preparatory study on the environmental performance of ... · 7.1 costs scenarios ... r6-technical...
TRANSCRIPT
ECODESIGN Lot 10 Comfort fans study
1
Service Contract to DGTREN
Preparatory study on the environmental performance of residential room conditioning appliances (airco and ventilation)
Contract TREN/D1/40-2005/LOT10/S07.56606
Study on comfort fans –final report October 2008, after SH comments
CO-ORDINATOR: Philippe RIVIERE, ARMINES, France
PARTICIPANTS
Jérôme ADNOT, Laurent GRIGNON-MASSE, Sébastien LEGENDRE, Dominique MARCHIO, Guillaume NERMOND,
Sri RAHIM, Philippe RIVIERE ARMINES, France
Philippe ANDRE, Laurie DETROUX, Jean LEBRUN, Julien L’HOEST, Vladut TEODOROSE
Université de Liège (ULg), Belgium
José Luis ALEXANDRE, Emanuel SA IDMEC, University of Porto, Faculty of Eng., Portugal.
Georg BENKE, Thomas BOGNER
Austrian Energy Angency, Austria
Amanda CONROY, Roger HITCHIN, Christine POUT, Wendy THORPE BRE, UK
Stavroula KARATASOU
IASA, Greece
Note : ventilation fans are treated in another document, this report is about comfort fans.
Legal disclaimer The sole responsibility for the content of this report lies with the authors. It does not represent the opinion of the European Community. The European Commission is not responsible for any use that may be made of the information contained therein.
ECODESIGN Lot 10 Comfort fans study
2
CONTENTS
1 DEFINITION OF PRODUCT, STANDARDS AND LEGISLATION ..................................... 6 1.1 PRODUCT CATEGORY AND PERFORMANCE ASSESSMENT .......................................................... 6
1.1.1 Product definitions ............................................................................................................ 6 1.1.2 Existing product categorisations ....................................................................................... 8 1.1.3 Functional analysis ............................................................................................................ 8
1.2 TEST STANDARDS ..................................................................................................................... 9 1.2.1 Energy use ......................................................................................................................... 9 1.2.2 Noise ................................................................................................................................ 13 1.2.3 Safety ............................................................................................................................... 13 1.2.4 Conclusion on test standards ........................................................................................... 13
1.3 EXISTING LEGISLATION ........................................................................................................... 14 1.3.1 Legislation and Agreements at European Community level ............................................ 14 1.3.2 Legislation at Member State level ................................................................................... 14 1.3.3 Third Country Legislation ............................................................................................... 14
TASK 1 SUMMARY .............................................................................................................................. 22 2 ECONOMIC AND MARKET ANALYSIS ............................................................................... 23
2.1 GENERIC ECONOMIC DATA ...................................................................................................... 23 2.2 MARKET AND STOCK DATA ..................................................................................................... 28 2.3 MARKET TRENDS .................................................................................................................... 31
2.3.1 Sales and climate change ................................................................................................ 31 2.3.2 Technical characteristics ................................................................................................. 31
2.4 CONSUMER EXPENDITURE BASE DATA ................................................................................... 35 2.4.1 Consumer price ................................................................................................................ 35 2.4.2 Running costs ................................................................................................................... 36 2.4.3 Disposal costs .................................................................................................................. 36 2.4.4 Economic Indicators ........................................................................................................ 36
TASK 2 SUMMARY .............................................................................................................................. 37 3 CONSUMER BEHAVIOUR AND LOCAL INFRASTRUCTURE ........................................ 38
3.1 REAL LIFE EFFICIENCY ........................................................................................................... 38 3.1.1 Hours of use ..................................................................................................................... 38 3.1.2 Airflow oscillations .......................................................................................................... 43 3.1.3 Standby energy consumption ........................................................................................... 43
3.2 END-OF-LIFE BEHAVIOUR ....................................................................................................... 44 3.3 LOCAL INFRASTRUCTURE ....................................................................................................... 44
3.3.1 Interaction with ventilation, cooling and heating ............................................................ 44 3.3.2 Installation guide for good practice ................................................................................ 45
TASK 3 SUMMARY .............................................................................................................................. 47 4 TECHNICAL ANALYSIS EXISTING PRODUCTS ............................................................... 48
INTRODUCTION .................................................................................................................................. 48 4.1 PRODUCTION PHASE ................................................................................................................ 49
4.1.1 Table fans ........................................................................................................................ 49 4.1.2 Box fan ............................................................................................................................. 51 4.1.3 Pedestal fan ..................................................................................................................... 53 4.1.4 Tower fan ......................................................................................................................... 53 4.1.5 Conclusion on material input .......................................................................................... 54
4.2 DISTRIBUTION PHASE .............................................................................................................. 55 4.3 USE PHASE (PRODUCT) ............................................................................................................ 55
4.3.1 Analysis of products catalogue data ................................................................................ 55 4.3.2 Experimental results ........................................................................................................ 59
ECODESIGN Lot 10 Comfort fans study
3
4.4 USE PHASE (SYSTEM) .............................................................................................................. 62 4.5 END-OF-LIFE PHASE ................................................................................................................ 62 TASK 4 SUMMARY .............................................................................................................................. 63
5 DEFINITION OF BASE-CASE .................................................................................................. 64 5.1 PRODUCT-SPECIFIC INPUTS ..................................................................................................... 64 5.2 BASE-CASE ENVIRONMENTAL IMPACT ASSESSMENT. ........................................................... 65 5.3 BASE-CASE LIFE CYCLE COSTS .............................................................................................. 70 5.4 EU TOTALS ............................................................................................................................. 74
5.4.1 Impact and LCC of new products installed in 2005 ........................................................ 74 5.5 EU-25 TOTAL SYSTEM IMPACT .............................................................................................. 78 TASK 5 SUMMARY .............................................................................................................................. 79
6 TECHNICAL ANALYSIS BAT ................................................................................................. 80 6.1 STATE-OF-THE-ART OF THE PRODUCT ..................................................................................... 80 6.2 STATE-OF-THE-ART FOR MOTORS AND POSSIBLE IMPROVEMENTS ......................................... 80 6.3 STATE-OF-THE-ART FOR BLADES AND POSSIBLE IMPROVEMENTS .......................................... 80 6.4 STATE-OF-THE-ART FOR CONTROL AND POSSIBLE IMPROVEMENTS ....................................... 81 6.5 STATE-OF-THE-ART : IS TOWER FAN AN IMPROVED TABLE FAN? ............................................ 81 TASK 6 SUMMARY .............................................................................................................................. 82
7 IMPROVEMENT POTENTIAL ................................................................................................ 83 7.1 COSTS SCENARIOS .................................................................................................................. 83 7.2 TENTATIVE LCC CURVE ......................................................................................................... 83
7.2.1 Table fans ........................................................................................................................ 84 7.2.2 Pedestal fans .................................................................................................................... 85 7.2.3 Tower fans with a remote control .................................................................................... 85
7.3 LONG-TERM TARGETS (BNAT) AND SYSTEMS ANALYSIS ...................................................... 87 TASK 7 SUMMARY .............................................................................................................................. 88
8 SCENARIO-, POLICY-, IMPACT- AND SENSITIVITY ANALYSIS ................................. 89 8.1 INTRODUCTION TO SCENARIOS ............................................................................................... 89 8.2 SCENARIO CONSIDERED IN THE STUDY : OBTAINING CORRECT INFORMATION ON THE PRODUCTS AND APPLYING LIGHT REQUIREMENTS ............................................................................. 94 8.3 EU-25 TOTAL SYSTEM IMPACT FOR THE SCENARIO CONSIDERED ......................................... 95 8.4 SENSITIVITY ANALYSIS ........................................................................................................... 96 8.5 IMPACT ON STAKEHOLDERS.................................................................................................... 96
REFERENCES .................................................................................................................................... 98 R1-DEFINITION OF PRODUCT AND STANDARDS ................................................................................. 98 R2-ECONOMIC AND MARKET ANALYSIS ............................................................................................ 98 R3-CONSUMER BEHAVIOUR AND LOCAL INFRASTRUCTURE ............................................................. 98 R4-TECHNICAL ANALYSIS EXISTING PRODUCTS .............................................................................. 99 R5-DEFINITION OF BASE-CASE ......................................................................................................... 99 R6-TECHNICAL ANALYSIS BAT ........................................................................................................ 99 R7-IMPROVEMENT POTENTIAL .......................................................................................................... 99 R8-SCENARIO-, POLICY-, IMPACT- AND SENSITIVITY ANALYSIS ....................................................... 99
LIST OF FIGURES Figure 1-1: “2cool” fan by Bionaire ........................................................................................................ 7 Figure 1-2: Ceiling fan appliance labelling rule from (FTC, 2006) ...................................................... 17 Figure 1-3: Taiwan energy label ........................................................................................................... 18 Figure 2-1: market EU25 ....................................................................................................................... 27 Figure 2-2: Total EU25 stock forecast .................................................................................................. 31
ECODESIGN Lot 10 Comfort fans study
4
Figure 2-3: Model database of comfort fans, representation of categories in % ................................... 32 Figure 2-4: Main trade marks ................................................................................................................ 33 Figure 2-5: Model database of comfort fans – table fans-, power input ............................................... 33 Figure 2-6: Model database of comfort fans –pedestal fans-, power input ........................................... 33 Figure 2-7: Model database of comfort fans – tower fans-, power input .............................................. 34 Figure 2-8: Price as a function of Wattage ............................................................................................ 35 Figure 3-1: Proportion of offices with fans running at different indoor globe temperatures. The lines are the logit approximations. ................................................................................................................. 39 Figure 3-2: Proportion of offices with fans running at different outdoor air temperatures. The lines are the logit approximations. ....................................................................................................................... 39 Figure 3-3: Probit lines for fans running in naturally ventilated (NV) buildings in different European countries. ............................................................................................................................................... 40 Figure 3-4: Airspeed required to offset increased temperature, source ASHRAE ................................ 41 Figure 3-5: Number of discomfort hours over the summer period for 3 French locations, from (Grignon-Massé, 2007) ......................................................................................................................... 42 Figure 4-1: Disassembly photo of table fan 1 ....................................................................................... 49 Figure 4-2: Disassembly photo of table fan 4 ....................................................................................... 50 Figure 4-3: Disassembly photo of fan 5 (Box Fan) ............................................................................... 51 Figure 4-4: Disassembly photo of fan 2 (Tower Fan) ........................................................................... 53 Figure 4-5: Comparison of material contents of the 5 fans dismantled ................................................. 54 Figure 4-6: Correlation on data base ..................................................................................................... 56 Figure 4-7: Use of traditional SFP ........................................................................................................ 57 Figure 4-8: Use of IEC 879 service value ............................................................................................. 57 Figure 4-9: Use of Chinese standard ..................................................................................................... 58 Figure 4-10: Comparison of EU pedestal fans performances and of the Taiwanese requirements ....... 58 Figure 4-11: Comparison of EU table fans performances and of the Taiwanese requirements ............ 59 Figure 4-12: Measured service value at the 3 speeds of operation for 3 types of fans, and declared nominal service value ............................................................................................................................ 61 Figure 5-1: Environmental impact of table fan base case, other resources and waste .......................... 66 Figure 5-2: Environmental impact of table fan base case, emissions to air .......................................... 67 Figure 5-3: Environmental impact of table fan base case, emissions to water ...................................... 67 Figure 5-4: End of life fate of material of comfort fan products installed in 2005 ............................... 74 Figure 5-5: Environmental impact of comfort fan products installed in 2005, energy, water and waste ............................................................................................................................................................... 75 Figure 5-6: Environmental impact of comfort fan products installed in 2005, emissions to air ........... 76 Figure 5-7: Environmental impact of comfort fan products installed in 2005, emissions to water ....... 76 Figure 6-1: Declared service value and cost .......................................................................................... 80 Figure 7-1: LCC against service value for a table fan (or pedestal fan, by adding the cost of the column) ................................................................................................................................................. 85 Figure 7-2: LCC against service value for a tower fan with and without the effect of the standby IM 87 Figure 8-1: Total EU25 stock forecast .................................................................................................. 91 Figure 8-2: Comparison of EU pedestal fans performances and of the Taiwanese requirements ......... 96 LIST OF TABLES Table 1-1: Different types of comfort fans and their technical characteristics ........................................ 6 Table 1-2: Prodcom segmentation for ventilators ................................................................................... 8 Table 1-3: values for table fans (TABLE I of standard) ........................................................................ 11 Table 1-4: values for pedestal fans (TABLE II of standard) ................................................................. 11 Table 1-5: International test standards for comfort fans ........................................................................ 12 Table 1-6: ENERGY STAR requirements for ceiling fans ................................................................... 14 Table 1-7: Information format to be supplied for ENERGY STAR ceiling fans .................................. 15 Table 1-8: Taiwan energy conservation maximum SFP and minimum performance value (service value) for comfort fans (2002), by type and diameter ........................................................................... 18 Table 1-9: Maximum power consumption as a function of fan diameter –GB 12021.9 (1989) ........... 19
ECODESIGN Lot 10 Comfort fans study
5
Table 1-10: Maximum value of the lower fan speed (ratio of the maximum speed) –GB 12021.9 (1989) .................................................................................................................................................... 19 Table 1-11: Scope of the study .............................................................................................................. 22 Table 2-1: Raw value of the difference (imports-exports) numbers in the sense of (prodcom 29.71.15.30) for six years and raw figures of imports and export values for year 2005 ....................... 24 Table 2-2: Production – Fans ................................................................................................................ 25 Table 2-3: Fans (in the sense of 29.71.15.30) – Imports in Euros ......................................................... 26 Table 2-4: Internal consumption of Comfort fans (prodcom 29.71.15.30) after filling the gaps .......... 28 Table 2-5: Stock of Comfort fans in use (prodcom 29.71.15.30), all types, all use .............................. 30 Table 2-6: Prices in data base in euros .................................................................................................. 36 Table 3-1: Percentage of people using a fan as a function of outdoor air temperature and indoor globe temperature ............................................................................................................................................ 39 Table 4-1: List of fans for technical analysis ........................................................................................ 48 Table 4-2: List of materials of fan 1 ...................................................................................................... 50 Table 4-3: List of materials of fan 4 ...................................................................................................... 51 Table 4-4: List of materials of fan 5 ...................................................................................................... 53 Table 4-5: List of materials of fan 5 ...................................................................................................... 54 Table 4-6: Power consumption of the 6 tested fans in the 3 speeds of operation, with and without oscillation .............................................................................................................................................. 60 Table 4-7: Measured air flow rates at the 3 speeds of operation for 3 types of fans, and declared nominal flow rate .................................................................................................................................. 60 Table 4-8: Measured service value at the 3 speeds of operation for 3 types of fans, and declared nominal service value ............................................................................................................................ 61 Table 5-1: Material composition of base cases ..................................................................................... 64 Table 5-2: Environmental impact of table fan base case ....................................................................... 66 Table 5-3: Environmental impact of pedestal fan base case ................................................................. 68 Table 5-4: Environmental impact of tower fan base case ..................................................................... 69 Table 5-5: Product price of base cases .................................................................................................. 70 Table 5-6: Summary table of sales and stock of comfort fans (all types in thousand units) – EU 27 ... 70 Table 5-7: LCC input for table fan ........................................................................................................ 71 Table 5-8: LCC output for table fan ...................................................................................................... 71 Table 5-9: LCC input for pedestal fan ................................................................................................... 72 Table 5-10: LCC output for pedestal fan ............................................................................................... 72 Table 5-11: LCC input for tower fan ..................................................................................................... 73 Table 5-12: LCC output for tower fan ................................................................................................... 73 Table 5-13: Environmental impact of comfort fan products installed in 2005, energy, water and waste ............................................................................................................................................................... 74 Table 5-14: Environmental impact of comfort fan products installed in 2005, emissions to air ........... 75 Table 5-15: Environmental impact of comfort fan products installed in 2005, emissions to water ...... 76 Table 5-16: Total expenditure of comfort fans instaled in 2005, between 2005 and 2015 ................... 77 Table 5-17: Total environmental impact of the stock of comfort fans between 2005 and 2025 ........... 78 Table 7-1: Improvement potential of the different residential ventilation products, translated to comfort fans service value ..................................................................................................................... 83 Table 7-2: LCC input and results Table fans ......................................................................................... 84 Table 7-3: LCC input and results of Tower fans with remote control ................................................. 86 Table 8-1: Summary table of sales and stock of comfort fans (all types in thousand units) – EU 27; market in Million Euros was estimated with weighted minimum retail price ....................................... 91 Table 8-2: Summary table of Service Values that can be achieved in (m3/min)/Watt (the larger, the better); the lack of participation of SH made impossible to determine distinct values for different sizes ............................................................................................................................................................... 93 Table 8-3: MEPS of service value for comfort fans based on Taiwan minimum performance value (2002), by type and diameter ................................................................................................................. 93
ECODESIGN Lot 10 Comfort fans study
6
1 Definition of product, standards and legislation
According to the MEEuP methodology, this task should define the product category and define the system boundaries of the ‘playing field’ for ecodesign. It is important for a realistic definition of design options and improvement potential (Task 7) and it is also relevant in the context of technically defining any implementing legislation or voluntary measures (if any) (Task 8). 1.1 Product category and performance assessment 1.1.1 Product definitions Using fans and moving air in a room is a way people can choose to improve their individual summer comfort. By generating air movement close to the body, comfort fans increase convection and evaporation and by this way the feeling of comfort. Thus, using comfort fans improve the individual summer comfort without lowering the room temperature. In fact, the inside temperature is even likely to increase since the comfort fan motor produces heat. On the other hand, fans should not be used as a primary cooling device during extended periods of excessive heat. Electric fans may provide relief, but when the temperature is above 35 °C, fans will not prevent heat related illness (Adnot, 2007) but on the contrary will contribute to heat exhaustion. Use of summer comfort fans should be guided by an indoor climate stress diagram. Comfort fans can be used to avoid the use of air conditioners during the summer period and provide an “acceptable comfort”, but it can also be used as a complement to this device. When air conditioning is used, a fan can help to better circulate the cool air through the room, allowing the system to run less often1.
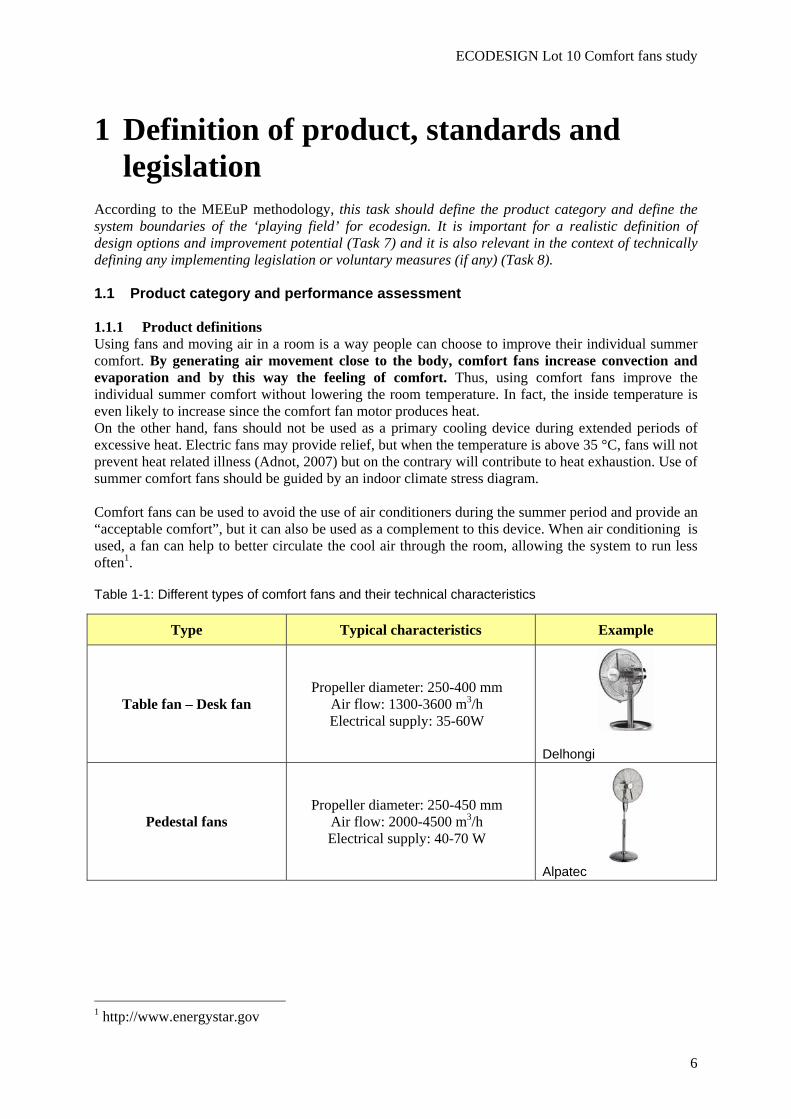
Table 1-1: Different types of comfort fans and their technical characteristics
Type Typical characteristics Example
Table fan – Desk fan Propeller diameter: 250-400 mm
Air flow: 1300-3600 m3/h Electrical supply: 35-60W
Delhongi
Pedestal fans Propeller diameter: 250-450 mm
Air flow: 2000-4500 m3/h Electrical supply: 40-70 W
Alpatec
1 http://www.energystar.gov
ECODESIGN Lot 10 Comfort fans study
7
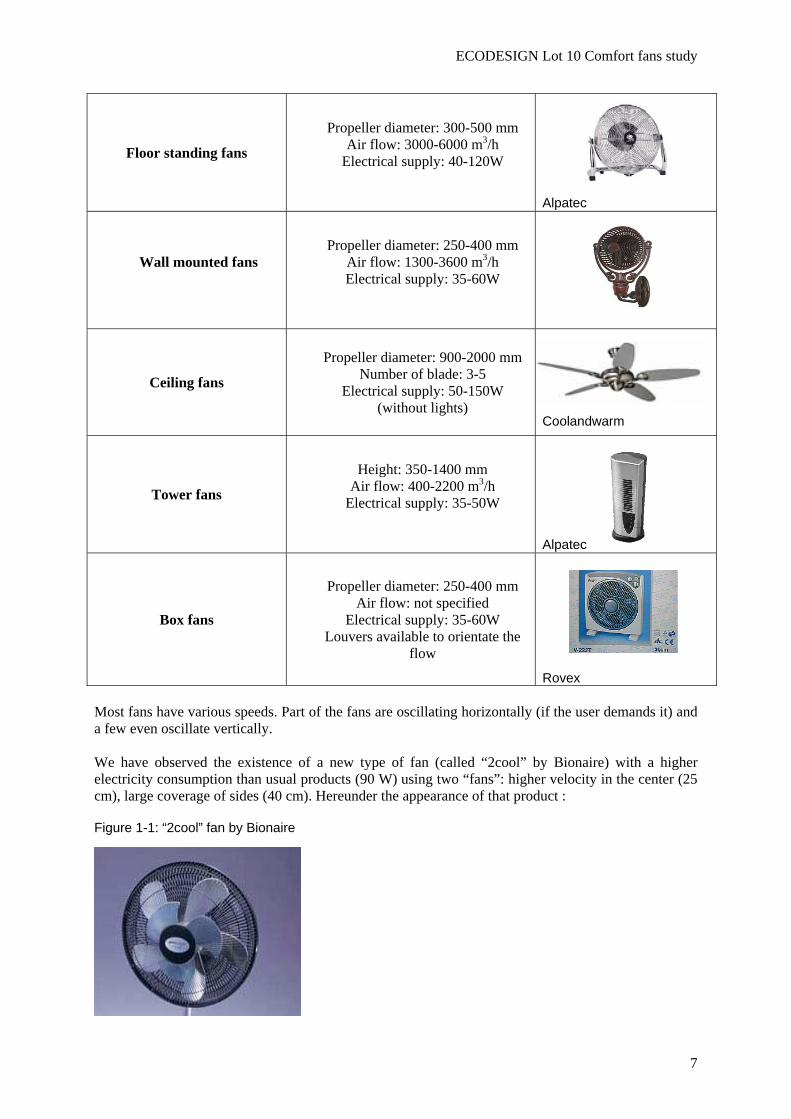
Floor standing fans
Propeller diameter: 300-500 mm Air flow: 3000-6000 m3/h
Electrical supply: 40-120W
Alpatec
Wall mounted fans
Propeller diameter: 250-400 mm Air flow: 1300-3600 m3/h Electrical supply: 35-60W
Ceiling fans
Propeller diameter: 900-2000 mm Number of blade: 3-5
Electrical supply: 50-150W (without lights)
Coolandwarm
Tower fans
Height: 350-1400 mm Air flow: 400-2200 m3/h
Electrical supply: 35-50W
Alpatec
Box fans
Propeller diameter: 250-400 mm Air flow: not specified
Electrical supply: 35-60W Louvers available to orientate the
flow
Rovex
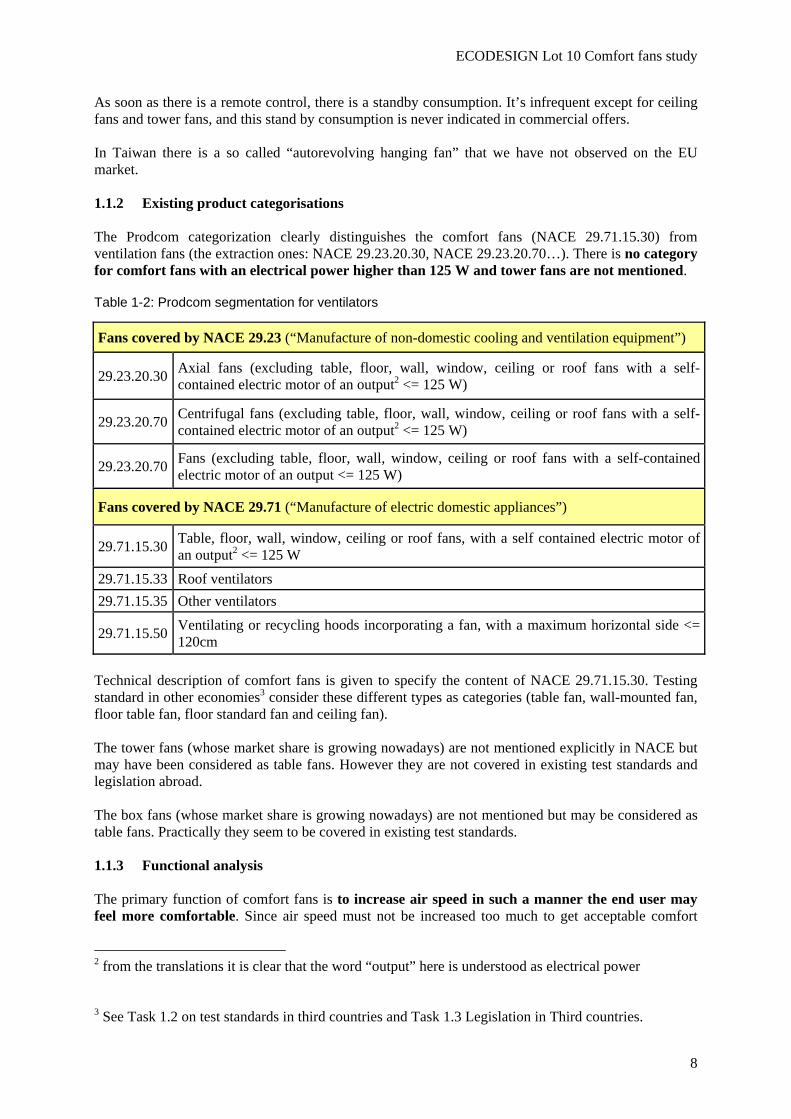
Most fans have various speeds. Part of the fans are oscillating horizontally (if the user demands it) and a few even oscillate vertically. We have observed the existence of a new type of fan (called “2cool” by Bionaire) with a higher electricity consumption than usual products (90 W) using two “fans”: higher velocity in the center (25 cm), large coverage of sides (40 cm). Hereunder the appearance of that product :
Figure 1-1: “2cool” fan by Bionaire
ECODESIGN Lot 10 Comfort fans study
8
As soon as there is a remote control, there is a standby consumption. It’s infrequent except for ceiling fans and tower fans, and this stand by consumption is never indicated in commercial offers. In Taiwan there is a so called “autorevolving hanging fan” that we have not observed on the EU market. 1.1.2 Existing product categorisations The Prodcom categorization clearly distinguishes the comfort fans (NACE 29.71.15.30) from ventilation fans (the extraction ones: NACE 29.23.20.30, NACE 29.23.20.70…). There is no category for comfort fans with an electrical power higher than 125 W and tower fans are not mentioned.
Table 1-2: Prodcom segmentation for ventilators
Fans covered by NACE 29.23 (“Manufacture of non-domestic cooling and ventilation equipment”)
29.23.20.30 Axial fans (excluding table, floor, wall, window, ceiling or roof fans with a self-contained electric motor of an output2 <= 125 W)
29.23.20.70 Centrifugal fans (excluding table, floor, wall, window, ceiling or roof fans with a self-contained electric motor of an output2 <= 125 W)
29.23.20.70 Fans (excluding table, floor, wall, window, ceiling or roof fans with a self-contained electric motor of an output <= 125 W)
Fans covered by NACE 29.71 (“Manufacture of electric domestic appliances”)
29.71.15.30 Table, floor, wall, window, ceiling or roof fans, with a self contained electric motor of an output2 <= 125 W
29.71.15.33 Roof ventilators 29.71.15.35 Other ventilators
29.71.15.50 Ventilating or recycling hoods incorporating a fan, with a maximum horizontal side <= 120cm
Technical description of comfort fans is given to specify the content of NACE 29.71.15.30. Testing standard in other economies3 consider these different types as categories (table fan, wall-mounted fan, floor table fan, floor standard fan and ceiling fan). The tower fans (whose market share is growing nowadays) are not mentioned explicitly in NACE but may have been considered as table fans. However they are not covered in existing test standards and legislation abroad. The box fans (whose market share is growing nowadays) are not mentioned but may be considered as table fans. Practically they seem to be covered in existing test standards. 1.1.3 Functional analysis The primary function of comfort fans is to increase air speed in such a manner the end user may feel more comfortable. Since air speed must not be increased too much to get acceptable comfort
2 from the translations it is clear that the word “output” here is understood as electrical power 3 See Task 1.2 on test standards in third countries and Task 1.3 Legislation in Third countries.
ECODESIGN Lot 10 Comfort fans study
9
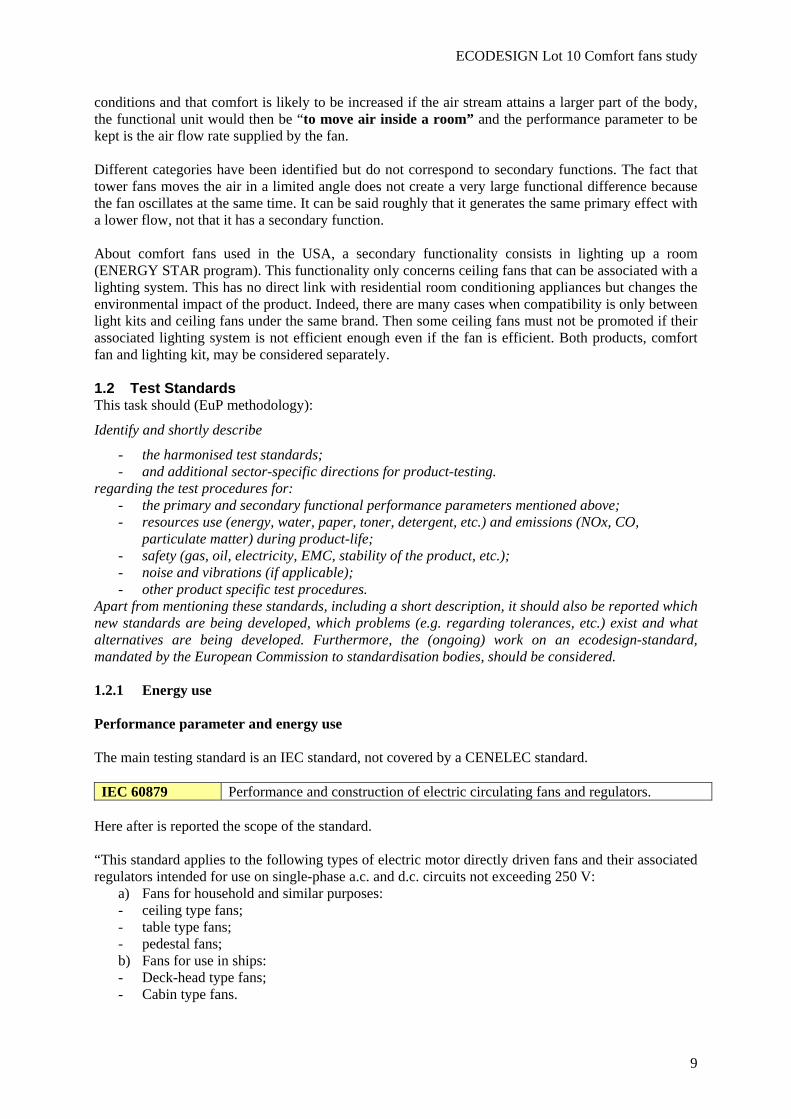
conditions and that comfort is likely to be increased if the air stream attains a larger part of the body, the functional unit would then be “to move air inside a room” and the performance parameter to be kept is the air flow rate supplied by the fan. Different categories have been identified but do not correspond to secondary functions. The fact that tower fans moves the air in a limited angle does not create a very large functional difference because the fan oscillates at the same time. It can be said roughly that it generates the same primary effect with a lower flow, not that it has a secondary function. About comfort fans used in the USA, a secondary functionality consists in lighting up a room (ENERGY STAR program). This functionality only concerns ceiling fans that can be associated with a lighting system. This has no direct link with residential room conditioning appliances but changes the environmental impact of the product. Indeed, there are many cases when compatibility is only between light kits and ceiling fans under the same brand. Then some ceiling fans must not be promoted if their associated lighting system is not efficient enough even if the fan is efficient. Both products, comfort fan and lighting kit, may be considered separately. 1.2 Test Standards This task should (EuP methodology):
Identify and shortly describe
- the harmonised test standards; - and additional sector-specific directions for product-testing.
regarding the test procedures for: - the primary and secondary functional performance parameters mentioned above; - resources use (energy, water, paper, toner, detergent, etc.) and emissions (NOx, CO,
particulate matter) during product-life; - safety (gas, oil, electricity, EMC, stability of the product, etc.); - noise and vibrations (if applicable); - other product specific test procedures.
Apart from mentioning these standards, including a short description, it should also be reported which new standards are being developed, which problems (e.g. regarding tolerances, etc.) exist and what alternatives are being developed. Furthermore, the (ongoing) work on an ecodesign-standard, mandated by the European Commission to standardisation bodies, should be considered. 1.2.1 Energy use Performance parameter and energy use The main testing standard is an IEC standard, not covered by a CENELEC standard. IEC 60879 Performance and construction of electric circulating fans and regulators.
Here after is reported the scope of the standard. “This standard applies to the following types of electric motor directly driven fans and their associated regulators intended for use on single-phase a.c. and d.c. circuits not exceeding 250 V:
a) Fans for household and similar purposes: - ceiling type fans; - table type fans; - pedestal fans; b) Fans for use in ships: - Deck-head type fans; - Cabin type fans.
ECODESIGN Lot 10 Comfort fans study
10
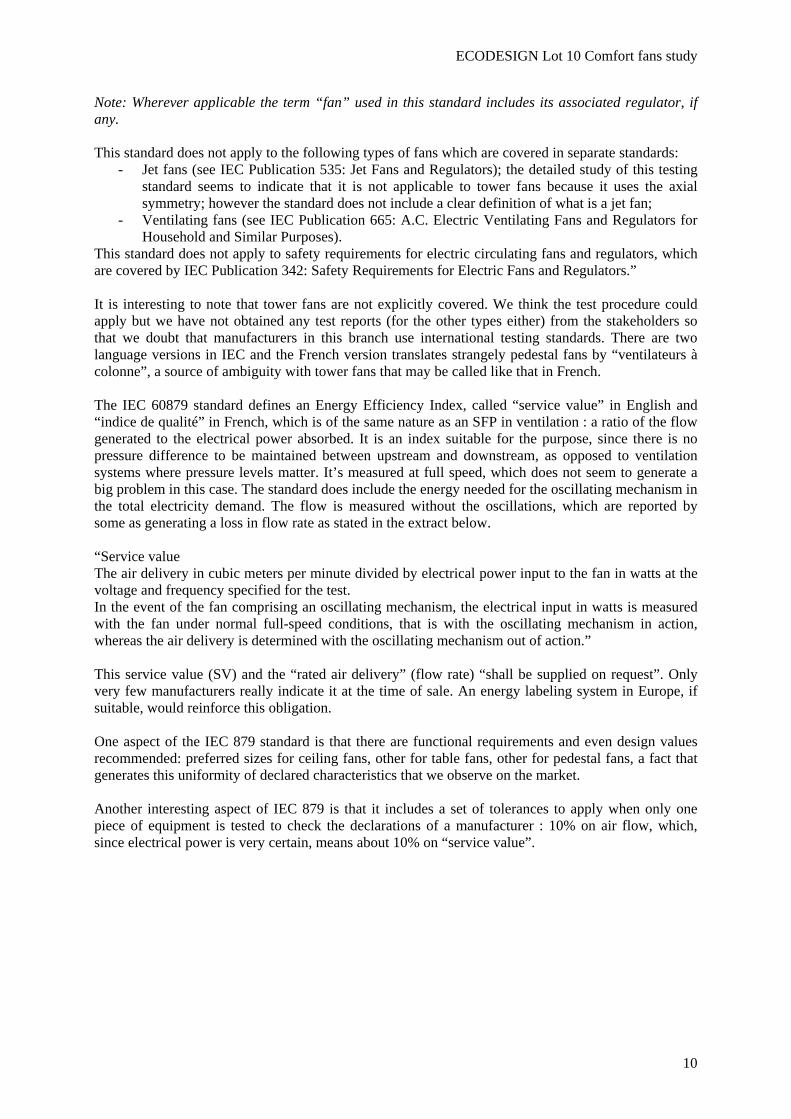
Note: Wherever applicable the term “fan” used in this standard includes its associated regulator, if any. This standard does not apply to the following types of fans which are covered in separate standards:
- Jet fans (see IEC Publication 535: Jet Fans and Regulators); the detailed study of this testing standard seems to indicate that it is not applicable to tower fans because it uses the axial symmetry; however the standard does not include a clear definition of what is a jet fan;
- Ventilating fans (see IEC Publication 665: A.C. Electric Ventilating Fans and Regulators for Household and Similar Purposes).
This standard does not apply to safety requirements for electric circulating fans and regulators, which are covered by IEC Publication 342: Safety Requirements for Electric Fans and Regulators.” It is interesting to note that tower fans are not explicitly covered. We think the test procedure could apply but we have not obtained any test reports (for the other types either) from the stakeholders so that we doubt that manufacturers in this branch use international testing standards. There are two language versions in IEC and the French version translates strangely pedestal fans by “ventilateurs à colonne”, a source of ambiguity with tower fans that may be called like that in French. The IEC 60879 standard defines an Energy Efficiency Index, called “service value” in English and “indice de qualité” in French, which is of the same nature as an SFP in ventilation : a ratio of the flow generated to the electrical power absorbed. It is an index suitable for the purpose, since there is no pressure difference to be maintained between upstream and downstream, as opposed to ventilation systems where pressure levels matter. It’s measured at full speed, which does not seem to generate a big problem in this case. The standard does include the energy needed for the oscillating mechanism in the total electricity demand. The flow is measured without the oscillations, which are reported by some as generating a loss in flow rate as stated in the extract below. “Service value The air delivery in cubic meters per minute divided by electrical power input to the fan in watts at the voltage and frequency specified for the test. In the event of the fan comprising an oscillating mechanism, the electrical input in watts is measured with the fan under normal full-speed conditions, that is with the oscillating mechanism in action, whereas the air delivery is determined with the oscillating mechanism out of action.” This service value (SV) and the “rated air delivery” (flow rate) “shall be supplied on request”. Only very few manufacturers really indicate it at the time of sale. An energy labeling system in Europe, if suitable, would reinforce this obligation. One aspect of the IEC 879 standard is that there are functional requirements and even design values recommended: preferred sizes for ceiling fans, other for table fans, other for pedestal fans, a fact that generates this uniformity of declared characteristics that we observe on the market. Another interesting aspect of IEC 879 is that it includes a set of tolerances to apply when only one piece of equipment is tested to check the declarations of a manufacturer : 10% on air flow, which, since electrical power is very certain, means about 10% on “service value”.
ECODESIGN Lot 10 Comfort fans study
11
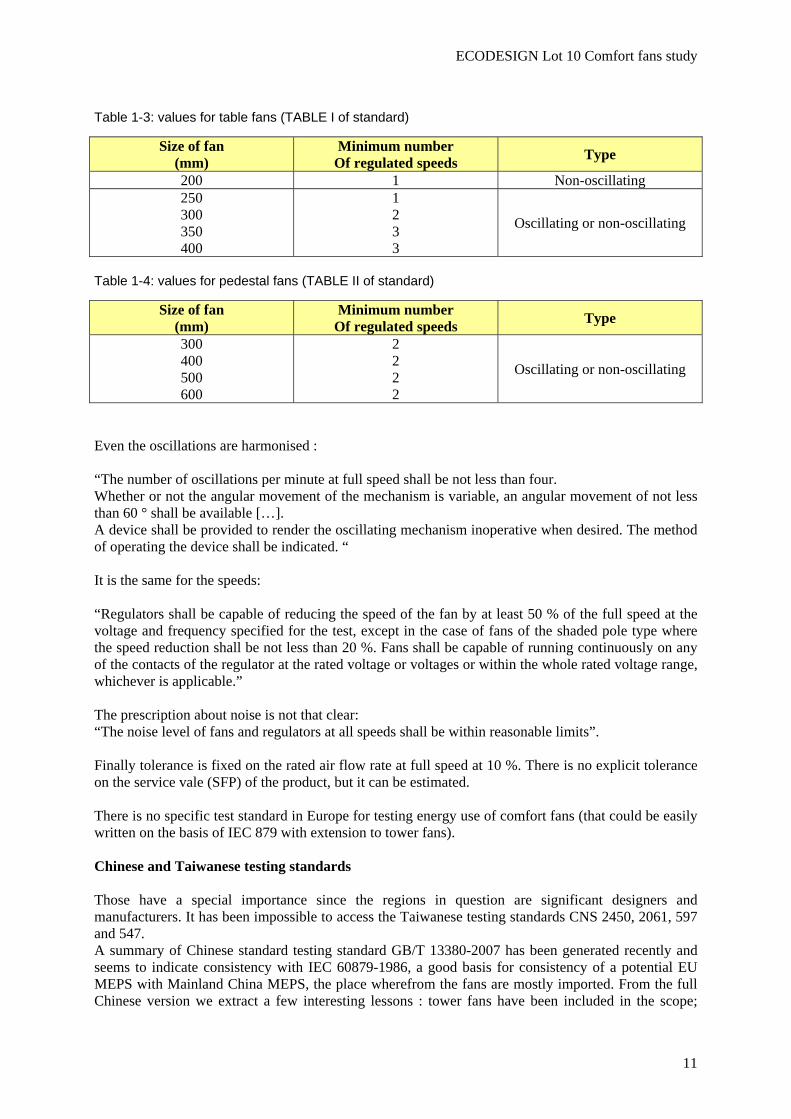
Table 1-3: values for table fans (TABLE I of standard)
Size of fan (mm)
Minimum number Of regulated speeds Type
200 1 Non-oscillating 250 300 350 400
1 2 3 3
Oscillating or non-oscillating
Table 1-4: values for pedestal fans (TABLE II of standard)
Size of fan (mm)
Minimum number Of regulated speeds Type
300 400 500 600
2 2 2 2
Oscillating or non-oscillating
Even the oscillations are harmonised : “The number of oscillations per minute at full speed shall be not less than four. Whether or not the angular movement of the mechanism is variable, an angular movement of not less than 60 ° shall be available […]. A device shall be provided to render the oscillating mechanism inoperative when desired. The method of operating the device shall be indicated. “ It is the same for the speeds: “Regulators shall be capable of reducing the speed of the fan by at least 50 % of the full speed at the voltage and frequency specified for the test, except in the case of fans of the shaded pole type where the speed reduction shall be not less than 20 %. Fans shall be capable of running continuously on any of the contacts of the regulator at the rated voltage or voltages or within the whole rated voltage range, whichever is applicable.” The prescription about noise is not that clear: “The noise level of fans and regulators at all speeds shall be within reasonable limits”. Finally tolerance is fixed on the rated air flow rate at full speed at 10 %. There is no explicit tolerance on the service vale (SFP) of the product, but it can be estimated. There is no specific test standard in Europe for testing energy use of comfort fans (that could be easily written on the basis of IEC 879 with extension to tower fans). Chinese and Taiwanese testing standards Those have a special importance since the regions in question are significant designers and manufacturers. It has been impossible to access the Taiwanese testing standards CNS 2450, 2061, 597 and 547. A summary of Chinese standard testing standard GB/T 13380-2007 has been generated recently and seems to indicate consistency with IEC 60879-1986, a good basis for consistency of a potential EU MEPS with Mainland China MEPS, the place wherefrom the fans are mostly imported. From the full Chinese version we extract a few interesting lessons : tower fans have been included in the scope;
ECODESIGN Lot 10 Comfort fans study
12
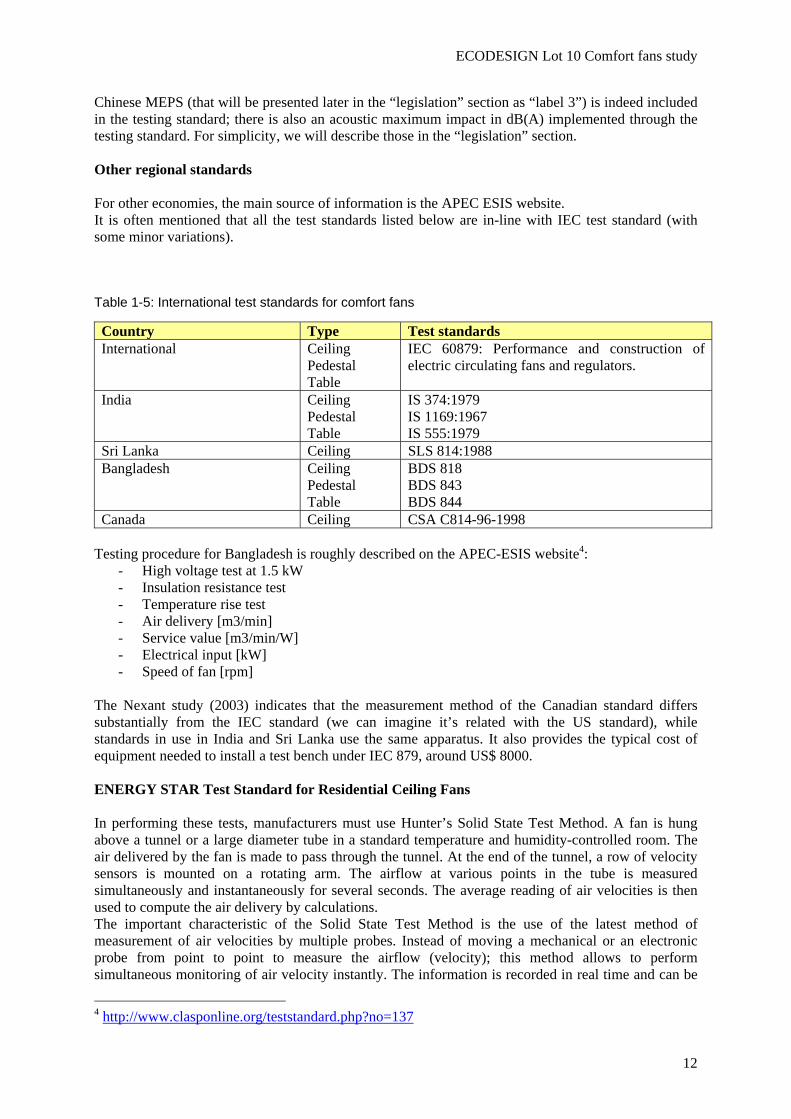
Chinese MEPS (that will be presented later in the “legislation” section as “label 3”) is indeed included in the testing standard; there is also an acoustic maximum impact in dB(A) implemented through the testing standard. For simplicity, we will describe those in the “legislation” section. Other regional standards For other economies, the main source of information is the APEC ESIS website. It is often mentioned that all the test standards listed below are in-line with IEC test standard (with some minor variations).
Table 1-5: International test standards for comfort fans
Country Type Test standards International Ceiling
Pedestal Table
IEC 60879: Performance and construction of electric circulating fans and regulators.
India Ceiling Pedestal Table
IS 374:1979 IS 1169:1967 IS 555:1979
Sri Lanka Ceiling SLS 814:1988 Bangladesh Ceiling
Pedestal Table
BDS 818 BDS 843 BDS 844
Canada Ceiling CSA C814-96-1998 Testing procedure for Bangladesh is roughly described on the APEC-ESIS website4:
- High voltage test at 1.5 kW - Insulation resistance test - Temperature rise test - Air delivery [m3/min] - Service value [m3/min/W] - Electrical input [kW] - Speed of fan [rpm]
The Nexant study (2003) indicates that the measurement method of the Canadian standard differs substantially from the IEC standard (we can imagine it’s related with the US standard), while standards in use in India and Sri Lanka use the same apparatus. It also provides the typical cost of equipment needed to install a test bench under IEC 879, around US$ 8000. ENERGY STAR Test Standard for Residential Ceiling Fans In performing these tests, manufacturers must use Hunter’s Solid State Test Method. A fan is hung above a tunnel or a large diameter tube in a standard temperature and humidity-controlled room. The air delivered by the fan is made to pass through the tunnel. At the end of the tunnel, a row of velocity sensors is mounted on a rotating arm. The airflow at various points in the tube is measured simultaneously and instantaneously for several seconds. The average reading of air velocities is then used to compute the air delivery by calculations. The important characteristic of the Solid State Test Method is the use of the latest method of measurement of air velocities by multiple probes. Instead of moving a mechanical or an electronic probe from point to point to measure the airflow (velocity); this method allows to perform simultaneous monitoring of air velocity instantly. The information is recorded in real time and can be
4 http://www.clasponline.org/teststandard.php?no=137
ECODESIGN Lot 10 Comfort fans study
13
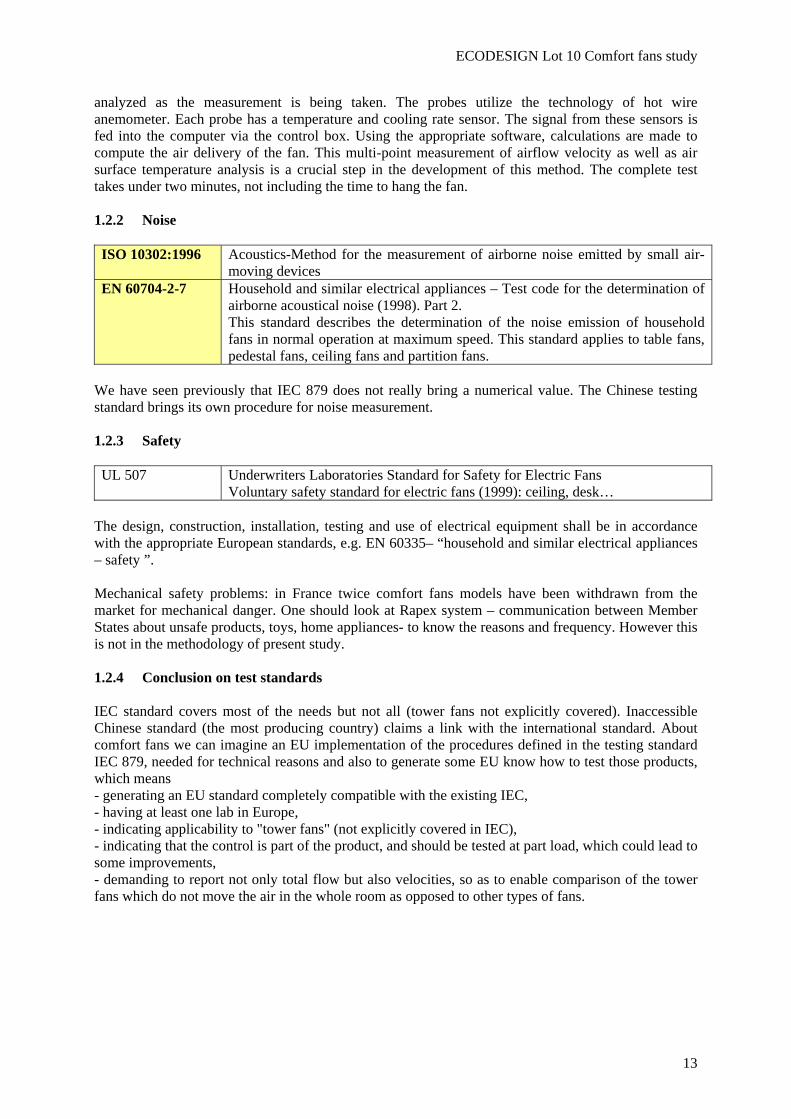
analyzed as the measurement is being taken. The probes utilize the technology of hot wire anemometer. Each probe has a temperature and cooling rate sensor. The signal from these sensors is fed into the computer via the control box. Using the appropriate software, calculations are made to compute the air delivery of the fan. This multi-point measurement of airflow velocity as well as air surface temperature analysis is a crucial step in the development of this method. The complete test takes under two minutes, not including the time to hang the fan. 1.2.2 Noise
ISO 10302:1996 Acoustics-Method for the measurement of airborne noise emitted by small air-
moving devices EN 60704-2-7 Household and similar electrical appliances – Test code for the determination of
airborne acoustical noise (1998). Part 2. This standard describes the determination of the noise emission of household fans in normal operation at maximum speed. This standard applies to table fans, pedestal fans, ceiling fans and partition fans.
We have seen previously that IEC 879 does not really bring a numerical value. The Chinese testing standard brings its own procedure for noise measurement. 1.2.3 Safety UL 507 Underwriters Laboratories Standard for Safety for Electric Fans
Voluntary safety standard for electric fans (1999): ceiling, desk… The design, construction, installation, testing and use of electrical equipment shall be in accordance with the appropriate European standards, e.g. EN 60335– “household and similar electrical appliances – safety ”. Mechanical safety problems: in France twice comfort fans models have been withdrawn from the market for mechanical danger. One should look at Rapex system – communication between Member States about unsafe products, toys, home appliances- to know the reasons and frequency. However this is not in the methodology of present study. 1.2.4 Conclusion on test standards IEC standard covers most of the needs but not all (tower fans not explicitly covered). Inaccessible Chinese standard (the most producing country) claims a link with the international standard. About comfort fans we can imagine an EU implementation of the procedures defined in the testing standard IEC 879, needed for technical reasons and also to generate some EU know how to test those products, which means - generating an EU standard completely compatible with the existing IEC, - having at least one lab in Europe, - indicating applicability to "tower fans" (not explicitly covered in IEC), - indicating that the control is part of the product, and should be tested at part load, which could lead to some improvements, - demanding to report not only total flow but also velocities, so as to enable comparison of the tower fans which do not move the air in the whole room as opposed to other types of fans.
ECODESIGN Lot 10 Comfort fans study
14
1.3 Existing legislation 1.3.1 Legislation and Agreements at European Community level No effect of environmental directives (RoHS, WEEE, Packaging directive) has been documented by stakeholders. 1.3.2 Legislation at Member State level No legislation has been indicated yet as being relevant by the Member States. 1.3.3 Third Country Legislation This section again deals with the subjects as above, but now for legislation and measures in Third Countries (extra- EU). None has been indicated by stakeholders (NGOs , industry, consumers) as being relevant for the product group. Three main programs do exist for comfort fans, in the USA, in Taiwan and in China, that we will describe now.
1.3.3.1 USA
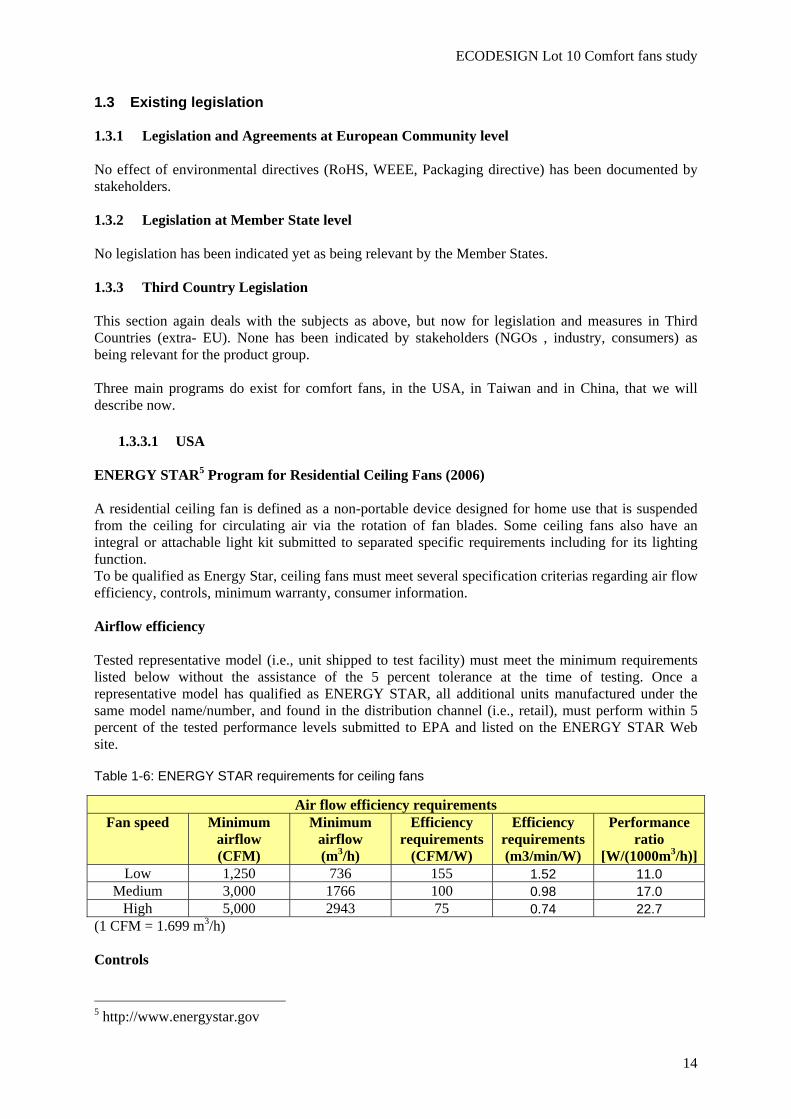
ENERGY STAR5 Program for Residential Ceiling Fans (2006) A residential ceiling fan is defined as a non-portable device designed for home use that is suspended from the ceiling for circulating air via the rotation of fan blades. Some ceiling fans also have an integral or attachable light kit submitted to separated specific requirements including for its lighting function. To be qualified as Energy Star, ceiling fans must meet several specification criterias regarding air flow efficiency, controls, minimum warranty, consumer information. Airflow efficiency Tested representative model (i.e., unit shipped to test facility) must meet the minimum requirements listed below without the assistance of the 5 percent tolerance at the time of testing. Once a representative model has qualified as ENERGY STAR, all additional units manufactured under the same model name/number, and found in the distribution channel (i.e., retail), must perform within 5 percent of the tested performance levels submitted to EPA and listed on the ENERGY STAR Web site.
Table 1-6: ENERGY STAR requirements for ceiling fans
Air flow efficiency requirements Fan speed Minimum
airflow (CFM)
Minimum airflow (m3/h)
Efficiency requirements
(CFM/W)
Efficiency requirements (m3/min/W)
Performance ratio
[W/(1000m3/h)]Low 1,250 736 155 1.52 11.0
Medium 3,000 1766 100 0.98 17.0 High 5,000 2943 75 0.74 22.7
(1 CFM = 1.699 m3/h) Controls
5 http://www.energystar.gov
ECODESIGN Lot 10 Comfort fans study
15
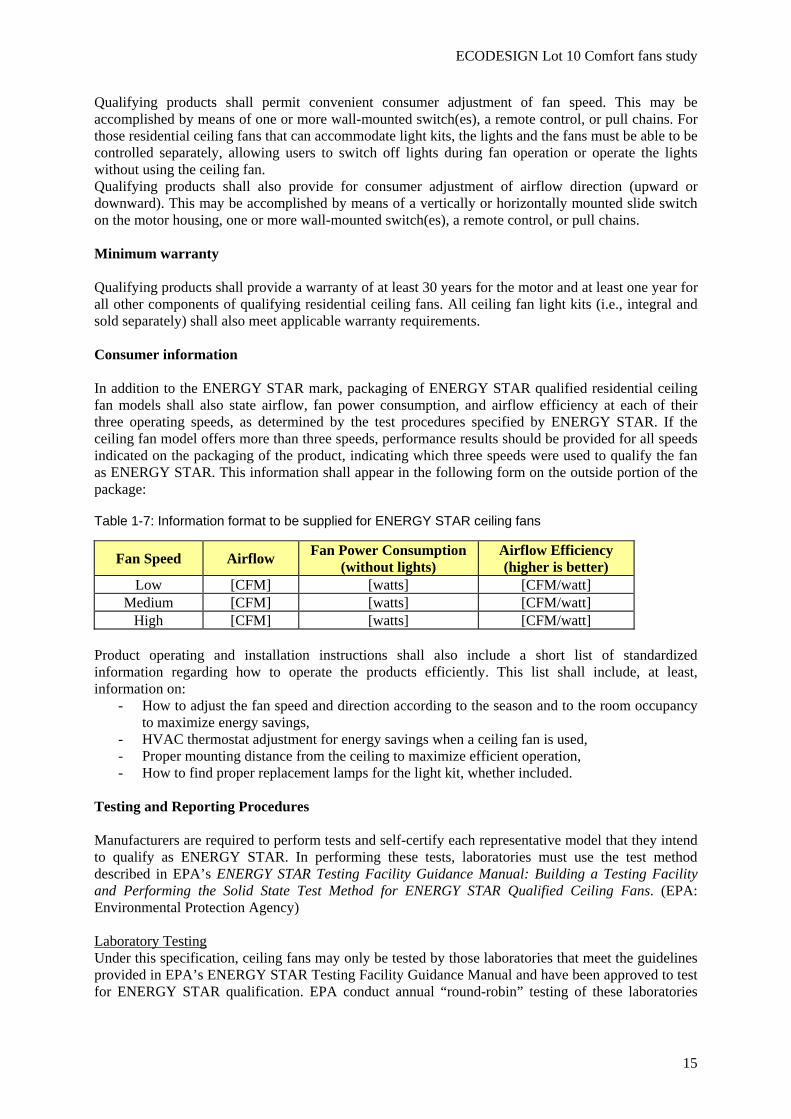
Qualifying products shall permit convenient consumer adjustment of fan speed. This may be accomplished by means of one or more wall-mounted switch(es), a remote control, or pull chains. For those residential ceiling fans that can accommodate light kits, the lights and the fans must be able to be controlled separately, allowing users to switch off lights during fan operation or operate the lights without using the ceiling fan. Qualifying products shall also provide for consumer adjustment of airflow direction (upward or downward). This may be accomplished by means of a vertically or horizontally mounted slide switch on the motor housing, one or more wall-mounted switch(es), a remote control, or pull chains. Minimum warranty Qualifying products shall provide a warranty of at least 30 years for the motor and at least one year for all other components of qualifying residential ceiling fans. All ceiling fan light kits (i.e., integral and sold separately) shall also meet applicable warranty requirements. Consumer information In addition to the ENERGY STAR mark, packaging of ENERGY STAR qualified residential ceiling fan models shall also state airflow, fan power consumption, and airflow efficiency at each of their three operating speeds, as determined by the test procedures specified by ENERGY STAR. If the ceiling fan model offers more than three speeds, performance results should be provided for all speeds indicated on the packaging of the product, indicating which three speeds were used to qualify the fan as ENERGY STAR. This information shall appear in the following form on the outside portion of the package:
Table 1-7: Information format to be supplied for ENERGY STAR ceiling fans
Fan Speed Airflow Fan Power Consumption (without lights)
Airflow Efficiency (higher is better)
Low [CFM] [watts] [CFM/watt] Medium [CFM] [watts] [CFM/watt]
High [CFM] [watts] [CFM/watt] Product operating and installation instructions shall also include a short list of standardized information regarding how to operate the products efficiently. This list shall include, at least, information on:
- How to adjust the fan speed and direction according to the season and to the room occupancy to maximize energy savings,
- HVAC thermostat adjustment for energy savings when a ceiling fan is used, - Proper mounting distance from the ceiling to maximize efficient operation, - How to find proper replacement lamps for the light kit, whether included.
Testing and Reporting Procedures Manufacturers are required to perform tests and self-certify each representative model that they intend to qualify as ENERGY STAR. In performing these tests, laboratories must use the test method described in EPA’s ENERGY STAR Testing Facility Guidance Manual: Building a Testing Facility and Performing the Solid State Test Method for ENERGY STAR Qualified Ceiling Fans. (EPA: Environmental Protection Agency) Laboratory Testing Under this specification, ceiling fans may only be tested by those laboratories that meet the guidelines provided in EPA’s ENERGY STAR Testing Facility Guidance Manual and have been approved to test for ENERGY STAR qualification. EPA conduct annual “round-robin” testing of these laboratories
ECODESIGN Lot 10 Comfort fans study
16
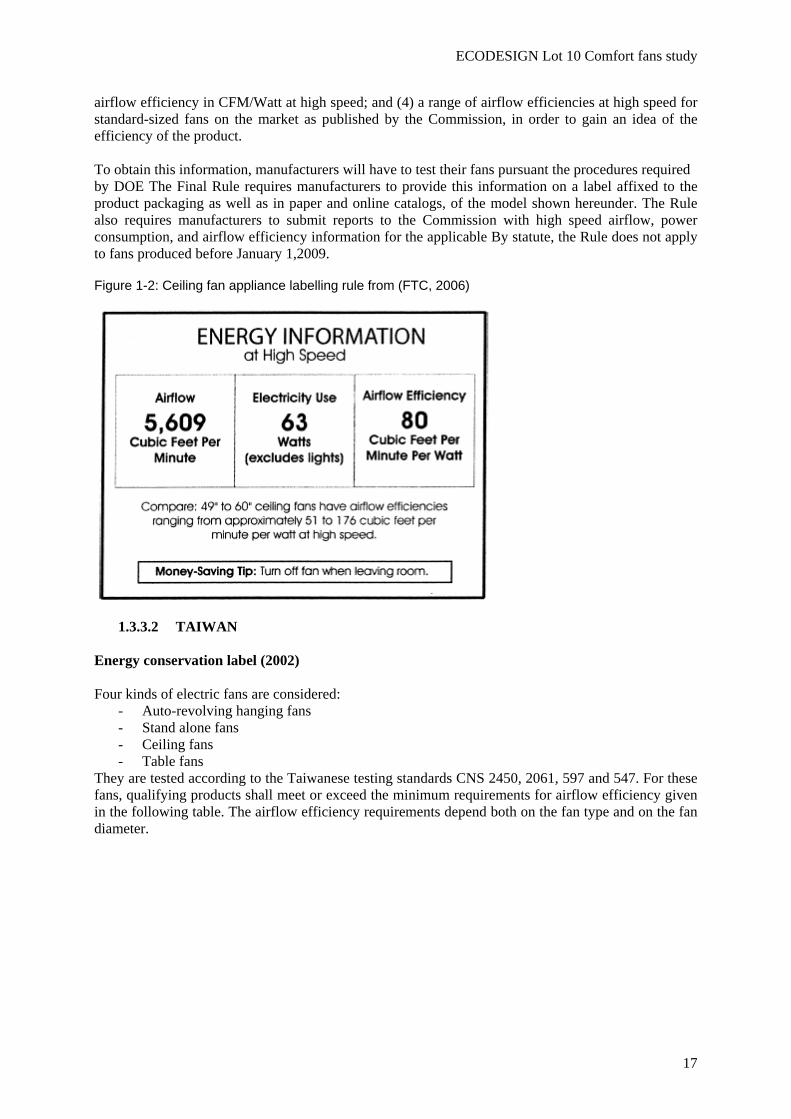
(i.e. calibrations), to verify that test results fall within +/- 5 percent of each other. This process is performed using a reference fan provided by EPA. Reporting Requirements The company whose brand name appears on the product packaging shall, for purposes of this specification, be considered the manufacturer. Manufacturers must complete a QPI form when submitting qualified products to EPA. This form must be accompanied by reports from a qualified laboratory containing airflow, power consumption, airflow efficiency data, and lighting test results (where applicable) for each residential ceiling fan model and light kits proposed for qualification. Families of residential ceiling fan models that are identical in every respect but finish may be qualified through submission of test data for a single representative model. Likewise, models that are unchanged or that differ only in finish from those sold in a previous year may remain qualified without the submission of new test data, assuming the specification remains unchanged. However, separate test data are required for all models that differ in any of the following characteristics: motor type or size; rotational speed; control type; blade (weight, number, size, or pitch); housing (i.e., size, design, ventilation). Product Performance Review Process To the extent ENERGY STAR is a self-certification program, EPA relies on the integrity of participating companies to ensure all products for which ENERGY STAR claims are made, meet all aspects of the ENERGY STAR performance specification. When mistakes are made and products are mislabeled or fail to perform as expected, EPA is committed to ensuring prompt corrective action, can perform its own tests to check the performance if necessary to comfort its decision to remove the fan from the list of qualified products. Update of criterias There is no transition period - called “grand-fathering” to let the opportunity to manufacturers to sell the stock of non compliant models when requirements are increased. CALIFORNIA Program for Residential Ceiling Fans (2006) The Appliance Efficiency Regulations, (California Code of Regulations, Title 20, Sections1601 through 1608) dated December 2006, contain amendments that were adopted by the California Energy Commission on July 5, 2006, and October 11, 2006, and approved by the California Office of Administrative Law on December 11, 2006 and December 14, 2006. The Appliance Efficiency Regulations include standards for both federally-regulated appliances and non-federally-regulated appliances. Twenty-one major categories of appliances are included in the scope of these regulations. The standards within these regulations apply to appliances that are sold or offered for sale in California. Each package containing a ceiling fan whose diameter exceeds 50 inches (127 cm) shall be marked, permanently and legibly on an accessible and conspicuous place on the unit’s packaging, in characters no less than 1/4”, the unit’s airflow at high, medium, and low speed in CFM, and the unit’s air flow efficiency in CFM/watt at high, medium and low speed. This is not very different from the Energy Star requirement, but compulsory in the State. FTC Appliance labelling Rule (2006, applicable 2009) The FEDERAL TRADE COMMISSION has published in 16 CFR Part 305-RIN 3084–AA74 (FTC, 2006) an Appliance Labeling Rule for application on January, 1st, 2009. As compared to the previous programs it requests only the information at high speed on the label. There is an additional filing with DOE that will produce long term knowledge. The Final Rule requires ceiling fan manufacturers to label their product packages with: (1) The fan’s airflow at high speed in CFM; (2) the fan’s power consumption in watts at high speed; (3) the fan’s
ECODESIGN Lot 10 Comfort fans study
17
airflow efficiency in CFM/Watt at high speed; and (4) a range of airflow efficiencies at high speed for standard-sized fans on the market as published by the Commission, in order to gain an idea of the efficiency of the product. To obtain this information, manufacturers will have to test their fans pursuant the procedures required by DOE The Final Rule requires manufacturers to provide this information on a label affixed to the product packaging as well as in paper and online catalogs, of the model shown hereunder. The Rule also requires manufacturers to submit reports to the Commission with high speed airflow, power consumption, and airflow efficiency information for the applicable By statute, the Rule does not apply to fans produced before January 1,2009.
Figure 1-2: Ceiling fan appliance labelling rule from (FTC, 2006)
1.3.3.2 TAIWAN
Energy conservation label (2002) Four kinds of electric fans are considered:
- Auto-revolving hanging fans - Stand alone fans - Ceiling fans - Table fans
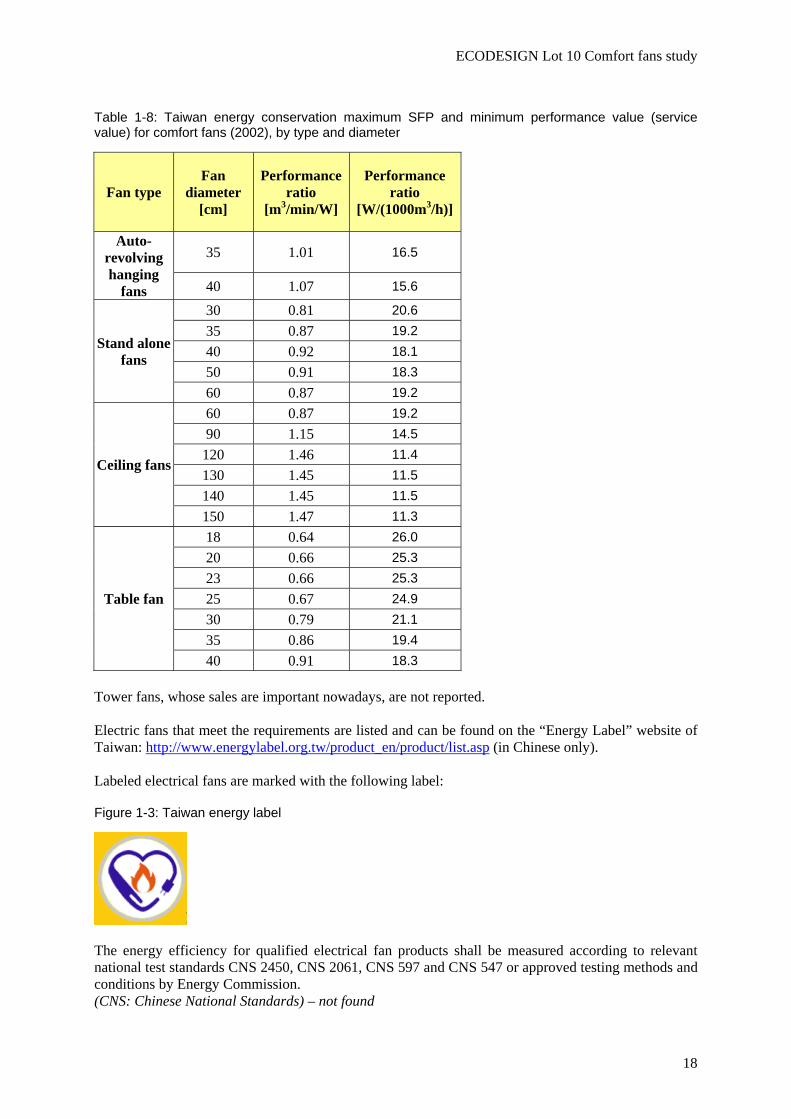
They are tested according to the Taiwanese testing standards CNS 2450, 2061, 597 and 547. For these fans, qualifying products shall meet or exceed the minimum requirements for airflow efficiency given in the following table. The airflow efficiency requirements depend both on the fan type and on the fan diameter.
ECODESIGN Lot 10 Comfort fans study
18
Table 1-8: Taiwan energy conservation maximum SFP and minimum performance value (service value) for comfort fans (2002), by type and diameter
Fan type Fan
diameter [cm]
Performance ratio
[m3/min/W]
Performance ratio
[W/(1000m3/h)]
Auto-revolving hanging
fans
35 1.01 16.5
40 1.07 15.6
Stand alone fans
30 0.81 20.6 35 0.87 19.2 40 0.92 18.1 50 0.91 18.3 60 0.87 19.2
Ceiling fans
60 0.87 19.2 90 1.15 14.5
120 1.46 11.4 130 1.45 11.5 140 1.45 11.5 150 1.47 11.3
Table fan
18 0.64 26.0 20 0.66 25.3 23 0.66 25.3 25 0.67 24.9 30 0.79 21.1 35 0.86 19.4 40 0.91 18.3
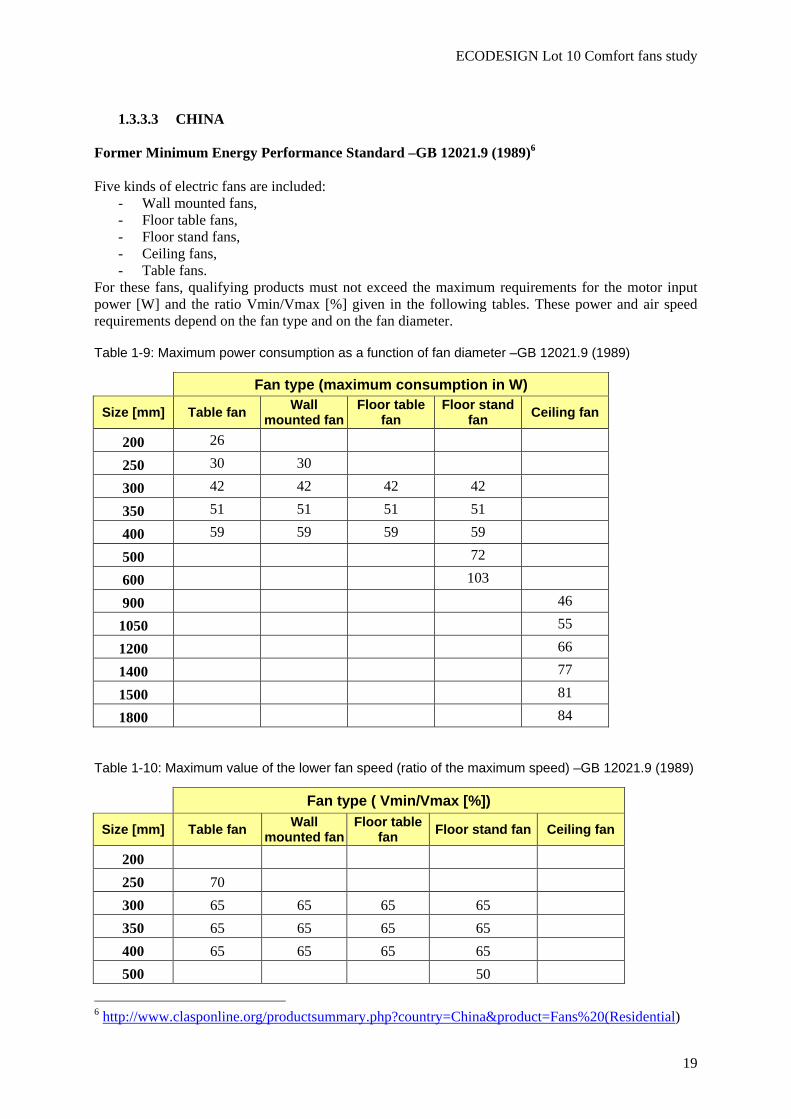
Tower fans, whose sales are important nowadays, are not reported. Electric fans that meet the requirements are listed and can be found on the “Energy Label” website of Taiwan: http://www.energylabel.org.tw/product_en/product/list.asp (in Chinese only). Labeled electrical fans are marked with the following label:
Figure 1-3: Taiwan energy label
The energy efficiency for qualified electrical fan products shall be measured according to relevant national test standards CNS 2450, CNS 2061, CNS 597 and CNS 547 or approved testing methods and conditions by Energy Commission. (CNS: Chinese National Standards) – not found
ECODESIGN Lot 10 Comfort fans study
19
1.3.3.3 CHINA
Former Minimum Energy Performance Standard –GB 12021.9 (1989)6 Five kinds of electric fans are included:
- Wall mounted fans, - Floor table fans, - Floor stand fans, - Ceiling fans, - Table fans.
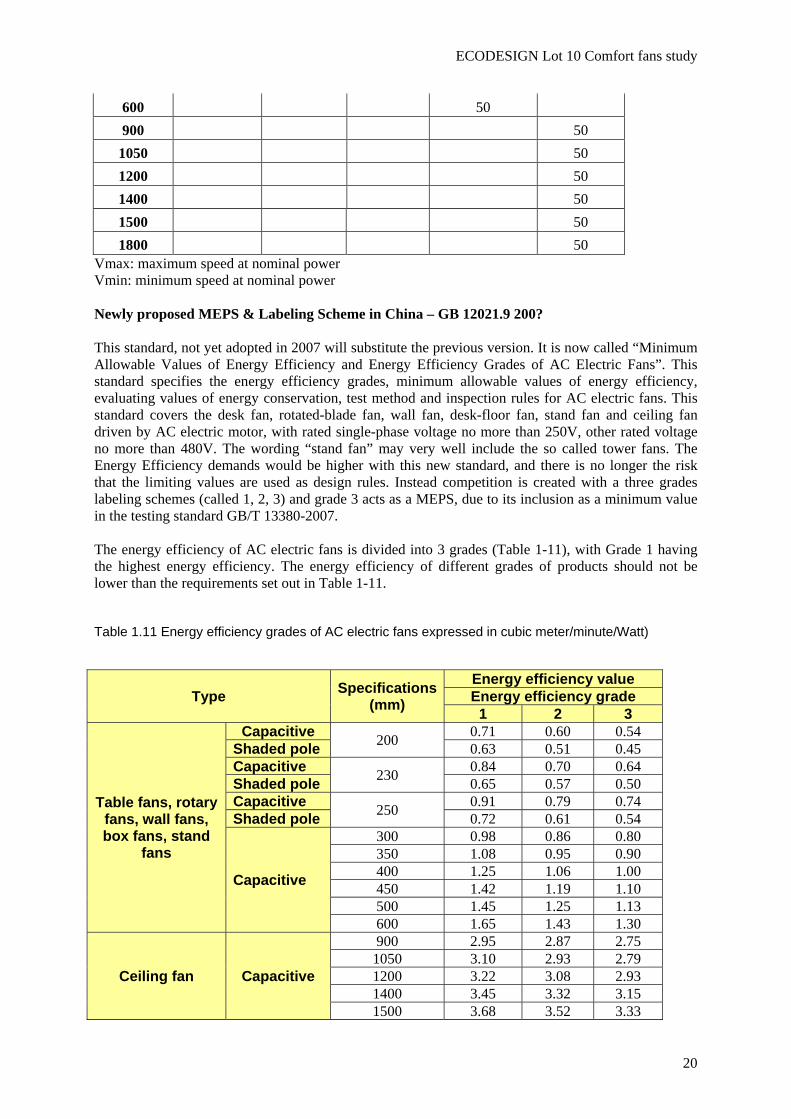
For these fans, qualifying products must not exceed the maximum requirements for the motor input power [W] and the ratio Vmin/Vmax [%] given in the following tables. These power and air speed requirements depend on the fan type and on the fan diameter.
Table 1-9: Maximum power consumption as a function of fan diameter –GB 12021.9 (1989)
Fan type (maximum consumption in W)
Size [mm] Table fan Wall mounted fan
Floor table fan
Floor stand fan Ceiling fan
200 26
250 30 30
300 42 42 42 42
350 51 51 51 51
400 59 59 59 59
500 72
600 103
900 46
1050 55
1200 66
1400 77
1500 81
1800 84
Table 1-10: Maximum value of the lower fan speed (ratio of the maximum speed) –GB 12021.9 (1989)
Fan type ( Vmin/Vmax [%])
Size [mm] Table fan Wall mounted fan
Floor table fan Floor stand fan Ceiling fan
200 250 70 300 65 65 65 65 350 65 65 65 65 400 65 65 65 65 500 50
6 http://www.clasponline.org/productsummary.php?country=China&product=Fans%20(Residential)
ECODESIGN Lot 10 Comfort fans study
20
600 50 900 50
1050 50 1200 50 1400 50 1500 50 1800 50
Vmax: maximum speed at nominal power Vmin: minimum speed at nominal power Newly proposed MEPS & Labeling Scheme in China – GB 12021.9 200? This standard, not yet adopted in 2007 will substitute the previous version. It is now called “Minimum Allowable Values of Energy Efficiency and Energy Efficiency Grades of AC Electric Fans”. This standard specifies the energy efficiency grades, minimum allowable values of energy efficiency, evaluating values of energy conservation, test method and inspection rules for AC electric fans. This standard covers the desk fan, rotated-blade fan, wall fan, desk-floor fan, stand fan and ceiling fan driven by AC electric motor, with rated single-phase voltage no more than 250V, other rated voltage no more than 480V. The wording “stand fan” may very well include the so called tower fans. The Energy Efficiency demands would be higher with this new standard, and there is no longer the risk that the limiting values are used as design rules. Instead competition is created with a three grades labeling schemes (called 1, 2, 3) and grade 3 acts as a MEPS, due to its inclusion as a minimum value in the testing standard GB/T 13380-2007. The energy efficiency of AC electric fans is divided into 3 grades (Table 1-11), with Grade 1 having the highest energy efficiency. The energy efficiency of different grades of products should not be lower than the requirements set out in Table 1-11.
Table 1.11 Energy efficiency grades of AC electric fans expressed in cubic meter/minute/Watt)
Type Specifications (mm)
Energy efficiency value Energy efficiency grade
1 2 3
Table fans, rotary fans, wall fans, box fans, stand
fans
Capacitive 200 0.71 0.60 0.54 Shaded pole 0.63 0.51 0.45 Capacitive 230 0.84 0.70 0.64 Shaded pole 0.65 0.57 0.50 Capacitive 250 0.91 0.79 0.74 Shaded pole 0.72 0.61 0.54
Capacitive
300 0.98 0.86 0.80 350 1.08 0.95 0.90 400 1.25 1.06 1.00 450 1.42 1.19 1.10 500 1.45 1.25 1.13 600 1.65 1.43 1.30
Ceiling fan Capacitive
900 2.95 2.87 2.75 1050 3.10 2.93 2.79 1200 3.22 3.08 2.93 1400 3.45 3.32 3.15 1500 3.68 3.52 3.33
ECODESIGN Lot 10 Comfort fans study
21
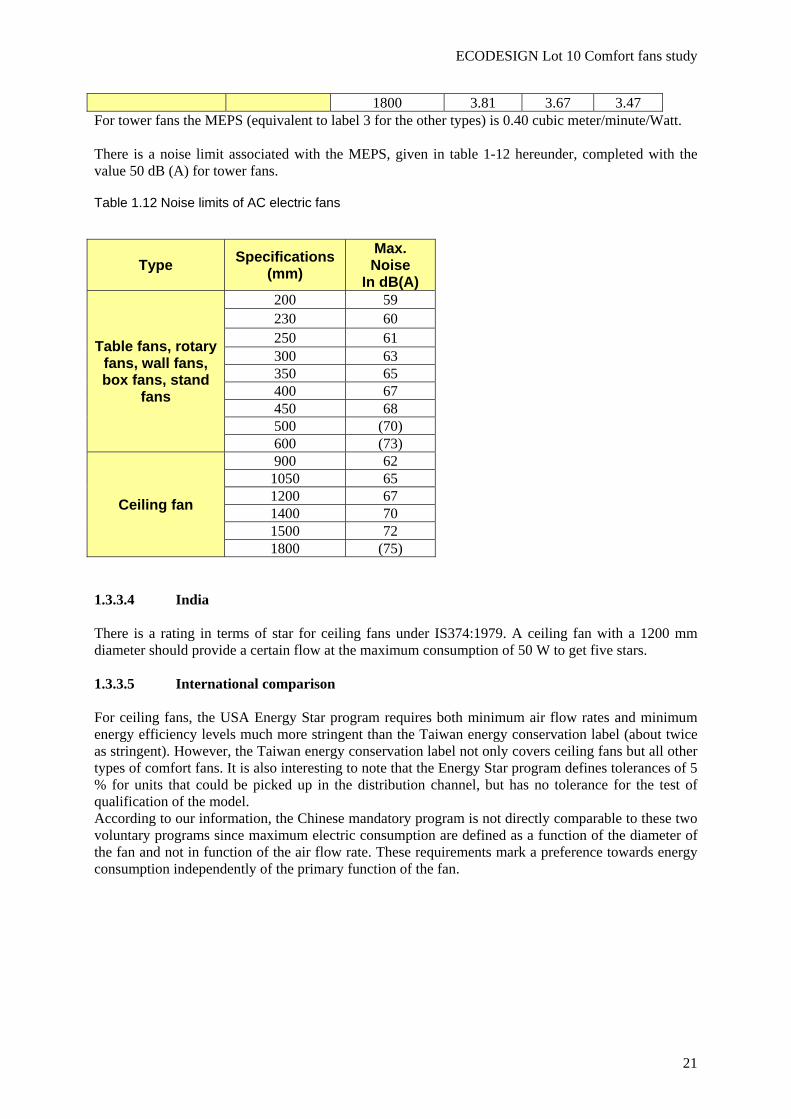
1800 3.81 3.67 3.47 For tower fans the MEPS (equivalent to label 3 for the other types) is 0.40 cubic meter/minute/Watt. There is a noise limit associated with the MEPS, given in table 1-12 hereunder, completed with the value 50 dB (A) for tower fans.
Table 1.12 Noise limits of AC electric fans
Type Specifications (mm)
Max. Noise
In dB(A)
Table fans, rotary fans, wall fans, box fans, stand
fans
200 59 230 60 250 61 300 63 350 65 400 67 450 68 500 (70) 600 (73)
Ceiling fan
900 62 1050 65 1200 67 1400 70 1500 72 1800 (75)
1.3.3.4 India There is a rating in terms of star for ceiling fans under IS374:1979. A ceiling fan with a 1200 mm diameter should provide a certain flow at the maximum consumption of 50 W to get five stars. 1.3.3.5 International comparison For ceiling fans, the USA Energy Star program requires both minimum air flow rates and minimum energy efficiency levels much more stringent than the Taiwan energy conservation label (about twice as stringent). However, the Taiwan energy conservation label not only covers ceiling fans but all other types of comfort fans. It is also interesting to note that the Energy Star program defines tolerances of 5 % for units that could be picked up in the distribution channel, but has no tolerance for the test of qualification of the model. According to our information, the Chinese mandatory program is not directly comparable to these two voluntary programs since maximum electric consumption are defined as a function of the diameter of the fan and not in function of the air flow rate. These requirements mark a preference towards energy consumption independently of the primary function of the fan.
ECODESIGN Lot 10 Comfort fans study
22
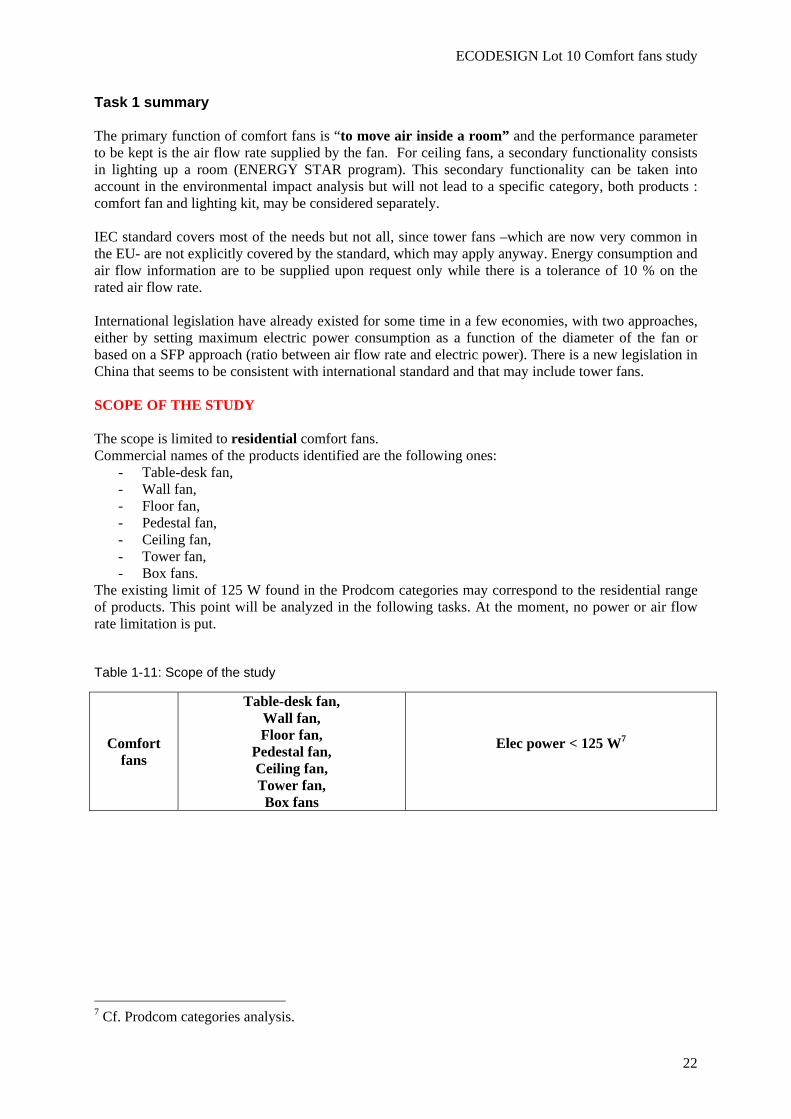
Task 1 summary The primary function of comfort fans is “to move air inside a room” and the performance parameter to be kept is the air flow rate supplied by the fan. For ceiling fans, a secondary functionality consists in lighting up a room (ENERGY STAR program). This secondary functionality can be taken into account in the environmental impact analysis but will not lead to a specific category, both products : comfort fan and lighting kit, may be considered separately. IEC standard covers most of the needs but not all, since tower fans –which are now very common in the EU- are not explicitly covered by the standard, which may apply anyway. Energy consumption and air flow information are to be supplied upon request only while there is a tolerance of 10 % on the rated air flow rate. International legislation have already existed for some time in a few economies, with two approaches, either by setting maximum electric power consumption as a function of the diameter of the fan or based on a SFP approach (ratio between air flow rate and electric power). There is a new legislation in China that seems to be consistent with international standard and that may include tower fans. SCOPE OF THE STUDY The scope is limited to residential comfort fans. Commercial names of the products identified are the following ones:
- Table-desk fan, - Wall fan, - Floor fan, - Pedestal fan, - Ceiling fan, - Tower fan, - Box fans.
The existing limit of 125 W found in the Prodcom categories may correspond to the residential range of products. This point will be analyzed in the following tasks. At the moment, no power or air flow rate limitation is put.
Table 1-11: Scope of the study
Comfort fans
Table-desk fan, Wall fan, Floor fan,
Pedestal fan, Ceiling fan, Tower fan, Box fans
Elec power < 125 W7
7 Cf. Prodcom categories analysis.
ECODESIGN Lot 10 Comfort fans study
23
2 ECONOMIC AND MARKET ANALYSIS
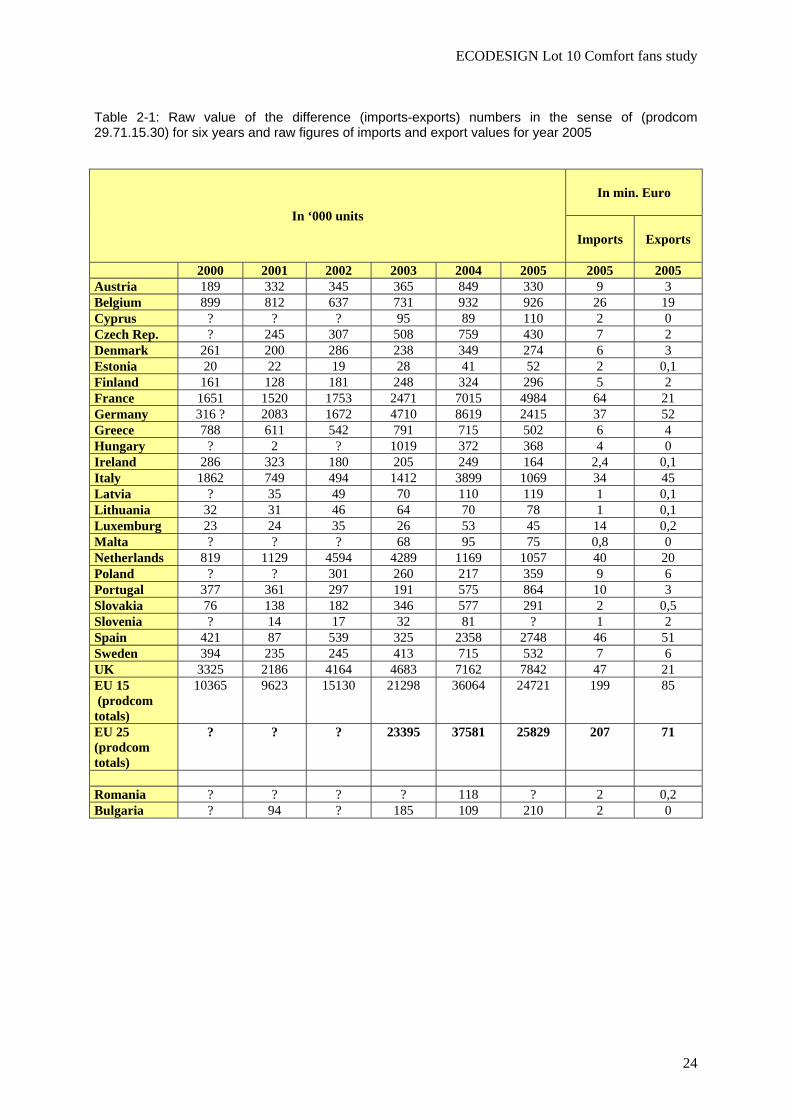
2.1 Generic economic data Treatment of prodcom data and the anomaly in export figures Tables 2.1 and 2.2 give extraction results from prodcom data base. Prodcom data show the massive imports but also a significant production and non negligible exports that we have to understand. The data have been treated to generate the net imports (imports-exports) for each EU country for the years 2000 to 2005 and the “production” (a few countries). The total of both figures is supposed to give apparent consumption. The series of (fans production) values is pretty complete, see table 2.2, later in text. The series of (export-import) values is pretty complete, see table 2.1, next page. The total EU values are of large interest because the internal trade is deleted. For EU25 as a whole, in 2005, 29 million units have been imported, 3 million units “manufactured” and 12.5 million units have been exported. The net balance is 25 800 000 units imported. The import and production figures have such consistency problems that we will not accept them, after further analysis. Since we know that every production takes place abroad, we have a problem with “export” figures that all countries display. This phenomenon is usually in the range of 10 to 15% of imported fans. We can understand that for supply chain reasons, some countries may receive fans that they re-export to another country, presumably within the EU. However some countries have a special role in the supply chain and display a ratio exports/ imports well over the average: Slovenia (from 75 to 95%), Belgium (70%), Italy (40%), Slovakia or Germany (25%). Also one cannot understand a global re export of 10% of imported fans by the EU. These percentages are given in physical terms. They increase even more when expressed in value. Exported products are declared over 25 Euros while imported are under 10 Euros, in the countries with no production. Anyway the result is that some countries appear as almost net exporters of fans (in Euros) while they don’t manufacture them.
ECODESIGN Lot 10 Comfort fans study
24
Table 2-1: Raw value of the difference (imports-exports) numbers in the sense of (prodcom 29.71.15.30) for six years and raw figures of imports and export values for year 2005
In ‘000 units
In min. Euro
Imports
Exports
2000 2001 2002 2003 2004 2005 2005 2005 Austria 189 332 345 365 849 330 9 3 Belgium 899 812 637 731 932 926 26 19 Cyprus ? ? ? 95 89 110 2 0 Czech Rep. ? 245 307 508 759 430 7 2 Denmark 261 200 286 238 349 274 6 3 Estonia 20 22 19 28 41 52 2 0,1 Finland 161 128 181 248 324 296 5 2 France 1651 1520 1753 2471 7015 4984 64 21 Germany 316 ? 2083 1672 4710 8619 2415 37 52 Greece 788 611 542 791 715 502 6 4 Hungary ? 2 ? 1019 372 368 4 0 Ireland 286 323 180 205 249 164 2,4 0,1 Italy 1862 749 494 1412 3899 1069 34 45 Latvia ? 35 49 70 110 119 1 0,1 Lithuania 32 31 46 64 70 78 1 0,1 Luxemburg 23 24 35 26 53 45 14 0,2 Malta ? ? ? 68 95 75 0,8 0 Netherlands 819 1129 4594 4289 1169 1057 40 20 Poland ? ? 301 260 217 359 9 6 Portugal 377 361 297 191 575 864 10 3 Slovakia 76 138 182 346 577 291 2 0,5 Slovenia ? 14 17 32 81 ? 1 2 Spain 421 87 539 325 2358 2748 46 51 Sweden 394 235 245 413 715 532 7 6 UK 3325 2186 4164 4683 7162 7842 47 21 EU 15 (prodcom totals)
10365 9623 15130 21298 36064 24721 199 85
EU 25 (prodcom totals)
? ? ? 23395 37581 25829 207 71
Romania ? ? ? ? 118 ? 2 0,2 Bulgaria ? 94 ? 185 109 210 2 0
ECODESIGN Lot 10 Comfort fans study
25
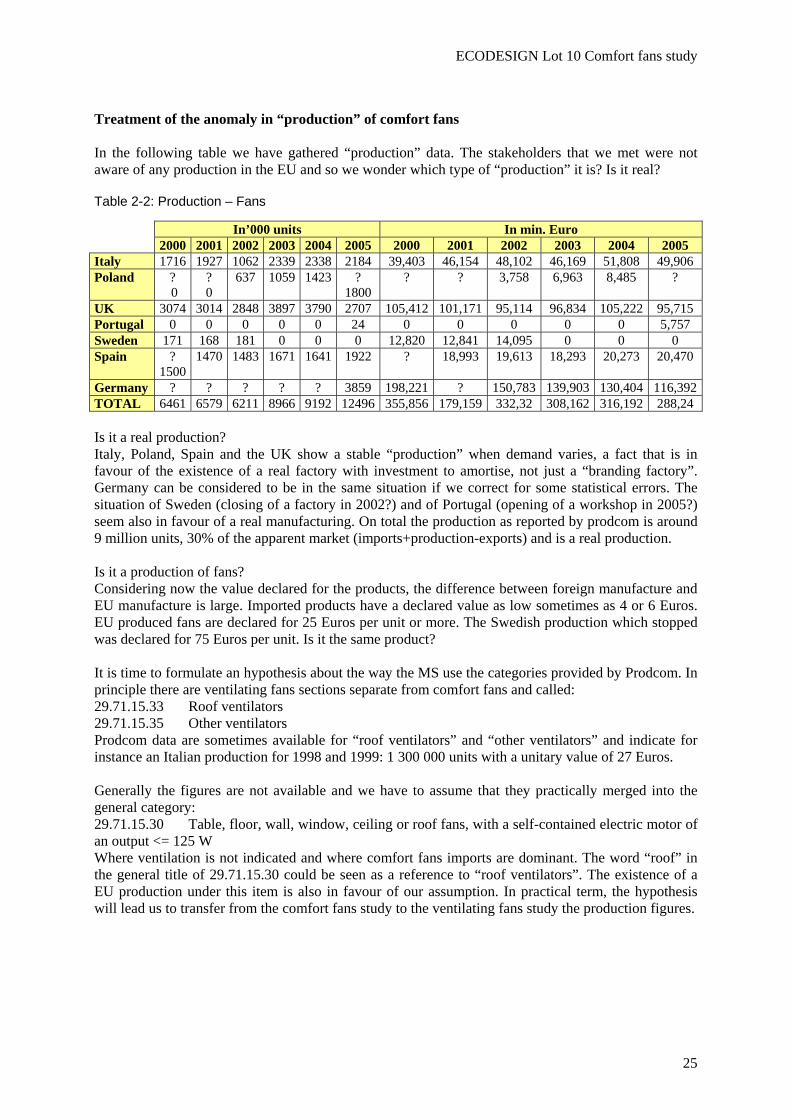
Treatment of the anomaly in “production” of comfort fans In the following table we have gathered “production” data. The stakeholders that we met were not aware of any production in the EU and so we wonder which type of “production” it is? Is it real?
Table 2-2: Production – Fans
In’000 units In min. Euro 2000 2001 2002 2003 2004 2005 2000 2001 2002 2003 2004 2005 Italy 1716 1927 1062 2339 2338 2184 39,403 46,154 48,102 46,169 51,808 49,906 Poland ?
0 ? 0
637 1059 1423 ? 1800
? ? 3,758 6,963 8,485 ?
UK 3074 3014 2848 3897 3790 2707 105,412 101,171 95,114 96,834 105,222 95,715 Portugal 0 0 0 0 0 24 0 0 0 0 0 5,757 Sweden 171 168 181 0 0 0 12,820 12,841 14,095 0 0 0 Spain ?
1500 1470 1483 1671 1641 1922 ? 18,993 19,613 18,293 20,273 20,470
Germany ? ? ? ? ? 3859 198,221 ? 150,783 139,903 130,404 116,392TOTAL 6461 6579 6211 8966 9192 12496 355,856 179,159 332,32 308,162 316,192 288,24 Is it a real production? Italy, Poland, Spain and the UK show a stable “production” when demand varies, a fact that is in favour of the existence of a real factory with investment to amortise, not just a “branding factory”. Germany can be considered to be in the same situation if we correct for some statistical errors. The situation of Sweden (closing of a factory in 2002?) and of Portugal (opening of a workshop in 2005?) seem also in favour of a real manufacturing. On total the production as reported by prodcom is around 9 million units, 30% of the apparent market (imports+production-exports) and is a real production. Is it a production of fans? Considering now the value declared for the products, the difference between foreign manufacture and EU manufacture is large. Imported products have a declared value as low sometimes as 4 or 6 Euros. EU produced fans are declared for 25 Euros per unit or more. The Swedish production which stopped was declared for 75 Euros per unit. Is it the same product? It is time to formulate an hypothesis about the way the MS use the categories provided by Prodcom. In principle there are ventilating fans sections separate from comfort fans and called: 29.71.15.33 Roof ventilators 29.71.15.35 Other ventilators Prodcom data are sometimes available for “roof ventilators” and “other ventilators” and indicate for instance an Italian production for 1998 and 1999: 1 300 000 units with a unitary value of 27 Euros. Generally the figures are not available and we have to assume that they practically merged into the general category: 29.71.15.30 Table, floor, wall, window, ceiling or roof fans, with a self-contained electric motor of an output <= 125 W Where ventilation is not indicated and where comfort fans imports are dominant. The word “roof” in the general title of 29.71.15.30 could be seen as a reference to “roof ventilators”. The existence of a EU production under this item is also in favour of our assumption. In practical term, the hypothesis will lead us to transfer from the comfort fans study to the ventilating fans study the production figures.
ECODESIGN Lot 10 Comfort fans study
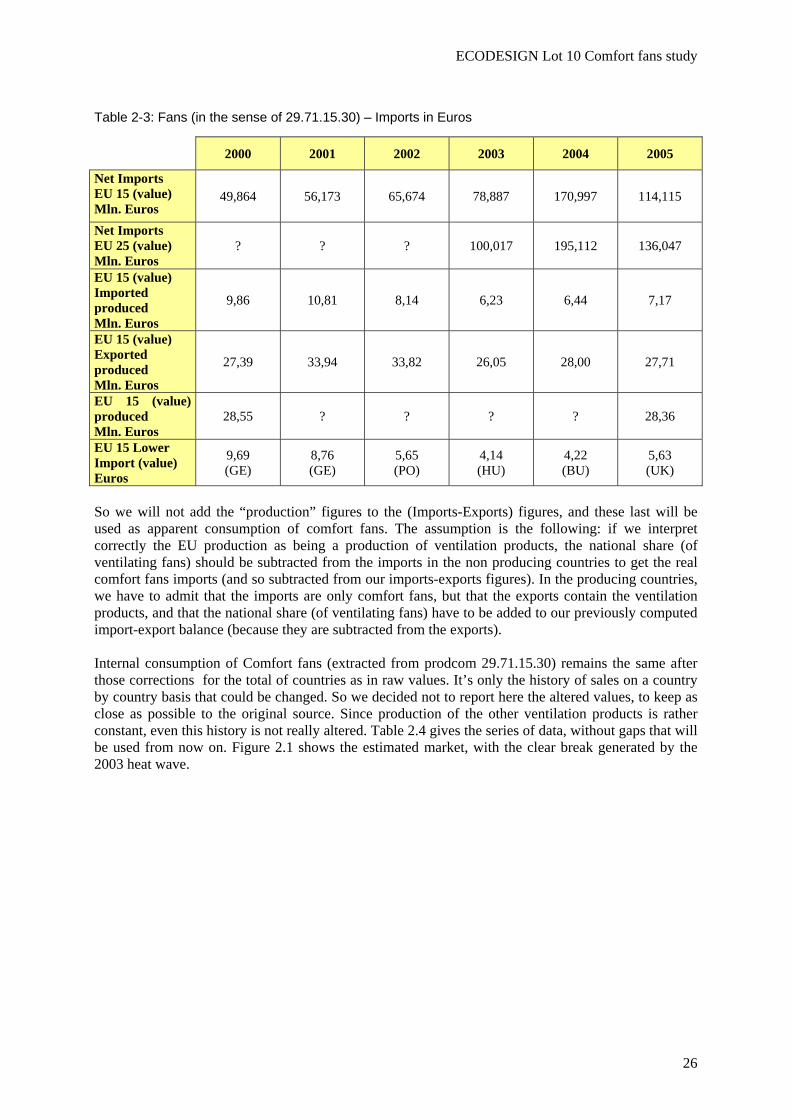
26
Table 2-3: Fans (in the sense of 29.71.15.30) – Imports in Euros
2000 2001 2002 2003 2004 2005
Net Imports EU 15 (value) Mln. Euros
49,864 56,173 65,674 78,887 170,997 114,115
Net Imports EU 25 (value) Mln. Euros
? ? ? 100,017 195,112 136,047
EU 15 (value) Imported produced Mln. Euros
9,86 10,81 8,14 6,23 6,44 7,17
EU 15 (value) Exported produced Mln. Euros
27,39 33,94 33,82 26,05 28,00 27,71
EU 15 (value) produced Mln. Euros
28,55 ? ? ? ? 28,36
EU 15 Lower Import (value) Euros
9,69 (GE)
8,76 (GE)
5,65 (PO)
4,14 (HU)
4,22 (BU)
5,63 (UK)
So we will not add the “production” figures to the (Imports-Exports) figures, and these last will be used as apparent consumption of comfort fans. The assumption is the following: if we interpret correctly the EU production as being a production of ventilation products, the national share (of ventilating fans) should be subtracted from the imports in the non producing countries to get the real comfort fans imports (and so subtracted from our imports-exports figures). In the producing countries, we have to admit that the imports are only comfort fans, but that the exports contain the ventilation products, and that the national share (of ventilating fans) have to be added to our previously computed import-export balance (because they are subtracted from the exports). Internal consumption of Comfort fans (extracted from prodcom 29.71.15.30) remains the same after those corrections for the total of countries as in raw values. It’s only the history of sales on a country by country basis that could be changed. So we decided not to report here the altered values, to keep as close as possible to the original source. Since production of the other ventilation products is rather constant, even this history is not really altered. Table 2.4 gives the series of data, without gaps that will be used from now on. Figure 2.1 shows the estimated market, with the clear break generated by the 2003 heat wave.
ECODESIGN Lot 10 Comfort fans study
27
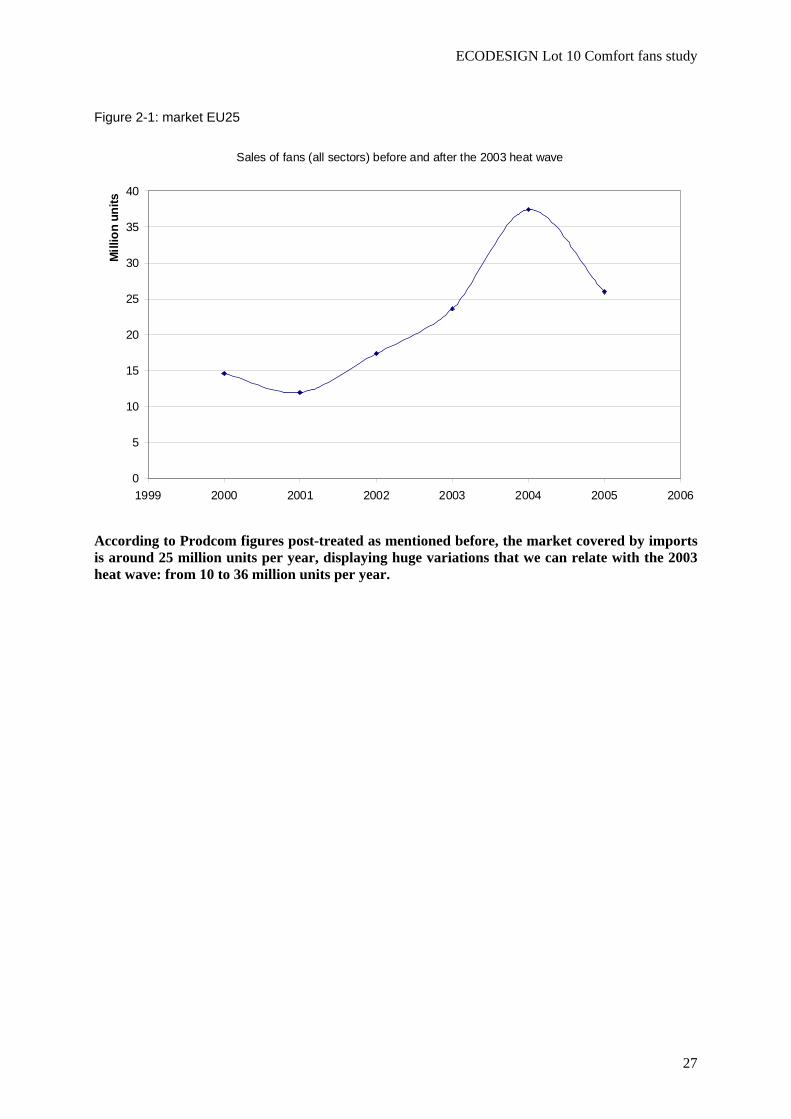
Figure 2-1: market EU25
Sales of fans (all sectors) before and after the 2003 heat wave
0
5
10
15
20
25
30
35
40
1999 2000 2001 2002 2003 2004 2005 2006
Mill
ion
units
According to Prodcom figures post-treated as mentioned before, the market covered by imports is around 25 million units per year, displaying huge variations that we can relate with the 2003 heat wave: from 10 to 36 million units per year.
ECODESIGN Lot 10 Comfort fans study
28
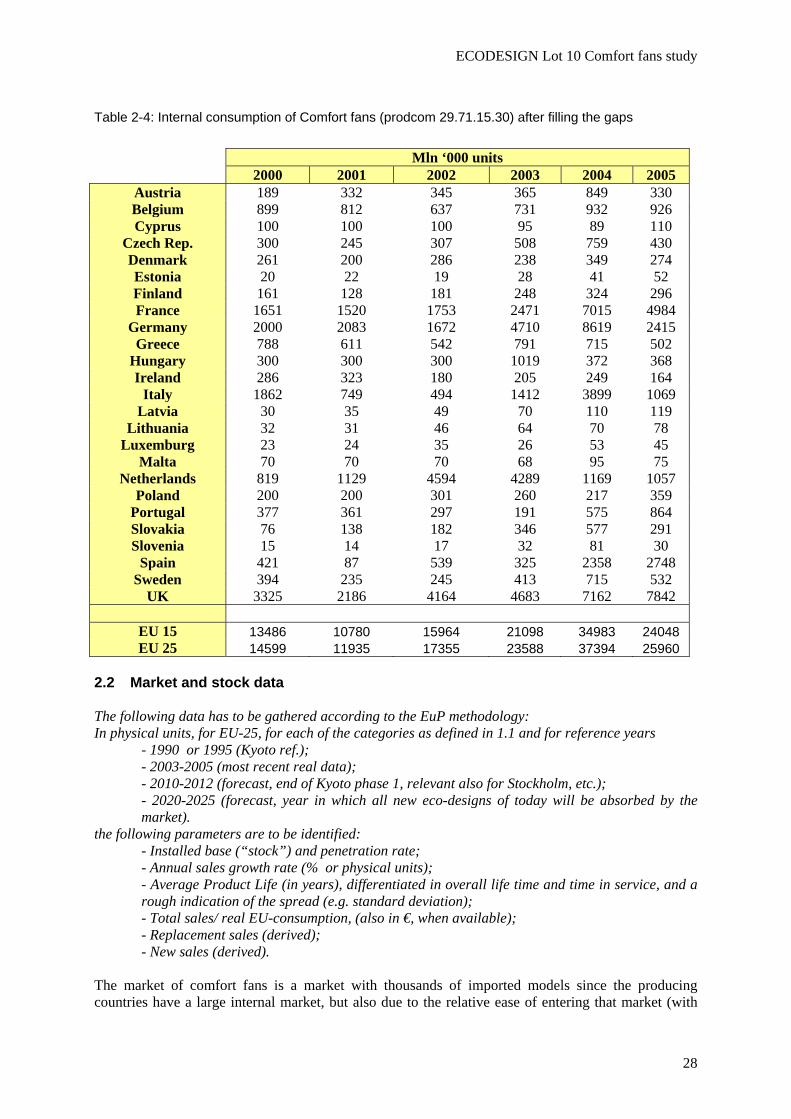
Table 2-4: Internal consumption of Comfort fans (prodcom 29.71.15.30) after filling the gaps
2.2 Market and stock data The following data has to be gathered according to the EuP methodology: In physical units, for EU-25, for each of the categories as defined in 1.1 and for reference years
- 1990 or 1995 (Kyoto ref.); - 2003-2005 (most recent real data); - 2010-2012 (forecast, end of Kyoto phase 1, relevant also for Stockholm, etc.); - 2020-2025 (forecast, year in which all new eco-designs of today will be absorbed by the market).
the following parameters are to be identified: - Installed base (“stock”) and penetration rate; - Annual sales growth rate (% or physical units); - Average Product Life (in years), differentiated in overall life time and time in service, and a rough indication of the spread (e.g. standard deviation); - Total sales/ real EU-consumption, (also in €, when available); - Replacement sales (derived); - New sales (derived).
The market of comfort fans is a market with thousands of imported models since the producing countries have a large internal market, but also due to the relative ease of entering that market (with
Mln ‘000 units 2000 2001 2002 2003 2004 2005
Austria 189 332 345 365 849 330 Belgium 899 812 637 731 932 926 Cyprus 100 100 100 95 89 110
Czech Rep. 300 245 307 508 759 430 Denmark 261 200 286 238 349 274 Estonia 20 22 19 28 41 52 Finland 161 128 181 248 324 296 France 1651 1520 1753 2471 7015 4984
Germany 2000 2083 1672 4710 8619 2415 Greece 788 611 542 791 715 502
Hungary 300 300 300 1019 372 368 Ireland 286 323 180 205 249 164
Italy 1862 749 494 1412 3899 1069 Latvia 30 35 49 70 110 119
Lithuania 32 31 46 64 70 78 Luxemburg 23 24 35 26 53 45
Malta 70 70 70 68 95 75 Netherlands 819 1129 4594 4289 1169 1057
Poland 200 200 301 260 217 359 Portugal 377 361 297 191 575 864 Slovakia 76 138 182 346 577 291 Slovenia 15 14 17 32 81 30
Spain 421 87 539 325 2358 2748 Sweden 394 235 245 413 715 532
UK 3325 2186 4164 4683 7162 7842
EU 15 13486 10780 15964 21098 34983 24048 EU 25 14599 11935 17355 23588 37394 25960
ECODESIGN Lot 10 Comfort fans study
29
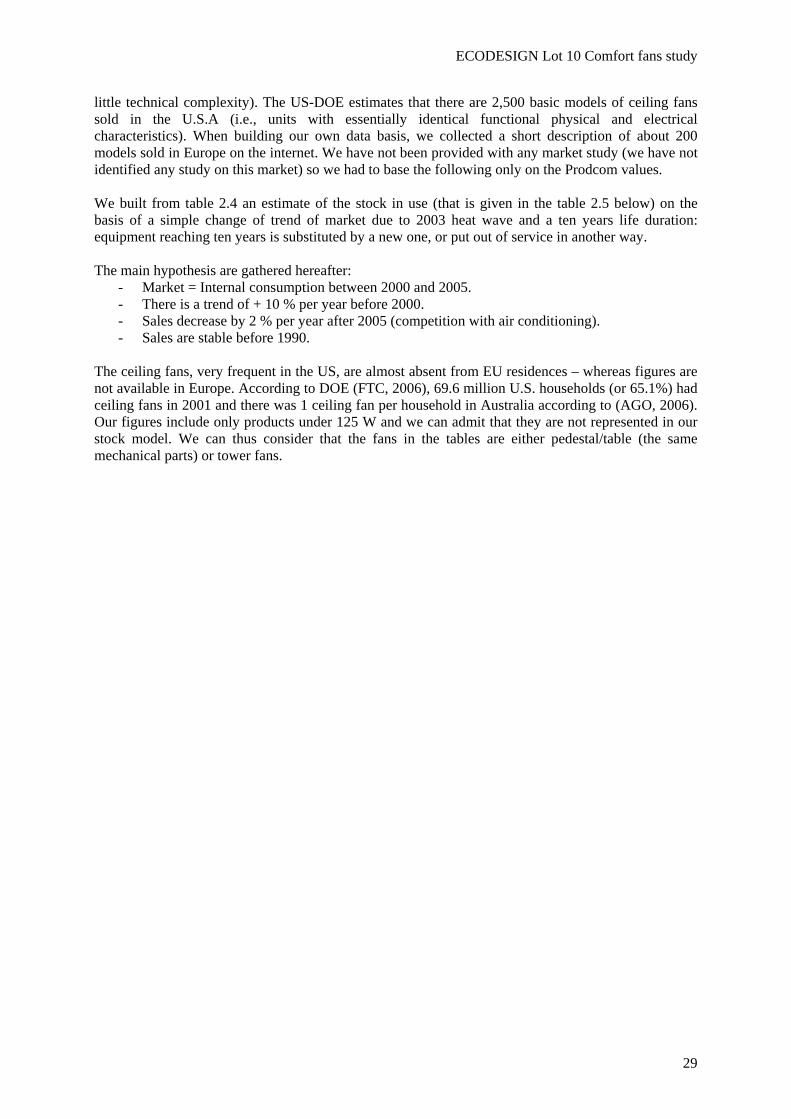
little technical complexity). The US-DOE estimates that there are 2,500 basic models of ceiling fans sold in the U.S.A (i.e., units with essentially identical functional physical and electrical characteristics). When building our own data basis, we collected a short description of about 200 models sold in Europe on the internet. We have not been provided with any market study (we have not identified any study on this market) so we had to base the following only on the Prodcom values. We built from table 2.4 an estimate of the stock in use (that is given in the table 2.5 below) on the basis of a simple change of trend of market due to 2003 heat wave and a ten years life duration: equipment reaching ten years is substituted by a new one, or put out of service in another way. The main hypothesis are gathered hereafter:
- Market = Internal consumption between 2000 and 2005. - There is a trend of + 10 % per year before 2000. - Sales decrease by 2 % per year after 2005 (competition with air conditioning). - Sales are stable before 1990.
The ceiling fans, very frequent in the US, are almost absent from EU residences – whereas figures are not available in Europe. According to DOE (FTC, 2006), 69.6 million U.S. households (or 65.1%) had ceiling fans in 2001 and there was 1 ceiling fan per household in Australia according to (AGO, 2006). Our figures include only products under 125 W and we can admit that they are not represented in our stock model. We can thus consider that the fans in the tables are either pedestal/table (the same mechanical parts) or tower fans.
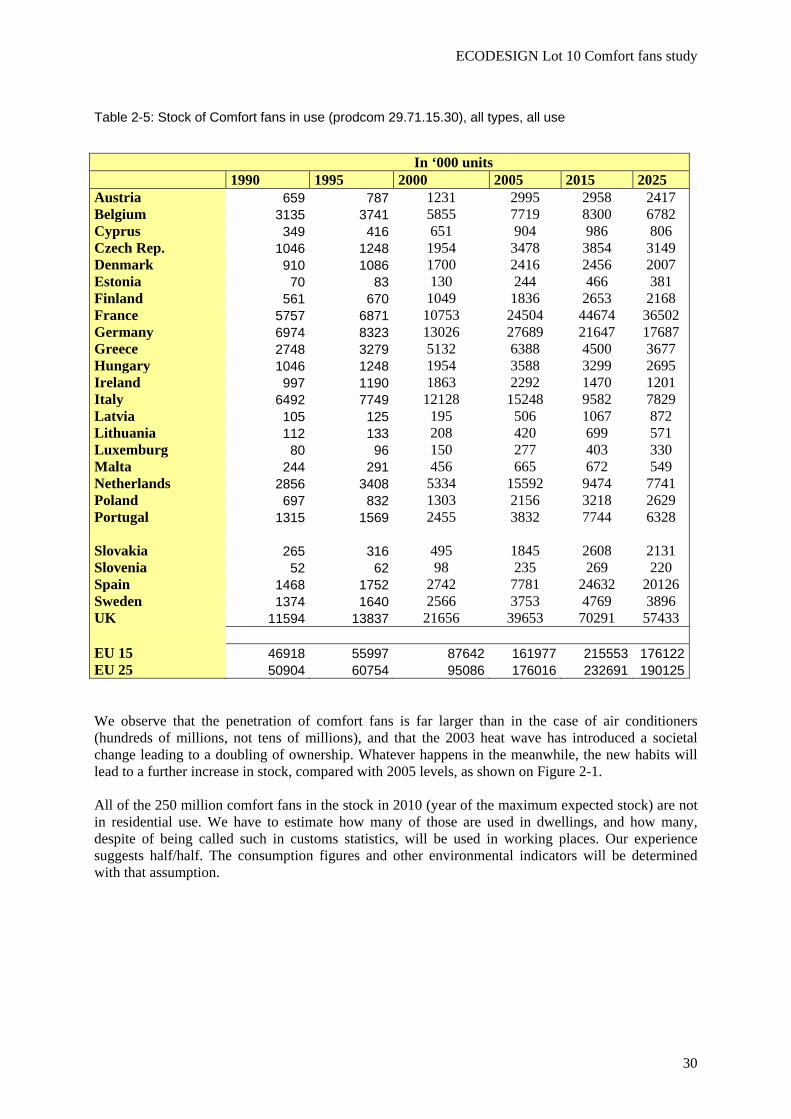
ECODESIGN Lot 10 Comfort fans study
30
Table 2-5: Stock of Comfort fans in use (prodcom 29.71.15.30), all types, all use
We observe that the penetration of comfort fans is far larger than in the case of air conditioners (hundreds of millions, not tens of millions), and that the 2003 heat wave has introduced a societal change leading to a doubling of ownership. Whatever happens in the meanwhile, the new habits will lead to a further increase in stock, compared with 2005 levels, as shown on Figure 2-1. All of the 250 million comfort fans in the stock in 2010 (year of the maximum expected stock) are not in residential use. We have to estimate how many of those are used in dwellings, and how many, despite of being called such in customs statistics, will be used in working places. Our experience suggests half/half. The consumption figures and other environmental indicators will be determined with that assumption.
In ‘000 units 1990 1995 2000 2005 2015 2025 Austria 659 787 1231 2995 2958 2417 Belgium 3135 3741 5855 7719 8300 6782 Cyprus 349 416 651 904 986 806 Czech Rep. 1046 1248 1954 3478 3854 3149 Denmark 910 1086 1700 2416 2456 2007 Estonia 70 83 130 244 466 381 Finland 561 670 1049 1836 2653 2168 France 5757 6871 10753 24504 44674 36502 Germany 6974 8323 13026 27689 21647 17687 Greece 2748 3279 5132 6388 4500 3677 Hungary 1046 1248 1954 3588 3299 2695 Ireland 997 1190 1863 2292 1470 1201 Italy 6492 7749 12128 15248 9582 7829 Latvia 105 125 195 506 1067 872 Lithuania 112 133 208 420 699 571 Luxemburg 80 96 150 277 403 330 Malta 244 291 456 665 672 549 Netherlands 2856 3408 5334 15592 9474 7741 Poland 697 832 1303 2156 3218 2629 Portugal 1315 1569 2455 3832 7744 6328 Slovakia 265 316 495 1845 2608 2131 Slovenia 52 62 98 235 269 220 Spain 1468 1752 2742 7781 24632 20126 Sweden 1374 1640 2566 3753 4769 3896 UK 11594 13837 21656 39653 70291 57433 EU 15 46918 55997 87642 161977 215553 176122EU 25 50904 60754 95086 176016 232691 190125
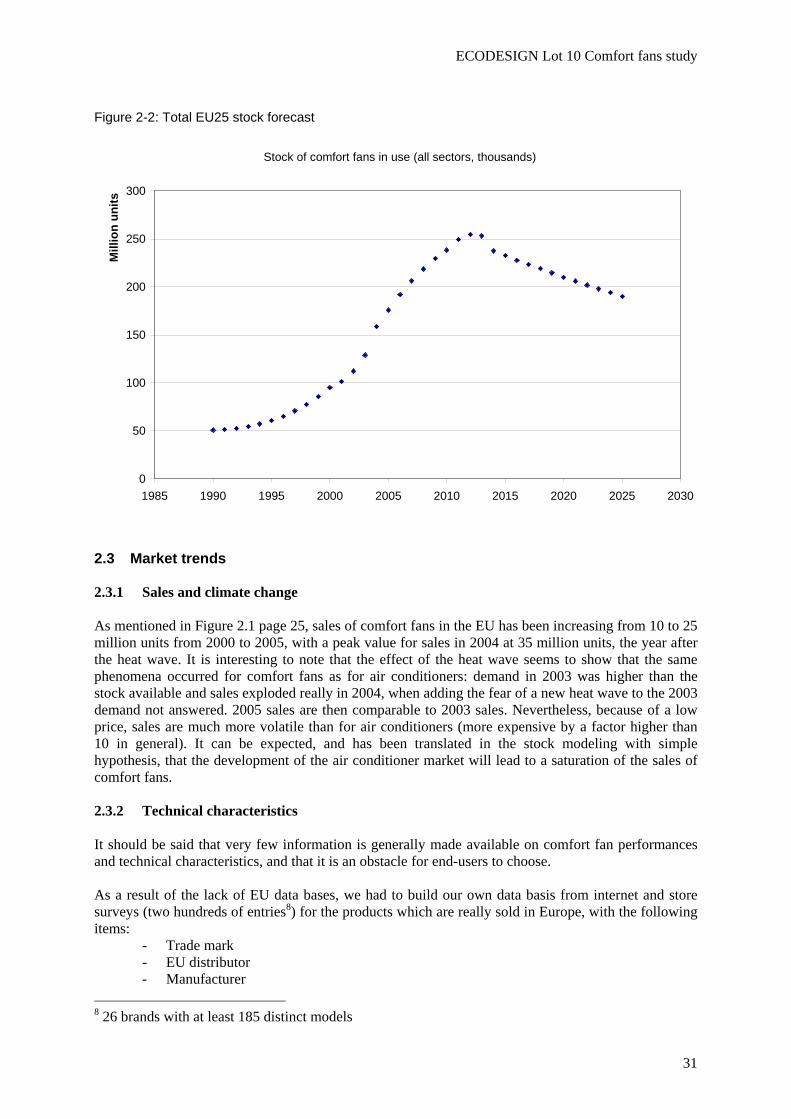
ECODESIGN Lot 10 Comfort fans study
31
Figure 2-2: Total EU25 stock forecast
Stock of comfort fans in use (all sectors, thousands)
0
50
100
150
200
250
300
1985 1990 1995 2000 2005 2010 2015 2020 2025 2030
Mill
ion
units
2.3 Market trends 2.3.1 Sales and climate change As mentioned in Figure 2.1 page 25, sales of comfort fans in the EU has been increasing from 10 to 25 million units from 2000 to 2005, with a peak value for sales in 2004 at 35 million units, the year after the heat wave. It is interesting to note that the effect of the heat wave seems to show that the same phenomena occurred for comfort fans as for air conditioners: demand in 2003 was higher than the stock available and sales exploded really in 2004, when adding the fear of a new heat wave to the 2003 demand not answered. 2005 sales are then comparable to 2003 sales. Nevertheless, because of a low price, sales are much more volatile than for air conditioners (more expensive by a factor higher than 10 in general). It can be expected, and has been translated in the stock modeling with simple hypothesis, that the development of the air conditioner market will lead to a saturation of the sales of comfort fans. 2.3.2 Technical characteristics It should be said that very few information is generally made available on comfort fan performances and technical characteristics, and that it is an obstacle for end-users to choose. As a result of the lack of EU data bases, we had to build our own data basis from internet and store surveys (two hundreds of entries8) for the products which are really sold in Europe, with the following items:
- Trade mark - EU distributor - Manufacturer
8 26 brands with at least 185 distinct models
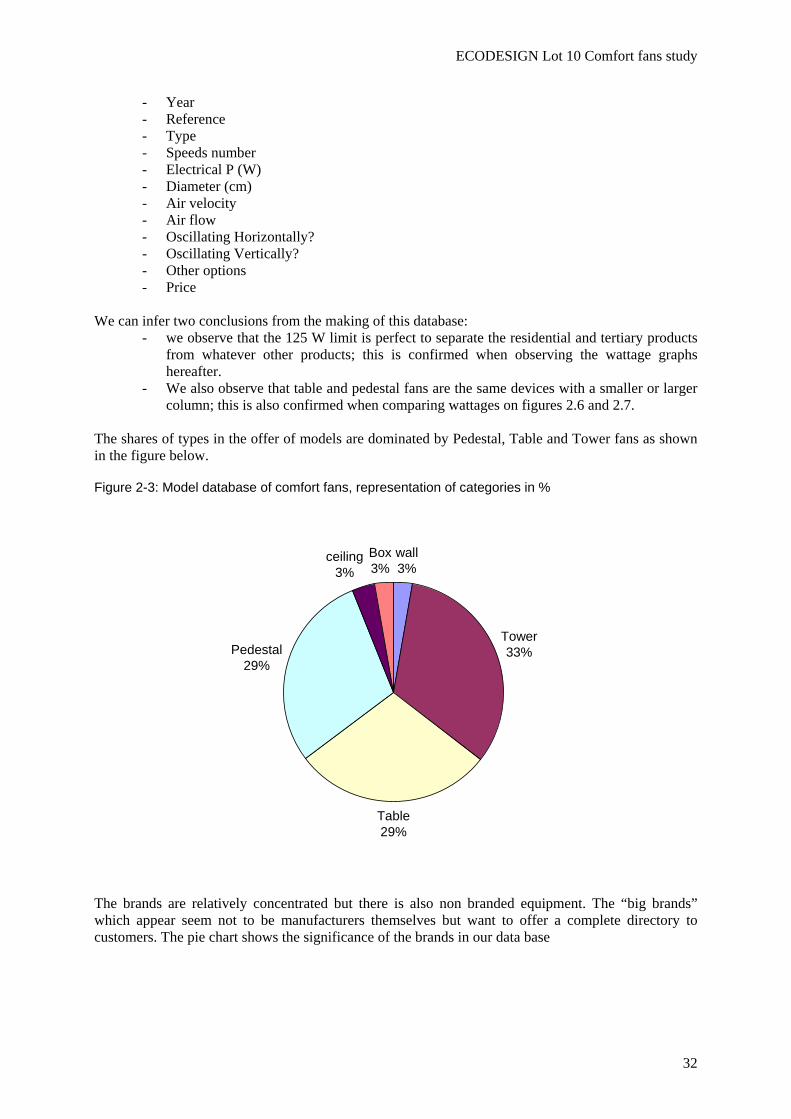
ECODESIGN Lot 10 Comfort fans study
32
- Year - Reference - Type - Speeds number - Electrical P (W) - Diameter (cm) - Air velocity - Air flow - Oscillating Horizontally? - Oscillating Vertically? - Other options - Price
We can infer two conclusions from the making of this database:
- we observe that the 125 W limit is perfect to separate the residential and tertiary products from whatever other products; this is confirmed when observing the wattage graphs hereafter.
- We also observe that table and pedestal fans are the same devices with a smaller or larger column; this is also confirmed when comparing wattages on figures 2.6 and 2.7.
The shares of types in the offer of models are dominated by Pedestal, Table and Tower fans as shown in the figure below.
Figure 2-3: Model database of comfort fans, representation of categories in %
wall3%
Tower33%
Table29%
Pedestal29%
ceiling3%
Box3%
The brands are relatively concentrated but there is also non branded equipment. The “big brands” which appear seem not to be manufacturers themselves but want to offer a complete directory to customers. The pie chart shows the significance of the brands in our data base
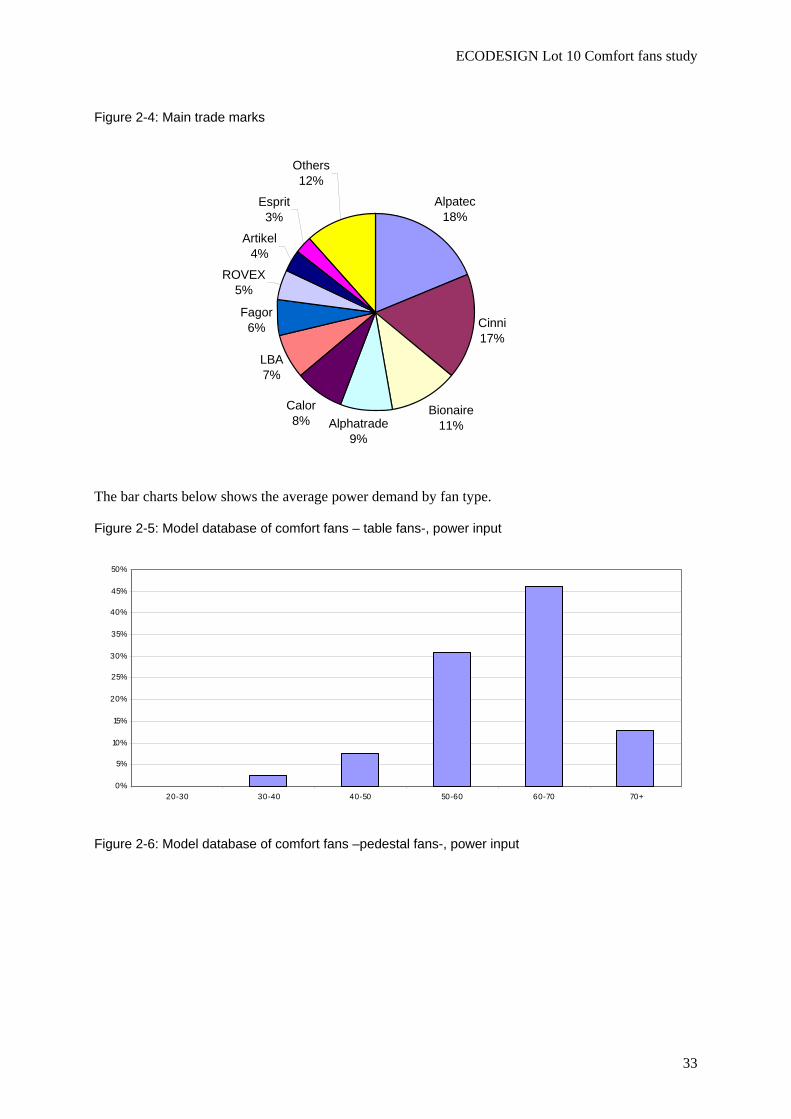
ECODESIGN Lot 10 Comfort fans study
33
Figure 2-4: Main trade marks
Alpatec18%
Cinni17%
Bionaire11%Alphatrade
9%
Calor8%
LBA7%
Fagor6%
ROVEX5%
Artikel4%
Esprit 3%
Others12%
The bar charts below shows the average power demand by fan type.
Figure 2-5: Model database of comfort fans – table fans-, power input
0%
5%
10%
15%
20%
25%
30%
35%
40%
45%
50%
20-30 30-40 40-50 50-60 60-70 70+
Figure 2-6: Model database of comfort fans –pedestal fans-, power input
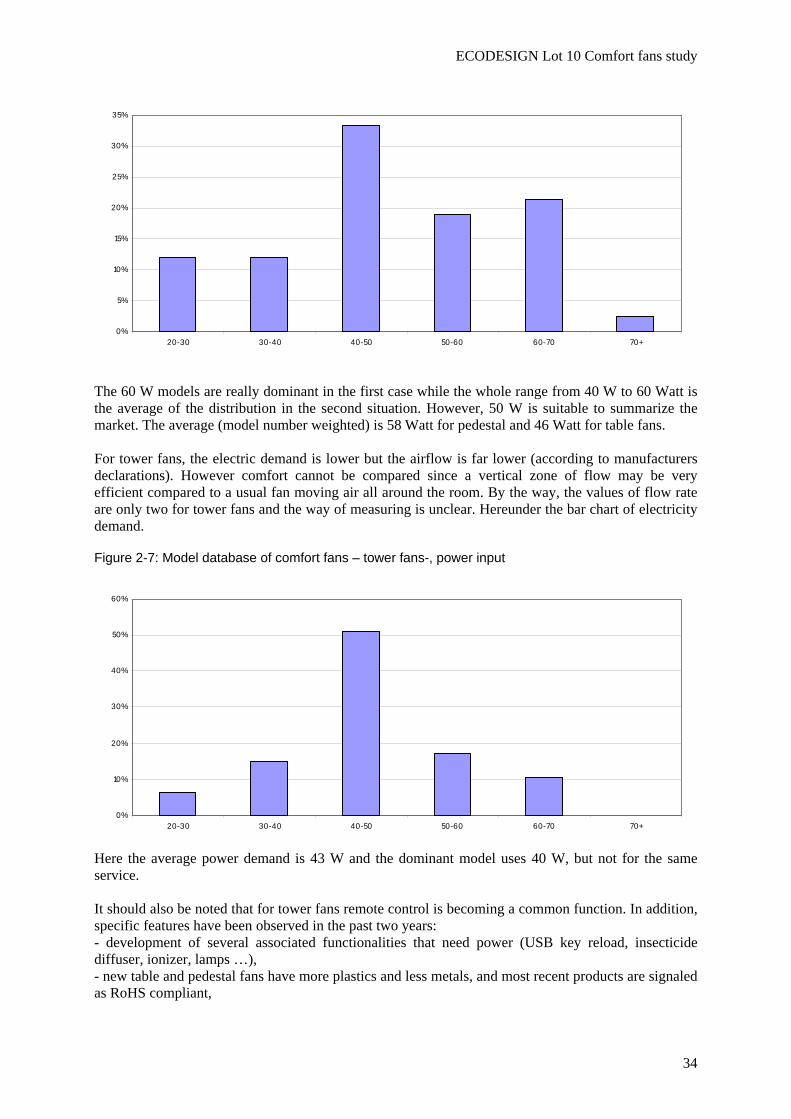
ECODESIGN Lot 10 Comfort fans study
34
0%
5%
10%
15%
20%
25%
30%
35%
20-30 30-40 40-50 50-60 60-70 70+
The 60 W models are really dominant in the first case while the whole range from 40 W to 60 Watt is the average of the distribution in the second situation. However, 50 W is suitable to summarize the market. The average (model number weighted) is 58 Watt for pedestal and 46 Watt for table fans. For tower fans, the electric demand is lower but the airflow is far lower (according to manufacturers declarations). However comfort cannot be compared since a vertical zone of flow may be very efficient compared to a usual fan moving air all around the room. By the way, the values of flow rate are only two for tower fans and the way of measuring is unclear. Hereunder the bar chart of electricity demand.
Figure 2-7: Model database of comfort fans – tower fans-, power input
Here the average power demand is 43 W and the dominant model uses 40 W, but not for the same service. It should also be noted that for tower fans remote control is becoming a common function. In addition, specific features have been observed in the past two years: - development of several associated functionalities that need power (USB key reload, insecticide diffuser, ionizer, lamps …), - new table and pedestal fans have more plastics and less metals, and most recent products are signaled as RoHS compliant,
0%
10%
20%
30%
40%
50%
60%
20-30 30-40 40-50 50-60 60-70 70+
ECODESIGN Lot 10 Comfort fans study
35
- nevertheless, the weight of the “pedestal” in the fan assembly is growing to ensure better balance of the fan. 2.4 Consumer expenditure base data According to the MEEuP methodology, task 2.4 should contain: For each of the categories defined in subtask 1.1: Average consumer prices, incl. VAT, in Euro. Determination of applicable rates for running costs and disposal, per EU Member State, specifically
- Electricity rates (€/ kWh); - Consumer prices of other consumables filters - Repair, cleaning and Maintenance costs (€/product life); - Installation costs (for installed appliances only); - Disposal tariffs/ taxes (€/product);
This section provides data on expenditure of comfort fans in each of the EU Member States. Three types of expenditure are considered:
• initial cost (price), • running costs and • disposal costs.
Running costs include electricity consumption, and repair and maintenance costs, whilst disposal costs include disposal taxes and tariffs. Additionally, information on the discount rate is also presented. 2.4.1 Consumer price We have completed this paragraph by calculating average prices for comfort fans gathered in our database of sold models. Price variations are not caused by brand (very few “big names”) or performance but by finishing of aspect (steel, chromium) and the appearance of plastic or not. Price are very different among tower, wall, ceiling and table/pedestal. The type is not the best explanatory factor. There is an influence of Wattage as can be seen in the figure below but somehow erratic, except for the very few wall fans.
Figure 2-8: Price as a function of Wattage
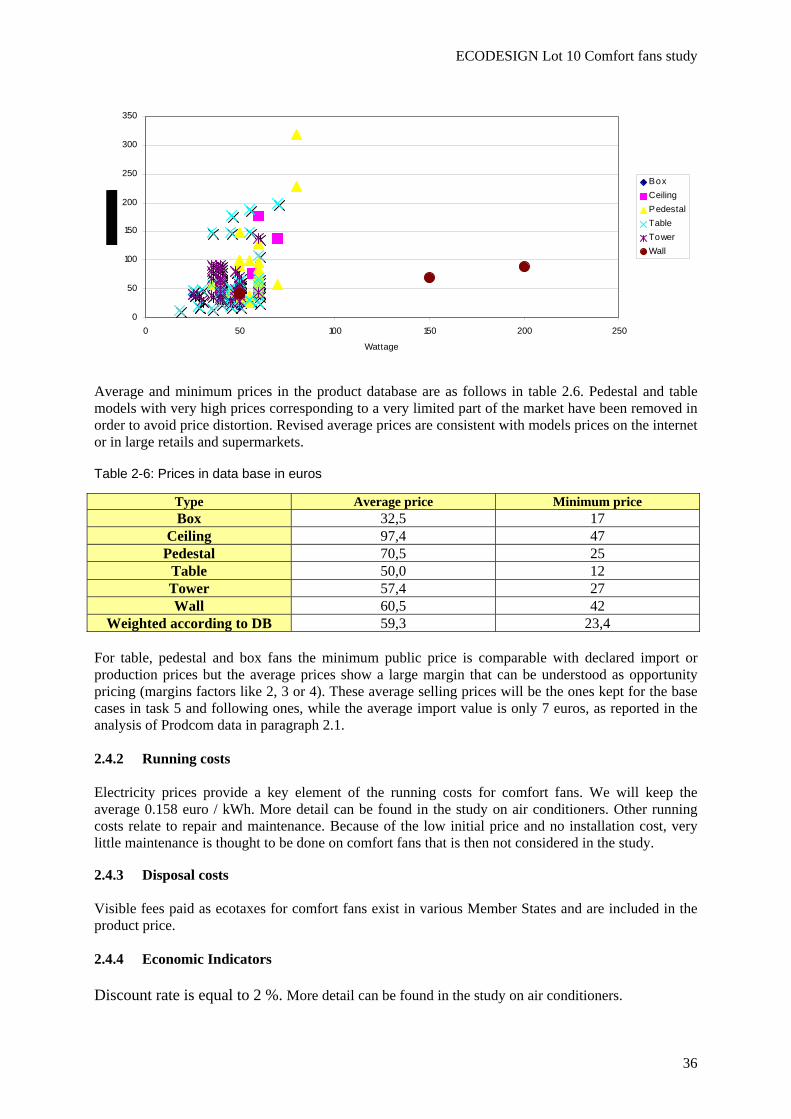
ECODESIGN Lot 10 Comfort fans study
36
Average and minimum prices in the product database are as follows in table 2.6. Pedestal and table models with very high prices corresponding to a very limited part of the market have been removed in order to avoid price distortion. Revised average prices are consistent with models prices on the internet or in large retails and supermarkets.
Table 2-6: Prices in data base in euros
Type Average price Minimum price Box 32,5 17
Ceiling 97,4 47 Pedestal 70,5 25
Table 50,0 12 Tower 57,4 27 Wall 60,5 42
Weighted according to DB 59,3 23,4 For table, pedestal and box fans the minimum public price is comparable with declared import or production prices but the average prices show a large margin that can be understood as opportunity pricing (margins factors like 2, 3 or 4). These average selling prices will be the ones kept for the base cases in task 5 and following ones, while the average import value is only 7 euros, as reported in the analysis of Prodcom data in paragraph 2.1. 2.4.2 Running costs Electricity prices provide a key element of the running costs for comfort fans. We will keep the average 0.158 euro / kWh. More detail can be found in the study on air conditioners. Other running costs relate to repair and maintenance. Because of the low initial price and no installation cost, very little maintenance is thought to be done on comfort fans that is then not considered in the study. 2.4.3 Disposal costs Visible fees paid as ecotaxes for comfort fans exist in various Member States and are included in the product price. 2.4.4 Economic Indicators Discount rate is equal to 2 %. More detail can be found in the study on air conditioners.
0
50
100
150
200
250
300
350
0 50 100 150 200 250
Wattage
BoxCeilingPedestalTableTowerWall
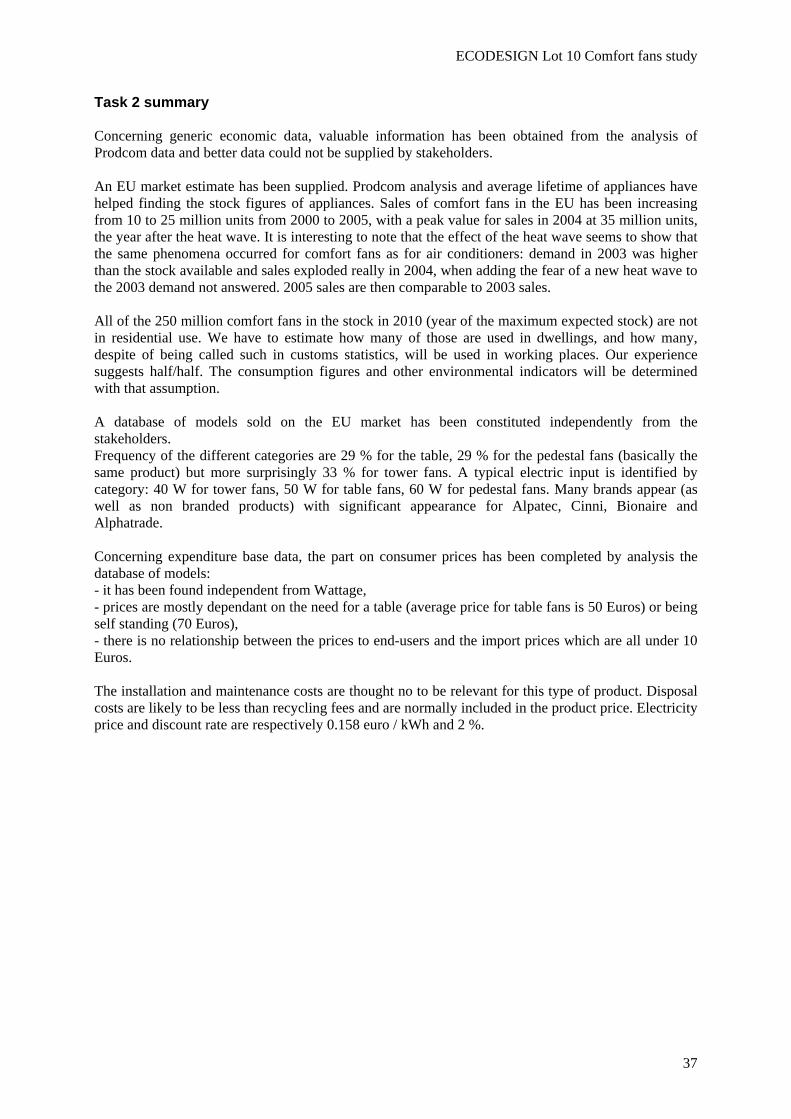
ECODESIGN Lot 10 Comfort fans study
37
Task 2 summary Concerning generic economic data, valuable information has been obtained from the analysis of Prodcom data and better data could not be supplied by stakeholders. An EU market estimate has been supplied. Prodcom analysis and average lifetime of appliances have helped finding the stock figures of appliances. Sales of comfort fans in the EU has been increasing from 10 to 25 million units from 2000 to 2005, with a peak value for sales in 2004 at 35 million units, the year after the heat wave. It is interesting to note that the effect of the heat wave seems to show that the same phenomena occurred for comfort fans as for air conditioners: demand in 2003 was higher than the stock available and sales exploded really in 2004, when adding the fear of a new heat wave to the 2003 demand not answered. 2005 sales are then comparable to 2003 sales. All of the 250 million comfort fans in the stock in 2010 (year of the maximum expected stock) are not in residential use. We have to estimate how many of those are used in dwellings, and how many, despite of being called such in customs statistics, will be used in working places. Our experience suggests half/half. The consumption figures and other environmental indicators will be determined with that assumption. A database of models sold on the EU market has been constituted independently from the stakeholders. Frequency of the different categories are 29 % for the table, 29 % for the pedestal fans (basically the same product) but more surprisingly 33 % for tower fans. A typical electric input is identified by category: 40 W for tower fans, 50 W for table fans, 60 W for pedestal fans. Many brands appear (as well as non branded products) with significant appearance for Alpatec, Cinni, Bionaire and Alphatrade. Concerning expenditure base data, the part on consumer prices has been completed by analysis the database of models: - it has been found independent from Wattage, - prices are mostly dependant on the need for a table (average price for table fans is 50 Euros) or being self standing (70 Euros), - there is no relationship between the prices to end-users and the import prices which are all under 10 Euros. The installation and maintenance costs are thought no to be relevant for this type of product. Disposal costs are likely to be less than recycling fees and are normally included in the product price. Electricity price and discount rate are respectively 0.158 euro / kWh and 2 %.
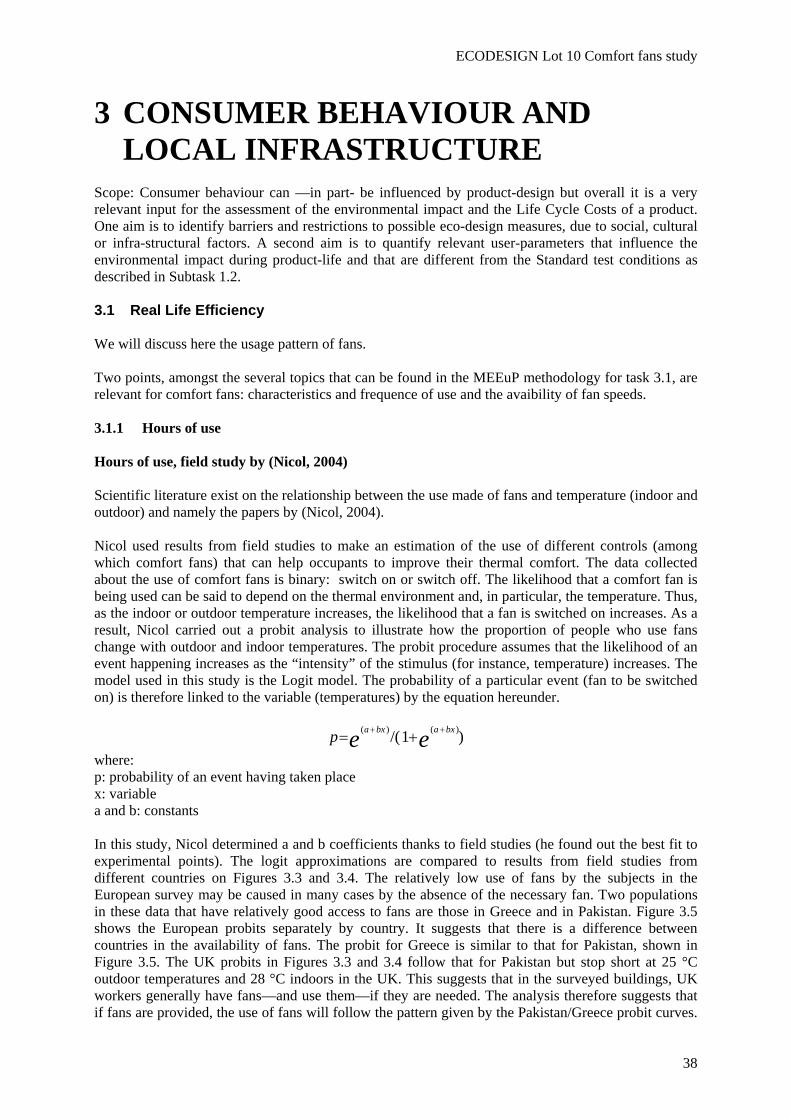
ECODESIGN Lot 10 Comfort fans study
38
3 CONSUMER BEHAVIOUR AND LOCAL INFRASTRUCTURE
Scope: Consumer behaviour can —in part- be influenced by product-design but overall it is a very relevant input for the assessment of the environmental impact and the Life Cycle Costs of a product. One aim is to identify barriers and restrictions to possible eco-design measures, due to social, cultural or infra-structural factors. A second aim is to quantify relevant user-parameters that influence the environmental impact during product-life and that are different from the Standard test conditions as described in Subtask 1.2. 3.1 Real Life Efficiency We will discuss here the usage pattern of fans. Two points, amongst the several topics that can be found in the MEEuP methodology for task 3.1, are relevant for comfort fans: characteristics and frequence of use and the avaibility of fan speeds. 3.1.1 Hours of use Hours of use, field study by (Nicol, 2004) Scientific literature exist on the relationship between the use made of fans and temperature (indoor and outdoor) and namely the papers by (Nicol, 2004). Nicol used results from field studies to make an estimation of the use of different controls (among which comfort fans) that can help occupants to improve their thermal comfort. The data collected about the use of comfort fans is binary: switch on or switch off. The likelihood that a comfort fan is being used can be said to depend on the thermal environment and, in particular, the temperature. Thus, as the indoor or outdoor temperature increases, the likelihood that a fan is switched on increases. As a result, Nicol carried out a probit analysis to illustrate how the proportion of people who use fans change with outdoor and indoor temperatures. The probit procedure assumes that the likelihood of an event happening increases as the “intensity” of the stimulus (for instance, temperature) increases. The model used in this study is the Logit model. The probability of a particular event (fan to be switched on) is therefore linked to the variable (temperatures) by the equation hereunder.
)1/( )()( ee bxabxap ++ += where: p: probability of an event having taken place x: variable a and b: constants In this study, Nicol determined a and b coefficients thanks to field studies (he found out the best fit to experimental points). The logit approximations are compared to results from field studies from different countries on Figures 3.3 and 3.4. The relatively low use of fans by the subjects in the European survey may be caused in many cases by the absence of the necessary fan. Two populations in these data that have relatively good access to fans are those in Greece and in Pakistan. Figure 3.5 shows the European probits separately by country. It suggests that there is a difference between countries in the availability of fans. The probit for Greece is similar to that for Pakistan, shown in Figure 3.5. The UK probits in Figures 3.3 and 3.4 follow that for Pakistan but stop short at 25 °C outdoor temperatures and 28 °C indoors in the UK. This suggests that in the surveyed buildings, UK workers generally have fans—and use them—if they are needed. The analysis therefore suggests that if fans are provided, the use of fans will follow the pattern given by the Pakistan/Greece probit curves.
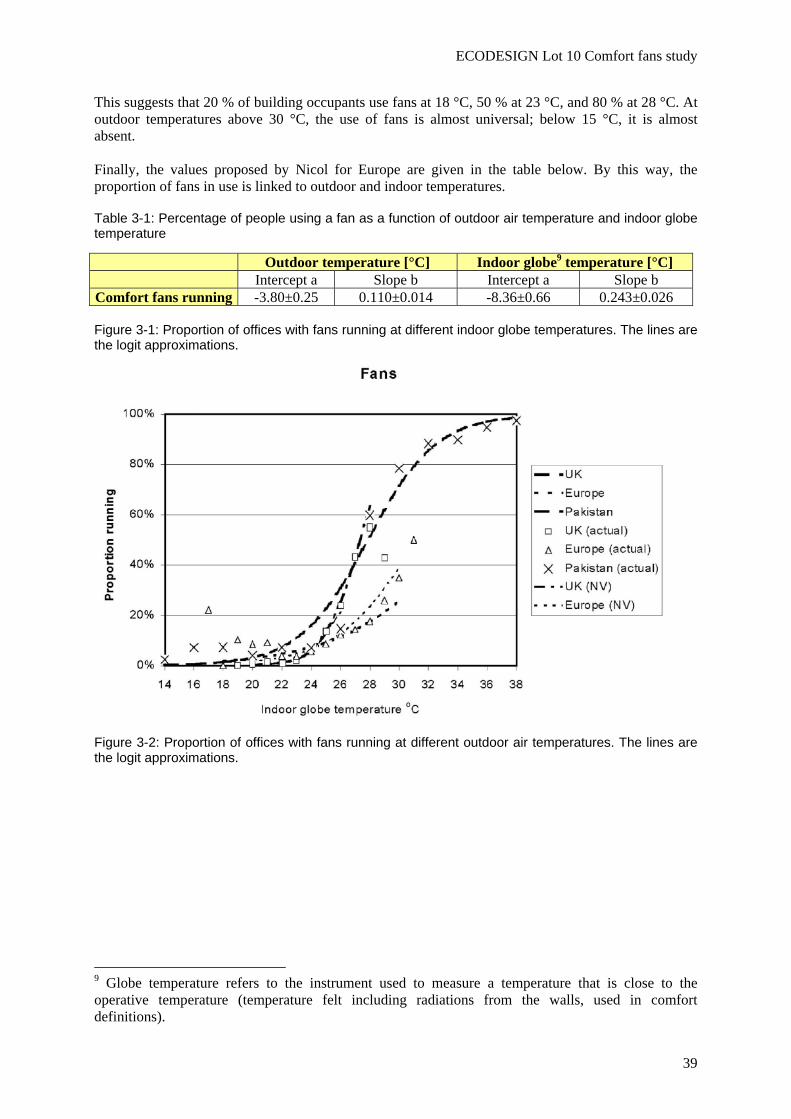
ECODESIGN Lot 10 Comfort fans study
39
This suggests that 20 % of building occupants use fans at 18 °C, 50 % at 23 °C, and 80 % at 28 °C. At outdoor temperatures above 30 °C, the use of fans is almost universal; below 15 °C, it is almost absent. Finally, the values proposed by Nicol for Europe are given in the table below. By this way, the proportion of fans in use is linked to outdoor and indoor temperatures.
Table 3-1: Percentage of people using a fan as a function of outdoor air temperature and indoor globe temperature
Outdoor temperature [°C] Indoor globe9 temperature [°C] Intercept a Slope b Intercept a Slope b
Comfort fans running -3.80±0.25 0.110±0.014 -8.36±0.66 0.243±0.026
Figure 3-1: Proportion of offices with fans running at different indoor globe temperatures. The lines are the logit approximations.
Figure 3-2: Proportion of offices with fans running at different outdoor air temperatures. The lines are the logit approximations.
9 Globe temperature refers to the instrument used to measure a temperature that is close to the operative temperature (temperature felt including radiations from the walls, used in comfort definitions).
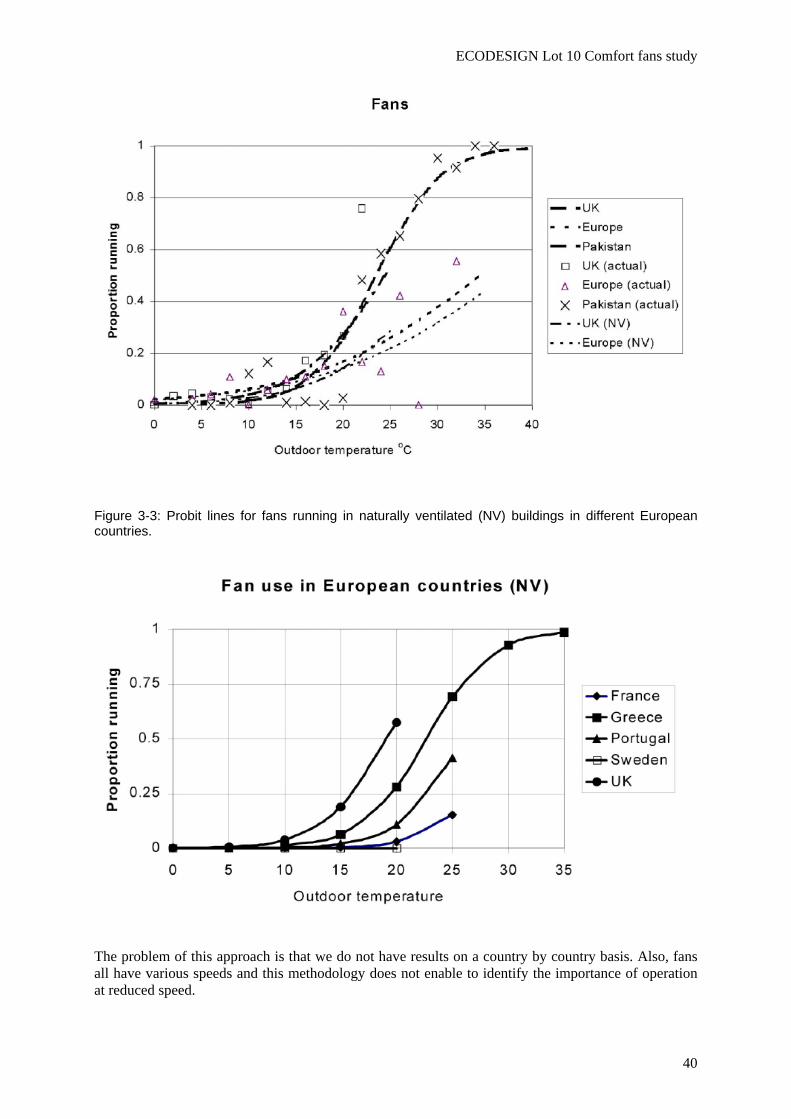
ECODESIGN Lot 10 Comfort fans study
40
Figure 3-3: Probit lines for fans running in naturally ventilated (NV) buildings in different European countries.
The problem of this approach is that we do not have results on a country by country basis. Also, fans all have various speeds and this methodology does not enable to identify the importance of operation at reduced speed.
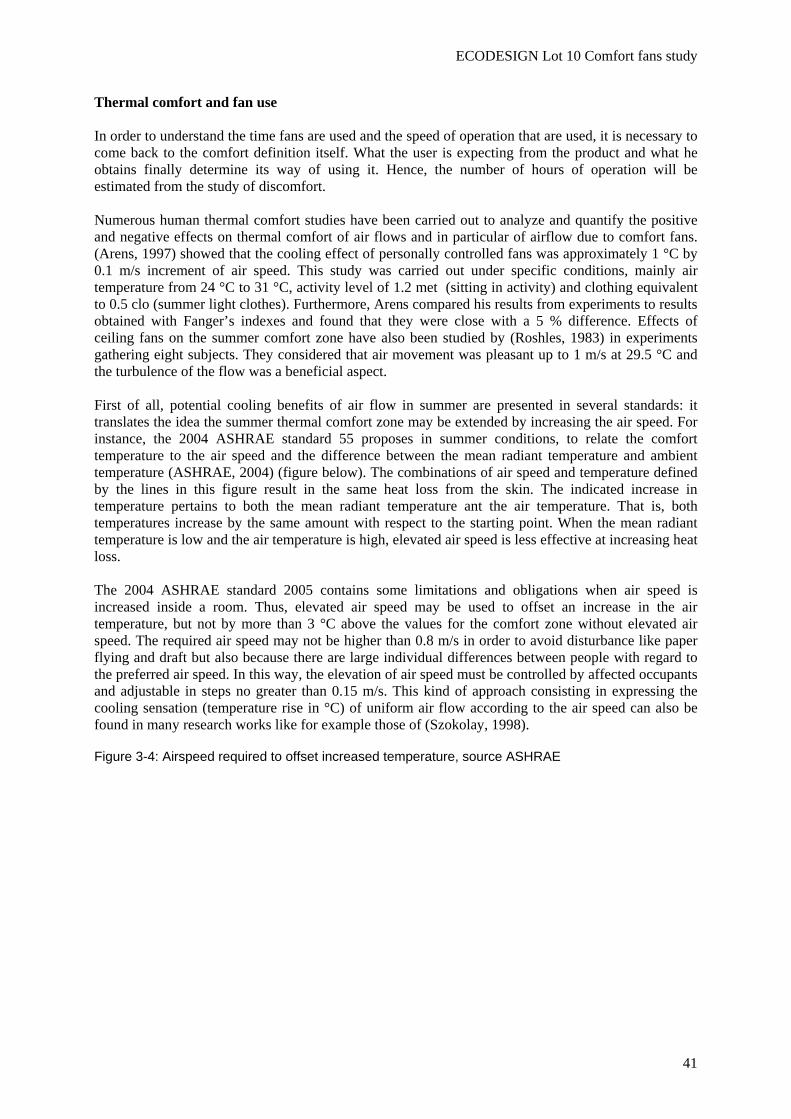
ECODESIGN Lot 10 Comfort fans study
41
Thermal comfort and fan use In order to understand the time fans are used and the speed of operation that are used, it is necessary to come back to the comfort definition itself. What the user is expecting from the product and what he obtains finally determine its way of using it. Hence, the number of hours of operation will be estimated from the study of discomfort. Numerous human thermal comfort studies have been carried out to analyze and quantify the positive and negative effects on thermal comfort of air flows and in particular of airflow due to comfort fans. (Arens, 1997) showed that the cooling effect of personally controlled fans was approximately 1 °C by 0.1 m/s increment of air speed. This study was carried out under specific conditions, mainly air temperature from 24 °C to 31 °C, activity level of 1.2 met (sitting in activity) and clothing equivalent to 0.5 clo (summer light clothes). Furthermore, Arens compared his results from experiments to results obtained with Fanger’s indexes and found that they were close with a 5 % difference. Effects of ceiling fans on the summer comfort zone have also been studied by (Roshles, 1983) in experiments gathering eight subjects. They considered that air movement was pleasant up to 1 m/s at 29.5 °C and the turbulence of the flow was a beneficial aspect. First of all, potential cooling benefits of air flow in summer are presented in several standards: it translates the idea the summer thermal comfort zone may be extended by increasing the air speed. For instance, the 2004 ASHRAE standard 55 proposes in summer conditions, to relate the comfort temperature to the air speed and the difference between the mean radiant temperature and ambient temperature (ASHRAE, 2004) (figure below). The combinations of air speed and temperature defined by the lines in this figure result in the same heat loss from the skin. The indicated increase in temperature pertains to both the mean radiant temperature ant the air temperature. That is, both temperatures increase by the same amount with respect to the starting point. When the mean radiant temperature is low and the air temperature is high, elevated air speed is less effective at increasing heat loss. The 2004 ASHRAE standard 2005 contains some limitations and obligations when air speed is increased inside a room. Thus, elevated air speed may be used to offset an increase in the air temperature, but not by more than 3 °C above the values for the comfort zone without elevated air speed. The required air speed may not be higher than 0.8 m/s in order to avoid disturbance like paper flying and draft but also because there are large individual differences between people with regard to the preferred air speed. In this way, the elevation of air speed must be controlled by affected occupants and adjustable in steps no greater than 0.15 m/s. This kind of approach consisting in expressing the cooling sensation (temperature rise in °C) of uniform air flow according to the air speed can also be found in many research works like for example those of (Szokolay, 1998).
Figure 3-4: Airspeed required to offset increased temperature, source ASHRAE
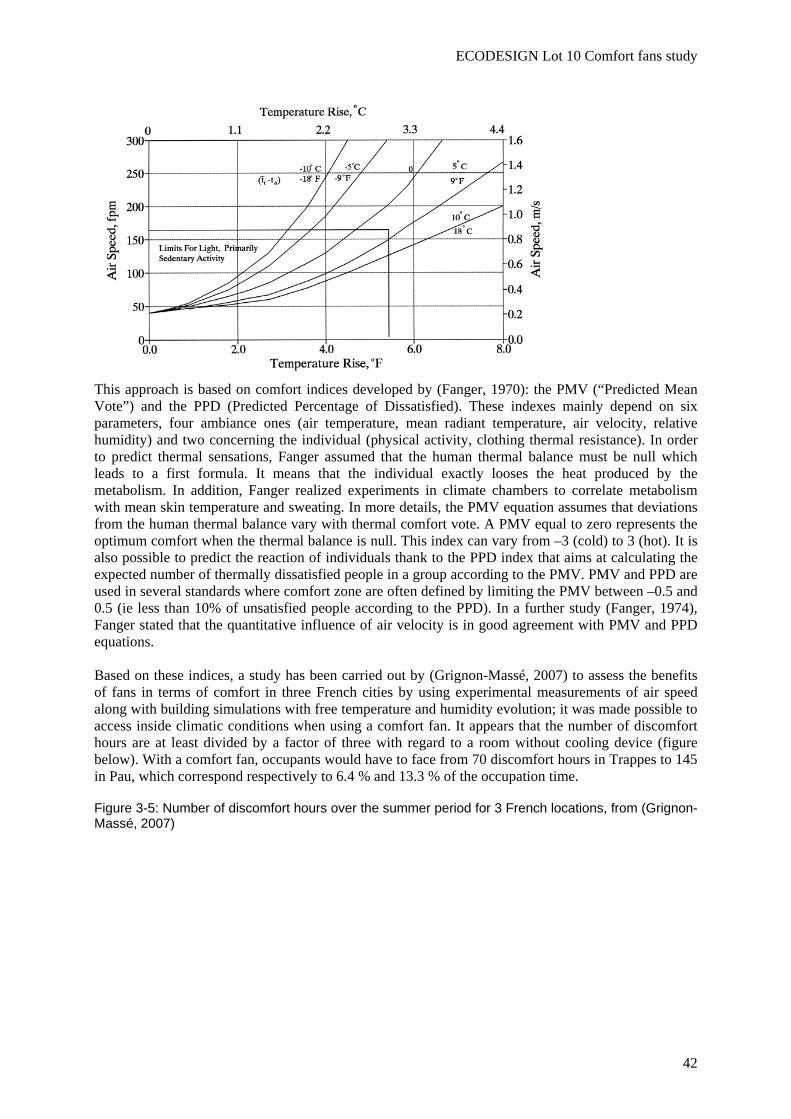
ECODESIGN Lot 10 Comfort fans study
42
This approach is based on comfort indices developed by (Fanger, 1970): the PMV (“Predicted Mean Vote”) and the PPD (Predicted Percentage of Dissatisfied). These indexes mainly depend on six parameters, four ambiance ones (air temperature, mean radiant temperature, air velocity, relative humidity) and two concerning the individual (physical activity, clothing thermal resistance). In order to predict thermal sensations, Fanger assumed that the human thermal balance must be null which leads to a first formula. It means that the individual exactly looses the heat produced by the metabolism. In addition, Fanger realized experiments in climate chambers to correlate metabolism with mean skin temperature and sweating. In more details, the PMV equation assumes that deviations from the human thermal balance vary with thermal comfort vote. A PMV equal to zero represents the optimum comfort when the thermal balance is null. This index can vary from –3 (cold) to 3 (hot). It is also possible to predict the reaction of individuals thank to the PPD index that aims at calculating the expected number of thermally dissatisfied people in a group according to the PMV. PMV and PPD are used in several standards where comfort zone are often defined by limiting the PMV between –0.5 and 0.5 (ie less than 10% of unsatisfied people according to the PPD). In a further study (Fanger, 1974), Fanger stated that the quantitative influence of air velocity is in good agreement with PMV and PPD equations. Based on these indices, a study has been carried out by (Grignon-Massé, 2007) to assess the benefits of fans in terms of comfort in three French cities by using experimental measurements of air speed along with building simulations with free temperature and humidity evolution; it was made possible to access inside climatic conditions when using a comfort fan. It appears that the number of discomfort hours are at least divided by a factor of three with regard to a room without cooling device (figure below). With a comfort fan, occupants would have to face from 70 discomfort hours in Trappes to 145 in Pau, which correspond respectively to 6.4 % and 13.3 % of the occupation time.
Figure 3-5: Number of discomfort hours over the summer period for 3 French locations, from (Grignon-Massé, 2007)
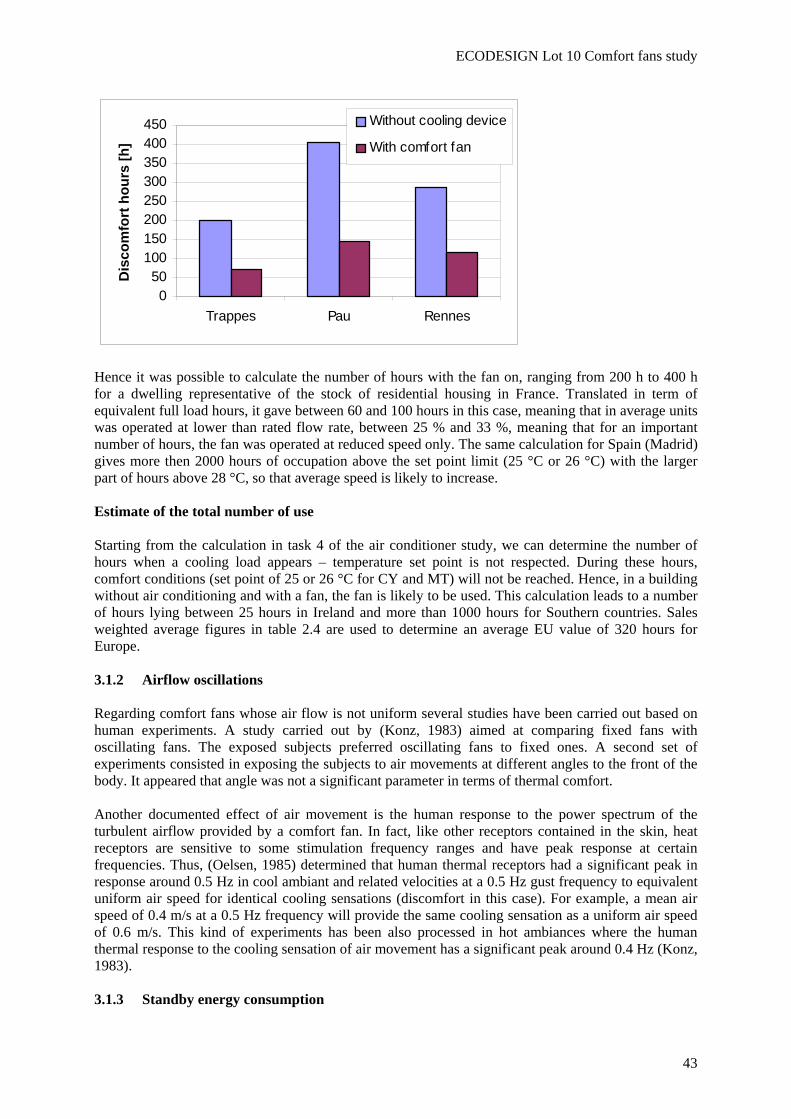
ECODESIGN Lot 10 Comfort fans study
43
050
100150200250300350400450
Trappes Pau Rennes
Dis
com
fort
hou
rs [h
]Without cooling device
With comfort fan
Hence it was possible to calculate the number of hours with the fan on, ranging from 200 h to 400 h for a dwelling representative of the stock of residential housing in France. Translated in term of equivalent full load hours, it gave between 60 and 100 hours in this case, meaning that in average units was operated at lower than rated flow rate, between 25 % and 33 %, meaning that for an important number of hours, the fan was operated at reduced speed only. The same calculation for Spain (Madrid) gives more then 2000 hours of occupation above the set point limit (25 °C or 26 °C) with the larger part of hours above 28 °C, so that average speed is likely to increase. Estimate of the total number of use Starting from the calculation in task 4 of the air conditioner study, we can determine the number of hours when a cooling load appears – temperature set point is not respected. During these hours, comfort conditions (set point of 25 or 26 °C for CY and MT) will not be reached. Hence, in a building without air conditioning and with a fan, the fan is likely to be used. This calculation leads to a number of hours lying between 25 hours in Ireland and more than 1000 hours for Southern countries. Sales weighted average figures in table 2.4 are used to determine an average EU value of 320 hours for Europe. 3.1.2 Airflow oscillations Regarding comfort fans whose air flow is not uniform several studies have been carried out based on human experiments. A study carried out by (Konz, 1983) aimed at comparing fixed fans with oscillating fans. The exposed subjects preferred oscillating fans to fixed ones. A second set of experiments consisted in exposing the subjects to air movements at different angles to the front of the body. It appeared that angle was not a significant parameter in terms of thermal comfort. Another documented effect of air movement is the human response to the power spectrum of the turbulent airflow provided by a comfort fan. In fact, like other receptors contained in the skin, heat receptors are sensitive to some stimulation frequency ranges and have peak response at certain frequencies. Thus, (Oelsen, 1985) determined that human thermal receptors had a significant peak in response around 0.5 Hz in cool ambiant and related velocities at a 0.5 Hz gust frequency to equivalent uniform air speed for identical cooling sensations (discomfort in this case). For example, a mean air speed of 0.4 m/s at a 0.5 Hz frequency will provide the same cooling sensation as a uniform air speed of 0.6 m/s. This kind of experiments has been also processed in hot ambiances where the human thermal response to the cooling sensation of air movement has a significant peak around 0.4 Hz (Konz, 1983). 3.1.3 Standby energy consumption
ECODESIGN Lot 10 Comfort fans study
44
(AGO, 2006) gives the results of a survey of the standby energy consumption of comfort fans led in Australia in 2005. The results are gathered hereafter for the 3 types of fans identified in the study. “Pedestal fan ownership was found to be 0.57 units per house in 2005, with ownership probably steady. About 99 % of units were found to have a hard off switch and about 97 % of units were found to use 0.0 Watts in off mode. “ ”Tower fan ownership was found to be 0.49 units per house in 2005, with ownership probably steady. About 95 % of units were found to have a hard off switch and about 97% of units were found to use 0.0 Watts in off mode. “ ”Ceiling fan ownership was found to be 1.02 units per house in 2005, with ownership probably steady. As all units were found hardwired or inaccessible, 97% of units were assumed to use 0.0 Watts in off mode. The other 3 % had remote control capabilities and were assumed to use an average of 2.5 Watts in passive standby mode.” Observations of models on the EU market when constituting the database of models confirmed that comfort fan standby possibly had 3 standby modes to be considered that are covered by the definitions of Lot 6: - Disconnected. - 0 watt off-mode: the comfort fan is connected to a power source but not drawing energy; it is galvanically switched off; - Lot 6 standby: some fans may have either a remote control (identified in the market trends for tower fans) and also some have a LCD screen to show the status of the fans (fan speed), also there may be a timer, etc. This seems to be the case also for ceiling fans according to (AGO, 2006) nevertheless no model has been identified on the EU market of ceiling fan with a remote control, type of fan which is very uncommon on the EU market anyway. Then it seems it is only useful to consider standby consumption for tower fans. 3.2 End-of-Life behaviour The required content of this subtask as defined in the EuP methodology is: Identification of actual consumer behaviour (avg. EU) regarding end-of-life aspects. This includes: - Economical product life (=actual time to disposal); - Repair- and maintenance practice (frequency, spare parts, transportation and other impact parameters); - Present fractions to recycling, re-use and disposal; - Best Practice in sustainable product use, amongst others regarding the items above. An economic life of ten years is assumed. No maintenance is supposed to be done because of the low price of the product itself. Comfort fans are included in the WEEE scheme; the study of environmental impact will thus be led in a post WEEE scenario. 3.3 Local Infrastructure 3.3.1 Interaction with ventilation, cooling and heating
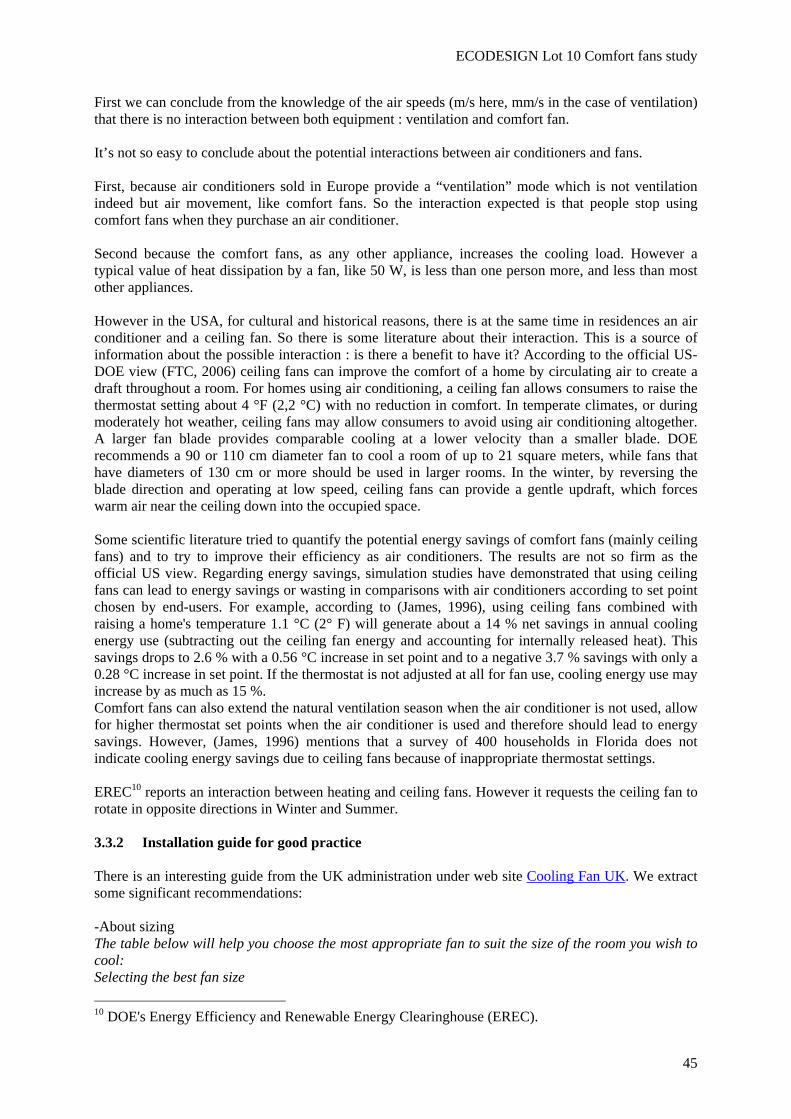
ECODESIGN Lot 10 Comfort fans study
45
First we can conclude from the knowledge of the air speeds (m/s here, mm/s in the case of ventilation) that there is no interaction between both equipment : ventilation and comfort fan. It’s not so easy to conclude about the potential interactions between air conditioners and fans. First, because air conditioners sold in Europe provide a “ventilation” mode which is not ventilation indeed but air movement, like comfort fans. So the interaction expected is that people stop using comfort fans when they purchase an air conditioner. Second because the comfort fans, as any other appliance, increases the cooling load. However a typical value of heat dissipation by a fan, like 50 W, is less than one person more, and less than most other appliances. However in the USA, for cultural and historical reasons, there is at the same time in residences an air conditioner and a ceiling fan. So there is some literature about their interaction. This is a source of information about the possible interaction : is there a benefit to have it? According to the official US-DOE view (FTC, 2006) ceiling fans can improve the comfort of a home by circulating air to create a draft throughout a room. For homes using air conditioning, a ceiling fan allows consumers to raise the thermostat setting about 4 °F (2,2 °C) with no reduction in comfort. In temperate climates, or during moderately hot weather, ceiling fans may allow consumers to avoid using air conditioning altogether. A larger fan blade provides comparable cooling at a lower velocity than a smaller blade. DOE recommends a 90 or 110 cm diameter fan to cool a room of up to 21 square meters, while fans that have diameters of 130 cm or more should be used in larger rooms. In the winter, by reversing the blade direction and operating at low speed, ceiling fans can provide a gentle updraft, which forces warm air near the ceiling down into the occupied space. Some scientific literature tried to quantify the potential energy savings of comfort fans (mainly ceiling fans) and to try to improve their efficiency as air conditioners. The results are not so firm as the official US view. Regarding energy savings, simulation studies have demonstrated that using ceiling fans can lead to energy savings or wasting in comparisons with air conditioners according to set point chosen by end-users. For example, according to (James, 1996), using ceiling fans combined with raising a home's temperature 1.1 °C (2° F) will generate about a 14 % net savings in annual cooling energy use (subtracting out the ceiling fan energy and accounting for internally released heat). This savings drops to 2.6 % with a 0.56 °C increase in set point and to a negative 3.7 % savings with only a 0.28 °C increase in set point. If the thermostat is not adjusted at all for fan use, cooling energy use may increase by as much as 15 %. Comfort fans can also extend the natural ventilation season when the air conditioner is not used, allow for higher thermostat set points when the air conditioner is used and therefore should lead to energy savings. However, (James, 1996) mentions that a survey of 400 households in Florida does not indicate cooling energy savings due to ceiling fans because of inappropriate thermostat settings. EREC10 reports an interaction between heating and ceiling fans. However it requests the ceiling fan to rotate in opposite directions in Winter and Summer. 3.3.2 Installation guide for good practice There is an interesting guide from the UK administration under web site Cooling Fan UK. We extract some significant recommendations: -About sizing The table below will help you choose the most appropriate fan to suit the size of the room you wish to cool: Selecting the best fan size 10 DOE's Energy Efficiency and Renewable Energy Clearinghouse (EREC).
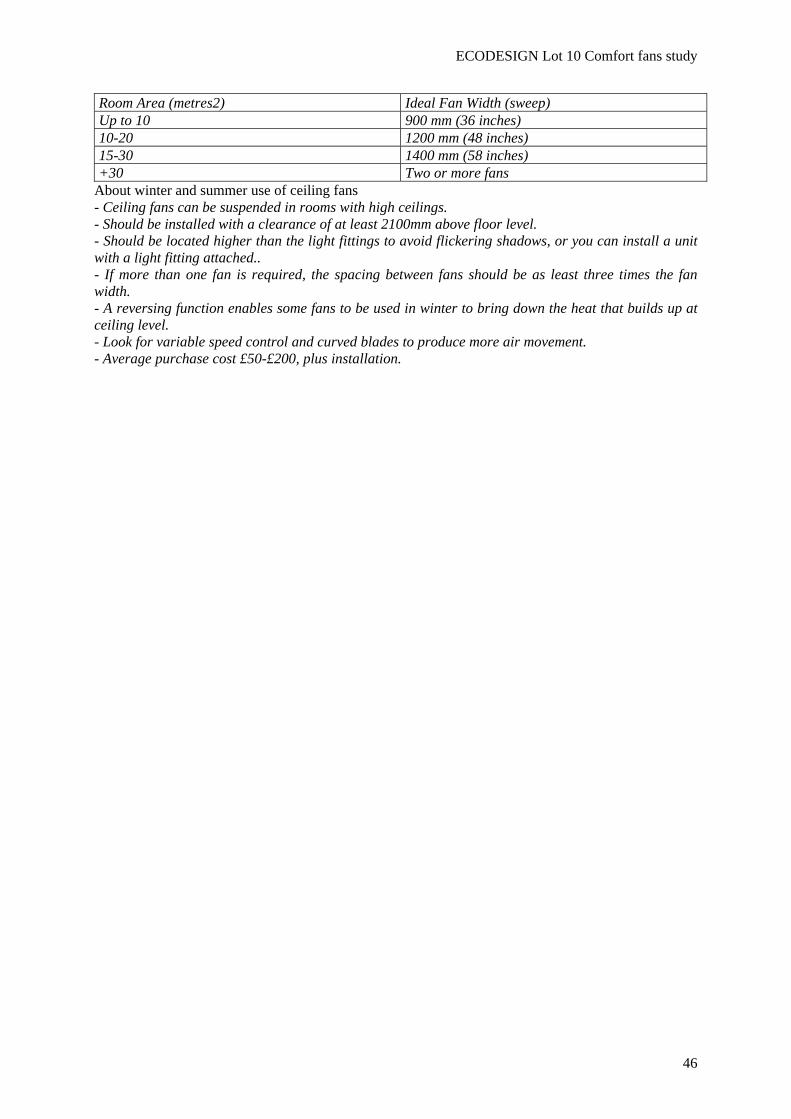
ECODESIGN Lot 10 Comfort fans study
46
Room Area (metres2) Ideal Fan Width (sweep) Up to 10 900 mm (36 inches) 10-20 1200 mm (48 inches) 15-30 1400 mm (58 inches) +30 Two or more fans
About winter and summer use of ceiling fans - Ceiling fans can be suspended in rooms with high ceilings. - Should be installed with a clearance of at least 2100mm above floor level. - Should be located higher than the light fittings to avoid flickering shadows, or you can install a unit with a light fitting attached.. - If more than one fan is required, the spacing between fans should be as least three times the fan width. - A reversing function enables some fans to be used in winter to bring down the heat that builds up at ceiling level. - Look for variable speed control and curved blades to produce more air movement. - Average purchase cost £50-£200, plus installation.
ECODESIGN Lot 10 Comfort fans study
47
Task 3 summary The review of thermal comfort literature enables to identify several parameters that can affect the perception of the thermal comfort supplied by the fan air speed and consequently the real life number of hours of use of comfort fans. Most fans have several fan speed with substantially lower efficiencies than the rated efficiency. The EU sales weighted average equivalent number of operation at full load, considering constant part load efficiency, is about 150 hours. Comfort fans supply thermal comfort by increasing air speed around the body. First we can conclude from the knowledge of the air speeds (m/s here, mm/s in the case of ventilation) that there is no interaction between ventilation and comfort fans. Comfort fans can be associated with air conditioners. Energy savings can be achieved with the same level of comfort whether air conditioner control is properly adapted to that configuration. At the moment no specific parameter has been identified that can be seen as a barrier for ecodesign measures.
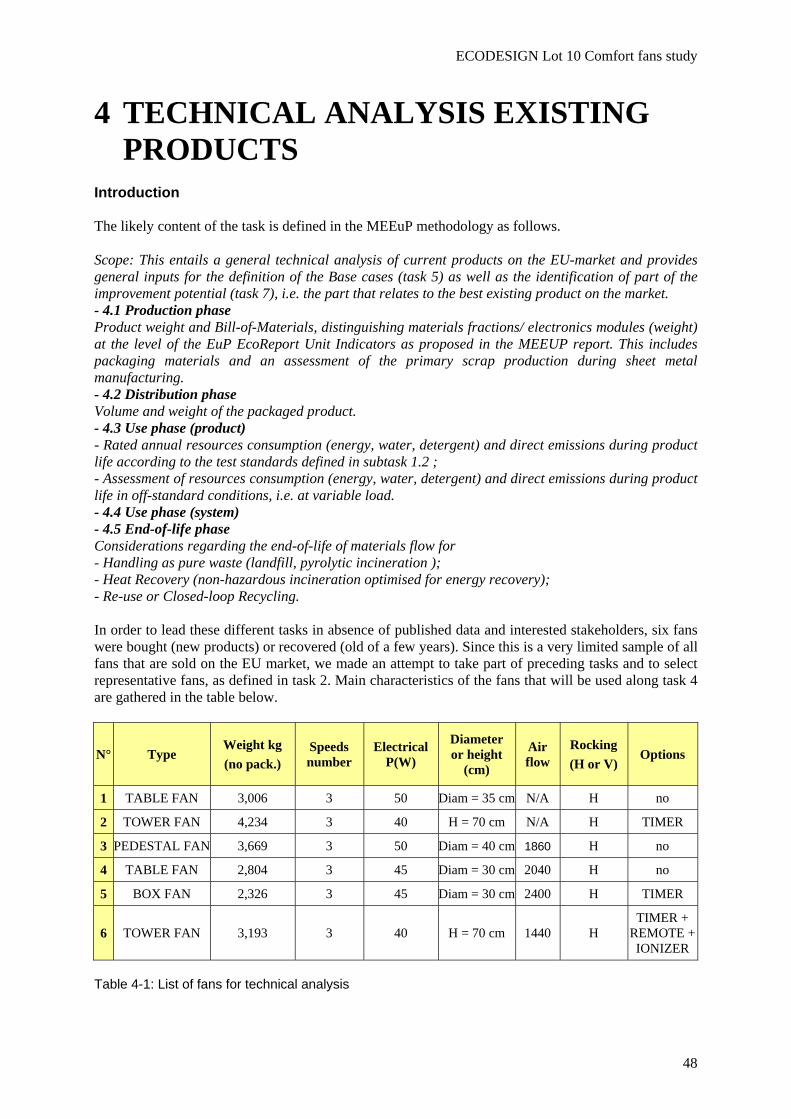
ECODESIGN Lot 10 Comfort fans study
48
4 TECHNICAL ANALYSIS EXISTING PRODUCTS
Introduction The likely content of the task is defined in the MEEuP methodology as follows. Scope: This entails a general technical analysis of current products on the EU-market and provides general inputs for the definition of the Base cases (task 5) as well as the identification of part of the improvement potential (task 7), i.e. the part that relates to the best existing product on the market. - 4.1 Production phase Product weight and Bill-of-Materials, distinguishing materials fractions/ electronics modules (weight) at the level of the EuP EcoReport Unit Indicators as proposed in the MEEUP report. This includes packaging materials and an assessment of the primary scrap production during sheet metal manufacturing. - 4.2 Distribution phase Volume and weight of the packaged product. - 4.3 Use phase (product) - Rated annual resources consumption (energy, water, detergent) and direct emissions during product life according to the test standards defined in subtask 1.2 ; - Assessment of resources consumption (energy, water, detergent) and direct emissions during product life in off-standard conditions, i.e. at variable load. - 4.4 Use phase (system) - 4.5 End-of-life phase Considerations regarding the end-of-life of materials flow for - Handling as pure waste (landfill, pyrolytic incineration ); - Heat Recovery (non-hazardous incineration optimised for energy recovery); - Re-use or Closed-loop Recycling. In order to lead these different tasks in absence of published data and interested stakeholders, six fans were bought (new products) or recovered (old of a few years). Since this is a very limited sample of all fans that are sold on the EU market, we made an attempt to take part of preceding tasks and to select representative fans, as defined in task 2. Main characteristics of the fans that will be used along task 4 are gathered in the table below.
N° Type Weight kg (no pack.)
Speeds number
Electrical P(W)
Diameteror height
(cm) Air flow
Rocking (H or V) Options
1 TABLE FAN 3,006 3 50 Diam = 35 cm N/A H no
2 TOWER FAN 4,234 3 40 H = 70 cm N/A H TIMER
3 PEDESTAL FAN 3,669 3 50 Diam = 40 cm 1860 H no
4 TABLE FAN 2,804 3 45 Diam = 30 cm 2040 H no
5 BOX FAN 2,326 3 45 Diam = 30 cm 2400 H TIMER
6 TOWER FAN 3,193 3 40 H = 70 cm 1440 H TIMER +
REMOTE + IONIZER
Table 4-1: List of fans for technical analysis
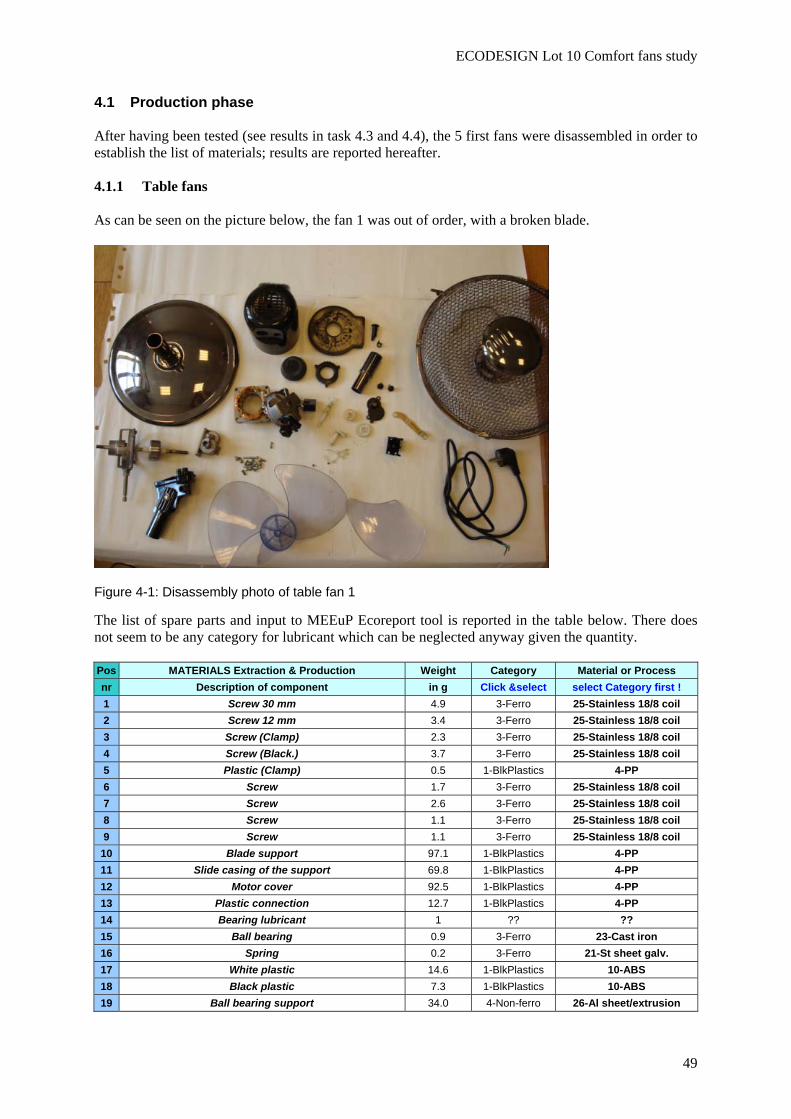
ECODESIGN Lot 10 Comfort fans study
49
4.1 Production phase After having been tested (see results in task 4.3 and 4.4), the 5 first fans were disassembled in order to establish the list of materials; results are reported hereafter. 4.1.1 Table fans As can be seen on the picture below, the fan 1 was out of order, with a broken blade.
Figure 4-1: Disassembly photo of table fan 1
The list of spare parts and input to MEEuP Ecoreport tool is reported in the table below. There does not seem to be any category for lubricant which can be neglected anyway given the quantity. Pos MATERIALS Extraction & Production Weight Category Material or Process nr Description of component in g Click &select select Category first ! 1 Screw 30 mm 4.9 3-Ferro 25-Stainless 18/8 coil 2 Screw 12 mm 3.4 3-Ferro 25-Stainless 18/8 coil 3 Screw (Clamp) 2.3 3-Ferro 25-Stainless 18/8 coil 4 Screw (Black.) 3.7 3-Ferro 25-Stainless 18/8 coil 5 Plastic (Clamp) 0.5 1-BlkPlastics 4-PP 6 Screw 1.7 3-Ferro 25-Stainless 18/8 coil 7 Screw 2.6 3-Ferro 25-Stainless 18/8 coil 8 Screw 1.1 3-Ferro 25-Stainless 18/8 coil 9 Screw 1.1 3-Ferro 25-Stainless 18/8 coil
10 Blade support 97.1 1-BlkPlastics 4-PP 11 Slide casing of the support 69.8 1-BlkPlastics 4-PP 12 Motor cover 92.5 1-BlkPlastics 4-PP 13 Plastic connection 12.7 1-BlkPlastics 4-PP 14 Bearing lubricant 1 ?? ?? 15 Ball bearing 0.9 3-Ferro 23-Cast iron 16 Spring 0.2 3-Ferro 21-St sheet galv. 17 White plastic 14.6 1-BlkPlastics 10-ABS 18 Black plastic 7.3 1-BlkPlastics 10-ABS 19 Ball bearing support 34.0 4-Non-ferro 26-Al sheet/extrusion
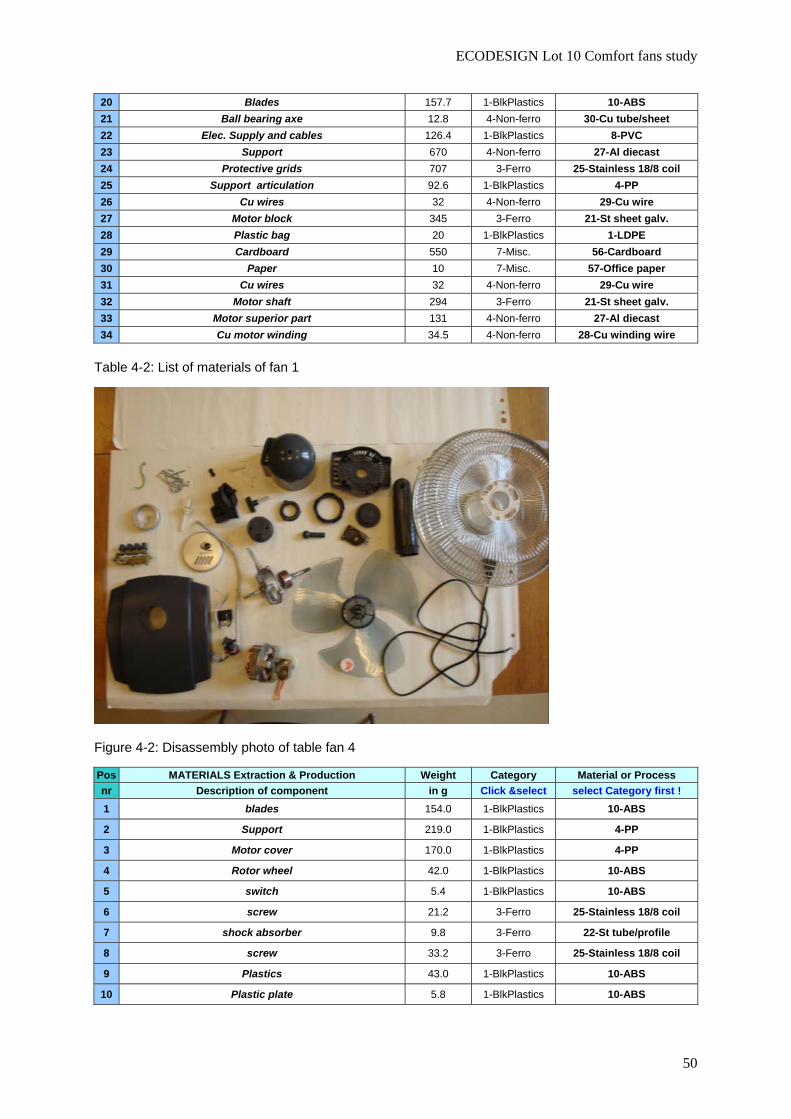
ECODESIGN Lot 10 Comfort fans study
50
20 Blades 157.7 1-BlkPlastics 10-ABS 21 Ball bearing axe 12.8 4-Non-ferro 30-Cu tube/sheet 22 Elec. Supply and cables 126.4 1-BlkPlastics 8-PVC 23 Support 670 4-Non-ferro 27-Al diecast 24 Protective grids 707 3-Ferro 25-Stainless 18/8 coil 25 Support articulation 92.6 1-BlkPlastics 4-PP 26 Cu wires 32 4-Non-ferro 29-Cu wire 27 Motor block 345 3-Ferro 21-St sheet galv. 28 Plastic bag 20 1-BlkPlastics 1-LDPE 29 Cardboard 550 7-Misc. 56-Cardboard 30 Paper 10 7-Misc. 57-Office paper 31 Cu wires 32 4-Non-ferro 29-Cu wire 32 Motor shaft 294 3-Ferro 21-St sheet galv. 33 Motor superior part 131 4-Non-ferro 27-Al diecast 34 Cu motor winding 34.5 4-Non-ferro 28-Cu winding wire
Table 4-2: List of materials of fan 1
Figure 4-2: Disassembly photo of table fan 4
Pos MATERIALS Extraction & Production Weight Category Material or Process nr Description of component in g Click &select select Category first ! 1 blades 154.0 1-BlkPlastics 10-ABS
2 Support 219.0 1-BlkPlastics 4-PP
3 Motor cover 170.0 1-BlkPlastics 4-PP
4 Rotor wheel 42.0 1-BlkPlastics 10-ABS
5 switch 5.4 1-BlkPlastics 10-ABS
6 screw 21.2 3-Ferro 25-Stainless 18/8 coil
7 shock absorber 9.8 3-Ferro 22-St tube/profile
8 screw 33.2 3-Ferro 25-Stainless 18/8 coil
9 Plastics 43.0 1-BlkPlastics 10-ABS
10 Plastic plate 5.8 1-BlkPlastics 10-ABS
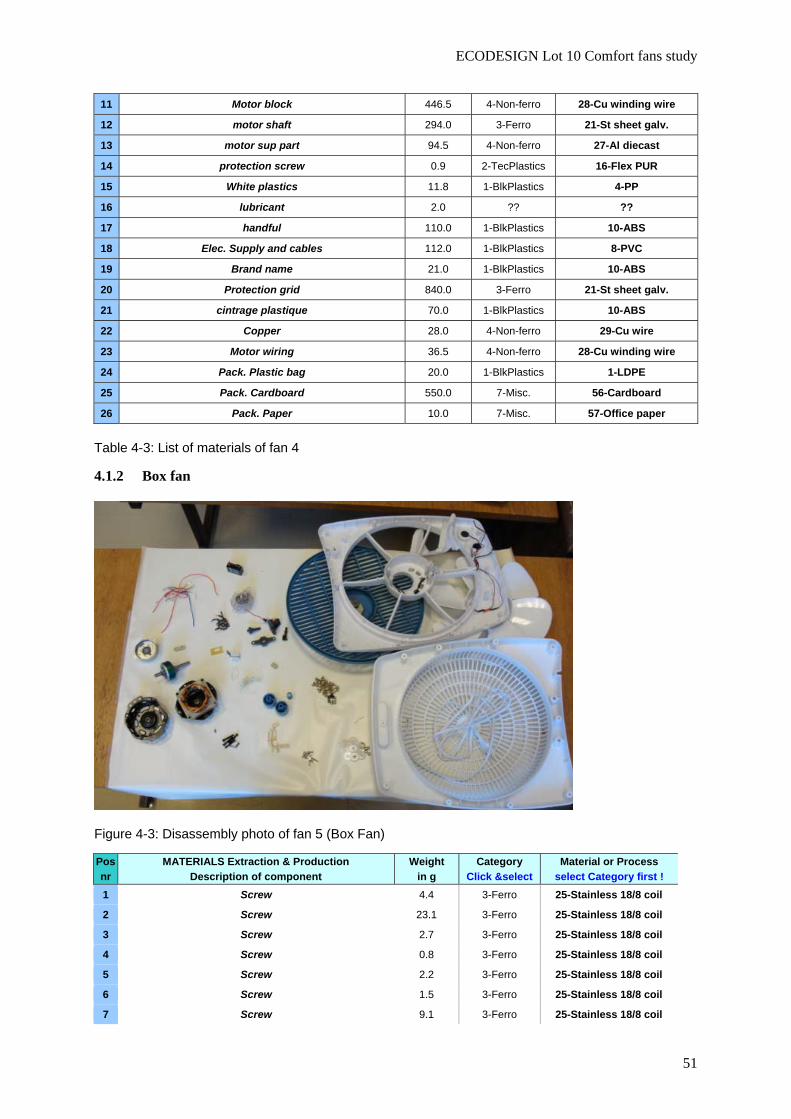
ECODESIGN Lot 10 Comfort fans study
51
11 Motor block 446.5 4-Non-ferro 28-Cu winding wire
12 motor shaft 294.0 3-Ferro 21-St sheet galv.
13 motor sup part 94.5 4-Non-ferro 27-Al diecast
14 protection screw 0.9 2-TecPlastics 16-Flex PUR
15 White plastics 11.8 1-BlkPlastics 4-PP
16 lubricant 2.0 ?? ??
17 handful 110.0 1-BlkPlastics 10-ABS
18 Elec. Supply and cables 112.0 1-BlkPlastics 8-PVC
19 Brand name 21.0 1-BlkPlastics 10-ABS
20 Protection grid 840.0 3-Ferro 21-St sheet galv.
21 cintrage plastique 70.0 1-BlkPlastics 10-ABS
22 Copper 28.0 4-Non-ferro 29-Cu wire
23 Motor wiring 36.5 4-Non-ferro 28-Cu winding wire
24 Pack. Plastic bag 20.0 1-BlkPlastics 1-LDPE
25 Pack. Cardboard 550.0 7-Misc. 56-Cardboard
26 Pack. Paper 10.0 7-Misc. 57-Office paper
Table 4-3: List of materials of fan 4
4.1.2 Box fan
Figure 4-3: Disassembly photo of fan 5 (Box Fan)
Pos MATERIALS Extraction & Production Weight Category Material or Process nr Description of component in g Click &select select Category first ! 1 Screw 4.4 3-Ferro 25-Stainless 18/8 coil
2 Screw 23.1 3-Ferro 25-Stainless 18/8 coil
3 Screw 2.7 3-Ferro 25-Stainless 18/8 coil
4 Screw 0.8 3-Ferro 25-Stainless 18/8 coil
5 Screw 2.2 3-Ferro 25-Stainless 18/8 coil
6 Screw 1.5 3-Ferro 25-Stainless 18/8 coil
7 Screw 9.1 3-Ferro 25-Stainless 18/8 coil
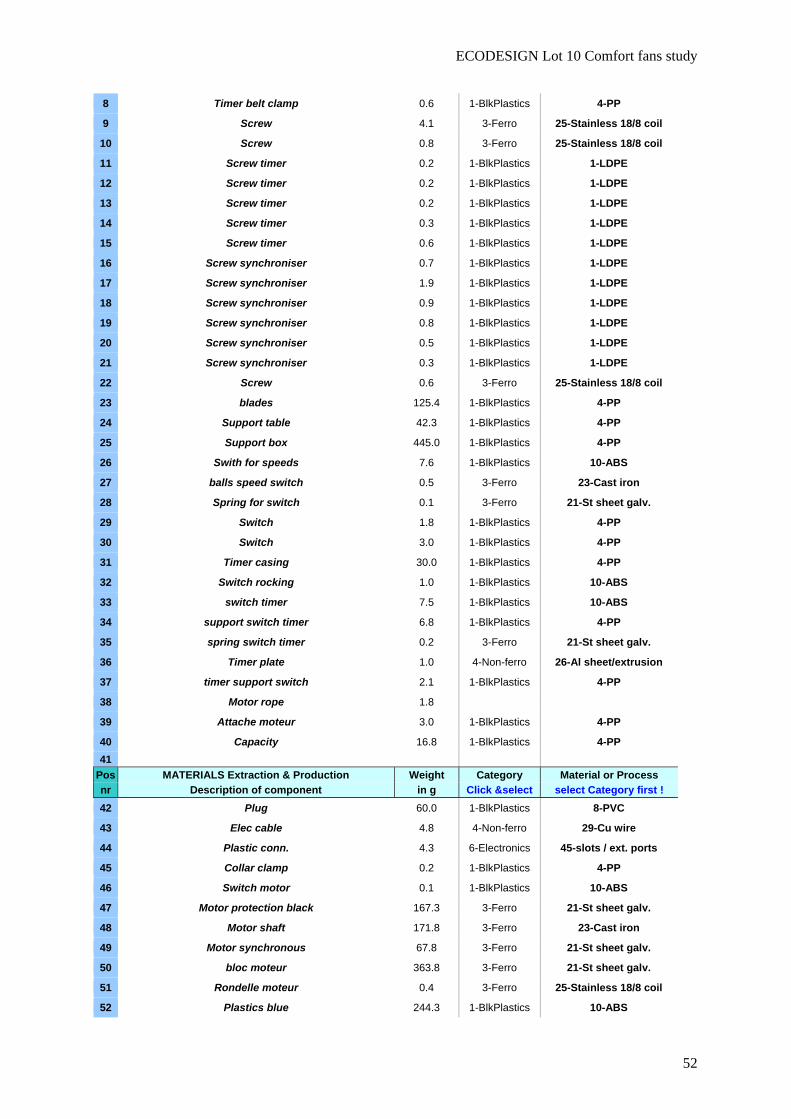
ECODESIGN Lot 10 Comfort fans study
52
8 Timer belt clamp 0.6 1-BlkPlastics 4-PP
9 Screw 4.1 3-Ferro 25-Stainless 18/8 coil
10 Screw 0.8 3-Ferro 25-Stainless 18/8 coil
11 Screw timer 0.2 1-BlkPlastics 1-LDPE
12 Screw timer 0.2 1-BlkPlastics 1-LDPE
13 Screw timer 0.2 1-BlkPlastics 1-LDPE
14 Screw timer 0.3 1-BlkPlastics 1-LDPE
15 Screw timer 0.6 1-BlkPlastics 1-LDPE
16 Screw synchroniser 0.7 1-BlkPlastics 1-LDPE
17 Screw synchroniser 1.9 1-BlkPlastics 1-LDPE
18 Screw synchroniser 0.9 1-BlkPlastics 1-LDPE
19 Screw synchroniser 0.8 1-BlkPlastics 1-LDPE
20 Screw synchroniser 0.5 1-BlkPlastics 1-LDPE
21 Screw synchroniser 0.3 1-BlkPlastics 1-LDPE
22 Screw 0.6 3-Ferro 25-Stainless 18/8 coil
23 blades 125.4 1-BlkPlastics 4-PP
24 Support table 42.3 1-BlkPlastics 4-PP
25 Support box 445.0 1-BlkPlastics 4-PP
26 Swith for speeds 7.6 1-BlkPlastics 10-ABS
27 balls speed switch 0.5 3-Ferro 23-Cast iron
28 Spring for switch 0.1 3-Ferro 21-St sheet galv.
29 Switch 1.8 1-BlkPlastics 4-PP
30 Switch 3.0 1-BlkPlastics 4-PP
31 Timer casing 30.0 1-BlkPlastics 4-PP
32 Switch rocking 1.0 1-BlkPlastics 10-ABS
33 switch timer 7.5 1-BlkPlastics 10-ABS
34 support switch timer 6.8 1-BlkPlastics 4-PP
35 spring switch timer 0.2 3-Ferro 21-St sheet galv.
36 Timer plate 1.0 4-Non-ferro 26-Al sheet/extrusion
37 timer support switch 2.1 1-BlkPlastics 4-PP
38 Motor rope 1.8
39 Attache moteur 3.0 1-BlkPlastics 4-PP
40 Capacity 16.8 1-BlkPlastics 4-PP 41
Pos MATERIALS Extraction & Production Weight Category Material or Process nr Description of component in g Click &select select Category first ! 42 Plug 60.0 1-BlkPlastics 8-PVC
43 Elec cable 4.8 4-Non-ferro 29-Cu wire
44 Plastic conn. 4.3 6-Electronics 45-slots / ext. ports
45 Collar clamp 0.2 1-BlkPlastics 4-PP
46 Switch motor 0.1 1-BlkPlastics 10-ABS
47 Motor protection black 167.3 3-Ferro 21-St sheet galv.
48 Motor shaft 171.8 3-Ferro 23-Cast iron
49 Motor synchronous 67.8 3-Ferro 21-St sheet galv.
50 bloc moteur 363.8 3-Ferro 21-St sheet galv.
51 Rondelle moteur 0.4 3-Ferro 25-Stainless 18/8 coil
52 Plastics blue 244.3 1-BlkPlastics 10-ABS
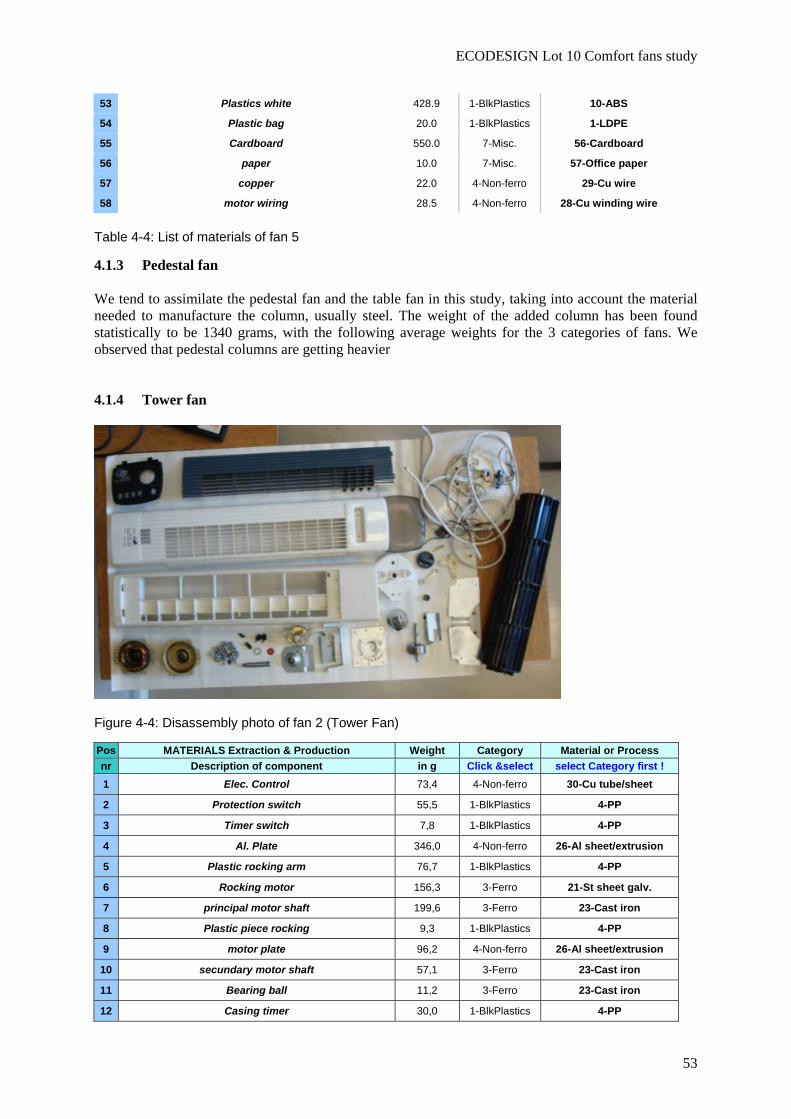
ECODESIGN Lot 10 Comfort fans study
53
53 Plastics white 428.9 1-BlkPlastics 10-ABS
54 Plastic bag 20.0 1-BlkPlastics 1-LDPE
55 Cardboard 550.0 7-Misc. 56-Cardboard
56 paper 10.0 7-Misc. 57-Office paper
57 copper 22.0 4-Non-ferro 29-Cu wire
58 motor wiring 28.5 4-Non-ferro 28-Cu winding wire
Table 4-4: List of materials of fan 5
4.1.3 Pedestal fan We tend to assimilate the pedestal fan and the table fan in this study, taking into account the material needed to manufacture the column, usually steel. The weight of the added column has been found statistically to be 1340 grams, with the following average weights for the 3 categories of fans. We observed that pedestal columns are getting heavier 4.1.4 Tower fan
Figure 4-4: Disassembly photo of fan 2 (Tower Fan)
Pos MATERIALS Extraction & Production Weight Category Material or Process nr Description of component in g Click &select select Category first ! 1 Elec. Control 73,4 4-Non-ferro 30-Cu tube/sheet
2 Protection switch 55,5 1-BlkPlastics 4-PP
3 Timer switch 7,8 1-BlkPlastics 4-PP
4 Al. Plate 346,0 4-Non-ferro 26-Al sheet/extrusion
5 Plastic rocking arm 76,7 1-BlkPlastics 4-PP
6 Rocking motor 156,3 3-Ferro 21-St sheet galv.
7 principal motor shaft 199,6 3-Ferro 23-Cast iron
8 Plastic piece rocking 9,3 1-BlkPlastics 4-PP
9 motor plate 96,2 4-Non-ferro 26-Al sheet/extrusion
10 secundary motor shaft 57,1 3-Ferro 23-Cast iron
11 Bearing ball 11,2 3-Ferro 23-Cast iron
12 Casing timer 30,0 1-BlkPlastics 4-PP
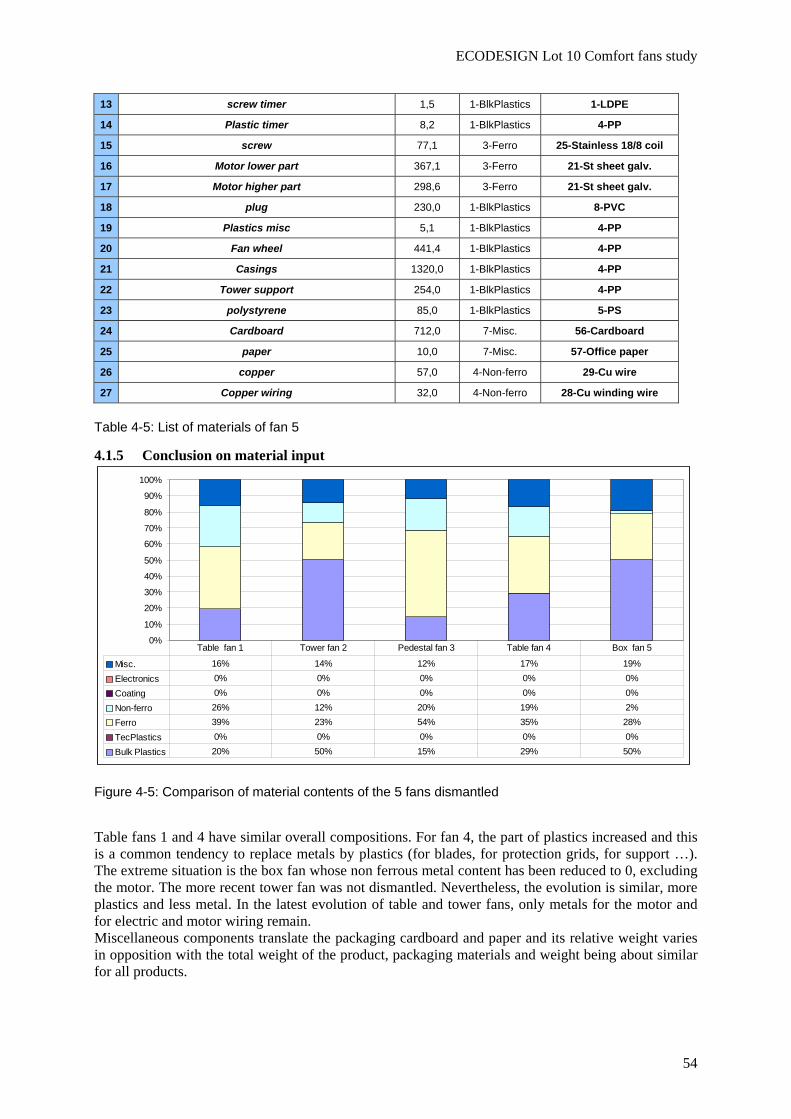
ECODESIGN Lot 10 Comfort fans study
54
13 screw timer 1,5 1-BlkPlastics 1-LDPE
14 Plastic timer 8,2 1-BlkPlastics 4-PP
15 screw 77,1 3-Ferro 25-Stainless 18/8 coil
16 Motor lower part 367,1 3-Ferro 21-St sheet galv.
17 Motor higher part 298,6 3-Ferro 21-St sheet galv.
18 plug 230,0 1-BlkPlastics 8-PVC
19 Plastics misc 5,1 1-BlkPlastics 4-PP
20 Fan wheel 441,4 1-BlkPlastics 4-PP
21 Casings 1320,0 1-BlkPlastics 4-PP
22 Tower support 254,0 1-BlkPlastics 4-PP
23 polystyrene 85,0 1-BlkPlastics 5-PS
24 Cardboard 712,0 7-Misc. 56-Cardboard
25 paper 10,0 7-Misc. 57-Office paper
26 copper 57,0 4-Non-ferro 29-Cu wire
27 Copper wiring 32,0 4-Non-ferro 28-Cu winding wire
Table 4-5: List of materials of fan 5
4.1.5 Conclusion on material input
0%
10%
20%
30%
40%
50%
60%
70%
80%
90%
100%
Misc. 16% 14% 12% 17% 19%
Electronics 0% 0% 0% 0% 0%
Coating 0% 0% 0% 0% 0%
Non-ferro 26% 12% 20% 19% 2%
Ferro 39% 23% 54% 35% 28%
TecPlastics 0% 0% 0% 0% 0%
Bulk Plastics 20% 50% 15% 29% 50%
Table fan 1 Tower fan 2 Pedestal fan 3 Table fan 4 Box fan 5
Figure 4-5: Comparison of material contents of the 5 fans dismantled
Table fans 1 and 4 have similar overall compositions. For fan 4, the part of plastics increased and this is a common tendency to replace metals by plastics (for blades, for protection grids, for support …). The extreme situation is the box fan whose non ferrous metal content has been reduced to 0, excluding the motor. The more recent tower fan was not dismantled. Nevertheless, the evolution is similar, more plastics and less metal. In the latest evolution of table and tower fans, only metals for the motor and for electric and motor wiring remain. Miscellaneous components translate the packaging cardboard and paper and its relative weight varies in opposition with the total weight of the product, packaging materials and weight being about similar for all products.
ECODESIGN Lot 10 Comfort fans study
55
For the time being, the production phase seems to take place in Chinese light industry, with around one hundred manufacturing companies11. It is difficult to know if the ratios that are applied to the BOM in the MEEuP Ecoreport apply correctly to such conditions. 4.2 Distribution phase Distribution of comfort fans seems to have special features, since they all come from one country but are distributed by numerous channels. 100 % is imported whereas in the hypothesis of the MEEuP, the hypothesis is that transportation only includes 50 % of abroad import with long distance air (10 %) or sea (90 %) freight (MEEuP): “This includes final assembly, delivery to EU distribution centre(s) and warehouses (heating and lighting as row 53) either by intra-EU trucking/rail (50%), sea-freight + EU trucking/rail (45%) or air-freight + EU trucking/rail (5%). Trucking-rail ratio for ICT&CE products assumed 90:10. Distances: 1000 km intra-EU trucking/rail, 12,000 km sea-freight, 10,000 km air-freight. Final delivery to whole-seller or central retail warehouse: 500 km in medium-sized truck.” Based on (ADEME, 2005), the above ratios indicate that air transportation is responsible for about 70 % of the emissions of GHG for the transportation figures are caused by the 5 % of air transportation. Long distance freight of comfort fans is likely to be mainly see-freight. The absolute emission value depends on the share of transportation by plane, and less on the relative shares of truck or ship freights. As a consequence, we will not change these values, since part of importation made by plane versus ship is not known. For the average sizes of fans in our database, packaging volumes are as follows: Table fan: 0,06 m3 Pedestal fan: 0,15 m3 Tower fan: 0,08 m3 Box fan: 0,06 m3 4.3 Use phase (product) Since the essential use phase impact is energy, we have to determine average energy efficiency, and number of hours of operation. Since there are usually various speeds, the number of hours of operations should be weighted for that, leading to an equivalent full speed number. 4.3.1 Analysis of products catalogue data Is there an average performance? For ceiling fan Energy Star gives a wide data base of performance for products sold in the US, with no proof that it is representative for EU. Also ceiling fans are not sold largely in Europe. We are not aware of any other existing data basis of performance of fans in the EU. The Energy Star data basis (limited to US ceiling fans) contains the following information:
- Manufacturer Name - Brand Name - Model Name - Model Number - Retailer/ SKU Number - Efficiency (CFM/Watt) – Low speed - Efficiency (CFM/Watt) – Medium speed - Efficiency (CFM/Watt) – High speed
11 We find 87 active manufacturers selling through alibaba.com, for instance
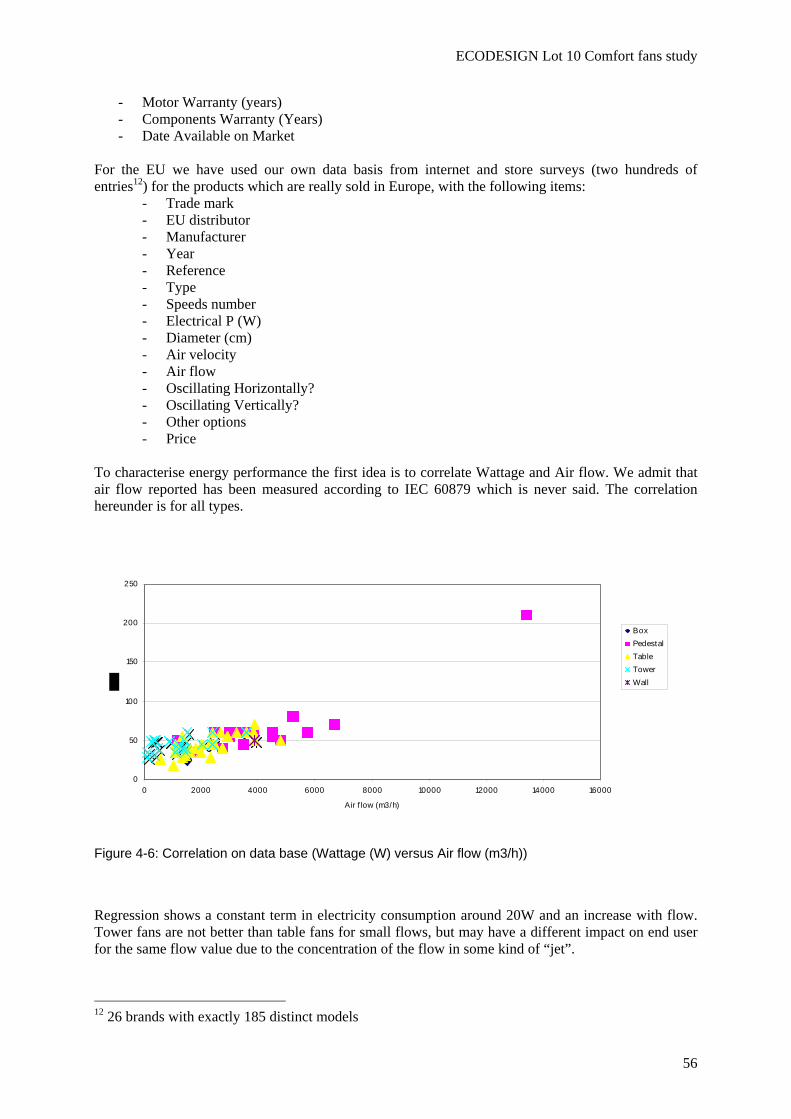
ECODESIGN Lot 10 Comfort fans study
56
- Motor Warranty (years) - Components Warranty (Years) - Date Available on Market
For the EU we have used our own data basis from internet and store surveys (two hundreds of entries12) for the products which are really sold in Europe, with the following items:
- Trade mark - EU distributor - Manufacturer - Year - Reference - Type - Speeds number - Electrical P (W) - Diameter (cm) - Air velocity - Air flow - Oscillating Horizontally? - Oscillating Vertically? - Other options - Price
To characterise energy performance the first idea is to correlate Wattage and Air flow. We admit that air flow reported has been measured according to IEC 60879 which is never said. The correlation hereunder is for all types.
Figure 4-6: Correlation on data base (Wattage (W) versus Air flow (m3/h))
Regression shows a constant term in electricity consumption around 20W and an increase with flow. Tower fans are not better than table fans for small flows, but may have a different impact on end user for the same flow value due to the concentration of the flow in some kind of “jet”.
12 26 brands with exactly 185 distinct models
0
50
100
150
200
250
0 2000 4000 6000 8000 10000 12000 14000 16000
Air f low (m3/h)
BoxPedestalTableTowerWall
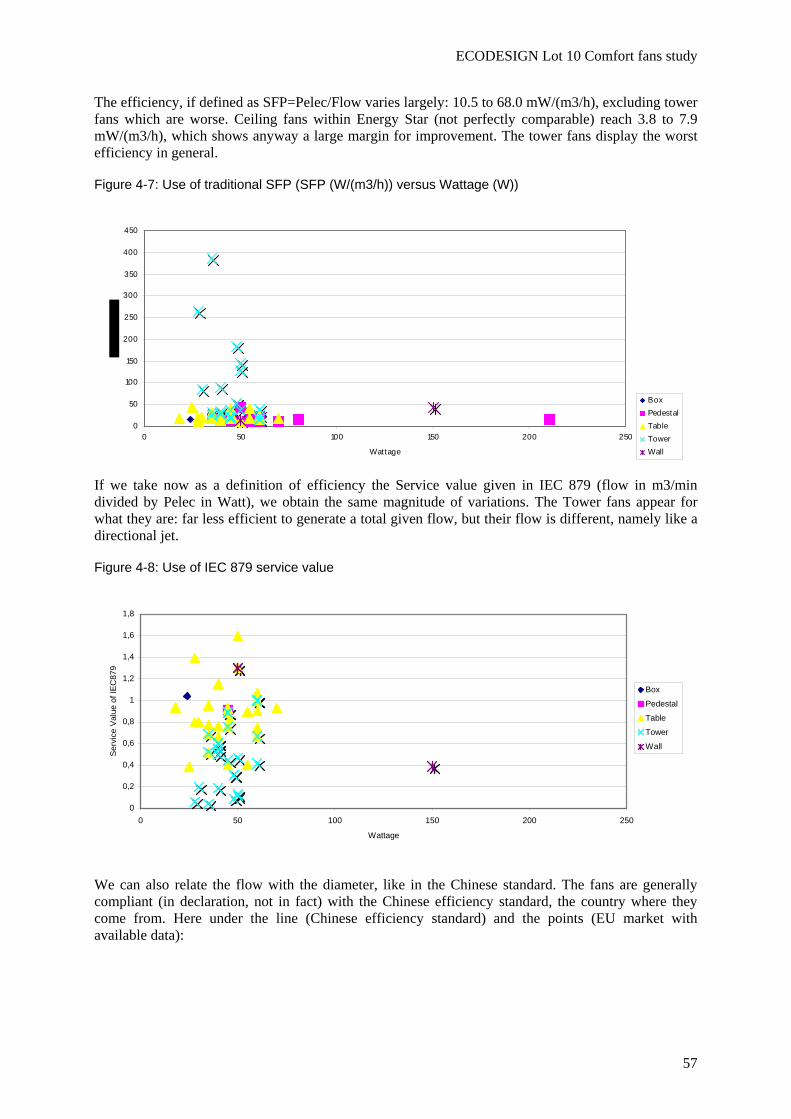
ECODESIGN Lot 10 Comfort fans study
57
The efficiency, if defined as SFP=Pelec/Flow varies largely: 10.5 to 68.0 mW/(m3/h), excluding tower fans which are worse. Ceiling fans within Energy Star (not perfectly comparable) reach 3.8 to 7.9 mW/(m3/h), which shows anyway a large margin for improvement. The tower fans display the worst efficiency in general.
Figure 4-7: Use of traditional SFP (SFP (W/(m3/h)) versus Wattage (W))
0
50
100
150
200
250
300
350
400
450
0 50 100 150 200 250
Wattage
BoxPedestalTableTowerWall
If we take now as a definition of efficiency the Service value given in IEC 879 (flow in m3/min divided by Pelec in Watt), we obtain the same magnitude of variations. The Tower fans appear for what they are: far less efficient to generate a total given flow, but their flow is different, namely like a directional jet.
Figure 4-8: Use of IEC 879 service value
0
0,2
0,4
0,6
0,8
1
1,2
1,4
1,6
1,8
0 50 100 150 200 250
Wattage
Ser
vice
Val
ue o
f IE
C87
9
Box
Pedestal
Table
Tower
Wall
We can also relate the flow with the diameter, like in the Chinese standard. The fans are generally compliant (in declaration, not in fact) with the Chinese efficiency standard, the country where they come from. Here under the line (Chinese efficiency standard) and the points (EU market with available data):
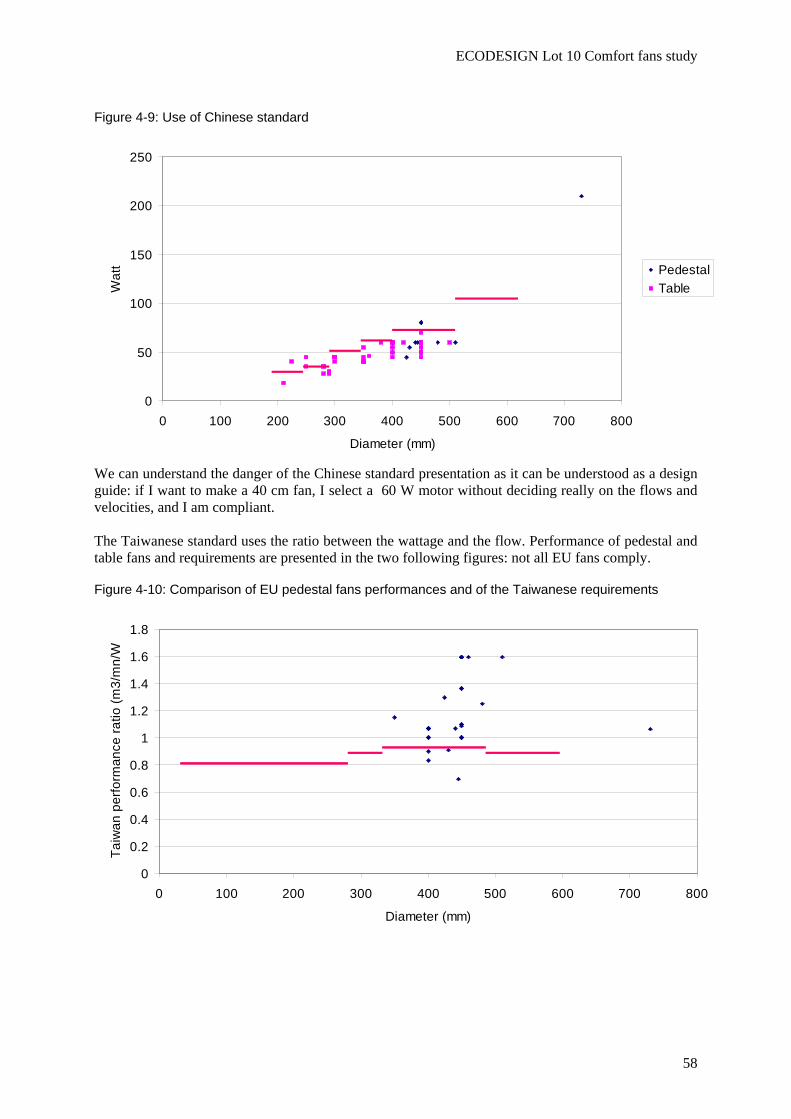
ECODESIGN Lot 10 Comfort fans study
58
Figure 4-9: Use of Chinese standard
0
50
100
150
200
250
0 100 200 300 400 500 600 700 800
Diameter (mm)
Wat
t PedestalTable
We can understand the danger of the Chinese standard presentation as it can be understood as a design guide: if I want to make a 40 cm fan, I select a 60 W motor without deciding really on the flows and velocities, and I am compliant. The Taiwanese standard uses the ratio between the wattage and the flow. Performance of pedestal and table fans and requirements are presented in the two following figures: not all EU fans comply.
Figure 4-10: Comparison of EU pedestal fans performances and of the Taiwanese requirements
0
0.2
0.4
0.6
0.8
1
1.2
1.4
1.6
1.8
0 100 200 300 400 500 600 700 800
Diameter (mm)
Taiw
an p
erfo
rman
ce ra
tio (m
3/m
n/W
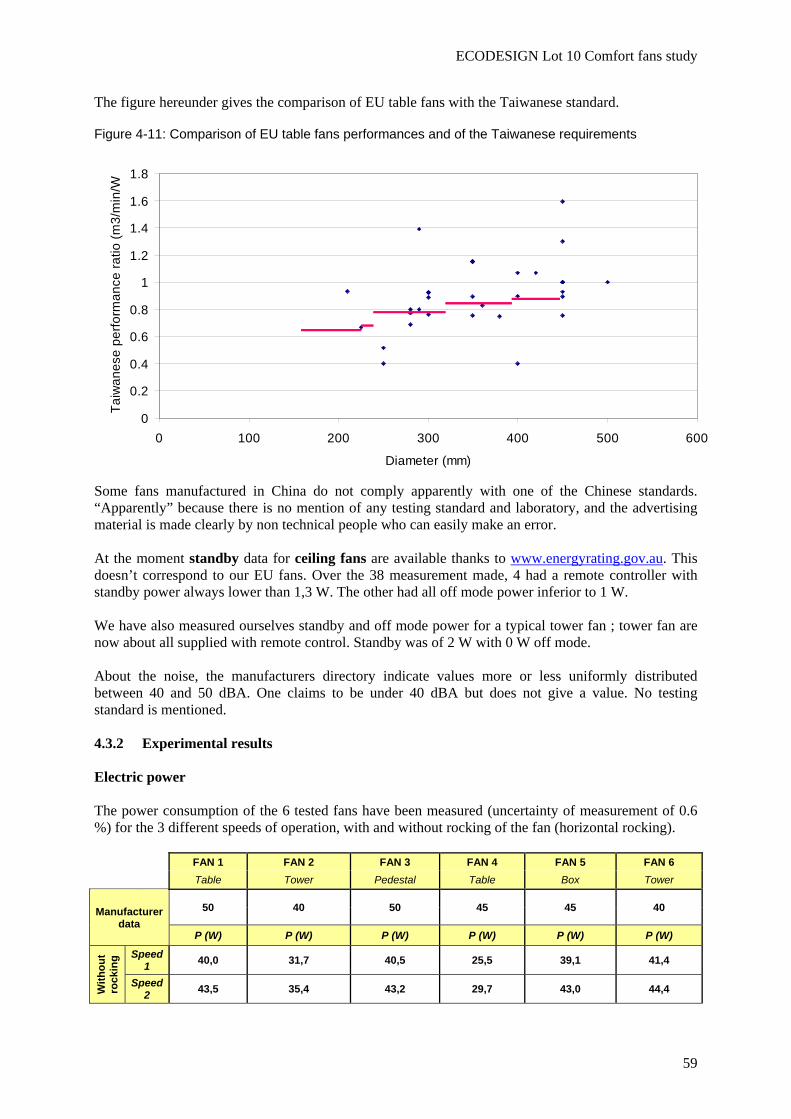
ECODESIGN Lot 10 Comfort fans study
59
The figure hereunder gives the comparison of EU table fans with the Taiwanese standard.
Figure 4-11: Comparison of EU table fans performances and of the Taiwanese requirements
Some fans manufactured in China do not comply apparently with one of the Chinese standards. “Apparently” because there is no mention of any testing standard and laboratory, and the advertising material is made clearly by non technical people who can easily make an error. At the moment standby data for ceiling fans are available thanks to www.energyrating.gov.au. This doesn’t correspond to our EU fans. Over the 38 measurement made, 4 had a remote controller with standby power always lower than 1,3 W. The other had all off mode power inferior to 1 W. We have also measured ourselves standby and off mode power for a typical tower fan ; tower fan are now about all supplied with remote control. Standby was of 2 W with 0 W off mode. About the noise, the manufacturers directory indicate values more or less uniformly distributed between 40 and 50 dBA. One claims to be under 40 dBA but does not give a value. No testing standard is mentioned. 4.3.2 Experimental results Electric power The power consumption of the 6 tested fans have been measured (uncertainty of measurement of 0.6 %) for the 3 different speeds of operation, with and without rocking of the fan (horizontal rocking).
FAN 1 FAN 2 FAN 3 FAN 4 FAN 5 FAN 6 Table Tower Pedestal Table Box Tower
Manufacturer data
50 40 50 45 45 40
P (W) P (W) P (W) P (W) P (W) P (W)
With
out
rock
ing Speed
1 40,0 31,7 40,5 25,5 39,1 41,4
Speed 2 43,5 35,4 43,2 29,7 43,0 44,4
0
0.2
0.4
0.6
0.8
1
1.2
1.4
1.6
1.8
0 100 200 300 400 500 600
Diameter (mm)
Taiw
anes
e pe
rform
ance
ratio
(m3/
min
/W
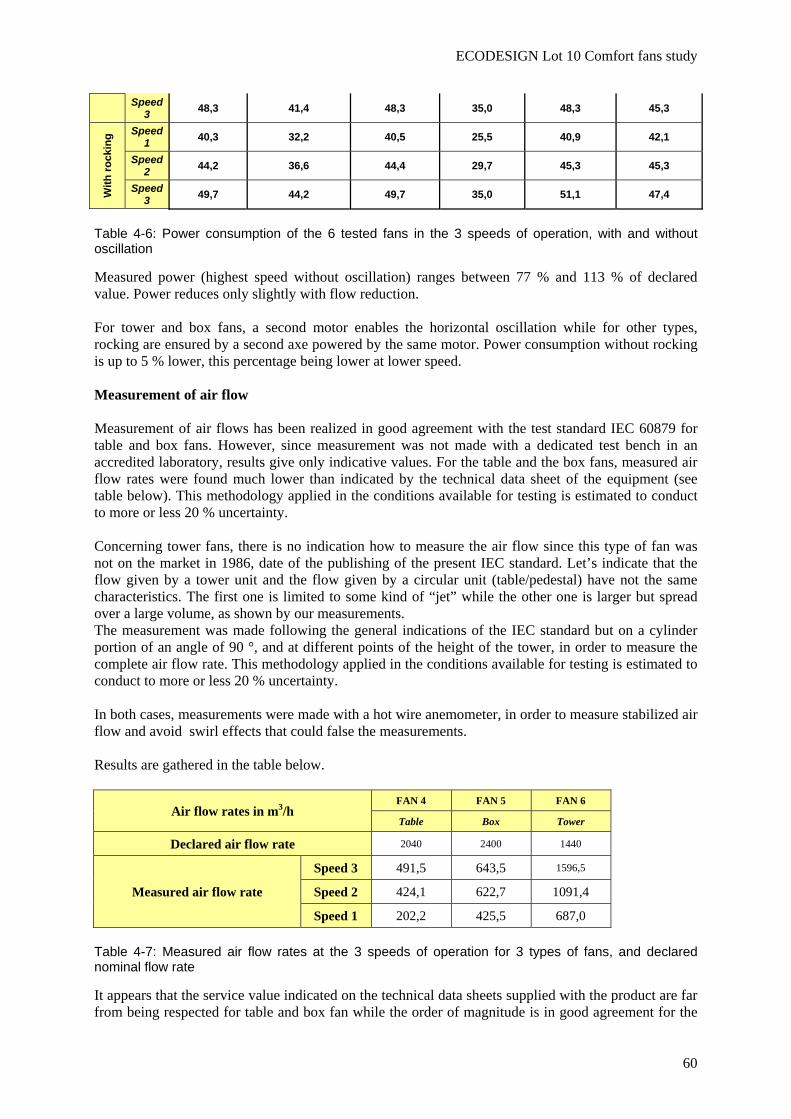
ECODESIGN Lot 10 Comfort fans study
60
Speed 3 48,3 41,4 48,3 35,0 48,3 45,3
With
rock
ing Speed
1 40,3 32,2 40,5 25,5 40,9 42,1
Speed 2 44,2 36,6 44,4 29,7 45,3 45,3
Speed 3 49,7 44,2 49,7 35,0 51,1 47,4
Table 4-6: Power consumption of the 6 tested fans in the 3 speeds of operation, with and without oscillation
Measured power (highest speed without oscillation) ranges between 77 % and 113 % of declared value. Power reduces only slightly with flow reduction. For tower and box fans, a second motor enables the horizontal oscillation while for other types, rocking are ensured by a second axe powered by the same motor. Power consumption without rocking is up to 5 % lower, this percentage being lower at lower speed. Measurement of air flow Measurement of air flows has been realized in good agreement with the test standard IEC 60879 for table and box fans. However, since measurement was not made with a dedicated test bench in an accredited laboratory, results give only indicative values. For the table and the box fans, measured air flow rates were found much lower than indicated by the technical data sheet of the equipment (see table below). This methodology applied in the conditions available for testing is estimated to conduct to more or less 20 % uncertainty. Concerning tower fans, there is no indication how to measure the air flow since this type of fan was not on the market in 1986, date of the publishing of the present IEC standard. Let’s indicate that the flow given by a tower unit and the flow given by a circular unit (table/pedestal) have not the same characteristics. The first one is limited to some kind of “jet” while the other one is larger but spread over a large volume, as shown by our measurements. The measurement was made following the general indications of the IEC standard but on a cylinder portion of an angle of 90 °, and at different points of the height of the tower, in order to measure the complete air flow rate. This methodology applied in the conditions available for testing is estimated to conduct to more or less 20 % uncertainty. In both cases, measurements were made with a hot wire anemometer, in order to measure stabilized air flow and avoid swirl effects that could false the measurements. Results are gathered in the table below.
Air flow rates in m3/h FAN 4 FAN 5 FAN 6
Table Box Tower
Declared air flow rate 2040 2400 1440
Measured air flow rate
Speed 3 491,5 643,5 1596,5
Speed 2 424,1 622,7 1091,4
Speed 1 202,2 425,5 687,0
Table 4-7: Measured air flow rates at the 3 speeds of operation for 3 types of fans, and declared nominal flow rate
It appears that the service value indicated on the technical data sheets supplied with the product are far from being respected for table and box fan while the order of magnitude is in good agreement for the
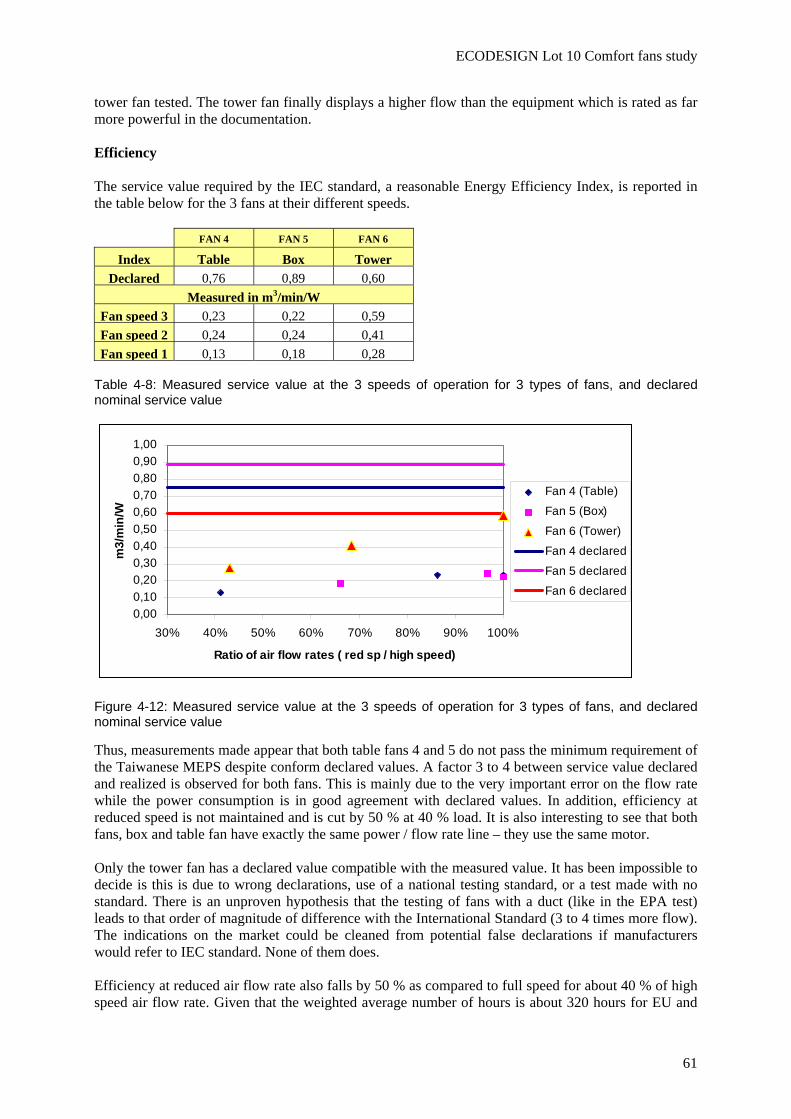
ECODESIGN Lot 10 Comfort fans study
61
tower fan tested. The tower fan finally displays a higher flow than the equipment which is rated as far more powerful in the documentation. Efficiency The service value required by the IEC standard, a reasonable Energy Efficiency Index, is reported in the table below for the 3 fans at their different speeds.
FAN 4 FAN 5 FAN 6
Index Table Box TowerDeclared 0,76 0,89 0,60
Measured in m3/min/W Fan speed 3 0,23 0,22 0,59Fan speed 2 0,24 0,24 0,41Fan speed 1 0,13 0,18 0,28
Table 4-8: Measured service value at the 3 speeds of operation for 3 types of fans, and declared nominal service value
0,000,100,200,300,400,500,600,700,800,901,00
30% 40% 50% 60% 70% 80% 90% 100%
Ratio of air flow rates ( red sp / high speed)
m3/
min
/W
Fan 4 (Table)
Fan 5 (Box)
Fan 6 (Tower)
Fan 4 declared
Fan 5 declared
Fan 6 declared
Figure 4-12: Measured service value at the 3 speeds of operation for 3 types of fans, and declared nominal service value
Thus, measurements made appear that both table fans 4 and 5 do not pass the minimum requirement of the Taiwanese MEPS despite conform declared values. A factor 3 to 4 between service value declared and realized is observed for both fans. This is mainly due to the very important error on the flow rate while the power consumption is in good agreement with declared values. In addition, efficiency at reduced speed is not maintained and is cut by 50 % at 40 % load. It is also interesting to see that both fans, box and table fan have exactly the same power / flow rate line – they use the same motor. Only the tower fan has a declared value compatible with the measured value. It has been impossible to decide is this is due to wrong declarations, use of a national testing standard, or a test made with no standard. There is an unproven hypothesis that the testing of fans with a duct (like in the EPA test) leads to that order of magnitude of difference with the International Standard (3 to 4 times more flow). The indications on the market could be cleaned from potential false declarations if manufacturers would refer to IEC standard. None of them does. Efficiency at reduced air flow rate also falls by 50 % as compared to full speed for about 40 % of high speed air flow rate. Given that the weighted average number of hours is about 320 hours for EU and
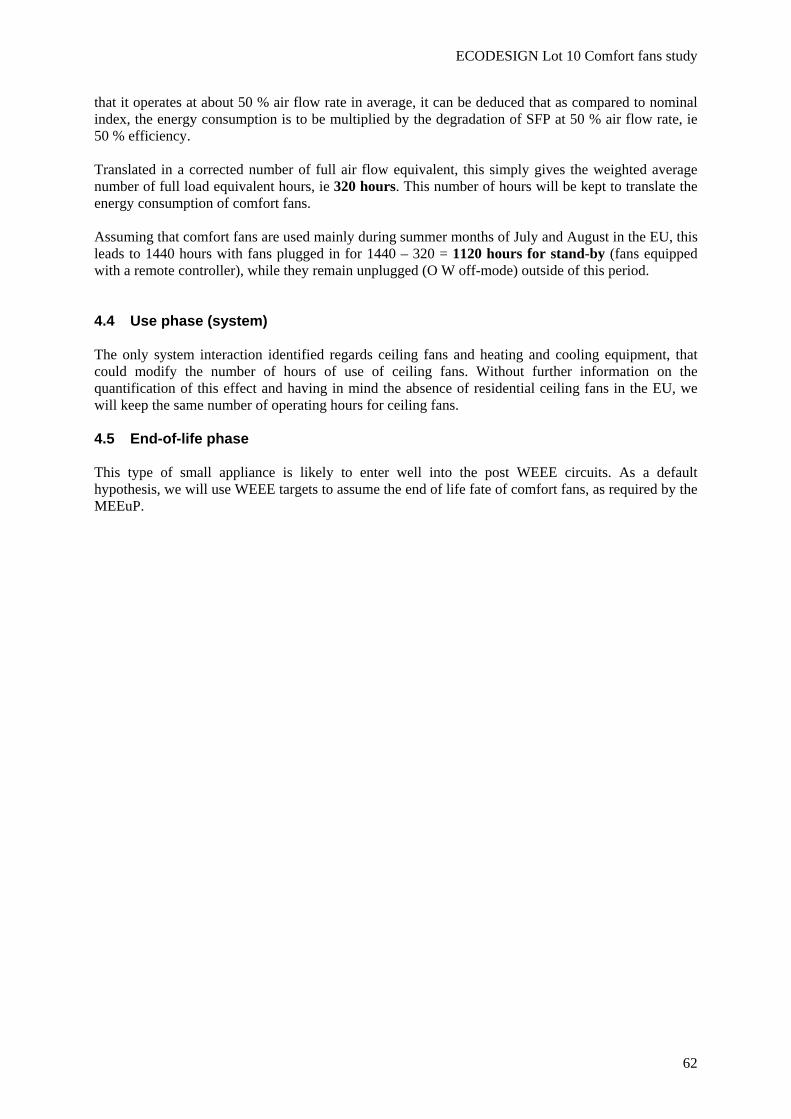
ECODESIGN Lot 10 Comfort fans study
62
that it operates at about 50 % air flow rate in average, it can be deduced that as compared to nominal index, the energy consumption is to be multiplied by the degradation of SFP at 50 % air flow rate, ie 50 % efficiency. Translated in a corrected number of full air flow equivalent, this simply gives the weighted average number of full load equivalent hours, ie 320 hours. This number of hours will be kept to translate the energy consumption of comfort fans. Assuming that comfort fans are used mainly during summer months of July and August in the EU, this leads to 1440 hours with fans plugged in for 1440 – 320 = 1120 hours for stand-by (fans equipped with a remote controller), while they remain unplugged (O W off-mode) outside of this period. 4.4 Use phase (system) The only system interaction identified regards ceiling fans and heating and cooling equipment, that could modify the number of hours of use of ceiling fans. Without further information on the quantification of this effect and having in mind the absence of residential ceiling fans in the EU, we will keep the same number of operating hours for ceiling fans. 4.5 End-of-life phase This type of small appliance is likely to enter well into the post WEEE circuits. As a default hypothesis, we will use WEEE targets to assume the end of life fate of comfort fans, as required by the MEEuP.
ECODESIGN Lot 10 Comfort fans study
63
Task 4 summary Material content of comfort fans vary mainly with the share of plastics it contains. Despite these products are all imported from Far East, the analysis of distribution environmental factors shows it is not necessary to change these parameters. The fans used in Europe are different in function and performance from the ceiling fans in the US. Their performance can be studied with various data presentations, some of them being related with Asian standards.
- Watt for a certain flow, for a certain diameter (China and Taiwan) - SFP (specific wattage per unit flow) for a certain size or Wattage – US standard - “Service value” of IEC 879, flow generated per Watt, as a function of size or Wattage –
the international standard, adequate for our purpose.
In the catalog of manufacturers, the tower fans appear to be less efficient to generate air flow while experimental test carried out to measure SFP for a certain number of fans showed that on the contrary they were more efficient than the table and box fan tested, which by the way had performances far below declared values concerning air flow rates. Based on the declared value, most fans are compliant with Chinese and Taiwanese standards but not all. Based on the limited experimental performance assessment led within the project, there is a significant margin for performance improvement and a lot of non compliance of producing countries with their own standards. Most fans have 3 speeds, which are practically used. Efficiency falls rapidly with air flow reduction, as low as 50 % of nominal efficiency at about 40 % air flow rate. Equivalent number of hours of full load operation is 320 hours and also 1120 hours of stand-by operation for units with a remote controller.
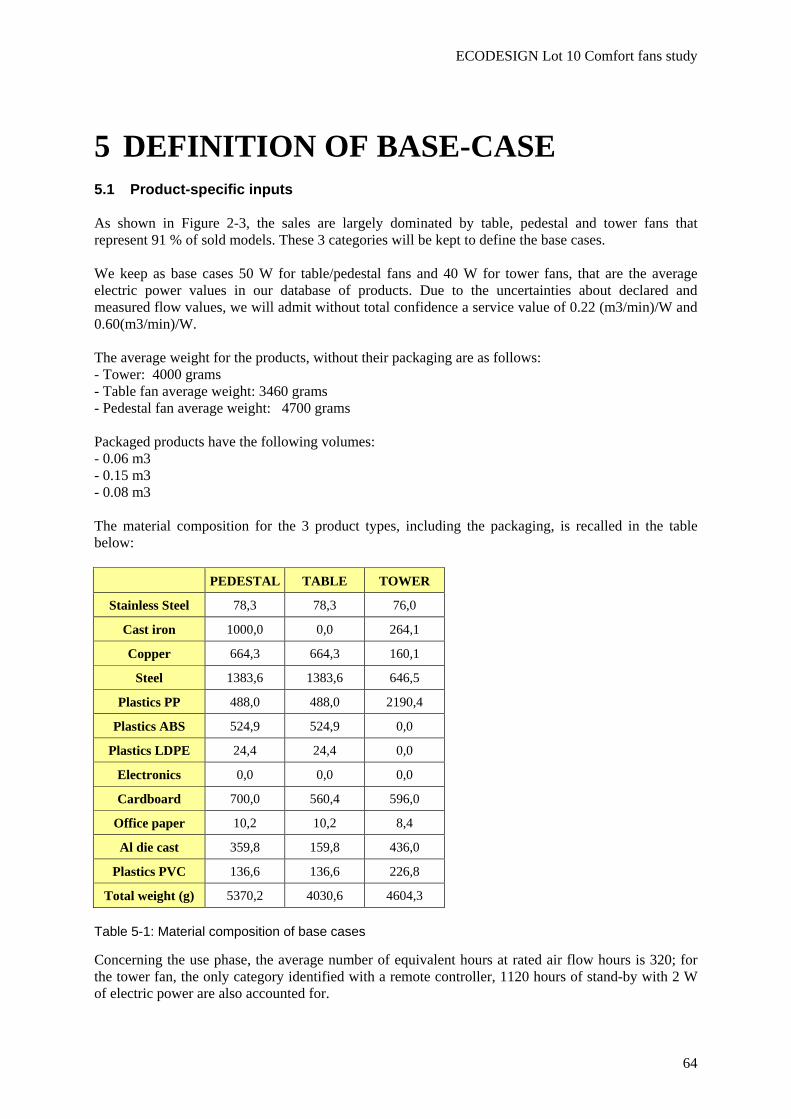
ECODESIGN Lot 10 Comfort fans study
64
5 DEFINITION OF BASE-CASE 5.1 Product-specific inputs As shown in Figure 2-3, the sales are largely dominated by table, pedestal and tower fans that represent 91 % of sold models. These 3 categories will be kept to define the base cases. We keep as base cases 50 W for table/pedestal fans and 40 W for tower fans, that are the average electric power values in our database of products. Due to the uncertainties about declared and measured flow values, we will admit without total confidence a service value of 0.22 (m3/min)/W and 0.60(m3/min)/W. The average weight for the products, without their packaging are as follows: - Tower: 4000 grams - Table fan average weight: 3460 grams - Pedestal fan average weight: 4700 grams Packaged products have the following volumes: - 0.06 m3 - 0.15 m3 - 0.08 m3 The material composition for the 3 product types, including the packaging, is recalled in the table below:
PEDESTAL TABLE TOWER
Stainless Steel 78,3 78,3 76,0
Cast iron 1000,0 0,0 264,1
Copper 664,3 664,3 160,1
Steel 1383,6 1383,6 646,5
Plastics PP 488,0 488,0 2190,4
Plastics ABS 524,9 524,9 0,0
Plastics LDPE 24,4 24,4 0,0
Electronics 0,0 0,0 0,0
Cardboard 700,0 560,4 596,0
Office paper 10,2 10,2 8,4
Al die cast 359,8 159,8 436,0
Plastics PVC 136,6 136,6 226,8
Total weight (g) 5370,2 4030,6 4604,3
Table 5-1: Material composition of base cases
Concerning the use phase, the average number of equivalent hours at rated air flow hours is 320; for the tower fan, the only category identified with a remote controller, 1120 hours of stand-by with 2 W of electric power are also accounted for.
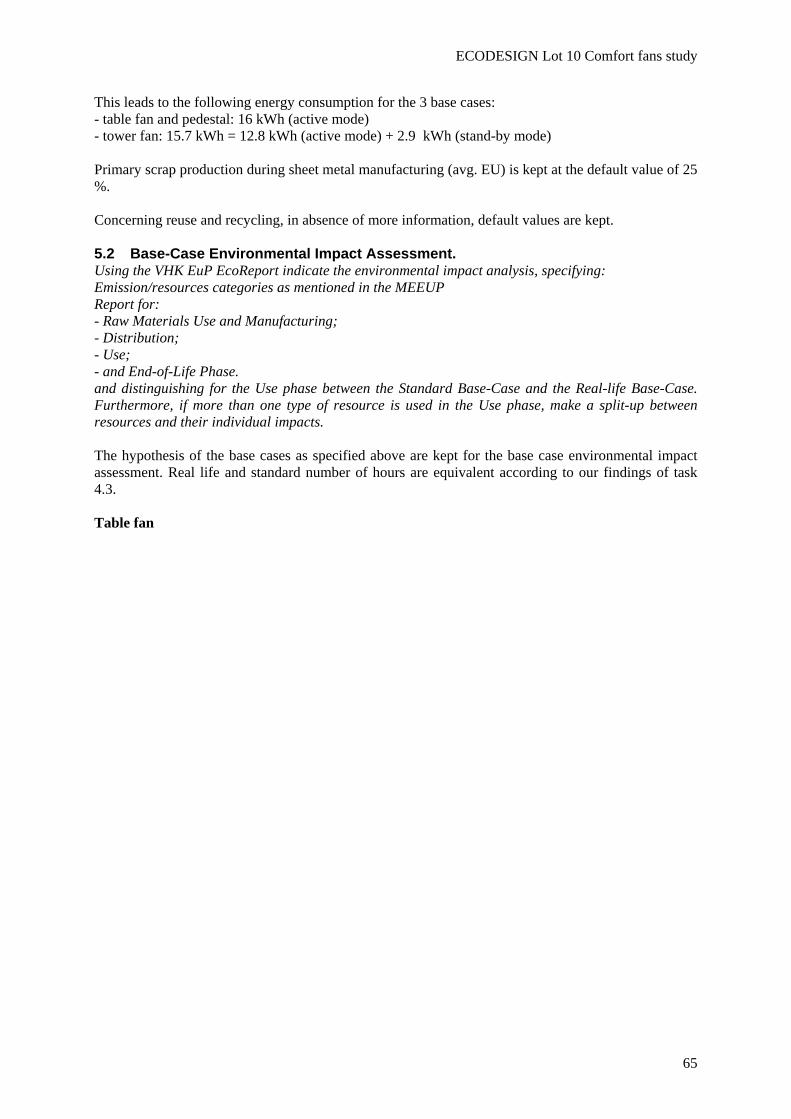
ECODESIGN Lot 10 Comfort fans study
65
This leads to the following energy consumption for the 3 base cases: - table fan and pedestal: 16 kWh (active mode) - tower fan: 15.7 kWh = 12.8 kWh (active mode) + 2.9 kWh (stand-by mode) Primary scrap production during sheet metal manufacturing (avg. EU) is kept at the default value of 25 %. Concerning reuse and recycling, in absence of more information, default values are kept. 5.2 Base-Case Environmental Impact Assessment. Using the VHK EuP EcoReport indicate the environmental impact analysis, specifying: Emission/resources categories as mentioned in the MEEUP Report for: - Raw Materials Use and Manufacturing; - Distribution; - Use; - and End-of-Life Phase. and distinguishing for the Use phase between the Standard Base-Case and the Real-life Base-Case. Furthermore, if more than one type of resource is used in the Use phase, make a split-up between resources and their individual impacts. The hypothesis of the base cases as specified above are kept for the base case environmental impact assessment. Real life and standard number of hours are equivalent according to our findings of task 4.3. Table fan
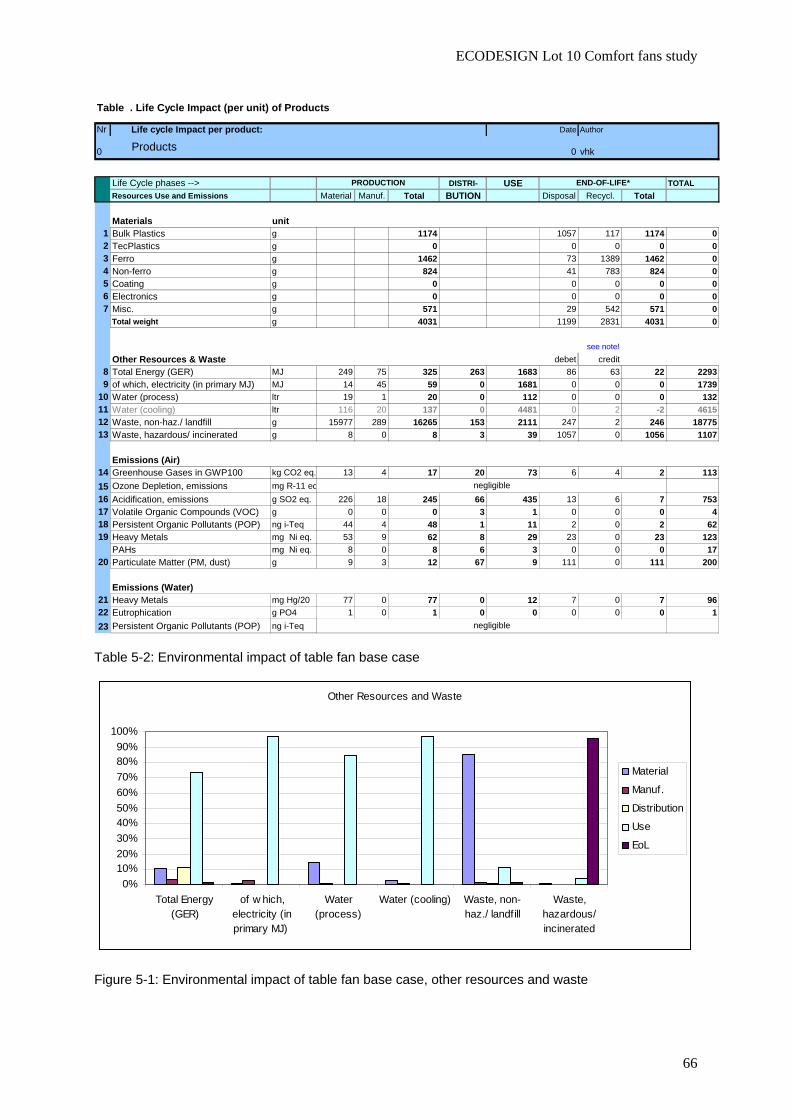
ECODESIGN Lot 10 Comfort fans study
66
Nr
0
Life Cycle phases --> DISTRI- USE TOTALResources Use and Emissions Material Manuf. Total BUTION Disposal Recycl. Total
Materials unit1 Bulk Plastics g 1174 1057 117 1174 02 TecPlastics g 0 0 0 0 03 Ferro g 1462 73 1389 1462 04 Non-ferro g 824 41 783 824 05 Coating g 0 0 0 0 06 Electronics g 0 0 0 0 07 Misc. g 571 29 542 571 0
Total weight g 4031 1199 2831 4031 0
see note!Other Resources & Waste debet credit
8 Total Energy (GER) MJ 249 75 325 263 1683 86 63 22 22939 of which, electricity (in primary MJ) MJ 14 45 59 0 1681 0 0 0 1739
10 Water (process) ltr 19 1 20 0 112 0 0 0 13211 Water (cooling) ltr 116 20 137 0 4481 0 2 -2 461512 Waste, non-haz./ landfill g 15977 289 16265 153 2111 247 2 246 1877513 Waste, hazardous/ incinerated g 8 0 8 3 39 1057 0 1056 1107
Emissions (Air)14 Greenhouse Gases in GWP100 kg CO2 eq. 13 4 17 20 73 6 4 2 11315 Ozone Depletion, emissions mg R-11 eq16 Acidification, emissions g SO2 eq. 226 18 245 66 435 13 6 7 75317 Volatile Organic Compounds (VOC) g 0 0 0 3 1 0 0 0 418 Persistent Organic Pollutants (POP) ng i-Teq 44 4 48 1 11 2 0 2 6219 Heavy Metals mg Ni eq. 53 9 62 8 29 23 0 23 123
PAHs mg Ni eq. 8 0 8 6 3 0 0 0 1720 Particulate Matter (PM, dust) g 9 3 12 67 9 111 0 111 200
Emissions (Water)21 Heavy Metals mg Hg/20 77 0 77 0 12 7 0 7 9622 Eutrophication g PO4 1 0 1 0 0 0 0 0 123 Persistent Organic Pollutants (POP) ng i-Teq
Table . Life Cycle Impact (per unit) of Products
Life cycle Impact per product:
PRODUCTION END-OF-LIFE*
negligible
Author
vhk
Date
0Products
negligible
Table 5-2: Environmental impact of table fan base case
Other Resources and Waste
0%10%20%30%40%50%60%70%80%90%
100%
Total Energy(GER)
of w hich,electricity (inprimary MJ)
Water(process)
Water (cooling) Waste, non-haz./ landfill
Waste,hazardous/incinerated
Material
Manuf.
Distribution
Use
EoL
Figure 5-1: Environmental impact of table fan base case, other resources and waste
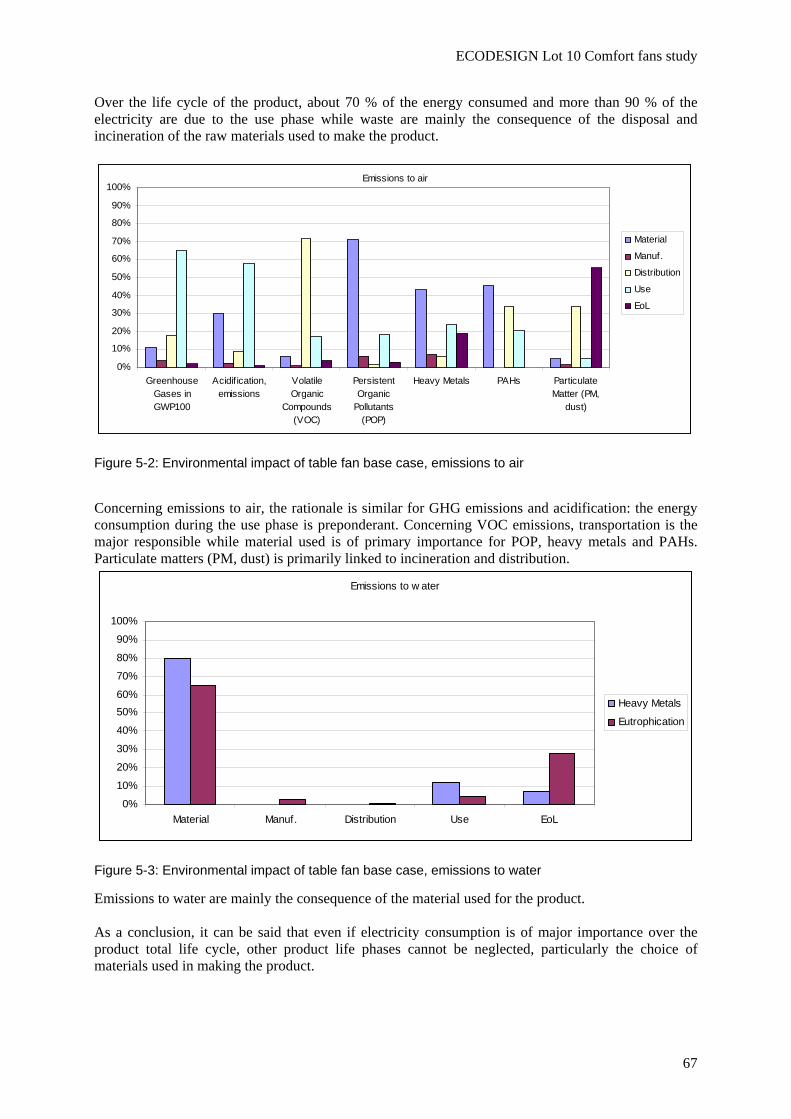
ECODESIGN Lot 10 Comfort fans study
67
Over the life cycle of the product, about 70 % of the energy consumed and more than 90 % of the electricity are due to the use phase while waste are mainly the consequence of the disposal and incineration of the raw materials used to make the product.
Emissions to air
0%
10%
20%
30%
40%
50%
60%
70%
80%
90%
100%
GreenhouseGases inGWP100
Acidif ication,emissions
VolatileOrganic
Compounds(VOC)
PersistentOrganic
Pollutants(POP)
Heavy Metals PAHs ParticulateMatter (PM,
dust)
Material
Manuf.
Distribution
Use
EoL
Figure 5-2: Environmental impact of table fan base case, emissions to air
Concerning emissions to air, the rationale is similar for GHG emissions and acidification: the energy consumption during the use phase is preponderant. Concerning VOC emissions, transportation is the major responsible while material used is of primary importance for POP, heavy metals and PAHs. Particulate matters (PM, dust) is primarily linked to incineration and distribution.
Emissions to w ater
0%
10%
20%
30%
40%
50%60%
70%
80%
90%
100%
Material Manuf. Distribution Use EoL
Heavy Metals
Eutrophication
Figure 5-3: Environmental impact of table fan base case, emissions to water
Emissions to water are mainly the consequence of the material used for the product. As a conclusion, it can be said that even if electricity consumption is of major importance over the product total life cycle, other product life phases cannot be neglected, particularly the choice of materials used in making the product.
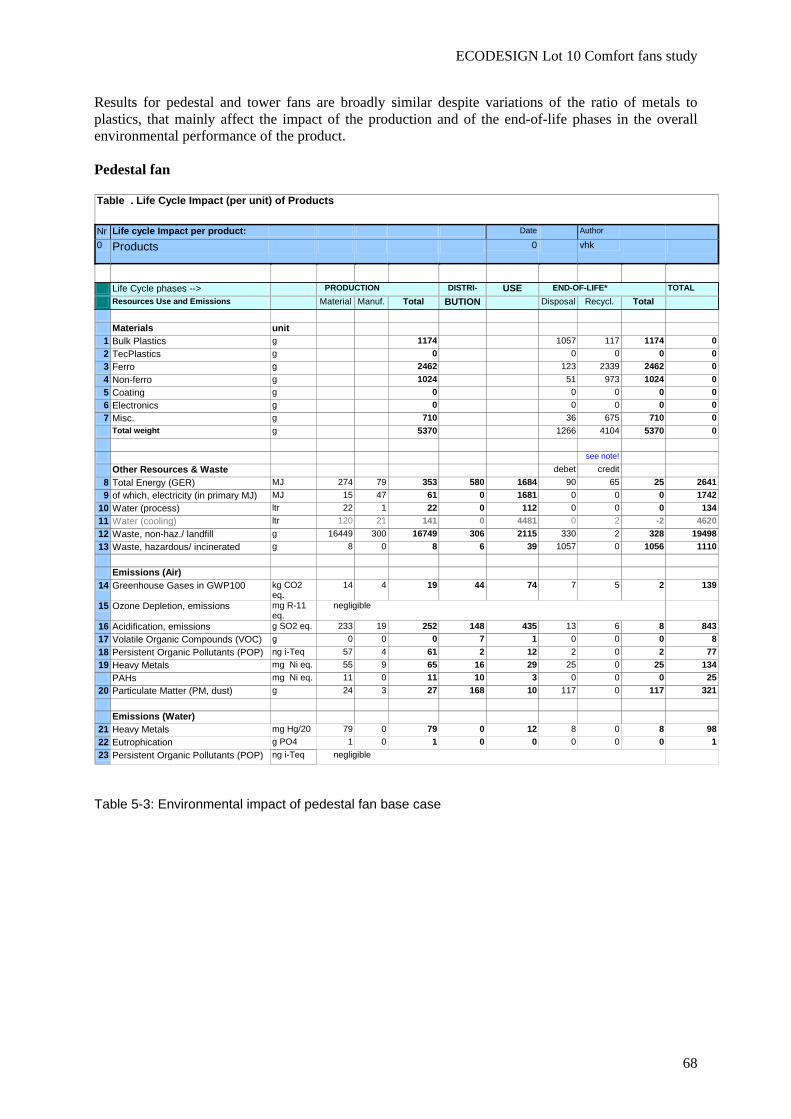
ECODESIGN Lot 10 Comfort fans study
68
Results for pedestal and tower fans are broadly similar despite variations of the ratio of metals to plastics, that mainly affect the impact of the production and of the end-of-life phases in the overall environmental performance of the product. Pedestal fan Table . Life Cycle Impact (per unit) of Products
Nr Life cycle Impact per product: Date Author
0 Products 0 vhk
Life Cycle phases --> PRODUCTION DISTRI- USE END-OF-LIFE* TOTAL
Resources Use and Emissions Material Manuf. Total BUTION Disposal Recycl. Total Materials unit
1 Bulk Plastics g 1174 1057 117 1174 02 TecPlastics g 0 0 0 0 03 Ferro g 2462 123 2339 2462 04 Non-ferro g 1024 51 973 1024 05 Coating g 0 0 0 0 06 Electronics g 0 0 0 0 07 Misc. g 710 36 675 710 0 Total weight g 5370 1266 4104 5370 0 see note!
Other Resources & Waste debet credit 8 Total Energy (GER) MJ 274 79 353 580 1684 90 65 25 26419 of which, electricity (in primary MJ) MJ 15 47 61 0 1681 0 0 0 1742
10 Water (process) ltr 22 1 22 0 112 0 0 0 13411 Water (cooling) ltr 120 21 141 0 4481 0 2 -2 462012 Waste, non-haz./ landfill g 16449 300 16749 306 2115 330 2 328 1949813 Waste, hazardous/ incinerated g 8 0 8 6 39 1057 0 1056 1110
Emissions (Air)
14 Greenhouse Gases in GWP100 kg CO2 eq.
14 4 19 44 74 7 5 2 139
15 Ozone Depletion, emissions mg R-11 eq.
negligible 16 Acidification, emissions g SO2 eq. 233 19 252 148 435 13 6 8 84317 Volatile Organic Compounds (VOC) g 0 0 0 7 1 0 0 0 818 Persistent Organic Pollutants (POP) ng i-Teq 57 4 61 2 12 2 0 2 7719 Heavy Metals mg Ni eq. 55 9 65 16 29 25 0 25 134
PAHs mg Ni eq. 11 0 11 10 3 0 0 0 2520 Particulate Matter (PM, dust) g 24 3 27 168 10 117 0 117 321
Emissions (Water)
21 Heavy Metals mg Hg/20 79 0 79 0 12 8 0 8 9822 Eutrophication g PO4 1 0 1 0 0 0 0 0 123 Persistent Organic Pollutants (POP) ng i-Teq negligible
Table 5-3: Environmental impact of pedestal fan base case
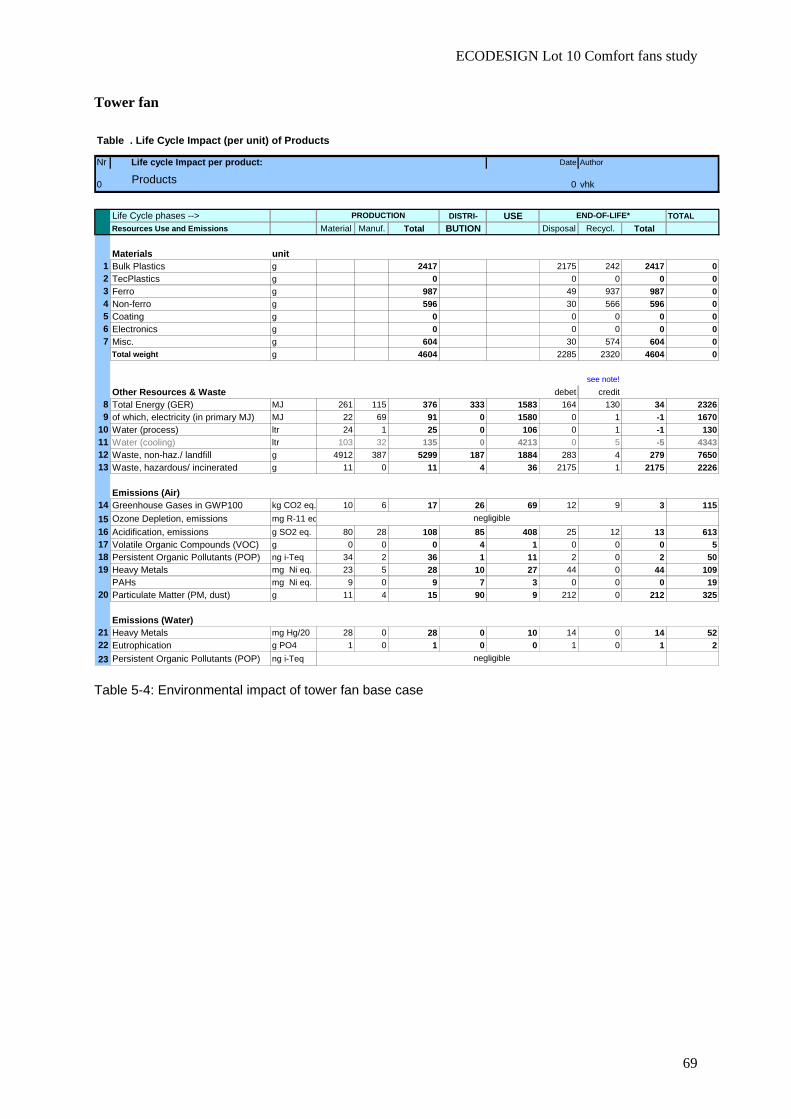
ECODESIGN Lot 10 Comfort fans study
69
Tower fan
Nr
0
Life Cycle phases --> DISTRI- USE TOTALResources Use and Emissions Material Manuf. Total BUTION Disposal Recycl. Total
Materials unit1 Bulk Plastics g 2417 2175 242 2417 02 TecPlastics g 0 0 0 0 03 Ferro g 987 49 937 987 04 Non-ferro g 596 30 566 596 05 Coating g 0 0 0 0 06 Electronics g 0 0 0 0 07 Misc. g 604 30 574 604 0
Total weight g 4604 2285 2320 4604 0
see note!Other Resources & Waste debet credit
8 Total Energy (GER) MJ 261 115 376 333 1583 164 130 34 23269 of which, electricity (in primary MJ) MJ 22 69 91 0 1580 0 1 -1 1670
10 Water (process) ltr 24 1 25 0 106 0 1 -1 13011 Water (cooling) ltr 103 32 135 0 4213 0 5 -5 434312 Waste, non-haz./ landfill g 4912 387 5299 187 1884 283 4 279 765013 Waste, hazardous/ incinerated g 11 0 11 4 36 2175 1 2175 2226
Emissions (Air)14 Greenhouse Gases in GWP100 kg CO2 eq. 10 6 17 26 69 12 9 3 11515 Ozone Depletion, emissions mg R-11 eq16 Acidification, emissions g SO2 eq. 80 28 108 85 408 25 12 13 61317 Volatile Organic Compounds (VOC) g 0 0 0 4 1 0 0 0 518 Persistent Organic Pollutants (POP) ng i-Teq 34 2 36 1 11 2 0 2 5019 Heavy Metals mg Ni eq. 23 5 28 10 27 44 0 44 109
PAHs mg Ni eq. 9 0 9 7 3 0 0 0 1920 Particulate Matter (PM, dust) g 11 4 15 90 9 212 0 212 325
Emissions (Water)21 Heavy Metals mg Hg/20 28 0 28 0 10 14 0 14 5222 Eutrophication g PO4 1 0 1 0 0 1 0 1 223 Persistent Organic Pollutants (POP) ng i-Teq negligible
Life cycle Impact per product:
PRODUCTION END-OF-LIFE*
negligible
Author
vhk
Date
0Products
Table . Life Cycle Impact (per unit) of Products
Table 5-4: Environmental impact of tower fan base case
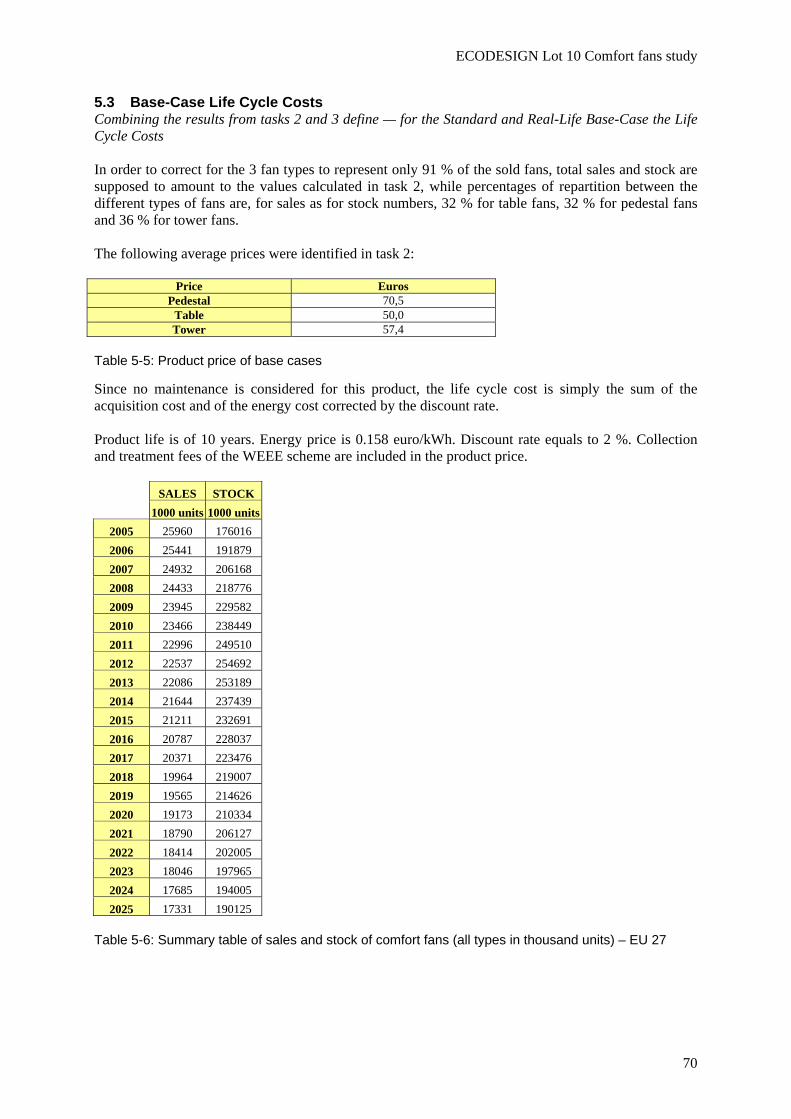
ECODESIGN Lot 10 Comfort fans study
70
5.3 Base-Case Life Cycle Costs Combining the results from tasks 2 and 3 define — for the Standard and Real-Life Base-Case the Life Cycle Costs In order to correct for the 3 fan types to represent only 91 % of the sold fans, total sales and stock are supposed to amount to the values calculated in task 2, while percentages of repartition between the different types of fans are, for sales as for stock numbers, 32 % for table fans, 32 % for pedestal fans and 36 % for tower fans. The following average prices were identified in task 2:
Price Euros Pedestal 70,5
Table 50,0 Tower 57,4
Table 5-5: Product price of base cases
Since no maintenance is considered for this product, the life cycle cost is simply the sum of the acquisition cost and of the energy cost corrected by the discount rate. Product life is of 10 years. Energy price is 0.158 euro/kWh. Discount rate equals to 2 %. Collection and treatment fees of the WEEE scheme are included in the product price.
SALES STOCK 1000 units 1000 units
2005 25960 176016 2006 25441 191879 2007 24932 206168 2008 24433 218776 2009 23945 229582 2010 23466 238449 2011 22996 249510 2012 22537 254692 2013 22086 253189 2014 21644 237439 2015 21211 232691 2016 20787 228037 2017 20371 223476 2018 19964 219007 2019 19565 214626 2020 19173 210334 2021 18790 206127 2022 18414 202005 2023 18046 197965 2024 17685 194005 2025 17331 190125
Table 5-6: Summary table of sales and stock of comfort fans (all types in thousand units) – EU 27
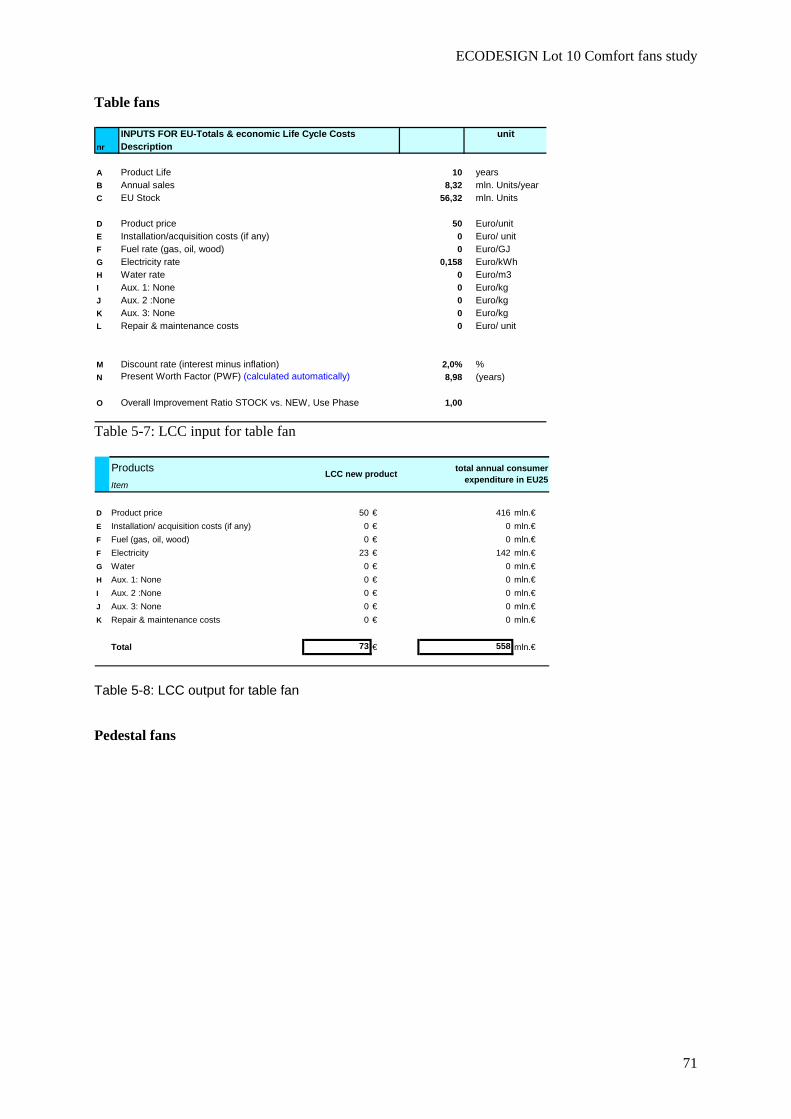
ECODESIGN Lot 10 Comfort fans study
71
Table fans
INPUTS FOR EU-Totals & economic Life Cycle Costs unitnr Description
A Product Life 10 yearsB Annual sales 8,32 mln. Units/yearC EU Stock 56,32 mln. Units
D Product price 50 Euro/unitE Installation/acquisition costs (if any) 0 Euro/ unitF Fuel rate (gas, oil, wood) 0 Euro/GJG Electricity rate 0,158 Euro/kWhH Water rate 0 Euro/m3I Aux. 1: None 0 Euro/kgJ Aux. 2 :None 0 Euro/kgK Aux. 3: None 0 Euro/kgL Repair & maintenance costs 0 Euro/ unit
M Discount rate (interest minus inflation) 2,0% %N Present Worth Factor (PWF) (calculated automatically) 8,98 (years)
O Overall Improvement Ratio STOCK vs. NEW, Use Phase 1,00
Table 5-7: LCC input for table fan
D € mln.€E € mln.€F € mln.€F € mln.€G € mln.€H € mln.€I € mln.€J € mln.€K € mln.€
€ mln.€
Item
41600Fuel (gas, oil, wood) 0
Products total annual consumer expenditure in EU25
558
LCC new product
00
0
1420
0
230
73Total
000Repair & maintenance costs
50
0
Product priceInstallation/ acquisition costs (if any)
Electricity Water Aux. 1: NoneAux. 2 :NoneAux. 3: None
0
Table 5-8: LCC output for table fan
Pedestal fans
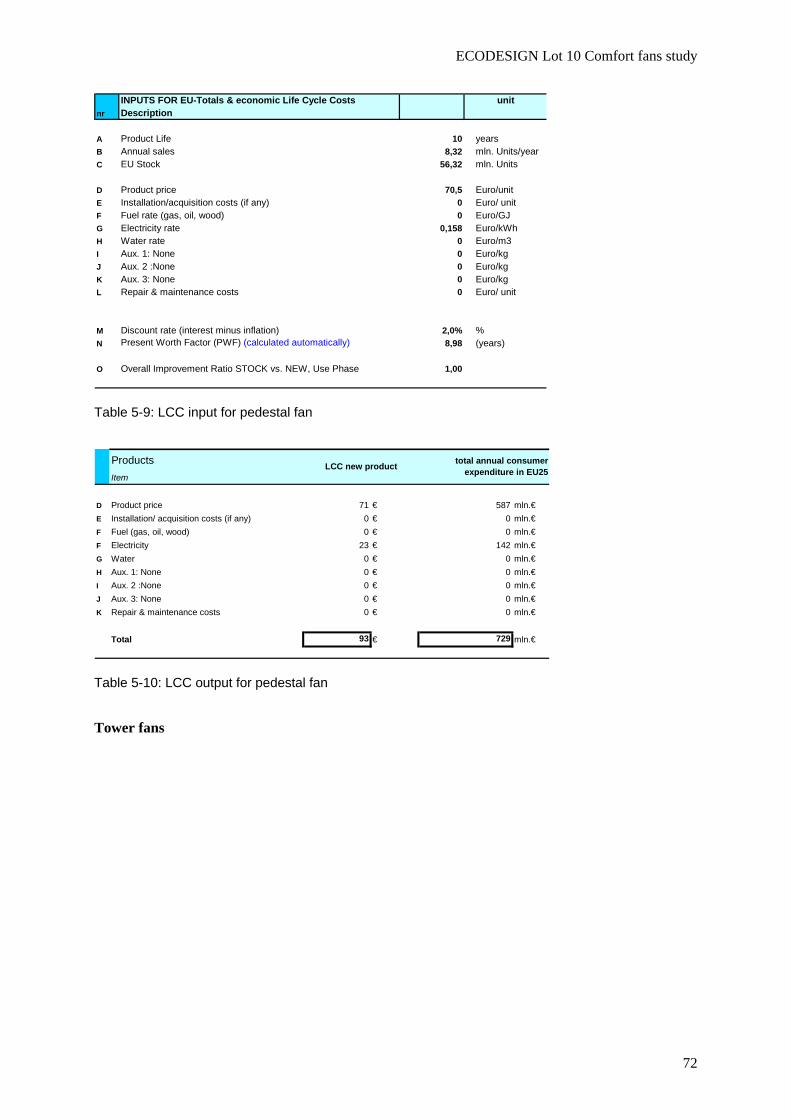
ECODESIGN Lot 10 Comfort fans study
72
INPUTS FOR EU-Totals & economic Life Cycle Costs unitnr Description
A Product Life 10 yearsB Annual sales 8,32 mln. Units/yearC EU Stock 56,32 mln. Units
D Product price 70,5 Euro/unitE Installation/acquisition costs (if any) 0 Euro/ unitF Fuel rate (gas, oil, wood) 0 Euro/GJG Electricity rate 0,158 Euro/kWhH Water rate 0 Euro/m3I Aux. 1: None 0 Euro/kgJ Aux. 2 :None 0 Euro/kgK Aux. 3: None 0 Euro/kgL Repair & maintenance costs 0 Euro/ unit
M Discount rate (interest minus inflation) 2,0% %N Present Worth Factor (PWF) (calculated automatically) 8,98 (years)
O Overall Improvement Ratio STOCK vs. NEW, Use Phase 1,00
Table 5-9: LCC input for pedestal fan
D € mln.€E € mln.€F € mln.€F € mln.€G € mln.€H € mln.€I € mln.€J € mln.€K € mln.€
€ mln.€
Aux. 2 :NoneAux. 3: None
0
Repair & maintenance costs
71
0
Product priceInstallation/ acquisition costs (if any)
Electricity Water Aux. 1: None
93Total
000
1420
0
230
729
LCC new product
00
0
58700Fuel (gas, oil, wood) 0
Products total annual consumer expenditure in EU25 Item
Table 5-10: LCC output for pedestal fan
Tower fans
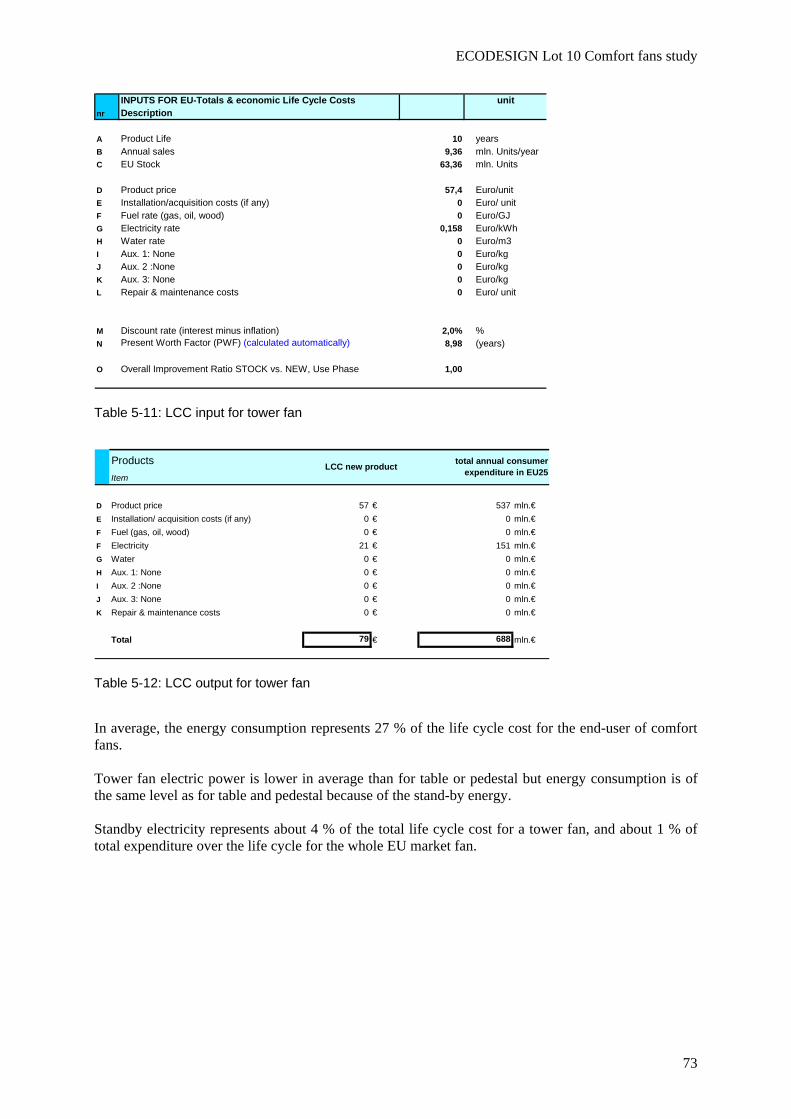
ECODESIGN Lot 10 Comfort fans study
73
INPUTS FOR EU-Totals & economic Life Cycle Costs unitnr Description
A Product Life 10 yearsB Annual sales 9,36 mln. Units/yearC EU Stock 63,36 mln. Units
D Product price 57,4 Euro/unitE Installation/acquisition costs (if any) 0 Euro/ unitF Fuel rate (gas, oil, wood) 0 Euro/GJG Electricity rate 0,158 Euro/kWhH Water rate 0 Euro/m3I Aux. 1: None 0 Euro/kgJ Aux. 2 :None 0 Euro/kgK Aux. 3: None 0 Euro/kgL Repair & maintenance costs 0 Euro/ unit
M Discount rate (interest minus inflation) 2,0% %N Present Worth Factor (PWF) (calculated automatically) 8,98 (years)
O Overall Improvement Ratio STOCK vs. NEW, Use Phase 1,00
Table 5-11: LCC input for tower fan
D € mln.€E € mln.€F € mln.€F € mln.€G € mln.€H € mln.€I € mln.€J € mln.€K € mln.€
€ mln.€
Aux. 2 :NoneAux. 3: None
0
Repair & maintenance costs
57
0
Product priceInstallation/ acquisition costs (if any)
Electricity Water Aux. 1: None
79Total
000
1510
0
210
688
LCC new product
00
0
53700Fuel (gas, oil, wood) 0
Products total annual consumer expenditure in EU25 Item
Table 5-12: LCC output for tower fan
In average, the energy consumption represents 27 % of the life cycle cost for the end-user of comfort fans. Tower fan electric power is lower in average than for table or pedestal but energy consumption is of the same level as for table and pedestal because of the stand-by energy. Standby electricity represents about 4 % of the total life cycle cost for a tower fan, and about 1 % of total expenditure over the life cycle for the whole EU market fan.
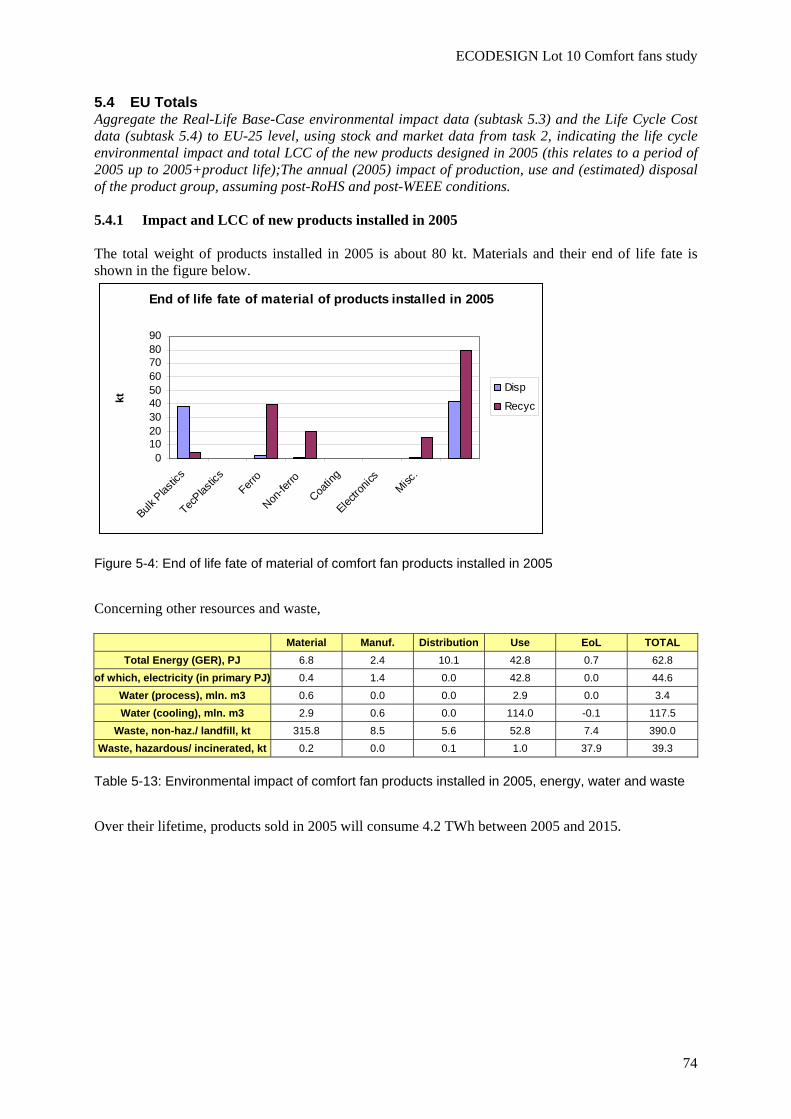
ECODESIGN Lot 10 Comfort fans study
74
5.4 EU Totals Aggregate the Real-Life Base-Case environmental impact data (subtask 5.3) and the Life Cycle Cost data (subtask 5.4) to EU-25 level, using stock and market data from task 2, indicating the life cycle environmental impact and total LCC of the new products designed in 2005 (this relates to a period of 2005 up to 2005+product life);The annual (2005) impact of production, use and (estimated) disposal of the product group, assuming post-RoHS and post-WEEE conditions. 5.4.1 Impact and LCC of new products installed in 2005 The total weight of products installed in 2005 is about 80 kt. Materials and their end of life fate is shown in the figure below.
End of life fate of material of products installed in 2005
0102030405060708090
Bulk P
lastic
s
TecPlas
tics
Ferro
Non-fe
rro
Coatin
g
Electro
nics
Misc.
kt
Disp
Recyc
Figure 5-4: End of life fate of material of comfort fan products installed in 2005
Concerning other resources and waste,
Material Manuf. Distribution Use EoL TOTAL Total Energy (GER), PJ 6.8 2.4 10.1 42.8 0.7 62.8
of which, electricity (in primary PJ) 0.4 1.4 0.0 42.8 0.0 44.6 Water (process), mln. m3 0.6 0.0 0.0 2.9 0.0 3.4 Water (cooling), mln. m3 2.9 0.6 0.0 114.0 -0.1 117.5
Waste, non-haz./ landfill, kt 315.8 8.5 5.6 52.8 7.4 390.0 Waste, hazardous/ incinerated, kt 0.2 0.0 0.1 1.0 37.9 39.3
Table 5-13: Environmental impact of comfort fan products installed in 2005, energy, water and waste
Over their lifetime, products sold in 2005 will consume 4.2 TWh between 2005 and 2015.
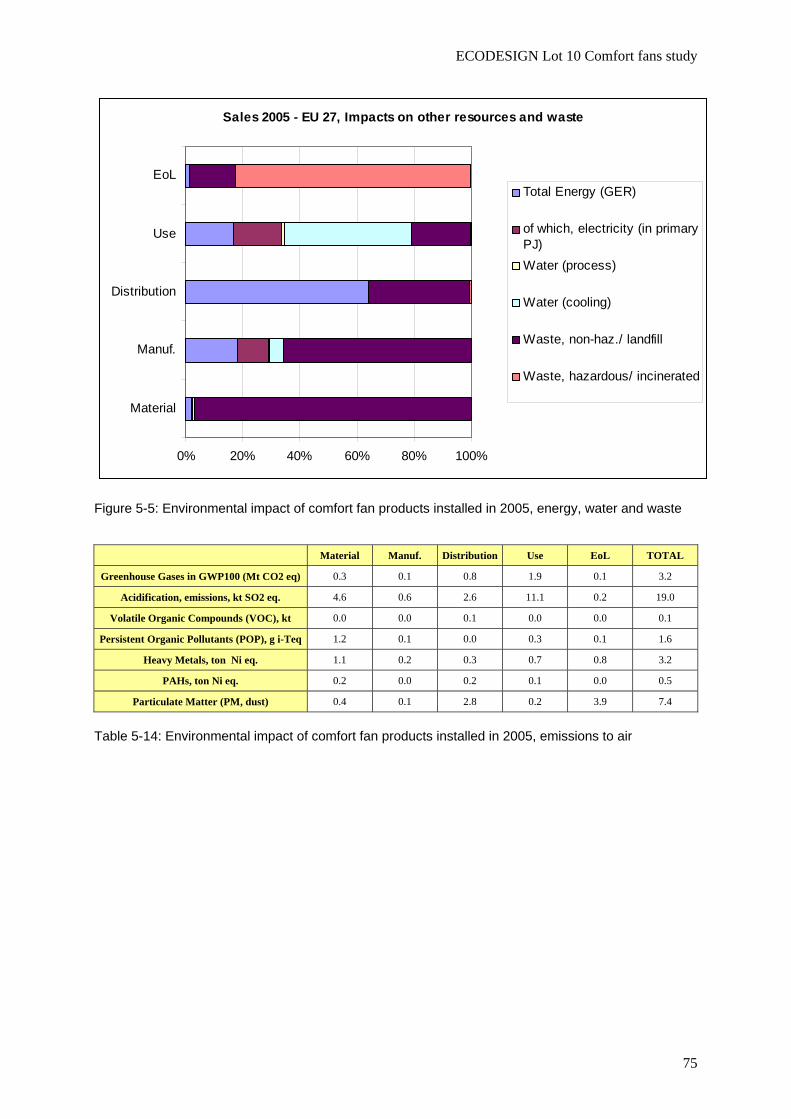
ECODESIGN Lot 10 Comfort fans study
75
Sales 2005 - EU 27, Impacts on other resources and waste
0% 20% 40% 60% 80% 100%
Material
Manuf.
Distribution
Use
EoLTotal Energy (GER)
of which, electricity (in primaryPJ) Water (process)
Water (cooling)
Waste, non-haz./ landfill
Waste, hazardous/ incinerated
Figure 5-5: Environmental impact of comfort fan products installed in 2005, energy, water and waste
Material Manuf. Distribution Use EoL TOTAL
Greenhouse Gases in GWP100 (Mt CO2 eq) 0.3 0.1 0.8 1.9 0.1 3.2
Acidification, emissions, kt SO2 eq. 4.6 0.6 2.6 11.1 0.2 19.0
Volatile Organic Compounds (VOC), kt 0.0 0.0 0.1 0.0 0.0 0.1
Persistent Organic Pollutants (POP), g i-Teq 1.2 0.1 0.0 0.3 0.1 1.6
Heavy Metals, ton Ni eq. 1.1 0.2 0.3 0.7 0.8 3.2
PAHs, ton Ni eq. 0.2 0.0 0.2 0.1 0.0 0.5
Particulate Matter (PM, dust) 0.4 0.1 2.8 0.2 3.9 7.4
Table 5-14: Environmental impact of comfort fan products installed in 2005, emissions to air
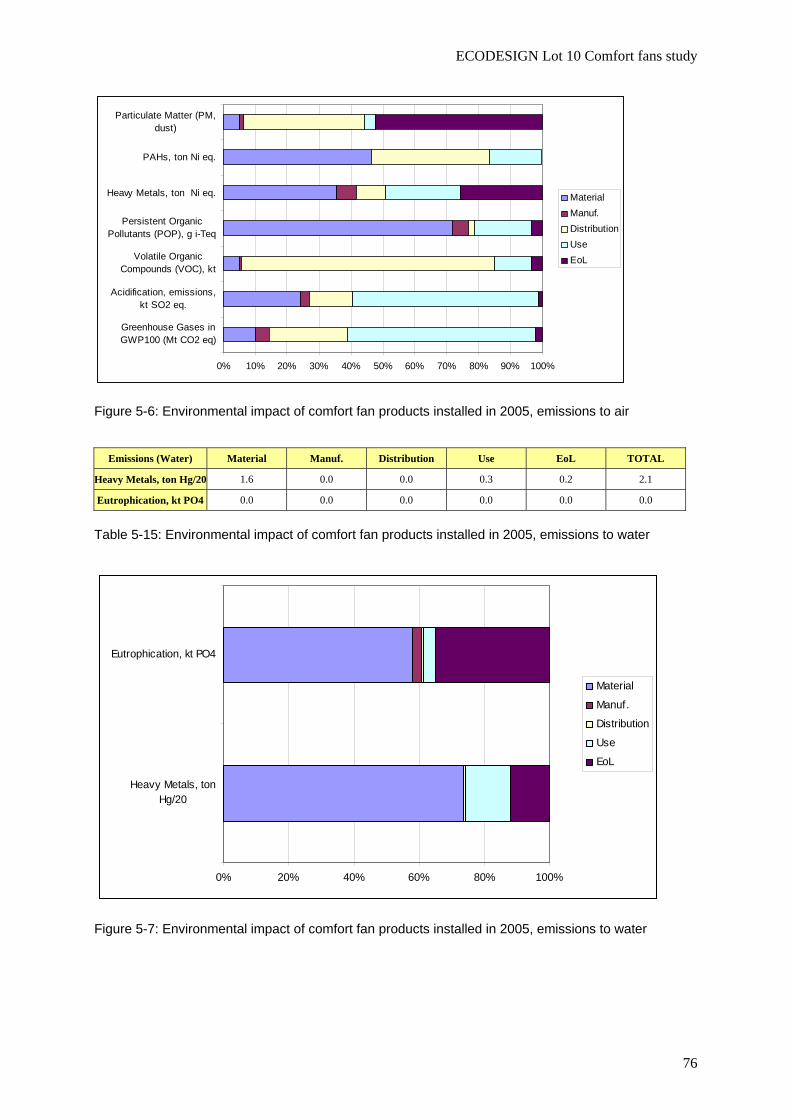
ECODESIGN Lot 10 Comfort fans study
76
0% 10% 20% 30% 40% 50% 60% 70% 80% 90% 100%
Greenhouse Gases inGWP100 (Mt CO2 eq)
Acidification, emissions,kt SO2 eq.
Volatile OrganicCompounds (VOC), kt
Persistent OrganicPollutants (POP), g i-Teq
Heavy Metals, ton Ni eq.
PAHs, ton Ni eq.
Particulate Matter (PM,dust)
MaterialManuf.DistributionUseEoL
Figure 5-6: Environmental impact of comfort fan products installed in 2005, emissions to air
Emissions (Water) Material Manuf. Distribution Use EoL TOTAL
Heavy Metals, ton Hg/20 1.6 0.0 0.0 0.3 0.2 2.1
Eutrophication, kt PO4 0.0 0.0 0.0 0.0 0.0 0.0
Table 5-15: Environmental impact of comfort fan products installed in 2005, emissions to water
0% 20% 40% 60% 80% 100%
Heavy Metals, tonHg/20
Eutrophication, kt PO4
Material
Manuf.
Distribution
Use
EoL
Figure 5-7: Environmental impact of comfort fan products installed in 2005, emissions to water
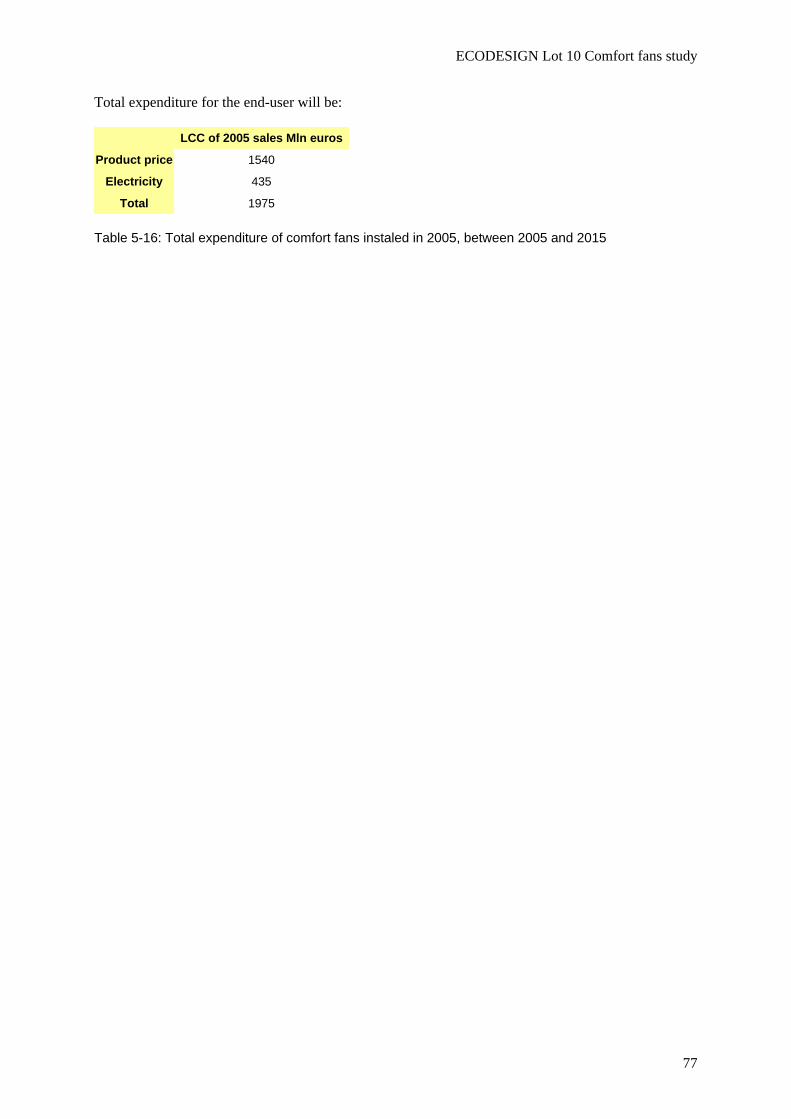
ECODESIGN Lot 10 Comfort fans study
77
Total expenditure for the end-user will be:
LCC of 2005 sales Mln euros
Product price 1540
Electricity 435
Total 1975
Table 5-16: Total expenditure of comfort fans instaled in 2005, between 2005 and 2015
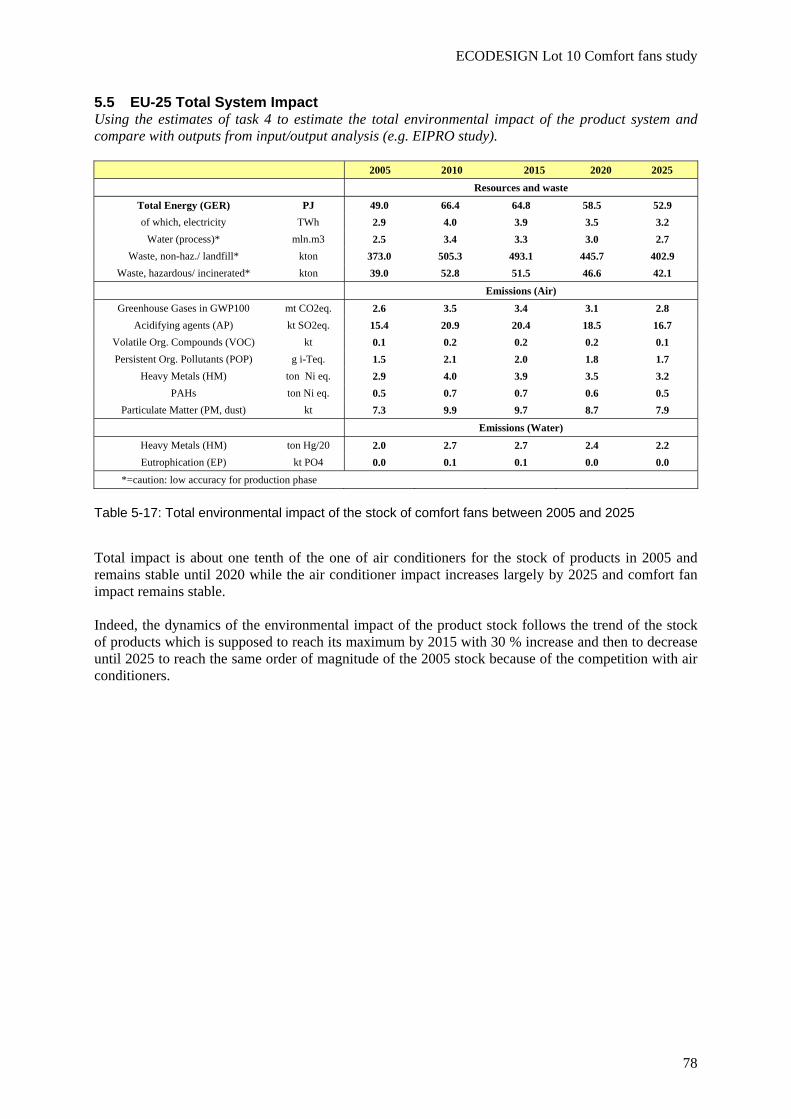
ECODESIGN Lot 10 Comfort fans study
78
5.5 EU-25 Total System Impact Using the estimates of task 4 to estimate the total environmental impact of the product system and compare with outputs from input/output analysis (e.g. EIPRO study).
2005 2010 2015 2020 2025
Resources and waste
Total Energy (GER) PJ 49.0 66.4 64.8 58.5 52.9 of which, electricity TWh 2.9 4.0 3.9 3.5 3.2
Water (process)* mln.m3 2.5 3.4 3.3 3.0 2.7 Waste, non-haz./ landfill* kton 373.0 505.3 493.1 445.7 402.9
Waste, hazardous/ incinerated* kton 39.0 52.8 51.5 46.6 42.1
Emissions (Air) Greenhouse Gases in GWP100 mt CO2eq. 2.6 3.5 3.4 3.1 2.8
Acidifying agents (AP) kt SO2eq. 15.4 20.9 20.4 18.5 16.7 Volatile Org. Compounds (VOC) kt 0.1 0.2 0.2 0.2 0.1 Persistent Org. Pollutants (POP) g i-Teq. 1.5 2.1 2.0 1.8 1.7
Heavy Metals (HM) ton Ni eq. 2.9 4.0 3.9 3.5 3.2 PAHs ton Ni eq. 0.5 0.7 0.7 0.6 0.5
Particulate Matter (PM, dust) kt 7.3 9.9 9.7 8.7 7.9
Emissions (Water) Heavy Metals (HM) ton Hg/20 2.0 2.7 2.7 2.4 2.2 Eutrophication (EP) kt PO4 0.0 0.1 0.1 0.0 0.0
*=caution: low accuracy for production phase
Table 5-17: Total environmental impact of the stock of comfort fans between 2005 and 2025
Total impact is about one tenth of the one of air conditioners for the stock of products in 2005 and remains stable until 2020 while the air conditioner impact increases largely by 2025 and comfort fan impact remains stable. Indeed, the dynamics of the environmental impact of the product stock follows the trend of the stock of products which is supposed to reach its maximum by 2015 with 30 % increase and then to decrease until 2025 to reach the same order of magnitude of the 2005 stock because of the competition with air conditioners.
ECODESIGN Lot 10 Comfort fans study
79
Task 5 summary Three base cases have been defined for most common types of comfort fans: table, pedestal and tower fans. Bills of material of the base case exhibit similar material composition. The analysis of environmental impact shows that the two main life phase is the use phase and the production phase. Then, the material that enters in the composition of the product are an important parameter to reduce the overall environmental impact of comfort fans. In average, the energy consumption represents 27 % of the life cycle cost for the end-user of comfort fans. Tower fan electric power is lower in average than for table or pedestal but energy consumption is of the same level as for table and pedestal because of the stand-by energy. Standby electricity represents about 4 % of the total life cycle cost for a tower fan, and about 1 % of total expenditure over the life cycle for the whole EU market fan. Total impact is about one tenth of the one of air conditioners for the stock of products in 2005 and remains stable until 2020 while the air conditioner impact increases largely by 2025 and comfort fan impact remains stable. Indeed, the dynamics of the environmental impact of the product stock follows the trend of the stock of products which is supposed to reach its maximum by 2015 with 30 % increase and then to decrease until 2025 to reach the same order of magnitude of the 2005 stock because of the competition with air conditioners.
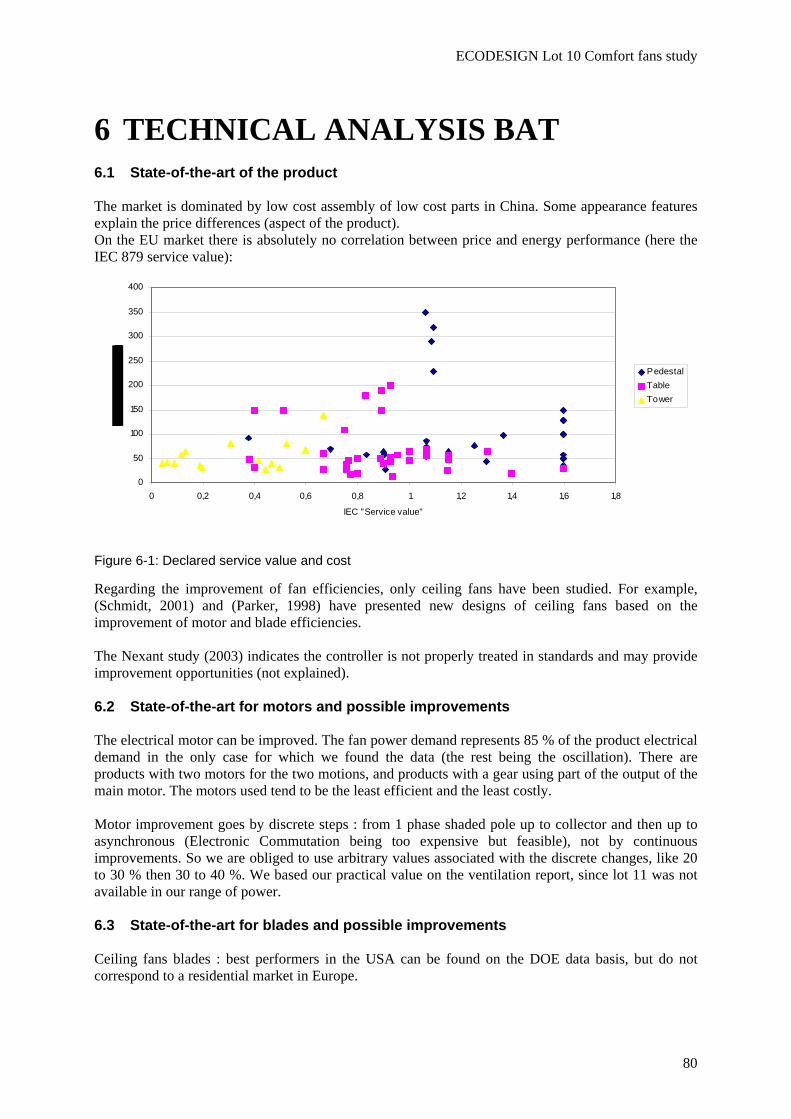
ECODESIGN Lot 10 Comfort fans study
80
6 TECHNICAL ANALYSIS BAT 6.1 State-of-the-art of the product The market is dominated by low cost assembly of low cost parts in China. Some appearance features explain the price differences (aspect of the product). On the EU market there is absolutely no correlation between price and energy performance (here the IEC 879 service value):
0
50
100
150
200
250
300
350
400
0 0,2 0,4 0,6 0,8 1 1,2 1,4 1,6 1,8
IEC "Service value"
PedestalTableTower
Figure 6-1: Declared service value and cost
Regarding the improvement of fan efficiencies, only ceiling fans have been studied. For example, (Schmidt, 2001) and (Parker, 1998) have presented new designs of ceiling fans based on the improvement of motor and blade efficiencies. The Nexant study (2003) indicates the controller is not properly treated in standards and may provide improvement opportunities (not explained). 6.2 State-of-the-art for motors and possible improvements The electrical motor can be improved. The fan power demand represents 85 % of the product electrical demand in the only case for which we found the data (the rest being the oscillation). There are products with two motors for the two motions, and products with a gear using part of the output of the main motor. The motors used tend to be the least efficient and the least costly. Motor improvement goes by discrete steps : from 1 phase shaded pole up to collector and then up to asynchronous (Electronic Commutation being too expensive but feasible), not by continuous improvements. So we are obliged to use arbitrary values associated with the discrete changes, like 20 to 30 % then 30 to 40 %. We based our practical value on the ventilation report, since lot 11 was not available in our range of power. 6.3 State-of-the-art for blades and possible improvements Ceiling fans blades : best performers in the USA can be found on the DOE data basis, but do not correspond to a residential market in Europe.
ECODESIGN Lot 10 Comfort fans study
81
The blades are either axial or tangential according to fan type but generally flat (even if twisted). Blades optimised with CFD could increase efficiency from 20 to 40 %, but at a cost : manufacturing more and more complex shapes. The directional aspect of the tower fan is certainly one way of improvement : focusing the flow. To understand the difference one can observe the way a circular fan evacuates the flow in all directions, as opposed to tower fans. See part 4.4 for details. 6.4 State-of-the-art for control and possible improvements The Nexant study (2003) indicates that there are two types of controllers, resistor-type speed regulator is far less efficient than the electronic controller, a fact that the test standard ignores because it provides only measurements at full speed. No figure is given. For this study the only control option that we can introduce is the automatic management of standby power in tower fans as defined in lot 6. 6.5 State-of-the-art : is tower fan an improved table fan? The directional aspect of the tower fan as well as the lateral encasing of box fans give one way of improvement. The future fan would not move all the air in the room, with some drawbacks (flying papers…) but direct a jet to a precise place: cool people not move air. The tower fan of today generates the same local velocity, the same flow (if we admit our measurements) at a higher investment cost (+7.50 Euros), but a lower running cost (40W instead of 50W). Furthermore, comfort cannot be compared since a focused zone of flow may be very pleasant compared to the usual air movement all around the room. Tower fan can be seen as an improvement option of table fans. The remote controller is not a compulsory part of the tower fan. We will investigate if this improvement option is cost effective.
ECODESIGN Lot 10 Comfort fans study
82
Task 6 summary On the EU market there is absolutely no correlation between price and energy performance. Regarding the improvement of fan efficiencies, only ceiling fans have been studied in the past. The motors used in products sold on EU market tend to be the least efficient and the least costly. Blades optimised with CFD could increase efficiency but at a cost : manufacturing more and more complex shapes. The reduction of standby power (as defined in lot 6) seems feasible in tower fans. The directional aspect of the tower fan is certainly one way of improvement. The directional aspect of the tower fan as well as the lateral encasing of box fans give one way of improvement. The future fan would not move all the air in the room, with some drawbacks (flying papers…) but direct a jet to a precise place: cool people not move air. Tower fan can be seen as an improvement option of table fans.
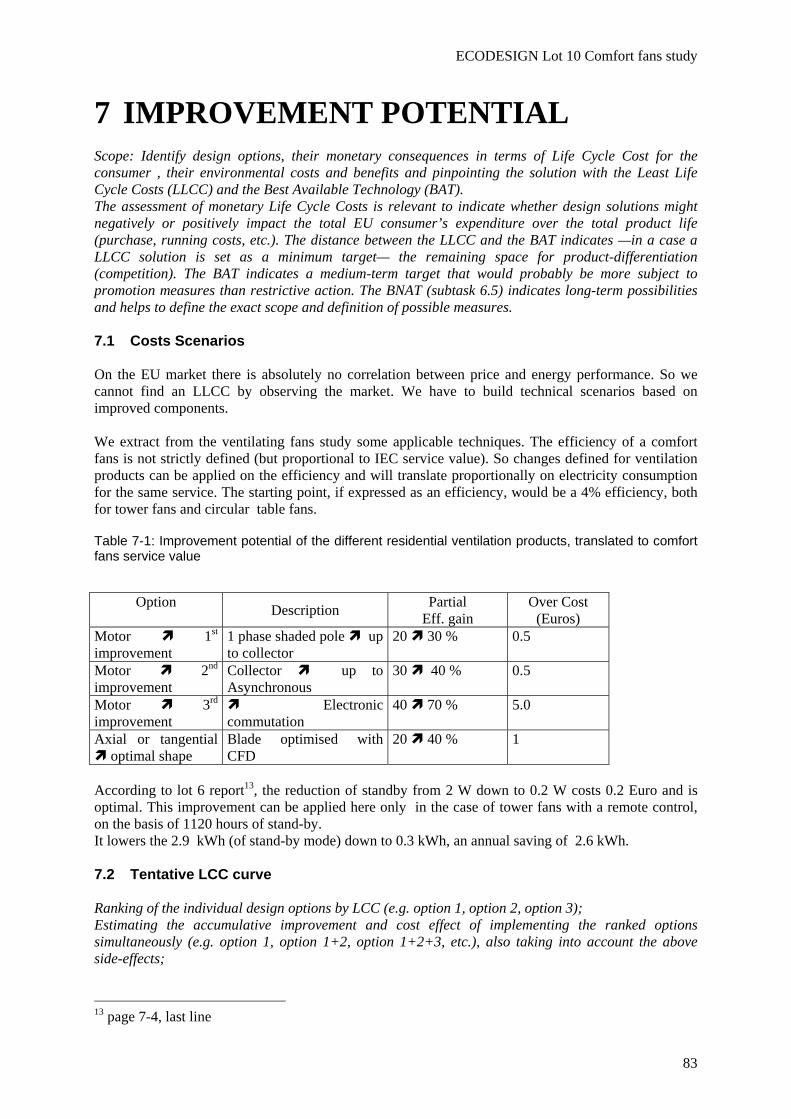
ECODESIGN Lot 10 Comfort fans study
83
7 IMPROVEMENT POTENTIAL Scope: Identify design options, their monetary consequences in terms of Life Cycle Cost for the consumer , their environmental costs and benefits and pinpointing the solution with the Least Life Cycle Costs (LLCC) and the Best Available Technology (BAT). The assessment of monetary Life Cycle Costs is relevant to indicate whether design solutions might negatively or positively impact the total EU consumer’s expenditure over the total product life (purchase, running costs, etc.). The distance between the LLCC and the BAT indicates —in a case a LLCC solution is set as a minimum target— the remaining space for product-differentiation (competition). The BAT indicates a medium-term target that would probably be more subject to promotion measures than restrictive action. The BNAT (subtask 6.5) indicates long-term possibilities and helps to define the exact scope and definition of possible measures. 7.1 Costs Scenarios On the EU market there is absolutely no correlation between price and energy performance. So we cannot find an LLCC by observing the market. We have to build technical scenarios based on improved components. We extract from the ventilating fans study some applicable techniques. The efficiency of a comfort fans is not strictly defined (but proportional to IEC service value). So changes defined for ventilation products can be applied on the efficiency and will translate proportionally on electricity consumption for the same service. The starting point, if expressed as an efficiency, would be a 4% efficiency, both for tower fans and circular table fans.
Table 7-1: Improvement potential of the different residential ventilation products, translated to comfort fans service value
Option Description Partial
Eff. gain Over Cost
(Euros) Motor 1st improvement
1 phase shaded pole up to collector
20 30 % 0.5
Motor 2nd improvement
Collector up to Asynchronous
30 40 % 0.5
Motor 3rd improvement
Electronic commutation
40 70 % 5.0
Axial or tangential optimal shape
Blade optimised with CFD
20 40 % 1
According to lot 6 report13, the reduction of standby from 2 W down to 0.2 W costs 0.2 Euro and is optimal. This improvement can be applied here only in the case of tower fans with a remote control, on the basis of 1120 hours of stand-by. It lowers the 2.9 kWh (of stand-by mode) down to 0.3 kWh, an annual saving of 2.6 kWh. 7.2 Tentative LCC curve Ranking of the individual design options by LCC (e.g. option 1, option 2, option 3); Estimating the accumulative improvement and cost effect of implementing the ranked options simultaneously (e.g. option 1, option 1+2, option 1+2+3, etc.), also taking into account the above side-effects;
13 page 7-4, last line
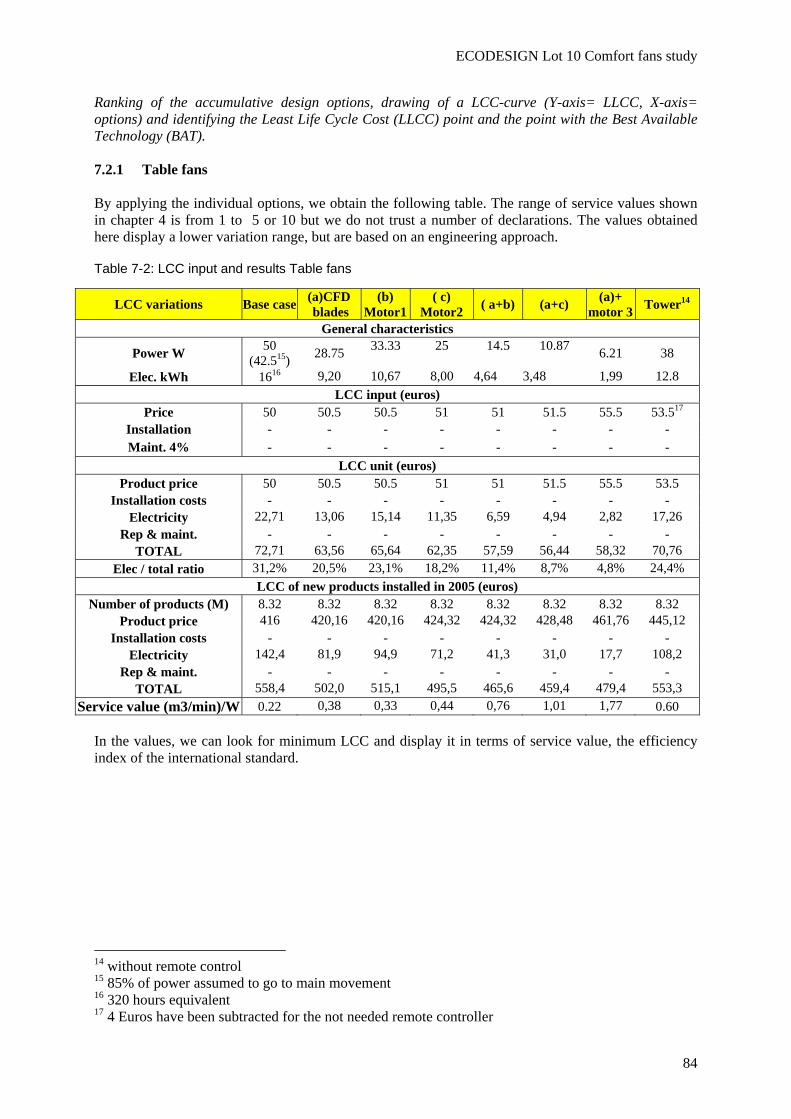
ECODESIGN Lot 10 Comfort fans study
84
Ranking of the accumulative design options, drawing of a LCC-curve (Y-axis= LLCC, X-axis= options) and identifying the Least Life Cycle Cost (LLCC) point and the point with the Best Available Technology (BAT). 7.2.1 Table fans By applying the individual options, we obtain the following table. The range of service values shown in chapter 4 is from 1 to 5 or 10 but we do not trust a number of declarations. The values obtained here display a lower variation range, but are based on an engineering approach.
Table 7-2: LCC input and results Table fans
LCC variations Base case (a)CFD blades
(b) Motor1
( c) Motor2 ( a+b) (a+c) (a)+
motor 3 Tower14
General characteristics
Power W 50 (42.515) 28.75 33.33 25 14.5 10.87 6.21 38
Elec. kWh 1616 9,20 10,67 8,00 4,64 3,48 1,99 12.8 LCC input (euros)
Price 50 50.5 50.5 51 51 51.5 55.5 53.517 Installation - - - - - - - - Maint. 4% - - - - - - - -
LCC unit (euros) Product price 50 50.5 50.5 51 51 51.5 55.5 53.5
Installation costs - - - - - - - - Electricity 22,71 13,06 15,14 11,35 6,59 4,94 2,82 17,26
Rep & maint. - - - - - - - - TOTAL 72,71 63,56 65,64 62,35 57,59 56,44 58,32 70,76
Elec / total ratio 31,2% 20,5% 23,1% 18,2% 11,4% 8,7% 4,8% 24,4% LCC of new products installed in 2005 (euros)
Number of products (M) 8.32 8.32 8.32 8.32 8.32 8.32 8.32 8.32 Product price 416 420,16 420,16 424,32 424,32 428,48 461,76 445,12
Installation costs - - - - - - - - Electricity 142,4 81,9 94,9 71,2 41,3 31,0 17,7 108,2
Rep & maint. - - - - - - - - TOTAL 558,4 502,0 515,1 495,5 465,6 459,4 479,4 553,3
Service value (m3/min)/W 0.22 0,38 0,33 0,44 0,76 1,01 1,77 0.60 In the values, we can look for minimum LCC and display it in terms of service value, the efficiency index of the international standard.
14 without remote control 15 85% of power assumed to go to main movement 16 320 hours equivalent 17 4 Euros have been subtracted for the not needed remote controller
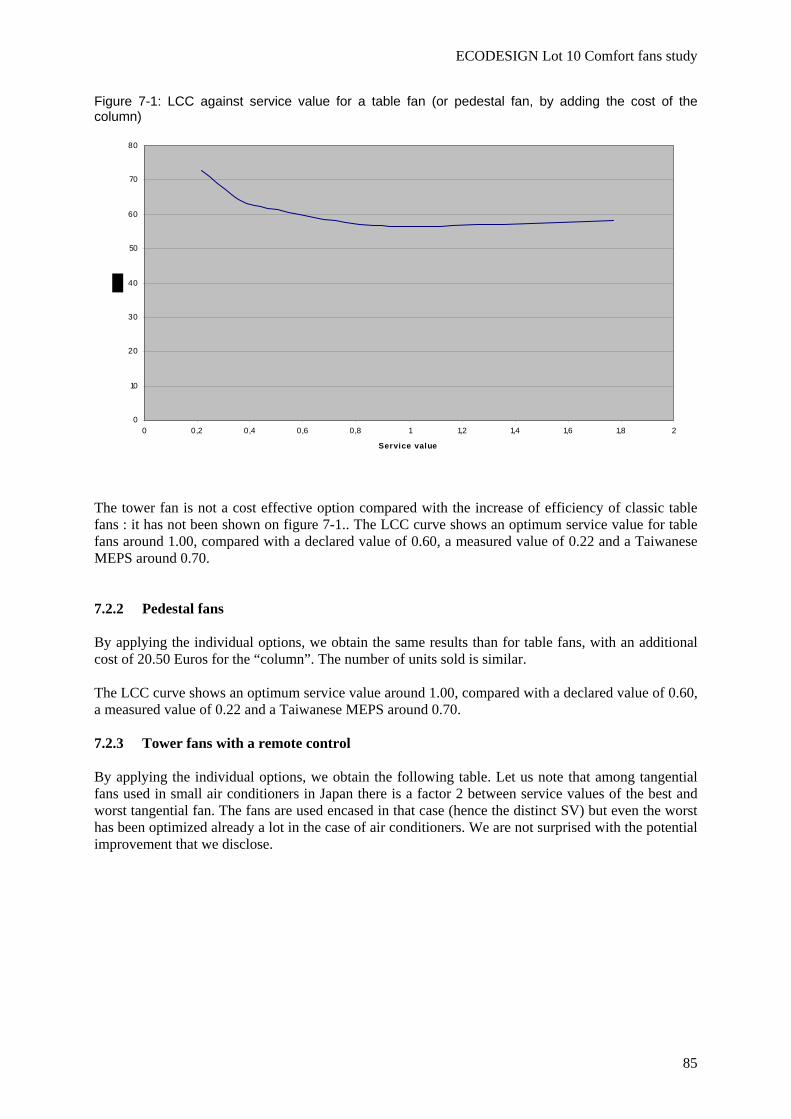
ECODESIGN Lot 10 Comfort fans study
85
Figure 7-1: LCC against service value for a table fan (or pedestal fan, by adding the cost of the column)
0
10
20
30
40
50
60
70
80
0 0,2 0,4 0,6 0,8 1 1,2 1,4 1,6 1,8 2
Service value
The tower fan is not a cost effective option compared with the increase of efficiency of classic table fans : it has not been shown on figure 7-1.. The LCC curve shows an optimum service value for table fans around 1.00, compared with a declared value of 0.60, a measured value of 0.22 and a Taiwanese MEPS around 0.70. 7.2.2 Pedestal fans By applying the individual options, we obtain the same results than for table fans, with an additional cost of 20.50 Euros for the “column”. The number of units sold is similar. The LCC curve shows an optimum service value around 1.00, compared with a declared value of 0.60, a measured value of 0.22 and a Taiwanese MEPS around 0.70. 7.2.3 Tower fans with a remote control By applying the individual options, we obtain the following table. Let us note that among tangential fans used in small air conditioners in Japan there is a factor 2 between service values of the best and worst tangential fan. The fans are used encased in that case (hence the distinct SV) but even the worst has been optimized already a lot in the case of air conditioners. We are not surprised with the potential improvement that we disclose.
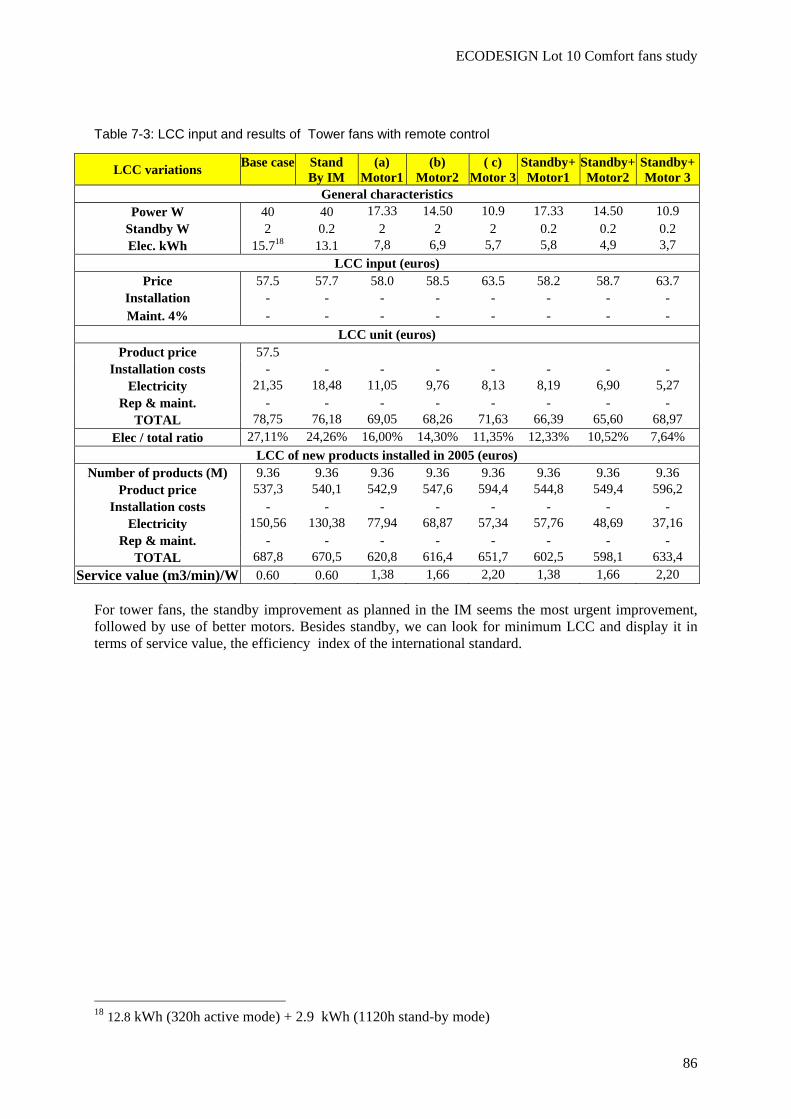
ECODESIGN Lot 10 Comfort fans study
86
Table 7-3: LCC input and results of Tower fans with remote control
LCC variations Base case
Stand By IM
(a) Motor1
(b) Motor2
( c) Motor 3
Standby+ Motor1
Standby+ Motor2
Standby+Motor 3
General characteristics Power W 40 40 17.33 14.50 10.9 17.33 14.50 10.9
Standby W 2 0.2 2 2 2 0.2 0.2 0.2 Elec. kWh 15.718 13.1 7,8 6,9 5,7 5,8 4,9 3,7
LCC input (euros) Price 57.5 57.7 58.0 58.5 63.5 58.2 58.7 63.7
Installation - - - - - - - - Maint. 4% - - - - - - - -
LCC unit (euros) Product price 57.5
Installation costs - - - - - - - - Electricity 21,35 18,48 11,05 9,76 8,13 8,19 6,90 5,27
Rep & maint. - - - - - - - - TOTAL 78,75 76,18 69,05 68,26 71,63 66,39 65,60 68,97
Elec / total ratio 27,11% 24,26% 16,00% 14,30% 11,35% 12,33% 10,52% 7,64% LCC of new products installed in 2005 (euros)
Number of products (M) 9.36 9.36 9.36 9.36 9.36 9.36 9.36 9.36 Product price 537,3 540,1 542,9 547,6 594,4 544,8 549,4 596,2
Installation costs - - - - - - - - Electricity 150,56 130,38 77,94 68,87 57,34 57,76 48,69 37,16
Rep & maint. - - - - - - - - TOTAL 687,8 670,5 620,8 616,4 651,7 602,5 598,1 633,4
Service value (m3/min)/W 0.60 0.60 1,38 1,66 2,20 1,38 1,66 2,20 For tower fans, the standby improvement as planned in the IM seems the most urgent improvement, followed by use of better motors. Besides standby, we can look for minimum LCC and display it in terms of service value, the efficiency index of the international standard.
18 12.8 kWh (320h active mode) + 2.9 kWh (1120h stand-by mode)
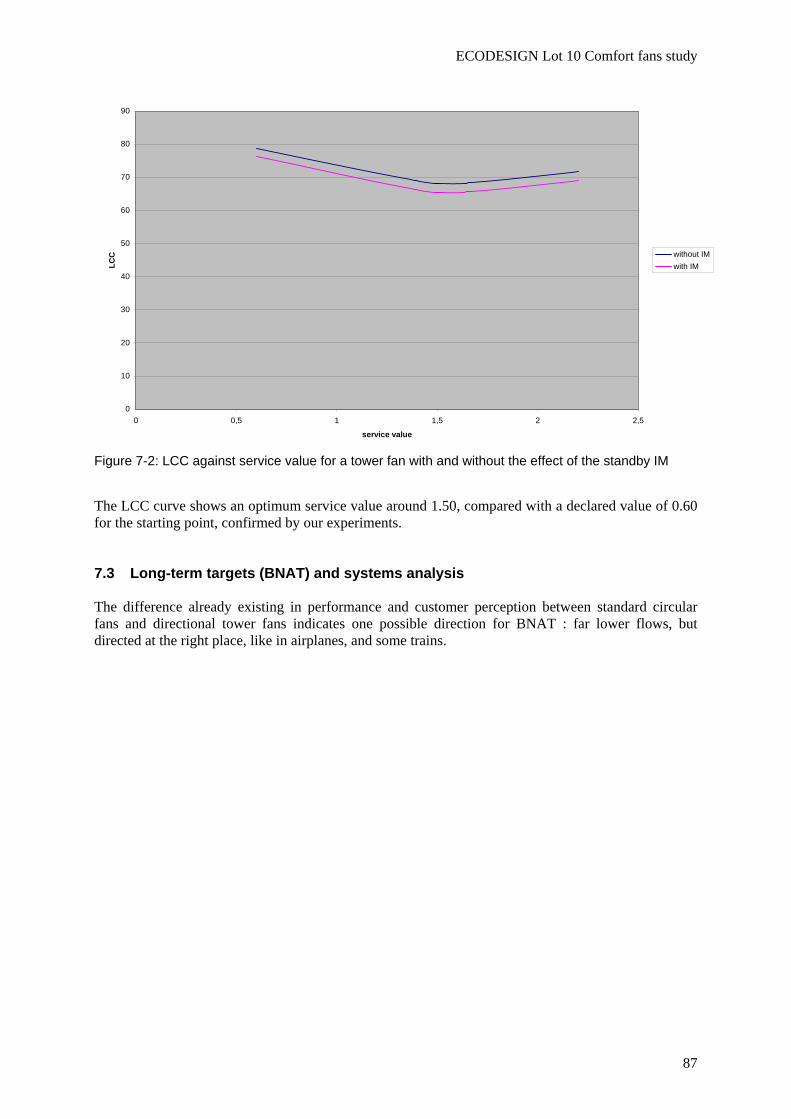
ECODESIGN Lot 10 Comfort fans study
87
0
10
20
30
40
50
60
70
80
90
0 0,5 1 1,5 2 2,5
service value
LCC without IM
with IM
Figure 7-2: LCC against service value for a tower fan with and without the effect of the standby IM
The LCC curve shows an optimum service value around 1.50, compared with a declared value of 0.60 for the starting point, confirmed by our experiments. 7.3 Long-term targets (BNAT) and systems analysis The difference already existing in performance and customer perception between standard circular fans and directional tower fans indicates one possible direction for BNAT : far lower flows, but directed at the right place, like in airplanes, and some trains.
ECODESIGN Lot 10 Comfort fans study
88
Task 7 summary On the EU market there is absolutely no correlation between price and energy performance. So we cannot find an LLCC by observing the market. We have to build technical scenarios based on improved components. The LCC curve shows an optimum service value for table and pedestal fans around 1.00, compared with a declared value of 0.60, a measured value of 0.22 and a Taiwanese MEPS around 0.70. For tower fans, the standby improvement seems the most urgent improvement, followed by use of better motors. The LCC curve shows an optimum service value around 1.50, compared with a declared value of 0.60 for the starting point, confirmed by our experiments. The difference already existing in performance and customer perception between standard circular fans and directional tower fans indicates one possible direction for BNAT : far lower flows, but directed at the right place, like in airplanes, and some trains.
ECODESIGN Lot 10 Comfort fans study
89
8 SCENARIO-, POLICY-, IMPACT- AND SENSITIVITY ANALYSIS
Scope: This task summarizes and totals the outcomes of all previous tasks. It looks at suitable policy means to achieve the potential e.g. implementing LLCC as a minimum and BAT as a promotional target, using legislative or voluntary agreements, labelling and promotion. It draws up scenarios 1990 – 2020 quantifying the improvements that can be achieved vs. a Business-as-Usual scenario and compares the outcomes with EU environmental targets, the societal costs if the environmental impact reduction would have to be achieved in another way, etc. It makes an estimate of the impact on consumers (purchasing power, societal costs) and industry (employment, profitability, competitiveness, investment level, etc.) as described in Appendix 2 of the Directive, explicitly describing and taking into account the typical design cycle (platform change) in a product sector. Finally, in a sensitivity analysis of the main parameters it studies the robustness of the outcome. 8.1 Introduction to scenarios General situation of stakeholders, standardisation, foreign measures The equipment in question is manufactured outside of the EU (we have located one hundred factories in China) . There is a certain “branding” of imported equipment by EU brands but none of them has accepted to contribute to the study, despite of numerous contacts. The brands are relatively concentrated but there is also non branded equipment. The “big brands” which appear seem not to be manufacturers themselves but want to offer a complete directory to customers. No performance declaration mentions the relevant IEC standard. The consultant made various approaches to balance the lack of contribution of importers: generating a large data base of declared performance; purchasing equipment, checking some performance in conditions close to the IEC standard, establishing the BOM of purchased equipment. The declarations of performance of manufacturers or importers are largely in contradiction with measured values. These contradictions make more difficult the establishment of a labelling system that would inform the consumers. It makes also very difficult the setting of a MEPS that would be needed (we will see the figures hereunder). In those conditions, the proposal is to set a provisional MEPS based on Taiwanese MEPS (the continental China MEPS is not a real performance MEPS, but more a design standard). However, the implementation of the minimum requirements at the level of the Taiwanese MEPS will help Europe to save 0.85 TWh by 2020, corresponding to 0.37 Mt of CO2. A second step can be taken in the context of the revision of the measure when a proper EN standard including part load is available. This will allow Europe to take an important step towards savings while simultaneously developing the knowledge of actual performance for a tougher measure. Scope of potential actions The scope of this study is limited to “comfort fans”. This name is suggested to represent all subtypes of products in legislation and on name plates, in a way allowing to differentiate them from ventilation fans. Some commercial names of the subtypes identified are the following ones:
- Table-desk fan, - Wall fan, - Floor fan, - Pedestal fan,
ECODESIGN Lot 10 Comfort fans study
90
- Ceiling fan, - Tower fan, - Box fans.
The existing limit of 125 W found in the Prodcom categories corresponds to the residential range of products, that can be used in many other places than dwellings. The options shall be applied to fans that could be declared under code Prodcom 29.71.15.30, i.e. Table, floor, wall, window, ceiling or roof fans, with a self contained electric motor of an output <= 125 W (output being understood as electrical power), which includes tower fans, box fans, either marketed for households or for any other purchaser. Do we have suitable testing standards? The main testing standard is an IEC standard, not yet transformed into a CENELEC standard, but completely applicable : IEC 60879 “Performance and construction of electric circulating fans and regulators”. It is interesting to note that tower fans are not explicitly covered but the standard can be applied anyway. However we suggest that a CENELEC version of IEC 60879 is mandated by the Commission (with explicit inclusion of the tower fans and optional part load testing) and that a significant number of tests are ordered to one laboratory to investigate all testing issues and to be certain that the market has been largely cleaned from false declarations. In three to five years, we could obtain from CENELEC committees a development of the procedures defined in the testing standard IEC 879, for technical reasons (adaptation to EU market) and also to generate some EU know how to test those products. This would allow : - generating an EU standard completely compatible with the existing IEC, - having at least two labs in Europe, - indicating applicability to "tower fans" (not explicitly covered in IEC), - indicating that the control is part of the product, and so providing part load test options, which could lead to some improvements, - demanding to report not only total flow but also velocities, so as to enable comparison of the tower fans which do not move the air in the whole room as opposed to other types of fans. The noise can be measured as well. ISO 10302:1996 and EN 60704-2-7 are both available for the purpose. Can we do independent testing in Europe, despite of lack of manufacturers? IMQ is an EU laboratory certified for testing comfort fans, and this gives us the possibility of making calls for bids, and to have at least one answer. The selected laboratory, whoever it is, should start a compliance campaign just to check manufacturers declarations on which we have emitted large doubts. Energy and environmental study : the necessity of introducing actions Sales of comfort fans in the EU have been increasing from 10 to 25 million units from 2000 to 2005, with a peak value for sales in 2004 at 35 million units, the year after the heat wave. It is interesting to note that the effect of the heat wave seems to show that the same phenomena occurred for comfort fans as for air conditioners: demand in 2003 was higher than the stock available and sales exploded really in 2004, when adding the fear of a new heat wave to the 2003 demand not answered. 2005 sales are then comparable to 2003 sales. Frequency of the different categories are 29 % for the table, 29 % for the pedestal fans (basically the same product) but more surprisingly 33 % for tower fans. Table 8.1 gives intermediate values.
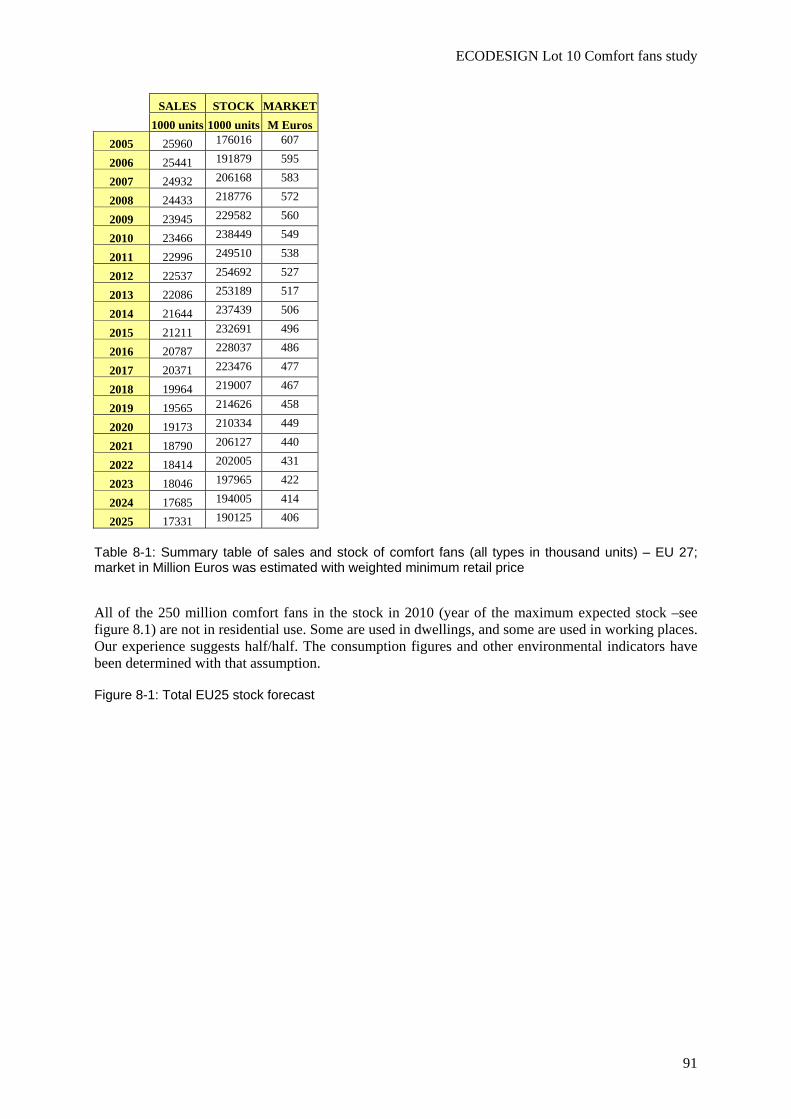
ECODESIGN Lot 10 Comfort fans study
91
SALES STOCK MARKET 1000 units 1000 units M Euros
2005 25960 176016 607
2006 25441 191879 595
2007 24932 206168 583
2008 24433 218776 572
2009 23945 229582 560
2010 23466 238449 549
2011 22996 249510 538
2012 22537 254692 527
2013 22086 253189 517
2014 21644 237439 506
2015 21211 232691 496
2016 20787 228037 486
2017 20371 223476 477
2018 19964 219007 467
2019 19565 214626 458
2020 19173 210334 449
2021 18790 206127 440
2022 18414 202005 431
2023 18046 197965 422
2024 17685 194005 414
2025 17331 190125 406
Table 8-1: Summary table of sales and stock of comfort fans (all types in thousand units) – EU 27; market in Million Euros was estimated with weighted minimum retail price
All of the 250 million comfort fans in the stock in 2010 (year of the maximum expected stock –see figure 8.1) are not in residential use. Some are used in dwellings, and some are used in working places. Our experience suggests half/half. The consumption figures and other environmental indicators have been determined with that assumption.
Figure 8-1: Total EU25 stock forecast
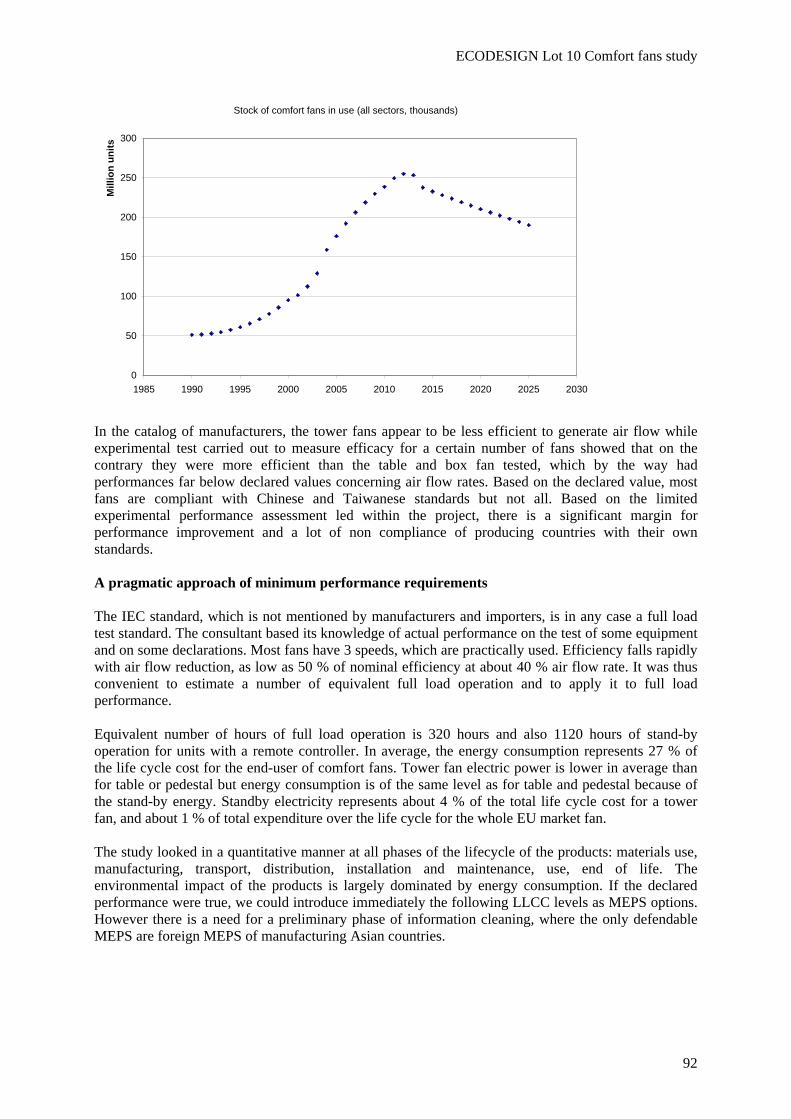
ECODESIGN Lot 10 Comfort fans study
92
Stock of comfort fans in use (all sectors, thousands)
0
50
100
150
200
250
300
1985 1990 1995 2000 2005 2010 2015 2020 2025 2030
Mill
ion
units
In the catalog of manufacturers, the tower fans appear to be less efficient to generate air flow while experimental test carried out to measure efficacy for a certain number of fans showed that on the contrary they were more efficient than the table and box fan tested, which by the way had performances far below declared values concerning air flow rates. Based on the declared value, most fans are compliant with Chinese and Taiwanese standards but not all. Based on the limited experimental performance assessment led within the project, there is a significant margin for performance improvement and a lot of non compliance of producing countries with their own standards. A pragmatic approach of minimum performance requirements The IEC standard, which is not mentioned by manufacturers and importers, is in any case a full load test standard. The consultant based its knowledge of actual performance on the test of some equipment and on some declarations. Most fans have 3 speeds, which are practically used. Efficiency falls rapidly with air flow reduction, as low as 50 % of nominal efficiency at about 40 % air flow rate. It was thus convenient to estimate a number of equivalent full load operation and to apply it to full load performance. Equivalent number of hours of full load operation is 320 hours and also 1120 hours of stand-by operation for units with a remote controller. In average, the energy consumption represents 27 % of the life cycle cost for the end-user of comfort fans. Tower fan electric power is lower in average than for table or pedestal but energy consumption is of the same level as for table and pedestal because of the stand-by energy. Standby electricity represents about 4 % of the total life cycle cost for a tower fan, and about 1 % of total expenditure over the life cycle for the whole EU market fan. The study looked in a quantitative manner at all phases of the lifecycle of the products: materials use, manufacturing, transport, distribution, installation and maintenance, use, end of life. The environmental impact of the products is largely dominated by energy consumption. If the declared performance were true, we could introduce immediately the following LLCC levels as MEPS options. However there is a need for a preliminary phase of information cleaning, where the only defendable MEPS are foreign MEPS of manufacturing Asian countries.
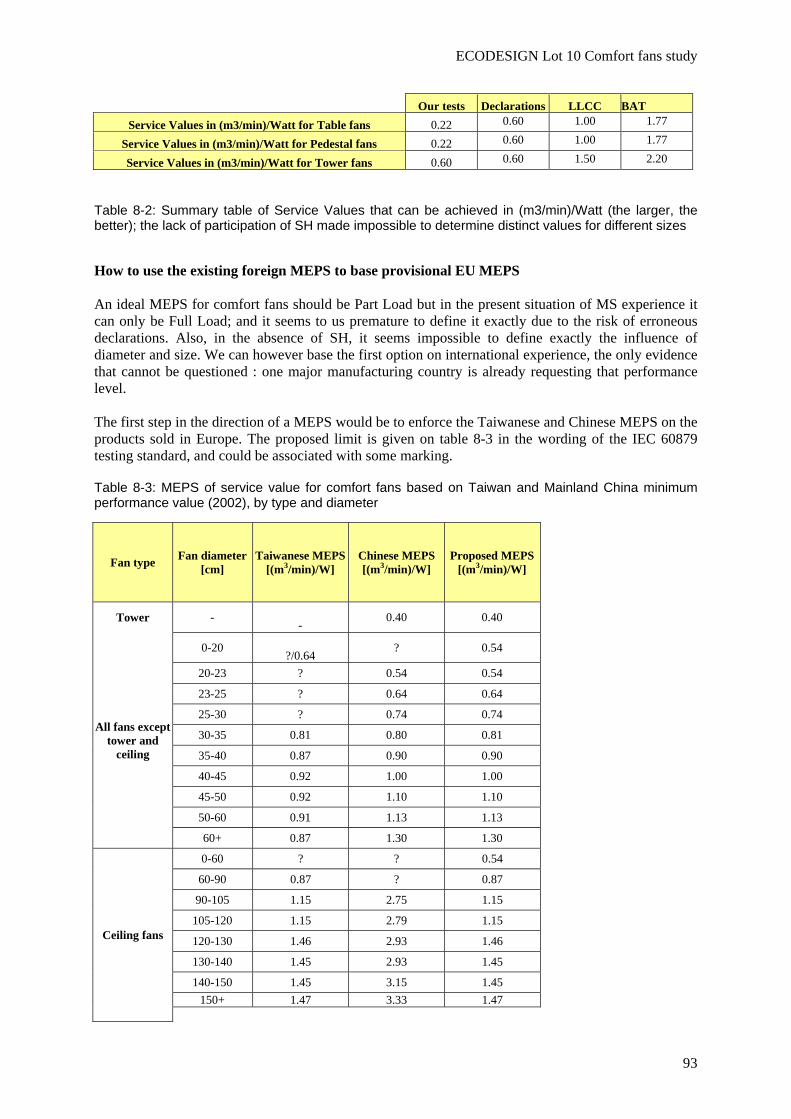
ECODESIGN Lot 10 Comfort fans study
93
Our tests Declarations LLCC BAT Service Values in (m3/min)/Watt for Table fans 0.22 0.60 1.00 1.77
Service Values in (m3/min)/Watt for Pedestal fans 0.22 0.60 1.00 1.77
Service Values in (m3/min)/Watt for Tower fans 0.60 0.60 1.50 2.20
Table 8-2: Summary table of Service Values that can be achieved in (m3/min)/Watt (the larger, the better); the lack of participation of SH made impossible to determine distinct values for different sizes
How to use the existing foreign MEPS to base provisional EU MEPS An ideal MEPS for comfort fans should be Part Load but in the present situation of MS experience it can only be Full Load; and it seems to us premature to define it exactly due to the risk of erroneous declarations. Also, in the absence of SH, it seems impossible to define exactly the influence of diameter and size. We can however base the first option on international experience, the only evidence that cannot be questioned : one major manufacturing country is already requesting that performance level. The first step in the direction of a MEPS would be to enforce the Taiwanese and Chinese MEPS on the products sold in Europe. The proposed limit is given on table 8-3 in the wording of the IEC 60879 testing standard, and could be associated with some marking.
Table 8-3: MEPS of service value for comfort fans based on Taiwan and Mainland China minimum performance value (2002), by type and diameter
Fan type Fan diameter [cm]
Taiwanese MEPS [(m3/min)/W]
Chinese MEPS [(m3/min)/W]
Proposed MEPS [(m3/min)/W]
Tower - -
0.40 0.40
All fans except tower and
ceiling
0-20 ?/0.64
? 0.54
20-23 ? 0.54 0.54
23-25 ? 0.64 0.64
25-30 ? 0.74 0.74
30-35 0.81 0.80 0.81
35-40 0.87 0.90 0.90
40-45 0.92 1.00 1.00
45-50 0.92 1.10 1.10
50-60 0.91 1.13 1.13
60+ 0.87 1.30 1.30
Ceiling fans
0-60 ? ? 0.54
60-90 0.87 ? 0.87
90-105 1.15 2.75 1.15
105-120 1.15 2.79 1.15
120-130 1.46 2.93 1.46
130-140 1.45 2.93 1.45
140-150 1.45 3.15 1.45 150+ 1.47 3.33 1.47
ECODESIGN Lot 10 Comfort fans study
94
Noise levels of the Chinese standards can be readily applied in Europe. The international standard is very clear about declarations and tolerances and can be readily applied to market control. Can we have a normal and immediate energy labeling of those products? The magnitude of the discrepancies discovered by the consultant leads us to reject the attribution of the prestigious EU energy label (from A to G) on the basis of the present manufacturers and importers declarations. Only when information has been cleaned, this will become possible. In the meanwhile since the IEC 879 standard says only that “service value” (which is a good Energy Efficiency Index) and the “rated air delivery” (flow rate) “shall be supplied on request” and that very few manufacturers really indicate it at the time of sale, a temporary requirement should transform this into an obligation. It will be revised when a real labeling of the product becomes possible. We think that the market can be cleaned from false information in two years, if a compliance study is ordered simultaneously to one testing laboratory. At the same time the EN standard can be mandated and may benefit of the tests being carried out at the same time. Standby and off mode of comfort fans Horizontal option on standby and off mode is applicable and cost effective (in fact slightly higher performance may be cost effective as well). There is a growing segment of fans with a remote control (tower) and a standby consumption. No technical problem foreseen in applying the option. Discussion of further possibilities of MEPS and labelling After some time of implementation of the provisional MEPS, there will be a need for a revision. The revised EU MEPS should be Part load based. This MEPS has to be designed when the real performance of equipment is known, typically two years after the application of labeling and first MEPS. It could lead to the LLCC in a period like three years and to BAT by steps in 2015. We should say that it is difficult to outline it due to the presumption of erroneous declarations today. Even the first MEPS, although based on foreign experience (Taiwan) could be put in question if the manufacturers declarations change substantially when they start referring to the international IEC standard instead of mentioning no specific testing standard. Noise levels being evenly distributed between 40 and 50 dBA, and due to the existence of a recognized international standard, we can request that the products are under 45 dBA at that time. However the availability of noise data is so small that no requirement on noise can be published immediately with certainty. 8.2 Scenario considered in the study : obtaining correct information on the products
and applying light requirements Definitions and scope. A comfort fan is any product designed to give a velocity to the air inside of a room in order to improve human comfort. Among them tower fans are defined by the feature for moving the air : a cross-flow (tangential) turbine. Among the other fans, ceiling fans are defined by the system that allows an horizontal operation: a hanging system with fixation on the ceiling. The scope of the study is limited to comfort fans with a power under 125W. First requirement. No product in the scope shall be put on the market if it does not bear a marking plate with “electricity use” in Watt, “service value” in (m3/minute)/W and “rated air delivery” in m3/minute with the indication of the testing standard IEC 879, and “noise” in dBA and the indication of the testing standard used : ISO 10302:1996 or EN 60704-2-7. This shall apply at the latest two years after publication of the requirement.
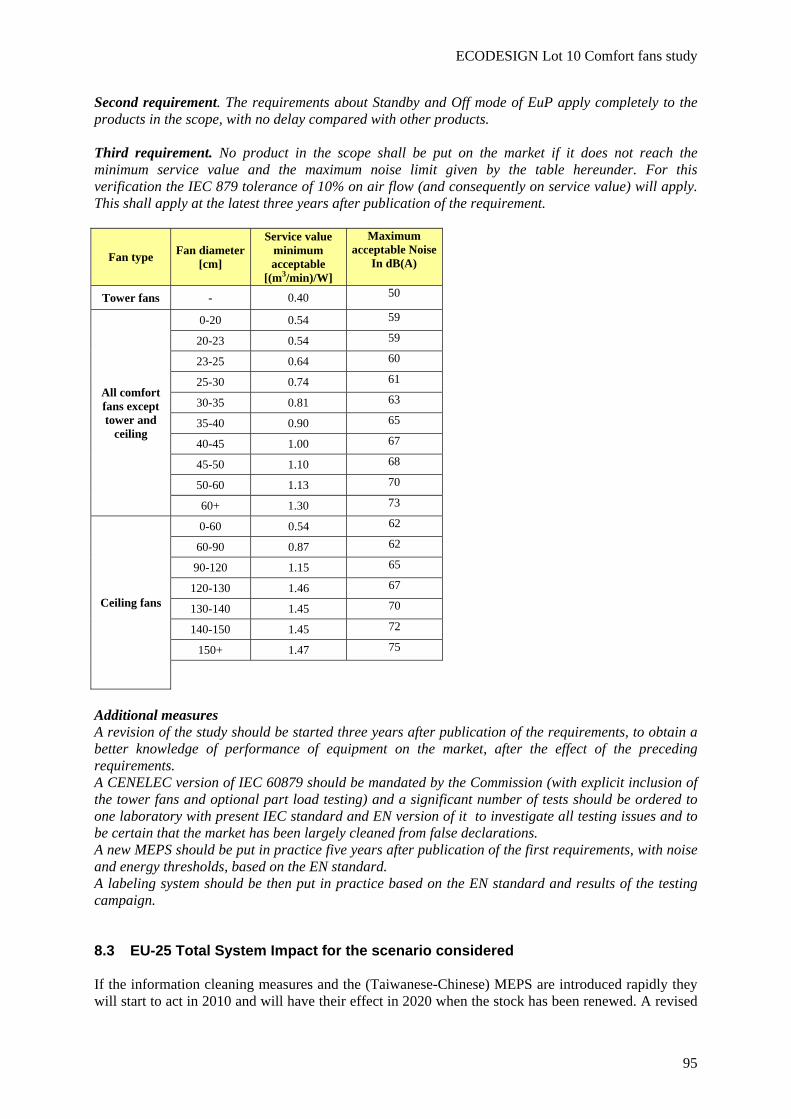
ECODESIGN Lot 10 Comfort fans study
95
Second requirement. The requirements about Standby and Off mode of EuP apply completely to the products in the scope, with no delay compared with other products. Third requirement. No product in the scope shall be put on the market if it does not reach the minimum service value and the maximum noise limit given by the table hereunder. For this verification the IEC 879 tolerance of 10% on air flow (and consequently on service value) will apply. This shall apply at the latest three years after publication of the requirement.
Fan type Fan diameter [cm]
Service value minimum acceptable
[(m3/min)/W]
Maximum acceptable Noise
In dB(A)
Tower fans - 0.40 50
All comfort fans except tower and
ceiling
0-20 0.54 59
20-23 0.54 59
23-25 0.64 60
25-30 0.74 61
30-35 0.81 63
35-40 0.90 65
40-45 1.00 67
45-50 1.10 68
50-60 1.13 70
60+ 1.30 73
Ceiling fans
0-60 0.54 62
60-90 0.87 62
90-120 1.15 65
120-130 1.46 67
130-140 1.45 70
140-150 1.45 72
150+ 1.47 75
Additional measures A revision of the study should be started three years after publication of the requirements, to obtain a better knowledge of performance of equipment on the market, after the effect of the preceding requirements. A CENELEC version of IEC 60879 should be mandated by the Commission (with explicit inclusion of the tower fans and optional part load testing) and a significant number of tests should be ordered to one laboratory with present IEC standard and EN version of it to investigate all testing issues and to be certain that the market has been largely cleaned from false declarations. A new MEPS should be put in practice five years after publication of the first requirements, with noise and energy thresholds, based on the EN standard. A labeling system should be then put in practice based on the EN standard and results of the testing campaign. 8.3 EU-25 Total System Impact for the scenario considered If the information cleaning measures and the (Taiwanese-Chinese) MEPS are introduced rapidly they will start to act in 2010 and will have their effect in 2020 when the stock has been renewed. A revised
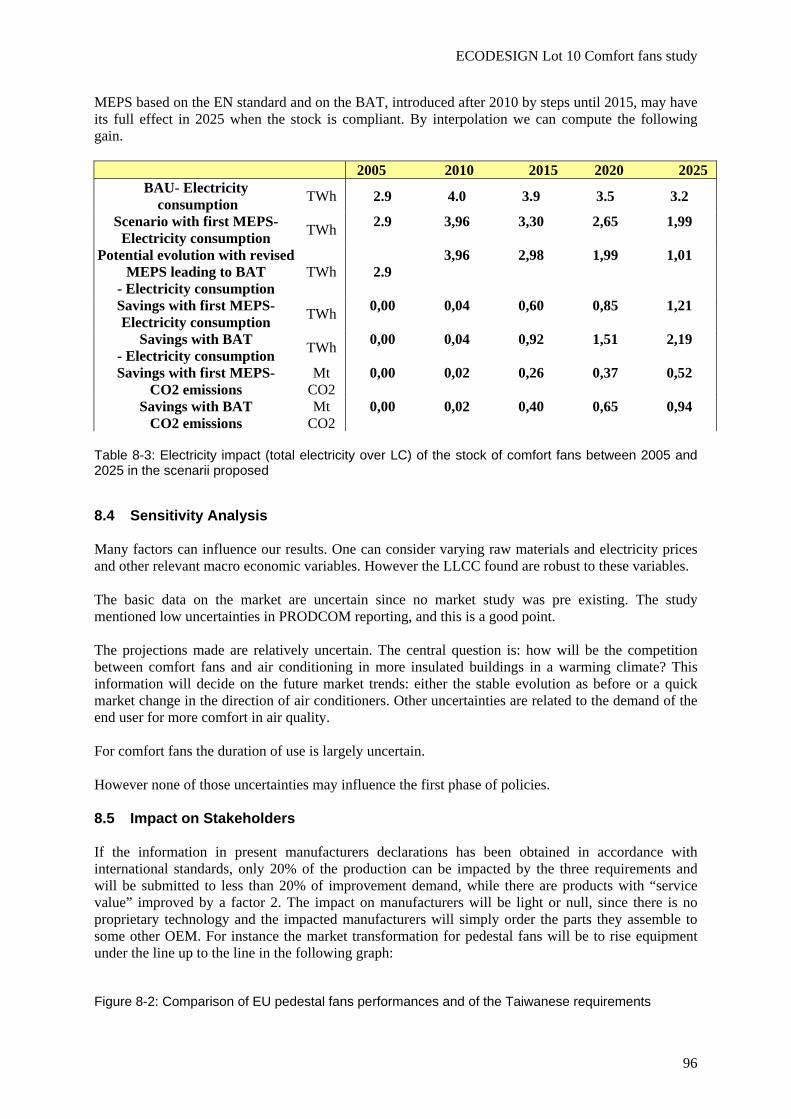
ECODESIGN Lot 10 Comfort fans study
96
MEPS based on the EN standard and on the BAT, introduced after 2010 by steps until 2015, may have its full effect in 2025 when the stock is compliant. By interpolation we can compute the following gain.
2005 2010 2015 2020 2025 BAU- Electricity
consumption TWh 2.9 4.0 3.9 3.5 3.2
Scenario with first MEPS- Electricity consumption TWh 2.9 3,96 3,30 2,65 1,99
Potential evolution with revised MEPS leading to BAT
- Electricity consumption TWh 2.9
3,96 2,98 1,99 1,01
Savings with first MEPS- Electricity consumption TWh 0,00 0,04 0,60 0,85 1,21
Savings with BAT - Electricity consumption TWh 0,00 0,04 0,92 1,51 2,19
Savings with first MEPS- CO2 emissions
Mt CO2
0,00 0,02 0,26 0,37 0,52
Savings with BAT CO2 emissions
Mt CO2
0,00 0,02 0,40 0,65 0,94
Table 8-3: Electricity impact (total electricity over LC) of the stock of comfort fans between 2005 and 2025 in the scenarii proposed
8.4 Sensitivity Analysis Many factors can influence our results. One can consider varying raw materials and electricity prices and other relevant macro economic variables. However the LLCC found are robust to these variables. The basic data on the market are uncertain since no market study was pre existing. The study mentioned low uncertainties in PRODCOM reporting, and this is a good point. The projections made are relatively uncertain. The central question is: how will be the competition between comfort fans and air conditioning in more insulated buildings in a warming climate? This information will decide on the future market trends: either the stable evolution as before or a quick market change in the direction of air conditioners. Other uncertainties are related to the demand of the end user for more comfort in air quality. For comfort fans the duration of use is largely uncertain. However none of those uncertainties may influence the first phase of policies. 8.5 Impact on Stakeholders If the information in present manufacturers declarations has been obtained in accordance with international standards, only 20% of the production can be impacted by the three requirements and will be submitted to less than 20% of improvement demand, while there are products with “service value” improved by a factor 2. The impact on manufacturers will be light or null, since there is no proprietary technology and the impacted manufacturers will simply order the parts they assemble to some other OEM. For instance the market transformation for pedestal fans will be to rise equipment under the line up to the line in the following graph:
Figure 8-2: Comparison of EU pedestal fans performances and of the Taiwanese requirements
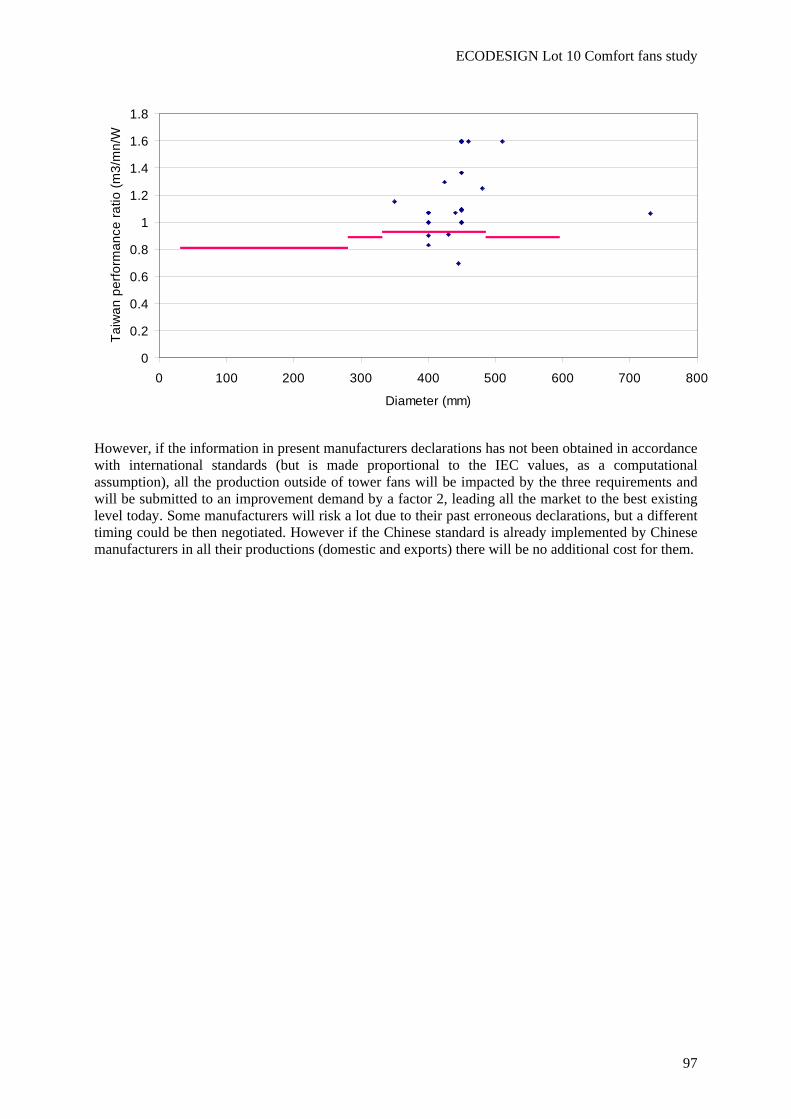
ECODESIGN Lot 10 Comfort fans study
97
0
0.2
0.4
0.6
0.8
1
1.2
1.4
1.6
1.8
0 100 200 300 400 500 600 700 800
Diameter (mm)
Taiw
an p
erfo
rman
ce ra
tio (m
3/m
n/W
However, if the information in present manufacturers declarations has not been obtained in accordance with international standards (but is made proportional to the IEC values, as a computational assumption), all the production outside of tower fans will be impacted by the three requirements and will be submitted to an improvement demand by a factor 2, leading all the market to the best existing level today. Some manufacturers will risk a lot due to their past erroneous declarations, but a different timing could be then negotiated. However if the Chinese standard is already implemented by Chinese manufacturers in all their productions (domestic and exports) there will be no additional cost for them.
ECODESIGN Lot 10 Comfort fans study
98
References R1-Definition of product and standards 2005/32/EC, Ecodesign Directive, 2005, European Parliament, Directive 2005/32/EC of the EP and of the Council of 6 July 2005 establishing a framework for the setting of Ecodesign requirements for energy-using products and amending council directive 92/42/EEC and directives 96/57/EC and 2000/55/EC of the European Parliament, Official Journal of the European Communities, L 1/65, Vol. 46, 4 January 2003
Adnot, 2007, Adnot J., Rivière P. et al., 2007, Improving Public Health Responses to extreme weather/heat-waves EuroHEAT Euroheat project, Indoor heat protection measures and human health, WHO, to be published in 2007.
Nexant, 2003, “Review of Appliance Testing Capabilities in South Asia”, prepared for USAID-SARI, www.sari-energy.org
FTC, 2006, FEDERAL TRADE COMMISSION 16 CFR Part 305-RIN 3084–AA74, see 78057 Federal Register / Vol. 71, No. 249 / Thursday, December 28, 2006 / Rules and Regulations, page 78057
R2-Economic and market analysis
R3-Consumer behaviour and local infrastructure AGO, 2006, 2005 Intrusive Residential Standby Survey Report March 2006, Report for E3 2006/02 Prepared by Energy Efficient Strategies An Initiative of the Ministerial Council on Energy forming part of the Australian National Framework forEnergy Efficiency and the New Zealand National Energy Efficiency and Conservation Strategy Arens, 1997, Arens E., Tengfang X., Katsuhiro M., et al 1997. A study of occupants cooling by personally controlled air movement. Energy and Buildings. Vol. 27, pp 45-59
ASHRAE, 2004, ANSI/ASHRAE Standard 55-2004, Thermal Environmental Conditions for Human Occupancy, Atlanta: American Society of Heating, Refrigerating, and Air conditioning Engineers, Inc.
Barroso-Krause, 1995, Barroso-Krause C. 1995.La climatisation naturelle : modélisation des objets architecturaux, aide à la conception en climat tropical. Ecole des Mines de Paris. pp 32-33
Fanger, 1970, Fanger, P.O. 1970. Thermal Comfort. Danish Technical Press.
Fanger, 1974, Fanger, P.O. Ostergaard J., Olesen. S., Lund Madsen T. 1974. The effect on man’s comfort of a uniform air flow from different directions. ASHRAE Transactions, Vol. 80, Part 2, pp. 142-157
FTC, 2006, FEDERAL TRADE COMMISSION 16 CFR Part 305-RIN 3084–AA74, see 78057 Federal Register / Vol. 71, No. 249 / Thursday, December 28, 2006 / Rules and Regulations, page 78057
Grignon-Massé, 2007, GRIGNON-MASSE, Laurent, ADNOT, Jérôme, RIVIERE Philippe. Environmental impact and discomfort relief of summer comfort appliances. In: Proceedings of CLIMA 2007, 9th REHVA world congress “WellBeing Indoors”, Helsinki, Finland, June 10th-14th, 2007 [CD-Rom].
James, 1996, James, P., Sonne, J., Vieira, R., Parker, D., Anello, M., "Are Energy Savings Due to Ceiling Fans Just Hot Air?" .Presented at the 1996 ACEEE Summer Study on Energy Efficiency in Buildings.
ECODESIGN Lot 10 Comfort fans study
99
Konz, 1983, Konz, S., S. Al-Wahab, and H. Gough. 1983. “The effect of air velocity on thermal comfort.” Proceedings of the Human Factors society.
Nicol J.F., and Humphreys M.A, 2004, A Stochastic Approach to Thermal Comfort—Occupant Behavior and Energy Use in Buildings, ADHRAE Transactions, Volume 110, Part 2. Oelsen, 1985, Oelsen, B. 1985. Local thermal discomfort. Bruel & Kjaer Technical Review, No.1, Denmark, pp.3-42.
Parker, 1998, Parker D., Callahan M, Sonne J, Su G. 1998.Development of a High efficiency Ceiling Fan "The Gossamer Wind"; Florida Solar Energy Center (FSEC) and AeroVironment, Inc.
Roshles, 1983, Roshles, F., S. Konz, and B. Jones. 1983. “Ceiling fans as extenders of the summer comfort envelope.” ASHRAE Transactions, Vol. 89, Part 1, pp. 245-263
Schmidt, 2001, Kersten Schmidt, Dean J. Patterson. 2001. Performance results for a high efficiency tropical ceiling fan and comparisons with conventional fans Demand side management via small appliance efficiency.
Szokolay, 1998, Szokolay S. 1998. Thermal comfort in the warm-humid tropics. Proceedings of the 31st Annual Conference of the Australian and New Zealand Architectural Science Association, The University of Queensland, Brisbane, 29th September – 3rd October 1997, pp. 7-12
Yizai, 2000, Yizai, Xia, Rongyi Zhao and Weiquan Xu. 2000. Human Thermal Sensation to Air Movement Frequency, Air Distribution in Rooms Volume 1, Proceedings of the 7th International Conference on Air Distribution in Rooms, Reading, UK, 9-12 July 2000, pp 41-46.
R4-Technical Analysis Existing Products ADEME, 2005, Notes sur les facteurs d’Emissions de Gaz à Effet de Serre pour la réalisation du bilan Carbone.
R5-Definition of Base-Case
R6-Technical Analysis BAT
R7-Improvement Potential
R8-Scenario-, policy-, impact- and sensitivity analysis