premature cracking of concrete bridge decks:...
TRANSCRIPT
Premature Cracking of Concrete Bridge Decks: Causes and Methods of Prevention
Ron Purvis and Khossrow Babaei, Wilbur Smith Associates Nalin Udani and Abid Qanbari, Pennsylvania Department of
Transportation William Williams, Federal Highway Administration
Newly constructed bridge decks were examined in order to identify the factors that cause cracking and ways in which the cracking might be reduced. The research included field surveys that showed transverse cracking to be the prevalent type associated with new bridges. Factors potentially influencing transverse cracking were studied and compared with the design and construction practice of the Pennsylvania Department of Transportation. Preliminary findings indicated that the main cause of transverse cracking is the shrinkage of hardened concrete. Further study and tests provided conclusive evidence of thermal shrinkage and drying shrinkage. Correlation of the cracking performance of several newly constructed decks with the shrinkage actually measured in the deck concrete showed that transverse cracking occurred where the shrinkage measurements were high. The findings further indicated that the type of aggregate used in the mix was a major factor associated with shrinkage cracking. Thermal shrinkage is affected by the amount of temperature change during the curing period as well as the coefficient of thermal expansion of concrete, which is mainly aggregate-related. It was noted that thermal shrinkage and cracking were especially severe in concretes that were subjected to large temperature changes associated with cold-weather curing. The research recommends the maximum acceptable
shrinkage, implementation of a shrinkage verification test for use in approving mix designs, and temperature control during cold-weather curing.
I ncreased cracking has been observed in recent years in newly constructed concrete highway bridge decks in Pennsylvania. Premature cracking is a concern,
because the Pennsylvania Department of Transportation's (PADOT's) experience has shown that cracks can cause steel to corrode and concrete to deteriorate, resulting in decreased deck service life. Prevention of premature cracks can provide longer deck lives and lower maintenance costs. A PADOT research project was initiated wi th the following objectives:
1. Identify factors that may cause premature concrete cracking,
2. Relate factors to PADOT bridge deck cracking, and
3. Recommend changes to reduce the cracking.
Initially, a literature search was performed and a questionnaire distributed to determine the extent of the problem and i f others had identified causes or solutions.
163
1 6 4 F O U R T H I N T E R N A T I O N A L B R I D G E E N G I N E E R I N G C O N F E R E N C E
This paper wi l l focus on the final stage of the work, which was conducted in three phases:
1. Examination of existing bridge decks, so that the types, significance, and causes of cracking, as well as methods to minimize i t , could be determined (1).
2. Observation of bridge deck construction to ident i fy specific construction procedures contributing to cracking, if any (2).
3. Performance of laboratory experiments to verify or modify the research findings (3).
P H A S E 1: E X A M I N A T I O N O F E X I S T I N G
B R I D G E D E C K S
Walk-By Surveys
The research team conducted visual walk-by surveys of 111 bridge decks that were selected by superstructure type f rom a group of 623 bridges to represent bridges built in Pennsylvania no more than 5 years before the surveys. The following number were selected f rom each type to represent this bridge group: 51 prestressed concrete I-beam bridges, 41 prestressed concrete spread box-beam bridges, and 19 steel-beam bridges. To the extent possible, various types of cracks were identified and their extent was quantified. Transverse cracking was identified as the prevalent type.
Transverse cracking occurred both in the positive and negative moment regions, which indicated that the cracking was not necessarily a load-related problem. The nature of the transverse cracks observed indicated that their cause was most likely shrinkage in hardened concrete and restraint provided by longitudinal beams. Concrete shrinkage is caused by the loss of heat of hydration and cooling during the curing period (short-term thermal shrinkage) and by the loss of mix water after curing and during the service (long-term drying shrinkage).
In-Depth Surveys
Of the 111 bridge decks, 12 were selected for in-depth surveys. The bridges were selected so as to include transverse crack intensities ranging f rom none to 87 m of cracks per 100 m ' (265 ft/1,000 f t ' ) of deck. The types selected also represent the majority of bridges being built in Pennsylvania. The in-depth surveys included crack mapping, crack width measurement, rebar location and depth survey (pachometer survey), and concrete coring. Background design and construction records of the 12 bridge decks were also obtained and reviewed as part of the in-depth surveys.
Field Observations
The following crack characteristics were observed during the in-depth field surveys:
• Almost all transverse cracks followed the line of the top transverse bars, regardless of the type of superstructure. This observation was revealed by pachometer surveys and verified by coring.
• Coring concrete showed that transverse cracks' depth extended to the level of the top transverse bars and beyond.
• The width of transverse cracks was generally narrow or medium, with the majority being medium.
0.1 mm < narrow < 0.25 mm (0.004 in.
< narrow < 0.01 in.)
0.25 mm < medium < 0.76 mm (0.01 in.
< medium < 0.03 in.)
[According to ACI Report 224 (4) Table 4 .1 , cracks wider than 0.18 mm (0.007 in.) contribute to deterioration of concrete and corrosion of reinforcing steel in the presence of deicing chemicals.]
• The average depth of cover for the top transverse bars ranged f rom 70 to 76 mm (2.75 to 3.00 in.). The nominal depth was 63.5 mm (2.5 in.). Thicker cover depths cause wider cracks, since the longitudinal crack control reinforcement is embedded too deeply in the concrete.
• Concrete cores examination showed that transverse cracks often intersected coarse aggregate particles. This indicated that the cracks occurred in the hardened concrete as opposed to the plastic concrete and that the cause of cracking was most likely drying shrinkage and thermal shrinkage, and not factors such as plastic shrinkage (caused by surface evaporation prior to curing) or settlement of plastic concrete between the top transverse bars.
• Concrete settlement cracking is not likely to have occurred in the bridge decks examined because their bar cover was relatively deep and their slump was relatively low [see NCHRP Report 297: Evaluation of Bridge Deck Protective Strategies (5)]. The cover depth was f rom 70 to 76 mm (2.75 to 3.0 in.) and slump was 51 to 102 mm (2 to 4 in.). However, vertical planes of weakness directly above the transverse bars are present because of the initial settlement-induced strains in the plastic concrete in that region. Later, transverse shrinkage cracking would form in the weakened concrete directly above the bar, as noted in the field surveys.

P U R V I S E T A L . 1 6 5
Estimate of Bridge Deck Shrinkage
Total concrete shrinkage strain (drying shrinkage plus thermal shrinkage) was estimated roughly for each bridge deck included in the in-depth surveys. To do this, the number of transverse cracks in each span was multiplied by the crack width and the product was divided by the length of the span. The number of transverse cracks for each span was obtained f rom the crack maps. An average crack width of 0.25 mm (0.01 in.) was assumed on the basis of the crack surveys. The shrinkages estimated for the spans were then averaged to represent the bridge. In continuous bridges, estimating shrinkage was limited to positive moment areas to eliminate the effects of negative moments on cracking.
It was found, analytically, that a residual long-term shrinkage of about 400 microstrain would be needed to initiate cracking. To find the residual shrinkage strain (tensile strain), the tensile strength was divided by the modulus of elasticity. Since shrinkage-induced tension is not an instantaneous phenomenon, an "effective" modulus of elasticity was used. The effective modulus of elasticity was the instantaneous modulus of elasticity divided by the sum of one plus the creep factor. The creep factor was found f rom the information available in ACT Report 209 (6). A creep factor of 2.5 was used to determine the residual long-term shrinkage. Detailed information is provided elsewhere (2, Appendix D). The residual shrinkage was added to the shrinkage estimated f rom the crack maps. On the basis of field data gathered in the second phase of the study (see Phase 2), a thermal shrinkage of 150 microstrain was assumed for all 12 decks. The thermal shrinkage was subtracted from' the shrinkage estimated to approximate the deck drying shrinkage.
The deck drying shrinkage was multiplied by 2.5 to represent shrinkage of standard laboratory specimens. Laboratory specimens [76 X 76 X 254 mm (3 X 3 X 10 in.)] have a much lower volume-to-surface ratio than a typical bridge deck slab, and drying shrinkage increases wi th a decrease in the volume-to-surface ratio [ACI Report 209 (6)]. Thie specimen drying shrinkage varied f rom 625 to 1,228 microstrain, a shrinkage difference of approximately 600 microstrain.
Next, background design and construction information for the 12 bridges was reviewed to identify the potential factors contributing to the range of shrinkage estimated.
Factors Affecting Drying Shrinkage
Mix Water
The content of concrete mix water affects drying shrinkage. The more water in the mix, the more evaporation
after curing and consequently more drying shrinkage to be expected. Information f rom A C I Report 224 (4) shows that for a typical concrete specimen, 1309 N/m^ (225 lb/yd'') water content results in about 300 microstrain drying shrinkage, and the drying shrinkage increases at a rate of about 0.5 microstrain per 1 N/m^ (3 microstrain per 1 Ib/yd^) increase in water content.
For the 12 bridges studied, the mix water content reported varied f rom 1552 to 1698 N / m ' (267 to 292 lh/yd\ a difference of 146 N / m ' (25 lb/yd').'That variation in water content increases the drying shrinkage by about 75 microstrain. This figure is only 13 percent of the difference between the minimum and maximum shrinkage determined for the 12 bridge decks in the study (i.e., 600 microstrain). Thus, it appeared that concrete mix water content was not the prime cause of the significant difference in the performance of the bridge decks wi th respect to transverse cracking.
Aggregate
Aggregate contributes to drying shrinkage of concrete in two quite different ways: first, certain aggregates need more water in the mix to produce the desired slump and workability, and the extra water increases shrinkage; and second, certain aggregates yield to the pressure f rom the shrinking paste and do not provide sufficient restraint against the shrinkage of the paste.
1. Aggregates demanding water: aggregates that need more water in the mix to produce the same workability have smaller coarse aggregate, rough texture, or flat and elongated particles. However, since the water content of the concrete is measured and controlled through its maximum allowable water-cement ratio, this characteristic of aggregate cannot unexpectedly increase shrinkage of concrete.
2. Aggregates yielding to pressure from shrinkage: aggregates that yield to the pressure f rom the shrinking paste are soft and have low stiffness and high compressibility. Absorption of an aggregate (coarse and fine) is a measure of its porosity, and the porosity influences the stiffness and compressibility. Generally, concretes made with high absorption aggregates tend to be more compressible and thus yield higher shrinkages. Also, aggregates with high absorption may themselves shrink an appreciable amount upon drying.
The information provided in ACI Report 224 (4) shows that the drying shrinkage can increase f rom 320 to 1,160 microstrain (about a 250 percent increase) when the aggregate absorption is increased f rom 0.3 to 5.0 percent. Quartz, limestone, dolomite, granite, feldspar, and some basalt are generally classified as aggre-

1 6 6 F O U R T H I N T E R N A T I O N A L B R I D G E E N G I N E E R I N G C O N F E R E N C E
gates that produce low shrinkage. Sandstone, slate, trap rock, and some types of basalt aggregates often produce high shrinkage concretes.
For the 12 bridge decks studied in the project, the coarse aggregate absorption varied f rom 0.34 percent (dolomite) to 1.17 percent (gravel), and the fine aggregate absorption varied f rom 0.43 percent (dolomite) to 1.97 percent (gravel). That variation in the absorption corresponds to an increase of at least about 300 mi-crostrain in drying shrinkage on the basis of the limited information provided by ACI Report 224 (4). That figure is 50 percent of the difference between the maximum and minimum shrinkage noted in the 12 bridge decks studied (i.e., 600 microstrain). Thus, it appeared that aggregate softness or hardness had an important role in the performance of the bridge decks wi th respect to transverse cracking.
Concept of Thermal Shrinkage
Concrete temperature rises during the initial hydration and curing process because of the release of heat of hydration. This initial temperature rise and expansion induces no residual compressive stresses in the concrete in changing f rom a plastic state to a solid state. This is because of the extremely low modulus of elasticity of the concrete at this plastic-to-solid state. When the concrete reaches its peak temperature, it has also solidified. Subsequently, the hardened concrete begins to cool to the ambient temperature.
During the cooUng process, longitudinal beams restrain the deck shrinkage. This phenomenon in turn w i l l cause tensile stresses and transverse cracking in the deck. The magnitude of thermal shrinkage in the deck depends on the difference between the peak concrete temperature and the temperature of supporting beams at the time of peak temperature. The temperature of suporting beams is usually equal to the ambient temperature, unless the deck is heated underneath as part of cold-weather curing.
The difference in deck and beam temperatures contributes to thermal shrinkage at a rate of 6.8 to 11.9 microstrain per degree Celsius (3.8 to 6.6 microstrain per degree Fahrenheit) depending on the type of aggregate used [average of 9.9 microstrain per degree Celsius (5.5 microstrain per degree Fahrenheit) (7)]. Typically, quartz and sandstone have very high coefficients of thermal expansion, and limestone has a very low coefficient of thermal expansion.
Unlike deck drying shrinkage, which may take over a year, thermal shrinkage affects the concrete in a short period (a few days); thus concrete creep properties cannot be fully used to relax the concrete and mitigate cracking. As a result, the shrinkage required to trigger
cracking wi l l be less than that required to trigger cracking under drying shrinkage. Analytical work found that 228 microstrain thermal shrinkage would be needed to initiate cracking. The analytical work was similar to that for residual long-term shrinkage, except that a creep factor of 1 was assumed. Detailed information is given elsewhere (2, Appendix D).
Factors Affecting Thermal Shrinkage
Thermal shrinkage increases as the rise in concrete temperature during curing increases. The heat generated during the hydration and the subsequent rise in temperature increase with increase in cement content, cement fineness (ASTM C I 15 or C204), or 28-day cement heat of hydration (ASTM C186).
ACI Report 207.2 (8) provides a procedure to estimate the rise in concrete temperature on the basis of the factors discussed. An attempt was made to quantify the impact of the factors discussed on the thermal shrinkage of the decks selected. The cement content of the 12 concrete mixes studied (Type I cement) varied f rom 377 to 418 kg/m' (635 to 705 lb/yd'). However, no information was available on the fineness and 28-day heat of hydration of these cements.
Two additional factors were unaccounted for in the ACI 207.2 procedure. First, retarder admixtures were used in the concrete. The authors' field observation in the second phase of the research was that depending on the dosage of the retarder, the rise in concrete temperature during curing may be almost ni l . Second, the field practice in hot weather is to lower the placing temperature of the concrete by using ice in the mix. Doing so w i l l also reduce the rise in concrete temperature.
Because of these reasons, estimating thermal shrinkage was not possible. However, on the basis of the field data obtained in the second phase of the study, it is reasonable to assume that the difference between the peak concrete temperature and ambient temperature varied f rom 0 to 17°C (0 to 31°F) for the 12 bridge decks studied. Those figures correspond to a difference of 170 microstrain deck thermal shrinkage, considering an average thermal coefficient of expansion of 9.9 microstrain per degree Celsius (5.5 microstrain per degree Fahrenheit) for concrete.
That amount of thermal shrinkage is relatively high and is 27 percent of the difference between the maximum and minimum shrinkage noted in the 12 bridge decks studied (i.e., 600 microstrain). Although 170-microstrain thermal shrinkage is not sufficient to initiate cracking in the concrete when the concrete is cooled gradually (less that the threshold of 228 microstrain), i t is later superimposed on the drying shrinkage.
P U R V I S E T A L . 1 6 7
Thermal Shrinkage Caused by Cold-Weather Curing
Further investigations of the background information of the selected existing decks revealed that two of the sample decks were subjected to special cold-weather curing conditions that involved heating or insulating the concrete or both. Cold-weather curing can contribute greatly to thermal shrinkage and cracking of concrete.
Springfield Road Bridge
Springfield Road Bridge is a two-span continuous bridge supported by prestressed concrete I-beams. Its deck had the highest level of transverse cracking among the 12 decks studied. Its cracking was measured as 87 m of transverse cracks per 100 m ' (265 ft/1,000 f r ' ) of deck area, equivalent to ful l-width cracks spaced about 1.2 m (4 f t ) apart.
Because of the cold weather during the placing and curing of the concrete, the deck was heated underneath. When the concrete placement began, the ambient temperature was 1°C (35°F). At that time the temperature of the metal deck forms was 10°C (50^) as a result the deck's being heated underneath overnight. Upon placement, the concrete was covered and insulated with blankets and straw.
One day after placing the concrete, the surface temperature of the concrete was recorded as 48°C (118°F). Since the concrete was insulated, it can be assumed that the surface temperature recorded is the same as the peak concrete temperature. However, the temperature of the supporting concrete beams in the enclosed heated area was the same as the temperature of the metal deck forms [i.e., 10°C (50°F)]. This condition translates to a difference of 38°C (68°F) [48°C - 10°C (118°F - 50°F)] between the peak deck temperature and the temperature of the supporting beams. Interestingly, a quartz aggregate, which has a high coefficient of thermal expansion, was used in this concrete. Assuming a thermal coefficient of expansion of 10.8 microstrain per degree Celsius (6.0 microstrain per degree Fahrenheit) for this concrete, its thermal shrinkage is estimated as at least 408 microstrain.
As discussed previously, a thermal shrinkage strain of about 228 microstrain may trigger cracking in the concrete in its early ages (gradual cooling). I f crack widths are assumed to be 0.25 mm (0.01 in.), the thermal shrinkage in excess of the cracking threshold shrinkage (i.e., 408 - 228 = 180 microstrain) is capable of developing transverse cracks 1.5 m (5 f t ) apart, which is in agreement with the overall crack pattern noted in the deck.
SR 0079 Bridge
SR 0079 Bridge is an eight-span continuous bridge supported by steel girders. The span wi th the highest level of cracking had 27 m of cracks per 100 m ' (82 ft/1,000 f t ' ) , equivalent to ful l-width cracks spaced about 3.7 m (12 ft) apart.
Upon placement, the deck was insulated wi th blankets because of the cold weather. The deck, however, was not heated underneath. The maximum surface temperature of the deck was 28°C (82°F) a day after placement. Since the concrete was insulated, it can be assumed that the surface temperature recorded is the same as the peak concrete temperature.
During concrete placement, the minimum day time temperature was 4°C (40°F). The peak concrete temperature most likely occurred at night (8 to 12 hr after placement). The night temperature may be assumed to be at least 3°C (5°F) less than the minimum day temperature, or 1°C (35°F). This temperature is almost the same as the temperature of the steel beams at the time of the peak concrete temperature. This condition translates to a maximum difference of 26°C (47°F) [28°C -2°C (82°F - 35°F)] between the peak deck temperature and the temperature of the supporting beams. Assuming the average thermal coefficient of expansion of 9.9 microstrain per degree Celsius (5.5 microstrain per degree Fahrenheit) for this concrete, the thermal shrinkage is estimated at 259 microstrain.
A thermal shrinkage strain of only 228 microstrain may trigger cracking in the concrete in its early ages. I f crack widths are assumed to be 0.25 mm (0.01 in.), the thermal shrinkage in excess of the crack threshold shrinkage (i.e., 259 - 228 = 31 microstrain) is capable of developing transverse cracks 8 m (26 f t ) apart. A l though the actual cracking is more intense than the cracking estimated, in time drying shrinkage can increase the intensity of cracking.
P H A S E 2: O B S E R V A T I O N O F B R I D G E
D E C K C O N S T R U C T I O N
Field Observations
The second phase of the research involved observing bridge deck construction to identify procedures contributing to shrinkage and cracking. Eight concrete bridge deck constructions were observed. A l l constructions were performed in late spring and summer. Construction procedures were monitored during the observations for any evidence that the procedures may contribute to cracking in concrete. The general observation was that the construction procedures would not affect the per-

1 6 8 F O U R T H I N T E R N A T I O N A L B R I D G E E N G I N E E R I N G C O N F E R E N C E
formance of the eight sites observed with respect to cracking.
Shrinkage of Field Concrete
Observations of bridge deck construction provided an opportunity to determine shrinkage. During the observations, concrete temperature was recorded during curing to determine the thermal shrinkage. The concrete used in the observed deck constructions was also sampled and tested in a laboratory to determine the drying shrinkage.
Thermal Shrinkage
The internal temperature of concrete was recorded during curing at each bridge deck construction site up to 8.5 hr after casting. Concrete thermometers were inserted in the concrete for this purpose. The concrete curing temperature (peak temperature) for each construction is presented in Table 1. The difference between the concrete curing temperature and ambient temperature (recorded at the time that the concrete temperature was recorded) ranged f rom 0 to 17°C (31°F). The lower end of the range corresponded to concretes that were highly dosed with a retarder: the retarder slows the cement hydration process, thus reducing the rate of heat of hydration generated and temperature rise.
The temperature of the beams supporting the decks was assumed to be the same as the ambient temperature, since the air surrounding the beams was not artificially heated. Therefore, the difference between concrete curing temperature and beam temperature would also range f rom 0 to 17°C (31°F). That differential temperature contributes to thermal shrinkage of concrete at an average rate of 9.9 microstrain per degree Celsius (5.5 microstrain per degree Fahrenheit) (7). Accordingly, the thermal shrinkage for each bridge deck was determined and is presented in Table 1; it ranged f rom 0 to 170 microstrain.
Drying Shrinkage
Concrete was sampled at each construction site for shrinkage tests. Each sample consisted of three unrestrained concrete specimens 76 X 76 X 254 mm (3 X 3 X 10 in.). The shrinkage specimens were taken to the laboratory and cured for 7 days, the same as the bridge decks. Twenty-four hours after casting the specimens were demolded and specimen lengths were measured; specimen lengths were measured up to 112 days after casting. The length measurement was performed in accordance with ASTM C157/C878, and shrinkage was determined accordingly. The values of specimen drying shrinkage (corresponding to 112 days) are given in Table 1; they ranged f rom 480 to 1,450 microstrain.
TABLE 1 Thermal and Drying Shrinkage Information for Eight Construction Sites
WSA Br. No. 1 2 3 4 5 6 7 8 SRNo. 0092 4021 0087 0108 1050 0079 0234 2007 District & 4 8 4 10 12 12 8 10 County Wyoming York Wyoming Butler Westmor. Greene Adams Jefferson Weather Overcast
Clear Clear P. Cloud P.
Cloud Cloud Clear
Clear P. Cloud
Overcast P. Cloud
Air Temp., °C (^) 16-33 23 - 36 13-26 21 -27 23 - 34 17 - 27 24 - 35 20 - 33 (60 - 92) (74-96) (55 - 78) (70-80) (74-94) (63-81) (76-95) (68 - 92)
Concrete Curing Temp. »C (°F) 38 (100) 31 (88) 39 (102) 27 (80) 40 (104) 44 (111) 37 (99) 44 (112) Ambient Temp.', °C (^) 26 (78) 33 (92) 24 (75) 27 (80) 34 (94) 27 (80) 35 (95) 33 (92) Assumed Beam Temp.', "C (^) 26 (78) 33 (92) 24 (75) 27 (80) 34 (94) 27 (80) 35 (95) 33 (92) Differential Cone./Beam Temp. 38-26=12 31-33 = 39-24 = 15 27- 40-34 =6 44-27=17 37- 44-33-11 "C (V) (100-78 = -2 (102-75 = 27=0 (104-94 = (111-80= 35=2 (112-92=
22) (88-92= -4)
27) (80-80=0)
10) 31) (99-95=4)
20)
Deck^ Thermal Shrinkage, 22x5.5= -4x5.5 = 27x 5.5 = 0x5.5= lOx 5.5 = 31x 5.5 = 4x 5.5= 20x 5.5 = Micro-Strain 121 -22 148 0 55 170 22 110 Specimen Drying Shrinkage, Micro-Strain
905 533 1450 508 480 805 710 867
Deck Drying Shrinkage, Micro-Strain
905: 2.5= 362
533:2.5 =213
1450: 2.5= 580
508:2.5 =203
480: 2.5= 192
805:2.5= 322
710:2.5 =284
867:2.5= 347 1
1: At the time when concrete cure temperature was recorded. 2: Since temperatures were recorded in the average coefficient of thermal expansion of 5.5 micro-strain per °F is used (7).
P U R V I S E T A L . 1 6 9
Deck drying shrinkage, however, is much less than specimen drying shrinkage because of the lower volume-to-surface ratio of the specimen. Drying shrinkage of the deck may approximately be assumed V2 times the drying shrinkage of the specimen considering the difference in the volume-to-surface ratio (6). The values of deck drying shrinkage are presented in Table 1 for the eight construction sites.
Relationship Between Deck Shrinkage and Deck Cracking
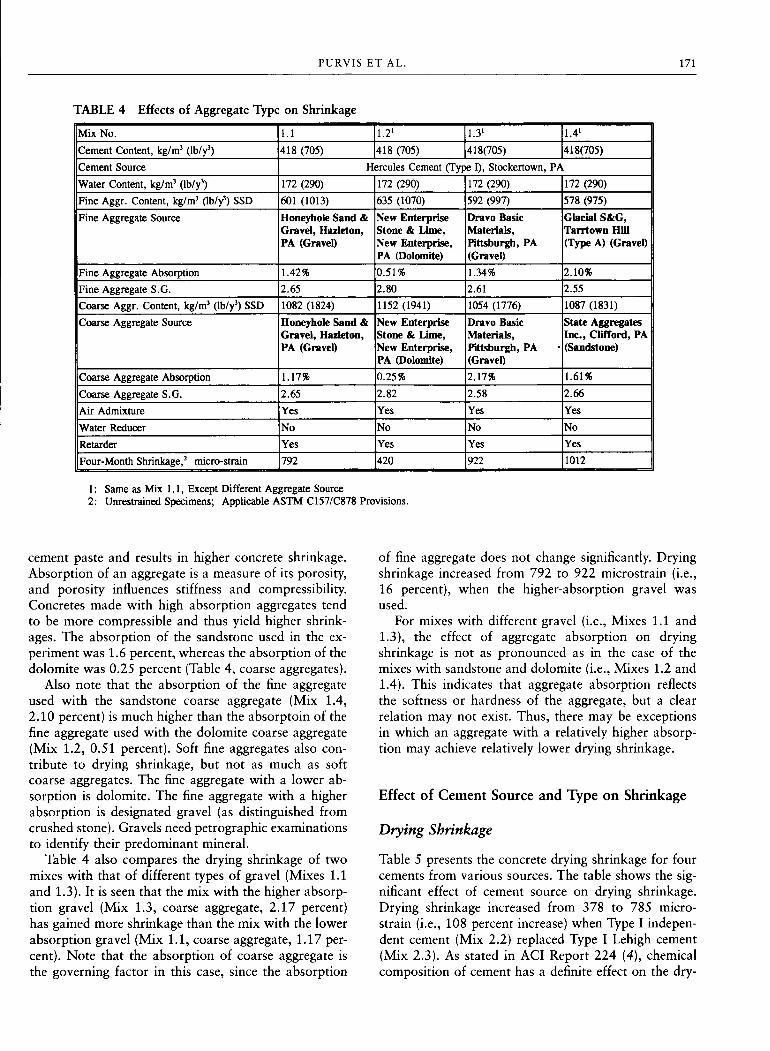
The eight newly constructed bridge decks were surveyed for crack occurrence after construction; the results are presented in Table 2. The survey revealed cracks in four bridge decks.
As discussed previously, it was found on the basis of analytical work that a thermal shrinkage strain of 228 microstrain may initiate cracking in the concrete in its early ages (gradual cooling). It was also found that for long-term shrinkage (i.e., thermal shrinkage plus drying shrinkage), the cracking threshold shrinkage strain would be 400 microstrain, since concrete creep properties would be further used. Detailed information is provided elsewhere (2).
By definition, the thermal shrinkage in excess of the cracking threshold strain of 228 microstrain is called effective thermal shrinkage. Effective thermal shrinkage is capable of developing transverse cracks in the deck in its early ages (when the concrete cools during curing). The authors have estimated the amount of effective thermal shrinkage for the eight newly constructed decks in Table 3. As noted in the table, the effective thermal shrinkage of the eight decks is 0, since the thermal shrinkage is always less than the cracking threshold of 228 microstrain. A l l of the thermal shrinkage, thus, wi l l be in the form of residual shrinkage and wiU be added to the long-term drying shrinkage later.
By definition, the long-term shrinkage in excess of the cracking threshold strain of 400 microstrain is called effective long-term shrinkage. Effective long-term shrinkage is capable of developing transverse cracks in the deck within about 1 year after the construction. The authors have estimated the amount of effective long-term shrinkage for the eight newly constructed bridge decks in Table 3. On the basis of the effective long-term shrinkage estimated, the average transverse crack spacing for each bridge deck has been predicted in Table 3. A crack width of 0.25 mm (0.01 in.) has been assumed for this purpose.
As noted in Table 3, the authors have predicted the development of transverse cracks in four decks and the absence of transverse cracks in four decks on the basis of the shrinkage determined for each bridge deck. A
visit to the eight decks validated the prediction of transverse cracking as shown in Table 3. These results further support shrinkage as the prime cause of transverse cracking in bridge decks.
On the basis of the crack prediction procedure, the crack spacing w i l l exceed 9 m (30 f t ) if the 4-month specimen drying shrinkage is kept below 700 micro-strain [equivalent to 400 microstrain 28-day shrinkage (6) provided the thermal shrinkage is limited to 150 microstrain] [corresponding to a maximum concrete temperature rise of 12°C (22°F)]. Note that the specimens are unrestrained and 76 X 76 X 254 mm (3 X 3 X 10 in.). The information in Tables 2 and 3 supports this statement.
P H A S E 3: L A B O R A T O R Y E X P E R I M E N T S
Experiment Design
The laboratory experiments focus on examining the effects of the aggregate source, cement source, and fly ash on shrinkage. The experiments were designed using the types of aggregate, cement, and fly ash typically used in Pennsylvania. Accordingly, concrete mixes were produced and tested for temperature rise during curing (indication of thermal shrinkage), and they were tested for drying shrinkage.
Three 76- X 76- X 254-mm (3- X 3- X 10-in.) unrestrained shrinkage specimens were produced f rom each concrete mix designed. Drying shrinkage was measured up to 4 months using applicable ASTM C157/ C878 provisions. For each mix, concrete temperature was recorded during curing while the concrete was in an insulated 152- X 305-mm (6- X 12-in.) steel cylinder.
It is important to note that the results reported here are all based on limited experiments. They indicate only the potential for a shrinkage increase, or decrease, when aggregate, cement, or fly ash sources and types are varied. The results are not sufficient to be used to approve, or reject, certain products.
Effect of Aggregate Type on Shrinkage
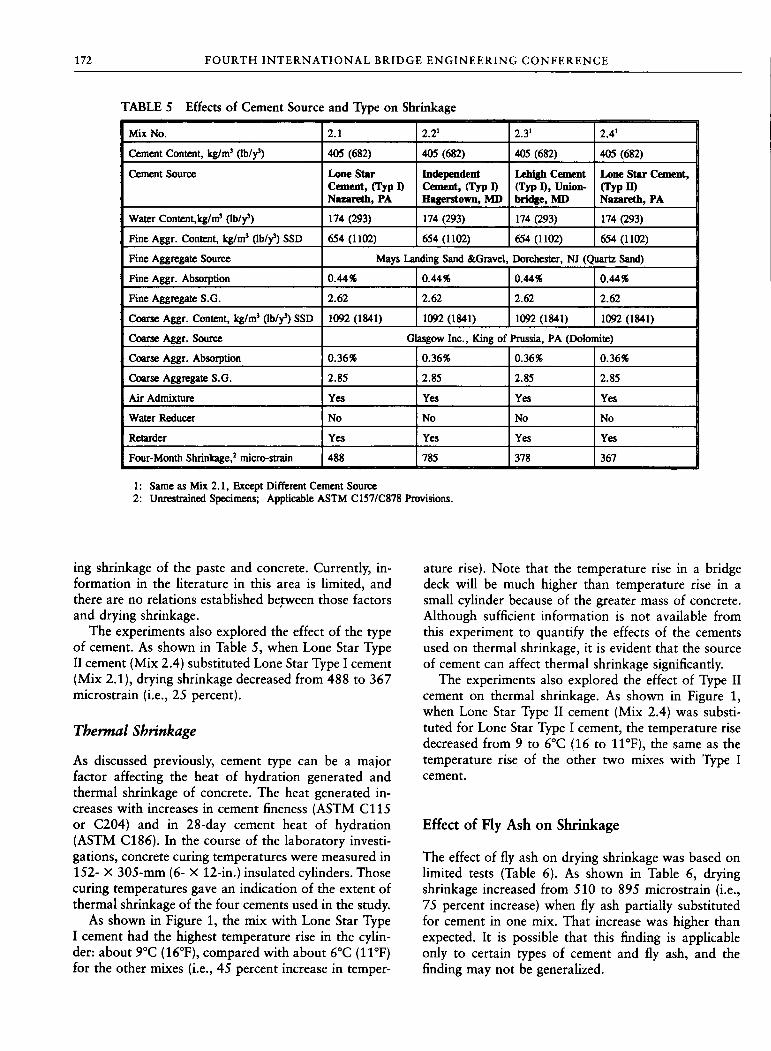
Table 4 gives the concrete drying shrinkage for four types of aggregate that were selected on the basis of their mineralogy. As the table shows, when sandstone coarse aggregate (Mix 1.4) was substituted for dolomite coarse aggregate (Mix 1.2) in the concrete mix, drying shrinkage increased f rom 420 to 1,012 microstrain (i.e., 141 percent increase).
Unlike dolomite, sandstone, by nature, is a soft aggregate with low stiffness and high compressibility. Therefore, i t yields to the pressure f rom the shrinking
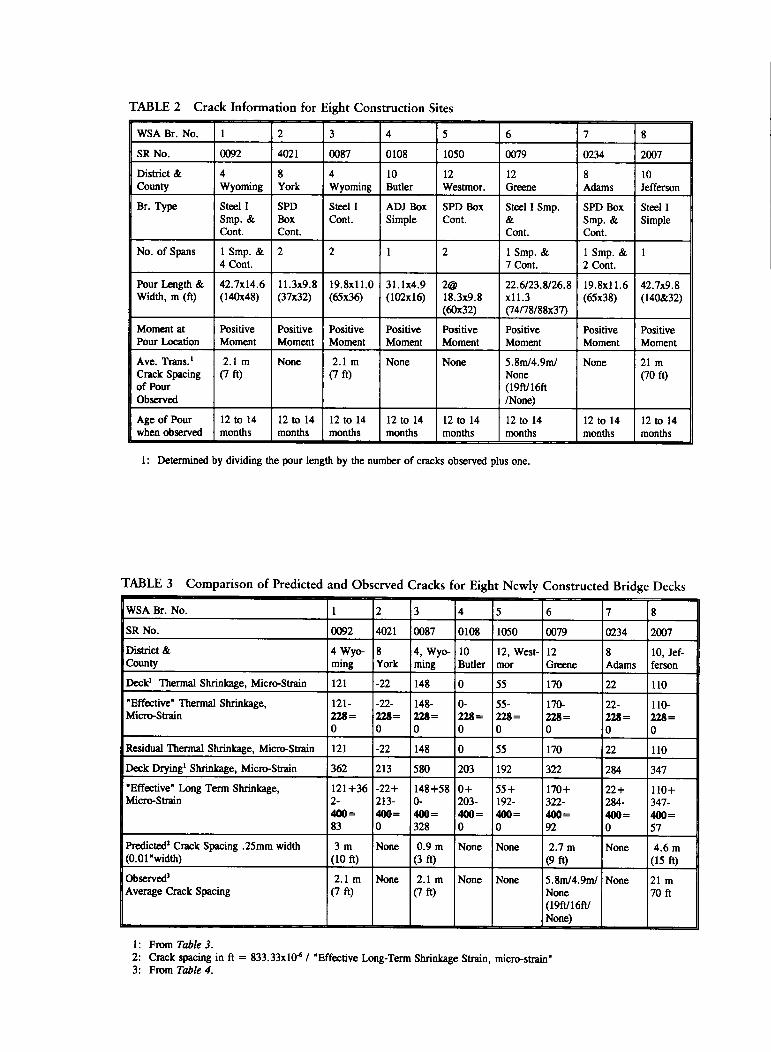
TABLE 2 Crack Information for Eight Construction Sites
WSA Br. No. 1 2 3 4 5 6 7 8
S R N o . 0092 4021 0087 0108 1050 0079 0234 2007
District & County
4 Wyoming
8 York
4 Wyoming
10 Butler
12 Westmor.
12 Greene
8 Adams
10 Jefferson
Br. Type Steel I Smp. & Cont.
SPD Box Cont.
Steel I Cont.
ADJ Box Simple
SPD Box Cont.
Steel I Smp. & Cont.
SPD Box Smp. & Cont.
Steel I Simple
No. of Spans 1 Smp. & 4 Cont.
2 2 1 2 1 Smp. & 7 Cont.
1 Smp. & 2 Cont.
1
Pour Length & Width, m (ft)
42.7x14.6 (140x48)
11.3x9.8 (37x32)
19.8x11.0 (65x36)
31.1x4.9 (102x16)
2 ® 18.3x9.8 (60x32)
22.6/23.8/26.8 x l l . 3 (74/78/88x37)
19.8x11.6 (65x38)
42.7x9.8 (140&32)
Moment at Pour Location
Positive Moment
Positive Moment
Positive Moment
Positive Moment
Positive Moment
Positive Moment
Positive Moment
Positive Moment
Ave. Trans.' Crack Spacing of Pour Observed
2.1 m (7 ft)
None 2.1 m (7 ft)
None None 5.8m/4.9m/ None (19ft/16ft /None)
None 21 m (70 ft)
Age of Pour when observed
12 to 14 months
12 to 14 months
12 to 14 months
12 to 14 months
12 to 14 months
12 to 14 months
12 to 14 months
12 to 14 months
1: Determined by dividing the pour length by the number of cracks observed plus one.
TABLE 3 Comparison of Predicted and Observed Cracks for Eight Newly Constructed Bridge Decks
1 WSA Br. No. I 2 3 4 5 6 7 8
I s R N o . 0092 4021 0087 0108 1050 0079 0234 2007
District & 1 County
4 Wyoming
8 York
4, Wyoming
10 Butler
12, Westmor
12 Greene
8 Adams
10, Jefferson
1 Deck' Thermal Shrinkage, Micro-Strain 121 -22 148 0 55 170 22 110
"Effective" Thermal Shrinkage, Micro-Strain
121-228 = 0
-22-228= 0
148-228= 0
0-228 = 0
55-228 = 0
170-228 = 0
22-228 = 0
110-228 = 0
Residual Thermal Shrinkage, Micro-Strain 121 -22 148 0 55 170 22 110
Deck Drying' Shrinkage, Micro-Strain 362 213 580 203 192 322 284 347
"Effective" Long Term Shrinkage, Micro-Strain
121+36 2-400 = 83
-22+ 213-400= 0
148+58 0-400= 328
0 + 203-400= 0
55 + 192-400= 0
170+ 322-400= 92
22 + 284-400= 0
110+ 347-400= 57
Predicted' Crack Spacing .25mm width (O.Orwidth)
3 m (10 ft)
None 0.9 m (3 ft)
None None 2.7 m (9 ft)
None 4.6 m (15 ft)
Observed' Average Crack Spacing
2.1 m (7 ft)
None 2.1 m (7 ft)
None None 5.8m/4.9m/ None (19ft/16ft/ None)
None 21 m 70 ft
1: From Table 3. 2: Crack spacing in ft = 833.33x10* / "Effective Long-Term Shrinkage Strain, micro-strain" 3: From Table 4.
P U R V I S E T A L . 171
TABLE 4 Effects of Aggregate Type on Shrinkage
Mix No. 1.1 1.2' 1.3' 1.4'
Cement Content, kg/m' (Ib/y') 418 (705) 418 (705) 418(705) 418(705)
Cement Source Hercules Cement (Type I), Stockertown, PA
Water Content, kg/m' (Ib/y^) 172 (290) 172 (290) 172 (290) 172 (290)
Fine Aggr. Content, kg/m' ( I b / f ) SSD 601 (1013) 635 (1070) 592 (997) 578 (975)
Fine Aggregate Source Honeyhole Sand & Gravel, Hazleton, PA (Gravel)
New Enterprise Stone & Lime, New Enterprise, PA (Dolomite)
Dravo Basic Materials, Pittsburgh, PA (Gravel)
Glacial S & G , Tarrtown Hill (Type A) (Gravel)
Fine Aggregate Absorption 1.42% 0.51% 1.34% 2.10%
Fine Aggregate S.G. 2.65 2.80 2.61 2.55
Coarse Aggr. Content, kg/m' (Ib/y') SSD 1082 (1824) 1152 (1941) 1054 (1776) 1087 (1831)
Coarse Aggregate Source Honeyhole Sand & Gravel, Hazleton, PA (Gravel)
New Enterprise Stone & Lime, New Enterprise, PA (Dolomite)
Dravo Basic Materials, Pittsburgh, PA (Gravel)
State Aggregates Inc., Clifford, PA (Sandstone)
Coarse Aggregate Absorption 1.17% 0.25% 2.17% 1.61%
Coarse Aggregate S.G. 2.65 2.82 2.58 2.66
Air Admixture Yes Yes Yes Yes
Water Reducer No No No No
Retarder Yes Yes Yes Yes
Four-Month Shrinkage,' micro-strain 792 420 922 1012
1: Same as Mix 1.1, Except Different Aggregate Source 2: Unrestrained Specimens; Applicable A S T M C157/C878 Provisions.
cement paste and results in higher concrete shrinkage. Absorption of an aggregate is a measure of its porosity, and porosity influences stiffness and compressibihty. Concretes made wi th high absorption aggregates tend to be more compressible and thus yield higher shrinkages. The absorption of the sandstone used in the experiment was 1.6 percent, whereas the absorption of the dolomite was 0.25 percent (Table 4, coarse aggregates).
Also note that the absorption of the fine aggregate used with the sandstone coarse aggregate (Mix 1.4, 2.10 percent) is much higher than the absorptoin of the fine aggregate used with the dolomite coarse aggregate (Mix 1.2, 0.51 percent). Soft fine aggregates also contribute to drying shrinkage, but not as much as soft coarse aggregates. The fine aggregate with a lower absorption is dolomite. The fine aggregate wi th a higher absorption is designated gravel (as distinguished f rom crushed stone). Gravels need petrographic examinations to identify their predominant mineral.
Table 4 also compares the drying shrinkage of two mixes with that of different types of gravel (Mixes 1.1 and 1.3). I t is seen that the mix with the higher absorption gravel (Mix 1.3, coarse aggregate, 2.17 percent) has gained more shrinkage than the mix with the lower absorption gravel (Mix 1.1, coarse aggregate, 1.17 percent). Note that the absorption of coarse aggregate is the governing factor in this case, since the absorption
of fine aggregate does not change significantly. Drying shrinkage increased f rom 792 to 922 microstrain (i.e., 16 percent), when the higher-absorption gravel was used.
For mixes with different gravel (i.e.. Mixes 1.1 and 1.3) , the effect of aggregate absorption on drying shrinkage is not as pronounced as in the case of the mixes with sandstone and dolomite (i.e.. Mixes 1.2 and 1.4) . This indicates that aggregate absorption reflects the softness or hardness of the aggregate, but a clear relation may not exist. Thus, there may be exceptions in which an aggregate with a relatively higher absorption may achieve relatively lower drying shrinkage.
Effect of Cement Source and Type on Shrinkage
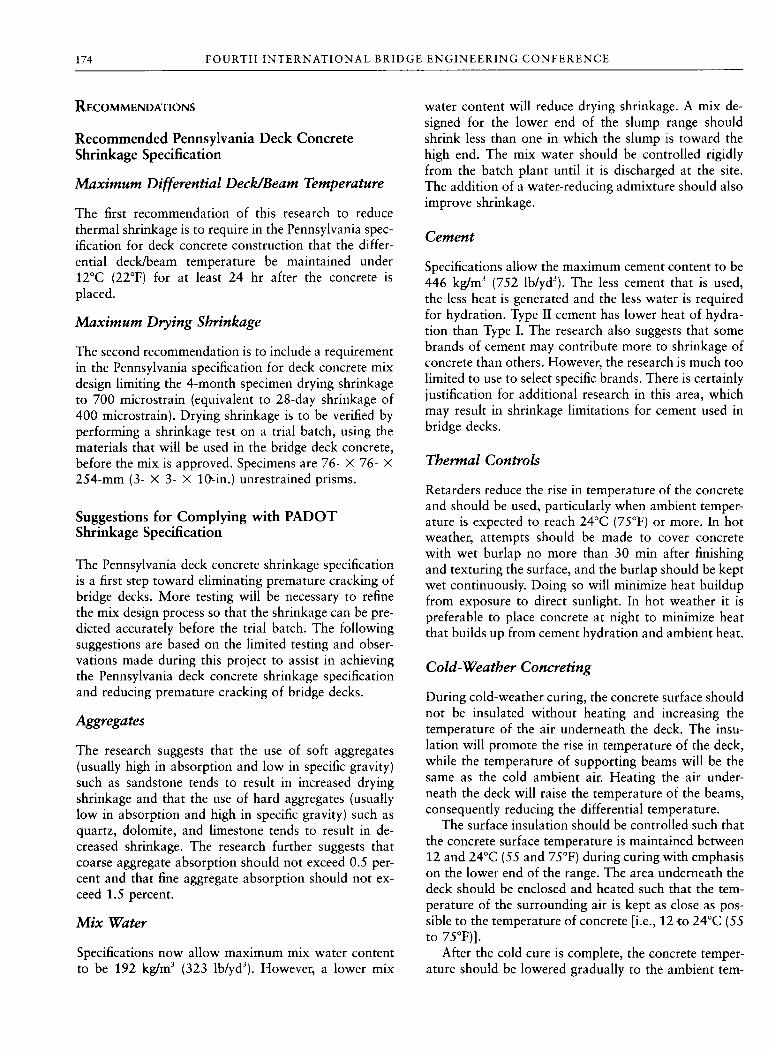
Drying Shrinkage
Table 5 presents the concrete drying shrinkage for four cements f rom various sources. The table shows the significant effect of cement source on drying shrinkage. Drying shrinkage increased f rom 378 to 785 micro-strain (i.e., 108 percent increase) when Type I independent cement (Mix 2.2) replaced Type I Lehigh cement (Mix 2.3). As stated in ACI Report 224 (4), chemical composition of cement has a definite effect on the dry-
172 F O U R T H I N T E R N A T I O N A L B R I D G E E N G I N E E R I N G C O N F E R E N C E
T A B L E 5 Effects of Cement Source and Type on Shrinkage
M i x No. 2.1 2.2' 2.3' 2.4' I Cement Content, kg/m' ( l b / / ) 405 (682) 405 (682) 405 (682) 405 (682) 1 Cement Source Lone Star
Cement, (Typ 1) Nazareth, PA
Independent Cement, (Typ 1) Hagerstown, M D
Lehigh Cement (Typ D , Union-bridge, M D
Lone Star Cement, (Typ n) Nazareth, PA |
Water Content.kg/m' flb/y') 174 (293) 174 (293) 174 (293) 174 (293) 1 Fine Aggr. Content, kg/m' ( l b / / ) SSD 654 (1102) 654 (1102) 654 (1102) 654 (1102) 1
Fine Aggregate Source Mays Landing Sand &Gravel, Dorchester, NJ (Quartz Sand) |
Fine Aggr. Absorption 0.44% 0.44% 0.44% 0.44% 1 Fine Aggregate S.G. 2.62 2.62 2.62 2.62 1 Coarse Aggr. Content, kg/m' Qh/f) SSD 1092 (1841) 1092 (1841) 1092 (1841) 1092 (1841) 1
Coarse Aggr. Source Glasgow Inc., King of Prussia, PA (Dolomite)
Coarse Aggr. Absorption 0.36% 0.36% 0.36% 0.36%
Coarse Aggregate S.G. 2.85 2.85 2.85 2.85
Ai r Admixture Yes Yes Yes Yes
Water Reducer No No No No 1 Retarder Yes Yes Yes Yes 1 Four-Month Shrinkage,^ micro-strain 488 785 378 367 1
1: Same as Mix 2 .1 , Except Different Cement Source 2: Unrestrained Specimens; Applicable A S T M C157/C878 Provisions.
ing shrinkage of the paste and concrete. Currently, information in the Hterature in this area is Umited, and there are no relations established between those factors and drying shrinkage.
The experiments also explored the effect of the type of cement. As shown in Table 5, when Lone Star Type II cement (Mix 2.4) substituted Lone Star Type I cement (Mix 2.1), drying shrinkage decreased from 488 to 367 microstrain (i.e., 25 percent).
Thermal Shrinkage
As discussed previously, cement type can be a major factor affecting the heat of hydration generated and thermal shrinkage of concrete. The heat generated increases with increases in cement fineness ( A S T M C I 15 or C204) and in 2 8-day cement heat of hydration ( A S T M C186) . In the course of the laboratory investigations, concrete curing temperatures were measured in 152- X 305-mm (6- X 12-in.) insulated cylinders. Those curing temperatures gave an indication of the extent of thermal shrinkage of the four cements used in the study.
As shown in Figure 1, the mix with Lone Star Type I cement had the highest temperature rise in the cyUn-der: about 9°C (16°F), compared with about 6°C (11°F) for the other mixes (i.e., 45 percent increase in temper
ature rise). Note that the temperature rise in a bridge deck wil l be much higher than temperature rise in a small cylinder because of the greater mass of concrete. Although sufficient information is not available from this experiment to quantify the effects of the cements used on thermal shrinkage, it is evident that the source of cement can affect thermal shrinkage significantly.
The experiments also explored the effect of Type II cement on thermal shrinkage. As shown in Figure 1, when Lone Star Type II cement (Mix 2.4) was substituted for Lone Star Type I cement, the temperature rise decreased from 9 to 6°C (16 to I T F ) , the same as the temperature rise of the other two mixes with Type I cement.
Effect of Fly Ash on Shrinkage
The effect of fly ash on drying shrinkage was based on limited tests (Table 6). As shown in Table 6, drying shrinkage increased from 510 to 895 microstrain (i.e., 75 percent increase) when fly ash partially substituted for cement in one mix. That increase was higher than expected. It is possible that this finding is applicable only to certain types of cement and fly ash, and the finding may not be generalized.

83.6
UJ
2 UJ CL 2
76.8
CEMENT SOURCE
—t— Lonestar I
-B— lndep«nd«nl I
-»<- Lehigh I
Loneslor It
TIME:{hour3)
F I G U R E 1 Effects of source and type of concrete on curing temperature.
T A B L E 6 Effects of Fly Ash on Shrinkage
Mix No. 3.1 Mix with Fly Ash 3.2 Same as 3.1, Except no Fly Ash
Cement Content, kg/m' ( l b / / ) 377 (635) 443' (746)
Cement Source Armstrong Cement (Type I ) , Cabot, PA
Fly Ash ConUnt, kg /m ' (Ib/y^ 67 (113) 0
Fly Ash Source National Mineral (Type F) -Fly Ash S.G. 2.25 -Water Content, kg/m' Q b / f ) 173 (291) 173 (291)
Fine Aggr. Content, kg/m' ( I b l f ) SSD 572 (963) 594' (1001)
Fine Aggregate Source Glacial S&G, Tarrtown H i l l (Type A) (GLG-03C), (Gravel)
Fine Aggregate Absorption 2.10% 2.10%
Fine Aggregate S.G. 2.55 2.55
Coarse Aggr. Content, kg/m' (Ib/y') SSD 1042 (1756) 1042 (1756)
Coarse Aggregate Source Latrobe Construction, Longbridge (/tST) (LAT-64A), (Calcarious Sandstone)
Coarse Aggregate Absorption 0.43% 0.43%
Coarse Aggregate S.G. 2.68 2.68
A i r Admixture Yes Yes
Water Reducer No No
Retarder Yes Yes
Four-Month Shrinkage,' micro-strain 895 510
Cement content is based on water-cementitious ratio o f 0.39. Aggregate is adjusted to partially substitute f ly ash. Unrestrained Specimens; Applicable A S T M C157/C878 Provisions.
174 F O U R T H I N T E R N A T I O N A L B R I D G E E N G I N E E R I N G C O N F E R E N C E
RECOMMENDATIONS
Recommended Pennsylvania Deck Concrete Shrinkage Specification
Maximum Differential Deck/Beam Temperature
The first recommendation of this research to reduce thermal shrinkage is to require in the Pennsylvania specification for deck concrete construction that the differential deck/beam temperature be maintained under 12°C (22°F) for at least 24 hr after the concrete is placed.
Maximum Drying Shrinkage
The second recommendation is to include a requirement in the Pennsylvania specification for deck concrete mix design limiting the 4-month specimen drying shrinkage to 700 microstrain (equivalent to 28-day shrinkage of 400 microstrain). Drying shrinkage is to be verified by performing a shrinkage test on a trial batch, using the materials that wil l be used in the bridge deck concrete, before the mix is approved. Specimens are 76- X 76- X 254-mm (3- X 3- X 10--in.) unrestrained prisms.
Suggestions for Complying with PADOT Shrinkage Specification
The Pennsylvania deck concrete shrinkage specification is a first step toward eliminating premature cracking of bridge decks. More testing will be necessary to refine the mix design process so that the shrinkage can be predicted accurately before the trial batch. The following suggestions are based on the limited testing and observations made during this project to assist in achieving the Pennsylvania deck concrete shrinkage specification and reducing premature cracking of bridge decks.
Aggregates
The research suggests that the use of soft aggregates (usually high in absorption and low in specific gravity) such as sandstone tends to result in increased drying shrinkage and that the use of hard aggregates (usually low in absorption and high in specific gravity) such as quartz, dolomite, and limestone tends to result in decreased shrinkage. The research further suggests that coarse aggregate absorption should not exceed 0.5 percent and that fine aggregate absorption should not exceed 1.5 percent.
Mix Water
Specifications now allow maximum mix water content to be 192 kg/m' (323 Ib/yd^). However, a lower mix
water content will reduce drying shrinkage. A mix designed for the lower end of the slump range should shrink less than one in which the slump is toward the high end. The mix water should be controlled rigidly from the batch plant until it is discharged at the site. The addition of a water-reducing admixture should also improve shrinkage.
Cement
Specifications allow the maximum cement content to be 446 kg/m' (752 lb/yd'). The less cement that is used, the less heat is generated and the less water is required for hydration. Type II cement has lower heat of hydration than Type I . The research also suggests that some brands of cement may contribute more to shrinkage of concrete than others. However, the research is much too limited to use to select specific brands. There is certainly justification for additional research in this area, which may result in shrinkage limitations for cement used in bridge decks.
Thermal Controls
Retarders reduce the rise in temperature of the concrete and should be used, particularly when ambient temperature is expected to reach 2 4 ° C (75°F) or more. In hot weather, attempts should be made to cover concrete with wet burlap no more than 30 min after finishing and texturing the surface, and the burlap should be kept wet continuously. Doing so will minimize heat buildup from exposure to direct sunlight. In hot weather it is preferable to place concrete at night to minimize heat that builds up from cement hydration and ambient heat.
Cold-Weather Concreting
During cold-weather curing, the concrete surface should not be insulated without heating and increasing the temperature of the air underneath the deck. The insulation wil l promote the rise in temperature of the deck, while the temperature of supporting beams will be the same as the cold ambient air. Heating the air underneath the deck will raise the temperature of the beams, consequently reducing the differential temperature.
The surface insulation should be controlled such that the concrete surface temperature is maintained between 12 and 2 4 ° C (55 and 75°F) during curing with emphasis on the lower end of the range. The area underneath the deck should be enclosed and heated such that the temperature of the surrounding air is kept as close as possible to the temperature of concrete [i.e., 12 to 2 4 ° C (55 to 75°F)] .
After the cold cure is complete, the concrete temperature should be lowered gradually to the ambient tem-
P U R V I S E T A L . 175
perature. The maximum allowable temperature drop during first 24 hr after end of curing period should be 14°C (25°F). The recommended temperature drop of concrete can be accomplished by reducing sources of heat slowly and by allowing insulation to remain until the concrete has essentially reached equilibrium with the ambient temperature.
A C K N O W L E D G M E N T S
The research reported herein was performed by Wilbur Smith Associates (WSA) as part of a project for the P A D O T , Office of Research and Special Studies. The research is sponsored by P A D O T and F H W A , U.S. Department of Transportation. Since it is in progress, not all the findings have been accepted as official views of either P A D O T or F H W A .
Managing the research for P A D O T and providing liaison between the P A D O T research panel and W S A was Steve Davis from the Office of Research and Studies. The panel, headed by Nalin Udani from the Bureau of Design Bridge Division, includes Abid Qanbari, Gordon Bell, Dave Reidenouer, Ron Arner, Gary Hoffman, and John Ekiert of P A D O T and William Williams of F H W A .
The W S A team of Ron Purvis (principal investigator) and Khossrow Babaei are performing the research. Subconsultants assisting W S A are Mike Boyle, Valley Forge Testing; Ken Clear, Kenneth C . Clear Inc.; Gajannan
Sabnis, Howard University; and Heintz Koretzky, private consultant.
REFERENCES
1. Babaei, K. , and R. L . Purvis. Prevention of Cracks in Concrete Bridge Decks: Report on Surveys of Existing Bridge Decks. Report for Research Project 89-01. Pennsylvania Department of Transportation, Oct. 1994.
2. Babaei, K. , and R. L . Purvis. Prevention of Cracks in Concrete Bridge Decks: Report on Observations of Bridge Deck Construction. Report for Research Project 89-01. Pennsylvania Department of Transportation, Jan. 1995.
3. Babaei, K. , and R. L . Purvis. Prevention of Cracks in Concrete Bridge Decks: Report on Laboratory Investigations of Concrete Shrinkage. Report for Research Project 89-01. Pennsylvania Department of Transportation, Jan. 1995.
4. Control of Cracking in Concrete Structures. Report 224R-80. American Concrete Institute, Detroit, Mich., rev. 1984.
5. NCHRP Report 297: Evaluation of Bridge Deck Protective Strategies. TRB, National Research Council, Washington, D .C . , 1987.
6. Prediction of Creep, Shrinkage, and Temperature Effects in Concrete Structures. Report 209R-92. American Concrete Institute, Detroit, Mich., 1992.
7. Design and Control of Concrete Mixtures. PCA Engineering Bulletin, Portland Cement Association, 1968.
8. Effects of Restraint, Volume Change, and Reinforcement on Cracking of Massive Concrete. Report 207.2R-73. American Concrete Institute, Detroit, Mich., rev. 1986.