preliminary report - whatcom child care demand
TRANSCRIPT

1 | P a g e
Preliminary Report: Whatcom County Child
Care Demand Study Prepared by the Center for Economic and Business Research
Author:
Brianna Berkson
May 2021
2 | P a g e
Table of Contents About the Authors ....................................................................................................................................... 3
Executive Summary ..................................................................................................................................... 4
Research Questions ................................................................................................................................. 4
Demand Forecast ..................................................................................................................................... 5
Parent/Guardian Survey .......................................................................................................................... 5
Further Research ..................................................................................................................................... 6
Background on Child Care Expansion Planning ........................................................................................... 7
Forecasting Child Care Demand ................................................................................................................... 7
COVID-19 Labor Force Changes and Recovery Assumptions ............................................................... 8
Population Growth Assumptions ....................................................................................................... 10
Child Care Preference Assumptions .................................................................................................. 10
Child Care Location Assumptions ...................................................................................................... 11
Demand Forecast ................................................................................................................................... 12
Current Supply and Gap Analysis ....................................................................................................... 13
Survey Responses ...................................................................................................................................... 14
Programs and Factors to Consider by Region .................................................................................... 14
Programs and Factors to Consider by Income Level .......................................................................... 15
Programs and Factors to Consider by Race/Ethnicity ........................................................................ 15
Questions Asked of All Respondents ..................................................................................................... 15
Respondents with Children 0-5 ............................................................................................................. 16
Respondents Who Do Not Want Formal Child Care .......................................................................... 18
Respondents Who Want Formal Child Care ...................................................................................... 20
Respondents with School-Age Children ................................................................................................. 32
Demographics ........................................................................................................................................ 34

3 | P a g e
About the Authors The Center for Economic and Business Research is an outreach center at Western Washington University located within the College of Business and Economics. In addition to publishing the Puget Sound Economic Forecaster, the Center connects the resources found throughout the University to assist for-profit, non-profit, government agencies, quasi-government entities, and tribal communities in gathering and analyzing useful data to respond to specific questions. We use a number of collaborative approaches to help inform our clients so that they are better able to hold policy discussions and craft decisions.
The Center employs students, staff, and faculty from across the University as well as outside resources to meet the individual needs of those we work with. Our work is based on academic approaches and rigor that not only provides a neutral analytical perspective but also provides applied learning opportunities. We focus on developing collaborative relationships with our clients and not simply delivering an end product.
The approaches we utilize are insightful, useful, and are all a part of the debate surrounding the topics we explore; however, none are absolutely fail-safe. Data, by nature, is challenged by how it is collected and how it is leveraged with other data sources. Following only one approach without deviation is ill-advised. We provide a variety of insights within our work – not only on the topic at hand but also the resources (data) that inform that topic.
We are always seeking opportunities to bring the strengths of Western Washington University to fruition within our region. If you have a need for analysis work or comments on this report, we encourage you to contact us at 360-650-3909 or by email at [email protected].
To learn more about CEBR visit us online at https://cebr.wwu.edu or follow us online through your favorite social media stream.
facebook.com/westerncebr
twitter.com/PugetSoundEF
linkedin.com/company/wwu-center-for-economic-and-business-research
instagram.com/wwucebr
The Center for Economic and Business Research is directed by Hart Hodges, Ph.D. and James McCafferty.

4 | P a g e
Executive Summary The goal of this study is to provide the client (United Way of Whatcom County), policymakers, child care providers, child care credentialling programs, employers, community members, and other stakeholders with a better understanding of the demand for child care in Whatcom County. First, we surveyed households in Whatcom County with children age 0-5 to get feedback on how their children are currently cared for, what types of child care they want, and what they look for in child care. Using data gathered from this survey and other available literature and resources, we then constructed a forecast for child care demand in Whatcom County.
By identifying the types of care and specific factors that drive parent and caregiver choice as outlined in this report, child care leaders and providers can ensure that investments made in program expansion will be well-utilized and will meet the needs of parents and caregivers.
Research Questions
The report ahead will be organized in two parts – the demand forecast and methodology, followed by survey responses. For each section, we aim to answer a few key questions about the needs and preferences of Whatcom County families who are looking for child care.
By forecasting demand for formal child care (licensed center, licensed family home, or licensed school-age program), the report aims to address the following questions:
• How much child care availability is needed to meet demand? • How might demand change if the COVID-19 pandemic has long-lasting impacts on women’s
labor force participation rate? • How will child care demand be distributed across the county?
The survey represents a direct appeal to Whatcom County families with children age 0 to 5 to gather their feedback on a series of key questions:
• What share of the population is considering using formal child care? • For those who do not plan to use formal child care, what motivated their decision? • For families who are considering using formal child care, what type of care are they looking for
in terms of: o Program type o Location o Hours per week o Other desired attributes
• What insights can demographic and geographic factors provide into child care demand? • What factors are important for those open to enrolling their school-age child in formal child
care?
Respondents with school-age children were asked a narrower set of questions regarding child care preferences and priorities.

5 | P a g e
Demand Forecast
Demand is forecasted in terms of full time equivalent (FTE) child care availability needed. Each full-time slot demanded corresponds to 1 FTE, while each part-time slot demanded corresponds to 0.67 FTE. We define formal child care as care in a licensed child care program, while informal care is provided by a family member, friend, babysitter, or equivalent. Child care demand for children less than 5 years old is considered under three different scenarios:
• Current Utilization: This scenario is based on current child care utilization patterns as reported in the survey, with 42% of respondents reporting that their children are enrolled in formal child care and 60% of that formal care being part-time.
• Moderate Demand Coverage: Takes the average of the low and high demand scenarios – 59% enrollment in formal child care with 55% opting for part-time care.
• Total Demand: Assumes all families who are considering formal child care (77%) enroll, with half in full time care and half in part-time (percentages are based on survey results).
By 2025, Whatcom County would need to increase their 0-5 child care capacity by 5,817 and their school-age capacity by 6,252 to meet the Total Demand scenario.
Total FTE Child Care Demand 2022 2023 2024 2025 Annual Increase Total Demand (<5) 8,387 8,425 8,463 8,501 38 Moderate Demand Coverage (<5) 6,351 6,380 6,409 6,437 29 Current Utilization (<5) 4,396 4,416 4,436 4,456 20 School-Age Scenario (5-9) 7,001 7,095 7,190 7,285 95
The following report will outline demand based on these factors in more detail:
• Labor force participation rate changes post-COVID • Forecasted population growth • Child care preferences expressed in the survey
Parent/Guardian Survey
The primary mode of data collection was a survey promoted to Whatcom County residents from February 22 to March 26 via two direct mail pieces (both pieces were sent in English and Spanish), targeted paid social media advertisements, and through multiple other stakeholders’ own communication channels. The survey was available online as well as by phone, with interpretation available. These data collection methods were chosen because they promoted the survey to a wide audience and provided access to those who were unable to complete the survey online, thus reducing barriers and increasing the probability of acquiring a representative sample of the Whatcom County community.
Questions were organized to gather information on a variety of questions from three main groups:
• Families with children 0-5 who do not plan to enroll their children in formal child care o What factors were most significant in this decision?

6 | P a g e
• Families with children 0-5 who are open to enrolling their children in formal child care o What is their current child care usage? o What are they looking for post-pandemic? o What factors are most influential when looking for care? o Where in Whatcom County would they like child care?
• Families with children older than 5 who were open to using formal child care o What is most important when looking for child care for your school-age children?
Demographic questions were asked of all respondents along with questions to help establish the impact of the COVID-19 pandemic on Whatcom families. Overall, the sample obtained is demographically representative of Whatcom in terms of race, ethnicity, and income. The sample was also representative of the County in terms of geography, with the sample deviating from the population by +/- 1% in most school districts. Bellingham was overrepresented in the sample by 9 percentage points and Blaine was underrepresented by 4 percentage points. The most significant deviation, in terms of demographics, was that 83% of the sample were women.
Response rates vary by questions, but the overall survey gained 1,312 respondents who completed at least the first question and 835 with children between the age of 0 and 5 (653 considering formal care), and 716 respondents with school age children (364 considering formal care). Statistically speaking, this represents a +/- 3% margin of error at a 95% confidence level. The survey was offered in both English and Spanish, online or by phone. A total of 10 respondents completed the survey in Spanish.
For respondents that currently use or are considering formal child care, the attributes most likely to be a “significant factor” in choosing child care are: quality (98%), safety (97%), and a welcoming environment (90%). Half of these respondents also indicated that the child care they have now does not meet their needs, with commonly cited barriers being cost, availability, or struggles related to the COVID-19 pandemic.
Turning to respondents who do not desire or intend to enroll their child in formal child care, the factors most likely to be reported as “significant” reason for not wanting formal child care are: a preference to have their child cared for by a parent or guardian (71%), a preference for informal child care (58%), and safety concerns (50%).
Further Research
Following the presentation of the study’s findings to stakeholders, we will solicit feedback regarding questions the report may have raised that merit further investigation and that will be most useful in creating an expansion plan and/or in making investments. Based on this feedback, and in consultation with stakeholders, we will be facilitating a series of focus groups with survey respondents. The focus groups will consist of individuals who were surveyed in this study and opted in to participating in further research.
Additionally, more research can be done to align and compare this data to local, state, and national trends in child care. While Whatcom County is unique in many ways, regional and national trends and legislation related to child care will be influential locally.

7 | P a g e
Background on Child Care Expansion Planning Whatcom County has been characterized as a child care desert due to the well-documented gap between child care supply and demand. One 2019 report from Child Care Aware estimates the child care shortage at 4,462 slots.1 The goal of this demand forecast is to help inform the Whatcom Child Care Coalition’s expansion plan and strategic recommendations for Whatcom County. The Whatcom Child Care Coalition’s expansion plan aims to offer recommendations that will set the County on a path to2:
• Increase the number of child care slots available • Reduce the amount of time families spend on child care waitlists • Ensure that household budgets can comfortably afford child care • Increase the availability of on-site behavior supports in child care programs • Provide equitable access to child care in both rural and urban areas
Forecasting Child Care Demand In the next few pages, we discuss the process for modeling child care demand in Whatcom County and the key assumptions that were made. Overall, the forecast suggests that Whatcom County will likely need formal child care capacity for an FTE of 8,387 children under 5 (5,009 full time slots and 5,009 part-time slots) in 2022 with an increase of 38 FTE annually through 2025 in order to meet the total demand in Whatcom County. For school-age children (age 5-9), the projected 2022 total demand is 4,174 FTE increasing annually by 56 FTE up to 2025.
Comparing 2021 supply to forecasted 2025 demand, we see a gap of 5,817 FTE formal child care slots for children 0-5 and a gap of 6,252 FTE for school-age care. The total annual growth rate of child care demand during this period is forecasted to be 0.8%, which is in keeping with JobsEQ’s 0.8% forecasted growth rate for child care employment.3
How to Use the Forecast
The demand forecast is largely based on survey data and the share of respondents who indicated an interest in formal child care. While the promotion of the survey was aimed at all Whatcom County families with children less than 5, it is likely that families who are not interested in formal child care were less inclined to participate – thus the sample may overestimate the share of families who want formal child care. Three scenarios are modeled to provide a range of possibilities for child care demand and a better picture of how changes to the model’s assumptions impact the forecast.
1 Child Care Aware. “Child Care Supply, Demand, and Cost in Whatcom County.” Child Care Aware, 18 October 2019, https://www.ccanorthwest.org/wp-content/uploads/2019/11/WhatcomCountyReport2019.pdf 2 Whatcom Child Care Coalition. “Child Care and Early Learning for Every Family.” United Way of Whatcom County, November 2020, https://www.unitedwaywhatcom.org/couch/uploads/file/wccc-child-care-brief.pdf 3 JobsEQ. “Occupation Report: Childcare Workers in Whatcom County, Washington.” Accessed April 19, 2021.

8 | P a g e
A demand forecast is also provided by region; however, smaller sample sizes result in larger margins of error. Further study is recommended to better understand child care demand in less-populous regions of Whatcom County.
Bellingham Blaine Ferndale Lynden Meridian Mt Baker Nooksack
Percent of Whatcom Population 53% 9% 14% 8% 5% 7% 4%
Adjusted Percent of Whatcom Demand 63% 6% 11% 8% 5% 5% 2%
COVID-19 Labor Force Changes and Recovery Assumptions
One of the first major considerations for the forecast is the impact of the COVID-19 pandemic on Whatcom families and their child care usage, as well as how these factors are expected to change in the coming years. Based on national data and survey data, women have left the workforce at a much higher rate during the pandemic and have taken on a disproportionate amount of child care and household duties. However, the survey data shows that more female respondents were planning to be in the labor force post-pandemic than were currently working. This suggests an increased need for child care in the next year compared to current levels.
Below is a graphic from the Federal Reserve Bank of San Francisco illustrating the impact of the pandemic on labor force participation by gender and parent status. The labor force participation rate refers to the percentage of adults who are currently working or actively looking for work. Not only did pandemic-related layoffs hit traditionally female-dominated fields harder, school and child care closures led to more responsibilities shifting to mothers (in heterosexual, two-parent households). The second large decline in labor force participation for mothers corresponds to the beginning of the school year, again suggesting that these additional child care responsibilities forced many mothers to stay home and leave the labor force.
Source: Lofton, Olivia, Nicolas Petrosky-Nadeau, and Lily Seitelman. “Parental Participation in a Pandemic Labor Market.” Federal Reserve Bank of San Francisco, 5 April 2021, https://www.frbsf.org/economic-research/publications/economic-letter/2021/april/parental-participation-in-pandemic-labor-market/?utm_source=mailchimp&utm_medium=email&utm_campaign=economic-letter

9 | P a g e
As the pandemic slows and more schools and child care options open, how will labor force participation change for mothers? Will they return to the labor force and need the same child care they had pre-pandemic, or will their child care needs change?
In our survey of Whatcom parents/guardians, we asked respondents about their current employment, schooling, or other responsibilities. The following table summarizes the feedback received from female survey respondents on their current and expected post-pandemic labor force participation. Census data from 2019 on pre-pandemic labor force participation are also included; however, they come with large margins of error.
Women’s Labor Force Expectations Pre-Covid (2019 Census Data)4 Current % Post-COVID % % Change
In School: primarily in person classes 0.5% 1.0% 100%
In School: primarily online classes 1.0% 0.5% -50%
Unemployed 1.6% (women with children <18) 2.8% (women with children <6)
1.8% 0.6% -67%
Other responsibilities (please explain): 5.8% 4.3% -25%
A mix of working/schooling from home and from another location
11.1% 13.0% 17%
Stay-at-home parent/caregiver 14.6% 10.3% -30%
Employed: working from home 27.6% 9.5% -66%
Employed: not working from home 37.8% 60.8% 61%
Total 100.0% 100.0%
In Labor Force 72% (women with children <18) 65% (women with children <6)
65.3% 70.3% 7%
Currently, 65% of respondents have employment as their primary time commitment; however, 70% of respondents expect employment to be their primary time commitment after the pandemic. This suggests that many Whatcom mothers who may have left the labor force as a result of the COVID-19 pandemic plan to rejoin the labor force post-pandemic and some who may not have been in the labor force before the pandemic plan to join in the next year. This data is used to inform the scenarios presented in the “Child Care Preference Assumptions” section of this report.
4 Census Bureau. “Median Household Income by Household Size.” Census Bureau, 2019, https://data.census.gov/cedsci/table?q=ACSDT1Y2019.B19019&g=0500000US53073&tid=ACSDT1Y2019.B19019&hidePreview=true

10 | P a g e
Population Growth Assumptions
Another important factor in forecasting child care demand is forecasting populations. The following table presents population projections from Washington State’s Office of Financial Management (OFM) for relevant age groups in 2020 and 2025.5 For the purpose of modeling child care demand, we assume that the population follows a straight-line growth rate between 2020 and 2025.
We rely on data from OFM in this instance because it is used by city and county governments as the basis for decisions related to their comprehensive plans.
Age 2020 2025 Annual Increase 0 to 4 12,965 13,261 59 5 to 9 13,281 14,191 182
Source: WA Office of Financial Management. “County Projections: 2010-2050 by Age and Sex (Medium Series Only).” 2017, https://ofm.wa.gov/washington-data-research/population-demographics/population-forecasts-and-projections/growth-management-act-county-projections/growth-management-act-population-projections-counties-2010-2040-0
Child Care Preference Assumptions
The next question to consider is what percentage of children will be enrolled in formal child care, as opposed to solely using informal child care or parent/guardian care. For this, we turn to survey data to create three potential scenarios:
• Current Utilization: We base this scenario on current child care utilization rates as reported though the survey. The full time vs. part time care distributions are determined using survey data on current usage.
• Total Demand: This scenario assumes that all respondents who are open to enrolling their child in formal child care (77%) do. Formal child care is divided between the three categories following the relative distribution established in the low demand scenario. The distribution between full time and part time care is based on survey respondents reporting the type of care that would best meet their needs.
• Moderate Demand Coverage: Here we take the average of the low and high demand scenarios to establish a “most likely” scenario where more families use child care than during the COVID-19 pandemic; however, some families who are open to formal child care may opt for informal child care, face barriers to using formal child care, or have a parent who has remained out of the labor force. The scenario also uses the average FTE of the Low and High Demand scenarios.
For school-age children, we default to the survey data, which suggests that 52% of families with school-age children are considering enrolling them in formal child care. Given that these children (post-pandemic) are in school, we assume that all of their demand for child care will be part-time during the school year and potentially full-time during the summer. Given that part-time slots will likely overlap
5 WA Office of Financial Management. “Population by Age and Sex, Five Year Age Groups.” Office of Financial Management, 2017, https://ofm.wa.gov/washington-data-research/population-demographics/population-forecasts-and-projections/growth-management-act-county-projections/growth-management-act-population-projections-counties-2010-2040-0
11 | P a g e
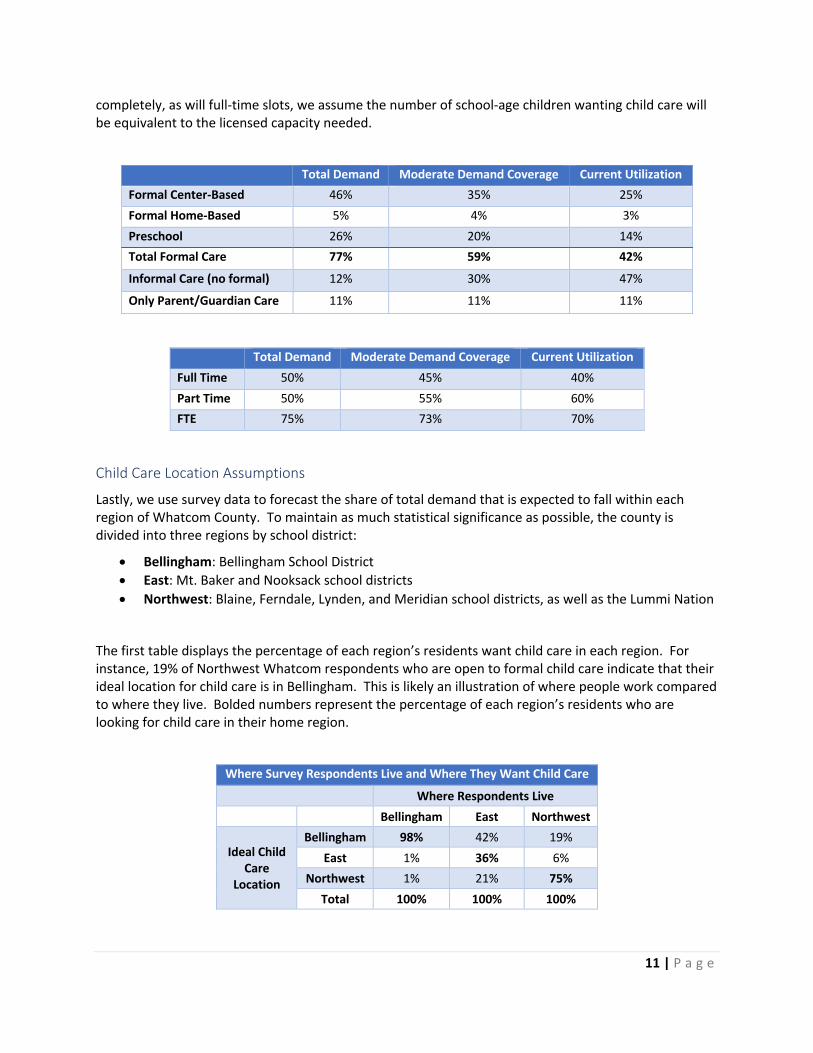
completely, as will full-time slots, we assume the number of school-age children wanting child care will be equivalent to the licensed capacity needed.
Total Demand Moderate Demand Coverage Current Utilization Formal Center-Based 46% 35% 25% Formal Home-Based 5% 4% 3% Preschool 26% 20% 14% Total Formal Care 77% 59% 42%
Informal Care (no formal) 12% 30% 47%
Only Parent/Guardian Care 11% 11% 11%
Total Demand Moderate Demand Coverage Current Utilization Full Time 50% 45% 40% Part Time 50% 55% 60% FTE 75% 73% 70%
Child Care Location Assumptions
Lastly, we use survey data to forecast the share of total demand that is expected to fall within each region of Whatcom County. To maintain as much statistical significance as possible, the county is divided into three regions by school district:
• Bellingham: Bellingham School District • East: Mt. Baker and Nooksack school districts • Northwest: Blaine, Ferndale, Lynden, and Meridian school districts, as well as the Lummi Nation
The first table displays the percentage of each region’s residents want child care in each region. For instance, 19% of Northwest Whatcom respondents who are open to formal child care indicate that their ideal location for child care is in Bellingham. This is likely an illustration of where people work compared to where they live. Bolded numbers represent the percentage of each region’s residents who are looking for child care in their home region.
Where Survey Respondents Live and Where They Want Child Care Where Respondents Live
Bellingham East Northwest
Ideal Child Care
Location
Bellingham 98% 42% 19% East 1% 36% 6%
Northwest 1% 21% 75% Total 100% 100% 100%

12 | P a g e
Next, we use the Whatcom population distribution and data in the table above to create an estimate for the distribution of child care demand across Whatcom County. Based on survey responses and our associated assumptions, we expect roughly 63% of child care demand to be in the Bellingham region, 30% to be in Northwest Whatcom County, and 7% to be in East Whatcom County.
Bellingham East Northwest Total Percent of Whatcom Population 53% 11% 36% 100% Adjusted Percent of Whatcom Demand 63% 7% 30% 100%
The same process is applied below by school district. By breaking down the 399 respondents who provided both their home location and ideal child care location into 7 school districts; however, these estimates come with a large margin of error. As a result, the forecast will be presented by region rather than by school district in order to preserve more statistical significance.
Bellingham Blaine Ferndale Lynden Meridian Mt Baker Nooksack
Percent of Whatcom Population 53% 9% 14% 8% 5% 7% 4%
Adjusted Percent of Whatcom Demand 63% 6% 11% 8% 5% 5% 2%
Demand Forecast
Demand is forecasted by multiplying the total population for an age range by the percentage assumed to enroll in formal child care. The resulting figure is then multiplied by the associated FTE percentage to convert all demand to like terms. Finally, we break total FTE demand for each year into demand by geographic region. The resulting demand forecast is presented in the table below.
The Current Utilization and Total Demand scenarios should be viewed as the upper and lower limits on demand, while the Moderate Demand Coverage scenario accounts for the possibility that those considering formal care were overrepresented in the sample and that not all who are considering formal care will choose it when presented with the option.
FTE Formal Child Care Demand by Region
2022 2023 2024 2025
Bell East NW Total Bell East NW Total Bell East NW Total Bell East NW Total
Total Demand (<5)
5320 565 2503 8387 5344 567 2514 8425 5368 570 2525 8463 5392 572 2537 8501
Moderate Demand Coverage (<5)
4028 428 1895 6351 4047 429 1904 6380 4065 431 1912 6409 4083 433 1921 6437
Current Utilization (<5)
2788 296 1312 4396 2801 297 1318 4416 2814 299 1324 4436 2826 300 1330 4456
School-Age (5-9) 4440 471 2089 7001 4500 478 2117 7095 4560 484 2146 7190 4621 490 2174 7285

13 | P a g e
Current Supply and Gap Analysis
Data on the supply of child care in Whatcom County was provided by the Washington State Department of Children Youth and Families (DCYF). The total licensed capacity can be compared to forecasted FTE child care demand.
Whatcom County Child Care Supply
Bellingham East Northwest Whatcom Total
Capacity Providers Capacity Providers Capacity Providers Capacity Providers
Child Care Center 1,746 35 72 2 512 12 2,330 49
Family Child Care Home 127 13 51 5 176 17 354 35
School-Age Program 835 21 68 3 130 5 1,033 29
Other (Outdoor Preschool)
16 1
16 1
Total 2,708 69 207 11 818 34 3,733 114
The gap between the supply of formal child care in 2021 and the forecasted Total Demand for 2025 is 12,068 FTE. There is a slight oversupply of formal home-based care in the East and Northwest regions; however, this may be a result of a lack of access to center-based care leading to more families turning to their secondary preference. As more center-based and preschool options become available, the oversupply of home-based care may become more evident.
Estimated Increase in Supply Needed to Meet 2025 Total Demand Scenario Bellingham East Northwest Whatcom Total
Formal Center-Based Care and Preschools 3,296 463 1,860 5,619 Formal Home-Based Care 223 -14 -11 198 School-Age Care 3,786 422 2,044 6,252 Total 7,304 872 3,892 12,068

14 | P a g e
Survey Responses For this study, we divide child care into the following categories:
• Formal Child Care: requires payment (or accepts State subsidies), run as a business, usually licensed through the State
o Center-Based: licensed child care usually located in commercial areas and care for a large number of children
o Home-Based: licensed child care located in a home
• Informal Child Care: children are cared for by a nanny, babysitter, family member, neighbor, friend, etc.
Demographic cross tabs are provided by geography – East County (Mount Baker and Nooksack school districts), Bellingham, and North County (Blaine, Ferndale, Lynden, and Meridian school districts) – income, and race/ethnicity.
For income-based cross tabs, respondents are divided into those with household incomes below $50,000 and those with incomes above $50,000. The results of income cross tabs will be reported when responses between groups differ by at least 5 percentage points.
For race/ethnicity, the comparison groups will be respondents with at least one BIPOC person in their household and respondents with only White people in their household. Cross tab results are reported when responses between the groups differ by at least 10 percentage points, due to the smaller sample size for BIPOC respondents.
The survey question asking respondents where they live gathered 450 responses from individuals with children they would consider enrolling in formal child care. As a result, only questions shown to respondents wanting formal child care will be analyzed by region. Because of the small total sample size for these questions, and even smaller sample size when divided by region, we will only report differences of more than 10 percentage points in response rates by region.
Programs and Factors to Consider by Region
Overall, quality, safety, and a welcoming environment are the three most important factors for Whatcom respondents when looking for child care. Below is a summary of notable differences in child care preferences by region:
• Northwest Whatcom: Less interest in licensed centers, preschools, and parent/guardian care compared to the rest of the County. Lower preference for informal care and higher preference for licensed family homes compared to Bellingham respondents. Availability is more of a barrier than for East Whatcom respondents.
• East Whatcom: Lower part-time demand than respondents from other parts of the County and higher year-round demand than Northwest Whatcom respondents.

15 | P a g e
Programs and Factors to Consider by Income Level
Respondents with household incomes below $50,000 were more likely to prefer formal child care, while those with higher incomes were more likely to prefer informal or parent/guardian care. Financial barriers were more common for respondents with incomes below $50,000 and those with higher incomes were more likely to report that the child care they have now meets their needs. While all factors were more significant for respondents with incomes less than $50,000, the largest gaps between groups were subsidy availability, cost, languages spoken, and sibling discount availability. There were no significant differences in the quantity of child care desired.
Programs and Factors to Consider by Race/Ethnicity
For respondents in BIPOC households who are not considering formal child care, five factors were more significant than for respondents in White households: staff diversity, a reduced need for formal care, a preference for informal care, the level of staff training, and the quality of care available. However, costs being too high was less likely to be a significant factor. BIPOC respondents who were currently using or considering formal child care were more likely to prioritize staff skill working with racially diverse classrooms and programs that accept state subsidies.
Questions Asked of All Respondents
Q1: How many children in your household are 0-5 years old? (n=1,312)
Of the 1,312 individuals who responded to the survey, 835 currently had children under 5 years old or expected to in the coming year. The other 477 did not have young children and were directed to Q18. Respondents with incomes less than $50,000 were 6 percentage points less likely to mark “None.” There were no significant differences by race.
36%
2%38%
20%
2% 1% 0%
How many children in your household are 0-5 years old?
None None, but expecting a child in the next year 1 2 3 4 5 or more

16 | P a g e
Respondents with Children 0-5
The following four questions were only asked of those with children age 0-5.
Q2: Does someone besides a parent/guardian currently care for children in your household? (select all that apply) (n = 798)
In this question, we begin to see what the demand for child care looks like among those with children 0 to 5 years old. Based on this data, we see that 27% of respondents use formal center-based child care, 4% use formal home based child care, and 27% have their children fully cared for by a parent/guardian.
Respondents with incomes less than $50,000 were less likely to have their child enrolled in preschool or to have them cared for by an at-home nanny or babysitter, but more likely to indicate that their child was only being cared for by a parent/guardian. BIPOC respondents were more likely to have formal center-based care.
Other (please explain):
• COVID-19 Impacts (9 respondents) • Informal (4 respondents)
• Kindergarten (9 respondents) • School-Age (3 respondents)
• Parent Care (5 respondents) • Respite Care (1)
4%
4%
11%
16%
27%
27%
39%
0% 5% 10% 15% 20% 25% 30% 35% 40% 45%
Yes, formal home-based child care
Other (please explain):
Yes, at-home nanny or babysitter
Yes, preschool
Yes, formal center-based child care
No
Yes, informal child care (grandparents, neighbor, friend, otherfamily, babysitter/nanny, etc.)
Does someone besides a parent/guardian currently care for children in your household? (select all that apply)

17 | P a g e
Q3: For the children in your household who are 0-5, would you consider putting them in formal child care? (n=465)
This question was only asked of respondents who did not select formal center, home, or preschool care in the previous question. Of those who are not currently using formal care, 61% are open to formal care in the future, 20% plan to have their child fully cared for by a parent/guardian, and 19% may rely on informal care. Respondents with incomes less than $50,000 were more likely to consider informal care and less likely to be open to formal child care. There were no significant differences by race.
The following two questions were asked of those who do not currently have a child 0-5, but expect to in the coming year. Given the small samples, this data is not useful.
Q4: Has your child been in formal child care outside of your home in the past two years? (n=5)
Q5: Do you plan to have your child in formal child care in the next year? (n=5)
61%20%
19%
For the children in your household who are 0-5, would you consider putting them in formal child care?
Yes, I would consider putting my childin formal child care
No, I don't plan to put my child in anytype of child care
No, but I would consider putting mychild in informal child care
18 | P a g e
Respondents Who Do Not Want Formal Child Care
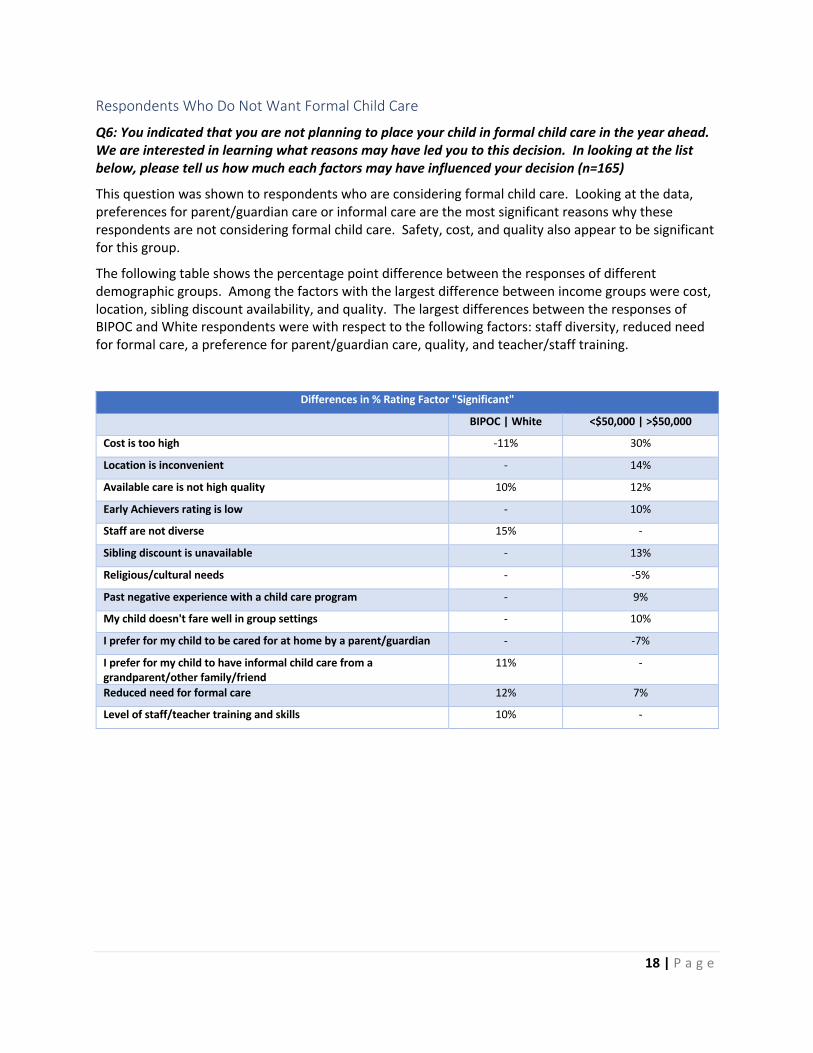
Q6: You indicated that you are not planning to place your child in formal child care in the year ahead. We are interested in learning what reasons may have led you to this decision. In looking at the list below, please tell us how much each factors may have influenced your decision (n=165)
This question was shown to respondents who are considering formal child care. Looking at the data, preferences for parent/guardian care or informal care are the most significant reasons why these respondents are not considering formal child care. Safety, cost, and quality also appear to be significant for this group.
The following table shows the percentage point difference between the responses of different demographic groups. Among the factors with the largest difference between income groups were cost, location, sibling discount availability, and quality. The largest differences between the responses of BIPOC and White respondents were with respect to the following factors: staff diversity, reduced need for formal care, a preference for parent/guardian care, quality, and teacher/staff training.
Differences in % Rating Factor "Significant"
BIPOC | White <$50,000 | >$50,000
Cost is too high -11% 30%
Location is inconvenient - 14%
Available care is not high quality 10% 12%
Early Achievers rating is low - 10%
Staff are not diverse 15% -
Sibling discount is unavailable - 13%
Religious/cultural needs - -5%
Past negative experience with a child care program - 9%
My child doesn't fare well in group settings - 10%
I prefer for my child to be cared for at home by a parent/guardian - -7%
I prefer for my child to have informal child care from a grandparent/other family/friend
11% -
Reduced need for formal care 12% 7%
Level of staff/teacher training and skills 10% -

19 | P a g e
87%
85%
79%
73%
67%
69%
60%
66%
56%
54%
59%
45%
38%
34%
27%
28%
19%
11%
10%
11%
11%
14%
25%
17%
27%
14%
31%
31%
7%
31%
32%
24%
26%
23%
23%
18%
3%
4%
10%
13%
8%
14%
13%
20%
13%
15%
34%
24%
30%
43%
47%
50%
58%
71%
0% 10% 20% 30% 40% 50% 60% 70% 80% 90%
My child doesn't fare well in group settings
Language(s) spoken by the child care provider don't meet my needs
Sibling discount is unavailable
Past negative experience with a child care program
Staff are not diverse
Religious/cultural needs
Early Achievers rating is low
The hours they are open don't match my schedule
Location is inconvenient
Curriculum or lesson plan doesn't meet my needs
Other (please explain):
Level of staff/teacher training and skills
Reduced need for formal care
Available care is not high quality
Cost is too high
Safety concerns about child care
I prefer for my child to have informal child care from a grandparent/otherfamily/friend
I prefer for my child to be cared for at home by a parent/guardian
Significant factor Important but not critical Not a significant factor

20 | P a g e
Respondents Who Want Formal Child Care
The following series of questions were only shown to those with children 0-5 who are currently in formal child care or who would consider formal child care in the future.
Q7: Does the child care you have now meet your needs? (n=578)
For those who are open to or currently use formal child care, half of the families report that their child care needs are not being met. Cost and availability were each barriers for 19% of respondents and those who responded No, something else mentioned pandemic-related struggles and combinations of cost and availability.
For those with incomes less than $50,000, they were 21 percentage points more likely to say affordability is a barrier and 16 percentage points less likely to say that their needs are being met. By region, Northwest respondents were 11 percentage points less likely to choose No, something else compared to Bellingham respondents. Northwest respondents were also 12 percentage points more likely to indicate that availability was a barrier compared to East respondents. There were no significant differences by race.
<$50,000 | >$50,000 NW | Bellingham NW | E
Yes -16% - -
No, I would like more child care but I cannot afford it
21% - -
No, I would like more child care but there is none available at the time/location I need
- - 12%
No, something else (please explain): - -10% -
12%
19%
19%
50%
0% 10% 20% 30% 40% 50% 60%
No, something else (please explain):
No, I would like more child care but there is none availableat the time/location I need
No, I would like more child care but I cannot afford it
Yes
Does the child care you have now meet your needs?

21 | P a g e
Q8: When you need help looking after your child, what options do you prefer? Please rate the following based on your preferences: (n=567)
The majority of respondents prefer care by a parent/guardian (61%), followed by licensed child care centers (57%), and part-time preschool (53%). Informal care (47%) and Promise-K (46%) were also preferred by a large share of respondents. Child care offered at a licensed family home, on the other hand, was only preferred by 15% and 44% do not plan to use this type of child care.
Respondents with incomes less than $50,000 were more likely than respondents with higher household incomes to indicate that they prefer each type of child care, with the exception of informal child care and care by a parent/guardian. By geography, Northwest residents were 12 to 29 percentage points less likely than both Bellingham and East residents to indicate that they prefer care by a parent/guardian, through a licensed center, or through a part-time preschool program. Bellingham respondents were more likely to indicate that they prefer informal child care (10 percentage points) and less likely to prefer care in a licensed family home (11 percentage points) compared to Northwest respondents. There are no significant differences by race. Single parent/guardian respondents were less likely to prefer informal or parent/guardian care, and more likely to prefer center-based care. Parents of infants are more likely to prefer parent/guardian or informal care than those with older children.
Differences: “I prefer this type of child care”
<$50,000 | >$50,000
NW | Bellingham
NW | E Single-Parent | Dual-Parent
Parent of Infant
Child care in a licensed child care center 6% -19% -23% 16%
Child care in a licensed family home 10% 11% - -
Part-time preschool program 5% -13% -12% -
Informal child care (i.e. grandparents, neighbor, friend, other family, etc.)
-7% - - -14% 9%
Cared for by parent/guardian - -20% -29% -16% 12%
44%
16%
15%
18%
14%
17%
41%
38%
38%
29%
29%
22%
15%
46%
47%
53%
57%
61%
0% 10% 20% 30% 40% 50% 60% 70%
Child care in a licensed family home
Child care offered at a school (i.e. Promise-K)
Informal child care (i.e. grandparents, neighbor, friend, otherfamily, etc.)
Part-time preschool program
Child care in a licensed child care center
Cared for by parent/guardian
When you need help looking after your child, what options do you prefer? Please rate the following based on your preferences:
I prefer this type of child care
I am open to using this type of child care, but it wouldn't be one of my top choices
I don't plan to use this type of child care

22 | P a g e
Q9: What type of child care do you have now? (select all that apply) (n=571)
Among respondents, informal and part-time care were most common. While all of these respondents expressed an interest in formal child care, 17% do not currently have formal or informal care. Most flexible/unconventional care needs reflected work schedules or COVID-19 impacts.
Respondents with incomes less than $50,000 were slightly less likely to have part-time care and more likely to not currently have child care. Bellingham respondents were slightly less likely to be using informal care than both East and Northwest respondents, as well as being more likely than East respondents to have part-time care. Northwest respondents were more likely than East respondents to have part-time care and to have year-round care. There were no significant differences by race.
E | Bellingham NW | Bellingham NW | E
Part-time (half-days or 2-3 days per week) -16% - 20%
Year-round - - 10%
Informal child care 12% 10% -
6%
11%
11%
17%
30%
41%
41%
0% 5% 10% 15% 20% 25% 30% 35% 40% 45%
Seasonal
Flexible or unconventional hours (i.e. night shift):
Year-round
None
Full-time (40+ hours per week)
Part-time (half-days or 2-3 days per week)
Informal child care (grandparents, friends, neighbor,babysitter, etc)
What type of child care do you have now? (select all that apply)

23 | P a g e
Q10: In the next year, what type of child care would best meet your needs? (select all that apply) (n=586)
In the previous question, 41% of respondents reported having part-time care; however, 53% would like part-time care. Similarly, 49% report wanting full-time care compared to 30% having full-time care. Similar disparities can be seen across care types. This is likely a reflection of the 50% of respondents who report that their current child care does not meet their needs due to cost, availability, or COVID-19 restrictions and impacts. For those looking for flexible options, work schedules and work schedule changes due to the pandemic were important factors.
There were no significant differences in the preferences by income, suggesting that the two groups have similar needs but those with incomes below $50,000 are less likely to be having their needs met. Responses also do not vary significantly by race.
By region, East respondents were less likely than both Bellingham and Northwest respondents to want part time care (23 percentage points). East respondents were also less likely than Northwest respondents to want year-round care (13 percentage points).
Single parent/guardian respondents were more likely to want full-time care and less likely to want part-time care than respondents from dual parent/guardian households. Respondents with infants had no significant difference in needs from those who did not have an infant.
E | Bellingham NW | E
Part-time (half-days or 2-3 days per week) -23% 23%
Year-round - 13%
3%
8%
15%
19%
49%
53%
0% 10% 20% 30% 40% 50% 60%
None
Seasonal
Flexible or unconventional hours (i.e. night shift):
Year-round
Full-time (40+ hours per week)
Part-time (half-days or 2-3 days per week)
In the next year, what type of child care would best meet your needs? (select all that apply)

24 | P a g e
Q11: As a parent/guardian, there are a lot of things to consider when deciding what child care option is right for you and your child. What factors are most important when you are looking for child care? (n=573)
The top three most significant factors for these respondents when they decide what child care option is right for them are: quality (98%), safety (97%), and a welcoming environment (90%). Availability (77%), staff (71%), hours (67%), cost (60%), flexibility and convenience (53%), and location (50%) were all significant factors for at least half of respondents. Other more specific needs (i.e. subsidy acceptance, religious/cultural needs, sibling discounts, and languages spoken by provider) were important to a more narrow segment of the sample.
Respondents with incomes less than $50,000 rated all the factors with more significance than respondents with higher household incomes, except for quality which was rated highly by both groups. Some of the largest gaps were accepting state subsidies, languages spoken, sibling discount, religious/cultural needs, and cost. By race, the biggest differences in responses were for accepting state subsidies and staff skill working with racially diverse classrooms, with BIPOC respondents more likely to rate the factors as Significant compared to White respondents.
By region, Bellingham and Northwest respondents reported the following as Significant, compared to East respondents: hours (less likely), curriculum (more likely), recommendation (more likely), and staff training (more likely). Compared to Bellingham respondents, both Northwest and East respondents more likely to say location is significant and less likely to say that staff skills in racially diverse classrooms is important. Lastly, compared to Northwest respondents, both Bellingham and East respondents were less likely to report Early Achievers ratings, languages spoken, and flexibility as important.
Differences in % Rating Factor "Significant"
BIPOC | White <$50,000 | >$50,000
E | Bellingham
NW | Bellingham
NW | E
Cost - 24% - - -
The hours they are open - 11% 16% - -15%
Location is convenient - 11% 10% 16% -
Early Achievers rating - 10% - 10% 14%
Staff diversity - 10% - - -
Curriculum or lesson plan - 14% -18% - 12%
Language(s) spoken by the child care provider - 16% - 12% 10%
Sibling discount available - 13% - - -
Religious/cultural needs - 6% - - -
Accept State subsidies 10% 36% 10% - -
Have openings when I enroll - 11% 11% - -
Recommended by someone I trust - -7% -19% - 24%
Flexibility and convenience - 9% - 11% 16%
Staff/teacher training and skills - 8% -17% - 16%
Other (please explain): 14% 7% - -13% -10%
Staff are skilled in working with racially diverse classrooms
14% 9% -14% -16% -

25 | P a g e
79%
71%
54%
57%
42%
26%
26%
24%
13%
7%
4%
3%
4%
6%
1%
3%
1%
0%
0%
12%
23%
34%
11%
48%
56%
50%
47%
51%
44%
47%
44%
35%
28%
27%
20%
10%
3%
2%
10%
7%
12%
32%
10%
18%
24%
29%
36%
49%
50%
53%
60%
67%
71%
77%
90%
97%
98%
0% 20% 40% 60% 80% 100% 120%
Accept State subsidies
Religious/cultural needs
Sibling discount available
Other (please explain):
Language(s) spoken by the child care provider
Staff diversity
Early Achievers rating
Staff are skilled in working with racially diverse classrooms
Curriculum or lesson plan
Recommended by someone I trust
Location is convenient
Flexibility and convenience
Cost
The hours they are open
Staff/teacher training and skills
Have openings when I enroll
Welcoming environment for parents and children
Safety of child care
Quality of child care
Significant Factor Important but not critical Not a significant factor

26 | P a g e
Q12: Which of the following do you want to see more of in child care? (select all that apply) (n=553)
Looking at other child care attributes, there appears to be a strong preference for outdoor education (81%). Respondents would also like to see more quality food, guided transitions to school, behavioral supports, and diverse classrooms. Responses were similar between income groups, as well as between BIPOC and White respondents.
Compared to Bellingham respondents, East respondents were less likely to want to see quality food, outdoor education, parenting support, diverse classrooms, and multiple languages spoken; however, they were more likely to want transportation. Compared to Northwest respondents, Bellingham respondents were more likely to want diverse classrooms and less likely to want more faith-based options or transportation. Compared to East respondents, Northwest respondents were more likely to want to see more parenting support and multiple languages spoken; however, they were less likely to want more behavioral supports.
E | Bellingham NW | Bellingham NW | E
Quality food -11% - -
Outdoor education -14% - -
Behavioral supports - - -11%
Parenting support -17% - 15%
Diverse classrooms -30% -25% -
Faith-based options - 10% -
Multiple languages spoken to children -22% - 14%
Transportation to or from programs 24% 15% -
11%
23%
24%
25%
33%
41%
48%
50%
61%
64%
81%
0% 10% 20% 30% 40% 50% 60% 70% 80% 90%
Faith-based options
Transportation to or from programs
Screenings and specialized resources
Support services co-located with child care programs
Parenting support
Multiple languages spoken to children
Diverse classrooms
Behavioral supports
Guided transitions into school/kindergarten
Quality food
Outdoor education
Which of the following do you want to see more of in child care? (select all that apply)

27 | P a g e
Q13: What language(s) do you prefer your child care provider to speak when talking to you (or your child's other parent/guardian, if they have one)? (n=564)
Most respondents (92%) want to be communicated with in English, 6% do not have a preference, 1% prefer Spanish, and 1% prefer another language. Respondents with incomes greater than $50,000 were more likely to prefer English and less likely to have no preference than respondents with lower household incomes. There were no significant differences by region or race.
Other (please specify): • it's beneficial to a child to learn multiple
languages. So I support many languages as long as it, doesn't cause any confusion for children
• Any other language than English. My children being bilingual would benefit from hearing another foreign language.
• Portuguese • Vietnamese
• English / Japanese • If teaching language, talk to me the same as my kid.
• Mandarin • Bilingual Spanish/english
1% 1%
6%
92%
What language(s) do you prefer your child care provider to speak when talking to you (or your child's other parent/guardian, if they have one)?
Spanish
Other (please specify):
No preference
English

28 | P a g e
Q14: What language(s) do you prefer your child care provider to speak when talking to your child? (n=567)
In comparison, when asked what language respondents would like child care providers to use when communicating with their children English had a somewhat lower preference (72%), while a larger percentage had no preference (19%) or preferred Spanish (3%). For those who responded Other, many reported an interest in a bilingual environment (primarily English/Spanish). Respondents with incomes less than $50,000 were less likely to prefer English and more likely to have no preference or be interested in another language. Both Northwest and East respondents were more likely than Bellingham respondents to prefer English. Northwest respondents were less likely than Bellingham respondents to have No Preference.
Other (please specify):
• English and Spanish (13 respondents) • A combination • English + unspecified other language (8
respondents) • I would love my child to learn another language but
we only speak english at home • Bilingual (6 respondents • English / Japanese
• English, but can understand child with aproxia. • Vietnamese • I’d want a structured program for a second
language • English is preferred but would love a dual
immersion program with any other language. • I wish they exposed to more languages in the
classroom • Multiple
• But want more language immersion options • Mandarin
• Japanese
3%
7%
19%
72%
What language(s) do you prefer your child care provider to speak when talking to your child?
Spanish
Other (please specify):
No preference
English

29 | P a g e
Q15: If you were to enroll your child in a formal child care program outside your home, where would you like it to be? (n=520)
Respondents were fairly evenly distributed between wanting child care near work/school (32%), between work/school and home (29%), or near home (26%). For those looking for child care near a location not listed, many respondents wanted child care near or on-site at their child’s school.
Preferences were similar between income groups, with respondents with incomes less than $50,000 being slightly more likely to prefer care somewhere between home and work. Responses by region were also similar; however, Northwest respondents were 11 percentage points more likely to want child care near work/school compared to East respondents. There were no significant differences by race.
Near another location: • Child's school (15 respondents, Blaine schools and
Kendall Elementary were each mentioned once) • My mom
• grandparents home • lummi early learning center • Location is not a top for me it is making sure my
child is happy and comfortable there. • With younger sibling
• A location with great access to outdoors or next would be school
• Work is remote, so home is same as work. Outdoor locations preferred
2%
4%8%
26%
29%
32%
If you were to enroll your child in a formal child care program outside your home, where would you like it to be?
I do not plan to enroll my child in a formalchild care program outside of my home
Near another location:
No preference
Near home
Between home and work/school
Near my work or school

30 | P a g e
Q16: To help with our analysis, we would like to know approximately where you live (we will look at the information by school district or Census Tract). Please use the map below to drop a pin near where you live: (n=450)
This question was asked of respondents with children (0-5 and/or school age) who are open to formal child care. Based on this data, we see that the sample has an 11 percentage point overrepresentation of Bellingham residents and a 1-2 percentage point underrepresentation of residents of all other Whatcom County residents.
School District % Respondents % Whatcom Households6 Bellingham 62% 53% Blaine 5% 9% Ferndale 12% 14% Lynden 9% 8% Meridian 4% 5% Mt. Baker 6% 7% Nooksack Valley 3% 4%
6 Census Reporter. “Profile.” https://censusreporter.org

31 | P a g e
Q17: If you could choose the ideal location for child care, where would it be? Please use the map below to drop a pin near your ideal location: (n=412)
Given that most respondents want child care close to work or between work and school, this datapoint is important in determining where demand will be. In this case, many residents of other school districts want their child care to be located within in the boundaries of the Bellingham School District.
School District % Respondents Bellingham 70% Blaine 4% Ferndale 10% Lynden 8% Meridian 4% Mt. Baker 4% Nooksack Valley 1%

32 | P a g e
Respondents with School-Age Children
Q18: Do you have any school-age children in your household who you would consider putting in formal child care? (n=1,184).
Of those respondents who have school-age children in their household, 31% are interested in putting their child in formal child care. Respondents with household incomes greater than $50,000 were slightly more likely to not have school-age children and slightly less likely to say they would only consider informal care for their school-age child. BIPOC respondents were more likely than White respondents to not plan to enroll their child in any form of child care. There were no significant differences between regions.
13%
17%
31%
40%
0% 5% 10% 15% 20% 25% 30% 35% 40% 45%
No, I have school-age children in my household but I would onlyconsider putting them in informal child care
No, I have school-age children in my household but I don't plan toput them in any type of child care
Yes, I have school-age children in my household who I wouldconsider putting in formal child care
No, there are no school-age children in my household
Do you have any school-age children in your household who you would consider putting in formal child care?

33 | P a g e
Q19: Using your mouse or finger, please drag and drop the following items in your order of importance when looking for child care for the school-age children in your household. Your top priority should be ranked as 1 and your lowest priority should be ranked 6. (n=348)
This question was only shown to those who have school-age children who they would consider putting in formal child care. When asked to rank importance for choosing school-age formal child care, respondents put the most weight on licensing status, enriching content, and partnerships with their child’s school. No respondents elaborated on their “Other” response. By region, the factors were ranked as follows:
• Bellingham: enriching content, licensed child care program, partnership with school, offers care 5 days/week, same program as siblings, other
• East: licensed child care program, offers care 5 days/week, enriching content, partnership with school, same program as siblings, other
• Northwest: partnership with school, licensed child care program, offers care 5 days/week, enriching content, same program as siblings, other
Average
Licensed child care program 2.83
Enriching content 3.01
Partnership with school 3.07
Offers care 5 days/week 3.16
Same program as siblings 3.91
Other (please explain) 5.03

34 | P a g e
Demographics
Q20: What best describes your current employment or other time commitments? (n=1,016)
Most respondents (67%) were employed and either working from home or in-person. Stay-at-home parents made up 13% of respondents and 12% were both working and attending school.
Q21: As we move through 2021, we expect many of the measures put in place because of COVID-19 to change. Do you expect your employment status or location (from home vs. in person) to change after the pandemic is over? (n=1,016)
In the coming year, 42% of respondents expected their employment status or location to change. If they responded No, they were directed to Q23.
1%
1%
2%
5%
12%
13%
29%
38%
0% 5% 10% 15% 20% 25% 30% 35% 40%
In School: primarily in person classes
In School: primarily online classes
Unemployed
Other responsibilities (please explain):
A mix of working/schooling from home and from another location
Stay-at-home parent/caregiver
Employed: working from home
Employed: not working from home
What best describes your current employment or other time commitments?
42%
58%
As we move through 2021, we expect many of the measures put in place because of COVID-19 to change. Do you expect your employment status or
location (from home vs. in person) to change after the pandemic is over?
Yes No

35 | P a g e
Q22: After the pandemic, do you expect to be (n=421)
After the pandemic, the most common change was to working in-person. Those moving to in-person work may be coming from doing at-home work, being a stay-at-home parent/caregiver, or any other category.
Other responsibilities (please explain):
• Employed, mix of at-home and in-person (12) • Stay-at-home parent and part-time work (2)
Q23: Does your child have another parent/guardian who shares caregiving responsibilities? (n=1,010)
Of the households surveyed, 82% of respondents reported that their child had another parent/guardian who shares caregiving responsibilities. If the respondent answered No, they were directed to Q27.
1%
1%
2%
2%
3%
4%
24%
64%
0% 10% 20% 30% 40% 50% 60% 70%
Unemployed
In School: primarily online classes
Stay-at-home parent/caregiver
In School: primarily in person classes
Employed: working from home
Other responsibilities (please explain):
A mix of working/schooling from home and from another…
Employed: not working from home
After the pandemic, do you expect to be:
82%
18%
Does your child have another parent/guardian who shares caregiving responsibilities?
Yes No

36 | P a g e
Q24: What best describes the current employment or other time commitments of your child's other parent/guardian? (n=832)
These second parent/caregivers were more likely to be working (especially in-person) and less likely to be a stay-at-home parent/caregiver.
Q25: As we move through 2021, we expect many of the measures put in place because of COVID-19 to change. Do you expect your child's other parent/guardian's employment status or location (from home vs. in person) to change after the pandemic is over? (n=829)
Their employment status and location was also not as likely to change in the coming year. Those who said No, were directed to Q27.
0%
1%
3%
3%
6%
8%
23%
56%
0% 10% 20% 30% 40% 50% 60%
In School: primarily in person classes
In School: primarily online classes
Unemployed
Other responsibilities (please explain):
A mix of working/schooling from home and from another location
Stay-at-home parent/caregiver
Employed: working from home
Employed: not working from home
What best describes the current employment or other time commitments of your child's other parent/guardian?
23%
77%
As we move through 2021, we expect many of the measures put in place because of COVID-19 to change. Do you expect your child's other parent/guardian's
employment status or location (from home vs. in person) to change after the pandemic is over?
Yes No

37 | P a g e
Q26: After the pandemic, do you expect your child's other parent/guardian to be (n=188)
Again, a shift to in-person employment was most common.
Other responsibilities (please explain):
• More hours and not working at home (4) • Retiring
• Working at a school (2) • More travelling for work
0%
1%
1%
2%
4%
5%
14%
74%
0% 10% 20% 30% 40% 50% 60% 70% 80%
In School: primarily online classes
Unemployed
Stay-at-home parent/caregiver
In School: primarily in person classes
Employed: working from home
Other responsibilities (please explain):
A mix of working/schooling from home and from another location
Employed: not working from home
After the pandemic, do you expect your child's other parent/guardian to be:

38 | P a g e
Q27: We are interested to learn how the pandemic has impacted your household. In thinking about how your household has been impacted by COVID-19, have any of the following been true for you? (select all that apply) (n=848)
Nearly three quarters of respondents experienced an increased difficulty balancing work and caring for children because of the pandemic. Increased mental and behavioral health needs were also common among this sample.
Other (please explain):
• Cost (13) • Reduced employment (11)
• Child care availability/school closure (10) • Child isolation (5)
• More involvement in child’s education (4) • Special needs support (4)
• Divorce/separation (4) • Increased household responsibilities (3)
• Using leave to care for children (3) • Spending more positive time with family (3)
• Increased stress (2)
5%
5%
8%
8%
13%
15%
34%
44%
74%
0% 10% 20% 30% 40% 50% 60% 70% 80%
We have had to move to a different housing arrangement
I or someone in my household has tested positive for COVID-19
Our housing is more at risk due to financial insecurity
Other (please explain):
I or someone in my household has lost their job
I or someone in my household has had their income increased
I or someone in my household has had their income reduced
Increased mental health/behavioral health needs
Increased difficulty balancing work and caring for children
We are interested to learn how the pandemic has impacted your household. In thinking about how your household has been impacted by COVID-19, have any of
the following been true for you? (select all that apply)
39 | P a g e
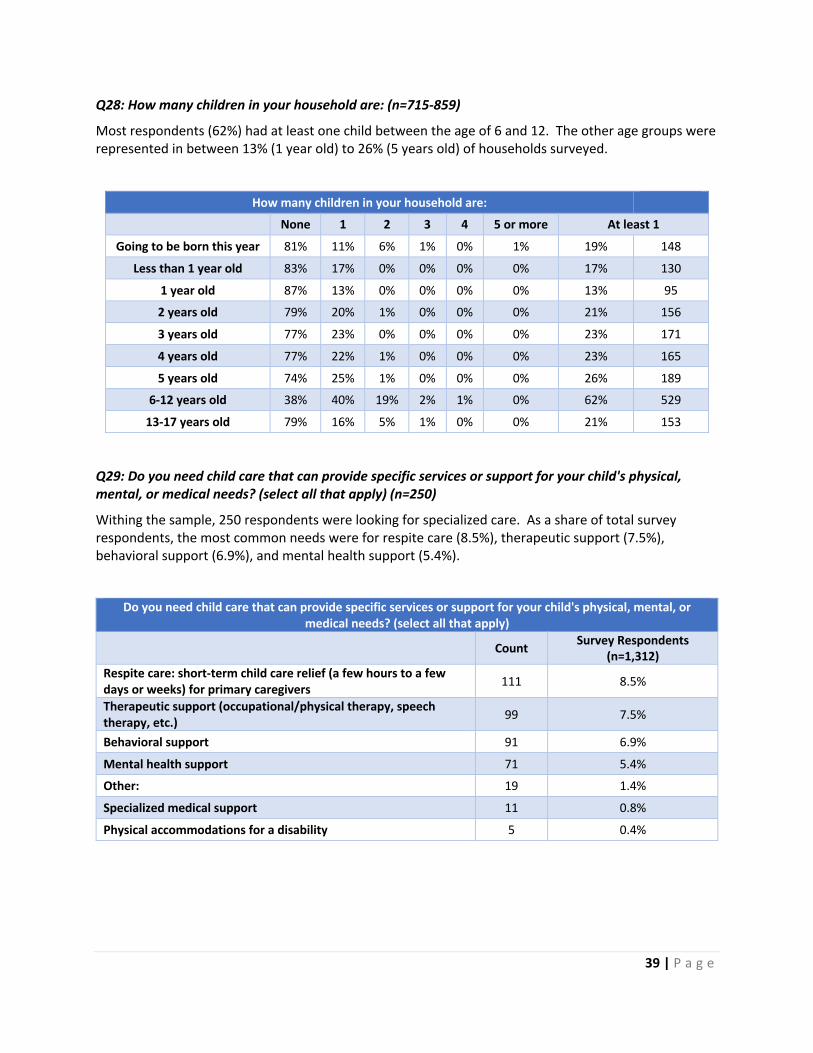
Q28: How many children in your household are: (n=715-859)
Most respondents (62%) had at least one child between the age of 6 and 12. The other age groups were represented in between 13% (1 year old) to 26% (5 years old) of households surveyed.
How many children in your household are: None 1 2 3 4 5 or more At least 1
Going to be born this year 81% 11% 6% 1% 0% 1% 19% 148
Less than 1 year old 83% 17% 0% 0% 0% 0% 17% 130
1 year old 87% 13% 0% 0% 0% 0% 13% 95
2 years old 79% 20% 1% 0% 0% 0% 21% 156
3 years old 77% 23% 0% 0% 0% 0% 23% 171
4 years old 77% 22% 1% 0% 0% 0% 23% 165
5 years old 74% 25% 1% 0% 0% 0% 26% 189
6-12 years old 38% 40% 19% 2% 1% 0% 62% 529
13-17 years old 79% 16% 5% 1% 0% 0% 21% 153
Q29: Do you need child care that can provide specific services or support for your child's physical, mental, or medical needs? (select all that apply) (n=250)
Withing the sample, 250 respondents were looking for specialized care. As a share of total survey respondents, the most common needs were for respite care (8.5%), therapeutic support (7.5%), behavioral support (6.9%), and mental health support (5.4%).
Do you need child care that can provide specific services or support for your child's physical, mental, or medical needs? (select all that apply)
Count Survey Respondents (n=1,312)
Respite care: short-term child care relief (a few hours to a few days or weeks) for primary caregivers 111 8.5%
Therapeutic support (occupational/physical therapy, speech therapy, etc.) 99 7.5%
Behavioral support 91 6.9%
Mental health support 71 5.4%
Other: 19 1.4%
Specialized medical support 11 0.8%
Physical accommodations for a disability 5 0.4%

40 | P a g e
Other:
• Physical Activity (3) • High Cost
• Allergies and Dietary Requirements (3) • Children miss other children
• Arts/Cultural Enrichment (2) • Type 1 Diabetes • More Mental/Behavioral Health Training and
Availability for Child Care (2) • Needs are being met without child care
• Speech • Autism support
• Help with school work (tutoring) • ABA Therapy
• Highly capable learner
Q30: Have you ever used a child care option that you were uncomfortable with out of necessity (such as leaving your child home alone or in the care of someone you did not feel safe leaving your child with)? (n=995)
Approximately one-quarter of respondents reported that they had used a child care option in the past that they did not feel safe with. Further research could determine what the source of this discomfort was (i.e. pandemic safety concerns, children left home alone, etc.) and what factors contributed to this option being a necessity. There is no significant difference in responses by race; however, respondents with household incomes less than $50,000 and single-parent respondents were more likely to have used care they were uncomfortable with.
25%
75%
Yes No

41 | P a g e
Q31: Currently, or in the last 2 years, has your household been eligible for subsidized child care (through Washington State's Working Connections Child Care (WCCC) subsidy)? (n=770)
In this sample, 93% of respondents reported that they were not eligible for WCCC. Based on the incomes reported in the survey, it would appear that many respondents may not realize that they are eligible for subsidized child care.
Q32: Would someone in your household consider themselves any of the following? (select all that apply) (total selections = 79)
Among all survey respondents, 2.1% were foster parents, 1.8% were members of a First Nation, 1.4% had experienced homelessness in the last 3 years, 0.5% were currently experiencing homelessness, and 0.2% were migrant farm workers.
Would someone in your household consider themselves any of the following? (select all that apply)
% of Question Respondents
(n=79) Count
Survey Respondents
(n=1,312) Foster parent 39% 28 2.1%
A member of a First Nation 32% 23 1.8% Experienced homelessness in the last 3 years (including doubled up,
couch surfing, staying in an emergency shelter, etc.) 26% 19 1.4%
Currently experiencing homelessness (including doubled up, couch surfing, staying in an emergency shelter, etc.) 8% 6 0.5%
Migrant farm worker 4% 3 0.2%
7%
93%
Currently, or in the last 2 years, has your household been eligible for subsidized child care (through Washington State's Working Connections Child Care (WCCC)
subsidy)?
Yes No

42 | P a g e
Q33: What is the primary language spoken in your household? (n=1,012)
Survey respondents primarily spoke English in their household (95%), with 3% speaking Spanish and 2% speaking another language.
Other (please specify):
• Punjabi (3) • German (2) • Japanese • Gujrat • Vietnamese • Arabic
• Spanish (2) • Romanian • Russian • Cantonese • Chinese
Q34: Which gender do you prefer to identify as? (n=993)
The majority of respondents identified as women (83%) with 14% identifying as men.
3%
95%
2%
What is the primary language spoken in your household?
Spanish
English
Other (please specify):
0.1%
0.4%
0.5%
1.9%
14.1%
83.0%
0.0% 10.0% 20.0% 30.0% 40.0% 50.0% 60.0% 70.0% 80.0% 90.0%
Agender
Gender queer/fluid
Nonbinary
Prefer not to say
Man
Woman
Which gender do you to identify as?

43 | P a g e
Q35: What race(s) are represented within your household? (select all that apply) (total responses = 1,129, n=983)
Overall, the respondents to this survey appear to reflect the racial makeup of Whatcom County well. The data is not directly comparable to Census data because the survey captures the racial makeup of households and Census data represents individuals. For instance, a household may consist of individuals of different races, but the individuals may not be multi-racial. The “Survey Households (adjusted)” column subtracts all multi-racial households from the individual race calculations and into the “Multi Racial” category.
What race(s) are represented within your household? (select all that apply)
Survey Households
Survey Households (adjusted)
Whatcom Individuals
American Indian or Alaska Native 3.9% 0.7% 3.4%
Asian 5.6% 1.1% 4.8%
Black/African American 3.2% 0.3% 1.3%
Native Hawaiian or other Pacific Islander 0.9% 0.1% 0.3%
White/Caucasian 83.3% 82.5% 86.2%
Some other race (please specify): 3.2% 1.9% N/A
Multi Racial N/A 13.3% 4.0%
Total 100% 100% 100%
Some other race (please specify):
• Hispanic (11) • Multi-Racial (2) • Human (2)
• Latinx (4) • Middle-Eastern (3) • Jewish
• Mexican (4) • Spaniard (3) • European
Q36: Is anyone in your household of Hispanic, Latino, or Spanish origin? (n=986)
In terms of Hispanic, Latinx, and Spanish heritage, the sample appears to accurately reflect the Whatcom County population.
Is anyone in your household of Hispanic, Latino, or Spanish origin?
Survey Whatcom
Yes 11.0% 9.8%
No 89.1% 90.2%

44 | P a g e
Q37: Please select the option that best describes your annual household income. (n=968)
According to the Census Bureau, the median household income in Whatcom County in 2019 ranged from $74,005 for a two-person household, up to $96,303 for a 4-person household. This is similar to the median income in this sample, which was somewhere between $80,000 and $100,000.
1%
2%
3%
5%
5%
7%
8%
9%
7%
9%
16%
10%
7%
4%
3%
5%
0% 2% 4% 6% 8% 10% 12% 14% 16% 18%
$0 - $10,000
$10,000 - $20,000
$20,000 - $30,000
$30,000 - $40,000
$40,000 - $50,000
$50,000 - $60,000
$60,000 - $70,000
$70,000 - $80,000
$80,000 - $90,000
$90,000 - $100,000
$100,000 - $120,000
$120,000 - $140,000
$140,000 - $160,000
$160,000 - $180,000
$180,000 - $200,000
$200,000 or more
Please select the option that best describes your annual household income.

45 | P a g e
Q38: How much does your household spend on housing each month (including rent or mortgage payments)? (n=983)
The median household spending on housing each month in the sample is somewhere between $1,000 and $2,000. 66% of respondents spend between $1,000 and $2,500 per month on housing.
3%
1%
2%
2%
3%
24%
34%
18%
8%
3%
2%
1%
0% 5% 10% 15% 20% 25% 30% 35% 40%
$0 or not applicable
$0 to $250
$250 to $500
$500 to $750
$750 to $1,000
$1,000 to $1,500
$1,500 to $2,000
$2,000 to $2,500
$2,500 to $3,000
$3,000 to $3,500
$3,500 to $4,000
$4,000 or more
How much does your household spend on housing each month (including rent or mortgage payments)?