preliminary demand analysis - undp/oso procurement · pdf file · 2006-12-19this...
TRANSCRIPT

D E M A N D
A N A L Y S I S
Preliminary Demand Analysis For Goods & Services Required by Tsunami Affected Countries 31 March 2005 UNDP/IAPSO Copenhagen
Table of Content
1. Executive Summary__________________________________________________ 3
2. Introduction ________________________________________________________ 4
3. Project Objectives ____________________________________________________ 5
4. Project Impact_______________________________________________________ 5 4.1. Deliverables ___________________________________________________________5 4.2. Spin-offs ______________________________________________________________5
5. Method ____________________________________________________________ 6
6. Demand for different goods & services by Country__________________________ 7 6.1. Maldives ______________________________________________________________7 6.1.1. Estimated Damage and Financing Needs _________________________________7 6.1.2. Estimated Reconstruction Costs ________________________________________7 6.2. Sri Lanka _____________________________________________________________9 6.2.1. Damages and Needs by Region ________________________________________10 6.3. Indonesia ____________________________________________________________12 6.3.1. The Preliminary Damage and Loss Assessment __________________________12 6.4. India ________________________________________________________________15
7. Demand Matrices ___________________________________________________ 16 7.1. Demand patterns______________________________________________________16 7.2. Summary Table_______________________________________________________18 7.3. Maldives Demand Matrix_______________________________________________27 7.4. Sri Lanka Demand Matrix ______________________________________________43 7.5. Indonesia Demand Matrix ______________________________________________65 7.6. India Demand Matrix __________________________________________________93
8. Funding__________________________________________________________ 102 8.1. Flash Appeal ________________________________________________________102 8.2. Australian relief packages _____________________________________________107 8.3. Canada _____________________________________________________________109 8.4. Denmark ___________________________________________________________110 8.5. Germany ___________________________________________________________112 8.6. Norway_____________________________________________________________113
9. Next Steps ________________________________________________________ 116

3
1. Executive Summary
The Tsunami of 26 December 2004, referred to as the worst natural disaster in living memory, will require an unprecedented level of procurement carried out by UN agencies, donor development agencies, national governments and NGO’s. The potential demand for goods, services and civil works generated by the recovery and reconstruction efforts will place enormous strain upon the known supply sources, with the possibility of over-burdening these. Within UNDP’s role of supporting the overall procurement effort and facilitating its coordination, UNDP has initiated a strategic procurement project encompassing an analysis of the demand and conversely the regional supply potential with the ultimate objective providing useful information that may guide co-operation and collaboration over tsunami procurement.. This preliminary demand analysis constitutes the first deliverable of this project, one that aims to consolidate and provide an overview of the loss and damage assessments and reconstruction requirements as expressed by the various entities involved in the recovery and reconstruction phases. This information was gathered using resources in the field, as well as employing literature reviews of the damage assessments and other report from International Financial Institutions (IFI’s), the UN agencies, and donor development agencies and national governments. This analysis is deemed preliminary as the full scale of recovery and reconstruction measures have not been assessed completely at this point in time, but this analysis provides an overview of requirements that are currently identified. The preliminary demand analysis has identified requirements for products and services for; Sri Lanka (US$ 2.2B), the Maldives (US$0.15B), Indonesia (US$3.2B) and India (US$0.7b) totalling a value of US$ 6.2B. Initial estimates of recovery and reconstruction costs in the immediate aftermath of the disaster were put at US$ 7 billion1. As more details of recovery and reconstruction projects arise, it can well be expected that this figure will rise. The analysis identifies individual project requirements where these have been defined by implementing entities as well as assessments of losses and damages. These have been categorised by country, region, sector and where possible specific project references and implementation time frames. This manner of compilation and presentation of this information is designed to allow for the identification of demand patterns, and the subsequent formulation of procurement strategies. The data presented in the report will be used to identify supply markets for further analysis. Building an in-depth knowledge of these markets will enable2;
• More effective competition to supply the reconstruction effort • Improve procurement outcomes because approaches to the market can be
optimised 1World Bank Website at :http://www.worldbank.org.in/WBSITE/EXTERNAL/COUNTRIES/SOUTHASIAEXT/INDIAEXTN/0,,contentMDK:20336602~menuPK:295606~pagePK:141137~piPK:141127~theSitePK:295584,00.html 2 Regional Supply Market Analysis and Development Focusing on Post Tsunami Reconstruction Procurement, 15.01.2005

4
• More efficient and likely speedier procurement processes especially where these are supported by long term agreements and pre-qualified supplier arrangements; and,
• More effective supplier performance monitoring and management.
Sharing this knowledge with all UN agencies and other organisations involved in reconstruction related procurement will:
• Improve the use and coordination of scarce resources; and, • Where it facilitates procurement from within the region and especially from the
affected countries, enhance regional economic development Tsunami affected countries covered in this analysis include; The Maldives, Sri Lanka, Indonesia and India. The document presents a brief discussion outlining specific situations affecting each of the countries, prior to mapping the anticipated goods/ services and works requirements in the specifically designed demand matrices. A brief overview of the response to the UN Flash Appeal is presented in section 8 of the documents well as details of bi-lateral assistance are highlighted where this information was readily available. 2. Introduction
The United Nations Development Programme has initiated a project designed to assist the procurement of goods and services required by the Tsunami affected countries for recovery and reconstruction. It is specifically aimed at supporting UN organisations, donor agencies, NGOs and affected national governments operating in these countries. UNDP’s Inter-Agency Procurement Service Office (IAPSO) will carry out this project from UNDP’s Bangkok Regional Service Centre. From a procurement perspective the central issue to be addressed in the post-tsunami recovery and reconstruction is that all agencies involved in the effort are procuring goods, works and services from essentially the same markets. This intensive effort has the potential to provide much needed opportunity and investment into these supply markets, while also harbouring the threat of exhausting, overheating and potentially distorting the markets especially at the local and regional levels. While the initial sources of supply in the relief phase have often been sourced from outside the region, the fullest economic and social benefits will be achieved through local and regional sourcing for the recovery and reconstruction phases. To facilitate effective and collaborative sourcing strategies, as well as to assist key implementing agencies in obtaining reliable and accurate supply market data, this project will seek identify demand patterns and to analyse supply market capacity in order to recommend procurement strategies. This document presents a preliminary analysis of the demand for goods and services related to the recovery and reconstruction phase. This preliminary demand analysis is a working document that attempts to ascertain recovery requirements for goods and

5
services by analysing available damage assessments. Due to the limited information presently available, this document will function as a stimulus for further analysis. 3. Project Objectives
• Effectively support the post tsunami procurement effort of UNDP country offices in
the region • Facilitate cooperation between procuring entities focussed on post-tsunami
recovery and reconstruction • Identify the demand over time for goods, works and services from these entities • Identify supply markets within the region that will meet this demand • Analyse the key supply markets within the region to develop optimal procurement
strategies • Implement regional procurement strategies (including long-term agreements and
supplier pre-qualification) in co-operation with all interested procuring entities • Provide effective, efficient and accessible e-procurement tools to support
implementation and management of these strategies
4. Project Impact
4.1. Deliverables • A demand profile of goods, works and services required throughout the process • Communication of the demand profile to all interested parties • Communication of existing cooperative procurement arrangements of UN family
organisations • Workshop to identify opportunities for collaboration and co-operation • Analyses of prioritised supply markets • Communication of the supply market analyse to procuring entities • Development and implementation of local and regional procurement strategies
including long-term supplier agreements and supplier pre-qualification • E-procurement tools for use by interested procuring entities including e-catalogues,
e-tendering and on-line supplier pre-qualification and performance management to support regional procurement strategies where appropriate
• A best practice guide to post-crisis reconstruction procurement drawing upon the lessons learned
4.2. Spin-offs • Improving the use and coordination of scarce resources • More effective competition to supply the recovery and reconstruction effort • Improve procurement outcomes through optimising approaches to the market • More efficient and likely swifter procurement processes especially where t supported
by long-term agreements and pre-qualified supplier arrangements • Facilitating procurement from within the region and especially from the affected
countries, thus enhancing regional economic development • More effective supplier performance monitoring and management

6
5. Method
The preliminary demand analysis was conducted using the presently available needs assessments carried out by a number of agencies and government entities, including; the World Bank, Asian Development Bank, Various UN Agencies, Non Governmental Organisations and Donor organisations. This analysis is deemed preliminary given the amount of data currently available. As more information regarding specific requirements and implementation time frames for goods and services becomes available, it will be incorporated into the demand matrices presented in this document. When a critical mass of data has been accumulated a complete and detailed demand analysis will be finalised. The demand matrices were designed to provide an clear and succinct overview of the goods and services requirements recovery and reconstruction phase. Each entry in the matrices designates either and existing project or a damage assessment. In each case, information regarding country, implementing agency(s), the aim of the project or needs assessment, equipment and services requirements, prospective budgets and time lines are given. The summary table on page 18 provide a quick scan of the equipment and service requirements per country. Two main approaches were utilised to identify the preliminary goods and services requirements and to populate the demand matrices;
(i) Where specific data on current or impending projects was available (such project documents or briefs), this was extracted and extrapolated into the demand matrices.
(ii) Data presented in damage assessments give an overall picture of the type of
equipment and/or services that were lost or damaged. This data is presented in the demand matrices under the assumption that the equipment and/or services will be replaced, however this has not as yet been attributed to a specific project or implementing agency. This data is presented in the matrices by sector.
The demand matrices presented in this paper should be considered as dynamic, the information provided will be updated on a continuous basis as further information becomes available. The demand matrices and the subsequent summary tables form the basis for all interested procuring entities to identify opportunities for collaboration and cooperation. Once these opportunities are identified, an analysis of priority markets will be undertaken. Focus will be on the local and regional supplier base in order to develop effective procurement strategies. E-procurement tools to support these strategies will be made available.

7
6. Demand for different goods & services by Country
The section is design to give a broad overview of the damage assessments per country. The countries that have been included in this preliminary demand analysis are; • Maldives • Sri Lanka • Indonesia • India The data for the overviews presented in this section is primarily drawn from the World Bank, Asian Development Bank and UN Damage Assessment Reports for each the above countries.
6.1. Maldives The joint World Bank, Asian Development Bank and UN report on the Maldives, titled “Tsunami: Impact and Recovery; Joint Needs Assessment WB-ADB-UN”, dated 8 February 20053, is used to provide overall data on Loss & Need Assessment due to its extensiveness. It covers the entire country and all sectors. Details on specific needs for the various sectors can be found in the Maldives Demand Matrix on page 15.
6.1.1. Estimated Damage and Financing Needs Total damages are estimated to be about $470 million, close to 62% of GDP (see Table 1). About $298 million of this are direct damages, and the rest are indirect losses. Although the cost of damages appear high, the direct damages amount to about 8% of the replacement cost of the entire national capital stock, estimated at around $3.8 billion at 2004 prices. Compared to the other tsunami affected countries, Maldives has higher per capita income and greater capital stock in relation to their affected population. Moreover, there has been heavy investment in high-end tourist resorts. The tourism sector has the largest direct damages, with losses of $100 million (of which half is insured), followed by the housing sector with losses close to $65 million4.
The indirect damage estimates need to be treated with caution, particularly when it comes to tourism and livelihood. The largest indirect losses occurred in the tourism sector which has seen a sharp drop in tourist arrivals (as of end-January 2005, 7600 tourists are in Maldives as compared to 17,000 at the same time one year ago)5.
6.1.2. Estimated Reconstruction Costs Overall Needs. Reconstruction costs for some sectors may be higher than total losses due to the need to rebuild to higher standards to reduce vulnerability (e.g. housing) and because current construction or environmental standards are higher than when original facilities were built (e.g. sanitation), or because modern equipment or supplies are of higher quality and provide improved services (e.g. health, education). Some of the indirect losses cannot be recovered: production losses from fishing, agriculture, and
3 Tsunami: Impact and Recovery; Joint Needs Assessment, World Bank-Asian Development Bank-UN System, 8 February 2005
4 Ibid, Paragraph 25, page 9 5 Ibid, Paragraph 26, page 9
8
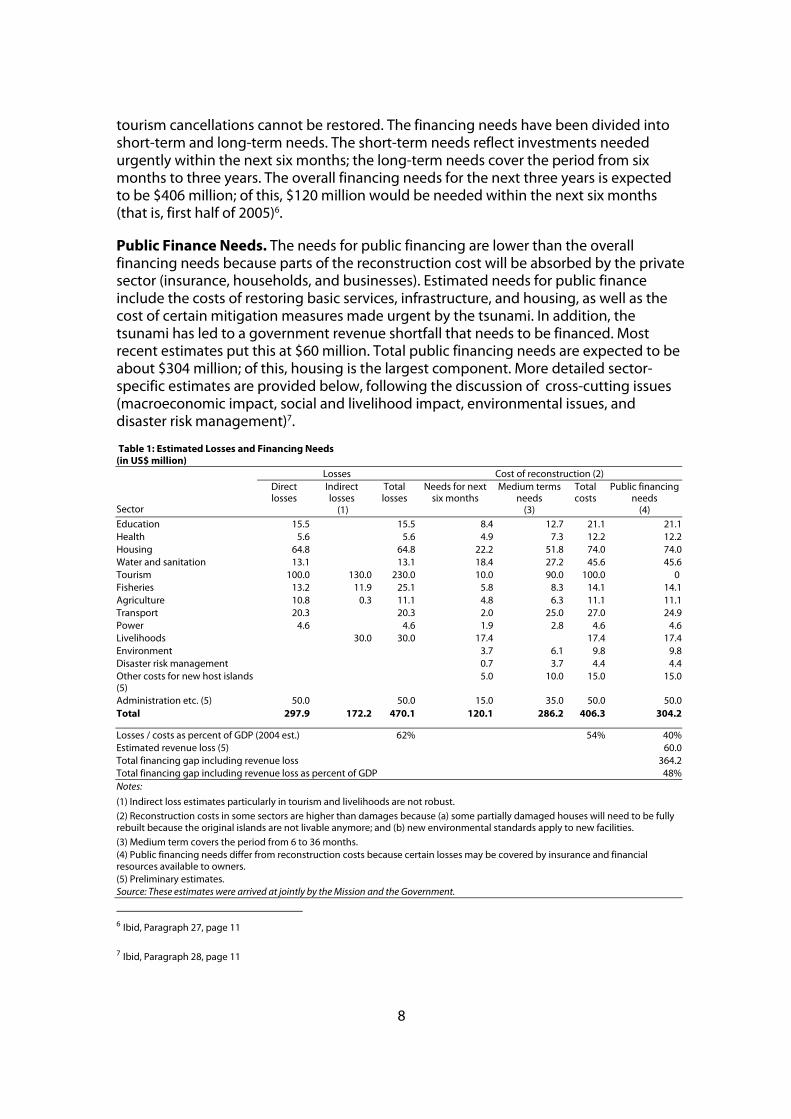
tourism cancellations cannot be restored. The financing needs have been divided into short-term and long-term needs. The short-term needs reflect investments needed urgently within the next six months; the long-term needs cover the period from six months to three years. The overall financing needs for the next three years is expected to be $406 million; of this, $120 million would be needed within the next six months (that is, first half of 2005)6. Public Finance Needs. The needs for public financing are lower than the overall financing needs because parts of the reconstruction cost will be absorbed by the private sector (insurance, households, and businesses). Estimated needs for public finance include the costs of restoring basic services, infrastructure, and housing, as well as the cost of certain mitigation measures made urgent by the tsunami. In addition, the tsunami has led to a government revenue shortfall that needs to be financed. Most recent estimates put this at $60 million. Total public financing needs are expected to be about $304 million; of this, housing is the largest component. More detailed sector-specific estimates are provided below, following the discussion of cross-cutting issues (macroeconomic impact, social and livelihood impact, environmental issues, and disaster risk management)7.
6 Ibid, Paragraph 27, page 11
7 Ibid, Paragraph 28, page 11
Table 1: Estimated Losses and Financing Needs (in US$ million)
Losses Cost of reconstruction (2)
Sector
Direct losses
Indirect losses
(1)
Total losses
Needs for next six months
Medium terms needs
(3)
Total costs
Public financing needs
(4) Education 15.5 15.5 8.4 12.7 21.1 21.1Health 5.6 5.6 4.9 7.3 12.2 12.2Housing 64.8 64.8 22.2 51.8 74.0 74.0Water and sanitation 13.1 13.1 18.4 27.2 45.6 45.6Tourism 100.0 130.0 230.0 10.0 90.0 100.0 0 Fisheries 13.2 11.9 25.1 5.8 8.3 14.1 14.1Agriculture 10.8 0.3 11.1 4.8 6.3 11.1 11.1Transport 20.3 20.3 2.0 25.0 27.0 24.9Power 4.6 4.6 1.9 2.8 4.6 4.6Livelihoods 30.0 30.0 17.4 17.4 17.4Environment 3.7 6.1 9.8 9.8Disaster risk management 0.7 3.7 4.4 4.4Other costs for new host islands (5)
5.0 10.0 15.0 15.0
Administration etc. (5) 50.0 50.0 15.0 35.0 50.0 50.0Total 297.9 172.2 470.1 120.1 286.2 406.3 304.2
Losses / costs as percent of GDP (2004 est.) 62% 54% 40%Estimated revenue loss (5) 60.0Total financing gap including revenue loss 364.2Total financing gap including revenue loss as percent of GDP 48%Notes:
(1) Indirect loss estimates particularly in tourism and livelihoods are not robust. (2) Reconstruction costs in some sectors are higher than damages because (a) some partially damaged houses will need to be fully rebuilt because the original islands are not livable anymore; and (b) new environmental standards apply to new facilities. (3) Medium term covers the period from 6 to 36 months. (4) Public financing needs differ from reconstruction costs because certain losses may be covered by insurance and financial resources available to owners. (5) Preliminary estimates. Source: These estimates were arrived at jointly by the Mission and the Government.
9
6.2. Sri Lanka The World Bank report on Sri Lanka, titled “Preliminary Damage and Needs Assessment”8 and dated January 10-28 2005, was used as a basis for the needs assessment due to its extensiveness. It covers the entire country and all sectors. Details on specific needs for the various sectors can be found in the demand matrix for Sri Lanka. Besides data from the WB report, the demand matrix also includes data from more specific reports that originate from OCHA, UN-HABITAT and WHO, specific references to these reports are given in the matrix. Overall damage is estimated to be around $1 billion (4.5 percent of GDP). However, many of these assets were concentrated in the private sector. The largest share of output losses appear in the fisheries and tourism sectors due to lost income and production. Many coastal fishermen and small scale farmers’ livelihoods were impacted by the tsunami, causing greater vulnerability to poverty. In addition, many people working in the informal sector who service the fisheries and tourism sectors and communities also lost their livelihoods temporarily; thus many may fall further into poverty in what were already poor areas. Losses to livelihoods are not listed separately in the table below in order to avoid double counting, as these losses have been incorporated into the fisheries, tourism, and agriculture sectors. It is also important to take into consideration that output losses are more difficult to estimate than asset losses, as figures depend upon extrapolation from existing data9. Overall incremental financing needs are estimated to amount to be around $1.5 to 1.6 billion. This is in addition to the $2-300 million that the Government of Sri Lanka estimates that it has already spent, and excludes further relief expenditures. In the short term, the majority of resources are required for housing, transportation infrastructure, and livelihood restoration for fishermen, small farmers, small and micro enterprises, and others. The recovery needs run parallel to the level of damage sustained by each sector, with some variation depending upon the recovery strategy and its intent to replace damaged assets with those of equal value, as in the cases of housing and health, or with upgrades to services and infrastructure, as in the cases of power, water supply and sanitation, and transportation (especially railways). In aggregate, this is very close to the current estimate of the Task Force for Rebuilding the Nation (TAFREN) (although with more significant differences at the sector level), and consistent with preliminary estimates released by Liberation Tigers of Tamil Eelam (LTTE). These estimates can be expected to converge over the coming weeks of further joint analysis10. The following table shows the losses and needs per sector.
8 Sri Lanka, 2005 Post-Tsunami Recovery Program, Preliminary Damage and Needs Assessment, prepared by Asian Development Bank, Japan Bank for International Cooperation and World Bank, Colombo, Sri Lank, 10-28 January 2005 9 Ibid, Paragraph 8, page 2 10 Ibid, Paragraph 9, page 3

10
Table 2: Preliminary Estimates of Losses and Financing Needs ($ Millions)11 Losses Financing Needs
Sector
Asset Loss
Output Loss****
Short Term
Medium Term
Total Needs
Housing 306-341 - 50 387-437 437-487 Roads 60 - 25 175 200 Water and Sanitation 42 - 64 53 117 Railways 15 - 40 90 130 Education 26 - 13 32 45 Health 60 - 17 67 84 Agriculture* 3 - 2 2 4 Fisheries* 97 200 69 49 118 Tourism* 250 130 130 - 130 Power 10 - 27 40-50 67-77 Environment 10 - 6 12 18 Social Welfare** - - 30 - 30 Excluded Items plus Contingency ***
90 30 120 150
Total ($ Millions, rounded) 970-1,000
330 500 1,000-1,100 1,500-1,600
Percent of GDP 4.4-4.6 1.5 7.0-7.3 *Includes estimates from livelihoods damage assessment of fishermen, small farmers, and small businesses in tourism totaling $140 million. **Targeted assistance to vulnerable groups. *** Includes items mentioned at the end of paragraph 4 and is estimated at about 10% of the total. ****Refers to 2005 and 2006. Source: Government of Sri Lanka and staff estimates.
6.2.1. Damages and Needs by Region A detailed breakdown by region and district of the estimated financing needs, including all sectors, is provided in the following Table 3.
11 Sri Lanka, 2005 Post-Tsunami Recovery Program, Preliminary Damage and Needs Assessment, prepared by Asian Development Bank, Japan Bank for International Cooperation and World Bank, Colombo, Sri Lank, 10-28 January 2005

11
Table 3: Sri Lanka Tsunami Financing Needs by Province, District and Sector12 ($ Millions)
Province/ District
Education
Health
Housing*
Power *
Water & Sanitation**
Fisheries ***
Tourism ****
Roads
Railways
Total
% of total
Province/ District
North East 30.2 56.2 317.6 27.6 87.6 62.6 7.2 132.3 53.1 774.4 58.3 North East
Batticaloa 7.85 17.84 66.78 7.77 18.3 8.23 0 30.76 17.4 174.93 13.2 Batticaloa Amparai 13.38 16.63 101.2 15.14 32.67 6.85 1.6 22.27 0 209.74 15.8 Amparai Trincomalee 5.46 14.89 35.82 3.55 9.07 19.77 5.6 31.82 35.7 161.68 12.2 Trincomalee
Mullaitivu 1.37 6.49 46.33 0 11.24 13.99 0 19.09 0 98.51 7.4 Mullaitivu
Kilinochchi 0 0.09 18.21 0 3.62 1.01 0 11.93 0 34.86 2.6 Kilinochchi
Jaffna 2.11 0.24 49.25 1.14 12.74 12.6 0 16.44 0 94.52 7.1 Jaffna
Mannar 0 0 0 0 0 0.13 0 0 0 0.13 0.0 Mannar
South 12.3 31.1 75.9 37.6 18.0 42.8 76.6 46.9 46.1 387.3 29.1 South
Hambantota 1.27 0.32 10.13 11.39 2.83 10.73 11.2 25.19 0 73.06 5.5 Hambantota
Matara 3.76 3.24 36.44 5.83 8.66 15.92 8 11.14 10.5 103.49 7.8 Matara
Galle 7.25 27.52 29.32 20.37 6.53 16.14 57.4 10.61 35.6 210.74 15.9 Galle
West 2.5 0.7 42.9 1.6 8.3 12.5 46.3 21.7 30.8 167.3 12.6 West
Kalutara 1.71 0.4 16.34 0.94 3.32 8.73 46.3 18.56 17.3 113.6 8.5 Kalutara
Colombo 0 0.32 25.1 0.6 4.6 0.32 0 3.18 13.5 47.58 3.6 Colombo
Gampaha 0.76 0 1.49 0.03 0.38 3.41 0 0 0 6.07 0.5 Gampaha
North West 0 0 0.14 0 0.03 0.18 0 0 0 0.35 0.03 North West
Puttalam 0 0 0.14 0 0.03 0.18 0 0 0 0.35 0.03 Puttalam Provinces
Total 45 88 437 67 114 118 130 201 130 1,329.3 100.0 Provinces
Total
NOTE: Does not include environment and agriculture needs due to unavailability of district specific data. Total needs for environment is US$18 million and for agriculture US$4 million.
* Low estimate ** Total damage cost, including indirect loss *** Including boats, fisheries harbors and buildings **** Including large hotels, guest houses, small hotels and hotel related assets such as souvenir shops, vehicles, etc.
12 Sri Lanka, 2005 Post-Tsunami Recovery Program, Preliminary Damage and Needs Assessment, prepared by Asian Development Bank, Japan Bank for International Cooperation and World Bank, Colombo, Sri Lank, 10-28 January 2005

12
6.3. Indonesia The World Bank report on Indonesia, titled “Preliminary Damage and Loss Assessment”13, and dated January 19-20 2005, is used to provide overall data on Loss & Need Assessment due to its extensiveness. It covers the entire country and all sectors. Details on specific needs for the various sectors can be found in the demand matrix for Indonesia and have been drawn from UN and UNDP Flash Appeal documents. All references are mentioned in the matrix. Indonesia’s leaders have expressed their vision for a National Recovery and Reconstruction Strategy. A successful reconstruction strategy will result in five primary outcomes14. • First, it will restore people’s lives – clean water to drink, health clinics and the
roads to get there, roofs over heads and a source of income to support families. • Second, it will restore the economy – jobs for people, markets for people to sell
and buy daily necessities, banks that lend to small-scale enterprises, shops for families to buy materials to rebuild their homes.
• Third, it will restore the system of local governance – local governments that represent people’s aspirations and ensure provision of basic services, like roads, water, markets, education and health services.
• Fourth, it will rebuild local governance and government. • Fifth, the strategy will implement a province-wide regional development plan. The common thread in all those is people and returning their lives and livelihoods.
6.3.1. The Preliminary Damage and Loss Assessment15 The total estimate of damages and losses from this catastrophe in Indonesia is Rp. 41.4 trillion, or $4.45 billion. Of the total, 66% constitutes damages, while 34% constitutes losses in the terms of income flows lost to the economy. The damage provides both an idea of the destruction of assets in the country as well as a baseline for defining the program of reconstruction. The amount of losses will directly impinge on the future economic performance of the country.
13 Indonesia: Preliminary Damage and Loss Assessment”, prepared by Bappenas (National Development Planning Agency) and the international Donor Community, 19-20 January 2005 14 Page 94-97 15 Ibid, Executive Summary, pages iii,iv,v

13
Table 4. Summary of Damages and Losses
The disaster primarily impacted private, not public, assets and revenues. Some 78% of total damages and losses accrued to the private sector, including households, whereas about 22% of damages and losses were borne by the public sector. This has important implications and poses particular challenges for the reconstruction strategy.
The damage and loss profile indicates that the priorities for reconstruction must lie in ways to rebuild the livelihoods and social fabric of the devastated communities. • Housing and shelter. Reconstruction of homes needs to be the first step in
rehabilitating livelihoods in the disaster-struck area as almost half of the total damage is due to the loss of housing. Repairing and constructing homes will be less costly when carried out at the community level and will also generate income at the local level. Local housing programs need to be based on public and participatory planning.
• Generating enterprise, commerce, and income creation. A local economic
revival strategy should also focus on local entrepreneurship and the promotion of micro/small enterprises, enhancing their capacity to respond to emerging market opportunities and encouraging new initiatives. During the rehabilitation phase many people will turn to micro-enterprise activities to generate an income. These re-emerging entrepreneurs will need to access to ideas, micro-finance, and know-how. Strategies that reach large numbers of people using mass-media and community-based approaches are often effective in disseminating this type of information.
• Rebuilding rural livelihoods: agriculture and fisheries. The livelihoods of
people in the agricultural sector and fisheries have been hardest hit. The loss of income in agriculture and fisheries make up more than one-third of total losses due to the disaster. In order to minimize losses in the flow of income, it is important to resuscitate these sectors as quickly as possible, possibly through extended micro-credit and grant programs.

14
• Providing public services. In many areas, local administrations no longer function. They should be re-launched as quickly as possible, through standard procedures for village elections. Village councils (BPDs) should be elected early, in order to aid in local reconstruction and to help prevent local capture of development aid.
• Assisting the newly vulnerable. The aid and reconstruction effort has to pay
particular attention to the newly created vulnerable populations, such as single-mothers and orphans. It is estimated that 75% of children who have a surviving mother do not live in extended families. These single mothers lack any support mechanism especially as the communal networks and social capital around them have also disappeared. On a striking note, the number of children who are estimated to have lost both parents is as high as 7,700 and going forward the aid effort needs to focus particular attention on the needs of these orphans
• Rebuilding communities. The reconstruction not only of houses and markets
but also of social structures and communities provides an opportunity for Acehnese to participate in their own governance and society building. Revival of the social fabric after the disaster requires empowering pesantren16 leaders to take an active part in rebuilding communities.
Developing a reconstruction strategy needs vision, the focus and involvement of the communities affected, strong implementation arrangements and monitoring systems. In devising a strategy to guide the reconstruction process, decision makers should build on the damage assessment by: (i) developing a reconstruction strategy through a consultative process; (ii) rapidly mobilizing of reconstruction funds and activities; (iii) focusing on the needs of the local population; (iv) establishing the highest fiduciary standards and efficient system managing the funds, and (v) updating and monitoring needs and results. Community consultation is imperative to devising the plan for reconstructing Aceh and North Sumatra. Implementing that plan and coordinating all elements of what will be an extremely complex undertaking is just as crucial. Rebuilding the devastated provinces will involve all levels of government from national to village as well as domestic and international organizations, bilateral and multilateral institutions, donors and community groups. Coordinating all these organizations within the overall recovery and reconstruction process, while promoting the interests of the local communities, is a major task. Bappenas is well placed for the role of coordinating the recovery and reconstruction activities but whoever assumes the role will only be first among equals. All stakeholders will have valuable contributions in planning the strategy, financing that recovery and ensuring the money and reconstruction are transparent, accountable and directed at those who need it.
16 Pesantren: Islamic residential learning center; teaches the Quran, the Arabic language, the sharia, and Muslim traditions and history

15
6.4. India The demand analysis for India has largely been based upon the Asian Development Bank, United Nations and World Bank joint demand and needs assessment of the socioeconomic and environmental impact of the December 26, 2004 tsunami in the states of Andhra Pradesh, Kerala and Tamil Nadu and the Union Territory (UT) of Pondicherry17. This report does not include the union territory of the Andaman and Nicobar Islands in the evaluation. The table below shows a summary of the preliminary assessment of damage and losses,
Table 5. Preliminary Summary of Damage and Losses ($ million)18
Overall damages are estimated to be $574.5 million, and losses are estimated to be $448.3 million. Whilst the largest proportion of the damages are concentrated in fisheries, housing and infrastructure, material private asset damages related to coastal fisheries, agriculture and micro enterprise livelihoods have been incorporated into the respective sectors. Losses related to livelihoods in these sectors are of particular significance because they accentuate the pre existing vulnerability to poverty of these coastal fisheries communities, agriculture and micro-enterprises.19 Table 6 reflects the short term needs (within one year) and medium term needs (up to three years). This table does not include longer term reconstruction needs which are significant in areas such as housing, rural and municipal infrastructure, transportation, and coastal protection; these can only be undertaken reliably after further detailed studies.
17 India Post Tsunami Recovery Program – Preliminary Damage and Needs Assessment, prepared by Asian Development Bank, United Nations and World Bank, New Delhi, India, March 8, 2005 18 Ibid, Page i, 19 Ibid, Page iii

16
Table 6. Preliminary Post Tsunami Reconstruction Needs ($ Million)20
Overall rehabilitation and reconstruction needs are estimated at $1.2 billion, requiring financing over the short and medium term. The estimates take into account that damaged assets need to be replaced with new ones, not only of equal value, but with upgrades to services and infrastructure in order to reduce the previous inherent vulnerability. 7. Demand Matrices
The following demand matrices provide an overview of projects of the recovery and reconstruction phases of the Tsunami affected region. At present information on current and anticipated projects is still relatively scarce, thus the data presented in the following matrices does not reflect all projects in the various pipelines. The following matrices should be seen as a first step toward the final demand analysis, they also present the type of information that will be available and from which the analysis will be conducted. The data that is shown in the demand matrices below has been gathered from a variety of reports currently available from the Agencies and entities involved with the recovery and reconstruction of the Tsunami affected countries, as such gives an indication of the type of data that will be collected by UNDP/IAPSO. The current demand matrices cover the Maldives, Sri Lanka, Indonesia and India as project information for these countries is available, albeit limited. Projects in other countries affected by the Tsunami will be entered in the matrices as this information becomes available.
7.1. Demand patterns The following demand matrices are designed to facilitate the identification of;
(i) the type of goods and services required by whom and where and which time frame
(ii) patterns of demand or rather areas where there are overlaps in demand for identical or similar goods or services as well as in terms of time
20 Ibid, page iii

17
frames across the countries and regions involved in the Tsunami recovery and reconstruction phases.
Due to the preliminary stage of this demand analysis it is not as yet feasible to draw conclusions in regards to demand patterns from which recommendations in terms of procurement strategies can be developed. When the project data has been consolidated in the above matrices, one is able to extract and categorise specific goods, works and works required by country and region. Demand patterns can then be identified to indicate the overall consolidated needs for specific services in the desired region. Once the desired requirements are consolidated, this will allow for more effective strategic planning and procurement approaches in order to satisfy the requirements. Furthermore, this will enable opportunities for collaborative procurement approaches as well as volume leveraging within the analysed supply markets as well as the establishment of long-term arrangements with larger suppliers in the region. As can be seen from the demand matrices, even at this early stage, a clearer picture is evolving in terms of the types of goods and services that will be required by the recovery and reconstruction effort. This information is already of value to suppliers eager to supply the agencies in this effort.
18
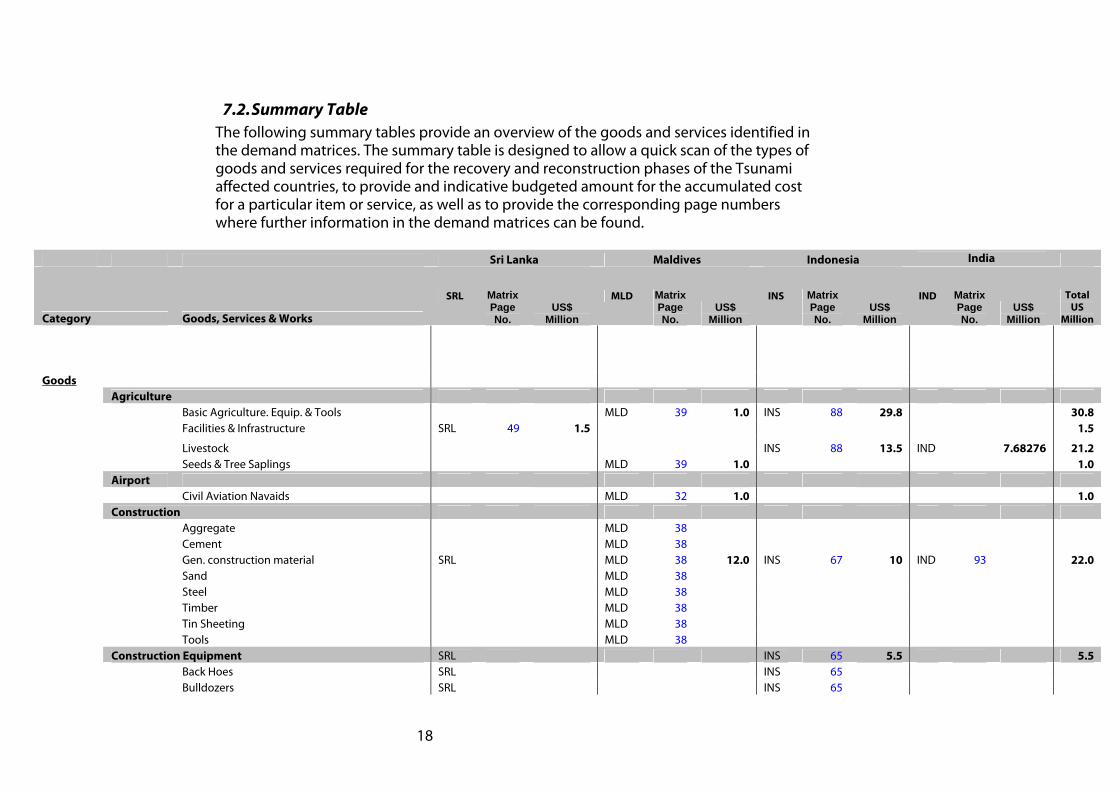
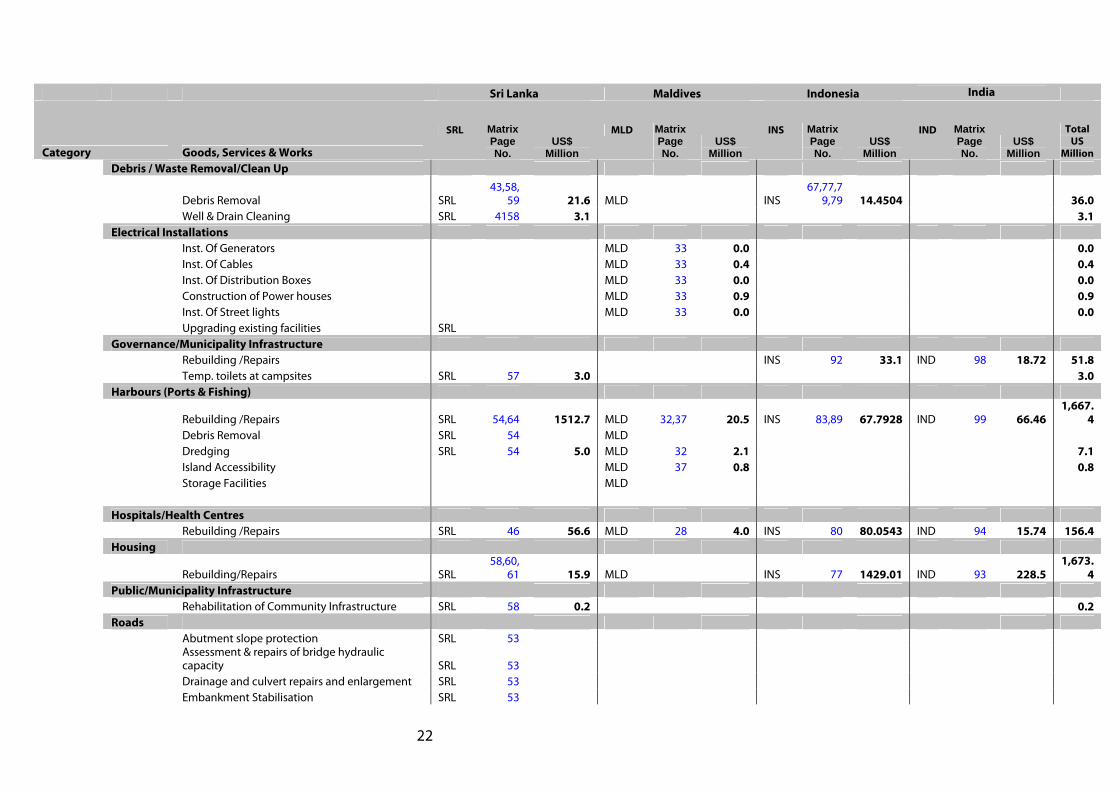
7.2. Summary Table The following summary tables provide an overview of the goods and services identified in the demand matrices. The summary table is designed to allow a quick scan of the types of goods and services required for the recovery and reconstruction phases of the Tsunami affected countries, to provide and indicative budgeted amount for the accumulated cost for a particular item or service, as well as to provide the corresponding page numbers where further information in the demand matrices can be found.
Sri Lanka Maldives Indonesia India
Category Goods, Services & Works
SRL Matrix Page No.
US$ Million
MLD Matrix Page No.
US$ Million
INS Matrix Page No.
US$ Million
IND Matrix Page No.
US$ Million
Total US
Million
Goods Agriculture Basic Agriculture. Equip. & Tools MLD 39 1.0 INS 88 29.8 30.8 Facilities & Infrastructure SRL 49 1.5 1.5
Livestock INS 88 13.5 IND 7.68276 21.2 Seeds & Tree Saplings MLD 39 1.0 1.0 Airport Civil Aviation Navaids MLD 32 1.0 1.0 Construction Aggregate MLD 38 Cement MLD 38 Gen. construction material SRL MLD 38 12.0 INS 67 10 IND 93 22.0 Sand MLD 38 Steel MLD 38 Timber MLD 38 Tin Sheeting MLD 38 Tools MLD 38 Construction Equipment SRL INS 65 5.5 5.5 Back Hoes SRL INS 65 Bulldozers SRL INS 65

19
Sri Lanka Maldives Indonesia India
Category Goods, Services & Works
SRL Matrix Page No.
US$ Million
MLD Matrix Page No.
US$ Million
INS Matrix Page No.
US$ Million
IND Matrix Page No.
US$ Million
Total US
Million
Dump Trucks SRL INS 65 Loaders SRL INS 65 Vehicles SRL Early Warning System Info. & Comms system SRL 56 Strengthening existing system SRL 56 Electrical Power Accessories MLD 33 0.05 0.0 Cables MLD 33 0.6 0.6 Distribution boxes MLD 33 0.2 INS 84 34.5358 34.8 Generators MLD 33 0.6 INS 84 4.49072 5.0 Meters & Consumer Panels MLD 33 0.4 0.4 Other Facilities INS 84 14.4345 14.4 Streetlights MLD 33 0.1 0.1 Switchboards MLD 33 0.5 0.5 Tools MLD 33 0.1 0.1 Emergency Shelter INS 67 0.7 0.7 Tents SRL 67 0.7 INS 79 0.19246 0.9 Fisheries Anchorages SRL 54 18.1 18.1 Boat Sheds MLD 31 0.1 0.1 Gear SRL MLD 31 2.6 INS 89 13.5 16.1 Production Equipment SRL 54 4.5 MLD 31 1.3 5.8 Vessels / Boat SRL 54 107.4 MLD 31 7.9 INS 89 118.1 IND 97 229.5 462.9 Fuel Storage (Petroleum) Fuel Stock INS 84 3.54981 3.5 Fuel Tanks MLD 33 0.5 INS 84 9.33429 9.9 Harbours Electrical Equipment/Lighting MLD 32 Entrance Markers MLD 32,37 0.6 0.6 Handling Gear MLD 32 Jetties / Docks SRL MLD 32 Light Beacons MLD 32 Reef Markers MLD

20
Sri Lanka Maldives Indonesia India
Category Goods, Services & Works
SRL Matrix Page No.
US$ Million
MLD Matrix Page No.
US$ Million
INS Matrix Page No.
US$ Million
IND Matrix Page No.
US$ Million
Total US
Million
Housing Furniture INS 77 225.392 225.4 Land Transport Vehicles and related infrastructure INS 82 314.778 314.8 Medical Ambulances SRL 46 Fogging devices SRL 46 Furniture MLD 0.8 0.8 Insecticides SRL 46 Lab. Equipment SRL INS 73 Medical Equipment SRL MLD 28 3.1 INS 73 IND 94 3.1 Medicines / Drugs/ Consumables SRL 46 1.8 MLD 28 1.2 IND 94 3.0 Reproductive MLD Safe-delivery kits MLD Vaccines MLD Office Facilities Computers & Printers SRL MLD Equipment INS 92 11.8 11.8 Furniture SRL MLD Public Composting bins MLD 29 Glass Crushers MLD 29 Shredders MLD 29 Wheeled bins MLD 29 Railways SRL 52 15.0 15.0 Automated Signal Systems SRL 52 Culverts SRL 52 Power Sets SRL 52 Rail SRL 52 Reconstruction SRL 52 Sleepers SRL 52 Track-bed bridges SRL 52 School Equipment School Facilities SRL MLD 27 12.0 12.0

21
Sri Lanka Maldives Indonesia India
Category Goods, Services & Works
SRL Matrix Page No.
US$ Million
MLD Matrix Page No.
US$ Million
INS Matrix Page No.
US$ Million
IND Matrix Page No.
US$ Million
Total US
Million
Student Supplies SRL MLD 27 2.1 INS 79 0.05346 2.1 Telecommunication Equipment INS 86 20.7108 20.7 Water Supply & Sanitation Crew Cabs SRL MLD Desalination Systems MLD 29 De-sludging system MLD 29 Disinfectants & water Chlorination tablets SRL 51 MLD 29 Electric Gears SRL 51 Gully Emptiers SRL 51 Polythene Pipes SRL 51 Rainwater Tanks MLD 29 Sanitary Latrines MLD 29 Sanitation systems MLD 29,30 23.2 IND 93 12.75 36.0 Sewage disposal browsers SRL 51 MLD Sewer system MLD 30 sludge pumps SRL 51 MLD Toilets & Septic Tanks SRL 51,58 0.1 MLD 27,30 0.1 Water Browsers SRL 51 MLD Water disinfection kits MLD Water Meters SRL 51 MLD Water Pumps SRL 51 MLD Water Purification Kits SRL 51 MLD Water quality testing kits SRL 51 MLD Water storage facilities SRL 51 MLD 27 Water Supply SRL 51,58 0.2 MLD 29,30 12.0 12.2 Water Supply and Sanitation Units SRL 51 50.0 INS 79,87 69.2915 IND 93,98 119.3 Civil Works Airports Repairs MLD 32 2.0 INS 83 4.91841 6.9
22
Sri Lanka Maldives Indonesia India
Category Goods, Services & Works
SRL Matrix Page No.
US$ Million
MLD Matrix Page No.
US$ Million
INS Matrix Page No.
US$ Million
IND Matrix Page No.
US$ Million
Total US
Million
Debris / Waste Removal/Clean Up
Debris Removal SRL 43,58,
59 21.6 MLD INS 67,77,7
9,79 14.4504 36.0 Well & Drain Cleaning SRL 4158 3.1 3.1 Electrical Installations Inst. Of Generators MLD 33 0.0 0.0 Inst. Of Cables MLD 33 0.4 0.4 Inst. Of Distribution Boxes MLD 33 0.0 0.0 Construction of Power houses MLD 33 0.9 0.9 Inst. Of Street lights MLD 33 0.0 0.0 Upgrading existing facilities SRL Governance/Municipality Infrastructure Rebuilding /Repairs INS 92 33.1 IND 98 18.72 51.8 Temp. toilets at campsites SRL 57 3.0 3.0 Harbours (Ports & Fishing)
Rebuilding /Repairs SRL 54,64 1512.7 MLD 32,37 20.5 INS 83,89 67.7928 IND 99 66.46 1,667.
4 Debris Removal SRL 54 MLD Dredging SRL 54 5.0 MLD 32 2.1 7.1 Island Accessibility MLD 37 0.8 0.8 Storage Facilities MLD Hospitals/Health Centres Rebuilding /Repairs SRL 46 56.6 MLD 28 4.0 INS 80 80.0543 IND 94 15.74 156.4 Housing
Rebuilding/Repairs SRL 58,60,
61 15.9 MLD INS 77 1429.01 IND 93 228.5 1,673.
4 Public/Municipality Infrastructure Rehabilitation of Community Infrastructure SRL 58 0.2 0.2 Roads Abutment slope protection SRL 53
Assessment & repairs of bridge hydraulic capacity SRL 53
Drainage and culvert repairs and enlargement SRL 53 Embankment Stabilisation SRL 53

23
Sri Lanka Maldives Indonesia India
Category Goods, Services & Works
SRL Matrix Page No.
US$ Million
MLD Matrix Page No.
US$ Million
INS Matrix Page No.
US$ Million
IND Matrix Page No.
US$ Million
Total US
Million
Reinstatement of damaged pavements SRL 53 Replacement of road furniture SRL 53 Replacement of temp. bridges w. permanent SRL 53 Structural repairs to damaged bridges SRL 53
Widening & Elevation of embankments & carriageways SRL 53
Reconstruction/Repairs INS 82 221.11 IND 93,98,99 221.1
Short Term Repair SRL 53 21.0 21.0 Medium Term Maintenance SRL 53 157.0 157.0 Bridge Reconstruction SRL 53 13.35 IND 13.4 Road Furniture SRL 53 Drainage equipment SRL 53 2.83 IND 98 2.8 Railways Long-Term Reconstruction Services SRL 71.0 71.0 Religion (Places of Worship) Rebuilding /Repairs INS 81 83.0203 83.0 Schools / Universities Rebuilding/Repairs SRL 45 37.0 MLD 27 1.9 INS 78 110.178 149.1 Tertiary Infrastructure INS 77 184.654 184.7 Services / Consultancy Agriculture Agricultural Management MLD Bio Diversity MLD Saline Soils Treatment SRL 49 MLD 39 0.4 0.4 Soil Remediation Consultancy SRL 49 0.0 MLD IND 95 12.5011 12.5 Re-establish Livelihoods SRL 49 2.1 MLD 2.1 Training & Capacity SRL 49 0.2 0.2 Construction Assessments and Consultancies IND 99 6.9 6.9 Resource Mapping & Technical Know-How SRL MLD
Shelter Needs & Implementation Capacity dev. Needs MLD

24
Sri Lanka Maldives Indonesia India
Category Goods, Services & Works
SRL Matrix Page No.
US$ Million
MLD Matrix Page No.
US$ Million
INS Matrix Page No.
US$ Million
IND Matrix Page No.
US$ Million
Total US
Million
Sustainable Construction Design & Buildings MLD Training of local masons & small contractors MLD
Training , capacity building for local planning & execution MLD 37,38 1.6 1.6
Damaged buildings in National Parks SRL 44 1.3 MLD 1.3 Skills Training SRL 4.7 4.7 Technical Assistance SRL 1.2 2 3.2 Education Teacher Replacement & Training INS 79 5.14295 5.1 Prof. Guidance & Teacher Training MLD 27 0.1 0.1 Environment Air Pollution Control System MLD 36 0.8 0.8 Biodiversity Survey & Recovery Plans MLD 35 0.9 0.9 Climate Change MLD Coastal Protection Measures IND 100 42.8 42.8 Coastal Zone Management MLD 36 1.5 1.5 Disaster Waste Management MLD 35 1.5 1.5 Energy Conservation & Renewable Energy MLD 36 0.4 0.4
Environmental Assessment of Marine Eco-Systems SRL 43 1.5 MLD 31,35 1.5 3.0
Environmental Assess. Rehab & Reconstruction SRL 43 0.2 MLD 35 0.3 0.5 Environmental Awareness Building MLD 29,36 2.5 2.5 Environmental Governance MLD 35 1.2 1.2 Impact on Protected & Env. Sensitive Areas SRL 43 0.8 0.8 Hazardous Substances Control Programme MLD 36 0.5 0.5 National Oil Spill Response Plan MLD 36 0.5 0.5 Reefs impact Assessment MLD 35 1.3 1.3 Sustainable Waste Management SRL 44 6.0 MLD 6.0 Fisheries Damage Assessment IND 97 54.1 54.1 Training Skill Development SRL 54 0.5 0.5 Technical Assistance SRL 54 5.0 5.0 Health SRL 62 12.5 12.5 Basic Health Care SRL 46 1.3 MLD IND 94 1.3

25
Sri Lanka Maldives Indonesia India
Category Goods, Services & Works
SRL Matrix Page No.
US$ Million
MLD Matrix Page No.
US$ Million
INS Matrix Page No.
US$ Million
IND Matrix Page No.
US$ Million
Total US
Million
Disease Surveillance, verification & response SRL 46 0.9 MLD 42 1.0 1.9 Environmental Treats on Human Health MLD EWS on life-threatening diseases SRL 62 MLD Hazardous Substances MLD Health Assessments SRL 62 MLD 40 0.4 INS 69 2 IND 94 2.4 Health Sector Coordination SRL 62 MLD 40 0.4 0.4 Health Care Waste Management SRL 44 3.0 3.0 Health Planning Needs SRL 62 MLD Medical Supply Chain Optimization SRL 46,62 4.5 MLD 41 3.0 7.5 Psycho-social Support SRL Project Management MLD 42 0.5 0.5 Re-establishing preventative health care SRL 46 4.5 4.5 Public Health Campaigns/Programs MLD 40 0.5 INS 12.3838 12.9
Strengthening Health Institutions & Delivery Systems SRL 46 11.3 MLD INS 74 3 14.3
Health Emergency Unit INS 70 3.5 3.5 Child & Maternal Health Services INS 72 5 5.0 Restoration of Health Services INS 73 10 10.0 Mental Health Programme & Counselling INS 75,79 5.08498 5.1 Water Supply & Sanitation System INS 76 3 3.0 Medical Machinery Installation MLD 0.2 0.2 Livelihood SME Micro Credits INS 66 10 10.0 Skills Training/Capacity Building MLD 39 0.2 INS 66 4 4.2 Technical Assistance MLD 39 0.5 INS 66 2 2.5 Misc. Services /Consultancies Vocational Training and Skills Development SRL Early Warning Systems Training SRL Knowledge Sharing SRL Public Sector Community-based livelihoods activities MLD Disposal Facilities MLD Human Capacity Building & Training SRL MLD Local Government Support MLD

26
Sri Lanka Maldives Indonesia India
Category Goods, Services & Works
SRL Matrix Page No.
US$ Million
MLD Matrix Page No.
US$ Million
INS Matrix Page No.
US$ Million
IND Matrix Page No.
US$ Million
Total US
Million
Public Awareness Campaigns MLD Public Sector Management MLD Sewage & Wastewater Management SRL MLD 30 Strengthening Institutional Capacity SRL MLD Transport Management & Systems MLD Solid Waste Management MLD 30 1.5 1.5 Transportation Transportation of Equipment MLD 33,38 3.8 6.14 IND 93,98 9.9
Total US$ Million 2,158.7 145.0 3,222.1 695.7 6,221.4
Demand Matrix – Maldives 17.03.2005
27
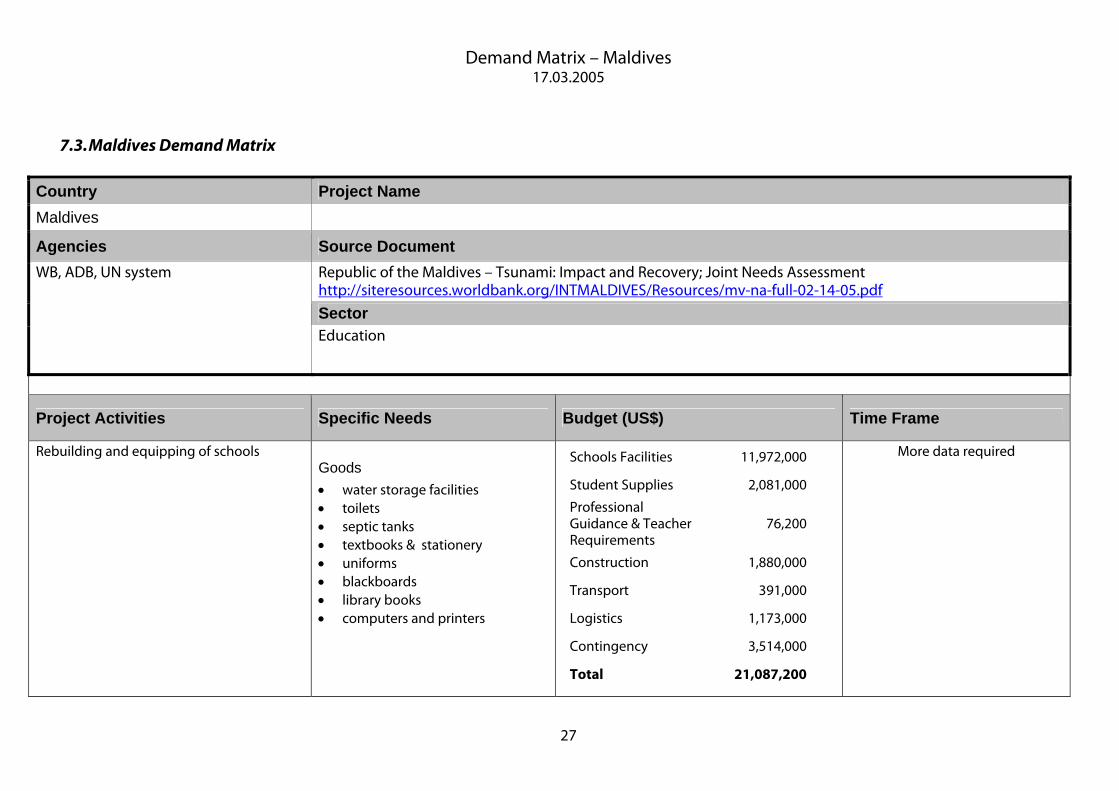
7.3. Maldives Demand Matrix
Country Project Name Maldives
Agencies Source Document Republic of the Maldives – Tsunami: Impact and Recovery; Joint Needs Assessment http://siteresources.worldbank.org/INTMALDIVES/Resources/mv-na-full-02-14-05.pdf
Sector
WB, ADB, UN system
Education
Project Activities Specific Needs Budget (US$) Time Frame
Rebuilding and equipping of schools
Goods • water storage facilities • toilets • septic tanks • textbooks & stationery • uniforms • blackboards • library books • computers and printers
Schools Facilities 11,972,000
Student Supplies 2,081,000
Professional Guidance & Teacher Requirements
76,200
Construction 1,880,000
Transport 391,000
Logistics 1,173,000
Contingency 3,514,000
Total 21,087,200
More data required

Demand Matrix – Maldives 17.03.2005
28
Country Project Name Maldives
Agencies Source Document Republic of the Maldives – Tsunami: Impact and Recovery; Joint Needs Assessment http://siteresources.worldbank.org/INTMALDIVES/Resources/mv-na-full-02-14-05.pdf
Sector
WB, ADB, UN system
Health
Project Activities Specific Needs Budget Time Frame
• Improving water and sanitation services • Rehabilitation of cold chain equipment for
immunization program • Supply of vaccines • Supply of essential medicines and medical
equipment (including logistics) • TA support to disease surveillance (including
laboratory), environmental health, and food safety • TA to support reconstruction and rehabilitation of
health systems • Mental health (Psychosocial support) • Supply of reproductive health and family planning
commodities • Inputs for providing care to pregnant women such
as safe delivery kits • Rehabilitation of health facilities
Goods • Vaccines • Medicines • Medical equipment • Safe-delivery kits • Reproductive
Services • Technical assistance to support
reconstruction • Rehabilitation of health facilities
Activity Budget (US$ )
Structural & Building Services Damages
4,000,000
Equipments & machineries 3,100,000
Medical Consumables 1,200,000Furniture 800,000Transport 100,000Duty 1,100,000Handling 100,000Site visits & machinery installation
200,000
Total 10,600,00
0
More data required

Demand Matrix – Maldives 17.03.2005
29
Country Project Name Maldives
Agencies Source Document Republic of the Maldives – Tsunami: Impact and Recovery; Joint Needs Assessment http://siteresources.worldbank.org/INTMALDIVES/Resources/mv-na-full-02-14-05.pdf
Sector
WB, ADB, UN system
Water Supply, Sanitation and Solid Waste Management
Project Activities Specific Needs Budget Time Frame
• rehabilitation of associated roof rainwater harvesting piping and gutters,
• supply disinfectants and water chlorination tablets,
• impermeable lining for the construction of temporary sludge drying beds;
• solid waste management: storage and processing equipment
Goods • 46 mobile desalination systems (46 units) • 7650 rainwater tanks (1000 for and 6650 for
households tanks) • 1800 temporary sanitary latrines • 34 septic tank de-sludging systems • disinfectants and water chlorination tablets • communal and household wheeled bins • 48 sets of shredders, glass crushers and
composting bins
Subcomponent US $
Water supply 10,300,000Sanitation 3,260,000Solid Waste Management 2,640,000Environmental Awareness and Education
500,000
Total 16,690,000Contingency (10%) 1,670,000Grand Total 18,360,000
Immediate and Short Term Needs (3–6 months)

Demand Matrix – Maldives 17.03.2005
30
• Rehabilitation and replacement of damaged sanitation infrastructure
• Construction of permanent septic and hygienic sludge drying beds
• Construction, repair or replacing of sewerage network systems
• septage treatment facilities and upgrading to full sewerage systems
• Preparation of a sanitation and water strategy.
Goods • 5000 toilets and 7600 septic tanks • 69 sludge drying beds • 21 sewer systems Services • Rehabilitation of sanitation & sewerage
systems • Preparation of a sanitation and water
strategy
Subcomponent US $ Water supply 1,660,000Sanitation 19,950,000Solid Waste Management 1,470,000Environmental Monitoring and Environmental Awareness Programs
1,600,000
Total 24,730,000Contingency (10%) 2,470,000Grand Total 27,210,000
Medium-Term to Long-Term Assistance (Up to 2-3 years)

Demand Matrix – Maldives 17.03.2005
31
Country Project Name Maldives
Agencies Source Document Republic of the Maldives – Tsunami: Impact and Recovery; Joint Needs Assessment http://siteresources.worldbank.org/INTMALDIVES/Resources/mv-na-full-02-14-05.pdf
Sector
WB, ADB, UN system
Fisheries
Project Activities Specific Needs Budget Time Frame
• Replacement & reparation of damages to fishing vessels (inclusive of engine, gear, etc.)
• Replace fishing gear/engines etc. in partially damaged boats
• Replace damaged equipment and facilities for Maldive fish production
• Replace damaged /destroyed boat sheds • Repair mariculture station and FAD Centre • Assess and monitor impact on reefs and marine
resources
Goods • Fishing vessels • Fishing gear • Fish production
equipment • Boat sheds
Services • Reefs impact
assessment
Activities US $ Replace damages fishing vessels (inclusive of engine, gear, etc.) 7,850,000Replace fishing gear/engines etc. in partially damaged boats 2,570,000Replace damaged equipment and facilities for Maldive fish production 1,290,000Replace damaged /destroyed boat sheds 50,000Repair mariculture station and FAD Centre 70,000Assess and monitor impact on reefs and marine resources 700,000Micro credit arrangements 1,560,000Total 14,090,00
More data required
Demand Matrix – Maldives 17.03.2005
32
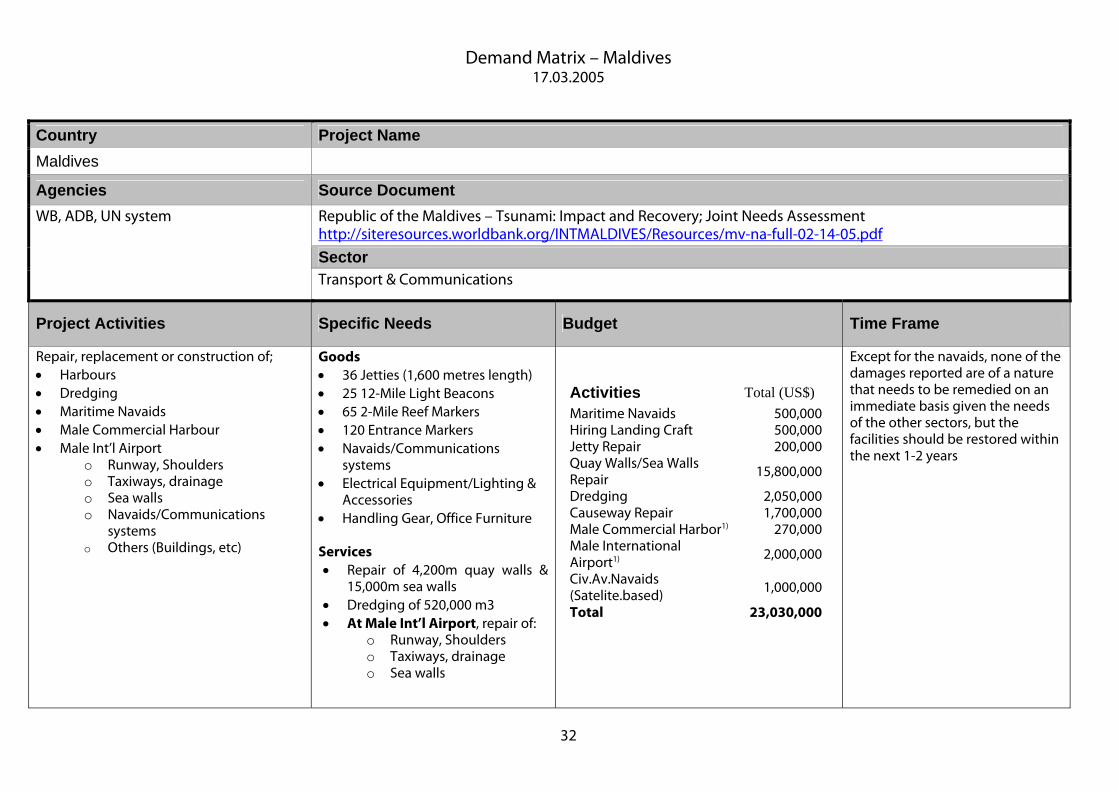
Country Project Name Maldives
Agencies Source Document Republic of the Maldives – Tsunami: Impact and Recovery; Joint Needs Assessment http://siteresources.worldbank.org/INTMALDIVES/Resources/mv-na-full-02-14-05.pdf
Sector
WB, ADB, UN system
Transport & Communications
Project Activities Specific Needs Budget Time Frame
Repair, replacement or construction of; • Harbours • Dredging • Maritime Navaids • Male Commercial Harbour • Male Int’l Airport
o Runway, Shoulders o Taxiways, drainage o Sea walls o Navaids/Communications
systems o Others (Buildings, etc)
Goods • 36 Jetties (1,600 metres length) • 25 12-Mile Light Beacons • 65 2-Mile Reef Markers • 120 Entrance Markers • Navaids/Communications
systems • Electrical Equipment/Lighting &
Accessories • Handling Gear, Office Furniture Services • Repair of 4,200m quay walls &
15,000m sea walls • Dredging of 520,000 m3 • At Male Int’l Airport, repair of:
o Runway, Shoulders o Taxiways, drainage o Sea walls
Activities Total (US$) Maritime Navaids 500,000Hiring Landing Craft 500,000Jetty Repair 200,000Quay Walls/Sea Walls Repair 15,800,000
Dredging 2,050,000Causeway Repair 1,700,000Male Commercial Harbor1) 270,000Male International Airport1)
2,000,000
Civ.Av.Navaids (Satelite.based) 1,000,000
Total 23,030,000
Except for the navaids, none of the damages reported are of a nature that needs to be remedied on an immediate basis given the needs of the other sectors, but the facilities should be restored within the next 1-2 years

Demand Matrix – Maldives 17.03.2005
33
Country Project Name Maldives
Agencies Source Document Republic of the Maldives – Tsunami: Impact and Recovery; Joint Needs Assessment http://siteresources.worldbank.org/INTMALDIVES/Resources/mv-na-full-02-14-05.pdf
Sector
WB, ADB, UN system
Electrical Power
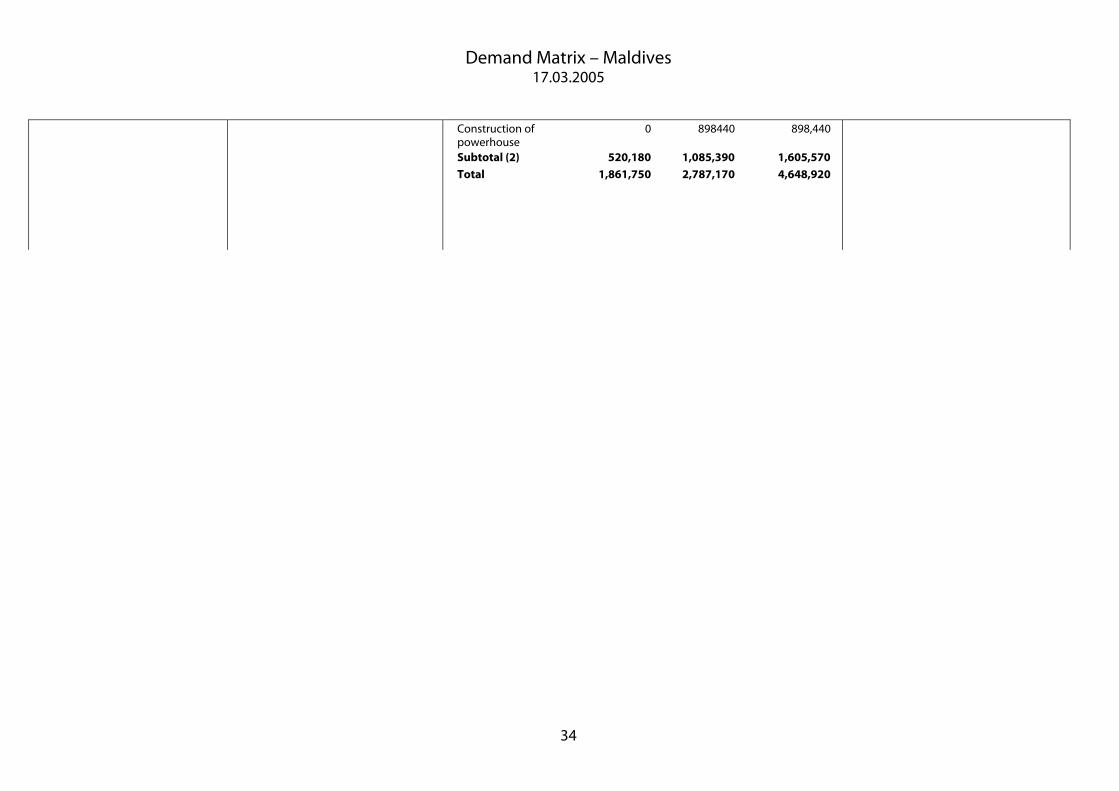
Project Activities Specific Needs Budget Time Frame Repair and/or replacement of: • 24 Power House • 104 Generator • 652 Streetlights • 34 Switchboards • 121 Cables • 632 Distribution boxes
Equipment • Generators • Switchboard • Cables • Distribution boxes • Streetlights • Tools • Accessories • Fuel tanks • Meters and consumer panel Works • Transport of equipment • Installation of generators • Installation of cables • Installation of distr. Boxes • Installation of streetlights • Construction of powerhouse
Description Phase 1 Phase 2 Total Equipment
Generators 555,440 555,440 Switchboard 478,130 478,130
Cables 597,660 597,660
Distribution boxes 224,660 224,660
Streetlights 138,550 138,550
Tools - 80,860 80,860 Accessories 41,120 6,930 48,050
Fuel tanks - 539,060 539,060
Meters and consumer panel
- 380,940 380,940
Subtotal (1) 1,341,570 1,701,780 3,043,350 Works - Transport of equipment 134160 116170 250,330 Installation of generators
0 45310 45,310
Installation of cables 351460 0 351,460 Installation of distr. Boxes
34560 0 34,560
Installation of streetlights
0 25470 25,470
Short Term (6 months) – Phase 1 To restore the power supply system on a more permanent basis within the shortest possible time, repairing the damaged generators, replacing the damaged cables and distribution boxes, are considered a priority Medium Term (1.5 – 2 years) – Phase 2
To bring back the system to the pre-disaster level, more time,
resources and detailed survey will be needed.
Demand Matrix – Maldives 17.03.2005
34
Construction of powerhouse
0 898440 898,440
Subtotal (2) 520,180 1,085,390 1,605,570 Total 1,861,750 2,787,170 4,648,920

Demand Matrix – Maldives 17.03.2005
35
Project Name
Maldives
Agencies Source Document Republic of the Maldives – Tsunami: Impact and Recovery; Joint Needs Assessment http://siteresources.worldbank.org/INTMALDIVES/Resources/mv-na-full-02-14-05.pdf
Sector
WB, ADB, UN system
Environment
Project Activities Specific Needs Budget Time Frame
Immediate Priorities • Disaster Waste Management • Assessment of Environmental Threats to Human
Health • Coral Reef Impact Assessment Programme • Biodiversity Survey and Recovery Plans • Strategic environmental assessment of overall
rehabilitation and reconstruction program • Strengthening Environmental Governance at the
National, Atoll and Island Levels
Services Professional Consultancy Services covering expertise outlined under ‘Project Activities’
Project Proposal
IMME-DIATE MEDIUM-TERM Total
Disaster Waste Management
1.5 1.5
Assessment of environmental threats to health
0.75 0.75
Coral Reef Impact Assessment
0.5 0.75 1.25
Biodiversity Survey and recovery plans
0.3 0.6 0.9
Environmental Assessment of reconstruction Programme
0.2 0.1 0.3
Strengthening environmental governance
0.45 0.7 1.15
Immediate Priorities ( 0 – 6 months) Medium Term (7 – 36 months)

Demand Matrix – Maldives 17.03.2005
36
Medium-Term Priorities • Development of a Sustainable Waste Management
System • Sewage and Wastewater Management System • Climate Change Programme • Coastal Zone Management • Disposal Facilities for Clinical Wastes • Hazardous Substances Control Programme • Development of Ambient Air Pollution Control
Regime • Development of Integrated Transport System • Environmental Land-Use Planning • Sustainable Construction Design and Building
Codes • National Environmental Contingency Plan • Environmental Management of Diesel Generators • Energy Conservation and Promotion of Renewable
Energy • Environmental Awareness Building
Services Professional Consultancy Services covering expertise outlined under ‘Project Activities’
Project Proposal MEDIUM-TERM Total
Coastal Zone Management
1.5 1.5
Hazardous Substances Control Programme
0.45 0.45
Air Pollution Control System
0.75 0.75
National Oil Spill Response Plan
0.45 0.45
Energy Conservation and Promotion of Renewable Energy
0.45 0.45
Environmental Awareness Building
0.35 0.35
Total 6.1 9.8 million
Immediate Priorities ( 0 – 6 months) Medium Term (7 – 36 months)

Demand Matrix – Maldives 17.03.2005
37
Country Project Name Maldives
Agencies Source Document Earthquake-Tsunami 2005 UNDP Flash Appeal Projects – Maldives
Sector
UNDP Flash Appeal Project Direct Execution by UNDP
Restoration of Critical Infra-structure
Project Activities Specific Needs Budget Time Frame
• Repair jetties, harbours and other coastal infrastructure
• Dredge access channels, basin dredging, cleaning up debris
• Repairing of storage facilities, facilities related to fishing (fish landing yards, fish smoking kitchens, community space for drying fish)
• Repair damaged navigational aid facilities, mile reef markers, mile light beacons
• Provision of TA for capacity building of relevant government
Goods and services for repair / reconstruction of: • 36 Jetties @ US$ 10,000 each • 1,000 m of Quay wall @ US$ 950/m • 1,500 m of Sea Walls @ US$ 895/m • 10 Boat repair yards (haruge’) @ US$
10,000 each • 10 Fish drying yards @US$9,500 each • Fish smoking facilities • 10 Warehouses • Dredging 100,000 cubic meter of sand
in identified sea channels and harbours @US$ 3.00 cu. m
Project Activities
US $
Rehabilitate jetties, harbour and costal infrastructure
2,520.000
Reconstruct island accessibility, repair fisheries facilities
817,000
Renovation of navigational facilities
63,000
Training, capacity building for local planning & execution
100,000
Technical Assistance 400,000Monitoring, Reporting and Miscellaneous
100,000
Total 4,000,000
6 months, until June 2005, activities undertaken during this period are likely to go beyond the period of the Appeal, and will dovetail with the reconstruction phase.

Demand Matrix – Maldives 17.03.2005
38
Country Project Name Maldives
Agencies Source Document Earthquake-Tsunami 2005 UNDP Flash Appeal Projects – Maldives
Sector
UN-HABITAT / UNDP Flash Appeal Projects National Execution – Disaster Management Centre
Shelter Provision
Project Activities Specific Needs Budget Time Frame
• Repair the most severely damaged houses and assist rebuilding the totally destroyed houses;
• Initiate a public awareness campaign on structural mitigation measures;
• Provide training for local masons and small contractors;
• Provide disaster mitigation technical support inputs to the Governments “Safe Islands” Programme
• Undertake in-depth assessment of shelter needs and capacities to implement the Programme.
• Establish a structure for capacity development as discussed with the Ministry of Planning;
• Undertake resource mapping to determine the availability of skilled and unskilled labour, as well as the availability of technical know-how and building materials in affected communities;
Goods • cement, • aggregate, • sand, • steel, • timber, • tin sheet Services • Local Labour • Transportation
services • Construction related
consultancy services
Project Activities US $
Construction materials (cement, aggregate, sand, steel, timber, tin sheet)
12,000,000
Recruit Local Labour 1,400,000
Transportation of construction materials
3,500,000
Capacity Development 1,500,000
Technical Assistance 500,000Monitoring, Reporting and Miscellaneous
200,000
Total 19,100,000
6 months, until June 2005. Activities undertaken during this
period are likely to go beyond the period of the Appeal, and will
dovetail with the reconstruction phase.
Demand Matrix – Maldives 17.03.2005
39
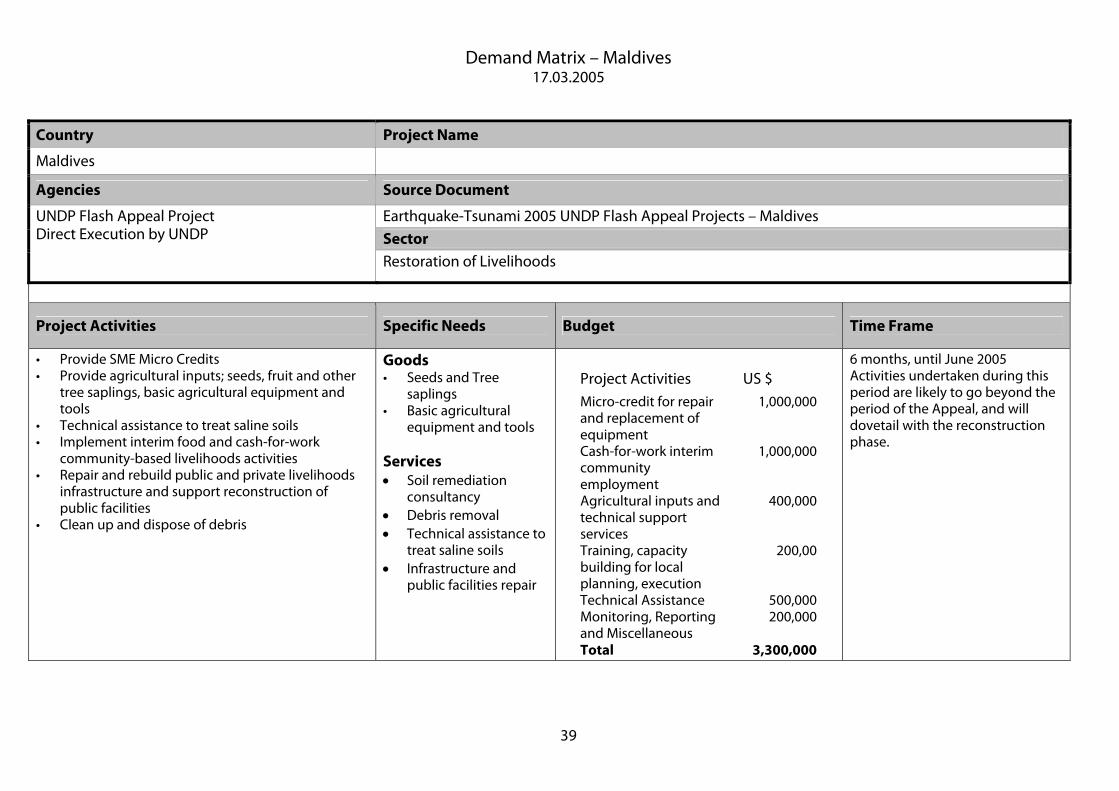
Country Project Name
Maldives
Agencies Source Document
Earthquake-Tsunami 2005 UNDP Flash Appeal Projects – Maldives
Sector
UNDP Flash Appeal Project Direct Execution by UNDP
Restoration of Livelihoods
Project Activities Specific Needs Budget Time Frame
• Provide SME Micro Credits • Provide agricultural inputs; seeds, fruit and other
tree saplings, basic agricultural equipment and tools
• Technical assistance to treat saline soils • Implement interim food and cash-for-work
community-based livelihoods activities • Repair and rebuild public and private livelihoods
infrastructure and support reconstruction of public facilities
• Clean up and dispose of debris
Goods • Seeds and Tree
saplings • Basic agricultural
equipment and tools Services • Soil remediation
consultancy • Debris removal • Technical assistance to
treat saline soils • Infrastructure and
public facilities repair
Project Activities US $ Micro-credit for repair and replacement of equipment
1,000,000
Cash-for-work interim community employment
1,000,000
Agricultural inputs and technical support services
400,000
Training, capacity building for local planning, execution
200,00
Technical Assistance 500,000Monitoring, Reporting and Miscellaneous
200,000
Total 3,300,000
6 months, until June 2005 Activities undertaken during this period are likely to go beyond the period of the Appeal, and will dovetail with the reconstruction phase.
Demand Matrix – Maldives 17.03.2005
40
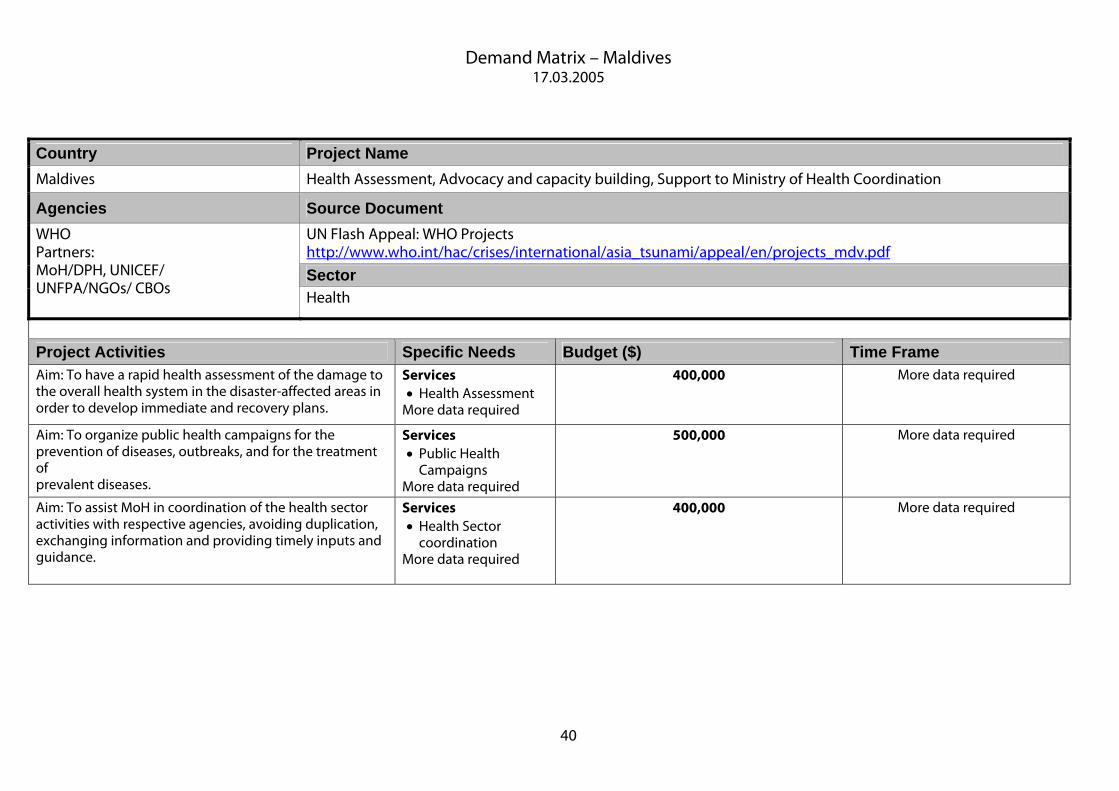
Country Project Name Maldives Health Assessment, Advocacy and capacity building, Support to Ministry of Health Coordination
Agencies Source Document UN Flash Appeal: WHO Projects http://www.who.int/hac/crises/international/asia_tsunami/appeal/en/projects_mdv.pdf
Sector
WHO Partners: MoH/DPH, UNICEF/ UNFPA/NGOs/ CBOs
Health
Project Activities Specific Needs Budget ($) Time Frame Aim: To have a rapid health assessment of the damage to the overall health system in the disaster-affected areas in order to develop immediate and recovery plans.
Services • Health Assessment
More data required
400,000 More data required
Aim: To organize public health campaigns for the prevention of diseases, outbreaks, and for the treatment of prevalent diseases.
Services • Public Health
Campaigns More data required
500,000 More data required
Aim: To assist MoH in coordination of the health sector activities with respective agencies, avoiding duplication, exchanging information and providing timely inputs and guidance.
Services • Health Sector
coordination More data required
400,000 More data required

Demand Matrix – Maldives 17.03.2005
41
Country Project Name Maldives Provision of supplies and equipment and replenishment of essential assets
Agencies Source Document UN Flash Appeal: WHO Projects http://www.who.int/hac/crises/international/asia_tsunami/appeal/en/projects_mdv.pdf
Sector
WHO Partners: MoH/DPH, UNICEF/ UNFPA/NGOs/ CBOs
Health
Project Activities Specific Needs Budget ($) Time Frame Aim: To contribute to ensuring that medical supply chains function as efficiently as possible and respond to the needs of end-users.
Services Optimizing medical supply chain More data required
3,000,000 More data required
Country Project Name Maldives Technical Support
Agencies Source Document UN Flash Appeal: WHO Projects http://www.who.int/hac/crises/international/asia_tsunami/appeal/en/projects_mdv.pdf
Sector
WHO Partners: MoH/DPH, UNICEF/ UNFPA/NGOs/ CBOs
Various
Project Activities Specific Needs Budget ($) Time Frame Aim: To provide technical assistance and to coordinate with the government along with other concerned organizations in disaster affected areas to determine the gaps, requirements and accordingly direct the health actions to fill the gaps.
Services General Technical Expertise
250,000 More data required

Demand Matrix – Maldives 17.03.2005
42
Country Project Name Maldives Disease surveillance, verification and response
Agencies Source Document UN Flash Appeal: WHO Projects http://www.who.int/hac/crises/international/asia_tsunami/appeal/en/projects_mdv.pdf
Sector
WHO Partners: MoH/DPH, UNICEF/ UNFPA/NGOs/ CBOs
Health
Project Activities Specific Needs Budget ($) Time Frame Aim: To track patterns of life-threatening diseases among those at risk through prompt set-up of a surveillance and early warning system, with regular epidemiological reports.
More data required 1,000,000 More data required
Country Project Name Maldives Project Management, evaluation and reporting
Agencies Source Document UN Flash Appeal: WHO Projects http://www.who.int/hac/crises/international/asia_tsunami/appeal/en/projects_mdv.pdf
Sector
WHO Partners: MoH/DPH, UNICEF/ UNFPA/NGOs/ CBOs
Health
Project Activities Specific Needs Budget ($) Time Frame Aim: To continuously monitor and follow-up the activities under this project along with the health status in the affected areas, and accordingly take appropriate remedial measures, as necessary.
Services • Project Management Services
More data required
535,000 More data required

Demand Matrix – Sri Lanka 17.03.2005
43
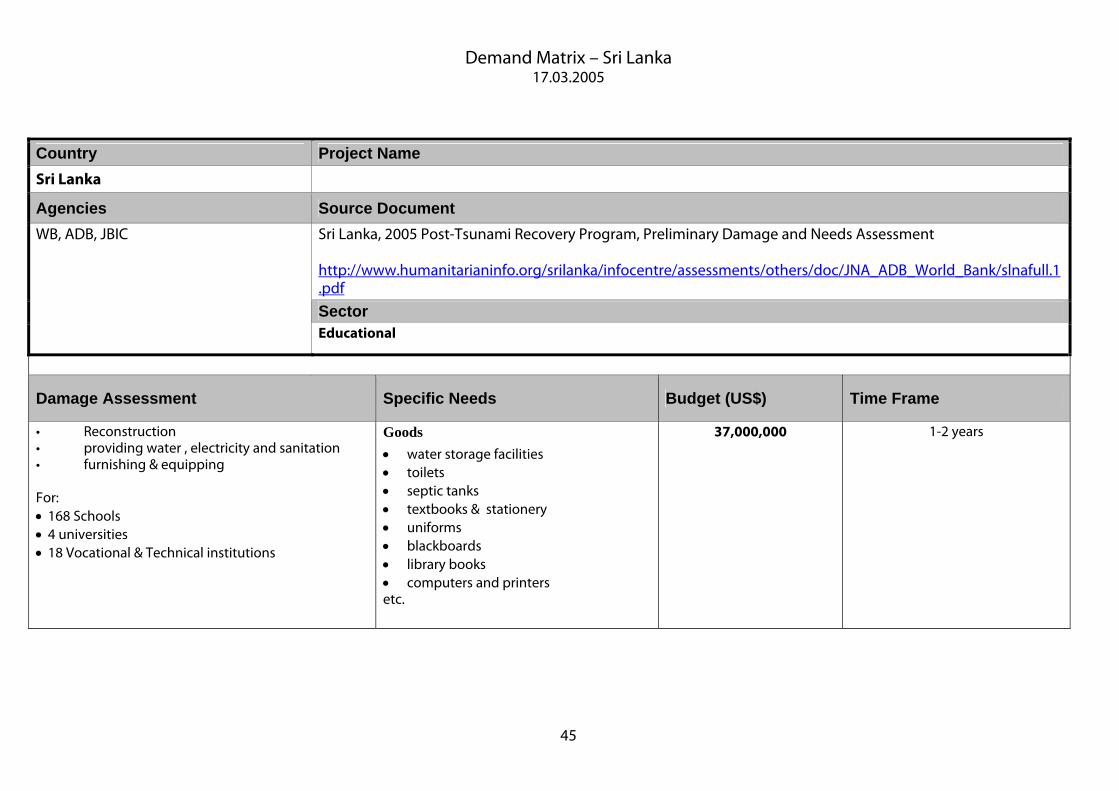
7.4. Sri Lanka Demand Matrix
Country Project Name Sri Lanka
Agencies Source Document Sri Lanka, 2005 Post-Tsunami Recovery Program, Preliminary Damage and Needs Assessment http://www.humanitarianinfo.org/srilanka/infocentre/assessments/others/doc/JNA_ADB_World_Bank/slnafull.1.pdf
Sector
WB, ADB, JBIC
Environmental
Damage Assessment Specific Needs Budget (US$) Time Frame
Rubble and debris disposal 1,500,000
Study of the role of natural resources in minimizing tsunami damage
250,000
Clean up of dug wells and tube wells in affected areas 3,000,000
Impacts on Protected Areas and other environmentally sensitive areas affected by the tsunami
750,000
Strategic Environmental Assessment of the Rehabilitation and Reconstruction Program
200,000
Total 5,700,000
Short Term (3-12 months)
Long term environmental impacts on the marine ecosystems
Services • Well cleaning • Various Impact
assessments • Setting up waste
management procedures
• Debris disposal
1,500,000 Medium to Long Term

Demand Matrix – Sri Lanka 17.03.2005
44
Development of a sustainable waste management system for affected areas
6,000,000
Health care waste management 3,000,000
Reconstruction of damaged and destroyed buildings in National Parks
1,250,000
Total 11,750,000
(1-3 years)
Demand Matrix – Sri Lanka 17.03.2005
45
Country Project Name Sri Lanka
Agencies Source Document Sri Lanka, 2005 Post-Tsunami Recovery Program, Preliminary Damage and Needs Assessment http://www.humanitarianinfo.org/srilanka/infocentre/assessments/others/doc/JNA_ADB_World_Bank/slnafull.1.pdf
Sector
WB, ADB, JBIC
Educational
Damage Assessment Specific Needs Budget (US$) Time Frame
• Reconstruction • providing water , electricity and sanitation • furnishing & equipping For: • 168 Schools • 4 universities • 18 Vocational & Technical institutions
Goods • water storage facilities • toilets • septic tanks • textbooks & stationery • uniforms • blackboards • library books • computers and printers etc.
37,000,000 1-2 years

Demand Matrix – Sri Lanka 17.03.2005
46
Country Project Name Sri Lanka
Agencies Source Document Sri Lanka, 2005 Post-Tsunami Recovery Program, Preliminary Damage and Needs Assessment http://www.humanitarianinfo.org/srilanka/infocentre/assessments/others/doc/JNA_ADB_World_Bank/slnafull.1.pdf
Sector
WB, ADB, JBIC
Health
Damage Assessment Specific Needs Budget (US$) Time Frame/Deadlines Basic health care to the affected 1,300,000 1-3 months
Strengthening existing health institutions 6,800,000 1-3 months
Re-establishing preventive health care needs 4,500,000 3-12 months
Reestablishment of regular drug supplies 1,800,000
3-12 months
Psycho-social support 1,200,000 3-12 months
Health planning needs 900,000 3-12 months
Reconstruct and re-equip 92 hospitals & health institutions
56,600,000 1-3 years
Strengthening the health care delivery system 4,500,000 1-3 years
Strengthening the epidemiological surveillance system
Goods • medical instruments (sterilizers, incubators); • 54+ ambulances; • fogging devices; • insecticides; • Drugs;
Services • Clean water supply, purification and
decontamination (16 water bowsers); repair of cold chain;
• computerize received drugs • Strengthening laboratory network • Reconstruct and re-equip 92 hospitals &
health institutions 900,000 1-3 years

Demand Matrix – Sri Lanka 17.03.2005
47
Establishing an emergency prevention and disaster mitigation system
900,000 1-3 years
Total 62,900,000

Demand Matrix – Sri Lanka 17.03.2005
48
Country Project Name Sri Lanka
Agencies Source Document Sri Lanka, 2005 Post-Tsunami Recovery Program, Preliminary Damage and Needs Assessment http://www.humanitarianinfo.org/srilanka/infocentre/assessments/others/doc/JNA_ADB_World_Bank/slnafull.1.pdf
Sector
WB, ADB, JBIC
Housing
Damage Assessment Specific Needs Budget (US$) Time Frame
Strategy is in-situ reconstruction actively managed by affected households and done by local building contractors
Local building material suppliers are targeted. Most likely they will need vast amounts of building materials.
Data required Data required

Demand Matrix – Sri Lanka 17.03.2005
49
Country Project Name Sri Lanka
Agencies Source Document Sri Lanka, 2005 Post-Tsunami Recovery Program, Preliminary Damage and Needs Assessment http://www.humanitarianinfo.org/srilanka/infocentre/assessments/others/doc/JNA_ADB_World_Bank/slnafull.1.pdf
Sector
WB, ADB, JBIC
Agriculture & Livestock
Damage Assessment Specific Needs Budget (US$) Time Frame
Micro-credit facilities to re-establish lost agriculture and livestock dependent livelihoods.
2,110,000
Replace damaged agriculture facilities and infrastructure 1,510,000
Rehabilitation of soil and water resource and Provision of extension services to facilitate recovery phase
20,000
Restoration of damaged Salt Water Exclusion Structures, embankments and drainage canals
150,000
Strengthening marketing and support services 100,000
Human capacity building, training etc. 200,000
Strengthening institutional capacity (adaptive research, multiplication of planting material, etc.)
100,000
Services • re-establish lost agriculture and livestock
dependent livelihoods. • Replace damaged agriculture facilities and
infrastructure • Rehabilitation of soil and water resource • Provision of extension services to facilitate
recovery phase • Restoration of damaged Salt Water Exclusion
Structures, embankments and drainage canals
Total 4,300,000

Demand Matrix – Sri Lanka 17.03.2005
50
Country Project Name Sri Lanka
Agencies Source Document Sri Lanka, 2005 Post-Tsunami Recovery Program, Preliminary Damage and Needs Assessment http://www.humanitarianinfo.org/srilanka/infocentre/assessments/others/doc/JNA_ADB_World_Bank/slnafull.1.pdf
Sector
WB, ADB, JBIC
Power
Damage Assessment Specific Needs Budget (US$) Time Frame
Operational capability of Ceylon Electricity Board
Rehabilitation and repair of damaged power infrastructure
27,100,000
Upgrading and expansion of infrastructure to improve access and promote economic development.
Goods • Construction tools and materials • Vehicles • Office furniture Services • Rehabilitation of damaged power
infrastructure • Development of electrical infrastructure
40,000,000 – 50,000,000

Demand Matrix – Sri Lanka 17.03.2005
51
Country Project Name Sri Lanka
Agencies Source Document Sri Lanka, 2005 Post-Tsunami Recovery Program, Preliminary Damage and Needs Assessment http://www.humanitarianinfo.org/srilanka/infocentre/assessments/others/doc/JNA_ADB_World_Bank/slnafull.1.pdf
Sector
WB, ADB, JBIC
Water supply and sanitation
Damage Assessment Specific Needs Budget (US$) Time Frame
Urgently needed items/equipment Goods water bowsers gully emptiers water meter crew cabs polyethylene pipes water disinfection kits generators water quality testing kits water purification kits sludge pumps water pumps electric gears etc.
1-3 months
Provision to transit camps 3-12 months
Water supply and piped sewer system Goods water supply sanitation systems sewage disposal bowsers
50,000,000 1-3 years

Demand Matrix – Sri Lanka 17.03.2005
52
Country Project Name Sri Lanka
Agencies Source Document Sri Lanka, 2005 Post-Tsunami Recovery Program, Preliminary Damage and Needs Assessment http://www.humanitarianinfo.org/srilanka/infocentre/assessments/others/doc/JNA_ADB_World_Bank/slnafull.1.pdf
Sector
WB, ADB, JBIC
Railways
Damage Assessment Specific Needs Budget (US$) Time Frame
Repairs Goods track-bed rails and sleepers bridges and culverts railway stations and substations railway employees quarters dwelling and relay houses automated signaling system advance communication system locomotives power sets (multiple train units) passenger carriages construction equipment
15,000,000 Short-term (on-going)
Rehabilitation – Longer term reconstruction & maintenance of railways system
Services Long-term reconstruction services
71,000,000 1 year
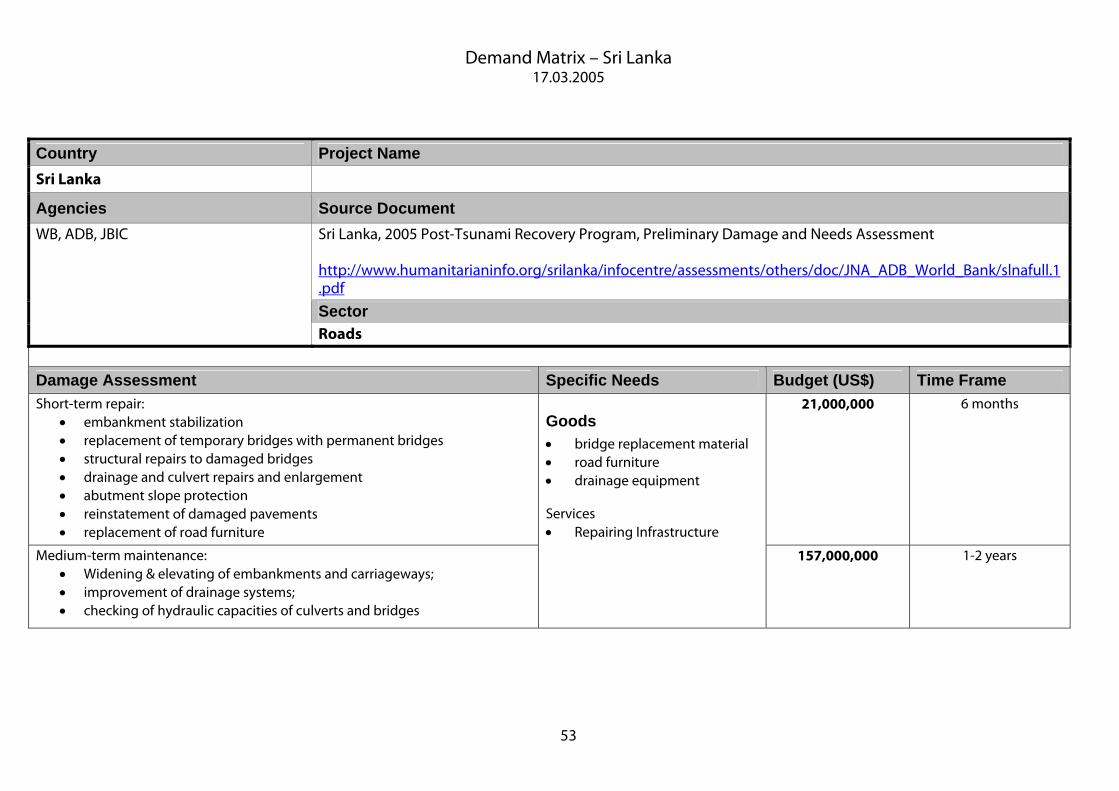
Demand Matrix – Sri Lanka 17.03.2005
53
Country Project Name Sri Lanka
Agencies Source Document Sri Lanka, 2005 Post-Tsunami Recovery Program, Preliminary Damage and Needs Assessment http://www.humanitarianinfo.org/srilanka/infocentre/assessments/others/doc/JNA_ADB_World_Bank/slnafull.1.pdf
Sector
WB, ADB, JBIC
Roads
Damage Assessment Specific Needs Budget (US$) Time Frame Short-term repair:
• embankment stabilization • replacement of temporary bridges with permanent bridges • structural repairs to damaged bridges • drainage and culvert repairs and enlargement • abutment slope protection • reinstatement of damaged pavements • replacement of road furniture
21,000,000 6 months
Medium-term maintenance: • Widening & elevating of embankments and carriageways; • improvement of drainage systems; • checking of hydraulic capacities of culverts and bridges
Goods • bridge replacement material • road furniture • drainage equipment Services • Repairing Infrastructure 157,000,000 1-2 years
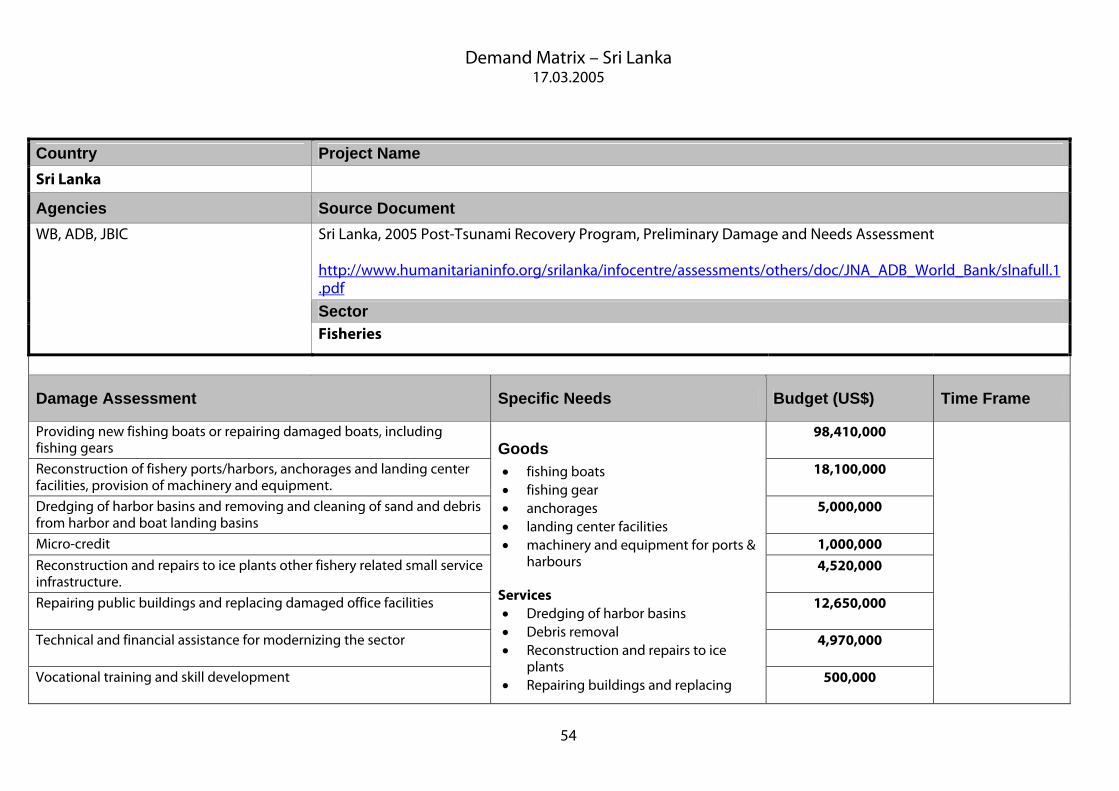
Demand Matrix – Sri Lanka 17.03.2005
54
Country Project Name Sri Lanka
Agencies Source Document Sri Lanka, 2005 Post-Tsunami Recovery Program, Preliminary Damage and Needs Assessment http://www.humanitarianinfo.org/srilanka/infocentre/assessments/others/doc/JNA_ADB_World_Bank/slnafull.1.pdf
Sector
WB, ADB, JBIC
Fisheries
Damage Assessment Specific Needs Budget (US$) Time Frame
Providing new fishing boats or repairing damaged boats, including fishing gears
98,410,000
Reconstruction of fishery ports/harbors, anchorages and landing center facilities, provision of machinery and equipment.
18,100,000
Dredging of harbor basins and removing and cleaning of sand and debris from harbor and boat landing basins
5,000,000
Micro-credit 1,000,000
Reconstruction and repairs to ice plants other fishery related small service infrastructure.
4,520,000
Repairing public buildings and replacing damaged office facilities 12,650,000
Technical and financial assistance for modernizing the sector 4,970,000
Vocational training and skill development
Goods • fishing boats • fishing gear • anchorages • landing center facilities • machinery and equipment for ports &
harbours Services • Dredging of harbor basins • Debris removal • Reconstruction and repairs to ice
plants • Repairing buildings and replacing 500,000
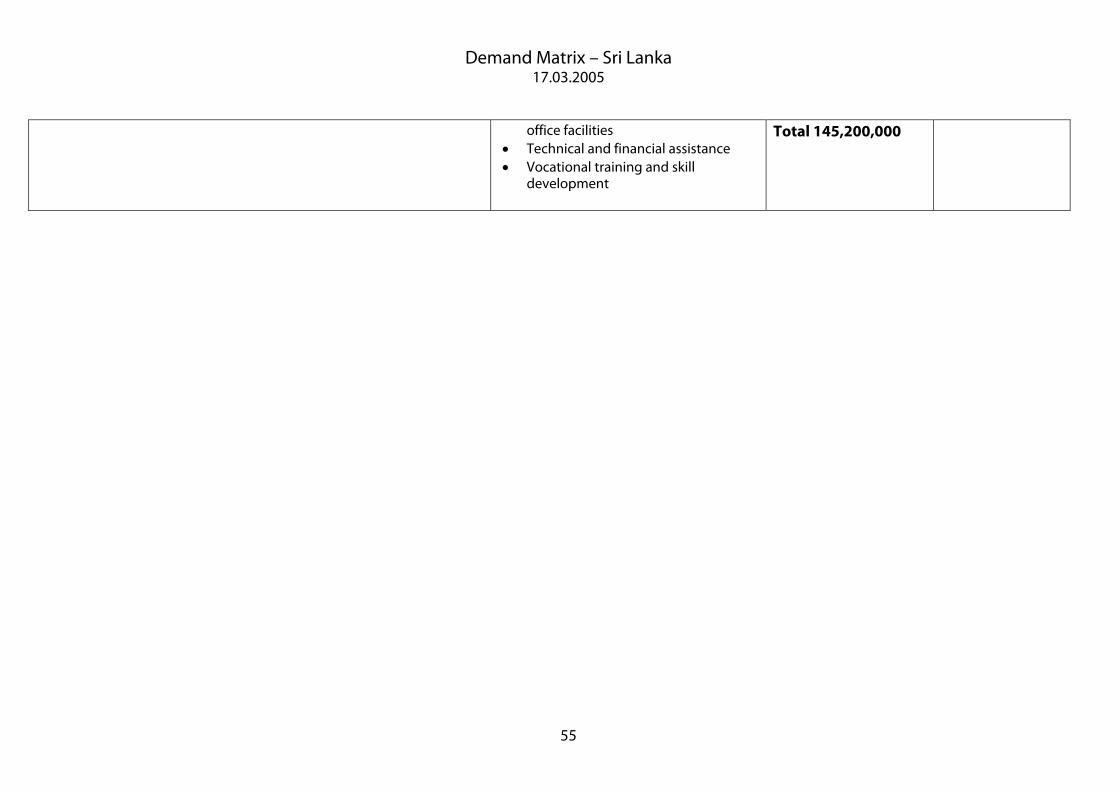
Demand Matrix – Sri Lanka 17.03.2005
55
office facilities • Technical and financial assistance • Vocational training and skill
development
Total 145,200,000

Demand Matrix – Sri Lanka 17.03.2005
56
Country Project Name Sri Lanka
Agencies Source Document Sri Lanka, 2005 Post-Tsunami Recovery Program, Preliminary Damage and Needs Assessment http://www.humanitarianinfo.org/srilanka/infocentre/assessments/others/doc/JNA_ADB_World_Bank/slnafull.1.pdf
Sector
WB, ADB, JBIC
Hazard Risk Management
Damage Assessment Specific Needs Budget (US$) Time Frame
Early warning systems (EWS); strengthening and upgrading of existing national systems
Emergency information and communication systems; strengthening the information flow
Education and training through National Disaster Management Centre (NDMC)
Knowledge sharing; International exchange of best practices and knowledge;
Goods Improved equipment
Services • training for warning systems • Training and exercising of disaster management
plans • Improve information packages and
communication strategies.
A complete overview of requirements for improving emergency preparedness is not available at this stage.

Demand Matrix – Sri Lanka 17.03.2005
57
Country Project Name Sri Lanka
Agencies Source Document UNDAC Rapid Environmental Assessment by Joint UNEP/OCHA Environment unit, February 2005
Sector
UNDAC/OCHA/UNEP
Rapid Environmental Assessment
Damage Assessment Specific Needs Budget (US$) Time Frame
• Management of Waste and Debris • Sewage and Sanitation Management • Re-mapping Affected Areas
For remapping: technical support and the provision of remote sensing data
Data Required Data Required
Country Project Name Sri Lanka
Agencies Source Document OCHA Situation Report – Reporting period 11-17 February 2005
Sector
OCHA/ Ministry of Urban Development and Water Supply
Sanitation
Project Activities Specific Needs Budget (US$) Time Frame construction of 16,000 temporary toilets at campsites 16,000 temporary toilets 3,000,000 1-3 months

Demand Matrix – Sri Lanka 17.03.2005
58
Country Project Name Sri Lanka
Agencies Source Document Rebuilding Community Infrastructure & Shelter in Disaster Affected District of Matara, Sri Lanka (not dated)
Sector
UN Habitat
Rebuilding in Matara
Project Activities Specific Needs Budget (US$) Time Frame Proposal to assist in the rebuilding of communities in district of Matara. The tsunami has destroyed a total of 8021 houses, either partially or completely, representing over 12 percent of the total housing stock in the Matara District. The project is designed to benefit at least 5,000 affected families, or approximately 30,000 people. Location: Major and smaller townships of Matara, Weligama, Dickwella and Devinuwara in the Matara District.
Work Item Cost US$ Clearing Debris 50,000 Cleaning of Drains 75,000 Rehabilitation of community Infrastructure such as markets, parks, primary schools, municipal clinics etc.
225,000
Water Supply 200,000
Toilets and Sceptic tanks 50,000 Access roads 50,000
Housing (Repairs and Reconstruction)
1,350,000
Total 3,000,000
3,000,000 6-12 months

Demand Matrix – Sri Lanka 17.03.2005
59
Country Project Name Sri Lanka
Agencies Source Document Rebuilding Community Infrastructure & Shelter in Disaster Affected Areas of Sri Lanka locations
Sector
UN Habitat
Emergency Shelter and Infrastructure
Project Activities Specific Needs Budget (US$) Time Frame
18,000 affected families, or approximately 100,000 people; Location: Batticaloa/Kattankudi, Galle, Jaffna, Kilinochchi, Ampara, Matara, Kalutara and Hambantota.
Services • support to remove the debris, rebuild and repair their houses; • repairing essential infrastructure; • social recovery of affected communities, supported through skills training
and local employment creation. • cleaning roads and drainage of debris; • making provision for public sceptic tank and latrines; • reviving community spaces. Budgeted: $ 1.000 for each family (18.000)
20,000,000 6-12 months
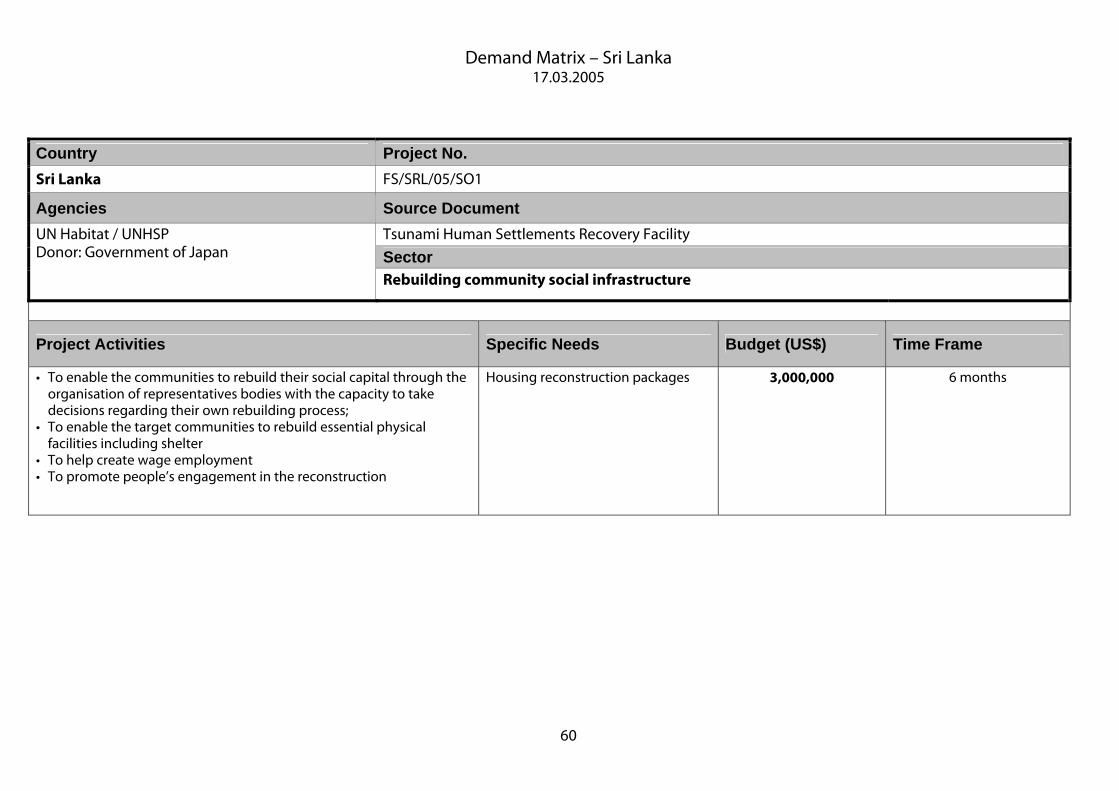
Demand Matrix – Sri Lanka 17.03.2005
60
Country Project No. Sri Lanka FS/SRL/05/SO1
Agencies Source Document Tsunami Human Settlements Recovery Facility
Sector
UN Habitat / UNHSP Donor: Government of Japan
Rebuilding community social infrastructure
Project Activities Specific Needs Budget (US$) Time Frame
• To enable the communities to rebuild their social capital through the organisation of representatives bodies with the capacity to take decisions regarding their own rebuilding process;
• To enable the target communities to rebuild essential physical facilities including shelter
• To help create wage employment • To promote people’s engagement in the reconstruction
Housing reconstruction packages 3,000,000 6 months

Demand Matrix – Sri Lanka 17.03.2005
61
Country Project No. Sri Lanka XB/SRL/
Agencies Source Document Rebuilding Community Infrastructure and Shelter in Kalmunai District
Sector
UN Habitat / UNHSP
Rebuilding Community Infrastructure
Project Activities Specific Needs Budget (US$) Time Frame
• To enable the communities to rebuild their social capital through the organisation of representatives bodies with the capacity to take decisions regarding their own rebuilding process;
• To enable the target communities to rebuild essential physical facilities including shelter
• To help create wage employment • To promote people’s engagement in the reconstruction
Housing reconstruction packages 11,500,000 12 months

Demand Matrix – Sri Lanka 17.03.2005
62
Country Project Name Sri Lanka Health sector response
Agencies Source Document Health sector response for survivors of the tsunami in Sri Lanka
Sector
WHO, Ministry of Health, UNICEF, UNFPA, MSF, IOM, Sarvodaya
Health
Project Activities Specific Needs Budget (US$) Time Frame
Overall goal: To reduce avoidable suffering and death due to public health consequences of tsunami. 1. Co-ordinate health sector response, with agreed strategies and joint action; manage information requests for technical issues and public and media information 2. Set-up early warning communicable disease surveillance system 3. Assess the health needs of the affected population 4. Assess the impact on health services and facilities 4. Ensure access to adequate health care services 5. Identify and enable the filling of critical gaps in public health sector 6. Contribute to ensuring that medical supply chains function as efficiently as possible
Services • Co-ordinate health sector response • manage information requests for technical
issues and public and media information • Set-up early warning communicable
disease surveillance system • Assess health needs • Assess impact on health services and
facilities • Ensure access to adequate health care
services • Identify and enable the filling of critical
gaps in public health sector • Contribute to ensuring that medical supply
chains function as efficiently as possible
12,500,000 Data required

Demand Matrix – Sri Lanka 17.03.2005
63
Country Project Name Sri Lanka
Agencies Source Document UNICEF Situation Report Sri Lanka, 28 february 2005
Sector
UNICEF / donor coordination committee
Education
Project Activities Specific Needs Budget (US$) Time Frame
Reconstruction and re-equiping of 163 schools (180 schools need reconstruction of which 17 are under UNICEF’s responsibility).
• Construction materials • Books & Stationery • Furniture & equipment • Computers & Printers
Data Required Data required

Demand Matrix – Sri Lanka 17.03.2005
64
Country Project Name Sri Lanka Hambantota Port
Agencies Source Document OCHA Situation Report for Sri Lanka Reporting Period: 11 – 17 February 2005
Sector
Sri Lankan Government
Harbour
Project Activities Specific Needs Budget (US$) Time Frame
New port in Hambantota • Jetties • Terminals • Docks • Administrative buildings
1,500,000,000 3 years

Demand Matrix – Indonesia 17.03.2005
65
7.5. Indonesia Demand Matrix
Country Project Name Indonesia Immediate Employment through Labour Intensive Works
Agencies Source Document UNDP-Earthquake-Tsunami 2005 Flash Appeal Projects – Indonesia. (Updated as of 24 Jan. 2005)
Sector
UNDP Project Execution: Direct Execution by UNDP, under Aceh Emergency Response and Transitional Recovery Programme
Project Activities Specific Needs Budget Time Frame / Deadlines
• Provide the local authorities with heavy equipment (dump trucks, bulldozers, back hoes, loaders, etc.) plus operating crews.
• Continue and scale up labour intensive clearing of public service facilities through deployment of work teams drawn from IDP camps.
• Provide manual equipment, to remove debris for public service facilities that remain structurally sound but have compounds and ground floors inundated with light debris.
• Provide employment for up to 50,000 persons (approx. 1 month work each) over the next six months both in Banda Aceh and in other affected urban areas.
Equipment • dump trucks, • bulldozers, • back hoes, • loaders
Indicative Budget Project Activities (US$) Heavy equipments &
Manual Equipment 5,500,000
Recruitment of Labourers 3,500,000 Technical Assistance 250,000 Monitoring, Reporting,
Miscellaneous 250,000
TOTAL 9,500,000
6 months
Activities undertaken during this early recovery period are likely to go beyond the period of the Appeal, and will dovetail with the transitional recovery phase.

Demand Matrix – Indonesia 17.03.2005
66
Country Project Name Indonesia Recovery of Livelihoods
Agencies Source Document UNDP-Earthquake-Tsunami 2005 Flash Appeal Projects – Indonesia. (Updated as of 24 Jan. 2005)
Sector
UNDP Project Execution: Direct Execution by UNDP, under Aceh Emergency Response and Transitional Recovery Programme
Project Activities Specific Needs Budget Time Frame / Deadlines
• Provide technical advisory support to the local authorities for developing strategies and priorities for livelihoods recovery ensuring community participation.
• Provide small-scale enterprises with technical support and seed funding through micro-finance mechanisms.
• Support rehabilitation of fisheries by repairing boats, providing financing to replace destroyed boats and rehabilitating marketing structures.
• Rehabilitate market centers in Bandah Aceh and other urban centers.
• Rehabilitate the paddy fields and other agricultural activities.
• Support establishment of women’s enterprises. • Organize skills training programmes for building
trades
Services • technical advisory
support • technical support and
seed funding • repairing boats, • replace destroyed
boats • skills training
Indicative Budget Project Activities (US$) Participatory
assessment processes 400,000
Seed funding for micro-finance
10,000,000
Fisheries and agriculture
9,000,000
Women’s enterprises 7,000,000 Skills training 4,000,000 Technical assistance 2,000,000 Monitoring, reporting,
miscellaneous 850,000
TOTAL 33,250,000
6 months
Activities undertaken during this early recovery period are likely to go beyond the period of the Appeal, and will dovetail with the transitional recovery phase.

Demand Matrix – Indonesia 17.03.2005
67
Country Project Name Indonesia Emergency Shelter and Recovery of Housing
Agencies Source Document UNDP-Earthquake-Tsunami 2005 Flash Appeal Projects – Indonesia. (Updated as of 24 Jan. 2005)
Sector
UNDP Project Execution: Direct Execution by UNDP, under Aceh Emergency Response and Transitional Recovery Programme
Project Activities Specific Needs Budget Time Frame / Deadlines
• Provide emergency shelter support. • Undertake labour intensive village debris
clearance. • Build local capacity to deal with housing, land and
property rights. • Rehabilitate rural feeder roads. • Provide technical assistance for hazard resistant
shelter rehabilitation. • Provide construction materials for rehabilitation of
damaged rural houses. • Provide tool kits and construction materials for
reconstruction of houses.
• Emergency shelter • Construction material
Indicative Budget Project Activities (US$) Emergency shelter 700,000 Construction material 10,000,000 Village debris clearance
and rehabilitation of local infrastructure
6,000,000
Skills training 4,700,000 Technical assistance 2,000,000 Monitoring, reporting,
miscellaneous 600,000
TOTAL 24,000,000
6 months
Activities undertaken during this early recovery period are likely to go beyond the period of the Appeal, and will dovetail with the transitional recovery phase.

Demand Matrix – Indonesia 17.03.2005
68
Country Project Name Indonesia Capacity Building for Sustainable Recovery and Risk Reduction
Agencies Source Document UNDP-Earthquake-Tsunami 2005 Flash Appeal Projects – Indonesia. (Updated as of 24 Jan. 2005)
Sector
UNDP Project Execution: Direct Execution by UNDP, under Aceh Emergency Response and Transitional Recovery Programme
Project Activities Specific Needs Budget Time Frame / Deadlines
• Short intensive training and institutional support to strengthen public administration capacity.
• Provide housing support to returning civil servants.
• Provide technical support to Government for strengthening capacities to manage psychosocial needs.
• Strengthen capacity of local NGOs in basic project and financial management.
• Support legislation on disaster management and disseminate best practices for construction in areas of high hazard potential.
• Enhance capacities for community based disaster risk management.
• Support to participatory planning processes for recovery and reconstruction.
Services • Capacity-building and
training • Technical assistance
Indicative Budget Project Activities (US$) Capacity-building 2,000,000 Workshops 500,000 Skills training 250,000 Technical assistance 1,750,000 Monitoring,
reporting, miscellaneous
250,000
TOTAL 4,750,000
6 months
Activities undertaken during this early recovery period are likely to go beyond the period of the Appeal, and will dovetail with the transitional recovery phase.

Demand Matrix – Indonesia 17.03.2005
69
Country Project Name Indonesia Assessment of Damage to the Health System in the Disaster-Affected Area
Agencies Source Document UN Flash Appeal: WHO Projects at: http://www.who.int/hac/crises/international/asia_tsunami/appeal/en/projects_idn.pdf
Sector
WHO Partners: Ministry of Health, provincial and district health authorities, UN agencies and NGOs
Project Activities Specific Needs Budget Time Frame / Deadlines
Aim: To assess the extent of damage to the overall health system in the disaster-affected area through rapid assessments of the conditions of infrastructure, essential equipment, human resources needs, and other essential system components such as the disease surveillance system, the drug supplies and distribution systems and health systems management.
Services • Health system
assessments
US$ 2,000,000 Data required

Demand Matrix – Indonesia 17.03.2005
70
Country Project Name Indonesia Establishment of an Integrated Health Emergency Unit for Disaster Response
Agencies Source Document UN Flash Appeal: WHO Projects at: http://www.who.int/hac/crises/international/asia_tsunami/appeal/en/projects_idn.pdf
Sector
WHO Partners: Ministry of Health, provincial and district health authorities, UNICEF, UNFPA
Project Activities Specific Needs Budget Time Frame / Deadlines
Aim: To establish a health emergency operations unit in Aceh and North Sumatra and also in Ministry of Health in Jakarta, including an integrated emergency health information system to coordinate health sector activities and health-related reports.
Services • Health Emergency
Operations Unit • Health Information
system
US$ 3,500,000 Data required

Demand Matrix – Indonesia 17.03.2005
71
Country Project Name Indonesia Emergency Health Services for the Disaster-Affected Population in Aceh and North Sumatra
Agencies Source Document UN Flash Appeal: WHO Projects at: http://www.who.int/hac/crises/international/asia_tsunami/appeal/en/projects_idn.pdf
Sector
WHO Partners: Ministry of Health, provincial and district health authorities, UNICEF, NGOs
Project Activities Specific Needs Budget Time Frame / Deadlines
Aim: To organise public health campaigns for the prevention of disease outbreaks and for treatment of prevalent diseases such as diarrhoea, ARI, insect-borne diseases, and vaccine preventable diseases through disease surveillance, organization of immunization campaigns, provision of treatment, and public health education.
Goods • Vaccines Services • Provision of treatment • Public Health
Education
US$ 8,000,000 Data required

Demand Matrix – Indonesia 17.03.2005
72
Country Project Name Indonesia Provision of Emergency Child and Maternal Health Services
Agencies Source Document UN Flash Appeal: WHO Projects at: http://www.who.int/hac/crises/international/asia_tsunami/appeal/en/projects_idn.pdf
Sector
WHO Partners: Ministry of Health, provincial and district health authorities, UNICEF, UNFPA, international and national NGOs
Project Activities Specific Needs Budget Time Frame / Deadlines
Aim: To assist the Government and other agencies in providing child and maternal health services. The focus will be given to technical support for provision of care, preventive and treatment advice, training and essential medical supplies.
Services • Child & Maternal
Health Services
US$ 5,000,000 Data required

Demand Matrix – Indonesia 17.03.2005
73
Country Project Name Indonesia Restoration of essential health services including establishment of blood banks
Agencies Source Document UN Flash Appeal: WHO Projects at: http://www.who.int/hac/crises/international/asia_tsunami/appeal/en/projects_idn.pdf
Sector
WHO Partners: Ministry of Health, provincial and district health authorities
Project Activities Specific Needs Budget Time Frame / Deadlines
Aim: Using a phased approach, to assist the Government to restore the essential services previously provided by state health facilities at various levels, including public health, clinical, laboratory and rehabilitative, and minor surgical services. Activities include training of medical staff, management of human resources for health, procurement of essential medical equipment and laboratory supplies, and support to repair and restore damaged equipment where appropriate
Goods • Medical Equipment • Laboratory supplies Services • Training of Medical
Staff • Management of
Human Resources
US$ 10,000,000 Data required
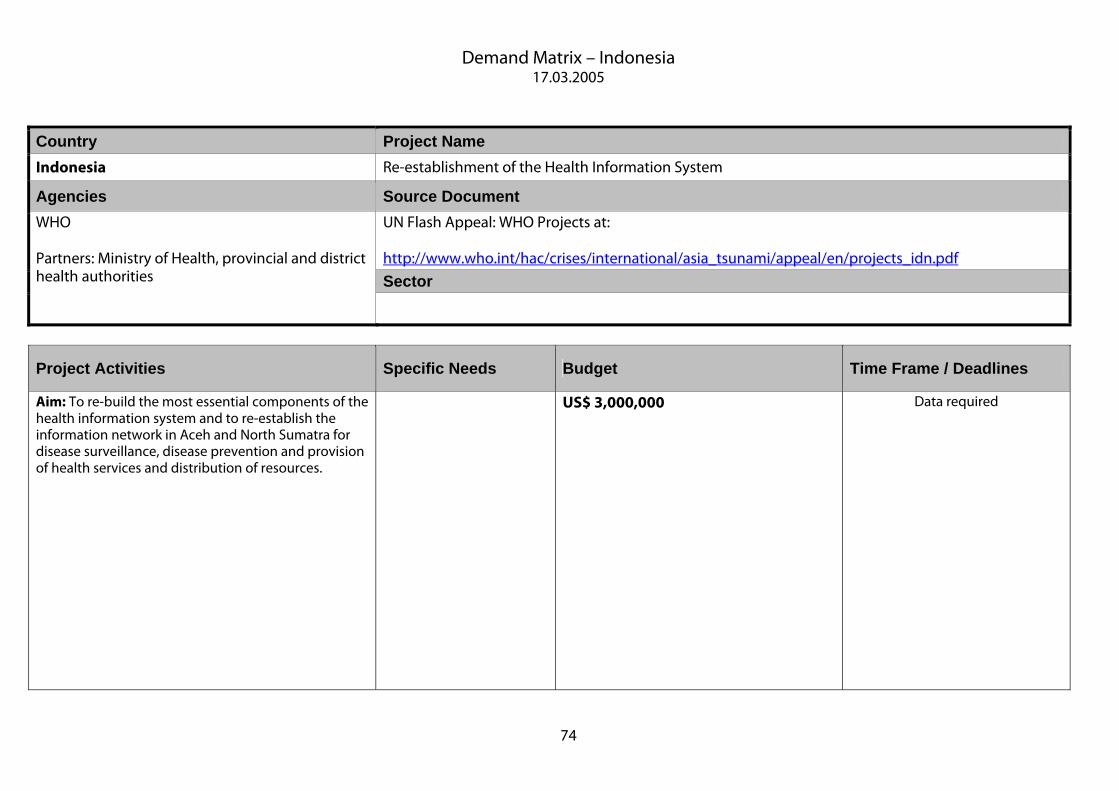
Demand Matrix – Indonesia 17.03.2005
74
Country Project Name Indonesia Re-establishment of the Health Information System
Agencies Source Document UN Flash Appeal: WHO Projects at: http://www.who.int/hac/crises/international/asia_tsunami/appeal/en/projects_idn.pdf
Sector
WHO Partners: Ministry of Health, provincial and district health authorities
Project Activities Specific Needs Budget Time Frame / Deadlines
Aim: To re-build the most essential components of the health information system and to re-establish the information network in Aceh and North Sumatra for disease surveillance, disease prevention and provision of health services and distribution of resources.
US$ 3,000,000 Data required
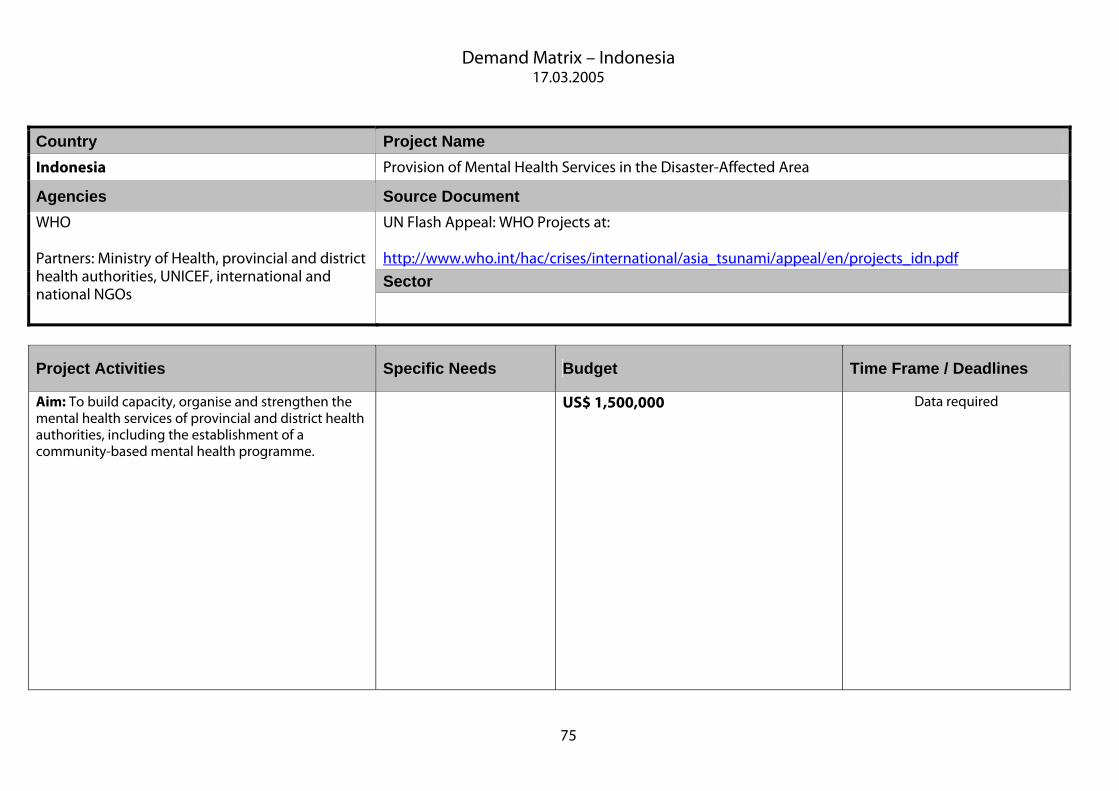
Demand Matrix – Indonesia 17.03.2005
75
Country Project Name Indonesia Provision of Mental Health Services in the Disaster-Affected Area
Agencies Source Document UN Flash Appeal: WHO Projects at: http://www.who.int/hac/crises/international/asia_tsunami/appeal/en/projects_idn.pdf
Sector
WHO Partners: Ministry of Health, provincial and district health authorities, UNICEF, international and national NGOs
Project Activities Specific Needs Budget Time Frame / Deadlines
Aim: To build capacity, organise and strengthen the mental health services of provincial and district health authorities, including the establishment of a community-based mental health programme.
US$ 1,500,000 Data required

Demand Matrix – Indonesia 17.03.2005
76
Country Project Name Indonesia Restoration of Water and Sanitation Systems in the Disaster-Affected Area
Agencies Source Document UN Flash Appeal: WHO Projects at: http://www.who.int/hac/crises/international/asia_tsunami/appeal/en/projects_idn.pdf
Sector
WHO Partners: Ministry of Health, provincial and district health authorities, UNICEF, international and national NGOs
Project Activities Specific Needs Budget Time Frame / Deadlines
Aim: In collaboration with partners, rehabilitate the water supply and sanitation waste disposal services in affected areas.
US$ 3,000,000 Data required
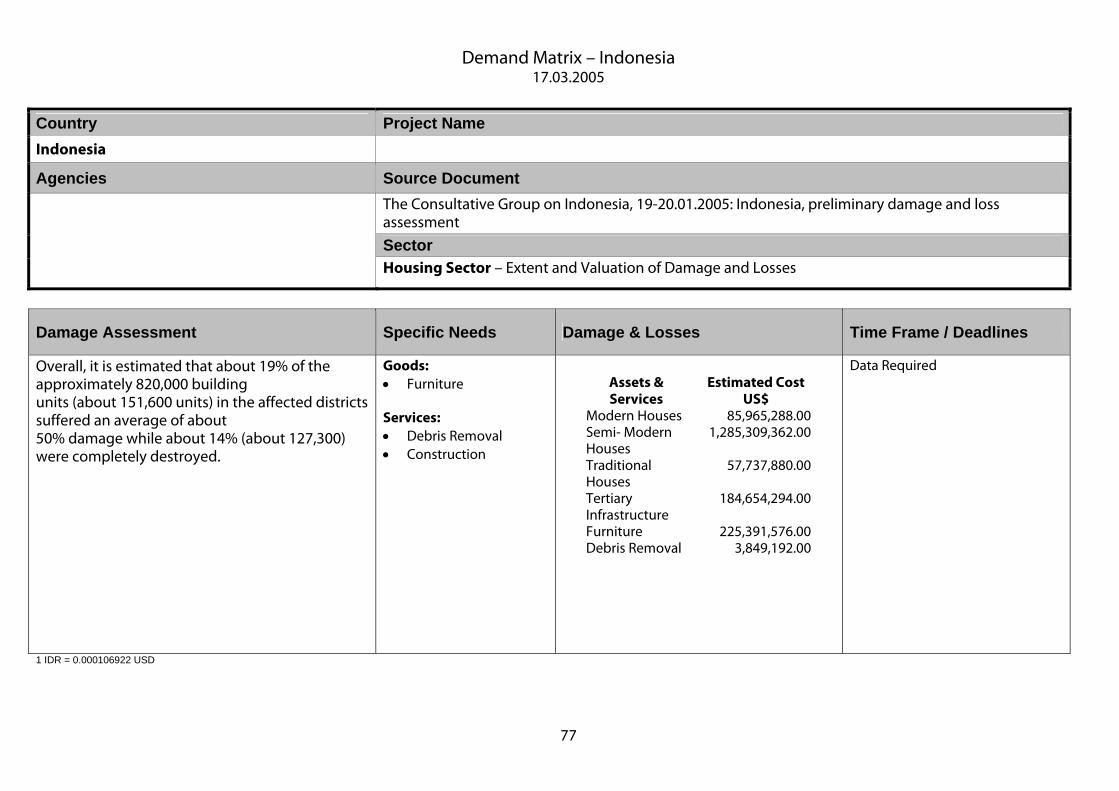
Demand Matrix – Indonesia 17.03.2005
77
Country Project Name Indonesia
Agencies Source Document The Consultative Group on Indonesia, 19-20.01.2005: Indonesia, preliminary damage and loss assessment
Sector
Housing Sector – Extent and Valuation of Damage and Losses
Damage Assessment Specific Needs Damage & Losses Time Frame / Deadlines
Overall, it is estimated that about 19% of the approximately 820,000 building units (about 151,600 units) in the affected districts suffered an average of about 50% damage while about 14% (about 127,300) were completely destroyed.
Goods: • Furniture Services: • Debris Removal • Construction
Assets & Services
Estimated Cost US$
Modern Houses 85,965,288.00 Semi- Modern Houses
1,285,309,362.00
Traditional Houses
57,737,880.00
Tertiary Infrastructure
184,654,294.00
Furniture 225,391,576.00 Debris Removal 3,849,192.00
Data Required
1 IDR = 0.000106922 USD
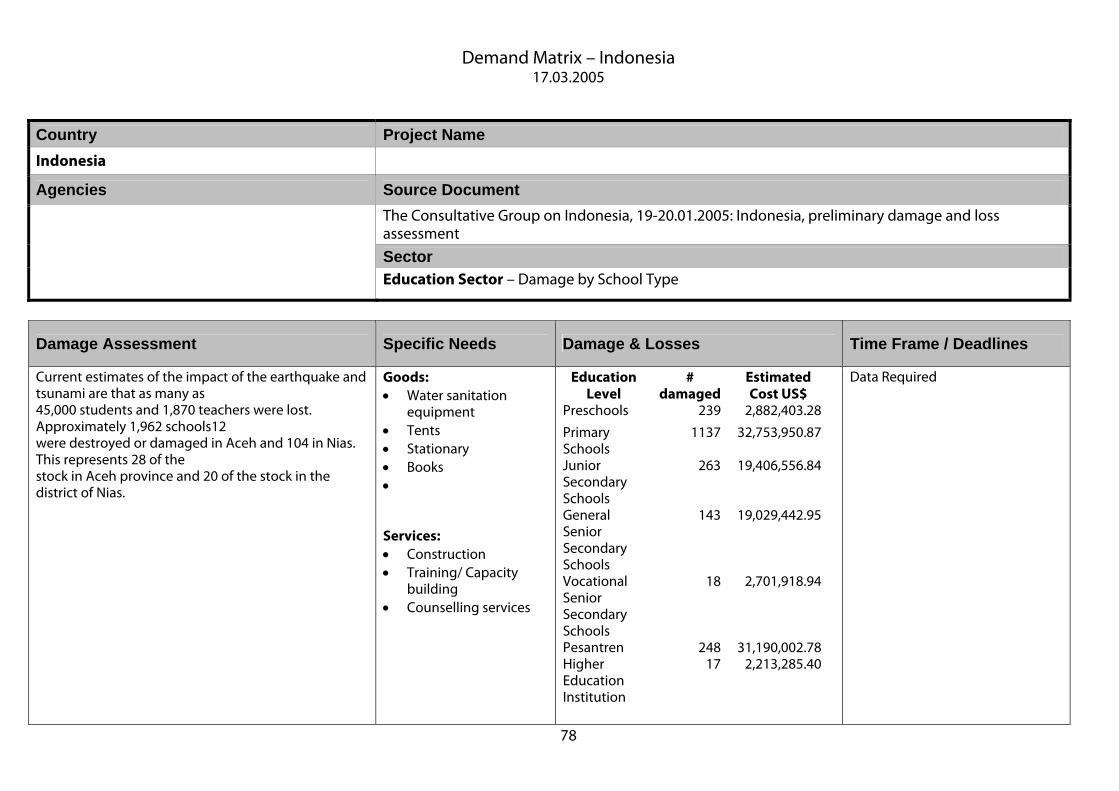
Demand Matrix – Indonesia 17.03.2005
78
Country Project Name Indonesia
Agencies Source Document The Consultative Group on Indonesia, 19-20.01.2005: Indonesia, preliminary damage and loss assessment
Sector
Education Sector – Damage by School Type
Damage Assessment Specific Needs Damage & Losses Time Frame / Deadlines
Current estimates of the impact of the earthquake and tsunami are that as many as 45,000 students and 1,870 teachers were lost. Approximately 1,962 schools12 were destroyed or damaged in Aceh and 104 in Nias. This represents 28 of the stock in Aceh province and 20 of the stock in the district of Nias.
Goods: • Water sanitation
equipment • Tents • Stationary • Books • Services: • Construction • Training/ Capacity
building • Counselling services
Education Level
# damaged
Estimated Cost US$
Preschools 239 2,882,403.28
Primary Schools
1137 32,753,950.87
Junior Secondary Schools
263 19,406,556.84
General Senior Secondary Schools
143 19,029,442.95
Vocational Senior Secondary Schools
18 2,701,918.94
Pesantren 248 31,190,002.78 Higher Education Institution
17 2,213,285.40
Data Required
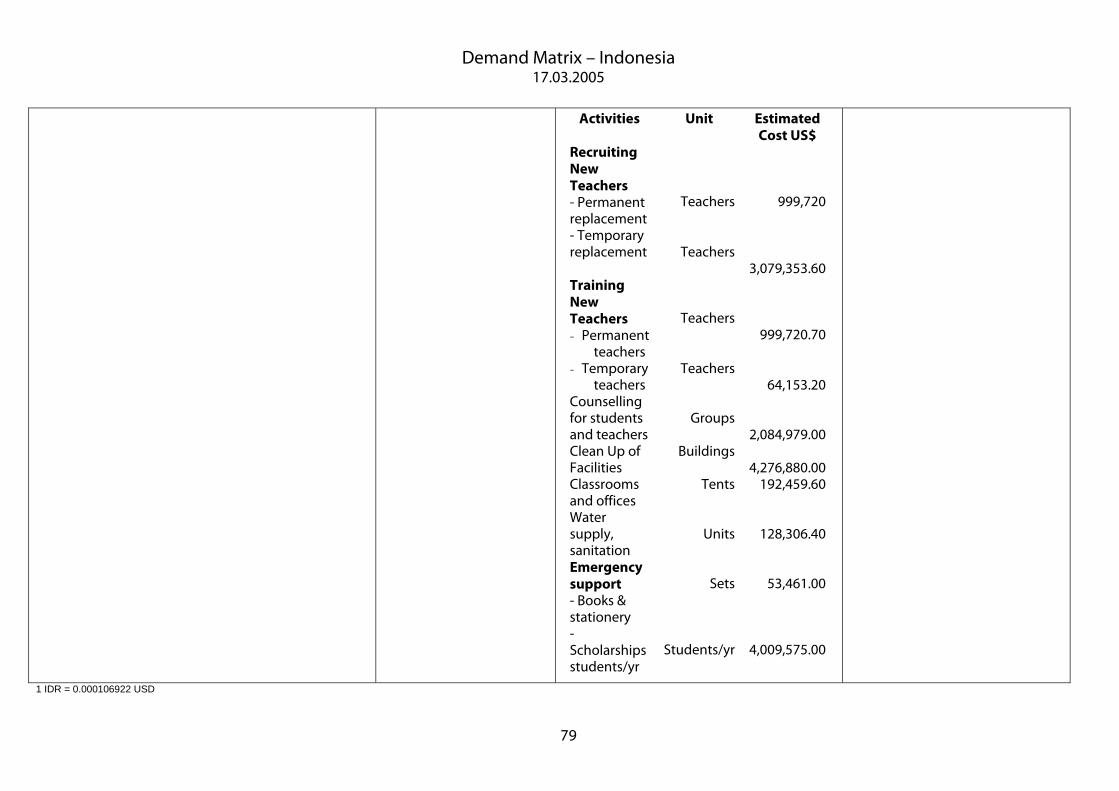
Demand Matrix – Indonesia 17.03.2005
79
Activities Unit Estimated Cost US$
Recruiting New Teachers - Permanent replacement
Teachers 999,720
- Temporary replacement Teachers
3,079,353.60 Training New Teachers - Permanent
teachers
Teachers 999,720.70
- Temporary teachers
Teachers 64,153.20
Counselling for students and teachers
Groups
2,084,979.00
Clean Up of Facilities
Buildings 4,276,880.00
Classrooms and offices
Tents 192,459.60
Water supply, sanitation
Units 128,306.40
Emergency support - Books & stationery - Scholarships students/yr
Sets
Students/yr
53,461.00
4,009,575.00
1 IDR = 0.000106922 USD

Demand Matrix – Indonesia 17.03.2005
80
Country Project Name Indonesia
Agencies Source Document The Consultative Group on Indonesia, 19-20.01.2005: Indonesia, preliminary damage and loss assessment
Sector
Health Sector – Extent and Valuation of Damage and Losses
Damage Assessment Specific Needs Damage & Losses Time Frame / Deadlines
The tsunami resulted in the destruction of five hospitals (three public and two private, from a total of 17 public and 10 private hospitals). Nineteen health centres (of a total of 239) were destroyed; a further 11 health centres will require major renovation and two will require minor renovation. The losses were greatest in Kabupaten Aceh Jaya and Banda Aceh city.
Goods: Services: • Construction
Item
(Damaged &/or Lost)
Estimated Cost US$
Public hospitals 45,537,438.27 Public health centres
3,246,365.76
Public health sub-centres
3,480,524.94
Other public and admin
4,556,587.95
Private hospitals 20,568,050.53 Other private facilities
2,665,351.62
Public health programs
4,383,802.00
Replacement personnel
4,024,651.00
Facility cleanup 324,294.43 Additional health 574,812.67
Data Required
1 IDR = 0.000106922 USD

Demand Matrix – Indonesia 17.03.2005
81
Country Project Name Indonesia
Agencies Source Document The Consultative Group on Indonesia, 19-20.01.2005: Indonesia, preliminary damage and loss assessment
Sector
Religion and Culture Sector – Extent and Valuation of Damage and Losses
Damage Assessment Specific Needs Damage & Losses Time Frame / Deadlines
Many places of worships were severely affected by the earthquake and tsunamis. A preliminary estimation is done using information gathered from Podes and estimated proportion of damaged occurred in the affected areas provided by Minister of Home Affairs. Overall estimated amount needed for rebuilding places of worship in Aceh and North Sumatra is US million
Goods: Services: • Construction •
Item (Damaged &/or
Lost)
Estimated Cost US$
Mosques 30,557,131.46 Menunasah 34,882,660.97 Prayer Room 7,587,078.20 Protestant Church 7,219,159.60 Catholic Church 2,098,130.41 Confucius Temple 248,593.65 Temple 427,581.08
Data Required
1 IDR = 0.000106922 USD

Demand Matrix – Indonesia 17.03.2005
82
Country Project Name Indonesia
Agencies Source Document The Consultative Group on Indonesia, 19-20.01.2005: Indonesia, preliminary damage and loss assessment
Sector
Transportation Sector – Extent and Valuation of Damage and Losses
Damage Assessment Specific Needs Damage & Losses Time Frame / Deadlines
Roads Infrastructure • Of the six major roads in the affected area, it is
estimated that 316 kilometres or 19% of the road length was damaged and 46% of bridges, including about 120 bridges destroyed.
• The national coastal road to Meulaboh in the south has been destroyed over 80 kilometres or 30% of its length and 110 or 60% of the bridges.
• It is estimated that about 124 kilometers of urban roads, 1,150 kilometres of kabupaten roads and 340 kilometers of village roads were impacted, with a total damage cost of Rp. 343 billion.
Road traffic and transport infrastructure. • Based on the vehicles registered in the most affected
areas and relating damages to those of housing in the same areas, it is estimated that about 7.2% or 29,800 vehicles were destroyed or seriously damaged with a replacement value in the order of US$ 185 million, almost all privately owned.
• heavy damage to the bus terminals in Banda Aceh, Meulaboh, and Lhokseumawe, and moderate damage to those in Sigli, Langsa, Bireun, and Gunung Sitoli
Goods: • Vehicles • Motor Cycles • Light Trucks • Busses • Ferries • Weigh-Bridges • Vehicle testing
Stations • Traffic Lights • Road Signage • Navigation
Infrastructure Services: • Construction in;
o Roads o Bridges o Ports o Ferry Terminals o Airport
infrastructure
Item (Damaged &/or Lost)
Qty impacted
Estimated Cost US$
Roads • National &
Local Rds • Bridges
Km 1937437
185,509,670.00
Land Transport • Road
Vehicles • Bus
Terminals • Road
Safety Facilities
• Ferry Terminals
29,746
8
8
8
314,778,368.00
Data Required

Demand Matrix – Indonesia 17.03.2005
83
(North Sumatra). There has also been some damage to road safety infrastructure, including roadside weighbridges, vehicle testing stations, traffic lights, and road signage, etc. Perum Damri reports heavy damage to its Banda Aceh depot and to 52 buses. Banda Aceh’s UleUheue ferry terminal has been totally destroyed, while those in Meulaboh and Lamteng have suffered heavy damage. Six others, including Gunung Sitoli, have suffered light damage.
Ports and Shipping • DGSC reports heavy damage to nine public ports in
Aceh, principally those in Banda Aceh and along the west coast, and light damage to another five ports. There is also heavy damage to five public ports in North Sumatra. Damage is estimated at US$ 27.7 million. DGSC also reports significant damage to maritime navigation facilities in the same areas.
Civil Aviation • Preliminary surveys undertaken by DGAC personnel
indicate airport damage to be relatively light.
(runways, tarmacs, buildings)
Ports • Public Port
Infrastructure
• Navigation Facilities
19
9
27,692,798.00
Airports • Airport
Infrastructure
44,918,412.00
1 IDR = 0.000106922 USD
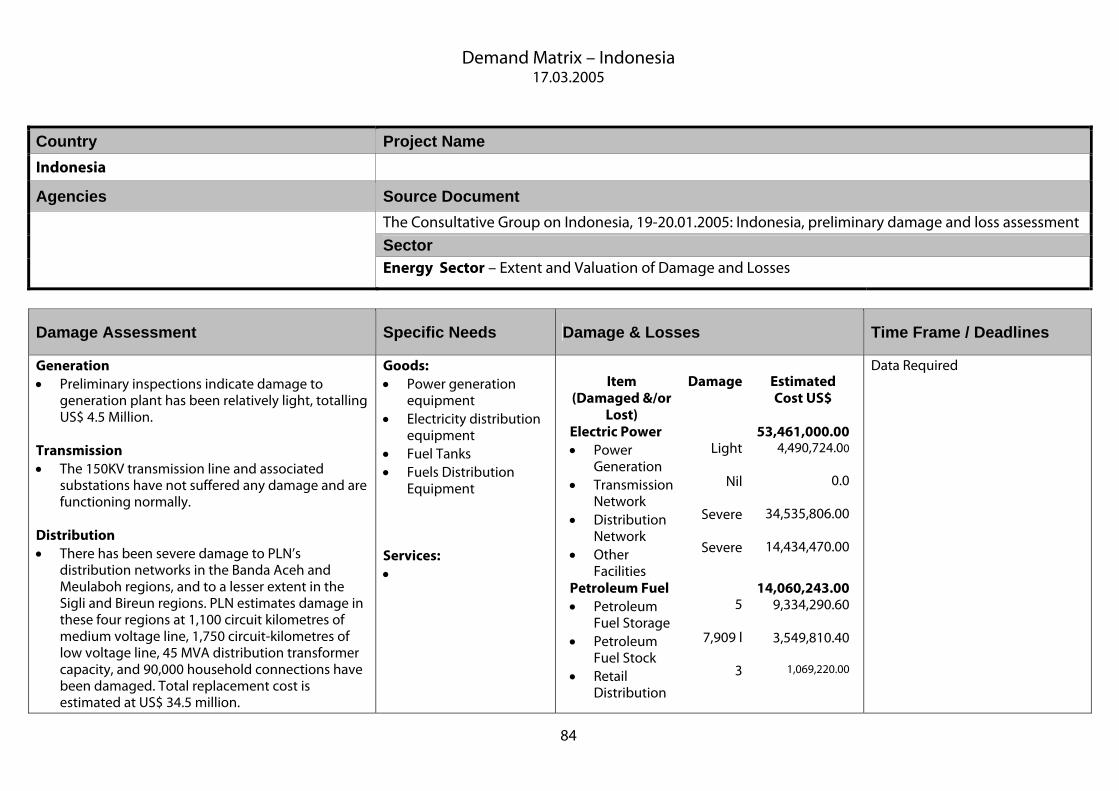
Demand Matrix – Indonesia 17.03.2005
84
Country Project Name Indonesia
Agencies Source Document The Consultative Group on Indonesia, 19-20.01.2005: Indonesia, preliminary damage and loss assessment
Sector
Energy Sector – Extent and Valuation of Damage and Losses
Damage Assessment Specific Needs Damage & Losses Time Frame / Deadlines
Generation • Preliminary inspections indicate damage to
generation plant has been relatively light, totalling US$ 4.5 Million.
Transmission • The 150KV transmission line and associated
substations have not suffered any damage and are functioning normally.
Distribution • There has been severe damage to PLN’s
distribution networks in the Banda Aceh and Meulaboh regions, and to a lesser extent in the Sigli and Bireun regions. PLN estimates damage in these four regions at 1,100 circuit kilometres of medium voltage line, 1,750 circuit-kilometres of low voltage line, 45 MVA distribution transformer capacity, and 90,000 household connections have been damaged. Total replacement cost is estimated at US$ 34.5 million.
Goods: • Power generation
equipment • Electricity distribution
equipment • Fuel Tanks • Fuels Distribution
Equipment Services: •
Item (Damaged &/or
Lost)
Damage Estimated Cost US$
Electric Power • Power
Generation • Transmission
Network • Distribution
Network • Other
Facilities
Light
Nil
Severe
Severe
53,461,000.00 4,490,724.00
0.0
34,535,806.00
14,434,470.00
Petroleum Fuel • Petroleum
Fuel Storage • Petroleum
Fuel Stock • Retail
Distribution
5
7,909 l
3
14,060,243.00 9,334,290.60
3,549,810.40
1,069,220.00
Data Required

Demand Matrix – Indonesia 17.03.2005
85
Public Fuel Supply • Pertamina reports heavy damage to its Kreung
Raya and Meulaboh depots, and lesser damage to its Lhokseumawe, Sitoli and Sabang depots. Damage to the Krueng Raya and Meulaboh caused rupture of tanks and resulted in fuel losses. Many SPBUs have been damaged but details are not yet available. Pertamina’s branch office in Banda Aceh has also suffered some damage. The replacement cost is estimated at Rp. 130 billion, including for lost fuel stock.
1 IDR = 0.000106922 USD

Demand Matrix – Indonesia 17.03.2005
86
Country Project Name Indonesia
Agencies Source Document The Consultative Group on Indonesia, 19-20.01.2005: Indonesia, preliminary damage and loss assessment
Sector
Communications Sector – Extent and Valuation of Damage and Losses
Damage Assessment Specific Needs Damage & Losses Time Frame / Deadlines
Communications & Postal Service • The tsunami caused significant damage to
Telkom’s fixed line network, and in particular the last mile of copper wire connection. There was also damage to exchanges, although repairs were made very quickly in many instances. Both Telkomsel and Indosat/Satelindo suffered damage to GSM base transceiver stations and associated facilities, most of which were reinstated quickly. However, MOC reported that all but eight of 111 lines provided to remote villages under the Universal Service Obligation (USO) scheme are damaged. Telkom and other operators were quick to mobilize VSAT and satellite communications equipment to support relief and recovery efforts. PT Pos reported damage to 27 post office buildings
Goods: • Telecommunication
equipment Services:
Item (Damaged &/or Lost)
Damage Estimated Cost US$
Telecommunications • USO Connections • Fixed Connections
111
98,860
20,710,791.40
Postal Services • Postal Facilities
940,913.60
Data Required
1 IDR = 0.000106922 USD

Demand Matrix – Indonesia 17.03.2005
87
Country Project Name Indonesia
Agencies Source Document The Consultative Group on Indonesia, 19-20.01.2005: Indonesia, preliminary damage and loss assessment
Sector
Water Supply & Sanitation Sector – Extent and Valuation of Damage and Losses
Damage Assessment Specific Needs Damage & Losses Time Frame / Deadlines
Damage to water supply and sanitation has been estimated to total US$ 25.5 million, comprising US$ 28.5 million (96%) for water supply and US$ 0.9 million (4%) for sanitation. For water supply, 63% of the damages were incurred by small-scale and private providers and the balance by the water supply enterprises.
Goods: • Water treatment
equipment • Water Tank Trucks • Water distribution
equipment • Water pumps Services: • Well digging services
Item (Damaged &/or
Lost)
Damage Estimated Cost US$
Water Supply • Water
Treatment Plant capacity
• Water tank Trucks
• Pipe Network • Small Tankers • Vendors • Dug Wells • Hand pumps
1495 L/s
108
895km70
57060,00015,000
28,590,942.80
Sanitation • Sludge
Treatment • Vacuum Truck
620
962,298.00
Data Required
1 IDR = 0.000106922 USD

Demand Matrix – Indonesia 17.03.2005
88
Country Project Name Indonesia
Agencies Source Document The Consultative Group on Indonesia, 19-20.01.2005: Indonesia, preliminary damage and loss assessment
Sector
Agriculture Sector – Extent and Valuation of Damage and Losses
Damage Assessment Specific Needs Damage & Losses Time Frame / Deadlines
Irrigation • All irrigation schemes which were in the coastal
areas were significantly affected by the tsunami. The total area affected by the tsunami is estimated at 28,000 ha (technical, semi-technical and simple irrigation systems).
Standing Crop • Based on the estimates provided by the Ministry of
Agriculture, crops on 21,000 ha of sawah and 29,000 ha of dry land were damaged. The immediate losses are estimated at 80,000 tons of unhusked rice and 160,000 tons of other crops.
Live Stock • It is estimated that 23,300 large ruminants, 21,000
small ruminants and about 2.5 million poultry birds were lost. The preliminary estimate of damages to animal husbandry are estimated at US$ 13.5 million.
Soil drainage, farm machinery and implements. • The soils that have received deposits of salt from
the tsunami must be leached and drained at an estimated cost of US$ 24.1 million. Replacement of farm machinery and farmers’ implements has an estimated cost of US$ 29.8 million
Goods: • Agricultural
equipment and machinery
• Domestic Livestock Services: • Soil remediation
services
Item
Estimated Cost US$
Million Lands permanently lost
40.1
Standing Crop Losses
21.9
Infrastructure Machinery
29.8
Future Crop Losses 118.1 Livestock 13.5
Data Required
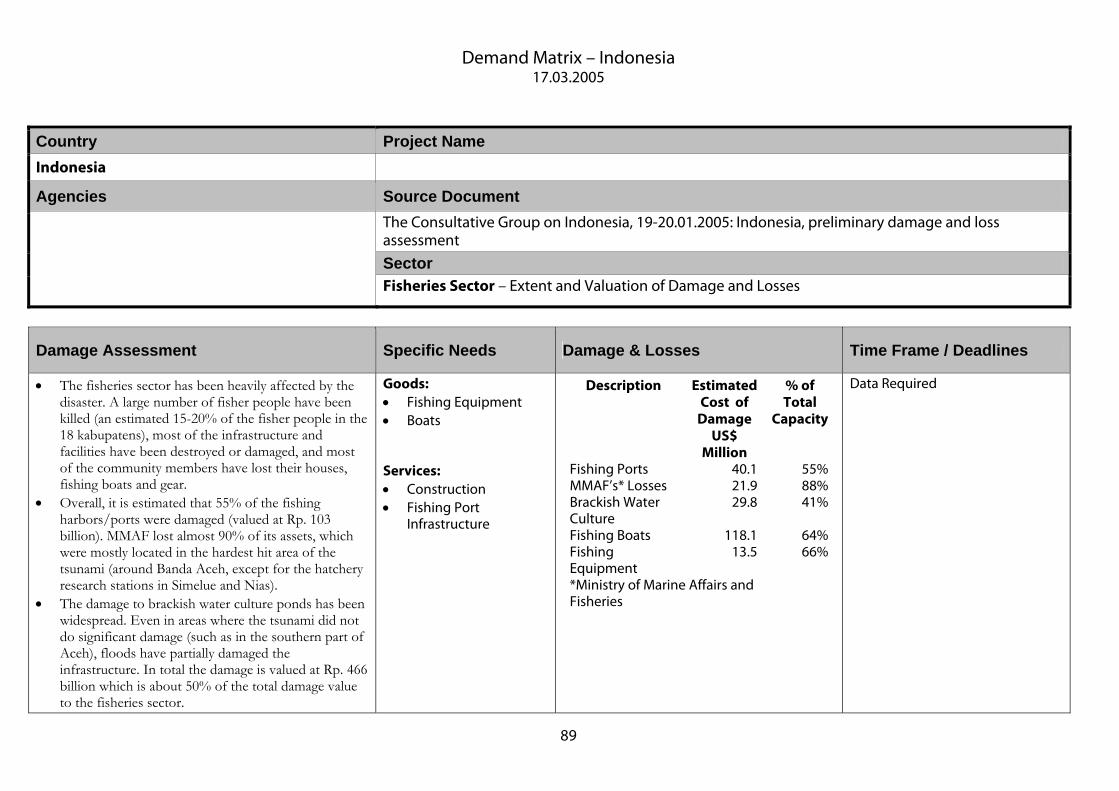
Demand Matrix – Indonesia 17.03.2005
89
Country Project Name Indonesia
Agencies Source Document The Consultative Group on Indonesia, 19-20.01.2005: Indonesia, preliminary damage and loss assessment
Sector
Fisheries Sector – Extent and Valuation of Damage and Losses
Damage Assessment Specific Needs Damage & Losses Time Frame / Deadlines
• The fisheries sector has been heavily affected by the disaster. A large number of fisher people have been killed (an estimated 15-20% of the fisher people in the 18 kabupatens), most of the infrastructure and facilities have been destroyed or damaged, and most of the community members have lost their houses, fishing boats and gear.
• Overall, it is estimated that 55% of the fishing harbors/ports were damaged (valued at Rp. 103 billion). MMAF lost almost 90% of its assets, which were mostly located in the hardest hit area of the tsunami (around Banda Aceh, except for the hatchery research stations in Simelue and Nias).
• The damage to brackish water culture ponds has been widespread. Even in areas where the tsunami did not do significant damage (such as in the southern part of Aceh), floods have partially damaged the infrastructure. In total the damage is valued at Rp. 466 billion which is about 50% of the total damage value to the fisheries sector.
Goods: • Fishing Equipment • Boats Services: • Construction • Fishing Port
Infrastructure
Description
Estimated
Cost of Damage
US$ Million
% of Total
Capacity
Fishing Ports 40.1 55%MMAF’s* Losses 21.9 88%Brackish Water Culture
29.8 41%
Fishing Boats 118.1 64%Fishing Equipment
13.5 66%
*Ministry of Marine Affairs and Fisheries
Data Required

Demand Matrix – Indonesia 17.03.2005
90
Country Project Name Indonesia
Agencies Source Document The Consultative Group on Indonesia, 19-20.01.2005: Indonesia, preliminary damage and loss assessment
Sector
Enterprise Sector – Extent and Valuation of Damage and Losses
Damage Assessment Specific Needs Damage & Losses Time Frame / Deadlines
Overall damages to large firms, medium to large-scale manufacturing enterprises, small and informal businesses and public markets amount to Rp. 2 trillion. Large enterprises. • With one notable exception, these facilities have
suffered relatively light damage. The exception is PT. Andalas which suffered severe damage.
Large and medium-scale manufacturing. • Overall for large and medium scale manufacturing the
damages are assessed to be around Rp. 44 billion (excluding the big companies discussed above), whilst the losses from reduced production are estimated at Rp. 169 billion.
Small-scale and unregistered businesses. • Assuming that each small informal business had
around Rp. 10 million in total assets and that all of this was destroyed – this amounts to a total damages figure of Rp. 800 billion. A rough estimate of economic losses can be obtained by multiplying the estimated number of businesses destroyed by the
Goods: Services:
Firms & Trading Facilities
Estimated Cost of
Damage* US$ Million
Largest Firms 62.1 Large Manufacturing Firms 22.8 Small Firms/MSME’s 111.8 Damage to Public Markets 17.6 Agro-based industry and commerce
256.0
*Both in terms of Assets and Revenue Flows
Data Required

Demand Matrix – Indonesia 17.03.2005
91
average number of workers in each business and the average wage – this yields an annual loss of Rp. 246 billion.
Public facilities for commerce and trade. • As a first approximation, the Ministry of Trade has
assumed that all of these markets have been destroyed. For the restoration phase the Ministry is intending to construct:
o 293 traditional markets in Aceh and North Sumatra as a total cost of approximately Rp.74 billion (Rp. 250 million per market),
o 18 wholesale markets in 18 regencies/cities in Aceh and North Sumatra. Each would cost Rp. 2 billion,
o 19 warehouses in Aceh and North Sumatra. Each would cost around Rp. 2.5 billion.
Agro-based Industries and Commerce. • On the basis of price differentials between retail,
wholesale and farmgate and at-dock values, a four-year loss in added value for these sectors was arrived at. This amounts to Rp. 2,394 billion.

Demand Matrix – Indonesia 17.03.2005
92
Country Project Name Indonesia
Agencies Source Document The Consultative Group on Indonesia, 19-20.01.2005: Indonesia, preliminary damage and loss assessment
Sector
Regional Governance Sector – Extent and Valuation of Damage and Losses
Damage Assessment Specific Needs Damage & Losses Time Frame / Deadlines
The disaster of December 26, aggravated the institutional, infrastructure and governance challenges, and generated numerous additional challenges. In public buildings, 21% of the public buildings and 19% of the equipment were destroyed, 21% of the personnel were severely affected, and 27% of the public records were destroyed. The replacement value of these damage and losses to the regional governance in the Province of Aceh is pre-liminarily estimated to be over $81 million.
Goods: • Office equipment &
machinery Services: • Construction
Category* Qty impacted
% Damage
Estimated Cost US$
Buildings 156 21% 33.1Equipment 208 19% 11.8Personnel 10,073 21% 4.3Record 27% 18.1Others 6.4Oversight 7.3*Includes Public Administration, Justice, Parliament and Police
Data Required
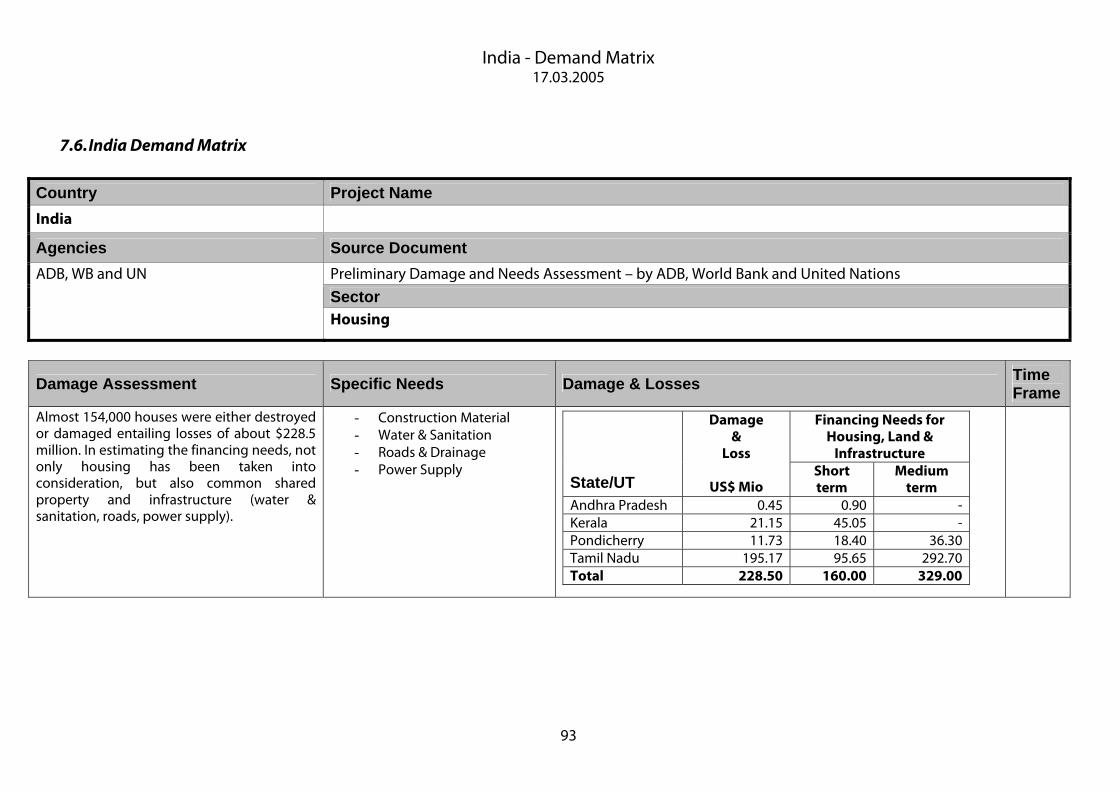
India - Demand Matrix 17.03.2005
93
7.6. India Demand Matrix
Country Project Name India
Agencies Source Document Preliminary Damage and Needs Assessment – by ADB, World Bank and United Nations
Sector
ADB, WB and UN
Housing
Damage Assessment Specific Needs Damage & Losses Time Frame
Almost 154,000 houses were either destroyed or damaged entailing losses of about $228.5 million. In estimating the financing needs, not only housing has been taken into consideration, but also common shared property and infrastructure (water & sanitation, roads, power supply).
- Construction Material - Water & Sanitation - Roads & Drainage - Power Supply
Financing Needs for
Housing, Land & Infrastructure
State/UT
Damage &
Loss
US$ Mio Short term
Medium term
Andhra Pradesh 0.45 0.90 -Kerala 21.15 45.05 -Pondicherry 11.73 18.40 36.30 Tamil Nadu 195.17 95.65 292.70 Total 228.50 160.00 329.00

India - Demand Matrix 17.03.2005
94
Country Project Name India
Agencies Source Document Preliminary Damage and Needs Assessment – by ADB, World Bank and United Nations
Sector
ADB, WB and UN
Health
Damage Assessment Specific Needs Damage & Losses Time Frame
Tamil Nadu: Three primary health centers (PHCs), 16 health sub-centers (HSCs) and the government district hospital in Nagapattinam were severely damaged. Other government facilities were also damaged to some extent. Kerala: Two PHCs and two HSCs were damaged in Kollam. No destruction of health infrastructure in Pondicherry or Andhra Pradesh.
Goods • drugs, equipment and patient amenities Services • Reconstruction/Renovation and refurbishing of
district and government hospitals, Primary Health Centers and Health Sub Centers;
• Provision of basic health care and psychosocial support
• Development of health sector disaster mitigation plan
• Improving communication facilities • Health system assessment • prevention of HIV/AIDS, malnutrition and anemia. • Control of vector and water borne diseases • Development of disease surveillance
Financing Needs
State/UT
Total Damages
& Losses
US$ Mio Short term
Medium term
Kerala 3.20 2.16 - Tamil Nadu 12.54 8.50 0.70 Total 15.74 10.66 0.70

India - Demand Matrix 17.03.2005
95
Country Project Name India
Agencies Source Document Preliminary Damage and Needs Assessment – by ADB, World Bank and United Nations
Sector
ADB, WB and UN
Agriculture & Livestock
Damage Assessment Specific Needs Needs Assessment Budget Time Frame
Damage to the agricultural sector is mainly confined to the destruction of standing crops. Intrusion of seawater has induced salinity and water logging and caused semi-permanent damage; effective crop growing won’t be possible for the next two to three years until seasonal rain flushes out the salt. Also, the loss of domestic livestock is large.
• Surveying affected agricultural lands to estimate the extent and grades of salinity/sodicity.
• ••Scraping and removing marine/mud sediments and sand deposited lands; establishing model reclamation fields; mobilizing saline tolerant seeds, planting materials and green manure crop; introducing bacterial strains like Rhizobia, Azozpirillum, Pseudomonas and Phosphobacterium which have the property of nitrogen fixation and phosphate mobilization.
• ••Reviving horticultural crops with and without soil amelioration.
• ••Restoring affected pasture lands, farm ponds and dug wells.
• ••Estimating water quality of all sources and identifying the pockets where ground water can still be tapped.
Needs Assessment for Agriculture and Livestock (Rs.
Crore)
Activity Tamil Nadu
Pondi-cherry
Andhra Pradesh Kerala Total
Replacement cost to crop and live stock losses
21.70
2.66
0.94 8.12
33.42
Rehabilitation of soil resources
35.32
1.38
1.44 16.24
54.38
Strengthening marketing and support services
4.13
0.60
0.08 1.61
6.42
Total (Rs. Crore)
61.15
4.64
2.46 25.97
94.22
Total (US$ Mio)
14.06
1.07
0.57 5.97
21.66

India - Demand Matrix 17.03.2005
96
• Providing fodder for animals and arranging vaccination for livestock.
• ••Re-establishment of home gardens with salt tolerant vegetables.
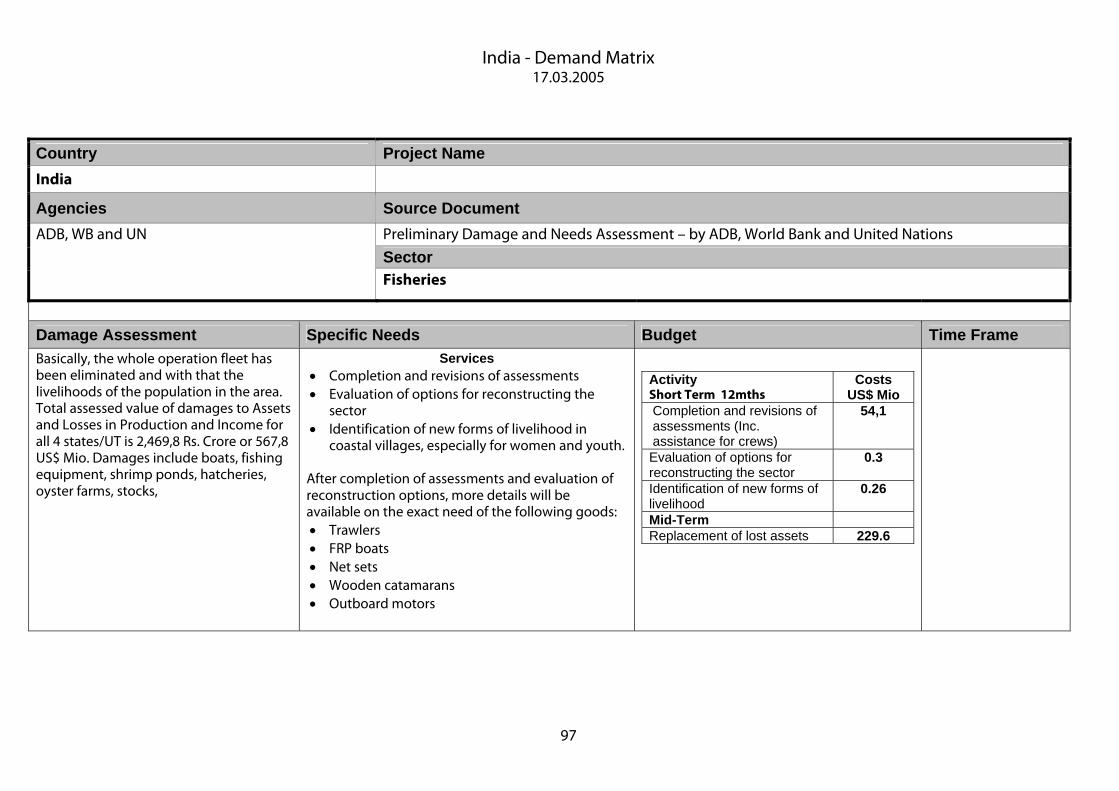
India - Demand Matrix 17.03.2005
97
Country Project Name India
Agencies Source Document Preliminary Damage and Needs Assessment – by ADB, World Bank and United Nations
Sector
ADB, WB and UN
Fisheries
Damage Assessment Specific Needs Budget Time Frame Basically, the whole operation fleet has been eliminated and with that the livelihoods of the population in the area. Total assessed value of damages to Assets and Losses in Production and Income for all 4 states/UT is 2,469,8 Rs. Crore or 567,8 US$ Mio. Damages include boats, fishing equipment, shrimp ponds, hatcheries, oyster farms, stocks,
Services • Completion and revisions of assessments • Evaluation of options for reconstructing the
sector • Identification of new forms of livelihood in
coastal villages, especially for women and youth. After completion of assessments and evaluation of reconstruction options, more details will be available on the exact need of the following goods: • Trawlers • FRP boats • Net sets • Wooden catamarans • Outboard motors
Activity Short Term 12mths
Costs US$ Mio
Completion and revisions of assessments (Inc. assistance for crews)
54,1
Evaluation of options for reconstructing the sector
0.3
Identification of new forms of livelihood
0.26
Mid-Term Replacement of lost assets 229.6
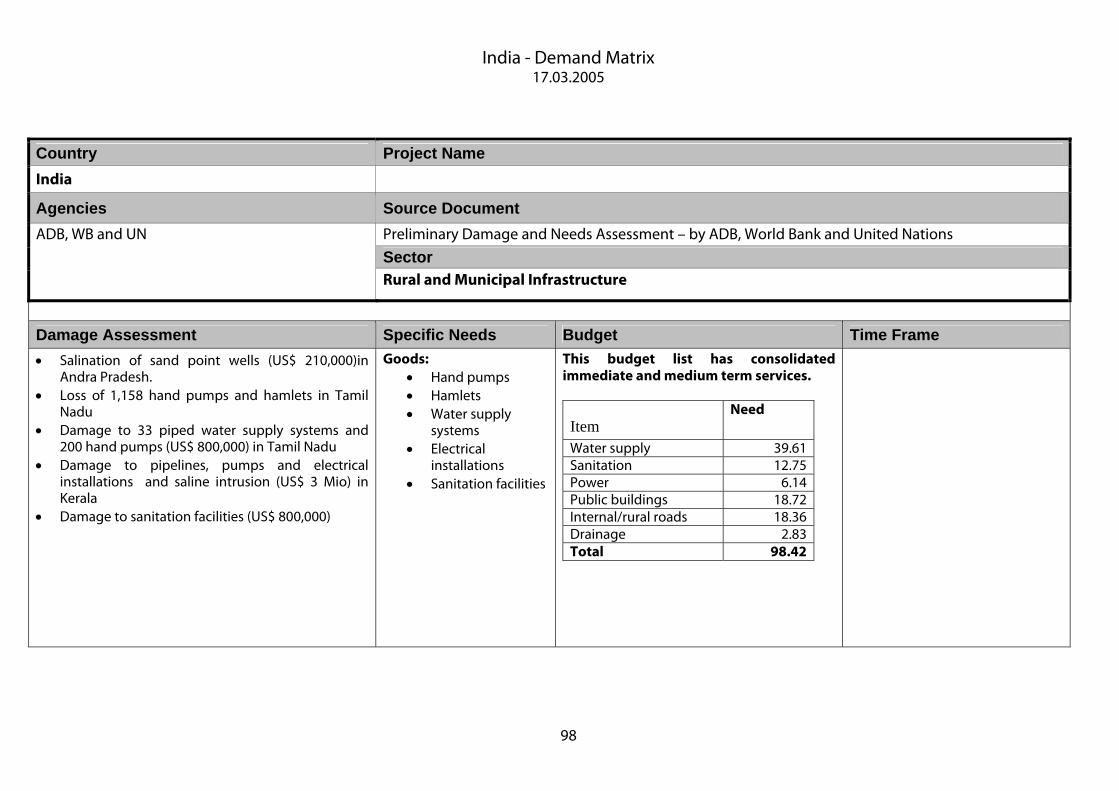
India - Demand Matrix 17.03.2005
98
Country Project Name India
Agencies Source Document Preliminary Damage and Needs Assessment – by ADB, World Bank and United Nations
Sector
ADB, WB and UN
Rural and Municipal Infrastructure
Damage Assessment Specific Needs Budget Time Frame • Salination of sand point wells (US$ 210,000)in
Andra Pradesh. • Loss of 1,158 hand pumps and hamlets in Tamil
Nadu • Damage to 33 piped water supply systems and
200 hand pumps (US$ 800,000) in Tamil Nadu • Damage to pipelines, pumps and electrical
installations and saline intrusion (US$ 3 Mio) in Kerala
• Damage to sanitation facilities (US$ 800,000)
Goods: • Hand pumps • Hamlets • Water supply
systems • Electrical
installations • Sanitation facilities
This budget list has consolidated immediate and medium term services.
Item Need
Water supply 39.61Sanitation 12.75Power 6.14Public buildings 18.72Internal/rural roads 18.36Drainage 2.83Total 98.42

India - Demand Matrix 17.03.2005
99
Country Project Name India
Agencies Source Document Preliminary Damage and Needs Assessment – by ADB, World Bank and United Nations
Sector
ADB, WB and UN
Transport
Damage Assessment Specific Needs Budget Time Frame
Road Subsector: In the districts of Nagapattinam, Kanniyakumari and Cuddalore of Tamil Nadu, and Pondicherry, more than 80 km of ODR and MDR, located within 800 m of the coastline, were seriously damaged. Ports and Fishing Harbors The restoration cost for each port was estimated based on market unit rates for reconstructing breakwaters, wharfs and buildings, dredging, and procurement of a dredger etc.
Services • Protective works for ports and fishing
harbours • Breakwaters and dredging • Reconstruction of roads, bridges • Reconstruction of ports and fishing
harbours • Studies & Consulting services
short term
medium term
Roads & Bridges Road reconstruction 13.45 3.79 Bridges reconstruction 3.96 9.39 studies and consulting 0.69 2.30
Ports and fishing harbours Ports reconstruction 17.23 6.00
Fishing Harbour reconstruction 4.53 3.87 Studies and consulting 1.61 2.30 Total 41.47 27.65

India - Demand Matrix 17.03.2005
100
Country Project Name India
Agencies Source Document Preliminary Damage and Needs Assessment – by ADB, World Bank and United Nations
Sector
ADB, WB and UN
Coastal Protection
Project Activities Specific Needs Budget Time Frame
Damage to coastal protection structures was limited. The total estimated cost of damage is Rs. 186 crore, or US$ 42.8million. The immediate focus should be on restoration of damaged infrastructure for protection against coastal hazards such as cyclones and subsequent storm surges and river floods. The aim of the reconstruction and recovery strategy is to strengthen coastal protection infrastructure in order to permanently reduce future damage and loss of life from sea-based hazards. In planning coastal protection measures, it is important to consider the land use of the coastal area concerned, as well as the status of coastal erosion. The coastal zone can be divided into three categories: (i) port and city area; (ii) fishery village or fishery and agricultural usage area and (iii) little human activity (as a village relocation or environmental preservation). Each category may require different measures.
Services • Widening and strengthening of banks
of rivers and drains • Restoration of seawalls • Equipment restoration • Study & survey services
42,8 Mio

India - Demand Matrix 17.03.2005
101
Country Project Name India
Agencies Source Document Preliminary Damage and Needs Assessment – by ADB, World Bank and United Nations
Sector
ADB, WB and UN
Hazard Risk Management
Needs & Budget Time Frame Components/ Projects Costs (US$)
Short term Multi-hazard risk assessment in the affected areas in the coastal areas with priority on affected talukas 2.15 Preparation of sectoral risk reduction guidelines (technical guidelines, suggested techno-legal arrangements, process guidance) 0.8 Community based reconstruction planning 2.22 Information, communication and public awareness 1.9 Mechanisms for dissemination of Early Warning Systems in the coastal districts 1 Sub Total 8.07
Medium term Multi-hazard risk assessment in unaffected but vulnerable Areas 1.6 Capacity Building at the village, block and district levels for Early Warning Systems in the coastal districts 0.8 Community based disaster risk management programs 2.25 Disaster risk information systems 2.25
Studies/ pilots on state specific studies on risk transfer mechanisms 2.25 Sub Total 9.15 TOTAL 17.22

102
8. Funding
This section strives to give a brief overview of the funding situation for the recovery and reconstruction phase of the Tsunami disaster. It must be noted that it is very difficult to keep up with the constant developments of the donor funding in a document. However the following provides an update of the situation as of mid-March.
Firstly an update on the response to the Flash appeal is presented. This is then followed with a more detailed look at funding from major donors, in terms of amounts and what the funds are to be used for, as far as this information is available.
8.1. Flash Appeal Most of the resources initially earmarked to the UN Flash Appeal from the humanitarian budgets of donor governments - $863 million in total - have been allocated to specific NGOs or UN agencies. UNDP has been the third largest recipient within the UN of such resources with a total pledged to date of almost $100 million, this may increase to a total of about $120 million under this first phase of the operation, representing close to 70% of the requirements identified in the Flash Appeal. Never before had the UN/UNDP benefited of such generosity under a humanitarian appeal.
Funding decisions during the recovery and reconstruction phase will be primarily made by donor governments at the country level. The following table21 analyses donor pledges based on the information available to us to date.
For each significant donor:
• The second column (Total pledge) indicates how much the donor has pledged in total to the overall Tsunami effort, whether it is for the relief phase or the reconstruction phase, and whether it will be channelled bilaterally or through multilateral institutions such as the UN. This total is then divided into three sub-components.
• The third column (To Flash Appeal) indicates how much of this total has been pledged to the UN Flash Appeal – most Flash Appeal pledges have been allocated to specific NGOs or UN agencies; however, when this is not the case, the unallocated part of the pledge is shown in column 4.
• The fifth column (Outside Flash Appeal - committed) represents those pledges made outside the Flash Appeal which have either been already used/allocated (for in kind relief aid for instance), or which will be channelled bilaterally (as in the case of the Australian pledge to Indonesia).
• Finally, the sixth column (Outside Flash Appeal - uncommitted) represents those pledges made outside the Flash Appeal and for which no decision has yet been made as far as we know.
• The table also indicates when donors have publicly expressed an interest or a preference for specific recipient countries. Information on donors’ particular priorities, however, is more likely to be available at the local level and we encourage you to consult with the local embassies of the donors concerned.
21 http://content.undp.org/go/tsunamirelief/Tsunami-Files/download/Total+Tsunami+pledges.xls?d_id=213956&g11n.enc=ISO-8859-1

Table 7: Funding Pledges & Contribution as at 13.03.2005
103
Donor Total pledge
To Flash Appeal
o/w unallocate
d
Outside Flash
Appeal comm..,
incl. Bilateral
Outside Flash
Appeal uncomm.
Detailed information Donor Expressions of interest / priorities
1 + 2 + 3 1 2 3 INS SRL MAL SEY THA IND
OECD/DAC DONORS
US $950 mio $34 mio $0 mio $67 mio $850 mio Total pledge = $350 from January + $600 additional request in Feb. Of the $850 mio uncommitted, $250 mio is for relief activities and $339 mio for large-scale infrastructure projects, such as the reconstruction of highways in Indonesia, $168 mio for smaller-scale infrastructure projects such as building schools, health clinics, water distribution systems, housing and livelihood programs, $62 mio for technical assistance for capacity building, and $35 mio to create early warning systems
Germany $665 mio $68 mio $0 mio $17 mio $579 mio €500 mio EC/ECHO $645 mio $94 mio $63 mio $4 mio $547 mio €450 mio o/w €100 mio for relief aid through ECHO and €350
mn for l.t rehabilitation and reconstruction (€240 mio for Indonesia, €80 mio for SL and €30 mio for others) + €1 bn credit
x x x x x x
Japan $500 mio $228 mio $0 mio $34 mio $239 mio The l.t. commitment of $239 mio will be disbursed bilaterally to Indonesia ($142 mio), Sri Lanka ($78 mio) and the Maldives ($19 mio)
x x x
France $443 mio $17 mio $0 mio $43 mio $383 mio €300 mio for reconstruction Australia $431 mio $18 mio $0 mio $413 mio $0 mio Aus$60 mio initially pledged for Indonesia, Sri Lanka and
Maldives + Aus$500 mio ($387 mio) in grants and Aus$500 mio in loans over 5 years for Indonesia (all bilateral)
x

Table 7: Funding Pledges & Contribution as at 13.03.2005
104
Donor Total pledge
To Flash Appeal
o/w unallocate
d
Outside Flash
Appeal comm..,
incl. Bilateral
Outside Flash
Appeal uncomm.
Detailed information Donor Expressions of interest / priorities
1 + 2 + 3 1 2 3 INS SRL MAL SEY THA IND Canada $351 mio $30 mio $0 mio $132 mio $189 mio Can$ 425 mio over 5 years o/w Can$265 mio for relief and
recovery (o/w Can$36 mio through CIDA to the Flash Appeal) and Can$160 mio for l.t. recovery. The uncommitted US$189 mio includes US$57 mio for relief over 5 years and US$131 mio for reconstruction ovre 5 years. Canada has assumed the chair of the Bilateral Donors' Group, which was established to coordinate the delivery of international assistance in Sri Lanka.
Netherlands $266 mio $26 mio $0 mio $9 mio $233 mio €20 mn pledged initially (€13 mn for Indonesia, €7 mn for Sri Lanka) + an additional €200 mn over 5 years (75% for Indonesia, 25% for Sri Lanka)
x x
Norway $172 mio $65 mio $0 mio $9 mio $96 mio NOK 1 bn ($170 mn) pledged for humanitarian relief, reconstruction and development, o/w NOK 400 mn ($65 mn) to the UN Flash Appeal. Receiving UN Agencies for projects in INS: FAO NOK 6.5 mio ($1 mio), WHO NOK 9.5 mio ($1.5mio), UNDP NOK 20 mio ($3.1 mio), UNEP NOK 2 mio ($0.3mio). Receiving UN Agencies for projects in SRL: FAO NOK 19mio ($3mio), UNDP NOK 27.5mio (4.3mio), WHO NOK 13mio ($2mio).
x x
UK $140 mio $75 mio $19 mio $35 mio $30 mio Of the $75 mio pledged against the Flash Appeal, GBP10 mio will go un-earmarked to OCHA for allocation
Italy $113 mio $22 mio $0 mio $92 mio Of the overal $100 mio + pledge, $46 mio will be for Sri Lanka x x
Denmark $77 mio $21 mio $8 mio $23 mio $34 mio The assistance from Denmark for recovery includes: DKK 50 million ($9 mio) to Sri Lanka which has already been committed. DKK 50 million to Indonesia - also committed and finally 100 million for environmental assistance in Aceh which has not yet been fully committed. In addition, the MFA has also allocated DKK 20 million for environmental assistance in Thailand.
x

Table 7: Funding Pledges & Contribution as at 13.03.2005
105
Donor Total pledge
To Flash Appeal
o/w unallocate
d
Outside Flash
Appeal comm..,
incl. Bilateral
Outside Flash
Appeal uncomm.
Detailed information Donor Expressions of interest / priorities
1 + 2 + 3 1 2 3 INS SRL MAL SEY THA IND Sweden $75 mio $23 mio $8 mio $9 mio $43 mio SEK 500 mn o/w SEK 80 mn already disbursed (NGOs,
OCHA, WFP, UNICEF), SEK 150 mn committed against Flash Appeal and SEK 270 mn yet to be allocated
Spain $70 mio $70 mio € 6 mn in emergency aid o/w 4 from central govt and 2 from local and regional gvts + € 50 mn for long-term reconstruction credits
Austria $69 mio $1 mio $68 mio € 50 mn over 3 years o/w € 2.1 mn for co-financing Finland $69 mio $13 mio $5 mio $15 mio $41 mio €20 mn for relief aid + €30 mn over 3 years for reconstruction
in Indonesia and Sri Lanka x x
Switzerland $55 mio $5 mio $0 mio $26 mio $20 mio For relief aid NZ $45 mio $14 mio $0 mio $17 mio $14 mio NZ$ 10 mio (US$ 7 mio) initially + NZ$58 mio, o/w NZ$20 mio
for UN, NZ$20 mio (US$14 mio) bilateral to Indonesia over 5 years
x
Belgium $38 mio $0 mio $0 mio $19 mio $19 mio € 30 mn o/w €15 mn for humanitarian aid (UNICEF, FAO, NGOs, in kind) and €15 mn for reconstruction
Ireland $14 mio $5 mio $0 mio $8 mio Greece $13 mio $13 mio $0 mio $13 mio x Portugal $10 mio $3 mio $0 mio $7 mio €8 mn Luxembourg $7 mio $4 mio $0 mio $1 mio $2 mio For relief aid OTHER DONORS (over $1
mn)
Saudi Arabia $163 mio $1 mio $0 mio $163 mio Includes public donations worth $101 mn Kuweit $100 mio $70 mio $30 mio $100 mn o/w $30 mn in cash and $70 mn through bilateral
projects
China $64 mio $20 mio $15 mio $44 mio Korea $55 mio $5 mio $4 mio $5 mio $45 mio Over three years

Table 7: Funding Pledges & Contribution as at 13.03.2005
106
Donor Total pledge
To Flash Appeal
o/w unallocate
d
Outside Flash
Appeal comm..,
incl. Bilateral
Outside Flash
Appeal uncomm.
Detailed information Donor Expressions of interest / priorities
1 + 2 + 3 1 2 3 INS SRL MAL SEY THA IND Singapore $40 mio Qatar $25 mio $3 mio $0 mio $22 mio UAE $20 mio $20 mn x Algeria $2 mio $2 mio $2 mio Mexico $2 mio $2 mio $0 mio Brunei $4 mio $4 mio x Russia $22 mio $0 mio Trinidad $2 mio $2 mio
IFIs
ADB $676 mn for immediate assistance IsDB $500 mn in loans o/w $10 mn for emergency relief World Bank $300 million in initial financial support to Indonesia, $100
million to Sri Lanka, and $12 million to the Maldives + up to $1 bn subsequently
Total $5,800 mio $863 mio $130 mio $1,368 mio
$3,462 mio

107
8.2. Australian relief packages22 The Minister for Foreign Affairs, Mr. Downer, made the first of three Australian Government aid announcements on 27 December, announcing an initial contribution of $10 million. A subsequent $25 million in relief aid was announced on 29 December, and another $25 million on 31 December 2004. The funding allocated for direct relief includes assistance for Indonesia, Sri Lanka, the Maldives, Seychelles and for Australian non government organisations (NGOs) and to support the relief work in other countries. As well, there is provision for the deployment of Australian technical and coordination specialist personnel. In support of the United Nations (UN) response to the Asian tsunami, $25 million of the initial contribution of $60 million was allocated to UN agencies. The following tables 8 & 9 outline the allocation of Australia's initial contribution of $60 million by target country or group: Table 8: Allocation of Australia's initial contribution
Indonesia - $33 million
Amount Purpose
$12.5 million Health and water sanitation
$8.25 million Coordination and support services
$7 million Food and non-food items
$5.25 million Shelter
Sri Lanka and the Maldives - $14.25 million
Amount Purpose
$4 million Food and non-food items
$4 million Education
$2.5 million Health and water sanitation
$2.25 million Environment
$1 million Shelter
$0.5 million Coordination and support services
Australian Non Government Organisations - $12 million This includes contributions to the Australian Red Cross and the International Federation of Red Cross and Red Crescent Societies.
22 AUSAID at http://www.ausaid.gov.au/hottopics/tsunami/relief.cfm
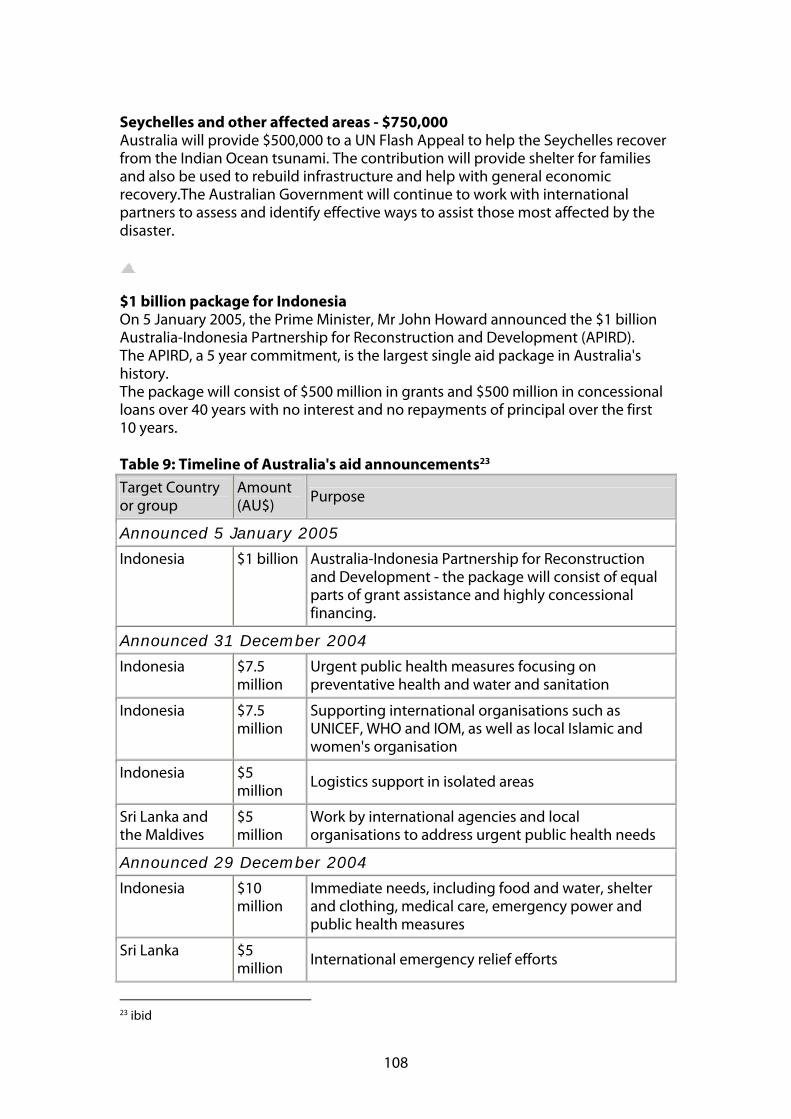
108
Seychelles and other affected areas - $750,000 Australia will provide $500,000 to a UN Flash Appeal to help the Seychelles recover from the Indian Ocean tsunami. The contribution will provide shelter for families and also be used to rebuild infrastructure and help with general economic recovery.The Australian Government will continue to work with international partners to assess and identify effective ways to assist those most affected by the disaster.
$1 billion package for Indonesia On 5 January 2005, the Prime Minister, Mr John Howard announced the $1 billion Australia-Indonesia Partnership for Reconstruction and Development (APIRD). The APIRD, a 5 year commitment, is the largest single aid package in Australia's history. The package will consist of $500 million in grants and $500 million in concessional loans over 40 years with no interest and no repayments of principal over the first 10 years. Table 9: Timeline of Australia's aid announcements23
Target Country or group
Amount (AU$)
Purpose
Announced 5 January 2005
Indonesia $1 billion Australia-Indonesia Partnership for Reconstruction and Development - the package will consist of equal parts of grant assistance and highly concessional financing.
Announced 31 December 2004
Indonesia $7.5 million
Urgent public health measures focusing on preventative health and water and sanitation
Indonesia $7.5 million
Supporting international organisations such as UNICEF, WHO and IOM, as well as local Islamic and women's organisation
Indonesia $5 million
Logistics support in isolated areas
Sri Lanka and the Maldives
$5 million
Work by international agencies and local organisations to address urgent public health needs
Announced 29 December 2004
Indonesia $10 million
Immediate needs, including food and water, shelter and clothing, medical care, emergency power and public health measures
Sri Lanka $5 million International emergency relief efforts
23 ibid
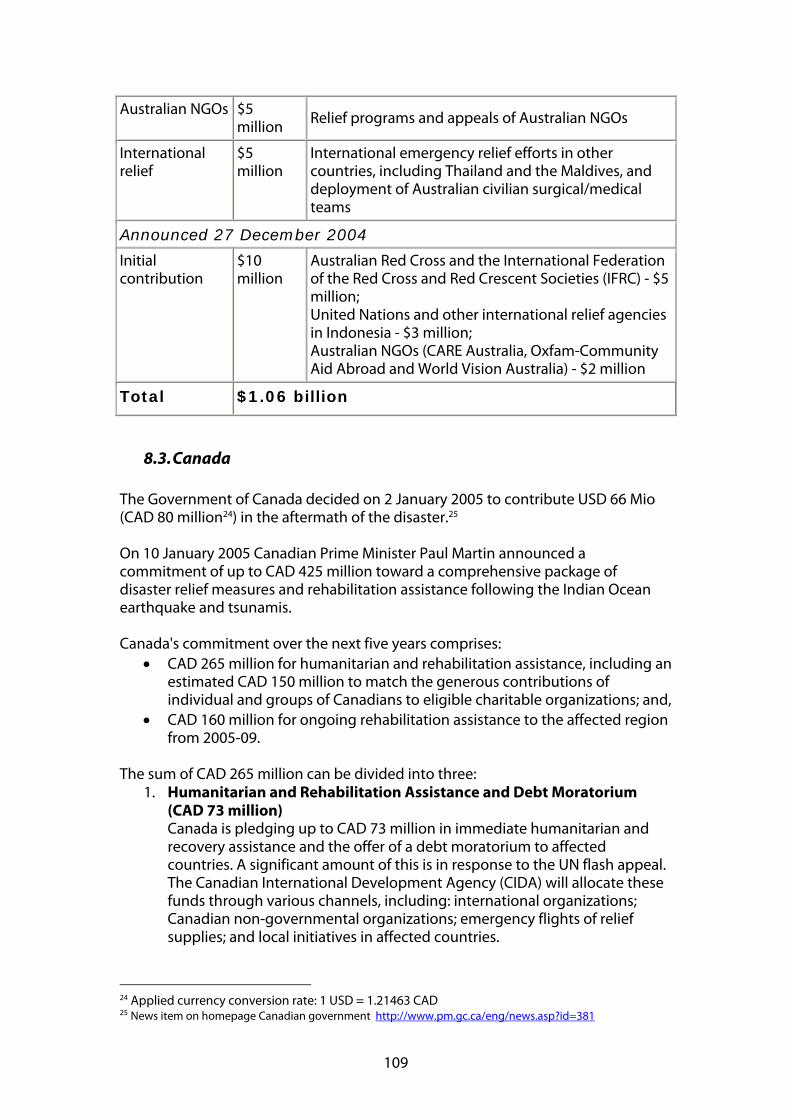
109
Australian NGOs $5 million Relief programs and appeals of Australian NGOs
International relief
$5 million
International emergency relief efforts in other countries, including Thailand and the Maldives, and deployment of Australian civilian surgical/medical teams
Announced 27 December 2004
Initial contribution
$10 million
Australian Red Cross and the International Federation of the Red Cross and Red Crescent Societies (IFRC) - $5 million; United Nations and other international relief agencies in Indonesia - $3 million; Australian NGOs (CARE Australia, Oxfam-Community Aid Abroad and World Vision Australia) - $2 million
Total $1.06 billion
8.3. Canada The Government of Canada decided on 2 January 2005 to contribute USD 66 Mio (CAD 80 million24) in the aftermath of the disaster.25 On 10 January 2005 Canadian Prime Minister Paul Martin announced a commitment of up to CAD 425 million toward a comprehensive package of disaster relief measures and rehabilitation assistance following the Indian Ocean earthquake and tsunamis. Canada's commitment over the next five years comprises:
• CAD 265 million for humanitarian and rehabilitation assistance, including an estimated CAD 150 million to match the generous contributions of individual and groups of Canadians to eligible charitable organizations; and,
• CAD 160 million for ongoing rehabilitation assistance to the affected region from 2005-09.
The sum of CAD 265 million can be divided into three:
1. Humanitarian and Rehabilitation Assistance and Debt Moratorium (CAD 73 million) Canada is pledging up to CAD 73 million in immediate humanitarian and recovery assistance and the offer of a debt moratorium to affected countries. A significant amount of this is in response to the UN flash appeal. The Canadian International Development Agency (CIDA) will allocate these funds through various channels, including: international organizations; Canadian non-governmental organizations; emergency flights of relief supplies; and local initiatives in affected countries.
24 Applied currency conversion rate: 1 USD = 1.21463 CAD 25 News item on homepage Canadian government http://www.pm.gc.ca/eng/news.asp?id=381

110
2. Matching of Individual Contributions (as much as $150 million by January 11) Donations of individuals and groups are being matched dollar-for-dollar by the government and will be matched to eligible Canadian non-governmental organizations (NGOs) already involved in relief efforts on the ground.
3. Incremental Operational Costs ($42 million)
These funds are allocated to fund the operational costs of Canadian individuals deployed in the region by the government, like members of the Disaster Assistance Response Team (DART), government personnel, and forensic experts and so on.
Ongoing reconstruction assistance Ongoing reconstruction assistance from CIDA will amount to USD 160 million between 2005 and 2009. Given the scale of existing needs in the aftermath of the disaster, the Government of Canada will carefully coordinate its response to longer-term rehabilitation and reconstruction in the most-affected countries of Sri Lanka and Indonesia. Support will be country specific and driven by the needs and priorities identified by the countries themselves. Drawing on its extensive experience in social and economic development, Canada will support small entrepreneurs and work with local authorities in re-building small-scale infrastructure and rehabilitating and strengthening systems to provide basic social services.
8.4. Denmark The Danish government momentarily has allocated USD 73 million (DKK 420 Mio) 26 in funding for the tsunami-struck region27. Of this sum, a total of USD 34,8 million (DKK 200 Mio) has been committed to emergency relief efforts and a total of USD 17,4 million (DKK 100 Mio) has been allocated to reconstruction activities. The remaining USD 20,9 million (DKK 120 Mio) has been allocated for assistance in dealing with environmental damage, for instance the destruction of coastal zones and water resources. The Danish support is primarily targeted at Sri Lanka and Indonesia, the countries that were hit the hardest. It focuses on providing support to the provision of clean drinking water, which poses one of the biggest problems right now. The support is given through three channels, namely through Danish aid organisations, UN agencies and through the Danish Emergency Management Agency that can provide competence and experience with efforts in crisis areas. The USD 17,4 million assigned to reconstruction will initially be divided equally between Sri Lanka and Indonesia. The exact structure of the reconstruction efforts will be determined after an assessment of needs and will be based on the preferences of both countries.
26 Applied currency conversion rate: 1 USD = 5.75504 DKK 27 http://www.um.dk/da/menu/Udviklingspolitik/Aktuelt/FokusPaa/Flodboelgen/DanskBistand/

111
Of the USD 20,9 million allocated for environmental assistance, USD 15,7 million is assigned to Indonesia and USD 5,2 million is assigned to Thailand. Table 11 provides an overview of the Danish funding for emergency relief. Table 11 Overview of Danish funding for emergency relief
Sri Lanka USD Mio
DKK Mio
Danish Red Cross 1.39 8 Evangelical Lutheran Church Emergency Relief 1.39 8 Danish Refugee Council 1.04 6 Danida centre in Colombo 0.87 5 Red Barnet 0.87 5 Small NGO's and Danish Bilharziasis Laboratory (DBL) 0.87 5 Danish Emergency Management Agency, water cleaning and drugs 2.43 14 UNHCR 1.74 10 Indonesia ADRA-Denmark 0.87 5 Danish Red Cross 2.09 12 Danish Emergency Management Agency (mobile hospital) 5.56 32 International Red Cross Committee (ICRC) 1.74 10 WHO 2.26 13 Donation from embassy in Jakarta 0.10 0.6 India Donation from embassy i New Delhi 0.10 0.6 Regional UNICEF 4.34 25 World Food Program 4.34 25 Office for Coordination of Humanitarian Aid (OCHA) 0.87 5 Ministry of Defence (airplane transport) 1.39 8.0 Other expenses 0.49 2.8 Total 34.75 200 Funds per category Danish NGO's 8.51 49 Ministry of Defence / Danish Emergency Management Agency 9.38 54 UN and ICRC 15.29 88 Danida 1.56 9 Total 34.75 200 Geographical division Indonesia 12.62 72.6 Sri Lanka 10.70 61.6 Regional + other expenses 11.43 65.8 Total 34.75 200

112
8.5. Germany Three months following the tsunami disaster in the Indian Ocean, the German government has committed itself to long-term aid in the region. But it will closely follow the funds’ implementation. The German government is shifting gears in its support for areas devastated by the December tsunami. Development Minister Heidemarie Wieczorek-Zeul said Germany’s initial acute emergency aid would now increasingly go into reconstruction efforts. These efforts will focus on Sri Lanka and Indonesia. Germany has provided 84.6 million euros (USD 110.2 million) in emergency aid so far. In the next three to five years, a further 500 million euros will follow. The focus will in particular be on health care, education, vocational training, house building, as well as the reconstruction of local government and economy. In Indonesia, Germany will help mainly with reconstruction efforts, while in Sri Lanka, the focus will be on re-establishing basic infrastructure. The German government ties certain conditions to the aid: Corruption must be prevented, weaker groups in the population like children, women and older people are not to be disadvantaged and sustainable development has to be realized.” The minister stressed that the funds would be allocated to individual projects. 28
Tsunami early warning system
Eleven weeks after deadly tsunamis swept through southern Asia, Germany has officially signed a pact with Indonesia to set up a tsunami early warning system. The agreement was signed Monday by Germany's Federal Minister for Education and Research Edelgard Bulmahn and her Indonesian counterpart Kusamayanto Kadiman in the capital Jakarta. The system will use newly developed buoys and sensors placed on the seafloor to record wave movements, with data transmitted to research centres, which would then issue necessary warnings. The first buoys are to be placed along Indonesia's coast in October. The system is expected to cost around 60 million dollars. According to Bulmahn, other affected countries in the region have also expressed an interest in cooperating with Germany on their early warning systems. German Foreign Minister Joschka Fischer offered to provide the technology to governments of tsunami-affected countries during his visits to the region in January. 29
28 News item on homepage German Federal Foreign Office, 24 February 2005 http://www.auswaertiges-amt.de/www/en/willkommen/deutschlandinfo/nachrichten_dtl/nachrichten_archiv_html?wb=1 29 News item on homepage German Federal Foreign Office, 14 February 2005 http://www.auswaertiges-amt.de/www/en/willkommen/deutschlandinfo/nachrichten_dtl/nachrichten_archiv_html?wb=2
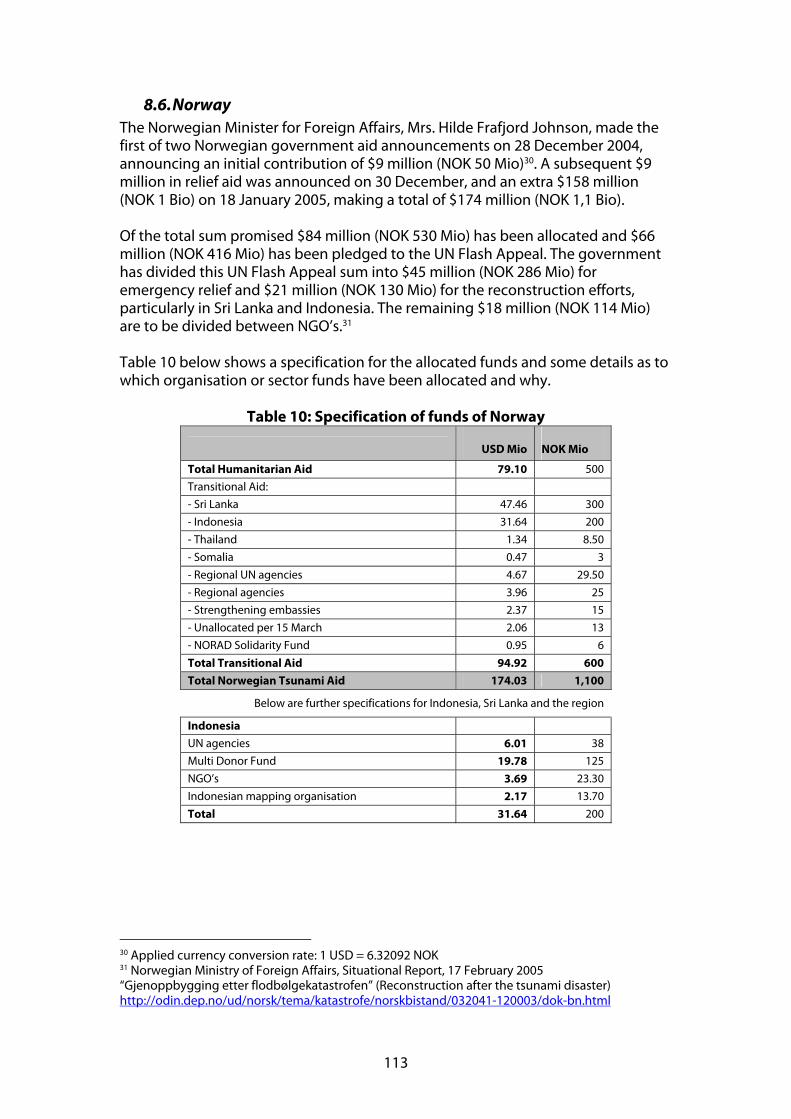
113
8.6. Norway The Norwegian Minister for Foreign Affairs, Mrs. Hilde Frafjord Johnson, made the first of two Norwegian government aid announcements on 28 December 2004, announcing an initial contribution of $9 million (NOK 50 Mio)30. A subsequent $9 million in relief aid was announced on 30 December, and an extra $158 million (NOK 1 Bio) on 18 January 2005, making a total of $174 million (NOK 1,1 Bio). Of the total sum promised $84 million (NOK 530 Mio) has been allocated and $66 million (NOK 416 Mio) has been pledged to the UN Flash Appeal. The government has divided this UN Flash Appeal sum into $45 million (NOK 286 Mio) for emergency relief and $21 million (NOK 130 Mio) for the reconstruction efforts, particularly in Sri Lanka and Indonesia. The remaining $18 million (NOK 114 Mio) are to be divided between NGO’s.31 Table 10 below shows a specification for the allocated funds and some details as to which organisation or sector funds have been allocated and why.
Table 10: Specification of funds of Norway
USD Mio NOK Mio
Total Humanitarian Aid 79.10 500
Transitional Aid:
- Sri Lanka 47.46 300
- Indonesia 31.64 200
- Thailand 1.34 8.50
- Somalia 0.47 3
- Regional UN agencies 4.67 29.50
- Regional agencies 3.96 25
- Strengthening embassies 2.37 15
- Unallocated per 15 March 2.06 13
- NORAD Solidarity Fund 0.95 6
Total Transitional Aid 94.92 600
Total Norwegian Tsunami Aid 174.03 1,100
Below are further specifications for Indonesia, Sri Lanka and the region
Indonesia
UN agencies 6.01 38
Multi Donor Fund 19.78 125
NGO’s 3.69 23.30
Indonesian mapping organisation 2.17 13.70
Total 31.64 200
30 Applied currency conversion rate: 1 USD = 6.32092 NOK 31 Norwegian Ministry of Foreign Affairs, Situational Report, 17 February 2005 “Gjenoppbygging etter flodbølgekatastrofen” (Reconstruction after the tsunami disaster) http://odin.dep.no/ud/norsk/tema/katastrofe/norskbistand/032041-120003/dok-bn.html

114
Sri Lanka
UN agencies 9.41 59.50
Multi Donor Fund 19.78 125
Norwegian NGO’s 11.07 70
Other society and business organisations 7.20 45.50
Total 47.46 300
Regional
UN International Strategy for Disaster Reduction (ISDR) 1.50 9.50
UNDP 3.16 20
NORAD Solidarity Fund 0.95 6
Regional organisations (not allocated) 3.96 25
Total 9.57 60.50
AID TO INDONESIA
UN agencies: Emphasis has been put on encouraging survivors to actively participate in the fishery and agriculture sector, the debris removal and general cleaning. Agencies that work for the vulnerable groups in society are targeted in the long term development work.
Receiving agencies are:
FAO: Fishing Equipment and Production material: NOK 6,5 Mio WHO: Healthcare information, medication, blood bank,: NOK 9,5 Mio UNDP: Construction of secure housing: NOK 20 Mio UNEP: Mapping of environmental damage: NOK 2 Mio
Multi Donor Fund: Over half of the aid is allocated for a planned multi donor fund that should consist of international organisations, national governments and donor countries.
NGO’s: Because of the conflict between the Aceh independence movement GAM and the Indonesian authorities, the Aceh province was fairly closed before the tsunami. Therefore, it is the opinion of Norway that support should only be given to organisations that already have established contact in the province. Negotiations with selected organisations are underway. Norway is keen to focus on environment & support to minorities, women and children.
Indonesian mapping organisation: After a request from the mapping organisation Norway has promised digital mapping for the affected areas. The maps will be used for the reconstruction projects and should become available to all parties active in these projects.

115
AID TO SRI LANKA
UN agencies: UN projects within the fishery, primary health services and capacity building for local organisations are targeted.
Receiving agencies are:
FAO: Fishery projects: NOK 19 Mio UNDP: Capacity building of local organisations: NOK 27,5 Mio WHO: Primary health services: NOK 13 Mio
Non-profit organisations, both social and business: The Norwegian support will primarily go to projects within the fishery sector, the restoring of jobs and reconstruction of schools. Other support will go to the reconstruction of cultural heritage, which is of great importance to the people of Sri Lanka. The emphasis should be on cooperation with local organisations to make them better equipped for their future work.
Multi Donor Fund: The international community is working on creating a multi donor fund that can collect international support for Sri Lanka in a coordinated fashion.
AID TO THAILAND AND SOMALIA
Thailand Thailand has not asked for humanitarian relief assistance, but has encouraged support for specific experience, for instance in dealing with marine areas and environments, removal of salt deposits, geotechnical destruction and rehabilitation of livelihoods. The ministry of Foreign Affairs is currently evaluating these efforts. Somalia The tsunami has come on top of years of drought and periodical floods together with serious security issues. Norway wants to focus on accommodating the immediate humanitarian needs as well as contributing to making the population self-sufficient through small scale fishery activities. This is done by supporting the UN agency Food and Agriculture Organisation FAO.
Regional efforts
Agencies receiving funds are: UN International Strategy for Disaster Reduction (ISDR): NOK 9,5 Mio UNDP: NOK 20 Mio NORAD Solidarity Fund: NOK 6 Mio Various efforts: NOK 25 Mio
Regional warning system: The tsunami disaster confirms the need for a regional early warning system. Support for this system has been given through funds allocated to ISDR. UNESCO is responsible for the coordination of the development of this system and further support is being considered.

116
UNDP: Support has been given to UNDP in the tsunami-struck region in order to develop capacity for planning, rehabilitation and reconstruction. Target groups are national and local governments together with regional and local non-profit organisations. The efforts include coordination, risk analysis, capacity building and warning systems.
Solidarity Fund: Through the Norwegian Solidarity Fund small projects have been able to find funding. These funds have nearly all been allocated.
9. Next Steps
As aid agencies, national governments and other entities complete the task of developing and implementing recovery and reconstruction projects, data on the type of goods/services requirements will become more abundantly available. This data will require continuous monitoring and updating of the demand matrices. The immediate next steps include the dissemination of this preliminary analysis to all stakeholders involved, these include UN Agencies, International Financial Institutions, Donor Development Agencies, National & Local Governments, NGO’s and the supplier community. Their reactions to this information will be sought in order to identify issues for forthcoming procurement that may be addressed through collaboration between procuring entities. In cooperation with project staff in the field, supply markets requiring in depth analysis will be identified. The results of these analyses will then be used in the potential formulation of co-operative and collaborative procurement strategies that may influence and improve the outcomes of the procurement effort in the recovery and reconstruction phases.