preliminary investigation on generation of electricity
TRANSCRIPT

Int. Journal of Renewable Energy Development 6 (1) 2017: 75-81 P a g e | 75
© IJRED – ISSN: 2252-4940, February 15th 2017, All rights reserved
Contents list available at IJRED website
Int. Journal of Renewable Energy Development (IJRED) Journal homepage: http://ejournal.undip.ac.id/index.php/ijred
Preliminary Investigation on Generation of Electricity Using Micro Wind Turbines Placed on a Car
Vijaya Krishna Teja Bangi a, Yogendra Chaudhary a, Ramesh K. Guduru a*, Kendrick T. Aung a and G. N. Reddy b
a Department of Mechanical Engineering, Lamar University, Beaumont, TX, USA – 77710
b Department of Electrical Engineering, Lamar University, Beaumont, TX, USA – 77710
ABSTRACT. Wind energy is one of the prominent resources for renewable energy and it is traditionally extracted using stationary wind turbines. However, it can also be extracted using mini or micro wind turbines on a moving body, such as an automobile, while cruising at high speeds on freeways. If the electricity is produced using air flowing around the vehicle without affecting aerodynamic performance of the vehicle, it can be used to charge up the battery or power up additional accessories of the vehicle. For the first time, in the present work, a preliminary investigation was carried out to generate electricity by utilizing air flow on a moving car. Initially, a correlation between the car speed and wind velocity was established using an anemometer. Placing a set of two micro wind turbines along with two micro generators on the rear end of the car trunk, the present study investigated the feasibility of generating electricity from these micro wind turbines while evaluating the effect of drag force on the performance of the car through the experimental approach and computational fluid dynamics (CFD) simulations. Both approaches confirmed negligible effect of drag force on the vehicle performance in terms of gas mileage and changes in drag coefficient values. Following these studies, the micro wind turbines were also tested for electricity generation at various cruising speeds of the car ranging from 50 to 80 mph on the freeways. The voltage and power generated always showed an increasing trend with increasing the car speed, however they saturated when a cut off limit was setup with the voltage controllers. A maximum voltage of 3.5 V and a maximum current of 0.8 A were generated by each micro wind turbine when a cut off limit was used along with a load consisting of four LED bulbs in parallel with 3.5 V and 0.2 A rating each. On the other hand, when the tests were repeated without using the cut-off limit, a maximum voltage of 18.91 V and a maximum current of 0.65 A were recorded with a load of six flash bulbs in series (flash bulb rating – 4.8 V and 0.5 A each). These studies clearly demonstrate the flexibility to vary the voltage and current outputs from the micro wind turbines indicating a possibility for utilizing the wind energy on the cars at high speeds. Keywords: automobile, renewable energy; wind energy
Article History: Received Sept 5th 2016; Received in revised form Dec 6th 2016 ; Accepted January 4th 2017; Available online How to Cite This Article: Bangi, V.K.T., Chaudhary, Y., Guduru, R.K., Aung, K.T and Reddy, G.N. (2017) Preliminary investigation on generation of electricity using micro wind turbines placed on a car. Int. Journal of Renewable Energy Development, 6(1), 75-81. http://dx.doi.org/10.14710/ijred.6.1.75-81
1. Introduction Internal combustion engines use non-renewable
fossil fuels to generate the energy in order to move automotive vehicles, and this, in turn, releases several million tons of greenhouse gases into the atmosphere every year (US transportation 2013). Lately, scientific communities have been warning about the alarming rate of increasing greenhouse gas emissions with the expansion of global economy and energy demands, and its long term detrimental impacts on the global ecological system (DeCicco and Fung 2006, World
*Corresponding Author: +1-409-880-7882
Email: [email protected]
Economics). On the other hand, extensive research has also been going on renewable energy resources, such as solar and wind energies in order to cut down the dependency on fossil fuels and thereby to reduce an imbalance in the ecological system. Several billions of dollars are being invested in the development and utilization of efficient and reliable renewable energy sources (Global Trends in Renewable Energy Investment
2016; Kiernan 2008, and Renewable energy policy network
for the 21st century). For example, automotive vehicles are being converted into hybrid and electric versions

Citation: Bangi, V.K.T., Chaudhary, Y., Guduru, R.K., Aung, K.T and Reddy, G.N. (2017) Preliminary investigation on generation of electricity using micro wind turbines placed on a car. Int. Journal of Renewable Energy Development, 6(1), 75-81, doi.org/10.14710/ijred.6.1.75-81
P a g e | 76
© IJRED – ISSN: 2252-4940, February 15th 2017, All rights reserved
utilizing large energy storage battery packs and contributing to reduced usage of fossil fuels with lower greenhouse gas emissions (Gadesmann and Kuhnert 2007, Sioshansi and Denholm 2009). However, these vehicles are relatively expensive and not easily affordable compared to vehicles with internal combustion engines. Interestingly, when the automobiles are in motion, they have forced flow of the wind along their body creating a drag force and wind profile. If this wind energy is utilized by vehicles that run on gas, electricity, or hybrid version, their dependence either on gas or in-built battery power sources could possibly be reduced to some extent, and thereby very likely contribute to more mileage or better performance of the vehicles. This wind energy is a renewable source on any moving body and use of suitable wind turbines could help generate the energy to substantiate the demands of electricity in the vehicles. However, one should be concerned about the location of installation of wind turbines on automobiles because of aesthetics and possible increased drag force on the vehicles. Increased drag force will consume more gas or electric energy to cruise the vehicles through the forced wind flow, and thereby self-defeat the purpose of augmenting vehicle performance through utilization of renewable wind energy. Therefore, keeping these aspects in mind, a preliminary investigation on the use of micro wind turbines on a car was performed in the present work.
The authors made an attempt to study the electricity generated by micro wind turbines mounted on a 1998 Honda Accord LX in order to evaluate and assess the feasibility of using wind energy flowing around the car. There are different possible locations on a car for installation of the micro wind turbines, such as front bumper, roof top, and rear end. There are some patents already existed on these ideas (Amick 1978, Boodman & Malone 1980, Vu 2005), however, to the best of author’s knowledge, there is no existing experimental literature in the research publications. In this work, the CFD simulations and experimental investigation were carried out while installing the wind turbine setup on rear end of the car simulating the rear wind spoiler with an assumption of minimal drag force effect on the aerodynamics of the car. Also, the wind velocity over the rear end of the car was usually expected to be less compared to the front end of the engine compartment as well as roof top of the car (Cakir 2012, Selvaraju et al 2015). Therefore, this study was focused on investigating the power generation by micro wind turbines while assessing the impact of these micro wind turbines on the drag force on the car.
2. Methods and Experiments
As stated above, the rear end of the car was selected for the present investigation of the drag force and electricity generated. However, prior to the experimental verifications of the drag force, CFD simulations were
performed using the design of a 1998 Honda Accord LX version, see Fig. 1, that was adapted from the reference (CAR Blueprints 2016).
Figure 1.(a) PTC Creo design of a car without wind turbine setup, (b) PTC Creo design of the car with a wind turbine setup on the rear end 2.1 CFD simulations on Drag Force
AUTODESK FLOW DESIGN application was used for CFD analysis. Flow Design was a 3D virtual wind tunnel for simulating air flow over and around the designs. Appropriate replica for the car model was developed using PTC CREO with and without the wind turbine setup. These models were then exported to Flow Design software to perform the simulations in order to determine the drag force on the car. This software meshed the car model automatically with an enclosure of the wind tunnel. Upon imposing boundary conditions for the wind flow, it started to iterate and simulate the wind flow and calculated the drag coefficient. When the solution converged, a stabilized value for drag force was obtained. This software simulation automatically generated the drag coefficient, the drag force, and the average drag coefficient for the vehicle. In these simulations, the ‘wind tunnel’ module was simulated with an input parameter of wind speed around 35.53 m/s corresponding to 80 mph of the car speed in an ideal wind flow condition against the car.
The direction of the wind flow was set from the front end to rear end of the car. Readings for drag force and drag coefficient were taken with and without the setup of micro turbines when the system stabilized with a converged solution. The drag force and drag coefficients were then extracted from converged solutions.
[a]
[b]
Citation: Bangi, V.K.T., Chaudhary, Y., Guduru, R.K., Aung, K.T and Reddy, G.N. (2017) Preliminary investigation on generation of electricity using micro wind turbines placed on a car. Int. Journal of Renewable Energy Development, 6(1), 75-81, doi.org/10.14710/ijred.6.1.75-81
P a g e | 77
© IJRED – ISSN: 2252-4940, February 15th 2017, All rights reserved
2.2 Experimental verification of Drag Force In order to estimate the impact of wind turbine
experimental setup on the aerodynamic performance of the car, several driving tests were performed to determine the consumption of gas (miles per gallon, mpg) with or without the wind turbine setup on the car. The gas tank of 1998 Honda Accord LX car was completely filled with gasoline till the pump tripped, and then it was driven on a freeway for a minimum distance of 110 miles for every measurement. At the end of every measurement, the same gas station, and the same pump were used to refuel the tank in order to maintain the consistency in the experimental measurements. The mpg was determined using the equation below (The Mathematical Collage 2016, Transportation 2016)
mpg= ([Odometer reading at the end of the trip (miles) - Odometer reading at the start of the trip(miles)])/(gas consumed (gallons)) (1) It should be noted that the direction of wind while driving on the freeway was not as ideal as it was assumed in the CFD simulations for comparison purposes. 2.3 Correlation between car speed and wind velocity
Experiments were conducted to establish a correlation between the car speed and wind velocity. A USB supported anemometer (Mastech MS6252A) was placed on the rear end of the car, without the micro wind turbine setup. Then, the experiments were conducted by driving the car in different directions with speeds ranging from 30 to 80 mph. In all these experiments, cruise control was enabled to maintain a constant speed at different speed intervals, and the wind velocity was recorded for its variations.
2.4 Electricity generated by micro wind turbines installed on the car without sensors
The experiments were performed using two wind turbines. The specifications for each wind turbine (generators come with the turbine) are listed in table 1. Tabel 1 Specifications of the micro turbines
Voltage: 1.5-36 V Current: 0.005-0.8 A Rated speed: 3000 rpm Motor diameter: 30 mm Motor height: 58 mm Shaft diameter: 3.0 mm
Initially, each turbine was tested in a wind tunnel in the laboratory experiments at different speeds ranging from 0 to 20 m/s without using any external load in the circuit. The voltage output from each turbine exceeded 30 V for a wind velocity of 20 m/s. However, under the load conditions, output voltage reduced depending on the amount of load and circuit resistance. While running the
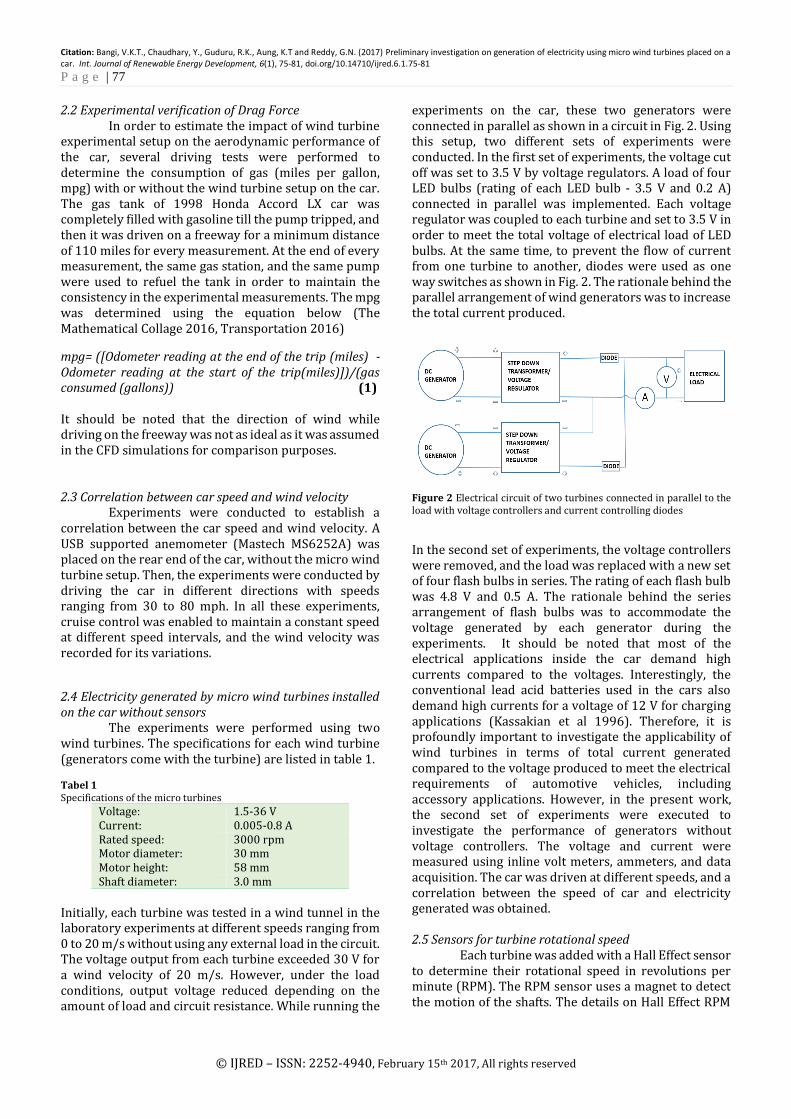
experiments on the car, these two generators were connected in parallel as shown in a circuit in Fig. 2. Using this setup, two different sets of experiments were conducted. In the first set of experiments, the voltage cut off was set to 3.5 V by voltage regulators. A load of four LED bulbs (rating of each LED bulb - 3.5 V and 0.2 A) connected in parallel was implemented. Each voltage regulator was coupled to each turbine and set to 3.5 V in order to meet the total voltage of electrical load of LED bulbs. At the same time, to prevent the flow of current from one turbine to another, diodes were used as one way switches as shown in Fig. 2. The rationale behind the parallel arrangement of wind generators was to increase the total current produced.
Figure 2 Electrical circuit of two turbines connected in parallel to the load with voltage controllers and current controlling diodes
In the second set of experiments, the voltage controllers were removed, and the load was replaced with a new set of four flash bulbs in series. The rating of each flash bulb was 4.8 V and 0.5 A. The rationale behind the series arrangement of flash bulbs was to accommodate the voltage generated by each generator during the experiments. It should be noted that most of the electrical applications inside the car demand high currents compared to the voltages. Interestingly, the conventional lead acid batteries used in the cars also demand high currents for a voltage of 12 V for charging applications (Kassakian et al 1996). Therefore, it is profoundly important to investigate the applicability of wind turbines in terms of total current generated compared to the voltage produced to meet the electrical requirements of automotive vehicles, including accessory applications. However, in the present work, the second set of experiments were executed to investigate the performance of generators without voltage controllers. The voltage and current were measured using inline volt meters, ammeters, and data acquisition. The car was driven at different speeds, and a correlation between the speed of car and electricity generated was obtained. 2.5 Sensors for turbine rotational speed
Each turbine was added with a Hall Effect sensor to determine their rotational speed in revolutions per minute (RPM). The RPM sensor uses a magnet to detect the motion of the shafts. The details on Hall Effect RPM

Citation: Bangi, V.K.T., Chaudhary, Y., Guduru, R.K., Aung, K.T and Reddy, G.N. (2017) Preliminary investigation on generation of electricity using micro wind turbines placed on a car. Int. Journal of Renewable Energy Development, 6(1), 75-81, doi.org/10.14710/ijred.6.1.75-81
P a g e | 78
© IJRED – ISSN: 2252-4940, February 15th 2017, All rights reserved
sensors could be found elsewhere (Hall Effect sensing and application, Ramsden, E. Hall Effect Sensors - Theory
and Applications). The RPM sensors on the back of each turbine are shown in Fig. 3. The sensors were programmed with Arduino of Uno version to determine the RPM of turbine shafts. These readings were monitored on a laptop using a software “CoolTerm” (http://freeware.the-meiers.org/). Then, by using an android application “Timestamp”, the car speed measurements were synchronized with the RPM, voltage and current data collection.
Figure 3. Hall Effect based RPM sensors attached on the back of wind turbines
3. Results and Discussion 3.1 Investigation of drag force through modeling and experiments The results of CFD simulations are shown in Table 2.
Tabel 2 Variation of drag force and drag coefficient values obtained through CFD modelling of a 1998 Honda Accord LX
Parameter Without wind turbine Setup
With wind turbine Setup
Drag Coefficient 0.47 0.39
Drag Force (N) 798.8 580.5
After the convergence of solutions within the tolerance, based on the model size, the voxel (grid) size and flow speed got stabilized (Autodesk Flow Design HELP 2016), and variation in the drag coefficient was minimized. The contour profile for converged drag forces is shown in Figure 4.
The variation in drag coefficient due to the wind turbine setup was not significant and this could be attributed to low wind velocities at the rear end of the car (CAR Blueprints 2016, Transportation 2016). Interestingly, the drag force was observed to decrease slightly, and the authors believe that the setup may have acted similar to a rear wind spoiler where the drag effects would be reduced. The experimental
observations also showed no major effect on the mileage performance of the car. Table 3 shows the number of miles travelled in two different routes along with the mpg obtained. The driving conditions in both the routes A and B were ensured to be similar in order to reduce the error in the mileage performance, and also the maximum speed was maintained within 80 mph on the freeway. The mpg data in both the cases i.e., with and without the wind turbine setup, implies a minimal effect of drag on the aerodynamic performance of the car.
Figure 4. Wind velocity contour image generated using Autodesk Flow Design with wind turbine setup mounted on the car
Tabel 3 Estimates of mpg from the experiments conducted with and without the wind turbine setup on rear end of the car without sensors
Without wind turbine setup on the rear end
Route Odometer Reading Gas consumed (Gallons)
mpg Start End
A 169432 169542 3.575 30.76
B 170634 170746 3.673 30.49
With wind turbine setup on the rear end
Route Odometer Reading Gas consumed (Gallons)
mpg Start End
A 169633 169743 3.744 29.38
B 170522 170634 3.546 31.58
3.2 Correlations between the car speed and wind velocity, and turbine RPM and car speed
These experiments were conducted without the wind turbine setup on the car. The variation in the wind velocity is shown in Fig. 5 as a function of car speed, and it exhibited an increasing trend with increased car speed. However, the amount of scatter in wind velocity at a particular car speed could be due to multiple effects, such as varying cross wind flow directions from location to location, and a sudden gush of local winds due to the vehicles passing by on the freeway in both the directions,

Citation: Bangi, V.K.T., Chaudhary, Y., Guduru, R.K., Aung, K.T and Reddy, G.N. (2017) Preliminary investigation on generation of electricity using micro wind turbines placed on a car. Int. Journal of Renewable Energy Development, 6(1), 75-81, doi.org/10.14710/ijred.6.1.75-81
P a g e | 79
© IJRED – ISSN: 2252-4940, February 15th 2017, All rights reserved
etc. Despite such variations, with increasing the car speed, the average wind velocity kept increasing indicating a possible positive impact on the wind turbines for increased rotational speed, which was tested in the subsequent measurements.
Figure 5. Variation of wind velocity with respect to the car speed
Figure 6. Variation of turbine RPM with respect to the car speed
Figure 6 shows the variation in turbine RPM with respect to the car speed. The RPM of both the turbines is almost similar and it increased with increasing the car speed. However, the fluctuations in the RPM of turbines for a given car speed could be attributed to varying cross winds and local gushing winds. 3.3 Electricity generated by micro wind turbines with voltage controllers
Figure 7 shows a variation of wind velocity with respect to the car speed and the corresponding voltage generated by the micro wind turbines. From this graph, it can be inferred that the wind velocity was increasing with increasing the car speed. The difference between the wind velocity imposed in the simulations and experimental observations can be attributed to the differing location of wind velocity measurements in the model and experiments. At the same time, the effect of cross wind flow is also anticipated to reduce the experimentally observed wind velocity values. The
scatter in the wind velocity and turbine RPM at a particular car speed was significant due to different factors listed in section 3.2. At a speed of 50 mph, the voltage generated was averaged around 2.5 V and it kept increasing with increasing the car speed. However, it showed a saturating trend toward the car speed of 80 mph, and it was due to the coupled voltage controllers. This is certainly interesting from the voltage demand point of view in the cars, where the generation of 12 V by wind turbines does not seem to be a challenge to meet the requirement of many utilities, and three to four of these micro wind turbines without a voltage controller can easily generate voltages close to or above 12 V. Hence, production of more electrical current takes primary importance over the voltage in terms of meeting the electrical demands in the cars.
Figure 7. Variation of wind velocity at turbine and the voltage generated with respect to the car speed
Figure 8 shows the variation of current produced and power output from the micro wind turbines as a function of the car speed. The power of the wind turbines was calculated using the current and voltage output produced at each speed of the car with the formula provided below: Power=Voltage× Current (2)
Figure 8. Variation of power and current produced by wind turbine with respect to the car speed without sensors
5
10
15
20
25
30
25 35 45 55 65 75 85
Win
d V
elo
city
(m
/s)
Car Speed (mph)
0
1000
2000
3000
4000
5000
43.0 53.0 63.0 73.0
RP
M
Car Speed (mph)
GENERATOR1
GENERATOR2
2.0
2.5
3.0
3.5
4.0
4.5
5.0
7
12
17
22
27
45 50 55 60 65 70 75 80 85
Vo
ltag
e (v
)
Win
d V
elo
city
(m
/s)
Car Speed (mph)
Wind Velocity
Voltage
0.0
0.4
0.8
1.2
1.6
2.0
0.0
0.8
1.6
2.4
3.2
4.0
45 55 65 75 85
Cu
rren
t (A
)
Po
wer
(W
atts
)
Car Speed (mph)
Power
Current

Citation: Bangi, V.K.T., Chaudhary, Y., Guduru, R.K., Aung, K.T and Reddy, G.N. (2017) Preliminary investigation on generation of electricity using micro wind turbines placed on a car. Int. Journal of Renewable Energy Development, 6(1), 75-81, doi.org/10.14710/ijred.6.1.75-81
P a g e | 80
© IJRED – ISSN: 2252-4940, February 15th 2017, All rights reserved
Both the current flow and the power generated were observed to increase with increasing car speed. The variation in both parameters at a fixed car speed could be attributed to the variation in wind velocities due to fluctuations in the local wind gusts around the turbines. Interestingly, the variation in power followed a similar trend exhibited by the current generated, and this is solely due to the voltage limitation imposed by the voltage controllers, which again implies a possible enhanced power generation if the voltage is not restricted by the controllers, which was also confirmed from the second set of experiments discussed in the next section. Thus, these studies show the plausibility of production and utilization of wind energy in the moving vehicles for their improved mileage or reduced energy consumption. 3.4 Electricity generated by micro wind turbines without voltage controllers
Figure 9. Variation of voltage and current produced by wind turbine with respect to the car speed when there were no voltage controllers in the circuit.
Figure 9 shows the variation of voltage with respect to the car speed when there were no voltage controllers in the circuit. The circles and triangles in the graph represent the data from two different tests. Solid data points show the voltage output, and hollow data points represent the current output.
Figure 10 shows the variation of the power and current generated by the experimental setup. The circles and triangles in the graph represent the data from two different tests. Similarly, the solid data points show the power output and hollow data points represent the current output.
It is clear that both the voltage and current continuously increased with increasing the car speed indicating a possible generation of high voltages also with the given experimental setup. However, due to the changes in the load parameters with four flash lights in series, the current did not exceed 0.65 A, which was slightly lower than the current obtained with parallel arrangement of the loads in the section 3.3.
Figure 10. Variation of power and current produced by wind turbines with respect to the car speed when there were no voltage controllers in the circuit
As the current and voltage generated by the setup were increasing, the entire power output of the system also increased with respect to the car speed. In both the tests, the experimental data followed the same trend in terms of increase in the voltage or current or power output with respect to the car speed, however there was a slight difference in the car speeds for the same voltage or power or current outputs, and this was due to the climatic wind directions when the vehicle was driven to-and-fro in the same route on a freeway. These measurements clearly signify that the voltage and current generated using the wind turbines can be altered depending on the load configuration as well as the controllers imposed on the circuit. At the same time, this auxiliary power generation with wind turbines could help serve the utilities in the car as well as reduce the gas consumption during. 4.Conclusions
In summary, the current preliminary investigations established the feasibility of using micro wind turbines on the cars with a reasonable output of current that can be utilized for the auxiliary application inside the car. The turbine RPM and wind velocity increased with increasing the car speed, however they were also affected by the cross wind flows and local wind gushes due to the vehicles passing by. The electricity generated with and without voltage controllers showed the flexibility to control the voltage and current outputs depending on the requirements in the vehicles. However, it was also evident that a minimum car speed of 50 mph or more is required to generate a current of 0.2 A for the wind turbine setup implemented in the present experiments. Also, the electrical components in the circuit could be replaced with different simple components such as capacitors and voltage regulators to reduce the power loss and increase the efficiency of power generated by wind turbines.
0
0.25
0.5
0.75
0
10
20
30
40
50
40 50 60 70 80
Cu
rren
t (A
)
Vo
ltag
e (V
)
Car Speed (mph)
-0.1
0.1
0.3
0.5
0.7
0
5
10
15
20
25
40 50 60 70 80
Cu
rren
t (A
)
Po
wer
( W
atts
)
Car Speed (mph)

Citation: Bangi, V.K.T., Chaudhary, Y., Guduru, R.K., Aung, K.T and Reddy, G.N. (2017) Preliminary investigation on generation of electricity using micro wind turbines placed on a car. Int. Journal of Renewable Energy Development, 6(1), 75-81, doi.org/10.14710/ijred.6.1.75-81
P a g e | 81
© IJRED – ISSN: 2252-4940, February 15th 2017, All rights reserved
Acknowledgement
This work was supported by the startup funds provided by Lamar University to the faculty Dr. Ramesh K. Guduru.
References
Amick, J.L (1978) US patent Wind-powered car Autodesk Flow Design Help
http://help.autodesk.com/view/ADSKFD/ENU/?guid=GUID-774D23EE-4278-4E02-B176-55ADDC81C508 Accessed on 15th August 2016
Boodman, L., and Malone, J.P (1980) US patent, Wind turbine generator for electrical powered vehicles
Cakir, M (2012) CFD Study on Aerodynamic Effects of a Rear Wing/spoiler on a Passenger Vehicle, Santa Clara University, School of Engineering, 3-9.
CAR Blueprints http://carblueprints.narod.ru/honda.html Accessed on 10th August 2016
CoolTerm Software, http://freeware.the-meiers.org/ Accessed on 15th August 2016
DeCicco, J. and Fung, F. (2006), Global Warming in the Road, The Climate Impact of America’s Automobiles, Environmental Defense 1-4
Gadesmann, K. and Kuhnert, F. (2007), The automotive industry and climate change, Framework and dynamics of the CO2 (r)evolution, 27-3
Global Trends in Renewable Energy Investment 2016,http://www.fs-unep-centre.org (Frankfurt am Main) Accessed on 3rd August 2016
Hall effect sensing and application http://sensing.honeywell.com/hallbook.pdf Accessed on 14th August 2016
Kassakian, J.G., Wolf, H.C., Miller, J.M., Hurton, C.J. (1996) Automotive electrical systems circa 2005, IEEE Spectrum,3(8 ), 22-27
Kiernan, M.J. (2008), Investing in a Sustainable World, AMACOM Div American Mgmt Assn, 1-7
Ramsden, E (2006). Hall Effect Sensors - Theory and Applications, 2nd ed.; Elsevier: Amsterdam, The Netherlands.
Renewable energy policy network for the 21st century- The First Decade 2004-2014, http://www.ren21.net/Portals/0/documents/activities/Topical%20Reports/REN21_10yr.pdf Accessed on 10th August 2016
Selvaraju, P.N., Parammasivam, K.M., Shankar,S., Devaradjane, D. (2015) Analysis of Drag and Lift performance in sedan car model using CFD, JCHPS Special Issue, 7, 429-434
Sioshansi, R and Denholm, P (2009) Emissions Impacts and Benefits of Plug-in Hybrid Electric Vehicles and Vehicle to Grid Services, Environmental Science and Technology, 43(4),1199-1204
The Mathematical Collage, Math and the Automobile http://www2.ohlone.edu/people2/bbradshaw/math155/excursions/m155_excursions_automobile.pdf Accessed on 12th August 2016
Transportation http://www.ems.psu.edu/~radovic/Chapter20.pdf Accessed on 12th August 2016
U.S. Transportation Sector Greenhouse Gas Emissions (2013), Office of Transportation and Air Quality, EPA-420-F-13-033a, 1-4
Vu, T.H (2005) US patent Wind energy capturing device for moving vehicles
World Economics, Vol. 7, No. 2, April–June 2006 Pages 1-10