predictive pore-scale modelling matching scal experiments using realistic networks per valvatne...
TRANSCRIPT

Predictive Pore-Scale Modelling Predictive Pore-Scale Modelling
Matching SCAL Experiments using Realistic Matching SCAL Experiments using Realistic Networks Networks
Per ValvatneImperial College, London
Per Valvatne, Imperial College
Presentation OutlinePresentation Outline
• Brief overview of pore-scale modelling
• The importance of spatially correlated wettability when predicting mixed-wet data
• Using non-specific networks to to predict experimental data for other rock types
• Successfully predict experimental data for water-wet and mixed-wet conditions

Per Valvatne, Imperial College
What is Pore Scale ModellingWhat is Pore Scale Modelling
• Rules determine fluid configuration and transport through network
• Macroscopic properties like capillary pressure and relative permeability can be estimated
Describe the void space ofa rock as a network of
pores and throats

Per Valvatne, Imperial College
Primary Drainage Displacement ProcessPrimary Drainage Displacement Process
• Oil invasion into a water-filled water-wet porous medium– Increase pressure in oil phase, keeping water pressure
constant
– Some water will still remain in the corners of pores with irregular shapes

Per Valvatne, Imperial College
Primary Drainage Displacement ProcessPrimary Drainage Displacement Process
0.0
0.2
0.4
0.6
0.8
1.0
0.0 0.2 0.4 0.6 0.8 1.0
Water Saturation
Re
lati
ve
Pe
rme
ab
ility
Drainage

Per Valvatne, Imperial College
Wettability AlterationWettability Alteration
Drainage
Water Flooding 90a
90a
0rWettability Alteration

Per Valvatne, Imperial College
Water Flooding Displacement EventsWater Flooding Displacement Events
• Piston type displacement– Water in the body displaces
oil in a neighbouring element
• Snap off– When water in the corners no longer has a stable
configuration, the element fills.
Spontaneous Forced

Per Valvatne, Imperial College
Water-WetWater-Wet• Following primary drainage all elements contacted by oil
have their wettability altered
• The elements might remain water-wet– Considerable amount of trapped oil due to water snap-off
0.0
0.2
0.4
0.6
0.8
1.0
0.0 0.2 0.4 0.6 0.8 1.0Water Saturation
Re
lati
ve
Pe
rme
ab
ility
Drainage
Water-wet

Per Valvatne, Imperial College
Oil-WetOil-Wet
• All elements might become oil-wet– Low residual oil saturation due to oil escaping through layers
0.0
0.2
0.4
0.6
0.8
1.0
0.0 0.2 0.4 0.6 0.8 1.0Water Saturation
Re
lati
ve
Pe
rme
ab
ility
DrainageWater-wet
Oil-wet

Per Valvatne, Imperial College
Mixed-WetMixed-Wet
• What if initial water saturation is higher than the residual?– Only pores and throats contacted by oil become oil-wet
– Network exhibits mixed-wet characteristics
0.0
0.2
0.4
0.6
0.8
1.0
0.0 0.2 0.4 0.6 0.8 1.0Water Saturation
Re
lati
ve
Pe
rme
ab
ility
DrainageWater-wetOil-wetSwi > Swr

Per Valvatne, Imperial College
Mixed-WetMixed-Wet
• Rocks often exhibit mixed wet characteristics even if all elements have been contacted by oil– How does wettability vary spatially on the pore scale?
Per Valvatne, Imperial College
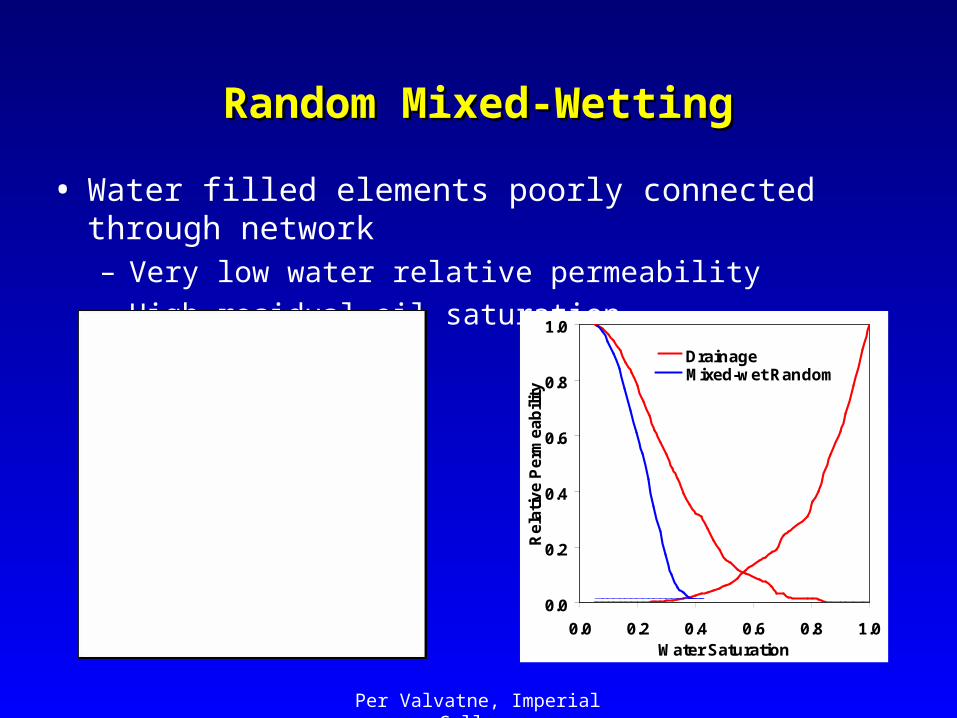
Random Mixed-WettingRandom Mixed-Wetting
• Water filled elements poorly connected through network– Very low water relative permeability
– High residual oil saturation
0.0
0.2
0.4
0.6
0.8
1.0
0.0 0.2 0.4 0.6 0.8 1.0Water Saturation
Re
lati
ve
Pe
rme
ab
ility
DrainageMixed-wet Random

Per Valvatne, Imperial College
Spatially Correlated Mixed-WettingSpatially Correlated Mixed-Wetting
• Water filled elements well connected through network– Relative permeability “looks” correct
– Same oil-wet fraction as in last example
0.0
0.2
0.4
0.6
0.8
1.0
0.0 0.5 1.0Water Saturation
Re
lati
ve
Pe
rme
ab
ility
DrainageMixed-wet RandomMixed-wet Correlated

Per Valvatne, Imperial College
Predictive Pore Scale ModellingPredictive Pore Scale Modelling
• Create the network from a geologically reconstructed Berea sandstone (in cooperation with Statoil)

Per Valvatne, Imperial College
Water-Wet Experimental DataWater-Wet Experimental Data
• Berea sandstone cores– 0 degrees receding contact angle
– 50-80° advancing contact angle (uniform distribution)
– Compared to experimental data by Oak
Primary Drainage
0.0
0.2
0.4
0.6
0.8
1.0
0.2 0.4 0.6 0.8 1.0
Water Saturation
Re
lati
ve
Pe
rme
ab
ility
ExperimentalPredicted
Water Flooding
0.0
0.2
0.4
0.6
0.8
1.0
0.2 0.4 0.6 0.8 1.0Water Saturation
Re
lati
ve
Pe
rme
ab
ility

Per Valvatne, Imperial College
Matching SCAL ExperimentsMatching SCAL Experiments
• Use existing realistic network for connectivity information – Pore locations, connection number, pore shapes etc.
• Condition network to mercury injection data– Modify throat size distribution until match on capillary
pressure curve
0
10
20
30
40
50
60
0.0 0.2 0.4 0.6 0.8 1.0Air saturation
Ca
pill
ary
Pre
ss
ure
(B
ar) Hg curve
Predicted
0.0
0.2
0.4
0.6
0.8
1.0
1.0E-021.0E-011.0E+001.0E+01
Diameter (micro.m)
Vo
l fra
cti
on
Hg curvePredicted

Per Valvatne, Imperial College
Sandstone ExampleSandstone Example
• Absolute permeability well predicted– 669 mD predicted versus 750 mD found experimentally
• Steady-state waterflood relative permeability available– Mixed-wet characteristics
-12000.0
-8000.0
-4000.0
0.0
4000.0
0.2 0.4 0.6 0.8 1.0
Water Saturation
Ca
pill
ary
Pre
ss
ure
(P
a)

Per Valvatne, Imperial College
Sandstone ExampleSandstone Example
0.0
0.2
0.4
0.6
0.8
1.0
0.2 0.4 0.6 0.8 1.0Water Saturation
Re
lati
ve
Pe
rme
ab
ility
Predicted
Experimental

Per Valvatne, Imperial College
Carbonate ExampleCarbonate Example
• Tight intergranular carbonate (2 samples matched)– 1.7 mD predicted versus 1.4 mD found experimentally
– Mixed-wet characteristics
– Both aged and unaged results available Sample 15 Sample 24
Per Valvatne, Imperial College
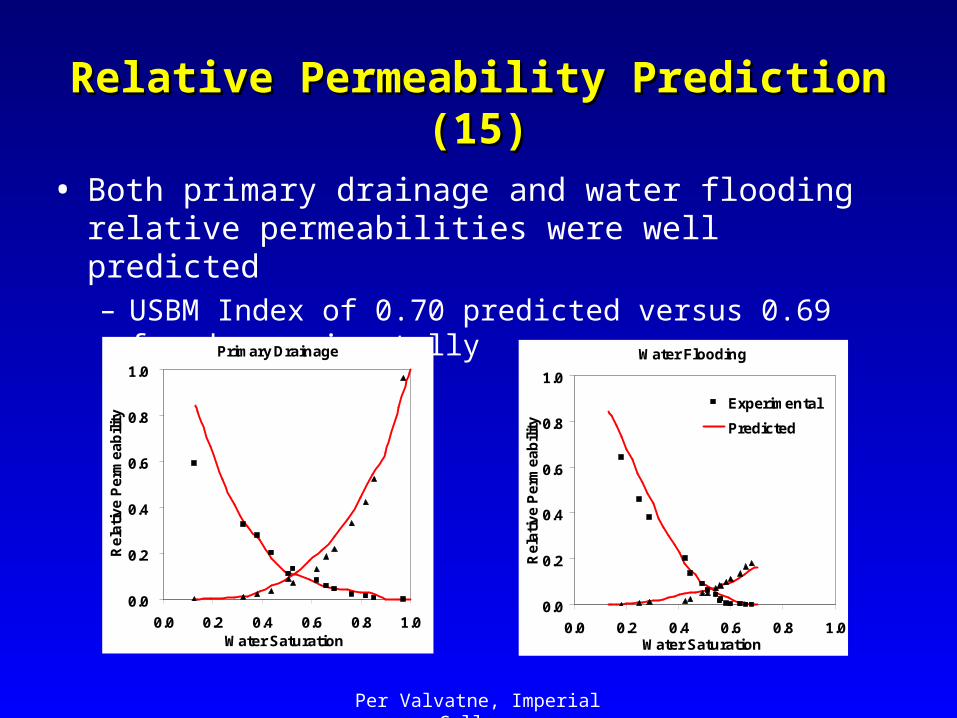
Relative Permeability Prediction (15)Relative Permeability Prediction (15)
• Both primary drainage and water flooding relative permeabilities were well predicted– USBM Index of 0.70 predicted versus 0.69 found
experimentallyPrimary Drainage
0.0
0.2
0.4
0.6
0.8
1.0
0.0 0.2 0.4 0.6 0.8 1.0Water Saturation
Re
lati
ve
Pe
rme
ab
ility
Water Flooding
0.0
0.2
0.4
0.6
0.8
1.0
0.0 0.2 0.4 0.6 0.8 1.0Water Saturation
Re
lati
ve
Pe
rme
ab
ility
Experimental
Predicted
Per Valvatne, Imperial College
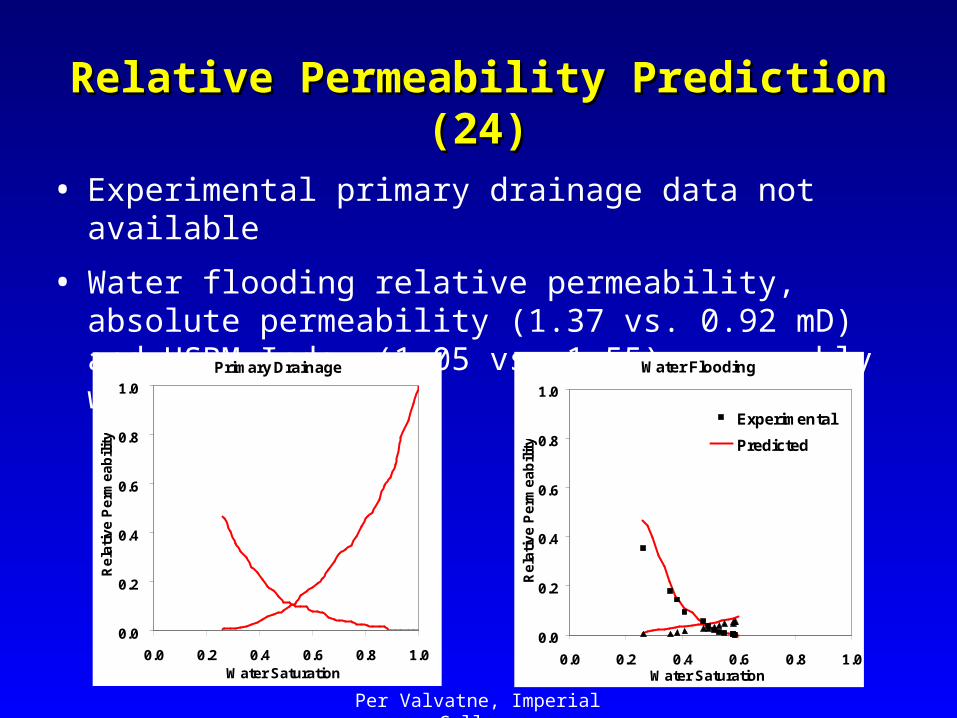
Relative Permeability Prediction (24)Relative Permeability Prediction (24)
• Experimental primary drainage data not available
• Water flooding relative permeability, absolute permeability (1.37 vs. 0.92 mD) and USBM Index (1.05 vs. 1.55) reasonably well matched
Primary Drainage
0.0
0.2
0.4
0.6
0.8
1.0
0.0 0.2 0.4 0.6 0.8 1.0Water Saturation
Re
lati
ve
Pe
rme
ab
ilit
y
Water Flooding
0.0
0.2
0.4
0.6
0.8
1.0
0.0 0.2 0.4 0.6 0.8 1.0Water Saturation
Re
lati
ve
Pe
rme
ab
ilit
y
Experimental
Predicted

Per Valvatne, Imperial College
ConclusionsConclusions
• Relative permeability is sensitive to both the average network-scale wettability as well as it’s spatial distribution on the pore scale
• Networks can be conditioned to successfully predict performance of a wide range of rock types
• Successfully predicted relative permeability and recovery data for water-wet and mixed-wet cores

Per Valvatne, Imperial College
Remaining WorkRemaining Work
• Using conditioning procedure to match more SCAL experiments– Would like to have more sandstone SCAL data
– Sensitivities with respect to underlying connectivity information
• Further investigation of wettability distribution– Is there a way to verify it’s distribution on the pore scale?
• Hysteresis trends during secondary drainage and higher order water floods– Compare to experimental data