prediction of non-darcy flow effects on fluid flow …
TRANSCRIPT

PREDICTION OF NON-DARCY FLOW EFFECTS ON FLUID FLOW
THROUGH POROUS MEDIA BASED ON FIELD DATA
A THESIS SUBMITTED TO
THE GRADUATE SCHOOL OF NATURAL AND APPLIED SCIENCES
OF
MIDDLE EAST TECHNICAL UNIVERSITY
BY
ERSEN ALP
IN PARTIAL FULFILLMENT OF THE REQUIREMENTS
FOR
THE DEGREE OF DOCTORATE OF PHILOSOPHY
IN
PETROLEUM AND NATURAL GAS ENGINEERING
OCTOBER 2012

Approval of the thesis:
PREDICTION OF NON-DARCY FLOW EFFECTS ON FLUID FLOW
THROUGH POROUS MEDIA BASED ON FIELD DATA
Submitted by ERSEN ALP in partial fulfillment of the requirements for the degree
of Doctor of Philosophy in Petroleum and Natural Gas Engineering
Department, Middle East Technical University by
Prof. Dr. Canan Özgen ____________
Dean, Graduate School of Natural and Applied Sciences
Prof. Dr. Mahmut Parlaktuna ____________
Head of Department, Petroleum and Natural Gas Engineering Dept.
Prof. Dr. Serhat Akın ____________
Supervisor, Petroleum and Natural Gas Engineering Dept, METU
Examining Committee Members:
Prof. Dr. Mahmut Parlaktuna ____________
Petroleum and Natural Gas Engineering Dept, METU
Prof. Dr. Serhat Akın ____________
Petroleum and Natural Gas Engineering Dept, METU
Prof. Dr. Tanju Mehmetoğlu _____________
Petroleum and Natural Gas Engineering Dept, METU
Prof. Dr. Nurkan Karahanoğlu _____________
Geological Engineering Dept, METU
Assistant Prof. Dr. İ. Metin Mıhçakan _____________
Petroleum and Natural Gas Engineering Dept, ITU
Date: 05 October 2012

iii
I hereby declare that all information in this document has been obtained and
presented in accordance with academic rules and ethical conduct. I also declare
that, as required by these rules and conduct, I have fully cited and referenced
all material and results that are not original to this work.
Name, Surname: Ersen ALP
Signature :

iv
ABSTRACT
PREDICTION OF NON-DARCY FLOW EFFECTS ON FLUID FLOW
THROUGH POROUS MEDIA BASED ON FIELD DATA
ALP, Ersen
Ph.D., Department of Petroleum and Natural Gas Engineering
Supervisor: Prof. Dr. Serhat AKIN
October 2012, 130 pages
The objective of this dissertation is to investigate the non-Darcy flow effects on field
base data by considering gas viscosity, gas deviation factor and gas density as
variables. To achieve it, different correlations from the literature and field data have
been combined to Sawyer-Brown Method, thus a contribution has been achieved.
Production history of selected gas field has been implemented to a numerical
simulator. To find out non-Darcy effects quantitatively, Darcy flow conditions have
also been run in the simulator for each scenario in addition to non-Darcy flow
correlation runs. Extracted data from simulation runs have been analyzed on the
basis of Sawyer-Brown Method by introducing several correlations to consider gas
viscosity, gas deviation factor and gas density as variables. Engineering and
scientific research on non-Darcy flow is still being conducted in order for better
understanding the nonlinear flow behavior of fluids through porous media. The
deviations from Darcy’s Law are attributed to the occurrence of all or alternating
combinations of factors that can be categorized as the anisotropy of porosity and
permeability, multi-phase flow of fluids in varying phases, magnitude of pressure
drop and the subsequent phase change in fluids, and the change in flow regime at
elevated rates of flow in porous media. Throughout this dissertation, the factors
causing deviations from Darcy flow behavior have been investigated.
Keywords: Porous Media, Fluid Flow, Fluid Phase, Non-Darcy Flow, Viscous
Forces.

v
ÖZ
SAHA VERĠLERĠ TEMELĠNDE GÖZENEKLĠ ORTAMDA DARCY-DIġI AKIġ
ETKĠLERĠNĠN SAPTANMASI
ALP, Ersen
Doktora, Petrol ve Doğal Gaz Mühendisliği Bölümü
Tez Yöneticisi: Prof. Dr. Serhat AKIN
Ekim 2012, 130 sayfa
Bu tezin amacı gaz viskozitesini, gaz sapma faktörünü ve gaz yoğunluğunu
değiĢkenler olarak ele alıp Darcy-dıĢı akıĢ etkilerini saha verileri temelinde
incelemektir. Bunu baĢarabilmek için literatürden ve saha verilerinden farklı
korelasyonlar, Sawyer-Brown Metoduna ilave edilmiĢ ve katkı sağlanmıĢtır. Seçilen
gaz sahasının üretim tarihçesi bir nümerik simülatöre girilmiĢtir. Darcy-dıĢı akıĢ
etkilerini nicel olarak bulabilmek için, Darcy-dıĢı akıĢ korelasyonlarına ilave olarak
Darcy akıĢ koĢulları da her senaryo için simüle edilmiĢtir. Gaz viskozitesini, gaz
sapma faktörünü ve gaz yoğunluğunu değiĢken olarak kullanabilmek için Sawyer-
Brown Metoduna farklı korelasyonlar eklenerek simülasyondan elde edilen sonuçlar
çözümlenmiĢtir. Gözenekli ortamda akıĢkanların doğrusal olmayan akıĢ
davranıĢlarını daha iyi anlayabilmek için Darcy-dıĢı akıĢ üzerine mühendislik ve
bilimsel araĢtırmalar halen devam etmektedir. Darcy Yasasından sapmalar gözenekli
ortamda gözeneklilik ve geçirgenlik anizotropisi, değiĢken fazlarda akıĢkanların çok
fazlı akıĢı, basınç düĢümü büyüklüğüne bağlı olarak akıĢkanların faz değiĢtirmesi,
ve gözenekli ortamda yüksek hızlı akıĢtan ötürü akıĢ rejiminin değiĢmesi Ģeklinde
sınıflanabilir. Bu doktora tezinde Darcy akıĢı davranıĢından sapmalara neden olan
faktörler incelenmiĢtir.
Anahtar Kelimeler: Gözenekli Ortam, AkıĢkan AkıĢı, AkıĢkan Fazı, Darcy-DıĢı
AkıĢ, Viskoz Kuvvetler.

vi
Dedicated to my father and mother Musa and Üner Alp who were my first teachers,
and
to my wife and son K. Özlem Alp and Tuna Alp who are my life pillars.

vii
ACKNOWLEDGEMENTS
I would like to thank to my supervisor for this dissertation Prof. Dr. Serhat AKIN
for his encouragement, orientation, sharing and friendly approach during the course
of my preparation of the present dissertation. Without his intellectual support this
study would not have been done.
I do also thank to Prof. Dr. Mahmut PARLAKTUNA, Prof. Dr. Nurkan
KARAHANOĞLU and Prof. Dr. Tanju MEHMETOĞLU for their contributions and
constructive recommendations during my presentations.
Thanks are extended to and Assistant Prof. Dr. Ġ. Metin MIHÇAKAN for his kind
acceptance to be a member in my examining committee and his contributive review.
Finally, I would like to thank to Petroleum and Natural Gas Engineering Department
staff and Natural and Applied Sciences Institute staff for their kind supports
whenever I was in need.

viii
TABLE OF CONTENTS
ABSTRACT iv
ÖZ ...……………………………………………………………………………… v
ACKNOWLEDGEMENTS …………………………………………………….. vii
TABLE OF CONTENTS ………………………………………………………. viii
LIST OF TABLES ……………………………………………………………… xii
LIST OF FIGURES ……………………………………………………………… xiv
LIST OF SYMBOLS ……………………………………………………………. xvii
LIST OF ABBREVIATIONS …………………………………………………… xx
CHAPTERS
1. INTRODUCTION ……………………………………………………………… 1
1.1. Darcy Flow …………………………………………………………………… 1
1.2. Non-Darcy Effects on Fluid Flow through Porous Media ……………...…… 2
1.3. Description of the Problem …..………………………………………………. 3
1.4. The Importance of the Study ………………………………………………… 3
1.5. The Objective and the Methodology of the Study ………..…….................... 3
1.6. Outline of the Study …………………………………………………………. 4

ix
2. BASIC CONCEPTS …………………………………………………………… 5
2.1 Medium Properties ………………………………………….......................... 5
2.1.1 Rock Properties .……………………………………………………………. 5
2.1.1.1 Porosity ………………………………………………………………….. 5
2.1.1.2 Permeability ……………………………………………………………… 6
2.1.1.2.1 Absolute Permeability ...……………………………………………….. 6
2.1.1.2.2 Effective Permeability ………………………………………………… 6
2.1.1.2.3 Relative Permeability …………………………………………………. 6
2.1.1.2.4 Vertical Permeability …………………………………………………. 8
2.1.1.2.5 Horizontal Permeability ……………………………………………… 8
2.1.1.3 Tortuosity ………………………………………………………………. 8
2.1.1.4 Wettability and Wetting ………………………………………………… 8
2.1.2 Fluid Properties …………………………………………………………… 9
2.1.2.1 Saturation ………………………………………………….……………. 9
2.1.2.2 Density, Specific Volume, Specific Gravity, Specific Weight ……….. 9
2.1.2.3 Viscosity (Dynamic and Kinematic) …………………………………… 10
2.1.2.4 Mobility and Mobility Ratio ……………………………………………. 13
2.1.2.5 Compressibility ………………………………………………………… 13
2.1.3 Fluid Saturated Rock Properties …………………………………………. 14
2.1.3.1 Surface Tension and Interfacial Tension Phenomena …………………. 14

x
3. LITERATURE SURVEY OF NON-DARCY EFFECT ON FLUID FLOW
THROUGH POROUS MEDIA ………………………………………………… 16
3.1. Anisotropic Effects …………………………………………..……..………. 17
3.2. Multi-Phase and Phase Behavior Effects ………....……………………….. 19
3.3. Fracture Effects …………………………………………………………….. 25
3.4. Well Completion and Skin Effects ………………………………………… 29
3.5. Flow Rate Effects …………….................................................................... 30
3.6. Thermal Effects …………………………………………………………….. 31
3.7. Model Studies on Non-Darcy Effects ……………………………………… 33
3.8. Correlations of Non-Darcy Flow Effects …………………………………... 34
4. STATEMENT OF THE PROBLEM ………………………………..……….. 36
5. THEORY IN MODELLING OF THE PROBLEM ………………...………. 37
5.1. Assumptions ……………………………………………………………….. 37
5.2. Sawyer-Brown Method …………………………………………………….. 37
5.3. Al Hossainy – Ramey Approach by Pseudo Pressure ……………………… 38
5.4. Viscosity Correlations ……………………………………………………… 39
5.5. Density Correlations ……………………………………………………….. 41
5.6. Al-Marhoun Correlation …………………………………………………… 42
6. METHOD OF SOLUTION …………………………………………………… 44
7. RESULTS AND DISCUSSIONS …………………...………………………… 51
8. CONCLUSIONS ………………………………………………………………. 72

xi
9. RECOMMENDATIONS ……………………………………………………… 73
REFERENCES …………………………………………………………………… 74
APPENDICIES …………………………………………………………………… 83
A. NORTH MARMARA GAS FIELD ………………………………………….. 83
B. TABLES ……………………………………………………….……………… 88
C. CMG IMEX OUTPUT DATA ………………………………………………. 97
Curriculum Vitae .................................................................................................. 129

xii
LIST OF TABLES
Table 2.1. Oil and water relative permeability behavior against water saturation . 7
Table 2.2. Temperature effect on liquid and gas viscosities……………………… 12
Table 6.1. Well test results for KM-1A ………………………………………….. 47
Table 6.2. Comparison of simulated reservoir pressures with calculated pressures
by calibration for KM-1A well ……………………………………………………. 49
Table B.1. KM-1A Porosity & Permeability readings from Density Log ……….. 88
Table B.2. KM-1A Production Data ……………………………………………… 91
Table B.3. KM-1A Average Petro-physical Characteristics ……………………… 93
Table B.4. KM-1A Initial Conditions …………………………………………….. 93
Table B.5. Indigenous Reservoir Gas Composition ……………………………… 94
Table B.6. Russian Gas Composition …………………………………………….. 94
Table B.7. PVT Properties ……………………………………………………….. 95
Table B.8. Solution Gas Oil Ratio, Rs …………………………………………… 96
Table C.1. Numerical simulation results for assumed Skin 0 ……………………. 97
Table C.2. Numerical simulation results for assumed Skin 5 …………………… 104
Table C.3. Numerical simulation results for assumed Skin 10 …………………. 111
Table C.4. Numerical simulation results for assumed Skin 33.3 ……………….. 118
Table C.5. Results for estimate of pseudo-steady-state radial gas flow in
reservoir by Sawyer-Brown Method …………………………………………… 125

xiii
Table C.6. Results for the estimate of pseudo-steady-state radial gas flow at bottom-
hole by Sawyer-Brown Method …………………………………………………127

xiv
LIST OF FIGURES
Figure 2.1. Relative permeability versus water saturation ……………………….. 7
Figure 6.1. Grid top view for single and vertical well through porous medium … 45
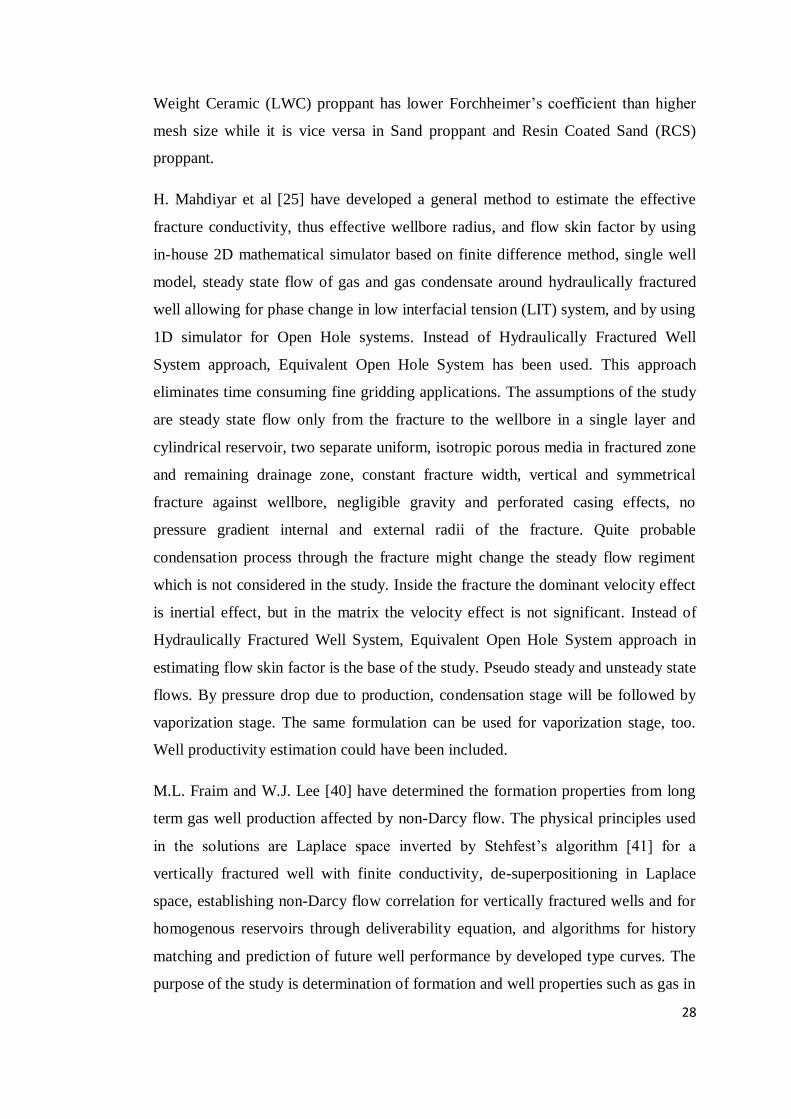
Figure 6.2. Three-dimensional grid view for a single and vertical well through
porous medium ………………………………………………………………….. 46
Figure 6.3. Bottom-hole pressure versus flow rate ……………………………... 48
Figure 6.4. Calibration error obtained from well test for KM-1A well ………… 50
Figure 7.1. Permeability and Porosity relation for KM 1A ……………………. 52
Figure 7.2. Average production rates of KM 1A ……………………………… 53
Figure 7.3. Cumulative production of KM 1A …………………………………. 53
Figure 7.4. Wellhead Pressure behavior of KM 1A …………………………… 54
Figure 7.5. Gas Viscosity (µg) versus Pressure …………………………………. 55
Figure 7.6. Gas Deviation Factor (z) versus Pressure …………………………. 55
Figure 7.7. Calculated Solution Gas Ratio (Rs) versus Pressure ……………… 56
Figure 7.8. Bottom-hole pressure behavior for Darcy flow at Skin 0…………. 58
Figure 7.9. Bottom-hole pressure behavior for non-Darcy flow by FG1
Correlation at Skin 0 …………………………………………………………… 58
Figure 7.10. Bottom-hole pressure behavior for non-Darcy flow by FG2
Correlation at Skin 0 …………………………………………………………….. 59
Figure 7.11. Bottom-hole pressure behavior for non-Darcy flow by Geertsma
Correlation at Skin 0 …………………………………………………………….. 59
xv
Figure 7.12. Bottom-hole pressure behavior for Darcy flow at Skin 5 …………. 60
Figure 7.13. Bottom-hole pressure behavior for non-Darcy flow by FG1
Correlation at Skin 5 …………………………………………………………….. 60
Figure 7.14. Bottom-hole pressure behavior for non-Darcy flow by FG2
Correlation at Skin 5 ……………………………………………………………… 61
Figure 7.15. Bottom-hole pressure behavior for non-Darcy flow by Geertsma
Correlation at Skin 5 ..…………………………………………………………….. 61
Figure 7.16. Bottom-hole pressure behavior for Darcy flow at Skin 10 ………… 62
Figure 7.17. Bottom-hole pressure behavior for non-Darcy flow by FG1
Correlation at Skin 10 …………………………………………………………….. 62
Figure 7.18. Bottom-hole pressure behavior for non-Darcy flow by FG2
Correlation at Skin 10 …………………………………………………………….. 63
Figure 7.19. Bottom-hole pressure behavior for non-Darcy flow by Geertsma
Correlation at Skin 10 …………………………………………………………….. 63
Figure 7.20. Bottom-hole pressure behavior for Darcy flow at Skin 33.3 ……... 64
Figure 7.21. Bottom-hole pressure behavior for non-Darcy flow by FG1
Correlation at Skin 33.3 …………………………………………………………… 64
Figure 7.22. Bottom-hole pressure behavior for non-Darcy flow by FG2
Correlation at Skin 33.3 ………………………………………………………….. 65
Figure 7.23. Bottom-hole pressure behavior for non-Darcy flow by Geertsma
Correlation at Skin 33.3 ………………………………………………………….. 65
Figure 7.24. Pressure drop (Pr-Pbh) behavior at Skin 0…………………………. 66
Figure 7.25. Pressure drop (Pr-Pbh) behavior at Skin 5…………………………. 66
Figure 7.26. Pressure drop (Pr-Pbh) behavior at Skin 10………………………… 67

xvi
Figure 7.27. Pressure drop (Pr-Pbh) behavior at Skin 33.3……………………… 67
Figure 7.28. (ΔP2)/q versus q graph to find out Jones’ constant………………… 69
Figure 7.29. Total skin at reservoir versus rate……………………………………. 70
Figure 7.30. Comparison of Reynolds’ Numbers of gas flow through reservoir
and flowing well for KM-1A well of North Marmara gas field …………………. 71

xvii
LIST OF SYMBOLS
Latin:
Symbol Description Dimension Unit
p pressure M/L2 psi
x distance L cm, ft, in
k permeability (absolute) L2 cm2, m2, D, mD
Q fluid flow rate L3/T cm3/sec, bbl/day
A cross sectional area of flow zone L2 cm
2, ft
2, in
2
ko effective oil permeability L2 cm
2, m
2, D, mD
kw effective water permeability L2 cm
2, m
2, D, mD
kg effective gas permeability L2 cm
2, m
2, D, mD
kro relative oil permeability L2/L
2 Dimensionless
krw relative water permeability L2/L
2 Dimensionless
krg relative gas permeability L2/L
2 Dimensionless
kv vertical permeability L2 cm
2, m
2, D, mD
kh horizontal (lateral) permeability L2 cm
2, m
2, D, mD
g earth gravity coefficient
S saturation L3/L
3 Dimensionless
So oil saturation L3/L
3 Dimensionless

xviii
Sg gas saturation L3/L
3 Dimensionless
Sw water saturation L3/L
3 Dimensionless
M mobility ratio [L3T/M]/ [L
3T/M] Dimensionless
c compressibility LT2/M Dimensionless
z gas deviation factor L3/L
3 Dimensionless
Greek:
Symbol Description Dimension Unit
ν superficial velocity L/T cm/s, ft/s
δ differential sign
µ dynamic (absolute) viscosity M/LT cP (centi-Pois)
µo effective oil viscosity M/LT cP (centi-Pois)
µg effective gas viscosity M/LT cP (centi-Pois)
µw effective water viscosity M/LT cP (centi-Pois)
Ø porosity L3/L
3 Percentage
τ tortuosity L/L Dimensionless
ρ density M/L3 kg/m
3, gr/cm
3, ppg
υ specific volume L3/Mm
3/kg, cm
3/gr, gpp
γs specific weight M/ L3 gr/cm
3, N/m
3
β non-Darcy flow coefficient 1/L cm-1
σ shear stress M/LT2
psi

xix
δu/δy shear rate 1/T s-1
ν kinematic viscosity L2/T cm
2/sn, stoke
γ absolute mobility L3T/M cm
2/cP, m
2/cP,
D/cP, mD/cP
γo oil mobility L3T/M cm
2/cP, m
2/cP,
D/cP, mD/cP
γg gas mobility L3T/M cm
2/cP, m
2/cP,
D/cP, mD/cP
γw water mobility L3T/M cm
2/cP, m
2/cP,
D/cP, mD/cP
c compressibility LT2/M Dimensionless
z gas deviation factor L3/ L
3 Dimensionless
Subscripts:
o oil
g gas
w water
r relative
c connate
i irreducible
s specific
v verticle
h horizontal

xx
LIST OF ABBREVIATIONS
ABBREVIATION DESCRIPTION
D Darcy (Unit description of permeability)
mD Mili Darcy (Unit description of permeability)
HC Hydro Carbon

1
CHAPTER 1
INTRODUCTION
Fluid flow through a porous medium has been described by Darcy in 1856 [1].
1.1. Darcy Flow
Darcy has described the fluid flow with following equation known as Darcy’s Law:
ν = - (k/µ)(δp/δx) (Eq. 1.1)
This is a unidirectional, linear, differential relationship between laminar and single
phase water (as a Newtonian fluid) flow through an isotropic aquifer as a porous and
permeable medium, the dynamic viscosity of water and the pressure gradient. Here
“ν” is the superficial velocity, “k” is permeability, δp is pressure differential, “µ” is
viscosity, “δx” is dimension in x direction and “δp/δx” is pressure gradient. The
minus sign at the right hand side of Eq. 1.1 indicates the flow direction from high
pressure to low pressure.
The superficial velocity can be written as:
ν = Q/A (Eq. 1.2)
where “Q” is the fluid flow rate and “A” is the cross sectional area of flow zone.
In Darcy’s equation given in Eq. 1.1, the dynamic viscosity “µ” has a constant value
due to linear relationship where shear stress (as dependent variable) changes by
shear rates (as independent variable).
Fluid flow obeying Darcy’s Law in Eq. 1.1 is called “Darcy Flow”.

2
1.2. Non-Darcy Effects on Fluid Flow Through Porous Media
Some flow characteristics cause deviations from Darcy Flow as described in Eq.1.1.
Darcy has defined the fluid flow with a linear function as velocity (or rate across the
cross-sectional area) versus pressure gradient in equation Eq. 1.1. As long as the
flow rate goes higher, every incremental step in rate increase requires more (for
shear thinning fluids) or less (for shear thickening fluids) energy (here pressure
differential) than one step below. That means the relationship in rate versus pressure
difference is not linear for non-Newtonian fluids. Drilling mud is an evidence for
non-linear viscosity changes as a function of shear rate. In reservoirs, flowing
fluid(s) are not always Newtonian type. That means the viscosity of the flowing
fluid(s) are not constant at different flow rates, but the viscosity in Eq. 1.1 has been
assumed as a constant value. Change in viscosity causes a deviation from Darcy
flow as well.
At high flow rates or in non-Darcy flow conditions, the pressure differential of
Eq.1.1 cannot predict the flow rate accurately. Thus, a deviation starts from Darcy
flow behavior.
On the other hand, flow paths in the pore network are usually not straight. Such pore
configuration is called tortuosity. Again, Eq.1.1 cannot accurately estimate the
required pressure drop due to deviation from unidirectional flow and thus a
deviation from Darcy Law takes place.
In gas reservoirs, flow rates are very high near wellbore regions. High flow rates
may cause high pressure drops, and therefore condensation might start.
Condensation during the flow is another source for a deviation in estimating
pressure drop from Eq.1.1 due to changes in relative permeabilities.
Fluid flow which does not obey Darcy’s Law due to all or alternating combination
of above mentioned reasons is called non-Darcy flow. Non-Darcy term has been
introduced by Forchheimer [2] with the development of following equation:
-(δp/δx) = (µ/k)ν + βρν2 (Eq. 1.3)

3
In Forchheimer equation (Eq.1.3.) the product of βρν2 is an additional quantity to
Darcy’s equation (Eq.1.1). Here, “ρ” is the fluid density and β is the non-Darcy flow
coefficient.
1.3. Description of The Problem
Defining non-Darcy flow coefficient (β in Eq.1.3) has led to numerous research
studies that contributed a wealth of knowledge to the literature regarding fluid flow
through porous media. Although many empirical and theoretical studies have been
published in almost every decade of the last century, a clear definition of non-Darcy
flow coefficient covering all affecting parameters has not been developed yet. Some
attribute it to turbulence [3, 4], and some attribute it to inertial forces [5, 6, 7, 8 and
9].
In this study, the viscosity and gas deviation factors shall be considered as variables
of pressure in finding non-Darcy flow effects.
1.4. The Importance of The Study
In gas reservoirs that produce from vertical wells, as the gas approaches radially to
the well bore, the cross sectional area to flow becomes smaller with reducing
distance, and consequently gas flow velocity increases. As a result, turbulent flow
might initiate which is directly related with flow velocity and gas condensation
might occur. Gas condensate causes a reduction in gas relative permeability, and
thus gas production decreases. This mechanism is important for converted
underground gas storage reservoirs during their production phases.
1.5. The Objective and the Methodology of The Study
The objective of this study is to investigate the non-Darcy flow effects by
considering gas viscosity, gas deviation factor and gas density as variables.
To achieve the objective, first the theory and some basic concepts on fluid flow
through porous media have been emphasized, and then the literature on non-Darcy
fluid flow has been reviewed. On the basis of mentioned theory, concepts and
literature, a new model has been developed by combining several correlations.
4
To verify the model, the field data of North Marmara (Kuzey Marmara)
Underground Gas Storage offshore reservoir located at North West of Turkey have
been implemented to the model, and the model results have been checked against the
field data. This underground gas storage is already depleted gas reservoir and
converted to underground gas storage.
1.6. Outline of The Study
To realize the above mentioned objective and methodology, the basic concepts on
fluid flow through porous media has been emphasized in Chapter 2. The literature
survey on non-Darcy fluid flow has been submitted in Chapter 3. The Statement of
the Problem takes place in Chapter 4 and the Theory in Chapter 5. Method of
Solution is given in Chapter 6 and the Results and Discussions including case study
as implementation of the case study data into the model has been given in Chapter 7.
In Chapter 8 the Conclusions of the study and in Chapter 9 the Recommendations
for new studies are submitted. The list of references is placed following Chapter 9,
and Appendices following the References.

5
CHAPTER 2
BASIC CONCEPTS
Fluid flow through porous media can categorically be investigated in following
outline.
2.1. Medium Properties
The media subject to this dissertation is fluid saturated, sedimentary, overlain and
underlain by impermeable layers, porous and permeable reservoirs.
2.1.1. Rock Properties
In terms of petrophysics and hydrocarbon (HC) exploration, sedimentary rocks can
be sandstones or carbonate rocks. Here, carbonate rocks can be either calcite
(CaCO3) or dolomite (CaMgCO3) type. In sandstones, the electrical load of solid
surface is negatively charged while in carbonates it is positively charged. Major rock
properties defining the fluid flow can be acknowledged as below.
2.1.1.1. Porosity
The average void fraction (in percentage) of the reservoir’s bulk volume is called
porosity. Porosity defines the fluid storage capacity of the reservoir rock. Dimension
of porosity is L3/L
3. Pore space has no any definitive geometrical shape and size.
The distribution of pore space in reservoir rock is not homogeneous. In addition,
pores are interconnected each other by capillary channels. Where the pores are not
connected to each other, they are called ‘dead pores’. The connected porosity of well
drainage areas can be estimated quantitatively by means of well pressure
interference tests [10], and also by lab tests on the core plugs taken from the
reservoir. It is important not to forget that porosity is field wise averagely estimated
datum.

6
2.1.1.2. Permeability
Fluid conductivity through a porous medium is achieved by capillary channels
interconnecting the pores. The average conductivity of a reservoir is called
permeability. Permeability is a tensor quantity. Capillary channels connecting the
pore spaces in reservoirs are usually not straight, with inconstant diameter and their
distribution in a reservoir is not homogeneous.
2.1.1.2.1. Absolute Permeability
The permeability is independent of the nature of the fluid where the pore volumes
are totally saturated with a single phase fluid. Thus, it is called absolute permeability
[11, 12]. Absolute permeability is denoted by Latin letter of “k”, has the dimension
of L2.
2.1.1.2.2. Effective Permeability
Reservoirs are usually saturated with more than one immiscible fluid. These fluids
can be oil, water and/or gas. Absolute permeability is independent of the nature of
saturating fluid in single phase. In case of multiphase existence in the reservoir, the
permeability value becomes a function of individually flowing phase saturation, and
it is called Effective Permeability. Effective permeability is the product of absolute
permeability (k) and the relative permeability of individual phase (kro for oil, krw for
water and krg for gas) at certain saturation. Its dimension is L2.
Effective permeability for oil (ko) : ko = kkro (Eq. 2.1)
Effective permeability for water (kw) : kw = kkrw (Eq. 2.2)
Effective permeability for gas (kg) : kg = kkrg (Eq. 2.3)
2.1.1.2.3. Relative Permeability
Relative permeability is the ratio of effective permeability of a phase to the absolute
permeability of the medium.
Relative permeability for oil (kro) : kro = ko/k (Eq. 2.4)
Relative permeability for water (krw) : krw = kw/k (Eq. 2.5)

7
Relative permeability for gas (krg) : krg = kg/k (Eq. 2.6)
Dimensionally, it is L2/L
2 and dimensionless in unit.
Table 2.1 and Figure 2.1 shows the behavior of oil and water relative permeability
versus water saturation. The data has been taken from Slider H.G. [12]. Here, it is
notable that at a certain water saturation (Sw) the summation of oil relative
permeability (kro) and water relative permeability (krw) does not yield one. On the
other hand, relative permeability of water is zero in the same figure where water
saturation is below 30 %. This is due to rock wettability and the level of connate
water saturation. Similar effect can be observed for oil relative permeability
behavior depending on oil saturation.
Table 2.1: Oil and water relative permeability behavior against water saturation.
Sw, % 30 40 60 80 90 100
kro 0.950 0.625 0.250 0.025 0.000 0.000
krw 0.000 0.020 0.060 0.300 0.600 1.000
Figure 2.1: Relative permeability versus water saturation (Replotted from Slider,
H.G. [12])

8
2.1.1.2.4. Vertical Permeability
Vertical permeability is the fluid conductivity perpendicular to the bedding plane of
stratified reservoir rock. As well as other rock properties, vertical permeability
values vary in micro scale in the reservoir. It is denoted by Latin letter of “kv”.
Dimensionally, it is L2.
2.1.1.2.5. Horizontal (Lateral) Permeability
Horizontal (lateral) permeability is the fluid conductivity parallel to the bedding
planes of stratified reservoir rock. Generally, horizontal permeability has higher
values than vertical permeability. This sounds quite reasonable in terms of
preferential migration paths. Unless otherwise is mentioned, always horizontal
permeability is meant in calculating the rate of fluid production from reservoirs
through wells. All definitions given above for absolute permeability, effective
permeability and relative permeability mean horizontal ones. Horizontal
permeability is denoted by Latin letter of “kh”.
2.1.1.3. Tortuosity
Capillary channels connecting pores are not strait paths. Here, the ratio of the
average path length (L’) to the average strait line distance in between pores (L) is
called tortuosity [12].
τ = L’/ L (Eq. 2.7)
Tortuosity is denoted by Greek symbol of “τ”. Dimensionally, it is L/L and
dimensionless in unit.
2.1.1.4. Wettability and Wetting
Wettability is a rock property although it can be observed when rock contacts with a
fluid. Wetting is fluid property. When adhesive force (inner force between
molecules of two different phases at the contact surface, such as solid and liquid) is
higher than cohesive force (inner force between the molecules of a fluid) then fluid
wets the solid surface. Therefore, wettability is not a function of fluid’s surface
tension, but fluid’s surface tension is a function of adhesive force, and wettability is
the result. On the other hand, the source of cohesive forces is the attraction between

9
the molecules of a fluid. But the source of adhesive forces is defined with the
interaction of contacting surface molecules of a solid with a fluid in contact. The
force balance between adhesive and cohesive forces determines the degree of
wetting [13].
2.1.2. Fluid Properties
2.1.2.1. Saturation
Porous media are sometimes filled with a single phase fluid but sometimes with
multiphase fluids. The porosity percent occupied with any phase of the fluids is
called the saturation for that phase, such as oil saturation (So), water saturation (Sw)
and gas saturation (Sg).
Depending on the wettability character of the reservoir rock and fluid surface
tension, some percent of a fluid saturation is naturally held by solid surface of the
pores. Since this held fluid cannot be recovered without introducing additional
energy into the medium, it is called Irreducible Saturation. Customarily, in oil wet
reservoirs, it is called Irreducible or Residual Oil Saturation (Sio), and in water wet
reservoirs it is called Irreducible or Residual Water Saturation (Scw). Similarly, in
gas reservoirs and in gas cap of oil reservoirs, some percent of gas can be held by
the surface of pores, and this percent of gas saturation is called Irreducible Gas
Saturation (Sig) [12].
2.1.2.2. Density, Specific Volume, Specific Gravity, Specific Weight
Density is defined as the mass of unit volume, and it is dependent on temperature
and pressure [14]. For liquids, density is decreased by increasing temperature, and
increased by increasing pressure. Since liquids are assumed as incompressible fluids,
the change in liquid density by pressure usually is ignored in practical engineering
calculations. For gases, density increases by increasing pressure, but decreases by
increasing temperature.
Density is denoted by Greek letter of “ρ”. Dimensionally, density is M/L3 and
defined as:
ρ = m/V (Eq.2.8)

10
Reciprocal of density is Specific Volume, and it is defined as the volume of unit
mass and is denoted by Greek letter of “υ”. Dimensionally, it is L3/M and
balanced as:
υ = V/m (Eq.2.9)
Specific Gravity of gases is the ratio of the density of a gas at a given temperature
and pressure to the density of air at the same temperature and pressure. Thus, it is
independent of temperature and pressure whereas density is dependent where the gas
obeys the ideal gas law. Therefore specific gravity is more commonly used than
density [14]. Specific Gravity is balanced as:
SG = ρgas / ρair (Eq.2.10)
2.1.2.3. Viscosity (Dynamic & Kinematic)
Viscosity is known as resistance of fluids against flow [15]. Driving mechanism of
fluid flow is the shear stress. Moving molecules exerts an acceleration force.
Viscosity is the ratio of change in shear stress over a change in shear rate under
constant environmental conditions (such as constant pressure, temperature, etc.).
Shear stress is defined by following equation:
σ = µ(δu/δy) (Eq.2.11)
Thus, viscosity is:
µ = σ / (δu/δy) (Eq.2.12)
Here, “µ” is dynamic (or absolute) viscosity with the dimension of M/LT, “σ” is
shear stress with the dimension of M/L, and δu/δy is shear rate (velocity gradient)
with the dimension of 1/T.
The ratio of dynamic viscosity over density is called Kinematic Viscosity:
ν = µ/ρ (Eq.2.13)
In Eq.2.13 “ν” is Kinematic Viscosity with the dimension of L2/T.
For liquids, since they are assumed as incompressible fluids, pressure effect on
dynamic and kinematic viscosities usually have been ignored in practical
11
engineering solutions. Increasing pressure has a tendency to slightly raise the
viscosity of liquids while increasing temperature cause an exponential decrease in
liquids. Increasing temperature reduces cohesive force and increases molecular
interchange. Reducing cohesive force reduces shear stress while increasing
molecular interchange increases shear stress. Mathematically, temperature effect on
liquid viscosity can be expressed as below [15]:
µ = a10b/(T-c)
(Eq.2.14)
Here, “T” is absolute temperature, “a”, “b” and “c” are constants for each liquid and
can be determined experimentally.
For gases, the pressure effect on dynamic viscosity has been assumed as negligible
in practical engineering solutions, but kinematic viscosity has been considered due
to compressibility of gasses by pressure. On the other hand, dynamic viscosities of
gases are increased by increasing temperature. Since cohesive force of gases is low,
its incremental contribution to reduce the gas viscosity by increasing temperature is
lower than the incremental contribution of molecular interchange to increase the
viscosity. Gas viscosity as a function of temperature can be calculated by:
µ = (aT1/2
)/(1+b/T) (Eq.2.15)
Here, “a” and “b” are experimentally determined constants and T is absolute
temperature.
To summarize the temperature effect on liquid and gas viscosities:

12
Table 2.2: Temperature effect on liquid and gas viscosities.
Phases Inner
Characteristics
Incremental
effect of
increasing
temperature
Effect on
shear
stress
Effect on
drag
force
Viscosity
change
Liquid
Cohesive
Forces
High
reduction
High
reduction
High
reduction Decrease
Molecular
Interchange
Low
increase
Low
increase
Low
increase
Gas
Cohesive
Forces
Low
reduction
Low
reduction
Low
reduction Increase
Molecular
Interchange
High
increase
High
increase
High
increase
Depending on the shear stress behavior versus shear rate, fluids can be classified
into two major groups: Newtonian Fluids and Non-Newtonian Fluids.
Newtonian Fluids have zero shear stress when there is no shear rate, and displays a
linear shear stress behavior versus shear rate. Therefore, viscosities of Newtonian
fluids have always constant values and Eq.2.12 applies.
Non-Newtonian Fluids might not have necessarily zero shear stress when there is no
shear rate, and they have nonlinear shear stress behavior versus shear rate.
Therefore, Non-Newtonian Fluids do not have necessarily always constant viscosity
values and Eq.2.12 does not apply. For each one of these fluids, many empirical
viscosity equations have been developed such as Bingham Plastic Viscosity, Power
Law, etc. Mathematically, following empirical equation approach applies for shear
stress of Non-Newtonian fluids:
σ = YP + µ (δu/δy)n (Eq.2.16)
µ = σ/[(δu/δy)n] – YP (Eq.2.17)
In Eq.2.16 and Eq.2.17 YP (Yield Point) and n values must be experimentally
determined for each Non-Newtonian fluid, while in these equations YP = 0 and n =
1 for Newtonian fluids, the resulting equation becomes Eq.2.12.

13
2.1.2.4. Mobility and Mobility Ratio
Mobility of reservoir fluids (in porous medium) is the ratio of permeability over
viscosity [11].
γ = k/µ (Eq.2.18)
Similar ratio is applied to find out effective mobility for oil, gas and water:
γo = ko/µo (Eq.2.19)
γg = kg/µg (Eq.2.20)
γw = kw/µw (Eq.2.21)
In case of fluid displacement by another fluid, the ratio of displacing fluid effective
mobility over displaced fluid effective mobility is called Mobility Ratio (M). As an
example, if oil is displaced by water:
M = γw/γo (Eq.2.22)
2.1.2.5. Compressibility
Volumes and thus densities of materials are dependent of temperature and pressure
of their surrounding environment. As it is very well known by Boyle’s and Charles’
Laws [14], if the product of volume and pressure of an ideal gas is divided by its
temperature, the result is always constant for that gas. Ideal gases obey following
equation:
pV = nRT (Eq.2.23)
Here, p is pressure, V is volume, n is the number of mole, R is universal gas
constant and T is temperature of ideal gas.
Compressibility (c) as a term can be defined as at a constant temperature, the ratio of
incremental volume change (Δυ) to the initial volume (υ0) under initial pressure (p0)
due to change in pressure Δp [16]:
c = -(1/υ0)(dυ/dp)T (Eq.2.24)

14
Minus sign in Eq.2.24 is due to the increasing pressure change (or due to increasing
volume if pressure reduces).
Since the incremental volume change for gases in practical engineering calculations
is not small, gas compressibility values are always considered. In case of ideal gases,
when the pressure is doubled, the volume is halved. But real gases such as natural
hydrocarbon gases deviate from ideal gas compression behavior by a multiplier
called gas deviation factor and usually denoted by “z”.
z = (Actual volume of n mole of gas at T and p)/(Ideal volume of n mole of gas at the same T
and p)
This dimensionless quantity varies usually between 0.70 and 1.20, a value of 1.00
representing ideal behavior [11]. Thus, Eq.2.23 becomes:
pV = znRT (Eq.2.25)
In practical engineering calculations for solids and liquids, since the incremental
volume change due to external pressure is small when compared with gases,
compressibility of solids and liquids is generally assumed as negligible, but actually
they are compressible, too. Hall [16] has experimentally showed that effective rock
compressibility versus porosity of fluid saturated carbonate rocks and sand stones
results almost similar function.
2.1.3. Fluid Saturated Rock Properties
On the base of basic concepts and theories on fluids and rocks, fluid saturated rocks
are investigated as systems.
2.1.3.1. Surface Tension and Interfacial Tension Phenomena
Surface tension is a result of cohesive forces (inner forces) between molecules of a
fluid independent of surrounding medium.
Interfacial tension is the result of adhesive forces in between two liquids at the
contact surface. Here, the contact surface is not a geometrical two dimensional
surface, but it has a thickness at molecular level.

15
Interfacial tension together with wettability of the rock, determine the relative
permeability of a pore surface.
As a result of surface tension, liquids climb or sink by holding the walls of capillary
solid channels depending on the degree of cohesive forces. This is known as
capillary effect of surface tension.

16
CHAPTER 3
LITERATURE SURVEY OF NON-DARCY EFFECTS
ON FLUID FLOW THROUGH POROUS MEDIA
Literature on fluid flow through porous media starts with empirical and
unidirectional Darcy’s Law [1]. Darcy’s law as below is a linear relationship
between laminar and single phase water (as a Newtonian fluid) flow through an
isotropic porous medium, the dynamic viscosity of water and the pressure gradient:
u= -(K/µ)(δp/δx) (Eq. 3.1)
where u is superficial velocity (L/T), K is permeability (L2), p is pressure M/(LT2), µ
is viscosity (M/LT), and x is dimension in x direction (L). In Darcy’s equation given
above the dynamic viscosity has a constant value due to assumed linear relationship
where shear stress (as dependent variable) versus shear rates (as independent
variable).
The deviations from Darcy’s conditions have required numerous contributions to
Darcy’s law since quite early dates up to now.
The very first contribution to Darcy’s Law has done by Jules Dupuit [17] known as
Dupuit Assumption which states that ground water discharge is proportional to the
saturated aquifer thickness.
The most significant and one of the earliest contributions to Darcy’s Law due to
deviations from Darcy’s conditions has been made by P. Forchheimer [2] as below
equation:
-(δp/δx)= (µ/K)u + βρu2 (Eq. 3.2)
where ρ is fluid density (M/L3), and β is the non-Darcy coefficient (1/L). Here β
coefficient has had different names in the literature such as turbulence factor, the
coefficient of inertial resistance, the velocity coefficient, the non-Darcy flow

17
coefficient, the non-Darcy coefficient, the Forchheimer coefficient, the beta factor,
etc.
The deviations from Darcy’s law categorically can be summarized as because of
anisotropy in porous media (three dimensional changes in absolute permeability due
to tortuosity, layers, fractures, etc.), multi phase flow such as gas, liquid and even
sometimes solid flow due to drag forces (non-Newtonian fluid properties, relative
permeability, saturation, wettability, gravity segregation, surface tension, interfacial
tension, miscibility might become definitive), phase changes due to pressure drop
(condensation and vaporization), and high flow rates (turbulence) in different
geometries (linear, cylindrical, semispherical, etc).
In almost every decade of the last century many empirical and theoretical studies
have been published but a clear definition of Non-Darcy flow coefficient covering
all affecting parameters has not been developed yet. As a matter of fact, there is no
common agreement on the causes of nonlinearity between the pressure gradient and
velocity; some scientists attribute it to viscous forces [3], and some attribute it to
inertial forces [4, 5, 6, 7 and 8]. It seems that non-Darcy effect on fluid flow due to
viscous forces has not been adequately quantified yet. Especially, gas condensation
near well bore regions due to turbulent raises the fluid viscosity which will increase
the required pressure drop to flow, and consequently a non-Darcy effect in fluid
flow occurs.
In the last decades, theoretical, numerical and experimental research and
investigations have proceeded for better understanding non-Darcy effects in flow
through porous media on the base of century old accumulated literature.
The survey in literature of non-Darcy flow has been grouped on the basis of non-
Darcy flow effects in this part of the dissertation.
3. 1. Anisotropic Effects:
J.W. Cooper, et all [18] have developed a quantitative relationship between pore
scale anisotropic parameters and non-Darcy flow coefficient, tortuosity and
permeability by single phase and two phase flow experiments on carbonate and sand
stone plugs in addition to numerical simulation. They have solved the connate water

18
saturation effect on non-Darcy coefficient, and in terms of anisotropy, they have
developed a relationship between the product of non-Darcy flow coefficient and
permeability, and permeability tensor and non-Darcy coefficient tensor. In the study
of J.W. Cooper, Klinkenberg effect and turbulence effect have been neglected. The
practical applications of the solutions are to calculate the pressure drop of non-Darcy
flow of gas, and to calculate non-Darcy flow coefficient in single phase and two
phase flows. In case of no experimental data, non-Darcy flow coefficient can be
estimated by submitted correlation. Absence of water saturation and relative
permeability terms are the weakest points of this study.
F.R. Spena and A. Vacca [19] have investigated a potential formulation of non-
linear models of flow through anisotropic porous media by non-linear filtration
model to anisotropic tensor permeability, quadratic and cubic flow models, and
inertial forces derived from dissipation potential. The problem solved by this study
is to generalize one dimensional non-Darcy flow models to three dimensional
through anisotropic porous media. As assumptions of the study, convex potential of
dissipative forces as viscous and drag are definitive on inertial terms, and viscous
forces are collinear with the form drag forces. Due to co-linearity between viscous
and form drag forces, an anisotropic media in terms of porosity and permeability can
be considered as isotropic in terms of inertial forces. The practical application of the
solutions is to extend isotropic non-linear flow models to anisotropic porous media.
The transition from linear Darcy regime to non-linear Forchheimer’s regime is
gradual due to the convexity of mechanically dissipative potential of viscous and
form drag forces, and thus from Forchheimer’s regime (local turbulence) to Frauds
regime (turbulence dominated inertial terms) as well. The magnitude of collinear
viscous forces and form drag forces depends on the non-negative scalar function of
the magnitude of seepage velocity. A consistent and general non-linear anisotropic
flow model has been obtained. Physical properties of the fluids in the reservoir are
considered as constant. Phase behavior of fluids in the pore is not considered. What
happens at the high level of Fraud regime? The disintegration of the rock! If so,
submitted formulation can mathematically explain the mechanism of artificial
fracturing of the reservoir. It can be extended for multiphase flow by implementing
saturation and relative permeability terms. It can be applied to analyze the water
19
influx into the reservoir to the conceptually analogical problems in different
engineering disciplines.
C.A.P. Tavares, et al [33] have studied the combined effect of non-Darcy flow and
formation damage on gas well performance of dual-porosity and dual-permeability
reservoirs by analytical solution and finite difference 2D simulation for single well
with cylindrical grid geometry. An interpretation of pressure drawdown, buildup and
isochronal tests in dual-porosity and dual-permeability reservoirs with non-Darcy
flow which causes high local velocities has been developed. Non-Darcy flow
coefficient has been calculated by Jones’ correlation [34]. Vertical and single well
production and steady state radial flow have been assumed. The model is modifiable
for other geometries. It has been seen that conventional interpretation of the early
time data in dual-porosity and dual-permeability reservoirs with non-Darcy flow
effect may lead errors. Combined effect of non-Darcy flow and physical skin
damage as effective damage has expectedly been calculated higher than input
physical damage. In high initial reservoir pressure systems, non-Darcy flow effect
starts at high flow rates while in low initial reservoir pressure systems at low flow
rates due to the higher gas densities in higher pressure systems. Non-Darcy flow
effect is highly susceptible to physical skin damage. In all scenarios, at similar flow
rates, calculated effective skin damages have been found higher than the input
physical skin damages. Dual porosity cause higher calculated effective skin than
dual permeability does.
3.2. Multi-phase and phase behavior effects:
M.I. Dickens, et al [26] have investigated the impact of gravity segregation on
multiphase non-Darcy flow in hydraulically fractured gas wells. Reservoir
simulation has been used under three situations: uniform influx flow conditions,
long term water production due to an initial mobile water saturation, and cleanup of
a gas well following hydraulic fracture stimulation. Geertsma’s correlation [72] has
been applied which has been applied to the case study took place in this dissertation
and explained in “Theory in Modeling of the Problem” (Chapter 5). The study has
been handled under the assumptions of steady state flow, homogenous reservoir,
uniform water saturation, constant bottom hole pressure, the influx to the fracture by

20
reservoir depletion rather than the forced influx when studying fractured gas well
with production of mobile water, complete gravity segregation requiring low
pressure drop in horizontal direction compared to the buoyancy forces in the vertical
direction, the complete segregation as inconsistent with gas entry into the highly
water saturated zone at the bottom, linear relative permeability in hydraulic fractures
requiring zero residual water saturation, and Forchheimer equation satisfying to
calculate gas resistance factor as a measure of non-Darcy effect. Assumptions do not
consider pressure drop in the fracture which can cause condensation of gas phase
and as a result it will create a third phase of condensate in addition to existing gas
and water. Darcy or non-Darcy flow and linear and non-linear relative permeability
have been checked to see the changes in effective permeability and effective
conductivity due to mixed or segregated flows within the fractures. When non-linear
relative permeability (with a Corey exponent of 2) and non-Darcy flow (with
Geertsma’s correlation) are modeled for mixed flow, effective permeability is found
as 39% lower and pressure drop is 39 % higher than segregated flow case. When
Darcy flow and linear relative permeability is modeled for mixed flow, the loss in
effective permeability and pressure drop have been found negligible (1.2 %) by
comparing with segregated flow. In case of mixed flow, non-linear relative
permeability with Darcy flow reduces effective relative permeability (25 % loss)
more than non-Darcy flow with linear relative permeability (13 % loss). In case of
non-linear relative permeability with Darcy flow the pressure drop (43 %) is higher
than linear relative permeability and non-Darcy flow (14 %). Effective
dimensionless conductivity in mixed flow is lower than in segregated flow. In mixed
flow case, Non-linear relative permeability with Darcy flow cause more loss in
effective dimensionless conductivity (41 %) than in non-Darcy flow with linear
permeability (21 %). But the loss in productivity due to Darcy flow and linear
relative permeability in mixed flow is negligible (1.3 %) and the loss in effective
conductivity is about 10 %. Multiphase and non-Darcy flow effects in hydraulically
fractured gas wells reduce effective fracture conductivity. By ignoring gravity
segregation, effective fracture conductivity can be underestimated by up to a factor
of 2 when fracture relative permeability is non-linear and non-Darcy flow effect
exists. Multiphase and non-Darcy flow effects in hydraulically fractured gas wells
increase the pressure drop down the fracture and consequently reduce the effective

21
fracture conductivity of the proppant. Effective permeability reduction caused by
non-Darcy flow can be compensated by choosing a higher permeability proppant.
Fredrick and Graves’ 1st correlation (1994) underestimates non-Darcy flow effect,
thus it should not be used in hydraulic fracture studies especially for high
permeability proppant packs. The difference in effective fracture conductivity
between two phase mixed flow and segregated flow models quantifies the amount of
present segregation effects. The pressure gradient is inversely proportional to
effective permeability, but also proportional to the flow rate. A relative increase in
total pressure drop is related to a relative decrease in effective conductivity.
Segregation increases by increasing conductivity in the fracture or by decreasing
ratio of fracture length to fracture height. When the vertical over horizontal pressure
gradient decreases the gravity segregation increases. The impact of segregation
effects is largely caused by relative permeability and non-Darcy flow. Water/gas
ratio does not significantly affect the difference in effective conductivity between
mixed and segregated flow. Water/gas ratio does not affect the average pressure
gradient in the fracture. Roughly one third of effective permeability in the fracture is
lost due to mixed flow by comparing with segregated flow. As the water saturation
decreases, the effective gas permeability decreases at greater than a linear rate with
water saturation. Non-linearity due to relative permeability has greater effect on
pressure drop and effective permeability than non-linearity due to non-Darcy flow.
Effective conductivity and as a result productivity is more susceptible to non-Darcy
flow and non-linear relative permeability than phase segregation effect due to
gravity. By considering changes in phase saturation due to condensation,
vaporization, the study can be extended. The chosen proppant and transporting fluid
type is not defined. Quantitative results for each permutated scenario for certain type
of proppant and transporting fluid will help in proppant and transporting fluid
selection.
L. Jin and G.S. Penny [27] have investigated two phase non-Darcy gas flow through
proppant Packs by experimental study under the assumptions of no gas
condensation, constant gas and liquid densities under different pressures, and linear
flow geometry. Under the mentioned assumptions, conductivity of proppant packs
under two phase and non-Darcy flow, and coefficient of inertial resistance β have

22
been predicted. By using the predicted values, mobile liquid saturation at certain
gas-liquid flow rate, and the relative permeability of proppant pack by considering
non-Darcy and two phase flow effects can be calculated. On the other hand, it
provides some eye opener hints to understand fracturing fluid clean up process and
proppant flow back mechanism under the effect of two phase flow. In case of dry
gas flow Forchheimer’s correlation works fine, but increasing liquid saturation in
two phase flow starts deviation from the Forchheimer’s correlation.
R.D. Evans and C.S. Hudson [28] have showed the effect of immobile liquid
saturation on the non-Darcy flow coefficient in porous media under multiphase
conditions by experimental approach with the assumptions of unidirectional linear
flow, constant viscosity, density and gas deviation factor. Study submits a
correlation to predict non-Darcy coefficient as a function of rock and fluid properties
for multiphase flow. Viscosity and density are functions of pressure. Especially
gases are more susceptible to pressure than liquids in terms of viscosity and density.
β calculated at given density will be deviated by changing density due to changing
pressure differential. In addition to density change, the effect of changing viscosity
altogether will cause a deviation from Forchheimer’s Equation results. The practical
application of the solution is to find out the value of non-Darcy flow coefficient in
sand stones under immobile liquid saturation multiphase flow by using the
correlation developed in this experimental study. To estimate the value of β,
Geertsma Equation is valid for certain range of permeability and porosity. β
increases by increasing liquid saturation, and by decreasing permeability and
porosity under the immobile multiphase flow. At a constant temperature, a unique
relationship exists between β and the effective gas permeability, porosity, liquid
saturation and effective overburden pressure. Using β values from published
correlations (such as Janicek-Katz correlation) as function of porosity and
permeability might give wrong estimations since these correlations does not
consider the lithology changes. Therefore β should be developed for the particular
rock in question. For different porosity and permeability values, the comparisons of
Janicek-Katz correlation, the results of Geertsma Equation and the results of this
study have been evaluated and submitted by graphs. Immobile liquid saturations
reduces the value of β. Janicek-Katz correlation has been developed for carbonate

23
formations. Geertsma Equation has been developed for sand stone with zero
immobile saturation. Changing lithology and multiphase flow conditions require
specific solution to estimate the value of β. Therefore, the comparison of the results
of this experimental work with Janicek-Katz correlation and with Geertsma
Equation is like comparing apples with oranges. If there is no any other choice to
estimate the value of β, the results of Janicek-Katz correlation should be preferred to
Geertsma Equation up to roughly 500 mD of permeability. At higher permeability
values, lab experiments should be run to estimate the value of β. Similar
experiments should be run for carbonate cores. Proposed experiments can be rerun
by using a certain natural gas composition representing world average (instead of
nitrogen) and crude oil samples at certain ranges of viscosities and API gravities
(instead of glycerin) to obtain more general and more reliable correlations to find
out the value of β. The concepts used in the solutions could be applied to find out
mechanical skin effect on well productivity.
R.D. Barree and M.W. Conway (2007) [29] have investigated multiphase non-Darcy
flow in proppant packs by laboratory experiments under the assumption of no phase
change during the process. Multiphase flow conditions are implemented to the
generalized equation for single phase non-Darcy flow. The solution can be used to
predict non-Darcy multiphase flow coefficients in proppant packs under mentioned
assumption. The value of the mean particle diameter T is constant for proppant
packs and it is not affected by experimental conditions, unlike inertial flow
coefficient β. The value of the mean particle diameter T can be determined by
T=1(kdβ) where kd is constant Darcy permeability in Darcy, at flow ranges where the
deviation from Forchheimer’s equation is small. The transition constant can also be
calculated by T=ρν/µ from the Forchheimer plot when the linear Forchheimer curve
is exactly twice the y-axis intercept value. The introduced transition constant T has
been calculated as 1/(2Dm) where Dm is mean particle in cm. In reservoir scale, the
mean particle diameter can be calculated closely only for proppants, but not for
naturally occurred heterogeneous reservoir rocks. Applying the non-Darcy equation
with transition constant instead of inertial flow coefficient β to high velocity
multiphase flow in reservoirs might result erroneous. The transition constant
determination from Forchheimer plot is applicable only in the laboratory but cannot

24
represent the reservoir, and it cannot be determined at site. Proposed method can be
applied to the porous and permeable media where particle size distributions are
precisely predictable. If the wellhead multiphase rates can be translated to certain
proppant pack saturations and flow capacities, then by analogy the submitted
method can be applied to field cases to predict non-Darcy multiphase phase flow
coefficients.
B. Ramirez, et all [20] have investigated non-Darcy flow in presence of retrograde
condensation behavior and analyzed short term pressure transient tests in naturally
fractured reservoirs by using single well compositional simulation. Reservoir
pressure has been assumed above the dew point pressure, but below in near the
wellbore to create non-Darcy flow. The practical use of this investigation is that,
non-Darcy flow skin to be calculated under the presence of condensation in dual
porosity and dual permeability reservoirs. Just by reducing the reservoir pressure
more in near wellbore, non-Darcy effect in evaporation phase could also have been
investigated.
F. Zeng and G. Zhao [35] have studied “gas well production analysis with non-
Darcy flow and real-gas PVT behavior” by semi-analytical model integrated with
pressure dependent gas properties and validated by finite difference method. Single
gas production well located at the center of a closed circular reservoir and radial gas
flow has been assumed. Study results allow to identify gas production rate behavior
with non-Darcy flow, and to quantify normalized viscosity, Forchheimer number
and the product of normalized gas viscosity and compressibility. Viscosity variation
increases non-Darcy flow, lowers initial production rate and it has little effect on the
production decline rate. In boundary dominated period, a large production decline
rate identifies non-Darcy flow effect. The greater non-Darcy flow, relatively the
longer steady production period. The greater the non-Darcy flow, the lower the
initial production rate and the larger the decline rate. Fetkovich’s [36] type curves
cannot be used where non-Darcy flow exists in the reservoir, because they
underestimate reservoir permeability, overestimate well skin factor and misinterpret
reservoir drainage area, thus the reservoir volume. In transient flow period, non-
Darcy flow reduces the gas flow velocity in the reservoir, thus to deplete the
reservoir takes longer time, and steady production period will be longer. In boundary

25
dominated period, the reservoir pressure won’t be enough to support additional
pressure drop required by Forchheimer’s inertial term, thus a larger decline rate
occurs. During the boundary dominated period, at a certain skin with zero non-
Darcy flow causes small production decline rate while at zero skin with a certain
non-Darcy flow causes large decline rate. This phenomenon identifies the non-
Darcy flow existence from the production data. At high Forchheimer’s inertial term,
traditional quadratic equation of Al Hussainy [37] derived from Ramey’s [38]
equation overestimates the production decline rate, while it gives good results under
Darcy flow. During the boundary dominated period, dimensionless normalized
viscosity and compressibility product gives smaller production decline rate than
Carter’s [39] model while in early time Carter’s model gives small overestimation.
In comparison of ideal gas and real gas behaviors of viscosity and compressibility
product as a function of production time, in early time both gasses gives almost the
same production rate decline, but in boundary dominated late time, ideal gas shows
higher production decline rate than the real gas. Normalized viscosity variation by
pressure has large effect on initial production rate but small effect in boundary
dominated period. By decreasing pressure, increasing viscosity enhances non-Darcy
flow. Non-Darcy flow in the reservoir is dominant if parameter b (reciprocal of
decline curve exponent) in Arp’s decline equation is less than its base value (b*)
which can be observed as steeper production decline rate than exponential decline
rate. Hence Forchheimer’s number takes place in the equations. If b value is higher
than b*, it is difficult to identify if non-Darcy flow exists or not. If they are almost
identical and approaches to 0.5, then it can be said that the flow in the reservoir is
Darcy type. The comparison of ideal gas and real gas in terms of viscosity and
compressibility product, their resulted behavior is expected as a result of general
laws of physics on gas compression and expansion. The solutions/results can be
applied to condensate gas reservoirs, to naturally and/or artificially fractured
reservoirs, and to multiphase flow reservoirs by adding the gravity effect.
3.3. Fracture effects:
J.A. Gil, et all [22] have investigated non-Darcy flow to design and evaluate
fractured well tests incorporating wellbore storage by semi-analytical method,
correlation and guide line, under the assumptions of laterally infinite reservoir,

26
uniform thickness, vertical well intercepted by a fully penetrating hydraulic fracture,
real gas flow, constant and uniform permeability, Darcy flow in reservoir and non-
Darcy flow in fracture, and no mechanical skin. The practical use of this
investigation under assumed conditions are to estimate non-Darcy coefficient,
fracture half length and thus fracture conductivity, magnitude of the skin due to non-
Darcy flow, without running two pressure tests at different production rates. Here,
the critical value is the ratio of “reservoir permeability/fracture permeability”.
Actually, hydraulic fracturing operations are applied in tight reservoirs, that means
mentioned ratio shall be quiet lower than ‘1’ thus reducing the probability of non-
Darcy flow. Mentioned method can be applied to the wells in reservoirs with
naturally occurred low conductivity fractures. Especially in moderately permeable
reservoirs with natural fractures the probability of non-Darcy flow is to be high. In
high deliverability but low productivity wells are also a sign for non-Darcy effect.
T. Friedel and H.D. Voigt [23] have investigated non-Darcy flow in tight-gas
reservoirs (k<0.01 mD) with fractured wells by in-house black oil numerical
simulator containing pressure dependent transmissibility multiplier for permeability
in the matrix and proppant packed fracture, under the assumptions of constant rate
and constant pressure production, vertical well, stress dependent permeability, and
single phase radial flow in addition to permeability less than 0.01 mD. The problem
solved by this study is to identify the role of reservoir and fracture non-Darcy flow
effect on well productivity in fractured tight gas reservoirs by considering
permeability (stress) dependency of inertial flow. Practical application of this study
is to take into account non-Darcy flow coefficient due to stress sensitivity of
reservoir permeability in tight gas reservoirs and fracture closures. Tight gas
reservoirs are stress-sensitive in terms of permeability of reservoir rock and
proppant packed fracture. In both reservoir rock and proppant packed fracture, the
permeability at a certain pressure decreases by decreasing reservoir pressure.
Normally, a decrease in permeability increases the velocity which results an increase
in non-Darcy flow effect. A decrease in permeability as a consequence of increasing
the effective stress is accompanied by a reduction of flow velocities. There is almost
a linear correlation between permeability, non-Darcy coefficients and effective
stress. When the stress dependency, fracture closure and non-Darcy flow effects

27
considered simultaneously, the reduction in productivity is lower than the
summation of mentioned effects considered individually. Permeability dependency
of non-Darcy flow coefficients is masked by stress dependency of permeability and
fracture closure. Inertial flow affects the productivity despite the low gas rates.
Depending on the proppant type, total gas production can reduce in the interval of
21-40% due to non-Darcy flow effects. New type curves have been presented for
non-Darcy flow in fracture and reservoir to predict future well performance. The
permeability sensitivity could have been investigated on the base of fluid’s physical
properties such as density. Mutual interaction effect of stress dependency of
permeability, fracture closure and non-Darcy flow effect requires investigating the
changes in fluid properties as functions of mentioned interacted parameters
individually.
P. Handren, et al [24], have shown the impact of non-Darcy flow on production
from hydraulically fractured wells by Stim-Lab’s SLFrac production model based on
Agarwal type curves and by inputting Lab measurements of incremental pressure
drop due to multiphase and non-Darcy effects into SLFrac production model. The
practical application of this study is to help proppant selection in designing
stimulation for multiphase and non-Darcy flow reservoirs. When selecting a
proppant for hydraulic fracturing, inertial forces in Forchheimer’s term is more
definitive than permeability. Unless non-Darcy and multiphase flow effects are
considered, fracture conductivity predictions will be overestimated, effective
producing fracture half length will be shorter, post stimulation production rates will
be over estimated, proppant selection might be incorrect, production rate from
fractured well will be reduced, total recoverable reserve will be reduced. To
minimize the pressure drop due to non-Darcy effect domination within the fracture,
it is necessary to reduce the inertial forces. The effects of multiphase flow through
fracture are substantial and should not be ignored. Always non-Darcy flow
considerations should be used for predictive purposes. Case studies show that non-
Darcy effects is more significant than multiphase effects on fracture conductivity,
thus in productivity. During fracturing operations in wells with low reservoir
pressure, CO2 should be preferred as transporting fluid instead of cross linked
polymeric fluids not to reduce initial production rate. Lower mesh size of Light
28
Weight Ceramic (LWC) proppant has lower Forchheimer’s coefficient than higher
mesh size while it is vice versa in Sand proppant and Resin Coated Sand (RCS)
proppant.
H. Mahdiyar et al [25] have developed a general method to estimate the effective
fracture conductivity, thus effective wellbore radius, and flow skin factor by using
in-house 2D mathematical simulator based on finite difference method, single well
model, steady state flow of gas and gas condensate around hydraulically fractured
well allowing for phase change in low interfacial tension (LIT) system, and by using
1D simulator for Open Hole systems. Instead of Hydraulically Fractured Well
System approach, Equivalent Open Hole System has been used. This approach
eliminates time consuming fine gridding applications. The assumptions of the study
are steady state flow only from the fracture to the wellbore in a single layer and
cylindrical reservoir, two separate uniform, isotropic porous media in fractured zone
and remaining drainage zone, constant fracture width, vertical and symmetrical
fracture against wellbore, negligible gravity and perforated casing effects, no
pressure gradient internal and external radii of the fracture. Quite probable
condensation process through the fracture might change the steady flow regiment
which is not considered in the study. Inside the fracture the dominant velocity effect
is inertial effect, but in the matrix the velocity effect is not significant. Instead of
Hydraulically Fractured Well System, Equivalent Open Hole System approach in
estimating flow skin factor is the base of the study. Pseudo steady and unsteady state
flows. By pressure drop due to production, condensation stage will be followed by
vaporization stage. The same formulation can be used for vaporization stage, too.
Well productivity estimation could have been included.
M.L. Fraim and W.J. Lee [40] have determined the formation properties from long
term gas well production affected by non-Darcy flow. The physical principles used
in the solutions are Laplace space inverted by Stehfest’s algorithm [41] for a
vertically fractured well with finite conductivity, de-superpositioning in Laplace
space, establishing non-Darcy flow correlation for vertically fractured wells and for
homogenous reservoirs through deliverability equation, and algorithms for history
matching and prediction of future well performance by developed type curves. The
purpose of the study is determination of formation and well properties such as gas in

29
place, drainage area, effective wellbore radius or half length of hydraulic fractures
etc. by considering non-Darcy flow effect through developed type curves. Vertically
fractured well located at the center of a unit square shaped homogenous and bonded
reservoir, and finite conductivity for fractures have been assumed in the study. The
practical applications of the solutions are the estimation of formation and well
properties such as gas in place, drainage area, half length of hydraulic fractures etc.
through developed type curves, modeling non-Darcy flow in the fracture of hydro
fractured wells and in the formation of un-fractured wells, and modeling gas
property changes as a function of pressure. By having the data of transient time and
late time, and by reflecting them on developed type curves, following reservoir
properties can be determined: Drainage area of the reservoir, fracture half length in
fractured reservoirs, gas in place, reservoir permeability. As of today’s literature, so
many other variables have been added to this kind of early dated efforts. No doubt, it
helped many reservoir engineers in approximately estimating some reservoir
characteristics such as reserve estimation, fracture half length calculation, etc. in the
last decade.
3.4. Well completion and skin effects:
J. Hagoort [30] has developed an improved model for estimating flow impairment
by perforation damage. Method estimates perforation damage skin factor in two
components as reduction in permeability and increase in non-Darcy flow. McLeod’s
inflow model [31] has been used in the study but instead of radial geometry, prolate
spheroidal flow geometry has been applied in the numerical model. The assumptions
of the solutions are prolate spheroidal flow geometry, steady state flow, straight,
elongated, circular perforation holes are perpendicular to the wellbore and
concentrically surrounded by a damaged zone of crushed and compacted rock due to
perforation operation, and lower permeability and higher inertial resistance
coefficient (non-Darcy flow coefficient) exist in perforation damage zone. Assumed
flow geometry toward perforation hole is more realistic than cylindrical flow
geometry. The practical applications of the solutions are to estimate the perforation
effect on productivity of a perforated well and better understanding of the impact of
crushed zone on the flow efficiency of individual perforations. Potential for non-
Darcy flow in perforated wells is higher than in open-hole completions. Non-Darcy

30
skin calculated in prolate spheroidal flow geometry is 1.4 times greater than found
by radial flow geometry of McLeod’s [31] flow model. For a single perforation,
prolate spheroidal flow geometry can be more realistic than radial flow geometry.
But mostly the perforation configurations are designed as spiral spacing through the
pay zone, which cause helical flow paths around the perforation holes in the pay
zone near wellbore. When the same well is in service for both injection and
production in sequential time intervals such as underground gas storage wells, the
crushed zone will act as a membrane against flow. Membranes have two sides with
different contamination levels. The plot of flow rate versus pressure difference to
maintain the fluid flow for injection period and for withdrawal period will create a
hysteresis due to different contamination levels of membrane sides. By using the
method introduced in this study, or by considering helical flow paths in
quantification of mentioned hysteresis, flow impairment by perforation damage can
be estimated.
J.P. Spivey, et all [21], have estimated non-Darcy flow coefficient from a single
pressure build up test data following constant rate production in perforated cased
completion with constant wellbore storage, infinite acting radial flow by using
algorithm derived from diffusivity equation and by constructing type curves for
build up tests with non-Darcy skin factor. Since the assumption implies non-Darcy
flow occurrence through the perforation channels, the results are not reasonable for
naturally or artificially fractured wells, in vugular or vertically layered anisotropic
porous media, or in tight reservoir rocks. The results obtained by this method in
wells satisfying the assumed conditions, can be used in identifying candidate wells
for stimulation and in making more reliable decisions for proposing workover.
3.5. Flow rate effects:
M. Fourar, et al [32] have investigated inertia effects in high-rate flow through
heterogeneous porous media by using numerical simulator. The assumptions of the
investigation are that the flow is governed by Forchheimer’s equation, the fluids are
compressible, and the media are serial layered, parallel layered and correlated.
Heterogeneous permeability effect on high rate velocity flows in porous media is the
focusing point of the study. A theoretical relationship has been proposed for the

31
inertial coefficient as a function of Reynolds’ Number and the characteristics of the
media. For the serial layers, the effective inertial coefficient is independent of
Reynolds’ Number and decreases by the increasing ratio of variance and the mean
permeability. For the parallel layers (stratified porous media) and correlated media,
the effective inertial coefficient is a function of Reynolds’ Number and increases by
the increasing ratio of variance and the mean permeability. Effective inertial
coefficient is constant only for parallel type layers. Inertial effects reduce the
permeability in high flow velocity zones more than in low flow velocity zones. In
stratified porous media high Reynolds’ Numbers have a tendency to establish a
uniformly low effective permeability field. This study is a contribution to
Forchheimer’s equation by investigating the coefficient inertia effect as a function of
Reynolds’ Number, particularly velocity, in heterogeneous porous media. The
solutions/results could be extended or improved by effective inertial coefficient to
be investigated as functions of the mean permeability and the standard deviation.
The same methodology should be applied to the cases of gas phase, multiphase, and
condensation occurrence. It can also be applied to the corresponding problems in
hydrology, geothermal energy and chemical engineering.
3.6. Thermal effects:
P.V.S.N. Murthy, P. Singh [43] have studied heat and mass transfer by natural
convection in a non-Darcy porous medium by similarity solution and specified
power function of mass flux. In the study, constant wall temperature which is higher
than the ambient temperature, homogeneous fluid saturation in isotropic porous
medium has been assumed. The problems solved by this study are to find out the
effects of Grashof Number [44] as “Buoyancy Force / Viscose Force” representing
the inertial effects in the porous medium, Buoyancy Ratio, Lewis Number [45]
representing the diffusivity ratio (Le=α/D) and Surface Mass Flux on non-
dimensional heat and mass transfer coefficients, and to find out the effect of lateral
mass flux on the free convection heat and mass transfer from a vertical wall in a
fluid saturated porous medium with Forchheimer flow model. The practical
applications of the solutions are generally geothermal reservoir engineering, thermal
oil recovery methods. As the mass flux parameter moves from the injection domain
to the suction domain the Nusselt [46] Number as “Total Heat Transfer / Conductive

32
Heat Transfer” and Sherwood Number [47] as “Mass Diffusivity / Molecular
Diffusivity” increase while they decrease in the Forchheimer flow region. Increasing
diffusivity ratio (Lewis number) increases mass transfer coefficient (Sherwood
number) to a certain degree depending on the buoyancy ratio parameter and on
intensity of injection parameter and then further increase in Lewis number cause a
reduction in mass transfer coefficient in case of fluid injection. Increasing inertial
effects reduces the flow intensity, and heat and mass transfer coefficients. Increasing
diffusivity ratio (Lewis Number) decreases the heat transfer coefficient, increases
the mass transfer coefficient. Fluid suction increases heat and mass transfer. At a
constant inertia effect and Buoyancy Ratio, as the diffusivity ratio increases the heat
transfer coefficient (Nusselt number) decreases but mass transfer coefficient
(Sherwood number) increases for the suction period. All mentioned results are
reasonable for the first suction/injection cycle. The fluid flow through the wall will
clean the outer wall from contamination. Thus in the second cycle, fluid will flow
through cleaned wall. The solutions/results could be extended or improved by
repeating the process for several cycles. The concepts used in the solutions could be
applied to underground gas storage operations.
P.V.S.N. Murthy, P. Singh [48] have also studied thermal dispersion effects on non-
Darcy convection with lateral mass flux by method of similarity, numerical
integration by fourth order of Runge-Kutta [49] and Newton-Raphson [50] methods
for proper initial guess value. The assumptions of the study are the medium
governing by Forchheimer extension, thermal diffusivity constant as the sum of
molecular diffusivity and the dispersion thermal diffusivity due to mechanical
thermal dispersion, velocity distribution of suction or injection as a power law
function of distance, isothermal hot wall permeable for lateral mass flux, and higher
wall temperature than ambient. The problems solved by this study are the impact of
thermal dispersion with lateral mass flux on non-Darcy in fluid saturated porous
media, and the combined effect of thermal dispersion and fluid suction/injection on
the heat transfer rate. The results can be applied in geothermal applications and
thermal oil recovery applications. Similarity solution is possible only for uniformly
heated hot wall with injection/suction velocity as a function of Ax1/2
. Increasing
thermal dispersion coefficient increases heat transfer. The heat transfer rate increases

33
as the mass flux parameter passes from injection domain to suction domain.
Reservoir rocks are expandable by heat as well as liquids. Therefore the porosity and
permeability of the porous media are also temperature dependent. Porosity and
permeability should be taken as temperature dependent.
3.7. Model studies of non-Darcy effects:
F. Zeng and G. Zhao [42] have developed a semi-analytical model for reservoirs
with Forchheimer’s non-Darcy flow on transient pressure behavior. Vertical well,
infinite acting homogeneous reservoir, steady state radial flow, constant wellbore
storage and constant skin factor have been assumed. The problems solved by this
study are to predict non-Darcy flow effect not only at the completions but also in the
reservoir region of several hundred times of wellbore radius, to supply type curves
for pressure build up and drawdown tests, and to estimate the skin factor for non-
Darcy flow across completions and the dimensionless Forchheimer number for non-
Darcy flow in the reservoir by common drawdown, buildup and variable rate tests.
The practical applications of the solutions are to identify the existence of non-Darcy
flow in the reservoir, and to estimate non-Darcy flow parameters both in the
reservoir and across the completion by using conventional well pressure tests. The
pressure drawdown test curves reflect larger transition periods with lesser slope
when non-Darcy flow is considered in the reservoir and at the completions, and on
the other hand, pressure build up test curves reflect less transition period and steeper
slopes. Permeability is dominant factor in defining inertial factor. The difference in
permeabilities of reservoir and completion area can be quite different due to
perforation, damage or stimulation, so can the inertial factor. Thus, the flow
equation for completion area should have different parameters than that for the
reservoir. The model and algorithm used in this study can be applied to gas
condensate and multiphase flow cases. For drawdown and buildup tests with non-
Darcy flow in the reservoir, the pressure derivative curves have tendency to
approach to the constant of 0.5, in radial flow and compared to the cases with only
non-Darcy flow across the completion region. The tendency of pressure derivative
curves to approach to a constant is a diagnostic character of non-Darcy flow
existence in the reservoir. In estimating Forchheimer’s Number for non-Darcy flow
in the reservoir and the skin factor for non-Darcy flow across the completion, the

34
pressure build up tests are more reliable than drawdown tests. This is a very
productive and practical method in identifying and estimating Forchheimer’s
number for non-Darcy flow in the reservoir, non-Darcy flow skin across the
completion, permeability changes at the completion region due to mechanical skins,
perforation and stimulation. The model can be applied for multiphase flows.
Withdrawal and injection periods of gas storage wells can be analyzed by the same
method. Method can be modified for different flow geometries.
S.A. Mathias, et al [51] have developed an approximate solution for Forchheimer
flow to a well by numerical modeling through finite difference, matched asymptotic
expansions, Laplace transformation, and similarity solution for large turbulent flow
dimensionless coefficient. Existence of significant wellbore storage, high turbulence
and infinitesimally small well radius has been assumed. The comparison of finite
difference solution with Sen’s solution [52] gives good match in post linear flow
(turbulent flow), but under estimation in short time (non-Darcy flow) and over
estimation in medium time. The comparison Matched Asymptotic Expansion with
Sen’s solution gives the same match in late time flow but under estimation in short
time and medium time. The comparison of Laplace solution with Sen’s solution
gives almost similar results as in Matched Asymptotic Expansion. The comparison
of Similarity solution with Sen’s solution again submits similar results as above.
Finally, since all solutions are approximations, it is not possible to say which one is
better. Mentioned approximate solutions can be used for post linear flow (late time)
but not for pre linear flow (early time). The best fit curve combining all mentioned
approaches can be more reliable for post linear flow (late time).
3.6. Correlations of non-Darcy flow effects:
F.E. Londono, et al [53] have studied the behavior of gas viscosity and gas density
for hydrocarbon (HC) gases to develop simplified correlations. HC gas viscosity is a
function of pressure, temperature, density and molecular weight, and on the other
hand HC gas density is a function of pressure, temperature and molecular weight as
clearly defined in Equation of State (EOS). On the other hand, since HC gases are
real gases, gas deviation factor (Z) [54, 55] is also a function of pressure,
temperature and density. In investigating HC gas viscosity, authors have considered

35
Jossi, Stiel and Thodos Correlation [56] and Lee, Gonzales and Eakin Correlation
[57].
K.G. Brown and W.K. Sawyer [58] have investigated two surveillance methods for
operators to track the damage including non-Darcy effects in addition to mechanical
skin and total skin. One of them is called Sawyer Brown Method (SB Method), and
the other one is called Minute Rise De-convolution Method (MRD Method). SB
Method has been developed on the base of pseudo steady state radial gas flow. The
main motivation of this study was to find out the path of damage development over
time which might provide considerable insight to the source of the damage. MRD
Method has been developed on the base of real gas law to estimate the flow rate.
The advantages of these two methods are no requirement of service companies or
down-hole equipment, and the wells can be tested at more frequent intervals than
conventional testing methods.
J.P. Spivey, et al [59] have studied how to identify the timing and sources of damage
for underground gas storage wells commonly using wellhead Electronic Flow
Measurement (EFM) systems. Authors have developed new analysis modules to
process extremely large data of EFM systems.

36
CHAPTER 4
STATEMENT OF THE PROBLEM
As a practical method in literature to track the occurrence of damage including non-
Darcy effect, Kenneth G. Brown and Walter K. Sawyer in 2002 [58] have developed
a method called “Sawyer-Brown Method” (SB Method). The theoretical base of SB
Method is pseudo steady state radial gas flow.
As explained in Chapter 5 in detail, in solving pseudo steady state radial gas flow by
SB Method, gas viscosity dependent constants have been used although they are
functions of gas viscosity and gas compressibility which are dependent variables of
pressure, temperature, density and molecular weight. In the last decade, following
SB Method which has been introduced in 2002, no new contribution has been done
to the mentioned method. The major objective and new contribution of this
dissertation is to investigate non-Darcy effect by considering gas viscosity, gas
deviation factor and gas density as dependent variable of pressure and temperature.
As explained in Chapter 8, fluid flow in the reservoir has been assumed as
isothermal. Therefore, viscosity, deviation factor and density of gas have been
assumed as dependent variable of pressure. To achieve the objective of this
dissertation, Jossi, Stiel and Thodos Correlation (JST Correlation) [56], implicit
model of Londono-Archer-Blasingame [53] approach, Lee-Gonzalez-Eakin (LGE
Correlation) [57] approach and P.M. Dranchuk and J.H. Abou-Kasem known as
DOK-EOS Method [62] have been introduced to Sawyer-Brown Method [58] in
addition to “gas viscosity versus pressure” (as given in Fig.7.5.) and “gas
compressibility versus pressure” (as given in Fig. 7.6.) correlations developed on the
basis of field data.

37
CHAPTER 5
THEORY IN MODELING OF THE PROBLEM
5.1. Assumptions
Isothermal and radial pseudo steady state gas flow has been assumed. Reasons of
these assumptions have been explained in Chapter 6.
5.2. Sawyer-Brown Method
As mentioned in Chapter 4, Sawyer-Brown Method (SB Method) has been
developed by Kenneth G. Brown and Walter K. Sawyer in 2002 [58] as a practical
method to track the occurrence of damage including non-Darcy effect. The
theoretical base of SB Method is pseudo steady state radial gas flow as:
Pr2 – Pwf
2 = Aq(bo + sm + Dq) (Eq.5.1)
where Pr is reservoir pressure (psi), Pwf is flowing well bottom hole pressure (psi), q
is flow rate (MMscf/D), sm is mechanical skin (dimensionless), D is turbulence
coefficient (1/MMscf). In Eq.4.1. “A” and “bo” are constants and given by following
equations:
A = (1.422 x 10⁶ µgzT) / (kgh) (Eq.5.2)
where µg is gas viscosity(cP), z is gas compressibility factor, T is reservoir
temperature (0R), kg is gas permeability (mD), h is average reservoir thickness (ft),
and:
bo = ln(re/rw) – ¾ (Eq.5.3)
where re is drainage radius (ft) and rw is well radius (ft).
By the authors of SB method, Eq.5.1 has been expressed in quadratic form as the
Jones Equation [60]:
Pr2 – Pwf
2 = aq
2 + bq (Eq.5.4)

38
where “a” and “b” are coefficients of Jones Equation as:
a = AD (Eq.5.5)
and
b = A(bo+sm) (Eq.5.6)
By implementing Eq.5.5 into Eq.5.1 and solving it for sm:
sm = (1/A) (ΔP2/q) – Dq - bo (Eq.5.7)
Thus, total skin (sT) will be as:
sT = sm + Dq (Eq.5.8)
or through Eq.5.7:
sT = [ΔP2/(Aq)] - bo (Eq.5.9)
In SB Method, “A” value in Eq.5.2 has been taken as constant although it is a
function of gas viscosity (µg) and gas compressibility (z) which are pressure (Pr and
Pwf), temperature (T), density (ρ) and molecular weight (Mw) dependent variables.
5.3. Al Hussainy-Ramey Approach by Pseudo Pressure:
On flow of real gases through porous media, Al Hussainy and Ramey [37] have
proposed a linearization approach by using pseudo pressure.
m(p) = 2 pmʃp (p/μz)dp (Eq.5.10)
Here, m(p) is real gas pseudo pressure, μ (real gas viscosity) and z (real gas
compressibility factor) are function of pressure at boundary conditions of pm and p.
In solving Eq.5.10, authors have applied Eilerts et al [61] and reached at following
equation:
[m(pr) - m(pbh)] = [(qscpscT) / πkhTsc][ln(r/rw) + s + Dqsc] (Eq.5.11)
Here m(pr) and m(pbh) are real gas pseudo pressure at reservoir and bottom hole
consequently.

39
5.4. Viscosity Correlations:
Regarding hydrocarbon gas mixtures viscosity and density behavior as pressure
dependent variables, Londono F.E. and et al. [53] had reported simplified
correlations to optimize existing models by using extensive number of measured gas
mixture viscosities and densities, to create large scale database of mentioned
properties including their pseudo reduced properties over a wide range of
composition, pressure and temperature. They have refitted Jossi, Stiel and Thodos
Correlation (JST Correlation) [56]. In original JST Correlation, proposed for gas
viscosity is as:
[(µg-µ*)ξ + 10
-4]
1/4 = f(ρr) (Eq.5.10)
where µg is gas viscosity (cP), µ*
is gas viscosity at low pressure(cP), and reduced
density function f(ρr) is:
f(ρr) = 0.1023+0.023364 ρr + 0.058533 ρr2 – 0.040758 ρr
3 + 0.0093324 ρr
4 (Eq.5.11)
Reduced density ρr (dimensionless) is:
ρr = ρ/ρc (Eq.5.12)
ρ is hydrocarbon gas mixture density (g/cc) and ρc is density at critical point (g/cc).
In Eq.5.10 ξ is:
ξ = Tc1/6
/ (Mw1/2
Pc2/3
) (Eq.5.13)
where Tc is critical temperature (K), Mw is molecular weight (lb/lb-mol) and Pc is
critical pressure (atm).
JST Correlation coefficients in Eq.5.11 and Eq.5.13 have been refitted with
optimized coefficient by Londono F.E. and et al. [53] as:
f(ρr) = 0.10367+0.131243ρr+0.0171893ρr2–0.0312987ρr
3+ 0.00884909 ρr
4 (Eq.5.14)
ξ = Tc-0.121699
/ (Mw0.391956
Pc-0.150857
) (Eq.5.15)

40
The data base used in obtaining coefficients of Eq.5.11 and Eq.5.13 had an upper
limit of 2 for reduced density. But data base used in obtaining optimized coefficients
of Eq.5.14 and Eq.5.15 had reduced densities greater than 2.
Another considered correlation in estimating hydrocarbon gas viscosity is Lee,
Gonzales, and Eakin Correlation (LGE Correlation) [57]:
µg = 10-4
Kexp(XρY) (Eq.5.16)
where:
K = [(9.379 + 0.01607Mw)T1.5
] / (209.2 + 19.26Mw + T) (Eq.5.17)
X = 3.448 + (986.4 / T) + 0.01009Mw (Eq.5.18)
Y = 2.447 – 0.2224X (Eq.5.19)
Here µg is hydrocarbon gas mixture viscosity, ρ is density (g/cc), Mw is molecular
weight of (lb/lb-mole) and T is temperature (0R).
Londono F.E. and et al. (2002) [53] had optimized LGE Correlation coefficients
given in Eq.5.17, Eq.5.18, and Eq.5.19 as:
K = [(16.7175 + 0.0419188Mw)T1.40256
] / (212.209 + 18.1349Mw + T) (Eq.5.20)
X = 2.12574 + (2063.71 / T) + 0.0119260Mw (Eq.5.21)
Y = 1.09809 – 0.0392851X (Eq.5.22)
Following Implicit Model had also developed by Londono F.E. and et al. [53] to
estimate hydrocarbon gas mixture viscosity as function of gas viscosity at 1 atm, gas
density and temperature:
µg = µ1 atm + f(ρ) (Eq.5.23)
where
µ1 atm = [-6.39821 – 0.6045922 ln(γg) + 0.749768 ln(T) + 0.1261051 ln(γg)ln(T)]
/ [1 +0.0697180 ln(γg) – 0.1013889 ln(T) – 0.021594 ln(γg)ln(T)] (Eq.5.24)
here γg is gas specific gravity and T is temperature (0R).

41
f(ρ) = (a + bρ + cρ2 + dρ
3) / (e + fρ + gρ
2 + hρ
3) (Eq.5.25)
where ρ is gas density (g/cc), and:
a = 0.953363 – 1.07384T + 0.00131729T2 (Eq.5.26)
b = -0.971028 + 11.2077T + 0.0901300T2 (Eq.5.27)
c = 1.01803 + 4.98986T + 0.302737T2 (Eq.5.28)
d = -0.990531 + 4.17585T – 0.636620T2 (Eq.5.29)
e = 1.00000 – 3.19646T + 3.90961T2 (Eq.5.30)
f = -1.00364 –0.181633T – 7.79089T2 (Eq.5.31)
g = 9.98080 – 1.62108T + 0.000634836T2 (Eq.5.32)
h = -1.00103 + 0.676875T + 4.62481T2 (Eq.5.33)
Average absolute error for above described Implicit Model to estimate viscosity is
3.05 percent.
5.5. Density Correlations:
Equation of State (EOS) for real gases is:
ρ = (1 / 62.37)(P / z)(Mw / RT) (Eq.5.34)
where 62.37 is conversion factor (1 g/cc = 62.37 lb/ft3), ρ is gas density (g/cc), P is
pressure (psia), Mw is molecular weight (lb/lb-mole) z is gas compressibility factor
(dimensionless), T is temperature (0R) and R is universal gas constant 10.732 (psia
ft3 / lb-mole
0R).
M.B. Standing and D.L. Katz [54] had presented gas compressibility factor
estimation by explicit function of pseudo-reduced pressure and temperature. P.M.
Dranchuk and J.H. Abou-Kasem [62] had presented following equation known as
DAK-EOS to calculate z-factor:

42
z = 1 + [0.3265 + (-1.0700/Tr) + (-0.5339/Tr3) + (0.01569/Tr
4) + (-0.05165/Tr
5)]ρr
+ [0.5475 + (-0.7361/ Tr) + (0.1844/ Tr)]ρr2 – 0.1056[(-0.7361/ Tr) + (0.1844/
Tr2)]ρr
5
+ 0.6134(1 + 0.7210ρr
2)( ρr
2/Tr
3)exp(-0.7210 ρr
2) (Eq.5.35)
where z is gas compressibility factor (dimensionless), Tr is reduced temperature
(dimensionless), ρr is reduced density (ρ/ρc dimensionless), ρ is density (g/cc), and
ρc is:
ρc = zc(Pr / zTr) here zc = 0.27 (Eq.5.36)
Londono F.E. and et al. [53] had resolved DAK-EOS by using H.F. Poettmann and
P.G. Carpenter [55], and modified Eq.5.35 with new coefficients as:
z = 1 + [0.3024696 + (-1.046964/Tr) + (-0.1078916/Tr3) + (-0.7694186/Tr
4) +
(0.1965439/Tr5)]ρr + [0.6527819 + (-1.118884/ Tr) + (0.3951957/ Tr)]ρr
2 –
0.09313593[(-1.118884/ Tr) + (0.3951957/ Tr2)]ρr
5 + 0.8483081(1 + 0.7880011ρr
2)
(ρr2/Tr
3)exp(-0.7880011ρr
2) (Eq.5.37)
Then, they had optimized DAK-EOS for z-factor coupled with:
Ppc = 725.89 – 70.27γg – 9.05γg2 (Eq.5.38)
Tpc = 40.39 + 549.47γg – 94.01γg2 (Eq.5.39)
where Ppc is pseudo-critical pressure (psia), Tpc is pseudo-critical temperature (0R),
and γg is gas specific gravity (air=1.0).
This optimized model provides average absolute error is 3.06 percent for estimating
z-factor by DAK-EOS method.
5.6. Al-Marhoun Correlation
Although the reservoir studied in this dissertation is a gas reservoir with no oil, in
case of gas condensation, Rs factor (solution gas oil ratio) values are calculated by
Al-Marhoun Correlation [63]. According to Al-Marhoun correlation:
Rs = {x / [(γg-1.87909
)( γc3.04659
)(T1.302347
)]}(1/0.722569)
(Eq.5.40)

43
where
X = [-b + Sqrt(b2 – 4ac)] / 2a (Eq.5.41)
and
a = -2.278475x10⁻⁹
(Eq. 5.42)
b = 7.02362x10⁻³
(Eq. 5.43)
c = -64.13891 – P (Eq.5.44)
here γg is gas specific gravity, γc condensate specific gravity, and T is temperature
(0R).

44
CHAPTER 6
METHOD OF SOLUTION
Throughout this dissertation, factors causing deviations from Darcy flow behavior
have been investigated in pseudo steady state radial gas flow model. The effect of
turbulence and viscous forces have been focused on and modeled by CMG IMEX
Simulator, their individual, mutual and collective effects on hydrocarbon flow
behavior in porous media quantitatively have been studied and finally predicted by
using the field data of North Marmara Underground Gas Storage. Production history
and reservoir parameters of KM-1A well among the wells in North Marmara
Underground Gas Storage have been chosen since this well is vertical which
satisfies radial pseudo steady state gas flow assumption. Besides, isothermal gas
flow through porous media also has been assumed by considering three supporting
factors:
a. Gas deviation factor calculated from the field data is below and close to
the value of 1 as seen in Figure 7.6.
b. Permeability values calculated by using the porosities from Density Log
for perforated producing layers doesn’t show a tight reservoir as seen in
Table.B.1.
c. Pressure drop at the bottom of well is not high as to cause Joule-
Thompson effect [84] which is mainly result of changes in gas deviation
factor as a function of pressure, and results in temperature drop in the
bottom of the well due to high pressure drop. Pressure drop graphs and
tables for the investigated gas well (from Fig.7.24 to Fig.7.27 and from
Table C.1 to C.4) also shows the amount of pressure drops as a result of
production history. There, it can clearly be seen that the pressure drops at
the bottom hole is not considerable for Joule-Thompson effect.

45
For radial fluid flow through porous medium, a single and vertical well has been
modeled in CMG IMEX numerical simulator. Reservoir zone has been divided to 30
parallel layers as seen in Figure 6.1. and Figure 6.2. These 30 layers have been
calibrated depending on permeability values calculated from density log as given in
Table B.1.
Well-1
-2,000 -1,000 0 1,000 2,000
-2,000 -1,000 0 1,000 2,000
-1,0
00
01,0
00
-1,0
00
01,0
00
0.00 505.00 1010.00 f eet
0.00 155.00 310.00 meters
3,664
3,693
3,721
3,750
3,778
3,807
3,835
3,864
3,892
3,921
3,949
KM-1A
Grid Top (ft) 1997-09-01 K layer: 1
Figure 6.1: Grid top view for single and vertical well through porous medium (in the
legend at right bottom, the red color shows the deepest layer’s depth while blue
shows the toppest layer’s depth.).
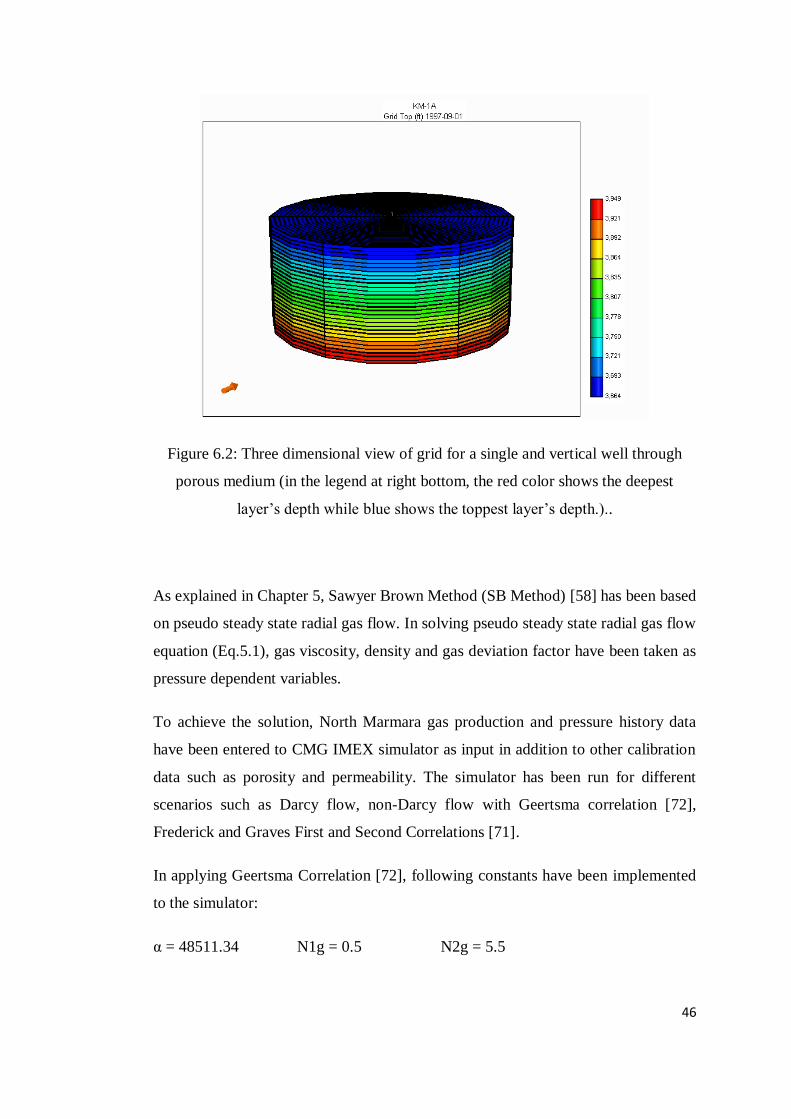
46
Figure 6.2: Three dimensional view of grid for a single and vertical well through
porous medium (in the legend at right bottom, the red color shows the deepest
layer’s depth while blue shows the toppest layer’s depth.)..
As explained in Chapter 5, Sawyer Brown Method (SB Method) [58] has been based
on pseudo steady state radial gas flow. In solving pseudo steady state radial gas flow
equation (Eq.5.1), gas viscosity, density and gas deviation factor have been taken as
pressure dependent variables.
To achieve the solution, North Marmara gas production and pressure history data
have been entered to CMG IMEX simulator as input in addition to other calibration
data such as porosity and permeability. The simulator has been run for different
scenarios such as Darcy flow, non-Darcy flow with Geertsma correlation [72],
Frederick and Graves First and Second Correlations [71].
In applying Geertsma Correlation [72], following constants have been implemented
to the simulator:
α = 48511.34 N1g = 0.5 N2g = 5.5
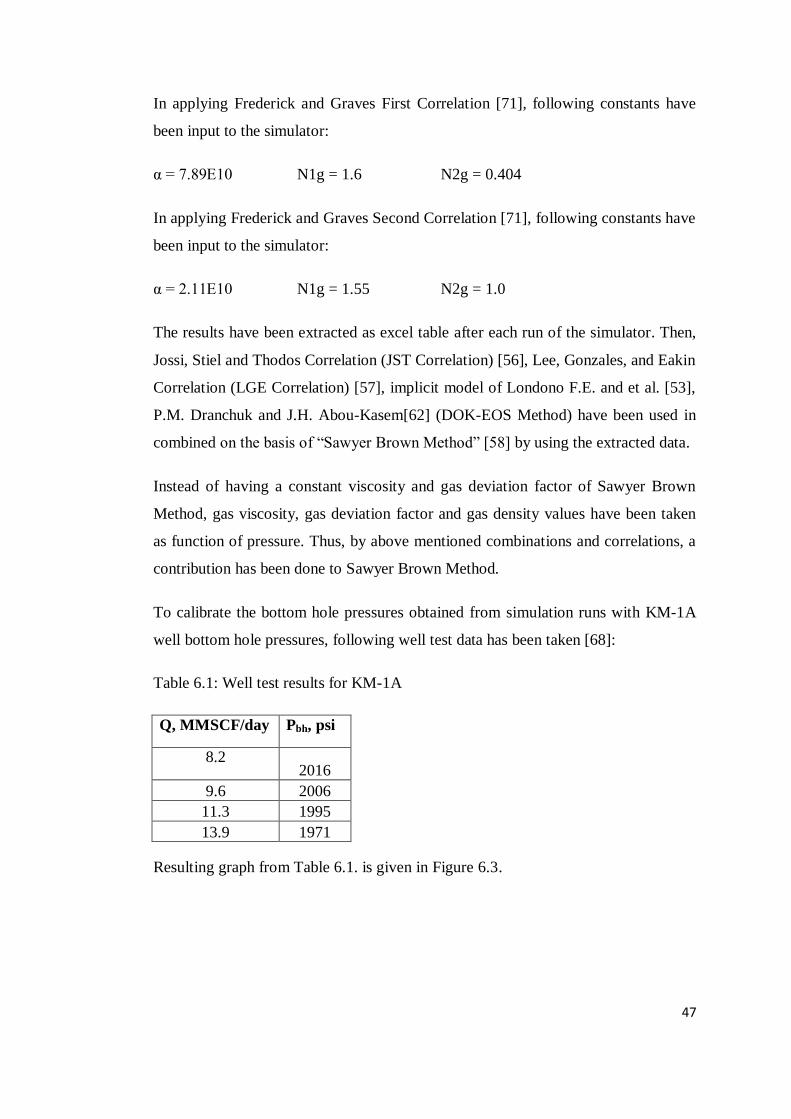
47
In applying Frederick and Graves First Correlation [71], following constants have
been input to the simulator:
α = 7.89E10 N1g = 1.6 N2g = 0.404
In applying Frederick and Graves Second Correlation [71], following constants have
been input to the simulator:
α = 2.11E10 N1g = 1.55 N2g = 1.0
The results have been extracted as excel table after each run of the simulator. Then,
Jossi, Stiel and Thodos Correlation (JST Correlation) [56], Lee, Gonzales, and Eakin
Correlation (LGE Correlation) [57], implicit model of Londono F.E. and et al. [53],
P.M. Dranchuk and J.H. Abou-Kasem[62] (DOK-EOS Method) have been used in
combined on the basis of “Sawyer Brown Method” [58] by using the extracted data.
Instead of having a constant viscosity and gas deviation factor of Sawyer Brown
Method, gas viscosity, gas deviation factor and gas density values have been taken
as function of pressure. Thus, by above mentioned combinations and correlations, a
contribution has been done to Sawyer Brown Method.
To calibrate the bottom hole pressures obtained from simulation runs with KM-1A
well bottom hole pressures, following well test data has been taken [68]:
Table 6.1: Well test results for KM-1A
Q, MMSCF/day Pbh, psi
8.2 2016
9.6 2006
11.3 1995
13.9 1971
Resulting graph from Table 6.1. is given in Figure 6.3.

48
Figure 6.3: Bottom-hole pressure versus flow rate (Table 6.1).
By using the correlation in Figure 6.2 which is produced with well test data of KM-
1A well, calibrated pressures against production rates have been tabulated in Table
6.2.
The error analysis of this calibration is also given in Figure 6.3. As it is seen in the
error analysis, for all production rates of North Marmara well KM-1A, the
calibration error has been found below 3.5 percent.

49
Table 6.2: Comparison of simulated reservoir pressures with calculated pressures by
calibration for KM-1A well.
Date
Gas Production Rate, q,
MMSCF/D
Simulated Reservoir
Pressure, Pr, psi
Calculated Pressure by
Calibration, Pc, psi
1997/10 5.06 2003 2042
1997/11 5.86 1999 2035
1997/12 6.21 1995 2033
1998/01 6.14 1990 2033
1998/02 6.09 1987 2034
1998/03 5.65 1983 2037
1998/04 7.32 1978 2024
1998/05 7.11 1973 2026
1998/06 9.38 1967 2008
1998/07 9.91 1960 2004
1998/08 7.97 1955 2019
1998/09 10.80 1948 1997
1998/10 10.83 1946 1996
1998/11 11.35 1933 1992
1998/12 11.82 1926 1989
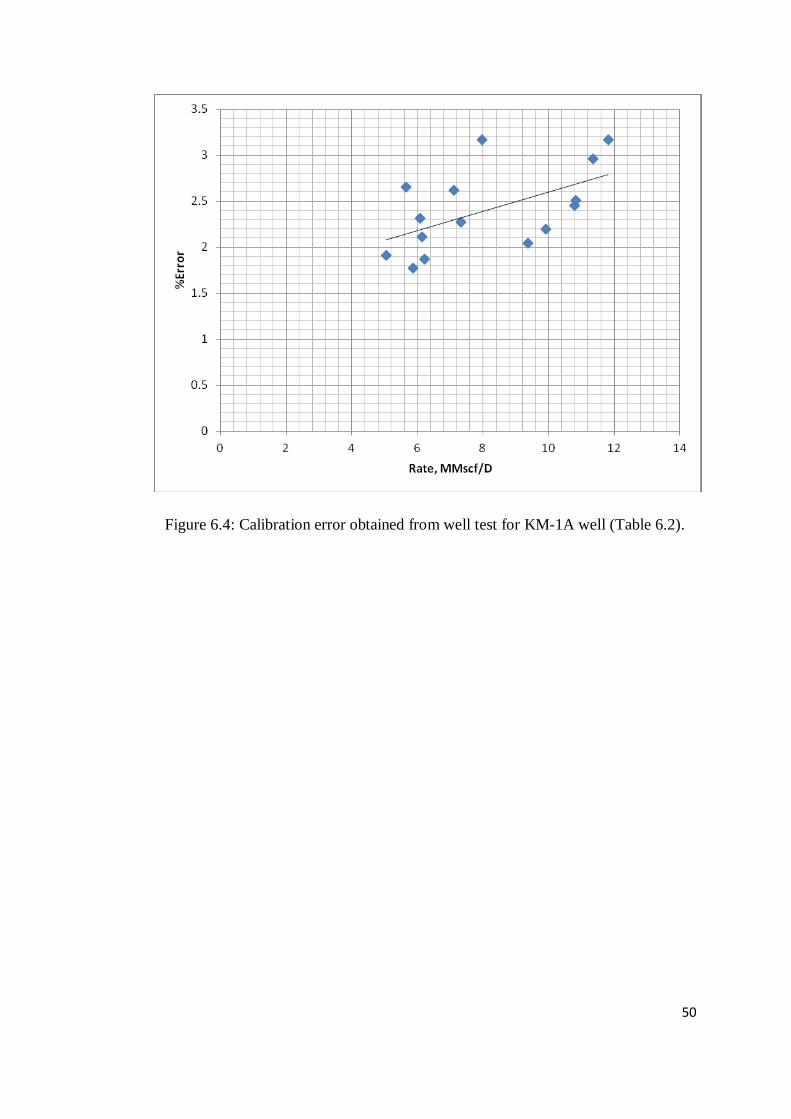
50
Figure 6.4: Calibration error obtained from well test for KM-1A well (Table 6.2).

51
CHAPTER 7
RESULTS AND DISCUSSIONS
Case field of this dissertation is North Marmara Gas Field which is an offshore field,
and case well is KM-1A.
North Marmara gas filed is located at about 7 km southwest of Silivri and 2.5 km off
the coast. The map showing the locations of offshore wells is given in Appendix A.1
[64].
The well KM-1A has been chosen as case well for this dissertation since it is a
vertical well and radial flow assumption applies. This well has been drilled up to the
base formation to test the whole stack.
In KM-1A Sogucak Formation which is the producing formation, starts at 1140 m
and ends in 1220 m.
The lithology of Sogucak Formation is limestone. North Marmara Gas Field
Sogucak Formation Structure Contour Map is given in Appendix A.2. and North
Marmara Gas Field Sogucak Formation “Porosity X Thickness” (Øh) Map is given
in Apendix A.3. [65].
After depletion of North Marmara Gas Field, in addition to 5 numbers of offshore
wells, 6 number of directional wells have been drilled from on shore to convert the
field to underground gas reservoir [66].
Appendix A.4 shows well completion figures of well KM-1A [67]. North Marmara
Gas Field, Well KM-1A Density & Neutron logs are given in Appendix A.5. Here,
Density Log is in pink color while Neutron Log is in blue. Regarding porosity and
permeability readings, density log is chosen due to its more sensitivity to porosity.
Density log readings for porosity and permeability are tabulated and given in
Appendix B as B.Table.1. In this table, values of porosity and permeability against
perforated intervals are shown in yellow filled columns and lines. By using data in
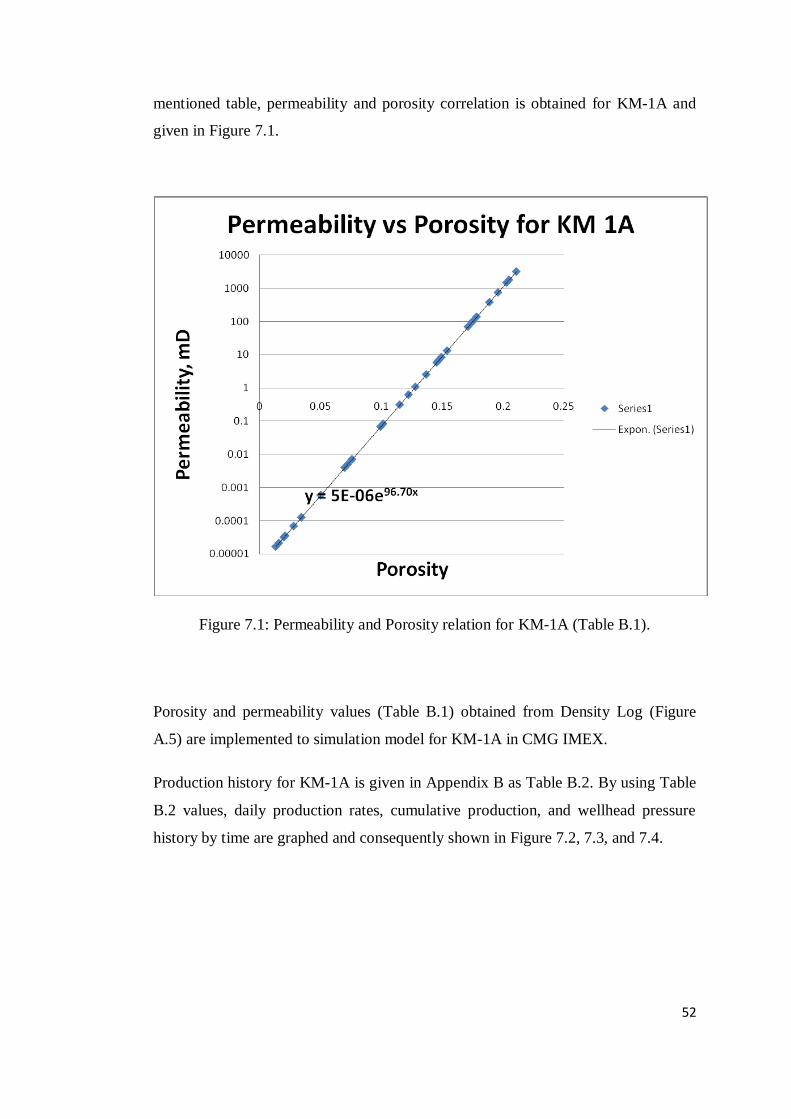
52
mentioned table, permeability and porosity correlation is obtained for KM-1A and
given in Figure 7.1.
Figure 7.1: Permeability and Porosity relation for KM-1A (Table B.1).
Porosity and permeability values (Table B.1) obtained from Density Log (Figure
A.5) are implemented to simulation model for KM-1A in CMG IMEX.
Production history for KM-1A is given in Appendix B as Table B.2. By using Table
B.2 values, daily production rates, cumulative production, and wellhead pressure
history by time are graphed and consequently shown in Figure 7.2, 7.3, and 7.4.

53
Figure 7.2: Average production rates of KM-1A (Table B.2).
Figure 7.3: Cumulative production of KM-1A (Table B.2).

54
Figure 7.4: Wellhead Pressure behavior of KM-1A (Table B.2).
Average petro-physical characteristics and initial conditions for KM-1A are given in
Appendix B, Table B.3 and Table B.4 [64, 68, 69].
Indigenous reservoir gas composition and Russian gas composition are consequently
given in Appendix B, Table B.5 and B.6 [69, 70]. In these tables, critical values
have been taken from R.C. Weast [44, 45, 46, 47].
Table B.7 shows PVT data of Reservoir Gas Volume Factor (Bg), Gas Expansion
Coefficient (Eg=1/Bg), Gas Viscosity (µg) and Gas Deviation factor (z). Through
this table values, Gas Viscosity (µg) and Deviation factor (z) behavior against
Pressure are graphed and shown in Figure 7.5 and 7.6.

55
Figure 7.5: Gas Viscosity (µg) versus Pressure (Table B.7).
Figure 7.6: Gas Deviation Factor (z) versus Pressure (Table B.7).

56
Rs (solution gas oil ratio) values are calculated by Al-Marhoun Correlation [63] by
Eq.5.40 as explained method in Chapter 5. The resulting table is given in Table B.8
and its graphical result is given in Figure 7.7.
Figure 7.7: Calculated solution gas oil ratio (Rs) versus pressure (Table B.8).
Rock and fluid properties, and production history data of North Marmara Gas
Reservoir have been implemented to the model done in CMG IMEX. It has been run
for separate scenarios by considering skin assumptions, Darcy flow case, and non-
Darcy flow case. Regarding non-Darcy flow case, “Frederick and Grave First
Correlation (FG1)” [71], “Frederick and Grave Second Correlation (FG2)” and
“Geertsma Correlation” [72] have been applied.

57
Results of these CMG IMEX simulator runs are given in Appendix C as Table C.1
for Assumed Skin 0, Table C.2 for Assumed Skin 5, Table C.3 for Assumed Skin 10
and Table C.4 for Assumed Skin 33.3.
Bottom-hole pressure behaviors as rate dependent by time for each assumed skin
value (Skin 0, 5, 10 and 33.3) and for each flow case (Darcy flow, non-Darcy flow
FG1, non-Darcy flow FG2 and non-Darcy flow Geertsma) are graphed and given
from Figure 7.8 to Figure 7.23. Table references of these graphs are given at the
bottom of each graph. In these graphs, green dash lines represent reservoir pressures,
blue dash lines represent gas production rates and red solid lines represent bottom-
hole pressures. The reason of the ossilations of red solid lines is the change of gas
production rates which cause a sudden change of bottom-hole pressure. Following
the rate stabilization, red colored bottom-hole pressure lines stop ossilation. Besides,
it is clearly seen from the same graphs that increasing gas production rates reduce
bottom-hole pressures while reducing rates increase bottom-hole pressures. During
the depletion of the resevoir, bottom-hole pressure has reducing tendency as
expected. On the other hand, the increasing bottom-hole pressure tendency almost
after mid 2000 shown in these graphs can be explained as the result of pressure build
up due to reduced production rates. Similar bottom-hole pressure behavior can be
seen from Fig 7.24 to Fig.7.27 as pressure drops.
In case of Darcy flow, when simulation resulting graphs are compared (Figures 7.8,
7.12, 7.16 and 7.20), it is obviously seen that increasing skin factors reduce the
bottom hole pressures. Similar effect can be seen for non-Darcy flow cases when
FG1 correlation applied to the simulation (Figure 7.9, 7.13, 7.17 and 7.21), when
FG2 correlation applied to the simulation (Figure 7.10, 7.14, 7.18 and 7.22), and
when Geertsma correlation applied to the simulation (Figure 7.11, 7.15, 7.19 and
7.23).

58
Figure 7.8: Wellbore bottom-hole pressure behavior for Darcy flow at Skin 0 (Table
C.1).
Figure 7.9: Wellbore bottom-hole pressure behavior for non-Darcy flow by FG1
Correlation at Skin 0 (Table C.1).

59
Figure 7.10: Wellbore bottom-hole pressure behavior for non-Darcy flow by FG2
Correlation at Skin 0 (Table C.1).
Figure 7.11: Wellbore bottom-hole pressure behavior for non-Darcy flow by
Geertsma Correlation at Skin 0 (Table C.1).

60
Figure 7.12: Wellbore bottom-hole pressure behavior for Darcy flow at Skin 5
(Table C.2).
Figure 7.13: Wellbore bottom-hole pressure behavior for non-Darcy flow by FG1
Correlation at Skin 5 (Table C.2).

61
Figure 7.14: Wellbore bottom-hole pressure behavior for non-Darcy flow by FG2
Correlation at Skin 5 (Table C.2).
Figure 7.15: Wellbore bottom-hole pressure behavior for non-Darcy flow by
Geertsma Correlation at Skin 5 (Table C.2).
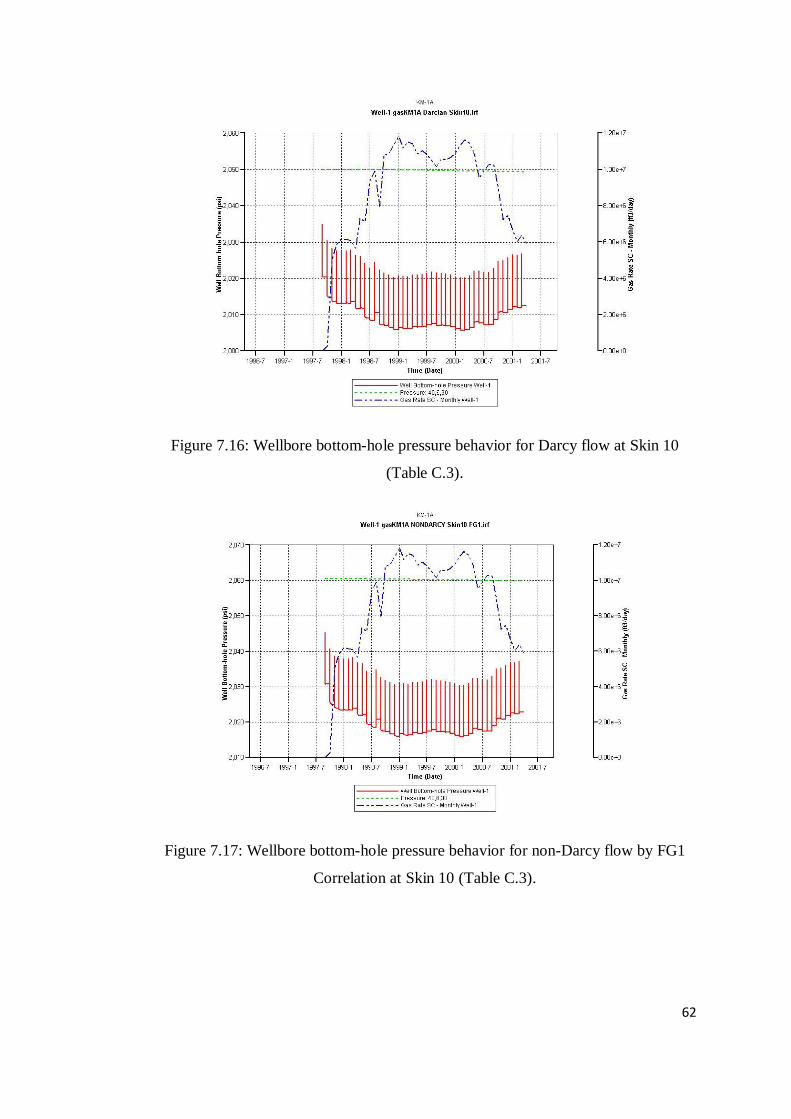
62
Figure 7.16: Wellbore bottom-hole pressure behavior for Darcy flow at Skin 10
(Table C.3).
Figure 7.17: Wellbore bottom-hole pressure behavior for non-Darcy flow by FG1
Correlation at Skin 10 (Table C.3).

63
Figure 7.18: Wellbore bottom-hole pressure behavior for non-Darcy flow by FG2
Correlation at Skin 10 (Table C.3).
Figure 7.19: Wellbore bottom-hole pressure behavior for non-Darcy flow by
Geertsma Correlation at Skin 10 (Table C.3).

64
Figure 7.20: Wellbore bottom-hole pressure behavior for Darcy flow at Skin 33.3
(Table C.4).
Figure 7.21: Wellbore bottom-hole pressure behavior for non-Darcy flow by FG1
Correlation at Skin 33.3 (Table C.4).

65
Figure 7.22: Wellbore bottom-hole pressure behavior for non-Darcy flow by FG2
Correlation at Skin 33.3 (Table C.4).
Figure 7.23: Wellbore bottom-hole pressure behavior for non-Darcy flow by
Geertsma Correlation at Skin 33.3 (Table C.4).
Table C.1, C.2, C.3 and C.4 are also the results of Sawyer-Brown analysis and re-
evaluated in terms of pressure drops (Pr-Pbh) for each assumed skin value (Skin 0,
5, 10 and 33.3) and results are graphed as below:

66
Figure 7.24: Pressure drop (Pr-Pbh) behavior at Skin 0 (Table C.1.).
Figure 7.25: Pressure drop (Pr-Pbh) behavior at Skin 5 (Table C.2).

67
Figure 7.26: Pressure drop (Pr-Pbh) behavior at Skin 10 (Table C.3).
Figure 7.27: Pressure drop (Pr-Pbh) behavior at Skin 33.3 (Table C.4).

68
In Figure 7.24, 25, 26 & 27, colored legends are given at the right side of ech graph
and it is clearly seen that Geertsma Correlation for non-Darcy fluid flow through
porous media estimates higher pressure drop (Reservoir pressure – Bottomhole
pressure) than Frederic and Grave’s First & Second Correlations. Increasing skin
effect also results higher pressure drop in both Darcy flow and non-Darcy flow.
By using reservoir pressure and bottomhole pressure data obtained from numerical
simulation results, pseudo stedy state radial gas flow equation in the form of SB
Method can be written as Eq.7.1:
Pr2 – Pwf
2 = Aq(bo + sm + Dq) (Eq.7.1)
This equation has been solved for North Marmara well KM-1A parameters. Table
C.5 of Appendix C gives the results for pseudo steady state radial gas flow at
reservoir, and bottom-hole by Sawyer-Brown Method (SB Method).
Eq.7.1 has been expressed in quadratic form as the Jones Equation [60]:
Pr2 – Pwf
2 = aq2 + bq (Eq.7.2)
thus
(Pr2 – Pwf
2)/q = aq+b (Eq.7.3)
Here Jones constants “a” and “b” have been calculated by using Table C.5 data and
resulting linear graph is given in Figure 7.28.

69
Figure 7.28: (ΔP2)/q versus q graph to find out Jones constants (Table C.5).
As it is seen in Figure 7.28, Jones constant [60] are:
a = -0.0101 and b = 207.84
In solving Eq.5.1, A value has been calculated through:
A = (1.422 x 10⁶ µgzT) / (kgh) (Eq.7.4)
Results for the coefficient “A” in Eq.5.2 are given in Table C.5 as function of
pressure. Thus, from Eq.5.5 non-Darcy factor:
D = a/A have been calculated.
Mechanical skin (sm) is calculated through:
b = A(bo+sm) (Eq.7.5)
Finally, total skin (sT) is calculated by:

70
sT = sm + Dq (Eq.7.6)
In order to test the validity of SB Method a numerical test has been conducted by
using the calibrated simulation model. Input skin was 33 obtained from well test
analysis [68]. Total skin behavior in reservoir as function of production rate is given
in Figure 7.29. As can be easily seen in the graph, at flow rates higher than 8
MMscf/day, total skin effect obtained from Sawyer-Brown analysis is around 33
which is in good agreement with the total skin effect obtained from well tests that
has been implemented in the input data file. Below a flow rate of 8 MMscf/day,
total skin value deviates from this value and increases as the rate decreases. Note
that, SB Method has been developed for non-Darcy flow. Since for low flow rates
the flow approaches to obey Darcy flow conditions, SB Method does not apply. It
can be concluded that the SB Method correctly identified skin as 33 for high rates
but overestimated the input value for low flow rates. It could be argued that at lower
flow rates non-Darcy flow does not exist and that's why the method introduces
unusually high skin factors.
Figure 7.29: Total skin at reservoir versus rate (Table C.5).

71
From the Table C.5 and C.6 data, turbulence in flow has been checked through
reservoir and wellhead against production rates of Well KM-1A. Resulting graph
has been given in Figure 7.30. As it is seen, in the reservoir, Reynolds Number [85]
values are below 0.2 even at the highest flow rates of production history of KM-1A.
Therefore, it can confidently be considered that there is no turbulence in producing
reservoir of KM-1A well of North Marmara gas field. This result can be checked
using Reynolds number calculations conducted by using the following equation:
Re = {ρ*Q*SQRT[K/(A*Ø)]}/(µ) (Eq.7.7)
The results of Figure 7.30 show that the Reynolds number is less than 0.2 in the
reservoir but higher than 2.5 near the wellbore. Darcy's law is only valid for slow,
viscous flow; fortunately, most porous media flow cases fall in this category.
Typically any flow with a Reynolds’ number less than one is clearly laminar, and it
would be valid to apply Darcy's law. Experimental tests have shown that flow
regimes with Reynolds’ numbers up to 10 may still be Darcy flow, as in the case of
groundwater flow.
Figure 7.30: Comparison of Reynolds’ Numbers of gas flow through reservoir and
flowing well for KM-1A well of North Marmara gas field (Table C.5 and C.6).

72
CHAPTER 8
CONCLUSIONS
1. Sawyer-Brown Method developed to investigate non-Darcy flow effects is
improved by incorporating pressure dependent gas viscosity, gas
compressibility gas deviation factor.
2. At low flow rates close to Darcy flow conditions SB Method gives over
estimated skin values.
3. Geertsma Correlation for non-Darcy fluid flow through porous media gives
higher pressure drop (Pr-Pbh) than Frederick and Grave’s first and second
correlations. Thus, higher non-Darcy factor results higher pressure drops.
4. As the skin factor increases the pressure drop increases.
5. Joule-Thompson effect does not apply to North Marmara KM-1A.
6. Obtained Reynold Numbers in flow through reservoir section of KM-1A
well of North Marmara gas field is below 0.2 even at the highest production
rates of this well’s production history. Thus, there is no turbulence effect in
reservoir flow of this well.
73
CHAPTER 9
RECOMMENDATIONS
1. Empirically, single phase and multi phase non-Darcy flow has been studied and
reported by several scientists and researchers in the literature [73, 74, 75, and 76].
On the other hand, theoretically single phase non-Darcy flow through porous media
has also been studied [77, 78, 79, 80, 81, 82, 83 and 84]. By reasonably combining
empirical and theoretical studies mentioned by these references on non-Darcy fluid
flow, new correlations for better fits can be obtained.
2. R. Al-Hussainy, H.J. Ramey and P.B. Crawford [37] approach can be combined
to Sawyer Brown Method for linearization of non-linear flow equations by using
pseudo pressure.

74
REFERENCES
1. Darcy, H.P.G. (1856). Les Fontaines Publiques de la Ville de Dijon,
Dalmont, Paris.
2. Forchheimer, P. (1901). Wasserbewegung durch Boden, Zeitscrift des
Vereines Deutscher Ingenieure.
3. Cornel D. and Katz, D.L. (October, 1953). “Flow of Gases through
Consolidated Porous Media”, Industrial and Engineering Chemistry, 45,
2145.
4. Tek, M.R., Coats, K.H., and Katz, D.L. (July 1962). "The Effect of
Turbulence on Flow of Natural Gas through Porous Media," JPT pp 799-
806.
5. Bear, J. (1972). Dynamics of Fluids in Porous Media. Dover Publications,
Inc., New York.
6. Scheidegger, A.E. (1974). The Physics of Flow through Porous Media.
University of Toronto Press. Toronto.
7. Barak, A.Z. (1987). “Comments on ‘High Velocity Flow in Porous Media’
by Hassanizadeh and Gray”. Transport in Porous Media. 1. 63-97.
8. Ruth, D. and Ma, H. (1992). “On the Derivation of Forchheimer Equation by
Means of the Average Theorem”. Transport in Porous Media. 7. No. 3. 255-
264.
9. Whitaker, S. (1996). “The Forchheimer Equation: A Theoretical
Development”. Transport in Porous Media. 25. 27-61.
10. Matthews C.S. and Russel D.G. (1967). Pressure Buildup and Flow Tests in
Wells, SPE AIME, New York, Dallas.

75
11. Craft, B.C. and Hawkins, M.F. (1959). Petroleum Reservoir Engineering,
Englewood Cliffs, N.J. p. 355.
12. Slider, H.C. (1976). Practical Petroleum Reservoir Engineering Methods,
Tulsa, Oklahoma, 5.
13. Schrader, M.E. and Loeb, G.I. (1992). Modern Approaches to Wettability.
Theory and Applications. New York, Plenum Press.
14. Halliday D. and Resnick R. Fundamentals of Physics. (1970). New York
Printed in the United States of America. Wiley International Edition.
15. Touloukian, Y.S., Saxena, C.S. and Hestermans, P. (1975). Thermophysical
Properties of Matter. The TPRC Data Series, Vol. 11, Viscosity, New York.
Plenum.
16. Hall, H.N. (1953). Compressibility of Reservoir Rocks. Trans. AIME 198.
309.
17. Dupuit, J. (1863). Estudes Thèoriques et Pratiques sur le mouvement des
Eaux dans les canaux dècouverts et à travers les terrains permèables. Second
Edition. Paris, Dunod.
18. J.W. Cooper, Xiuli Wang and K.K. Mohanty. (December 1999). “Non -
Darcy – Flow Studies in Anisotropic Porous Media”. SPE Journal 4 (4), pp
334-341.
19. F.R. Spena and A. Vacca. (2001) “A Potential formulation of Non-Linear
Models of Flow through Anisotropic Porous Media”. Transport in Porous
Media 45. Kluwer Academic Publishers. Printed in the Netherlands. pp 407–
423.
20. B. Ramirez, H. Kazemi, E. Ozkan and M. Al-Matrook. (2007). “Non-Darcy
Flow Effects in Dual-Porosity, Dual-Permeability, Naturally Fractured Gas
Condensate Reservoirs”. SPE 109295.
76
21. J.P. Spivey, K.G. Brown, W.K. Sawyer and J.H. Frantz. (August 2004)
“Estimating Non Darcy Flow Coefficient From Build Up Test Data With
Wellbore Storage”. SPE Reservoir Evaluation & Engineering, pp 256-269.
22. J.A. Gil, E. Ozkan and R. Raghavan. (2001). “Fractured-Well-Test Design
and Analysis in the Presence of Non-Darcy Flow”. SPE 71573.
23. T. Friedel and H.D. (2006). “Voigt.Investigation of Non-Darcy Flow in
Tight-Gas Reservoirs with Fractured Wells”. Journal of Petroleum Science
and Engineering 54. pp 112–128.
24. P. Handren, C.M. Pearson, J. Kullman, R.J. Coleman, J. Foreman. (2001)
“The Impact of Non Darcy Flow on Production from Hydraulically Fractured
Gas Wells”. SPE 67299.
25. H. Mahdiyar, M. Jamiolahmadi, and M. Sohrabi. (2008). “A New Flow Skin
Factor Formulation for Hydraulically Fractured Wells in Gas Condensate
Reservoirs”. SPE 113597.
26. M.I. Dickens, D.A. McVay and S.K. Schubart. (2008). “The Impact of
Gravity Segregation on Multiphase Non-Darcy Flow in Hydraulically
Fractured Gas Wells”. SPE 116748.
27. L. Jin and G.S. Penny. (1998). “A Study on Two Phase, Non-Darcy Gas
Flow Through Proppant Packs”. SPE 49248.
28. R.D. Evans and C.S. Hudson. (November 1987). “The Effect of Immobile
Liquid Saturation on the Non-Darcy Flow Coefficient in Porous Media”.
SPE Production Engineering. pp 331-338.
29. R.D. Barree and M.W. Conway. (2007). “Multiphase Non-Darcy Flow in
Proppant Packs”. SPE 109561.
30. J. Hagoort. (June 2007). “An Improved Model for Estimating Flow
Impairment by Perforation Damage”. SPE JOURNAL, pp 235-244.
31. H.O. McLeod. (1983). “The Effect of Perforation Conditions on Well
Performance. JPT 35 (1): pp 31-39.

77
32. M. Fourar, R. Lenormand, M.Karimi-Fard, and R. Horne. (2005). “Inertia
Effects in High-Rate Flow through Heterogeneous Porous Media”. Transport
in Porous Media 60. pp 353–370.
33. C.A.P. Tavares, H. Kazemi and E. Ozkan. (2004). “Combined Effect of Non-
Darcy Flow and Formation Damage on Gas Well Performance of Dual-
Porosity and Dual-Permeability Reservoirs”. SPE 90623.
34. S.C. Jones. (1987). “Using the Inertial Coefficient, B, to Characterize
Heterogeneity in Reservoir Rock”. SPE 16969.
35. F. Zeng and G. Zhao. (2007). “Gas Well Production Analysis with Non-
Darcy Flow and Real-Gas PVT Behavior”. Journal of Petroleum Science and
Engineering 59. pp 169–182.
36. M.J. Fetkovich and M.E. Vienot. (February 1985). “Shape Factor, CA,
Expressed as Skin. SCA, JPT 321.
37. R. Al-Hussainy, H.J. Ramey and P.B. Crawford. (18 May 1966). “The Flow
of Real Gases Through Porous Media” JPT.
38. H.J. Ramey Jr. (February 1965). “Non-Darcy Flow and Wellbore Storage
Effects in Pressure Build Up and Drawdown of Gas Wells”. JPT 223.
39. R.D. Carter. (October 1985). “Type Curves for Finite Radial and Linear Gas
Flow Systems: Constant –Terminal-Pressure Case”. SPE J 719.
40. M.L. Fraim and W.J. Lee. (1987). “Determination of Formation Properties
from Long-Term Gas Well Production Affected by Non-Darcy Flow”. SPE
16934.
41. H. Stehfest. (January 1970). “Algorithm 368, Numerical Inversion of
LaPlace Transforms”. D-5, Communication of the ACM, 13, No 1, pp 47-49.
42. F. Zeng and G. Zhao. (2006). “Semi Analytical Model for Reservoirs with
Forchheimer's Non-Darcy Flow”. SPE 100540.
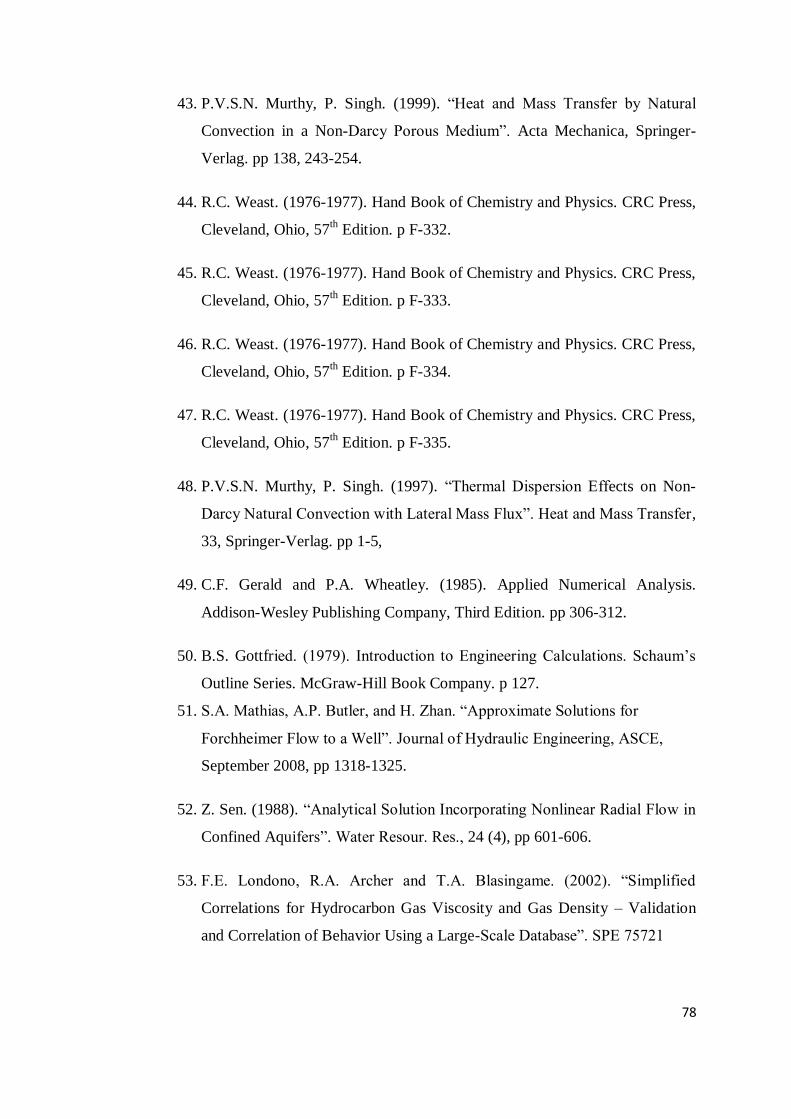
78
43. P.V.S.N. Murthy, P. Singh. (1999). “Heat and Mass Transfer by Natural
Convection in a Non-Darcy Porous Medium”. Acta Mechanica, Springer-
Verlag. pp 138, 243-254.
44. R.C. Weast. (1976-1977). Hand Book of Chemistry and Physics. CRC Press,
Cleveland, Ohio, 57th Edition. p F-332.
45. R.C. Weast. (1976-1977). Hand Book of Chemistry and Physics. CRC Press,
Cleveland, Ohio, 57th Edition. p F-333.
46. R.C. Weast. (1976-1977). Hand Book of Chemistry and Physics. CRC Press,
Cleveland, Ohio, 57th Edition. p F-334.
47. R.C. Weast. (1976-1977). Hand Book of Chemistry and Physics. CRC Press,
Cleveland, Ohio, 57th Edition. p F-335.
48. P.V.S.N. Murthy, P. Singh. (1997). “Thermal Dispersion Effects on Non-
Darcy Natural Convection with Lateral Mass Flux”. Heat and Mass Transfer,
33, Springer-Verlag. pp 1-5,
49. C.F. Gerald and P.A. Wheatley. (1985). Applied Numerical Analysis.
Addison-Wesley Publishing Company, Third Edition. pp 306-312.
50. B.S. Gottfried. (1979). Introduction to Engineering Calculations. Schaum’s
Outline Series. McGraw-Hill Book Company. p 127.
51. S.A. Mathias, A.P. Butler, and H. Zhan. “Approximate Solutions for
Forchheimer Flow to a Well”. Journal of Hydraulic Engineering, ASCE,
September 2008, pp 1318-1325.
52. Z. Sen. (1988). “Analytical Solution Incorporating Nonlinear Radial Flow in
Confined Aquifers”. Water Resour. Res., 24 (4), pp 601-606.
53. F.E. Londono, R.A. Archer and T.A. Blasingame. (2002). “Simplified
Correlations for Hydrocarbon Gas Viscosity and Gas Density – Validation
and Correlation of Behavior Using a Large-Scale Database”. SPE 75721

79
54. M.B. Standing and D.L. Katz. (1942). “Density of Natural Gases”. Trans.
AIME 146, p 140.
55. H.F. Poettmann and P.G. Carpenter. (1952). “The Multiphase Flow of Gas,
Oil, and Water through Vertical Flow String with Application to the Design
of Gas Lift Installations”. Drilling and Production Practice. pp 257-317.
56. J.A. Jossi, L.I. Stiel and G. Thodos. (March 1962). “The viscosity of pure
substances in Dense Gaseous and Liquid Phases”. AIChE Journal. Vol 8,
No1. pp 59-62.
57. A.L. Lee, M.H. Gonzales and B.E. Eakin. (August 1966). “The Viscosity of
Natural Gases”. JPT. pp 997-1000.
58. K.G. Brown and W.K. Sawyer. (2002). “Novel Surveillance Helps Operators
Track Damage”. SPE 75713.
59. J.P. Spivey, K.G. Brown and W.K. Sawyer. (2005). “Identify the Timing and
Sources of Damage in Gas Storage Wells Using Smart Storage Technology”.
SPE 97070.
60. L.G. Jones, E.M. Blount, and O.H. Glaze. (1976). “Use of Short Term
Multiple Rate Flow Test to Predict Performance of Wells Having
Turbulence”. SPE 6133.
61. C.K. Eilerts, E.F. Sumner and N.L. Potts (1965). “Integration of Partial
Differential Equation for Transient Radial Flow of Gas-Condensate Fluids in
Porous Structures”. Soc. Of Pet. Eng. Jour. June 1965, p. 141.
62. P.M. Dranchuk and J.H. Abou-Kasem. (1975). “Calculation of z-Factors for
Natural Gases Using Equation of State”. Journal of Canadian Petroleum. 14.
pp 34-36.
63. Al-Marhoun. (1985). "Pressure-Volume-Temperature Correlations for Saudi
Crude Oils". SPE 13718.

80
64. E. Uygur. (1996). “1. Bölge Kuzey Marmara-1/A, Kuzey Marmara-3 ve
Kuzey Marmara-4 Kuyularında Soğucak Formasyonunun Sedimentoloji ve
Rezervuar Özelliklerinin Değerlendirilmesi”. TPAO Araştırma Merkezi
Grubu Başkanlığı, Sedimentoloji ve Rezervuar Jeolojisi Müdürlüğü Rapor
No 2203.
65. M. Türkaslan, M. Siyako. (1995). TPAO, Arama Grubu.
66. M. Yılmaz, S. Abravcı, Ö. Saraçoğlu. (2005). “Bir Doğalgaz Rezervuarının
Yeraltı Gaz Deposu Olarak Geliştirilmesi: Kuzey Marmara Sahası”.
IPETGAS 2005. 15th Internatıonal Petroleum and Natural Gas Congress and
Exhibition. Ankara, Turkey.
67. TPAO Production Group. (2005). Operation History of KM-1A.
68. M. Yılmaz. (1995). “Kuzey Marmara 1A, 3 ve 4 Gaz Kuyuları Test
Değerlendirmeleri”. TPAO Üretim Grubu Başkanlığı Özel Projeler
Müdürlüğü. 148-1420.
69. SOFREGAZ. (1997). “Engineering Study for the Underground Gas Storage
of Natural Gas in K.Marmara and Degirmenkoy Gas Fields”. Report No:
SC715.10.RA.0000001.
70. GEOSTOCK. (2007) TPAO Underground Storage of Natural Gas in Kuzey
Marmara and Degirmenkoy Gas Fields Reservoir Simulation of Kuzey
Marmara. Phase 1 Test Design. THR/DJ/0001.
71. D.C. Frederick Jr., and R.M. Graves. (1994). “New Correlations to Predict
Non-Darcy Flow Coefficients at Immobile and Mobile Water Saturation”.
Paper SPE 28451 presented at the 1994 SPE Annual Technical Conference
and Exhibition, New Orleans, Sept., 25-28.
72. J. Geertsma. (October 1975). “Estimation the Coefficient of Inertial
Resistance in Fluid Flow through Porous Media”. SPEJ. 445-450.
73. S.V. Wong. (Oct-Dec 1970) “Effect of Liquid Saturation on Turbulence
Factors for Gas-Liquid Systems”. J. Cdn. Pet. Tech. 274.

81
74. E.V. Evans and R.D. Evans, (1986). “The Influence of an Immobile or
Mobile Saturation upon Non-Darcy Compressible Flow or Real Gases in
Propped Fractures”. Paper SPE 15066 presented at the 1986 SPE Western
Regional Meeting, Oklahoma, April, 2-4.
75. I.M. Kutasov. (1993)“Equation Predicts Non-Darcy Flow Coefficient”. Oil
& Gas Journal. March 15, 1993. 66-67.
76. M. Coles and K.J. Hartman (1998). “Non-Darcy Measurements In Dry Core
and the Effect of Immobile Liquid”. Paper SPE 39977 presented at the 1998
SPE Gas Technology Symposium, Calgary, Canada, March, 15-18.
77. R.B. Grigg and M.K. Hwang. (1998). “High Velocity Gas Flow Effects in
Porous Gas-Water System”. Paper SPE 39978 presented at the 1998 SPE
Gas Technology Symposium, Calgary, Canada, March, 15-18.
78. M. Brillouin, (1907). Lecons Sur La Viscosité des Liquides et des Gas.
Gauthier-Villars, Paris. 1907.
79. S. Ergun and A.A. Orning. (1949). “Fluid Flow through Randomly Packed
Columns and Fluidized Beds”. Industrial and Engineering Chemistry. 1949.
41. No.6. 1179-1184.
80. A.E. Scheidegger. (1953). “Theoretical Models of Porous Matter”. Producers
Monthly. Aug. 1953. 17-23.
81. S. Irmay. (1958). “On the Theoretical Derivation of Darcy and Forchheimer
Formulas”. Trans. American Geophysical Union. 1958. 39. No. 4. 702-707.
82. J. Bear. (1972). Dynamics of Fluids in Porous Media. Diver Publications,
Inc. New York. 1972.
83. A.E. Scheidegger. (1974). The Physics of Flow through Porous Media.
University of Toronto Press. Toronto.

82
84. I. Maric. (2005). “The Joule-Thompson Effect in Natural Gas Flow Rate
Measurements”. Flow Measurements and Instrumentation. Dec 205. 387-
395.
85. M. Fourar, R. Lenormand, M. Karimi-Fard and R. Horne. (2005). “Inertia
Effects in High-Rate Flow through Heterogeneous Porous Media”. Transport
in Porous Media. 2005. 60: 353-370.

83
APPENDIX A
NORTH MARMARA GAS FIELD
A.1: North Marmara Gas Field, Offshore Well Locations Map.

84
A.2: North Marmara Gas Field, Sogucak Formation Structure Contour Map.

85
A.3: North Marmara Gas Field, Sogucak Formation “Porosity X Thickness” (Øh)
Map.

86
A.4: North Marmara Gas Field, Well KM-1A well completion figures.
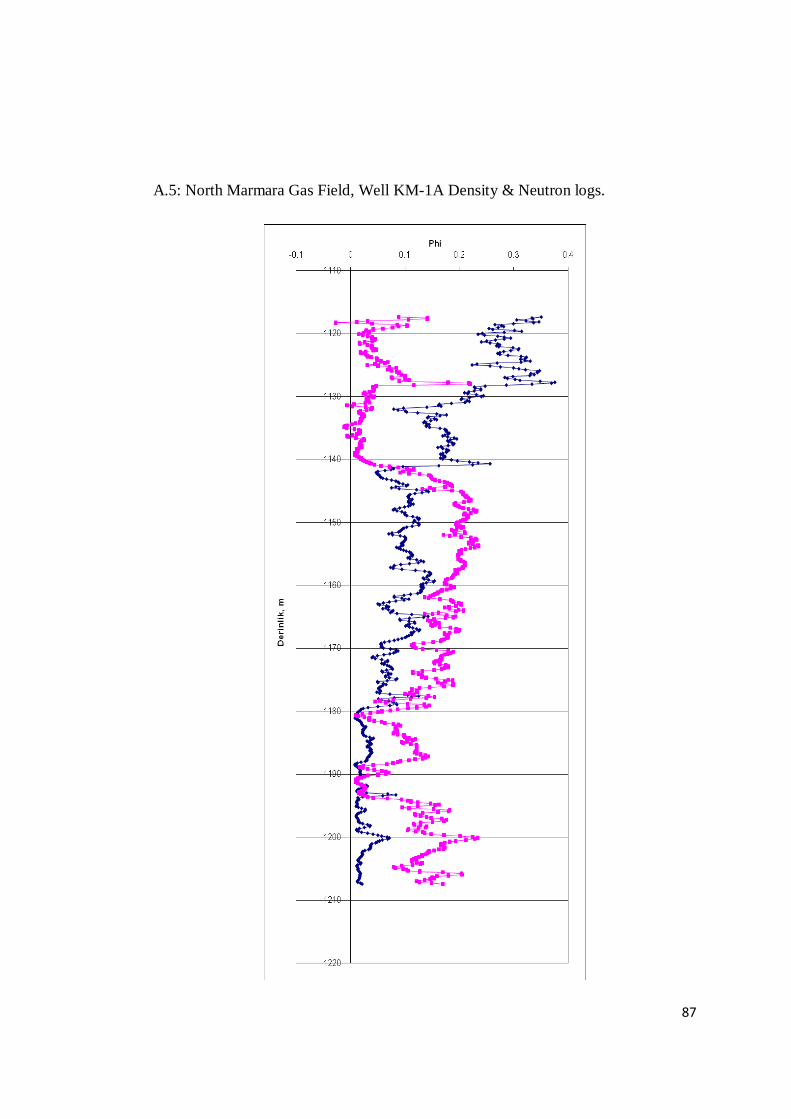
87
A.5: North Marmara Gas Field, Well KM-1A Density & Neutron logs.
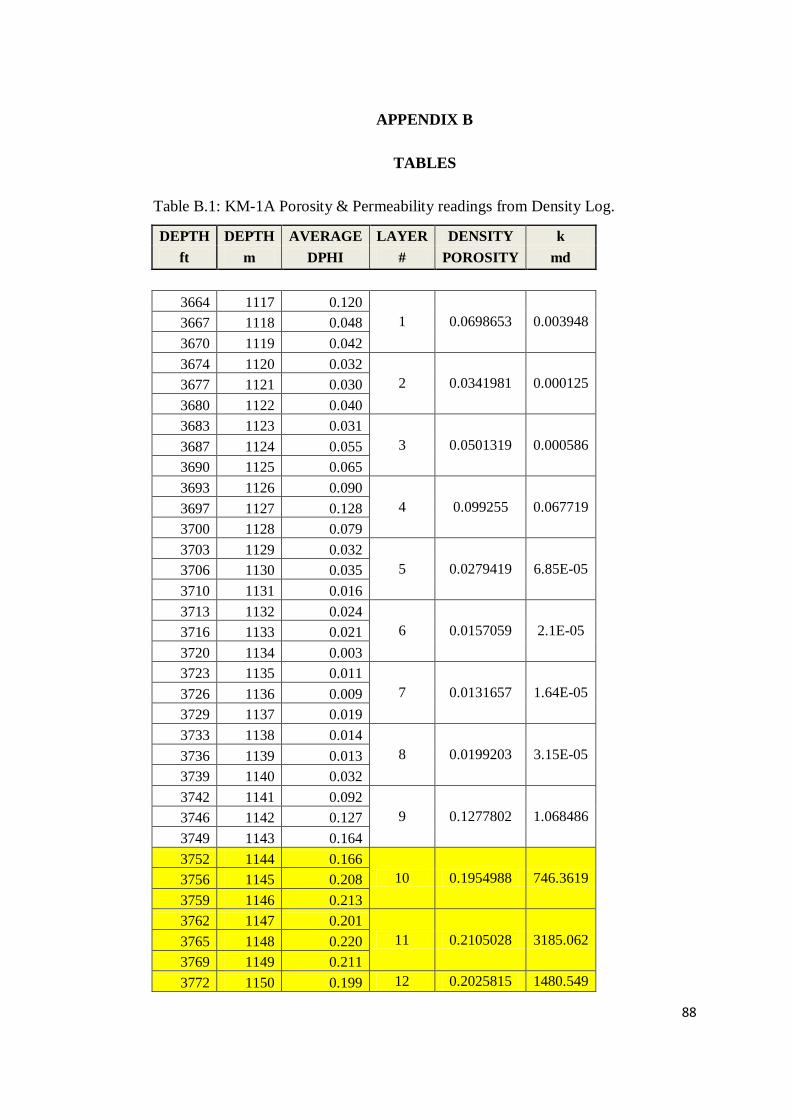
88
APPENDIX B
TABLES
Table B.1: KM-1A Porosity & Permeability readings from Density Log.
DEPTH DEPTH AVERAGE LAYER DENSITY k
ft m DPHI # POROSITY md
3664 1117 0.120
1 0.0698653 0.003948 3667 1118 0.048
3670 1119 0.042
3674 1120 0.032
2 0.0341981 0.000125 3677 1121 0.030
3680 1122 0.040
3683 1123 0.031
3 0.0501319 0.000586 3687 1124 0.055
3690 1125 0.065
3693 1126 0.090
4 0.099255 0.067719 3697 1127 0.128
3700 1128 0.079
3703 1129 0.032
5 0.0279419 6.85E-05 3706 1130 0.035
3710 1131 0.016
3713 1132 0.024
6 0.0157059 2.1E-05 3716 1133 0.021
3720 1134 0.003
3723 1135 0.011
7 0.0131657 1.64E-05 3726 1136 0.009
3729 1137 0.019
3733 1138 0.014
8 0.0199203 3.15E-05 3736 1139 0.013
3739 1140 0.032
3742 1141 0.092
9 0.1277802 1.068486 3746 1142 0.127
3749 1143 0.164
3752 1144 0.166
10 0.1954988 746.3619 3756 1145 0.208
3759 1146 0.213
3762 1147 0.201
11 0.2105028 3185.062 3765 1148 0.220
3769 1149 0.211
3772 1150 0.199 12 0.2025815 1480.549
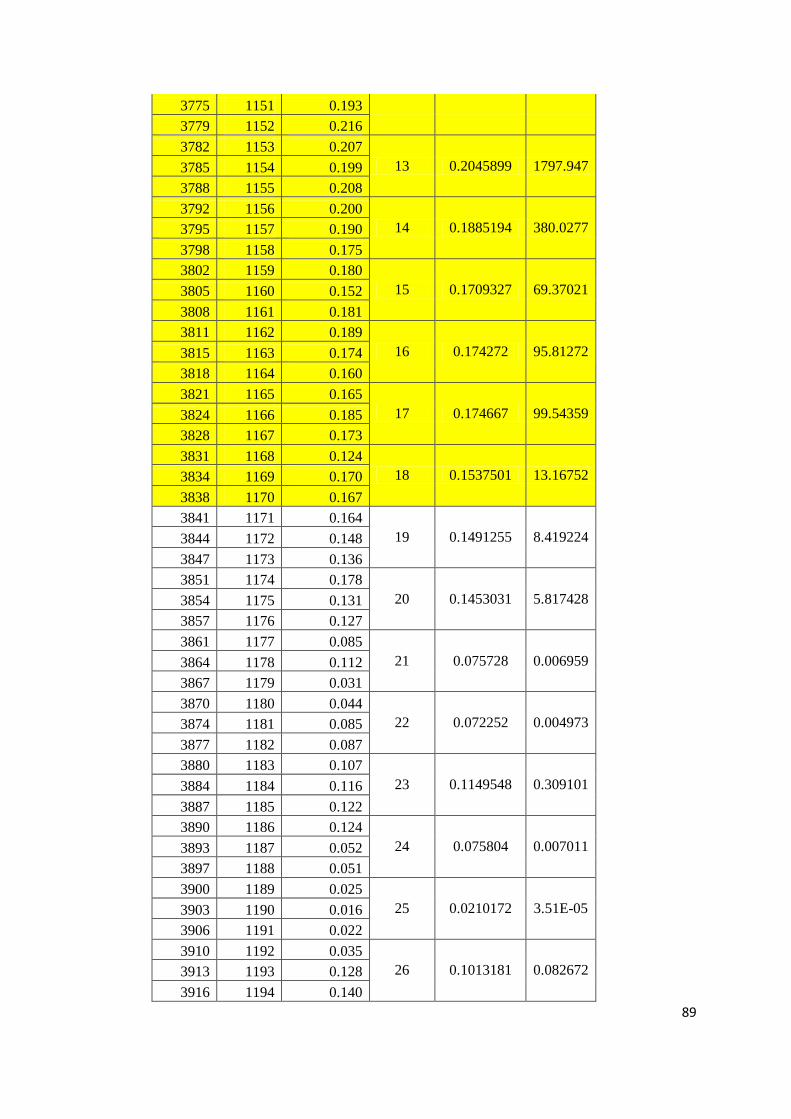
89
3775 1151 0.193
3779 1152 0.216
3782 1153 0.207
13 0.2045899 1797.947 3785 1154 0.199
3788 1155 0.208
3792 1156 0.200
14 0.1885194 380.0277 3795 1157 0.190
3798 1158 0.175
3802 1159 0.180
15 0.1709327 69.37021 3805 1160 0.152
3808 1161 0.181
3811 1162 0.189
16 0.174272 95.81272 3815 1163 0.174
3818 1164 0.160
3821 1165 0.165
17 0.174667 99.54359 3824 1166 0.185
3828 1167 0.173
3831 1168 0.124
18 0.1537501 13.16752 3834 1169 0.170
3838 1170 0.167
3841 1171 0.164
19 0.1491255 8.419224 3844 1172 0.148
3847 1173 0.136
3851 1174 0.178
20 0.1453031 5.817428 3854 1175 0.131
3857 1176 0.127
3861 1177 0.085
21 0.075728 0.006959 3864 1178 0.112
3867 1179 0.031
3870 1180 0.044
22 0.072252 0.004973 3874 1181 0.085
3877 1182 0.087
3880 1183 0.107
23 0.1149548 0.309101 3884 1184 0.116
3887 1185 0.122
3890 1186 0.124
24 0.075804 0.007011 3893 1187 0.052
3897 1188 0.051
3900 1189 0.025
25 0.0210172 3.51E-05 3903 1190 0.016
3906 1191 0.022
3910 1192 0.035
26 0.1013181 0.082672 3913 1193 0.128
3916 1194 0.140
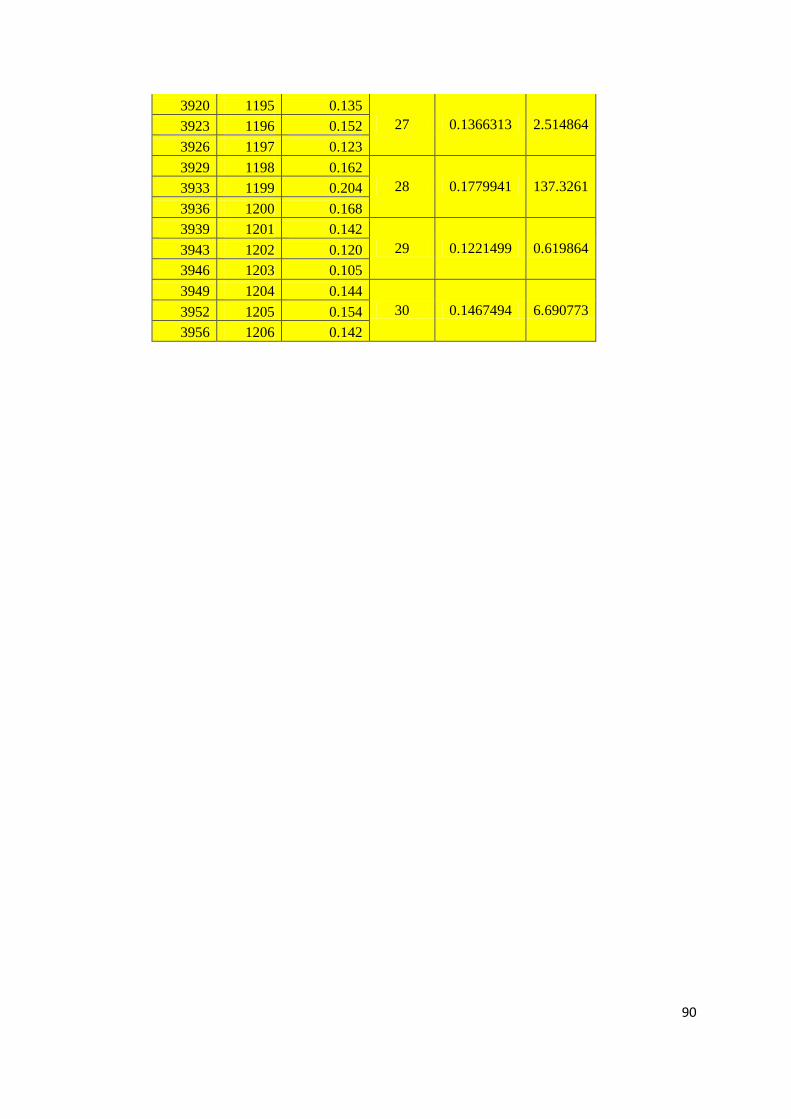
90
3920 1195 0.135
27 0.1366313 2.514864 3923 1196 0.152
3926 1197 0.123
3929 1198 0.162
28 0.1779941 137.3261 3933 1199 0.204
3936 1200 0.168
3939 1201 0.142
29 0.1221499 0.619864 3943 1202 0.120
3946 1203 0.105
3949 1204 0.144
30 0.1467494 6.690773 3952 1205 0.154
3956 1206 0.142

91
Table B.2: KM-1A Production Data.
KM-1A PRODUCTION DATA
Year
and
Month
Number
of days
Pwh
(psi)
Rate
(Mscf/D)
Number of
Producing
days
Modified Rate,
(Mscf/D)
Cumulative
Production,
(Mscf)
1997.10 31 1690 6538 24 5062 156912
1997.11 30 1720 5865 30 5865 332862
1997.12 31 1710 6210 31 6210 525372
1998.01 31 1780 6143 31 6143 715805
1998.02 28 1710 6085 28 6085 886185
1998.03 31 1680 7298 24 5650 1061337
1998.04 30 1680 7577 29 7324 1281070
1998.05 31 1690 7106 31 7106 1501356
1998.06 30 1630 9379 30 9379 1782726
1998.07 31 1610 9907 31 9907 2089843
1998.08 31 1640 7965 31 7965 2336758
1998.09 30 1520 10801 30 10801 2660788
1998.10 31 1520 11644 29 10893 2998464
1998.11 30 1480 11353 30 11353 3339054
1998.12 31 1460 11822 31 11822 3705536
1999.01 31 1480 11175 31 11175 4051961
1999.02 28 1440 11521 28 11521 4374549
1999.03 31 1440 11425 31 11425 4728724
1999.04 30 1440 10859 30 10859 5054494
1999.05 31 1430 11044 31 11044 5396858
1999.06 30 1420 10839 30 10839 5722028
1999.07 31 1390 10845 30 10495 6047378
1999.08 31 1420 10151 31 10151 6362059
1999.09 30 1380 10612 30 10612 6680419
1999.10 31 1370 10538 31 10538 7007097
1999.11 30 1340 10677 30 10677 7327407
1999.12 31 1320 10909 31 10909 7665586
2000.01 31 1240 11360 31 11360 8017746
2000.02 29 1250 11633 29 11633 8355103
2000.03 31 1200 11427 31 11427 8709340
2000.04 30 1270 10880 30 10880 9035740
2000.05 31 1280 9852 30 9534 9331300
2000.06 30 1290 9623 30 9623 9619990
2000.07 31 1270 10291 31 10291 9939011
2000.08 31 1250 10234 31 10234 10256265
2000.09 30 1250 9291 29 8981 10525704
2000.10 31 1310 7246 31 7246 10750330

92
2000.11 30 1310 7471 30 7471 10974460
2000.12 31 1300 6636 31 6636 11180176
2001.01 31 1295 6239 30 6038 11367346
2001.02 28 1205 7140 25 6375 11545846
2001.03 31 1230 8664 21 5869 11727790
2001.04 30 1240 7690 17 4358 11858520
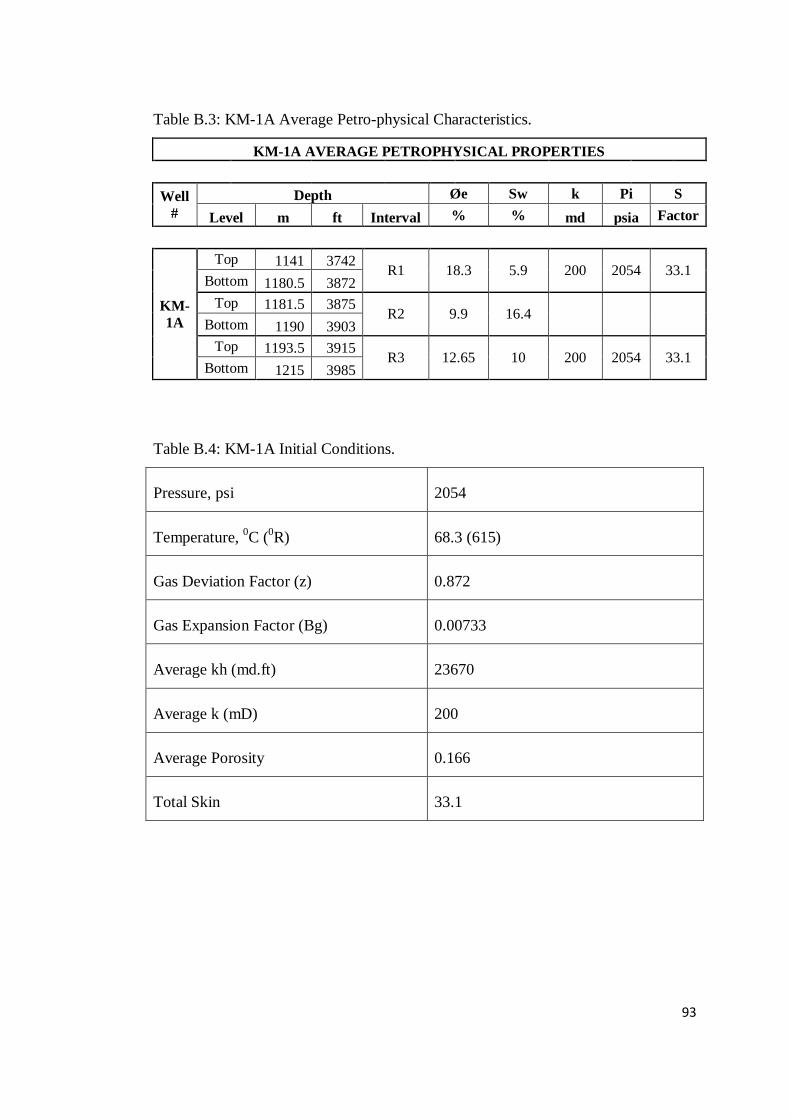
93
Table B.3: KM-1A Average Petro-physical Characteristics.
KM-1A AVERAGE PETROPHYSICAL PROPERTIES
Well
#
Depth Øe Sw k Pi S
Level m ft Interval % % md psia Factor
KM-
1A
Top 1141 3742 R1 18.3 5.9 200 2054 33.1
Bottom 1180.5 3872
Top 1181.5 3875 R2 9.9 16.4
Bottom 1190 3903
Top 1193.5 3915 R3 12.65 10 200 2054 33.1
Bottom 1215 3985
Table B.4: KM-1A Initial Conditions.
Pressure, psi 2054
Temperature, 0C (
0R) 68.3 (615)
Gas Deviation Factor (z) 0.872
Gas Expansion Factor (Bg) 0.00733
Average kh (md.ft) 23670
Average k (mD) 200
Average Porosity 0.166
Total Skin 33.1

94
Table B.5: Indigenous reservoir gas composition.
KM RESERVOIR GAS COMPOSITION
COMP
ONENT
%
mol Tc (
0R)
WEIGH
TED Tc
(0R)
Pc
(psi)
WEIGH
TED Pc
(psi)
Mw
(g/mol)
WEIGH
TED MW
(g/mol)
Mw
(lb/mol)
WEIGH
TED
MW
(lb/mol)
N2 2.32 272.2 6.32 493 11.44 28.01 0.65 61.62 1.43
CO2 1.22 548 6.69 1071 13.07 44.01 0.54 96.82 1.18
C1 92.42 344.2 318.11 673 622.19 16.043 14.83 35.29 32.62
C2 2.22 550.0 12.23 709 15.75 30.069 0.67 66.15 1.47
C3 0.86 666.2 5.73 617 5.31 44.096 0.38 97.01 0.83
IC4 0.20 735.0 1.47 529 1.06 58.123 0.12 127.87 0.26
NC4 0.26 765.6 1.99 551 1.43 58.123 0.15 127.87 0.33
IC5 0.10 830.0 0.83 484 0.48 72.15 0.07 158.73 0.16
NC5 0.07 845.9 0.59 490 0.34 72.15 0.05 158.73 0.11
C6 0.09 913.6 0.81 440 0.39 86.18 0.08 189.60 0.17
C7 0.07 972.8 0.69 397 0.28 100.21 0.07 220.46 0.16
C8 0.05 1024.8 0.53 365 0.19 114.23 0.06 251.31 0.13
C9 0.04 1069.8 0.46 331 0.14 128.20 0.06 282.04 0.12
C10+ 0.08 1111.9 0.87 306 0.24 142.29 0.11 313.04 0.24
Total 100 354.76 671.46 17.82 38.56
Table B.6: Russian Gas Composition.
RUSSIAN GAS COMPOSITION
COMP
ONENT
%
mol Tc (
0R)
WEIGH
TED Tc
(0R)
Pc
(psi)
WEIGH
TED Pc
(psi)
Mw
(g/mol)
WEIGH
TED Mw
(g/mol)
Mw
(lb/mol)
WEIGH
TED
Mw
(lb/mol)
C1 98.55 344 339.23 673 663.50 16.043 15.81 35.2946 34.78
C2 0.43 550 2.36 709 3.05 30.069 0.13 66.1518 0.28
C3 0.13 666 0.87 617 0.80 44.08 0.06 96.976 0.13
C4 0.05 766 0.38 551 0.28 58.123 0.03 127.871 0.06
C5+ 0.01 846 0.08 489 0.05 72.15 0.01 158.73 0.02
N2 0.79 272 2.15 493 3.89 28.01 0.22 61.622 0.49
CO2 0.04 548 0.22 1071 0.43 44.01 0.02 96.822 0.04
Total 100 345 672 16.3 35.8

95
Table B.7: PVT Properties.
PVT PROPERTIES P, bar P, psi Bg, m3/sm3 Eg, sm3/m3 µ, cp z
1 14.7 1.18162 0.8462958 0.01248 0.991
9 132.3 0.13157 7.6005168 0.01255 0.988
18 264.6 0.06499 15.3869826 0.01265 0.976
27 396.9 0.04282 23.3535731 0.01279 0.964
36 529.2 0.03175 31.4960630 0.01295 0.953
45 661.5 0.02511 39.8247710 0.01313 0.943
54 793.8 0.02070 48.3091787 0.01333 0.933
63 926.1 0.01756 56.9476082 0.01355 0.923
72 1058.4 0.01522 65.7030223 0.01379 0.914
81 1190.7 0.01340 74.6268657 0.01405 0.906
90 1323 0.01196 83.6120401 0.01433 0.898
99 1455.3 0.01079 92.6784059 0.01463 0.891
108 1587.6 0.00982 101.8329939 0.01494 0.884
117 1719.9 0.00901 110.9877913 0.01528 0.879
126 1852.2 0.00832 120.1923077 0.01563 0.875
135 1984.5 0.00774 129.1989664 0.01600 0.871
144 2116.8 0.00723 138.3125864 0.01638 0.868
153 2249.1 0.00679 147.2754050 0.01678 0.866
162 2381.4 0.00640 156.2500000 0.01719 0.865

96
Table B.8: Solution gas oil ratio, Rs.
CALCULATED Rs VALUES
P, bar P, psi Rs
1 14.7 3.8469
9 132.3 13.7138
18 264.6 28.2133
27 396.9 45.4595
36 529.2 65.0463
45 661.5 86.7464
54 793.8 110.4196
63 926.1 135.9771
72 1058.4 163.3630
81 1190.7 192.5455
90 1323 223.5110
99 1455.3 256.2607
108 1587.6 290.8085
117 1719.9 327.1800
126 1852.2 365.4116
135 1984.5 405.5506
144 2116.8 447.6552
153 2249.1 491.7949
162 2381.4 538.0517

97
APPENDIX C
CMG IMEX OUTPUT DATA
Table C.1: CMG IMEX Numerical simulation results for assumed Skin 0.
Skin 0
Darcy Flow
Non-Darcy Flow
FG1
Non-Darcy Flow
FG2
Non-Darcy Flow
Geertsma
DATE
Gas Rate
SC -
Monthly Pbh Pr Pbh Pr Pbh Pr Pbh Pr
(ft3/day) (psi) (psi) (psi) (psi) (psi) (psi) (psi) (psi)
8/31/1997 0 0 0 0 0 0 0 0 0
9/1/1997 90.2957 0 2050.01 0 2060.53 0 2060.53 0 2060.53
9/1/1997 112.87 2035.14 2050.01 2045.54 2060.53 2045.54 2060.53 2046.09 2060.53
9/1/1997 225.739 2020.48 2050.01 2030.82 2060.53 2030.81 2060.53 2030.73 2060.53
9/1/1997 790.087 2020.57 2050.01 2030.92 2060.53 2030.92 2060.53 2030.88 2060.53
9/1/1997 3611.83 2020.56 2050.01 2030.91 2060.53 2030.9 2060.53 2030.88 2060.53
9/2/1997 17720.5 2020.55 2050.01 2030.89 2060.53 2030.89 2060.53 2030.87 2060.53
9/10/1997 88264.1 2020.54 2050.01 2030.88 2060.52 2030.88 2060.52 2030.85 2060.52
9/30/1997 270887 2020.53 2050.01 2030.87 2060.48 2030.87 2060.48 2030.84 2060.48
10/1/1997 272432 2020.53 2050.01 2030.87 2060.48 2030.87 2060.48 2030.84 2060.48
10/1/1997 272819 2033.38 2050.01 2043.78 2060.48 2043.79 2060.48 2044.92 2060.48
10/1/1997 274750 2018.48 2050.01 2028.72 2060.48 2028.66 2060.48 2027.62 2060.48
10/1/1997 284406 2018.36 2050.01 2028.66 2060.48 2028.63 2060.48 2027.69 2060.48
10/1/1997 332688 2018.14 2050.01 2028.45 2060.48 2028.42 2060.48 2027.45 2060.48
10/2/1997 574098 2017.92 2050.01 2028.23 2060.48 2028.2 2060.48 2027.2 2060.48
10/10/1997 1.78E+06 2017.7 2050.01 2028.01 2060.48 2027.98 2060.48 2026.96 2060.48
10/31/1997 5.06E+06 2017.53 2050.01 2027.84 2060.48 2027.82 2060.48 2026.78 2060.48
11/1/1997 5.06E+06 2017.53 2050.01 2027.84 2060.48 2027.82 2060.48 2026.78 2060.48
11/1/1997 5.06E+06 2031.77 2050.01 2042.18 2060.48 2042.25 2060.48 2043.06 2060.48
11/1/1997 5.06E+06 2017.1 2050.01 2027.33 2060.48 2027.25 2060.48 2025.85 2060.48
11/1/1997 5.06E+06 2017.17 2050.01 2027.46 2060.48 2027.42 2060.48 2026.17 2060.48
11/1/1997 5.07E+06 2017.13 2050.01 2027.43 2060.48 2027.39 2060.48 2026.15 2060.48
11/2/1997 5.11E+06 2017.08 2050.01 2027.38 2060.48 2027.35 2060.48 2026.1 2060.48
11/10/1997 5.32E+06 2017.01 2050.01 2027.31 2060.48 2027.27 2060.48 2026.02 2060.48
11/30/1997 5.86E+06 2016.92 2050.01 2027.22 2060.48 2027.19 2060.48 2025.92 2060.48
12/1/1997 5.86E+06 2016.92 2050.01 2027.22 2060.48 2027.19 2060.48 2025.92 2060.48
12/1/1997 5.86E+06 2031.31 2050.01 2041.72 2060.48 2041.8 2060.48 2042.44 2060.48
12/1/1997 5.87E+06 2016.68 2050.01 2026.89 2060.48 2026.81 2060.48 2025.28 2060.48
12/1/1997 5.87E+06 2016.76 2050.01 2027.05 2060.48 2027.01 2060.48 2025.63 2060.48
12/1/1997 5.87E+06 2016.74 2050.01 2027.04 2060.48 2027 2060.48 2025.65 2060.48
12/2/1997 5.89E+06 2016.72 2050.01 2027.02 2060.48 2026.98 2060.48 2025.63 2060.48
12/10/1997 5.97E+06 2016.68 2050.01 2026.98 2060.48 2026.94 2060.48 2025.58 2060.48
12/31/1997 6.21E+06 2016.62 2050.01 2026.92 2060.48 2026.88 2060.48 2025.52 2060.48
1/1/1998 6.21E+06 2016.62 2050.01 2026.92 2060.48 2026.88 2060.48 2025.52 2060.48
1/1/1998 6.21E+06 2031.16 2050.01 2041.57 2060.48 2041.65 2060.48 2042.25 2060.48
1/1/1998 6.21E+06 2016.54 2050.01 2026.76 2060.48 2026.68 2060.48 2025.15 2060.48
1/1/1998 6.21E+06 2016.65 2050.01 2026.94 2060.48 2026.9 2060.48 2025.52 2060.48
1/1/1998 6.21E+06 2016.65 2050.01 2026.95 2060.48 2026.91 2060.48 2025.56 2060.48

98
1/2/1998 6.21E+06 2016.65 2050.01 2026.95 2060.48 2026.91 2060.48 2025.56 2060.48
1/10/1998 6.19E+06 2016.64 2050.01 2026.93 2060.48 2026.9 2060.48 2025.55 2060.48
1/31/1998 6.14E+06 2016.6 2050.01 2026.9 2060.48 2026.86 2060.48 2025.51 2060.48
2/1/1998 6.14E+06 2016.6 2050.01 2026.9 2060.48 2026.86 2060.48 2025.51 2060.48
2/1/1998 6.14E+06 2031.14 2050.01 2041.55 2060.48 2041.63 2060.48 2042.24 2060.48
2/1/1998 6.14E+06 2016.52 2050.01 2026.74 2060.48 2026.66 2060.48 2025.13 2060.48
2/1/1998 6.14E+06 2016.62 2050.01 2026.92 2060.48 2026.88 2060.48 2025.51 2060.48
2/1/1998 6.14E+06 2016.63 2050.01 2026.93 2060.48 2026.89 2060.48 2025.55 2060.48
2/2/1998 6.14E+06 2016.63 2050.01 2026.93 2060.48 2026.89 2060.48 2025.55 2060.48
2/10/1998 6.12E+06 2016.62 2050 2026.92 2060.48 2026.88 2060.48 2025.54 2060.48
2/28/1998 6.09E+06 2016.6 2050 2026.89 2060.47 2026.86 2060.47 2025.52 2060.47
3/1/1998 6.08E+06 2016.6 2050 2026.89 2060.47 2026.86 2060.47 2025.52 2060.47
3/1/1998 6.08E+06 2031.26 2050 2041.68 2060.47 2041.77 2060.47 2042.46 2060.47
3/1/1998 6.08E+06 2016.67 2050 2026.9 2060.47 2026.82 2060.47 2025.39 2060.47
3/1/1998 6.08E+06 2016.79 2050 2027.09 2060.47 2027.05 2060.47 2025.79 2060.47
3/1/1998 6.08E+06 2016.81 2050 2027.12 2060.47 2027.08 2060.47 2025.85 2060.47
3/2/1998 6.06E+06 2016.83 2050 2027.13 2060.47 2027.1 2060.47 2025.88 2060.47
3/10/1998 5.95E+06 2016.84 2050 2027.14 2060.47 2027.11 2060.47 2025.89 2060.47
3/31/1998 5.65E+06 2016.83 2050 2027.14 2060.47 2027.11 2060.47 2025.88 2060.47
4/1/1998 5.65E+06 2016.83 2050 2027.14 2060.47 2027.11 2060.47 2025.88 2060.47
4/1/1998 5.65E+06 2030.76 2050 2041.16 2060.47 2041.23 2060.47 2041.7 2060.47
4/1/1998 5.65E+06 2016.05 2050 2026.25 2060.47 2026.15 2060.47 2024.37 2060.47
4/1/1998 5.66E+06 2016.07 2050 2026.35 2060.47 2026.29 2060.47 2024.63 2060.47
4/1/1998 5.67E+06 2016 2050 2026.28 2060.47 2026.22 2060.47 2024.57 2060.47
4/2/1998 5.76E+06 2015.92 2050 2026.2 2060.47 2026.15 2060.47 2024.48 2060.47
4/10/1998 6.20E+06 2015.84 2049.99 2026.12 2060.46 2026.07 2060.46 2024.39 2060.47
4/30/1998 7.32E+06 2015.77 2049.99 2026.05 2060.46 2026 2060.46 2024.31 2060.46
5/1/1998 7.32E+06 2015.77 2049.99 2026.05 2060.46 2026 2060.46 2024.31 2060.46
5/1/1998 7.32E+06 2030.36 2049.99 2040.76 2060.46 2040.85 2060.46 2041.12 2060.46
5/1/1998 7.32E+06 2015.76 2049.99 2025.96 2060.46 2025.86 2060.46 2024.05 2060.46
5/1/1998 7.32E+06 2015.87 2049.99 2026.15 2060.46 2026.09 2060.46 2024.43 2060.46
5/1/1998 7.32E+06 2015.88 2049.99 2026.16 2060.46 2026.11 2060.46 2024.48 2060.46
5/2/1998 7.31E+06 2015.88 2049.99 2026.17 2060.46 2026.12 2060.46 2024.49 2060.46
5/10/1998 7.25E+06 2015.88 2049.99 2026.16 2060.46 2026.11 2060.46 2024.48 2060.46
5/31/1998 7.11E+06 2015.85 2049.98 2026.13 2060.45 2026.08 2060.45 2024.46 2060.45
6/1/1998 7.11E+06 2015.85 2049.98 2026.13 2060.45 2026.08 2060.45 2024.46 2060.45
6/1/1998 7.11E+06 2029.56 2049.98 2039.94 2060.45 2040 2060.45 2039.9 2060.45
6/1/1998 7.11E+06 2014.82 2049.98 2024.98 2060.45 2024.85 2060.45 2022.53 2060.45
6/1/1998 7.11E+06 2014.82 2049.98 2025.05 2060.45 2024.96 2060.45 2022.71 2060.45
6/1/1998 7.14E+06 2014.71 2049.98 2024.96 2060.45 2024.87 2060.45 2022.61 2060.45
6/2/1998 7.25E+06 2014.61 2049.98 2024.85 2060.45 2024.77 2060.45 2022.49 2060.45
6/10/1998 7.85E+06 2014.49 2049.98 2024.74 2060.45 2024.66 2060.45 2022.37 2060.45
6/30/1998 9.38E+06 2014.4 2049.97 2024.64 2060.44 2024.56 2060.44 2022.26 2060.45
7/1/1998 9.38E+06 2014.4 2049.97 2024.64 2060.44 2024.56 2060.44 2022.26 2060.45
7/1/1998 9.38E+06 2028.71 2049.97 2039.08 2060.44 2039.15 2060.44 2038.6 2060.45
7/1/1998 9.38E+06 2014.08 2049.97 2024.22 2060.44 2024.09 2060.44 2021.53 2060.45
7/1/1998 9.38E+06 2014.16 2049.97 2024.38 2060.44 2024.28 2060.44 2021.81 2060.45
7/1/1998 9.39E+06 2014.13 2049.97 2024.36 2060.44 2024.27 2060.44 2021.81 2060.45
7/2/1998 9.41E+06 2014.1 2049.97 2024.33 2060.44 2024.24 2060.44 2021.78 2060.44
7/10/1998 9.54E+06 2014.05 2049.97 2024.28 2060.44 2024.19 2060.44 2021.73 2060.44
7/31/1998 9.91E+06 2013.98 2049.96 2024.22 2060.43 2024.13 2060.43 2021.65 2060.44
8/1/1998 9.91E+06 2013.98 2049.96 2024.22 2060.43 2024.13 2060.43 2021.65 2060.44
8/1/1998 9.91E+06 2029.17 2049.96 2039.56 2060.43 2039.65 2060.43 2039.39 2060.44
8/1/1998 9.91E+06 2014.67 2049.96 2024.85 2060.43 2024.74 2060.43 2022.59 2060.44
8/1/1998 9.90E+06 2014.86 2049.96 2025.13 2060.43 2025.06 2060.43 2023.07 2060.44
8/1/1998 9.88E+06 2014.95 2049.96 2025.22 2060.43 2025.16 2060.43 2023.22 2060.44
8/2/1998 9.78E+06 2015.04 2049.96 2025.31 2060.43 2025.25 2060.43 2023.33 2060.43
8/10/1998 9.29E+06 2015.11 2049.96 2025.38 2060.43 2025.32 2060.43 2023.42 2060.43

99
8/31/1998 7.97E+06 2015.13 2049.95 2025.4 2060.42 2025.34 2060.42 2023.45 2060.42
9/1/1998 7.97E+06 2015.13 2049.95 2025.4 2060.42 2025.34 2060.42 2023.45 2060.42
9/1/1998 7.97E+06 2028.63 2049.95 2039 2060.42 2039.05 2060.42 2038.55 2060.42
9/1/1998 7.97E+06 2013.87 2049.95 2024 2060.42 2023.86 2060.42 2021.15 2060.42
9/1/1998 7.97E+06 2013.84 2049.95 2024.05 2060.42 2023.94 2060.42 2021.25 2060.42
9/1/1998 8.00E+06 2013.72 2049.95 2023.93 2060.42 2023.82 2060.42 2021.11 2060.42
9/2/1998 8.15E+06 2013.59 2049.95 2023.8 2060.42 2023.69 2060.42 2020.97 2060.42
9/10/1998 8.89E+06 2013.46 2049.95 2023.67 2060.42 2023.57 2060.42 2020.82 2060.42
9/30/1998 1.08E+07 2013.36 2049.94 2023.57 2060.41 2023.46 2060.41 2020.7 2060.41
10/1/1998 1.08E+07 2013.36 2049.94 2023.57 2060.41 2023.46 2060.41 2020.7 2060.41
10/1/1998 1.08E+07 2027.82 2049.94 2038.17 2060.41 2038.23 2060.41 2037.26 2060.41
10/1/1998 1.08E+07 2013.22 2049.94 2023.34 2060.41 2023.19 2060.41 2020.32 2060.41
10/1/1998 1.08E+07 2013.32 2049.94 2023.52 2060.41 2023.4 2060.41 2020.59 2060.41
10/1/1998 1.08E+07 2013.31 2049.94 2023.52 2060.41 2023.41 2060.41 2020.62 2060.41
10/2/1998 1.08E+07 2013.3 2049.94 2023.51 2060.41 2023.4 2060.41 2020.61 2060.41
10/10/1998 1.08E+07 2013.27 2049.94 2023.48 2060.41 2023.37 2060.41 2020.58 2060.41
10/31/1998 1.09E+07 2013.22 2049.93 2023.43 2060.4 2023.32 2060.4 2020.52 2060.4
11/1/1998 1.09E+07 2013.22 2049.93 2023.43 2060.4 2023.32 2060.4 2020.52 2060.4
11/1/1998 1.09E+07 2027.55 2049.93 2037.89 2060.4 2037.94 2060.4 2036.86 2060.4
11/1/1998 1.09E+07 2012.93 2049.93 2023.04 2060.4 2022.89 2060.4 2019.89 2060.4
11/1/1998 1.09E+07 2013.01 2049.93 2023.2 2060.4 2023.08 2060.4 2020.13 2060.4
11/1/1998 1.09E+07 2012.99 2049.93 2023.19 2060.4 2023.07 2060.4 2020.13 2060.4
11/2/1998 1.09E+07 2012.96 2049.93 2023.16 2060.4 2023.05 2060.4 2020.1 2060.4
11/10/1998 1.10E+07 2012.93 2049.92 2023.12 2060.39 2023.01 2060.39 2020.06 2060.39
11/30/1998 1.14E+07 2012.88 2049.91 2023.07 2060.38 2022.96 2060.38 2020.01 2060.39
12/1/1998 1.14E+07 2012.88 2049.91 2023.07 2060.38 2022.96 2060.38 2020.01 2060.39
12/1/1998 1.14E+07 2027.2 2049.91 2037.53 2060.38 2037.58 2060.38 2036.33 2060.39
12/1/1998 1.14E+07 2012.58 2049.91 2022.68 2060.38 2022.53 2060.38 2019.39 2060.39
12/1/1998 1.14E+07 2012.66 2049.91 2022.84 2060.38 2022.71 2060.38 2019.61 2060.39
12/1/1998 1.14E+07 2012.64 2049.91 2022.83 2060.38 2022.7 2060.38 2019.6 2060.39
12/2/1998 1.14E+07 2012.62 2049.91 2022.8 2060.38 2022.68 2060.38 2019.58 2060.38
12/10/1998 1.15E+07 2012.58 2049.91 2022.77 2060.38 2022.64 2060.38 2019.54 2060.38
12/31/1998 1.18E+07 2012.53 2049.9 2022.71 2060.37 2022.59 2060.37 2019.48 2060.37
1/1/1999 1.18E+07 2012.53 2049.9 2022.71 2060.37 2022.59 2060.37 2019.48 2060.37
1/1/1999 1.18E+07 2027.25 2049.9 2037.58 2060.37 2037.64 2060.37 2036.44 2060.37
1/1/1999 1.18E+07 2012.69 2049.9 2022.8 2060.37 2022.65 2060.37 2019.64 2060.37
1/1/1999 1.18E+07 2012.82 2049.9 2023.02 2060.37 2022.9 2060.37 2019.95 2060.37
1/1/1999 1.18E+07 2012.85 2049.9 2023.05 2060.37 2022.94 2060.37 2020.02 2060.37
1/2/1999 1.18E+07 2012.88 2049.89 2023.08 2060.37 2022.97 2060.37 2020.06 2060.37
1/10/1999 1.16E+07 2012.89 2049.89 2023.09 2060.36 2022.98 2060.36 2020.07 2060.36
1/31/1999 1.12E+07 2012.88 2049.88 2023.08 2060.35 2022.97 2060.35 2020.06 2060.35
2/1/1999 1.12E+07 2012.88 2049.88 2023.08 2060.35 2022.97 2060.35 2020.06 2060.35
2/1/1999 1.12E+07 2027.25 2049.88 2037.58 2060.35 2037.63 2060.35 2036.46 2060.35
2/1/1999 1.12E+07 2012.63 2049.88 2022.74 2060.35 2022.59 2060.35 2019.52 2060.35
2/1/1999 1.12E+07 2012.72 2049.88 2022.91 2060.35 2022.78 2060.35 2019.76 2060.35
2/1/1999 1.12E+07 2012.7 2049.88 2022.9 2060.35 2022.78 2060.35 2019.76 2060.35
2/2/1999 1.12E+07 2012.69 2049.88 2022.88 2060.35 2022.76 2060.35 2019.75 2060.35
2/10/1999 1.13E+07 2012.66 2049.87 2022.86 2060.34 2022.74 2060.34 2019.72 2060.35
2/28/1999 1.15E+07 2012.64 2049.86 2022.83 2060.33 2022.71 2060.33 2019.69 2060.34
3/1/1999 1.15E+07 2012.64 2049.86 2022.83 2060.33 2022.71 2060.33 2019.69 2060.34
3/1/1999 1.15E+07 2027.16 2049.86 2037.49 2060.33 2037.55 2060.33 2036.34 2060.34
3/1/1999 1.15E+07 2012.57 2049.86 2022.68 2060.33 2022.53 2060.33 2019.47 2060.34
3/1/1999 1.15E+07 2012.68 2049.86 2022.87 2060.33 2022.74 2060.33 2019.74 2060.34
3/1/1999 1.15E+07 2012.68 2049.86 2022.88 2060.33 2022.76 2060.33 2019.77 2060.34
3/2/1999 1.15E+07 2012.69 2049.86 2022.88 2060.33 2022.77 2060.33 2019.78 2060.34
3/10/1999 1.15E+07 2012.68 2049.86 2022.88 2060.33 2022.76 2060.33 2019.77 2060.33
3/31/1999 1.14E+07 2012.66 2049.84 2022.85 2060.31 2022.74 2060.31 2019.75 2060.32
4/1/1999 1.14E+07 2012.66 2049.84 2022.85 2060.31 2022.74 2060.31 2019.75 2060.32
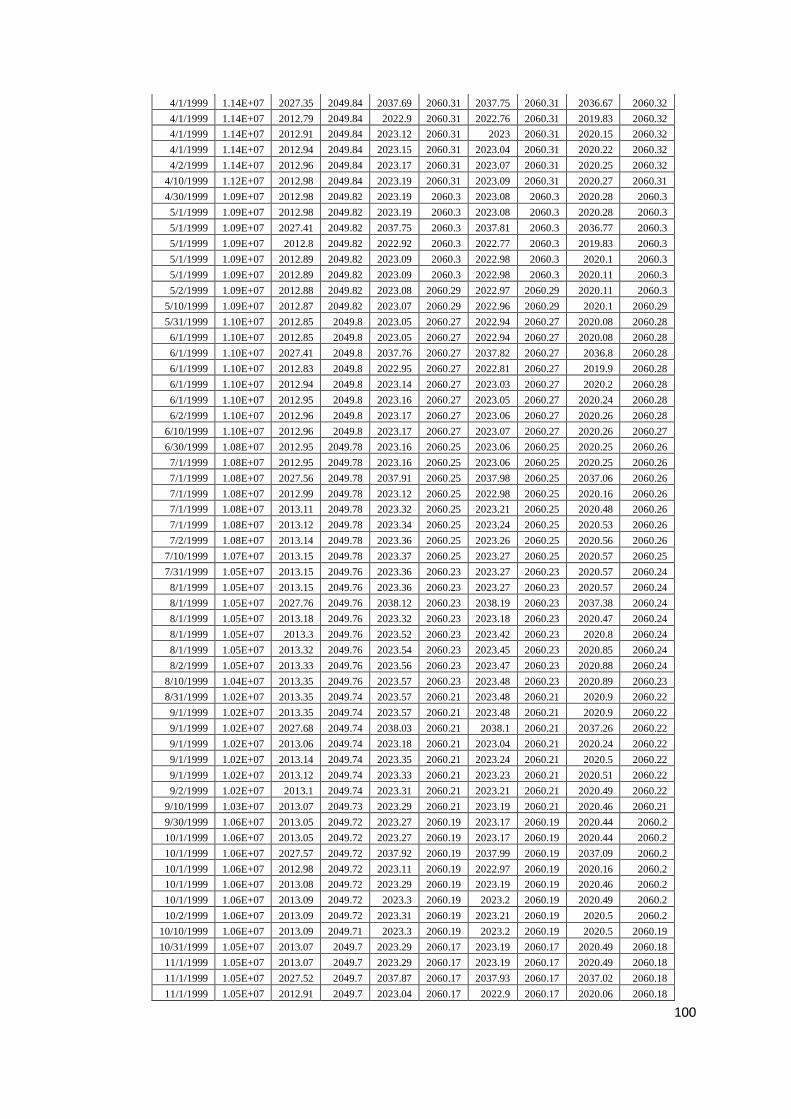
100
4/1/1999 1.14E+07 2027.35 2049.84 2037.69 2060.31 2037.75 2060.31 2036.67 2060.32
4/1/1999 1.14E+07 2012.79 2049.84 2022.9 2060.31 2022.76 2060.31 2019.83 2060.32
4/1/1999 1.14E+07 2012.91 2049.84 2023.12 2060.31 2023 2060.31 2020.15 2060.32
4/1/1999 1.14E+07 2012.94 2049.84 2023.15 2060.31 2023.04 2060.31 2020.22 2060.32
4/2/1999 1.14E+07 2012.96 2049.84 2023.17 2060.31 2023.07 2060.31 2020.25 2060.32
4/10/1999 1.12E+07 2012.98 2049.84 2023.19 2060.31 2023.09 2060.31 2020.27 2060.31
4/30/1999 1.09E+07 2012.98 2049.82 2023.19 2060.3 2023.08 2060.3 2020.28 2060.3
5/1/1999 1.09E+07 2012.98 2049.82 2023.19 2060.3 2023.08 2060.3 2020.28 2060.3
5/1/1999 1.09E+07 2027.41 2049.82 2037.75 2060.3 2037.81 2060.3 2036.77 2060.3
5/1/1999 1.09E+07 2012.8 2049.82 2022.92 2060.3 2022.77 2060.3 2019.83 2060.3
5/1/1999 1.09E+07 2012.89 2049.82 2023.09 2060.3 2022.98 2060.3 2020.1 2060.3
5/1/1999 1.09E+07 2012.89 2049.82 2023.09 2060.3 2022.98 2060.3 2020.11 2060.3
5/2/1999 1.09E+07 2012.88 2049.82 2023.08 2060.29 2022.97 2060.29 2020.11 2060.3
5/10/1999 1.09E+07 2012.87 2049.82 2023.07 2060.29 2022.96 2060.29 2020.1 2060.29
5/31/1999 1.10E+07 2012.85 2049.8 2023.05 2060.27 2022.94 2060.27 2020.08 2060.28
6/1/1999 1.10E+07 2012.85 2049.8 2023.05 2060.27 2022.94 2060.27 2020.08 2060.28
6/1/1999 1.10E+07 2027.41 2049.8 2037.76 2060.27 2037.82 2060.27 2036.8 2060.28
6/1/1999 1.10E+07 2012.83 2049.8 2022.95 2060.27 2022.81 2060.27 2019.9 2060.28
6/1/1999 1.10E+07 2012.94 2049.8 2023.14 2060.27 2023.03 2060.27 2020.2 2060.28
6/1/1999 1.10E+07 2012.95 2049.8 2023.16 2060.27 2023.05 2060.27 2020.24 2060.28
6/2/1999 1.10E+07 2012.96 2049.8 2023.17 2060.27 2023.06 2060.27 2020.26 2060.28
6/10/1999 1.10E+07 2012.96 2049.8 2023.17 2060.27 2023.07 2060.27 2020.26 2060.27
6/30/1999 1.08E+07 2012.95 2049.78 2023.16 2060.25 2023.06 2060.25 2020.25 2060.26
7/1/1999 1.08E+07 2012.95 2049.78 2023.16 2060.25 2023.06 2060.25 2020.25 2060.26
7/1/1999 1.08E+07 2027.56 2049.78 2037.91 2060.25 2037.98 2060.25 2037.06 2060.26
7/1/1999 1.08E+07 2012.99 2049.78 2023.12 2060.25 2022.98 2060.25 2020.16 2060.26
7/1/1999 1.08E+07 2013.11 2049.78 2023.32 2060.25 2023.21 2060.25 2020.48 2060.26
7/1/1999 1.08E+07 2013.12 2049.78 2023.34 2060.25 2023.24 2060.25 2020.53 2060.26
7/2/1999 1.08E+07 2013.14 2049.78 2023.36 2060.25 2023.26 2060.25 2020.56 2060.26
7/10/1999 1.07E+07 2013.15 2049.78 2023.37 2060.25 2023.27 2060.25 2020.57 2060.25
7/31/1999 1.05E+07 2013.15 2049.76 2023.36 2060.23 2023.27 2060.23 2020.57 2060.24
8/1/1999 1.05E+07 2013.15 2049.76 2023.36 2060.23 2023.27 2060.23 2020.57 2060.24
8/1/1999 1.05E+07 2027.76 2049.76 2038.12 2060.23 2038.19 2060.23 2037.38 2060.24
8/1/1999 1.05E+07 2013.18 2049.76 2023.32 2060.23 2023.18 2060.23 2020.47 2060.24
8/1/1999 1.05E+07 2013.3 2049.76 2023.52 2060.23 2023.42 2060.23 2020.8 2060.24
8/1/1999 1.05E+07 2013.32 2049.76 2023.54 2060.23 2023.45 2060.23 2020.85 2060.24
8/2/1999 1.05E+07 2013.33 2049.76 2023.56 2060.23 2023.47 2060.23 2020.88 2060.24
8/10/1999 1.04E+07 2013.35 2049.76 2023.57 2060.23 2023.48 2060.23 2020.89 2060.23
8/31/1999 1.02E+07 2013.35 2049.74 2023.57 2060.21 2023.48 2060.21 2020.9 2060.22
9/1/1999 1.02E+07 2013.35 2049.74 2023.57 2060.21 2023.48 2060.21 2020.9 2060.22
9/1/1999 1.02E+07 2027.68 2049.74 2038.03 2060.21 2038.1 2060.21 2037.26 2060.22
9/1/1999 1.02E+07 2013.06 2049.74 2023.18 2060.21 2023.04 2060.21 2020.24 2060.22
9/1/1999 1.02E+07 2013.14 2049.74 2023.35 2060.21 2023.24 2060.21 2020.5 2060.22
9/1/1999 1.02E+07 2013.12 2049.74 2023.33 2060.21 2023.23 2060.21 2020.51 2060.22
9/2/1999 1.02E+07 2013.1 2049.74 2023.31 2060.21 2023.21 2060.21 2020.49 2060.22
9/10/1999 1.03E+07 2013.07 2049.73 2023.29 2060.21 2023.19 2060.21 2020.46 2060.21
9/30/1999 1.06E+07 2013.05 2049.72 2023.27 2060.19 2023.17 2060.19 2020.44 2060.2
10/1/1999 1.06E+07 2013.05 2049.72 2023.27 2060.19 2023.17 2060.19 2020.44 2060.2
10/1/1999 1.06E+07 2027.57 2049.72 2037.92 2060.19 2037.99 2060.19 2037.09 2060.2
10/1/1999 1.06E+07 2012.98 2049.72 2023.11 2060.19 2022.97 2060.19 2020.16 2060.2
10/1/1999 1.06E+07 2013.08 2049.72 2023.29 2060.19 2023.19 2060.19 2020.46 2060.2
10/1/1999 1.06E+07 2013.09 2049.72 2023.3 2060.19 2023.2 2060.19 2020.49 2060.2
10/2/1999 1.06E+07 2013.09 2049.72 2023.31 2060.19 2023.21 2060.19 2020.5 2060.2
10/10/1999 1.06E+07 2013.09 2049.71 2023.3 2060.19 2023.2 2060.19 2020.5 2060.19
10/31/1999 1.05E+07 2013.07 2049.7 2023.29 2060.17 2023.19 2060.17 2020.49 2060.18
11/1/1999 1.05E+07 2013.07 2049.7 2023.29 2060.17 2023.19 2060.17 2020.49 2060.18
11/1/1999 1.05E+07 2027.52 2049.7 2037.87 2060.17 2037.93 2060.17 2037.02 2060.18
11/1/1999 1.05E+07 2012.91 2049.7 2023.04 2060.17 2022.9 2060.17 2020.06 2060.18

101
11/1/1999 1.05E+07 2013.01 2049.7 2023.22 2060.17 2023.11 2060.17 2020.34 2060.18
11/1/1999 1.05E+07 2013 2049.7 2023.22 2060.17 2023.11 2060.17 2020.36 2060.18
11/2/1999 1.05E+07 2013 2049.7 2023.21 2060.17 2023.11 2060.17 2020.36 2060.18
11/10/1999 1.06E+07 2012.98 2049.69 2023.2 2060.16 2023.1 2060.16 2020.35 2060.17
11/30/1999 1.07E+07 2012.97 2049.68 2023.18 2060.15 2023.08 2060.15 2020.33 2060.16
12/1/1999 1.07E+07 2012.97 2049.68 2023.18 2060.15 2023.08 2060.15 2020.33 2060.16
12/1/1999 1.07E+07 2027.38 2049.68 2037.72 2060.15 2037.78 2060.15 2036.8 2060.16
12/1/1999 1.07E+07 2012.77 2049.68 2022.89 2060.15 2022.74 2060.15 2019.84 2060.16
12/1/1999 1.07E+07 2012.86 2049.68 2023.06 2060.15 2022.95 2060.15 2020.11 2060.16
12/1/1999 1.07E+07 2012.85 2049.68 2023.06 2060.15 2022.95 2060.15 2020.13 2060.16
12/2/1999 1.07E+07 2012.84 2049.68 2023.05 2060.15 2022.94 2060.15 2020.12 2060.15
12/10/1999 1.08E+07 2012.82 2049.67 2023.03 2060.14 2022.92 2060.14 2020.1 2060.15
12/31/1999 1.09E+07 2012.8 2049.66 2023.01 2060.13 2022.9 2060.13 2020.08 2060.13
1/1/2000 1.09E+07 2012.8 2049.66 2023.01 2060.13 2022.9 2060.13 2020.08 2060.13
1/1/2000 1.09E+07 2027.13 2049.66 2037.47 2060.13 2037.52 2060.13 2036.42 2060.13
1/1/2000 1.09E+07 2012.51 2049.66 2022.62 2060.13 2022.47 2060.13 2019.45 2060.13
1/1/2000 1.09E+07 2012.59 2049.66 2022.78 2060.13 2022.66 2060.13 2019.69 2060.13
1/1/2000 1.09E+07 2012.57 2049.66 2022.77 2060.13 2022.65 2060.13 2019.69 2060.13
1/2/2000 1.09E+07 2012.55 2049.66 2022.75 2060.13 2022.63 2060.13 2019.67 2060.13
1/10/2000 1.11E+07 2012.52 2049.65 2022.72 2060.12 2022.6 2060.12 2019.64 2060.13
1/31/2000 1.14E+07 2012.49 2049.64 2022.69 2060.11 2022.57 2060.11 2019.6 2060.11
2/1/2000 1.14E+07 2012.49 2049.64 2022.69 2060.11 2022.57 2060.11 2019.6 2060.11
2/1/2000 1.14E+07 2026.88 2049.64 2037.21 2060.11 2037.26 2060.11 2036.03 2060.11
2/1/2000 1.14E+07 2012.27 2049.64 2022.38 2060.11 2022.23 2060.11 2019.12 2060.11
2/1/2000 1.14E+07 2012.36 2049.64 2022.55 2060.11 2022.42 2060.11 2019.35 2060.11
2/1/2000 1.14E+07 2012.35 2049.64 2022.54 2060.11 2022.42 2060.11 2019.36 2060.11
2/2/2000 1.14E+07 2012.34 2049.64 2022.53 2060.11 2022.41 2060.11 2019.35 2060.11
2/10/2000 1.15E+07 2012.31 2049.63 2022.51 2060.1 2022.39 2060.1 2019.33 2060.11
2/29/2000 1.16E+07 2012.28 2049.62 2022.48 2060.09 2022.36 2060.09 2019.29 2060.09
3/1/2000 1.16E+07 2012.28 2049.62 2022.48 2060.09 2022.36 2060.09 2019.29 2060.09
3/1/2000 1.16E+07 2026.85 2049.62 2037.18 2060.09 2037.23 2060.09 2036 2060.09
3/1/2000 1.16E+07 2012.27 2049.62 2022.37 2060.09 2022.22 2060.09 2019.15 2060.09
3/1/2000 1.16E+07 2012.38 2049.62 2022.57 2060.09 2022.44 2060.09 2019.42 2060.09
3/1/2000 1.16E+07 2012.39 2049.62 2022.58 2060.09 2022.46 2060.09 2019.46 2060.09
3/2/2000 1.16E+07 2012.39 2049.61 2022.59 2060.09 2022.47 2060.09 2019.47 2060.09
3/10/2000 1.16E+07 2012.39 2049.61 2022.59 2060.08 2022.47 2060.08 2019.48 2060.09
3/31/2000 1.14E+07 2012.38 2049.59 2022.57 2060.07 2022.46 2060.07 2019.46 2060.07
4/1/2000 1.14E+07 2012.38 2049.59 2022.57 2060.07 2022.46 2060.07 2019.46 2060.07
4/1/2000 1.14E+07 2027.06 2049.59 2037.4 2060.07 2037.46 2060.07 2036.37 2060.07
4/1/2000 1.14E+07 2012.5 2049.59 2022.62 2060.07 2022.47 2060.07 2019.53 2060.07
4/1/2000 1.14E+07 2012.62 2049.59 2022.83 2060.07 2022.71 2060.07 2019.85 2060.07
4/1/2000 1.14E+07 2012.65 2049.59 2022.86 2060.07 2022.75 2060.07 2019.91 2060.07
4/2/2000 1.14E+07 2012.67 2049.59 2022.88 2060.06 2022.78 2060.06 2019.95 2060.07
4/10/2000 1.12E+07 2012.69 2049.59 2022.9 2060.06 2022.79 2060.06 2019.97 2060.07
4/30/2000 1.09E+07 2012.69 2049.57 2022.9 2060.05 2022.8 2060.05 2019.98 2060.05
5/1/2000 1.09E+07 2012.69 2049.57 2022.9 2060.05 2022.8 2060.05 2019.98 2060.05
5/1/2000 1.09E+07 2027.66 2049.57 2038.02 2060.05 2038.1 2060.05 2037.35 2060.05
5/1/2000 1.09E+07 2013.14 2049.57 2023.28 2060.05 2023.16 2060.05 2020.56 2060.05
5/1/2000 1.09E+07 2013.3 2049.57 2023.53 2060.05 2023.44 2060.05 2020.97 2060.05
5/1/2000 1.09E+07 2013.36 2049.57 2023.6 2060.04 2023.52 2060.04 2021.08 2060.05
5/2/2000 1.08E+07 2013.43 2049.57 2023.66 2060.04 2023.58 2060.04 2021.17 2060.05
5/10/2000 1.05E+07 2013.48 2049.57 2023.72 2060.04 2023.64 2060.04 2021.24 2060.04
5/31/2000 9.53E+06 2013.52 2049.55 2023.76 2060.02 2023.68 2060.02 2021.28 2060.03
6/1/2000 9.53E+06 2013.52 2049.55 2023.76 2060.02 2023.68 2060.02 2021.28 2060.03
6/1/2000 9.53E+06 2027.88 2049.55 2038.24 2060.02 2038.31 2060.02 2037.7 2060.03
6/1/2000 9.53E+06 2013.26 2049.55 2023.4 2060.02 2023.27 2060.02 2020.65 2060.03
6/1/2000 9.54E+06 2013.34 2049.55 2023.57 2060.02 2023.47 2060.02 2020.94 2060.03
6/1/2000 9.54E+06 2013.33 2049.55 2023.56 2060.02 2023.47 2060.02 2020.95 2060.03
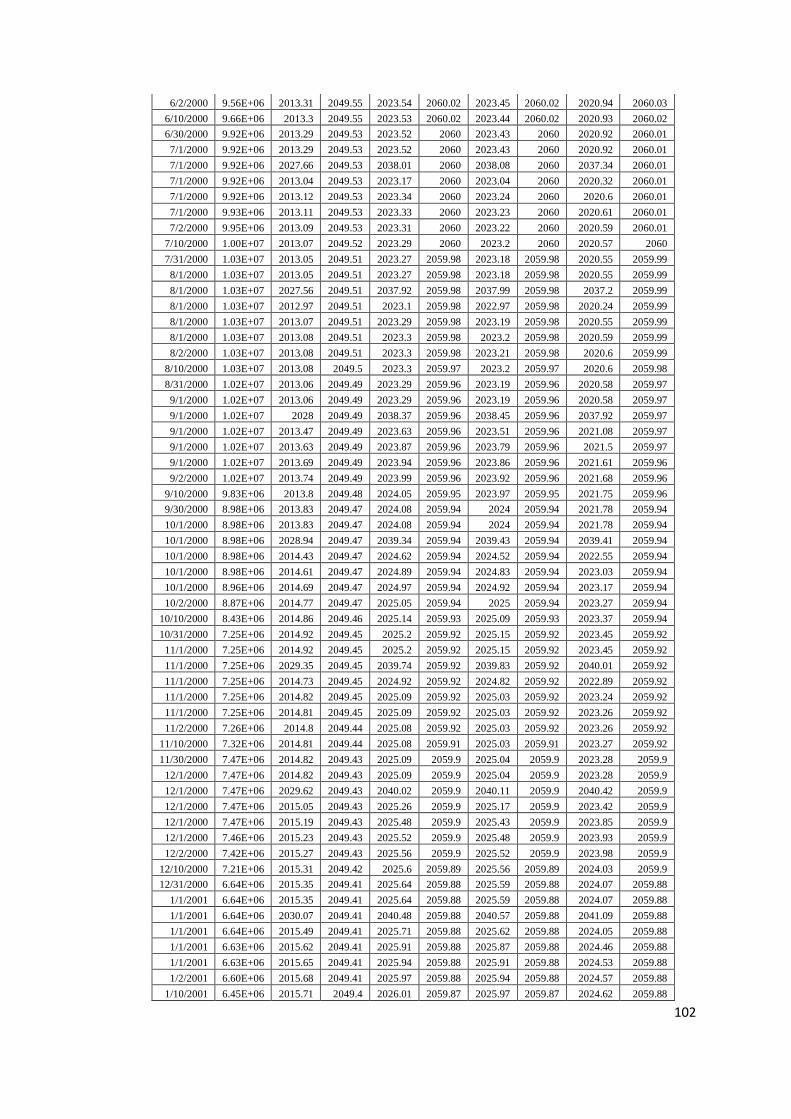
102
6/2/2000 9.56E+06 2013.31 2049.55 2023.54 2060.02 2023.45 2060.02 2020.94 2060.03
6/10/2000 9.66E+06 2013.3 2049.55 2023.53 2060.02 2023.44 2060.02 2020.93 2060.02
6/30/2000 9.92E+06 2013.29 2049.53 2023.52 2060 2023.43 2060 2020.92 2060.01
7/1/2000 9.92E+06 2013.29 2049.53 2023.52 2060 2023.43 2060 2020.92 2060.01
7/1/2000 9.92E+06 2027.66 2049.53 2038.01 2060 2038.08 2060 2037.34 2060.01
7/1/2000 9.92E+06 2013.04 2049.53 2023.17 2060 2023.04 2060 2020.32 2060.01
7/1/2000 9.92E+06 2013.12 2049.53 2023.34 2060 2023.24 2060 2020.6 2060.01
7/1/2000 9.93E+06 2013.11 2049.53 2023.33 2060 2023.23 2060 2020.61 2060.01
7/2/2000 9.95E+06 2013.09 2049.53 2023.31 2060 2023.22 2060 2020.59 2060.01
7/10/2000 1.00E+07 2013.07 2049.52 2023.29 2060 2023.2 2060 2020.57 2060
7/31/2000 1.03E+07 2013.05 2049.51 2023.27 2059.98 2023.18 2059.98 2020.55 2059.99
8/1/2000 1.03E+07 2013.05 2049.51 2023.27 2059.98 2023.18 2059.98 2020.55 2059.99
8/1/2000 1.03E+07 2027.56 2049.51 2037.92 2059.98 2037.99 2059.98 2037.2 2059.99
8/1/2000 1.03E+07 2012.97 2049.51 2023.1 2059.98 2022.97 2059.98 2020.24 2059.99
8/1/2000 1.03E+07 2013.07 2049.51 2023.29 2059.98 2023.19 2059.98 2020.55 2059.99
8/1/2000 1.03E+07 2013.08 2049.51 2023.3 2059.98 2023.2 2059.98 2020.59 2059.99
8/2/2000 1.03E+07 2013.08 2049.51 2023.3 2059.98 2023.21 2059.98 2020.6 2059.99
8/10/2000 1.03E+07 2013.08 2049.5 2023.3 2059.97 2023.2 2059.97 2020.6 2059.98
8/31/2000 1.02E+07 2013.06 2049.49 2023.29 2059.96 2023.19 2059.96 2020.58 2059.97
9/1/2000 1.02E+07 2013.06 2049.49 2023.29 2059.96 2023.19 2059.96 2020.58 2059.97
9/1/2000 1.02E+07 2028 2049.49 2038.37 2059.96 2038.45 2059.96 2037.92 2059.97
9/1/2000 1.02E+07 2013.47 2049.49 2023.63 2059.96 2023.51 2059.96 2021.08 2059.97
9/1/2000 1.02E+07 2013.63 2049.49 2023.87 2059.96 2023.79 2059.96 2021.5 2059.97
9/1/2000 1.02E+07 2013.69 2049.49 2023.94 2059.96 2023.86 2059.96 2021.61 2059.96
9/2/2000 1.02E+07 2013.74 2049.49 2023.99 2059.96 2023.92 2059.96 2021.68 2059.96
9/10/2000 9.83E+06 2013.8 2049.48 2024.05 2059.95 2023.97 2059.95 2021.75 2059.96
9/30/2000 8.98E+06 2013.83 2049.47 2024.08 2059.94 2024 2059.94 2021.78 2059.94
10/1/2000 8.98E+06 2013.83 2049.47 2024.08 2059.94 2024 2059.94 2021.78 2059.94
10/1/2000 8.98E+06 2028.94 2049.47 2039.34 2059.94 2039.43 2059.94 2039.41 2059.94
10/1/2000 8.98E+06 2014.43 2049.47 2024.62 2059.94 2024.52 2059.94 2022.55 2059.94
10/1/2000 8.98E+06 2014.61 2049.47 2024.89 2059.94 2024.83 2059.94 2023.03 2059.94
10/1/2000 8.96E+06 2014.69 2049.47 2024.97 2059.94 2024.92 2059.94 2023.17 2059.94
10/2/2000 8.87E+06 2014.77 2049.47 2025.05 2059.94 2025 2059.94 2023.27 2059.94
10/10/2000 8.43E+06 2014.86 2049.46 2025.14 2059.93 2025.09 2059.93 2023.37 2059.94
10/31/2000 7.25E+06 2014.92 2049.45 2025.2 2059.92 2025.15 2059.92 2023.45 2059.92
11/1/2000 7.25E+06 2014.92 2049.45 2025.2 2059.92 2025.15 2059.92 2023.45 2059.92
11/1/2000 7.25E+06 2029.35 2049.45 2039.74 2059.92 2039.83 2059.92 2040.01 2059.92
11/1/2000 7.25E+06 2014.73 2049.45 2024.92 2059.92 2024.82 2059.92 2022.89 2059.92
11/1/2000 7.25E+06 2014.82 2049.45 2025.09 2059.92 2025.03 2059.92 2023.24 2059.92
11/1/2000 7.25E+06 2014.81 2049.45 2025.09 2059.92 2025.03 2059.92 2023.26 2059.92
11/2/2000 7.26E+06 2014.8 2049.44 2025.08 2059.92 2025.03 2059.92 2023.26 2059.92
11/10/2000 7.32E+06 2014.81 2049.44 2025.08 2059.91 2025.03 2059.91 2023.27 2059.92
11/30/2000 7.47E+06 2014.82 2049.43 2025.09 2059.9 2025.04 2059.9 2023.28 2059.9
12/1/2000 7.47E+06 2014.82 2049.43 2025.09 2059.9 2025.04 2059.9 2023.28 2059.9
12/1/2000 7.47E+06 2029.62 2049.43 2040.02 2059.9 2040.11 2059.9 2040.42 2059.9
12/1/2000 7.47E+06 2015.05 2049.43 2025.26 2059.9 2025.17 2059.9 2023.42 2059.9
12/1/2000 7.47E+06 2015.19 2049.43 2025.48 2059.9 2025.43 2059.9 2023.85 2059.9
12/1/2000 7.46E+06 2015.23 2049.43 2025.52 2059.9 2025.48 2059.9 2023.93 2059.9
12/2/2000 7.42E+06 2015.27 2049.43 2025.56 2059.9 2025.52 2059.9 2023.98 2059.9
12/10/2000 7.21E+06 2015.31 2049.42 2025.6 2059.89 2025.56 2059.89 2024.03 2059.9
12/31/2000 6.64E+06 2015.35 2049.41 2025.64 2059.88 2025.59 2059.88 2024.07 2059.88
1/1/2001 6.64E+06 2015.35 2049.41 2025.64 2059.88 2025.59 2059.88 2024.07 2059.88
1/1/2001 6.64E+06 2030.07 2049.41 2040.48 2059.88 2040.57 2059.88 2041.09 2059.88
1/1/2001 6.64E+06 2015.49 2049.41 2025.71 2059.88 2025.62 2059.88 2024.05 2059.88
1/1/2001 6.63E+06 2015.62 2049.41 2025.91 2059.88 2025.87 2059.88 2024.46 2059.88
1/1/2001 6.63E+06 2015.65 2049.41 2025.94 2059.88 2025.91 2059.88 2024.53 2059.88
1/2/2001 6.60E+06 2015.68 2049.41 2025.97 2059.88 2025.94 2059.88 2024.57 2059.88
1/10/2001 6.45E+06 2015.71 2049.4 2026.01 2059.87 2025.97 2059.87 2024.62 2059.88

103
1/31/2001 6.04E+06 2015.74 2049.39 2026.04 2059.86 2026 2059.86 2024.65 2059.86
2/1/2001 6.04E+06 2015.74 2049.39 2026.04 2059.86 2026 2059.86 2024.65 2059.86
2/1/2001 6.04E+06 2030.13 2049.39 2040.54 2059.86 2040.62 2059.86 2041.17 2059.86
2/1/2001 6.04E+06 2015.5 2049.39 2025.72 2059.86 2025.63 2059.86 2024.02 2059.86
2/1/2001 6.04E+06 2015.59 2049.39 2025.88 2059.86 2025.83 2059.86 2024.37 2059.86
2/1/2001 6.04E+06 2015.57 2049.39 2025.87 2059.86 2025.83 2059.86 2024.38 2059.86
2/2/2001 6.06E+06 2015.56 2049.39 2025.85 2059.86 2025.81 2059.86 2024.37 2059.86
2/10/2001 6.16E+06 2015.55 2049.38 2025.85 2059.85 2025.81 2059.85 2024.37 2059.86
2/28/2001 6.37E+06 2015.55 2049.37 2025.85 2059.84 2025.81 2059.84 2024.37 2059.85
3/1/2001 6.37E+06 2015.55 2049.37 2025.85 2059.84 2025.81 2059.84 2024.37 2059.85
3/1/2001 6.37E+06 2030.24 2049.37 2040.65 2059.84 2040.74 2059.84 2041.33 2059.85
3/1/2001 6.37E+06 2015.66 2049.37 2025.88 2059.84 2025.8 2059.84 2024.29 2059.85
3/1/2001 6.37E+06 2015.78 2049.37 2026.08 2059.84 2026.04 2059.84 2024.69 2059.85
3/1/2001 6.37E+06 2015.8 2049.37 2026.1 2059.84 2026.07 2059.84 2024.75 2059.85
3/2/2001 6.34E+06 2015.83 2049.37 2026.13 2059.84 2026.09 2059.84 2024.79 2059.85
3/10/2001 6.22E+06 2015.85 2049.37 2026.15 2059.84 2026.12 2059.84 2024.81 2059.84
3/31/2001 5.87E+06 2015.87 2049.35 2026.17 2059.82 2026.14 2059.82 2024.84 2059.83
4/1/2001 0 2015.87 2049.35 2026.17 2059.82 2026.14 2059.82 2024.84 2059.83

104
Table C.2: CMG IMEX Numerical simulation results for assumed Skin 5.
Skin 5
Darcy Flow
Non-Darcy Flow
FG1
Non-Darcy Flow
FG2
Non-Darcy Flow
Geertsma
DATE
Gas Rate
SC -
Monthly Pbh Pr Pbh Pr Pbh Pr Pbh Pr
(ft3/day) (psi) (psi) (psi) (psi) (psi) (psi) (psi) (psi)
8/31/1997 0 0 0 0 0 0 0 0 0
9/1/1997 90.2957 0 2050.01 0 2060.53 0 2060.53 0 2060.53
9/1/1997 112.87 2034.99 2050.01 2045.4 2060.53 2045.4 2060.53 2045.83 2060.53
9/1/1997 225.739 2020.41 2050.01 2030.75 2060.53 2030.75 2060.53 2030.65 2060.53
9/1/1997 790.087 2020.5 2050.01 2030.84 2060.53 2030.84 2060.53 2030.79 2060.53
9/1/1997 3611.83 2020.49 2050.01 2030.83 2060.53 2030.83 2060.53 2030.79 2060.53
9/2/1997 17720.5 2020.48 2050.01 2030.82 2060.53 2030.82 2060.53 2030.77 2060.53
9/10/1997 88264.1 2020.46 2050.01 2030.8 2060.52 2030.8 2060.52 2030.76 2060.52
9/30/1997 270887 2020.45 2050.01 2030.79 2060.48 2030.79 2060.48 2030.75 2060.48
10/1/1997 272432 2020.45 2050.01 2030.79 2060.48 2030.79 2060.48 2030.75 2060.48
10/1/1997 272819 2031.87 2050.01 2042.27 2060.48 2042.27 2060.48 2043.03 2060.48
10/1/1997 274750 2017.05 2050.01 2027.33 2060.48 2027.29 2060.48 2025.85 2060.48
10/1/1997 284406 2016.92 2050.01 2027.23 2060.48 2027.2 2060.48 2025.79 2060.48
10/1/1997 332688 2016.71 2050.01 2027.02 2060.48 2026.99 2060.48 2025.54 2060.48
10/2/1997 574098 2016.49 2050.01 2026.8 2060.48 2026.77 2060.48 2025.29 2060.48
10/10/1997 1.78E+06 2016.27 2050.01 2026.58 2060.48 2026.55 2060.48 2025.04 2060.48
10/31/1997 5.06E+06 2016.1 2050.01 2026.41 2060.48 2026.38 2060.48 2024.86 2060.48
11/1/1997 5.06E+06 2016.1 2050.01 2026.41 2060.48 2026.38 2060.48 2024.86 2060.48
11/1/1997 5.06E+06 2030.03 2050.01 2040.43 2060.48 2040.45 2060.48 2040.74 2060.48
11/1/1997 5.06E+06 2015.45 2050.01 2025.72 2060.48 2025.66 2060.48 2023.71 2060.48
11/1/1997 5.06E+06 2015.51 2050.01 2025.81 2060.48 2025.77 2060.48 2023.93 2060.48
11/1/1997 5.07E+06 2015.47 2050.01 2025.77 2060.48 2025.73 2060.48 2023.91 2060.48
11/2/1997 5.11E+06 2015.42 2050.01 2025.72 2060.48 2025.69 2060.48 2023.86 2060.48
11/10/1997 5.32E+06 2015.35 2050.01 2025.65 2060.48 2025.61 2060.48 2023.78 2060.48
11/30/1997 5.86E+06 2015.26 2050.01 2025.56 2060.48 2025.52 2060.48 2023.68 2060.48
12/1/1997 5.86E+06 2015.26 2050.01 2025.56 2060.48 2025.52 2060.48 2023.68 2060.48
12/1/1997 5.86E+06 2029.48 2050.01 2039.87 2060.48 2039.9 2060.48 2039.98 2060.48
12/1/1997 5.87E+06 2014.93 2050.01 2025.19 2060.48 2025.13 2060.48 2023.02 2060.48
12/1/1997 5.87E+06 2015 2050.01 2025.3 2060.48 2025.25 2060.48 2023.26 2060.48
12/1/1997 5.87E+06 2014.99 2050.01 2025.28 2060.48 2025.24 2060.48 2023.27 2060.48
12/2/1997 5.89E+06 2014.97 2050.01 2025.26 2060.48 2025.22 2060.48 2023.25 2060.48
12/10/1997 5.97E+06 2014.92 2050.01 2025.22 2060.48 2025.18 2060.48 2023.2 2060.48
12/31/1997 6.21E+06 2014.86 2050.01 2025.16 2060.48 2025.12 2060.48 2023.14 2060.48
1/1/1998 6.21E+06 2014.86 2050.01 2025.16 2060.48 2025.12 2060.48 2023.14 2060.48
1/1/1998 6.21E+06 2029.35 2050.01 2039.73 2060.48 2039.76 2060.48 2039.81 2060.48
1/1/1998 6.21E+06 2014.81 2050.01 2025.08 2060.48 2025.02 2060.48 2022.9 2060.48
1/1/1998 6.21E+06 2014.91 2050.01 2025.21 2060.48 2025.16 2060.48 2023.17 2060.48
1/1/1998 6.21E+06 2014.92 2050.01 2025.21 2060.48 2025.17 2060.48 2023.21 2060.48
1/2/1998 6.21E+06 2014.91 2050.01 2025.21 2060.48 2025.17 2060.48 2023.21 2060.48
1/10/1998 6.19E+06 2014.9 2050.01 2025.19 2060.48 2025.15 2060.48 2023.2 2060.48
1/31/1998 6.14E+06 2014.86 2050.01 2025.16 2060.48 2025.12 2060.48 2023.16 2060.48
2/1/1998 6.14E+06 2014.86 2050.01 2025.16 2060.48 2025.12 2060.48 2023.16 2060.48
2/1/1998 6.14E+06 2029.34 2050.01 2039.72 2060.48 2039.76 2060.48 2039.82 2060.48
2/1/1998 6.14E+06 2014.81 2050.01 2025.07 2060.48 2025.01 2060.48 2022.91 2060.48
2/1/1998 6.14E+06 2014.9 2050.01 2025.2 2060.48 2025.16 2060.48 2023.19 2060.48
2/1/1998 6.14E+06 2014.91 2050.01 2025.2 2060.48 2025.16 2060.48 2023.22 2060.48
2/2/1998 6.14E+06 2014.91 2050.01 2025.2 2060.48 2025.16 2060.48 2023.23 2060.48
2/10/1998 6.12E+06 2014.9 2050 2025.19 2060.48 2025.15 2060.48 2023.22 2060.48

105
2/28/1998 6.09E+06 2014.87 2050 2025.17 2060.47 2025.13 2060.47 2023.19 2060.47
3/1/1998 6.08E+06 2014.87 2050 2025.17 2060.47 2025.13 2060.47 2023.19 2060.47
3/1/1998 6.08E+06 2029.59 2050 2039.98 2060.47 2040.02 2060.47 2040.21 2060.47
3/1/1998 6.08E+06 2015.08 2050 2025.35 2060.47 2025.29 2060.47 2023.33 2060.47
3/1/1998 6.08E+06 2015.19 2050 2025.49 2060.47 2025.46 2060.47 2023.64 2060.47
3/1/1998 6.08E+06 2015.21 2050 2025.52 2060.47 2025.48 2060.47 2023.69 2060.47
3/2/1998 6.06E+06 2015.23 2050 2025.53 2060.47 2025.5 2060.47 2023.72 2060.47
3/10/1998 5.95E+06 2015.24 2050 2025.54 2060.47 2025.51 2060.47 2023.74 2060.47
3/31/1998 5.65E+06 2015.23 2050 2025.54 2060.47 2025.5 2060.47 2023.73 2060.47
4/1/1998 5.65E+06 2015.23 2050 2025.54 2060.47 2025.5 2060.47 2023.73 2060.47
4/1/1998 5.65E+06 2028.61 2050 2038.99 2060.47 2039.01 2060.47 2038.79 2060.47
4/1/1998 5.65E+06 2013.98 2050 2024.23 2060.47 2024.16 2060.47 2021.7 2060.47
4/1/1998 5.66E+06 2014 2050 2024.28 2060.47 2024.22 2060.47 2021.81 2060.47
4/1/1998 5.67E+06 2013.93 2050 2024.2 2060.47 2024.15 2060.47 2021.74 2060.47
4/2/1998 5.76E+06 2013.85 2050 2024.13 2060.47 2024.07 2060.47 2021.65 2060.47
4/10/1998 6.20E+06 2013.77 2049.99 2024.05 2060.46 2023.99 2060.46 2021.56 2060.47
4/30/1998 7.32E+06 2013.7 2049.99 2023.98 2060.46 2023.92 2060.46 2021.48 2060.46
5/1/1998 7.32E+06 2013.7 2049.99 2023.98 2060.46 2023.92 2060.46 2021.48 2060.46
5/1/1998 7.32E+06 2028.27 2049.99 2038.64 2060.46 2038.67 2060.46 2038.29 2060.46
5/1/1998 7.32E+06 2013.75 2049.99 2024 2060.46 2023.93 2060.46 2021.45 2060.46
5/1/1998 7.32E+06 2013.86 2049.99 2024.14 2060.46 2024.08 2060.46 2021.7 2060.46
5/1/1998 7.32E+06 2013.87 2049.99 2024.15 2060.46 2024.1 2060.46 2021.74 2060.46
5/2/1998 7.31E+06 2013.87 2049.99 2024.16 2060.46 2024.1 2060.46 2021.75 2060.46
5/10/1998 7.25E+06 2013.87 2049.99 2024.15 2060.46 2024.09 2060.46 2021.74 2060.46
5/31/1998 7.11E+06 2013.84 2049.98 2024.12 2060.45 2024.07 2060.45 2021.71 2060.45
6/1/1998 7.11E+06 2013.84 2049.98 2024.12 2060.45 2024.07 2060.45 2021.71 2060.45
6/1/1998 7.11E+06 2026.82 2049.98 2037.17 2060.45 2037.18 2060.45 2036.17 2060.45
6/1/1998 7.11E+06 2012.17 2049.98 2022.39 2060.45 2022.31 2060.45 2019.15 2060.45
6/1/1998 7.11E+06 2012.16 2049.98 2022.4 2060.45 2022.32 2060.45 2019.08 2060.45
6/1/1998 7.14E+06 2012.06 2049.98 2022.3 2060.45 2022.21 2060.45 2018.94 2060.45
6/2/1998 7.25E+06 2011.95 2049.98 2022.19 2060.45 2022.11 2060.45 2018.82 2060.45
6/10/1998 7.85E+06 2011.84 2049.98 2022.08 2060.45 2021.99 2060.45 2018.69 2060.45
6/30/1998 9.38E+06 2011.74 2049.97 2021.98 2060.44 2021.9 2060.44 2018.58 2060.45
7/1/1998 9.38E+06 2011.74 2049.97 2021.98 2060.44 2021.9 2060.44 2018.58 2060.45
7/1/1998 9.38E+06 2025.83 2049.97 2036.16 2060.44 2036.15 2060.44 2034.62 2060.45
7/1/1998 9.38E+06 2011.28 2049.97 2021.49 2060.44 2021.41 2060.44 2017.98 2060.45
7/1/1998 9.38E+06 2011.36 2049.97 2021.58 2060.44 2021.49 2060.44 2017.96 2060.45
7/1/1998 9.39E+06 2011.33 2049.97 2021.56 2060.44 2021.46 2060.44 2017.92 2060.45
7/2/1998 9.41E+06 2011.3 2049.97 2021.53 2060.44 2021.43 2060.44 2017.88 2060.44
7/10/1998 9.54E+06 2011.25 2049.97 2021.48 2060.44 2021.38 2060.44 2017.83 2060.44
7/31/1998 9.91E+06 2011.18 2049.96 2021.41 2060.43 2021.31 2060.43 2017.75 2060.44
8/1/1998 9.91E+06 2011.18 2049.96 2021.41 2060.43 2021.31 2060.43 2017.75 2060.44
8/1/1998 9.91E+06 2026.84 2049.96 2037.19 2060.43 2037.21 2060.43 2036.19 2060.44
8/1/1998 9.91E+06 2012.43 2049.96 2022.66 2060.43 2022.59 2060.43 2019.69 2060.44
8/1/1998 9.90E+06 2012.61 2049.96 2022.88 2060.43 2022.81 2060.43 2020 2060.44
8/1/1998 9.88E+06 2012.7 2049.96 2022.97 2060.43 2022.9 2060.43 2020.13 2060.44
8/2/1998 9.78E+06 2012.78 2049.96 2023.05 2060.43 2022.99 2060.43 2020.24 2060.43
8/10/1998 9.29E+06 2012.85 2049.96 2023.12 2060.43 2023.06 2060.43 2020.32 2060.43
8/31/1998 7.97E+06 2012.88 2049.95 2023.14 2060.42 2023.08 2060.42 2020.35 2060.42
9/1/1998 7.97E+06 2012.88 2049.95 2023.14 2060.42 2023.08 2060.42 2020.35 2060.42
9/1/1998 7.97E+06 2025.5 2049.95 2035.83 2060.42 2035.82 2060.42 2034.23 2060.42
9/1/1998 7.97E+06 2010.83 2049.95 2021.02 2060.42 2020.94 2060.42 2017.29 2060.42
9/1/1998 7.97E+06 2010.79 2049.95 2021 2060.42 2020.89 2060.42 2017.04 2060.42
9/1/1998 8.00E+06 2010.66 2049.95 2020.87 2060.42 2020.76 2060.42 2016.86 2060.42
9/2/1998 8.15E+06 2010.53 2049.95 2020.74 2060.42 2020.63 2060.42 2016.7 2060.42
9/10/1998 8.89E+06 2010.41 2049.95 2020.61 2060.42 2020.5 2060.42 2016.55 2060.42
9/30/1998 1.08E+07 2010.3 2049.94 2020.51 2060.41 2020.4 2060.41 2016.43 2060.41
10/1/1998 1.08E+07 2010.3 2049.94 2020.51 2060.41 2020.4 2060.41 2016.43 2060.41
106
10/1/1998 1.08E+07 2024.66 2049.94 2034.96 2060.41 2034.94 2060.41 2032.86 2060.41
10/1/1998 1.08E+07 2010.14 2049.94 2020.34 2060.41 2020.25 2060.41 2016.43 2060.41
10/1/1998 1.08E+07 2010.24 2049.94 2020.44 2060.41 2020.33 2060.41 2016.35 2060.41
10/1/1998 1.08E+07 2010.23 2049.94 2020.44 2060.41 2020.32 2060.41 2016.32 2060.41
10/2/1998 1.08E+07 2010.22 2049.94 2020.43 2060.41 2020.31 2060.41 2016.3 2060.41
10/10/1998 1.08E+07 2010.19 2049.94 2020.4 2060.41 2020.28 2060.41 2016.27 2060.41
10/31/1998 1.09E+07 2010.14 2049.93 2020.34 2060.4 2020.23 2060.4 2016.21 2060.4
11/1/1998 1.09E+07 2010.14 2049.93 2020.34 2060.4 2020.23 2060.4 2016.21 2060.4
11/1/1998 1.09E+07 2024.26 2049.93 2034.55 2060.4 2034.52 2060.4 2032.28 2060.4
11/1/1998 1.09E+07 2009.72 2049.93 2019.91 2060.4 2019.83 2060.4 2015.86 2060.4
11/1/1998 1.09E+07 2009.8 2049.93 2019.99 2060.4 2019.88 2060.4 2015.7 2060.4
11/1/1998 1.09E+07 2009.78 2049.93 2019.97 2060.4 2019.85 2060.4 2015.64 2060.4
11/2/1998 1.09E+07 2009.75 2049.93 2019.95 2060.4 2019.82 2060.4 2015.6 2060.4
11/10/1998 1.10E+07 2009.72 2049.92 2019.91 2060.39 2019.78 2060.39 2015.56 2060.39
11/30/1998 1.14E+07 2009.67 2049.91 2019.86 2060.38 2019.73 2060.38 2015.5 2060.39
12/1/1998 1.14E+07 2009.67 2049.91 2019.86 2060.38 2019.73 2060.38 2015.5 2060.39
12/1/1998 1.14E+07 2023.78 2049.91 2034.06 2060.38 2034.02 2060.38 2031.55 2060.39
12/1/1998 1.14E+07 2009.25 2049.91 2019.42 2060.38 2019.34 2060.38 2015.23 2060.39
12/1/1998 1.14E+07 2009.32 2049.91 2019.5 2060.38 2019.38 2060.38 2015 2060.39
12/1/1998 1.14E+07 2009.3 2049.91 2019.48 2060.38 2019.35 2060.38 2014.92 2060.39
12/2/1998 1.14E+07 2009.27 2049.91 2019.46 2060.38 2019.32 2060.38 2014.88 2060.38
12/10/1998 1.15E+07 2009.24 2049.91 2019.42 2060.38 2019.28 2060.38 2014.83 2060.38
12/31/1998 1.18E+07 2009.19 2049.9 2019.37 2060.37 2019.23 2060.37 2014.78 2060.37
1/1/1999 1.18E+07 2009.19 2049.9 2019.37 2060.37 2019.23 2060.37 2014.78 2060.37
1/1/1999 1.18E+07 2024 2049.9 2034.29 2060.37 2034.26 2060.37 2031.91 2060.37
1/1/1999 1.18E+07 2009.54 2049.9 2019.72 2060.37 2019.64 2060.37 2015.67 2060.37
1/1/1999 1.18E+07 2009.66 2049.9 2019.86 2060.37 2019.75 2060.37 2015.6 2060.37
1/1/1999 1.18E+07 2009.69 2049.9 2019.89 2060.37 2019.77 2060.37 2015.6 2060.37
1/2/1999 1.18E+07 2009.72 2049.89 2019.92 2060.37 2019.79 2060.37 2015.63 2060.37
1/10/1999 1.16E+07 2009.73 2049.89 2019.93 2060.36 2019.81 2060.36 2015.64 2060.36
1/31/1999 1.12E+07 2009.72 2049.88 2019.92 2060.35 2019.79 2060.35 2015.63 2060.35
2/1/1999 1.12E+07 2009.72 2049.88 2019.92 2060.35 2019.79 2060.35 2015.63 2060.35
2/1/1999 1.12E+07 2023.91 2049.88 2034.2 2060.35 2034.16 2060.35 2031.8 2060.35
2/1/1999 1.12E+07 2009.38 2049.88 2019.56 2060.35 2019.48 2060.35 2015.44 2060.35
2/1/1999 1.12E+07 2009.46 2049.88 2019.65 2060.35 2019.53 2060.35 2015.27 2060.35
2/1/1999 1.12E+07 2009.45 2049.88 2019.64 2060.35 2019.51 2060.35 2015.21 2060.35
2/2/1999 1.12E+07 2009.43 2049.88 2019.62 2060.35 2019.49 2060.35 2015.18 2060.35
2/10/1999 1.13E+07 2009.41 2049.87 2019.6 2060.34 2019.47 2060.34 2015.15 2060.35
2/28/1999 1.15E+07 2009.38 2049.86 2019.57 2060.33 2019.44 2060.33 2015.12 2060.34
3/1/1999 1.15E+07 2009.38 2049.86 2019.57 2060.33 2019.44 2060.33 2015.12 2060.34
3/1/1999 1.15E+07 2023.85 2049.86 2034.13 2060.33 2034.1 2060.33 2031.72 2060.34
3/1/1999 1.15E+07 2009.35 2049.86 2019.53 2060.33 2019.45 2060.33 2015.42 2060.34
3/1/1999 1.15E+07 2009.45 2049.86 2019.64 2060.33 2019.52 2060.33 2015.28 2060.34
3/1/1999 1.15E+07 2009.45 2049.86 2019.65 2060.33 2019.52 2060.33 2015.25 2060.34
3/2/1999 1.15E+07 2009.45 2049.86 2019.65 2060.33 2019.52 2060.33 2015.24 2060.34
3/10/1999 1.15E+07 2009.45 2049.86 2019.64 2060.33 2019.51 2060.33 2015.24 2060.33
3/31/1999 1.14E+07 2009.43 2049.84 2019.62 2060.31 2019.49 2060.31 2015.21 2060.32
4/1/1999 1.14E+07 2009.43 2049.84 2019.62 2060.31 2019.49 2060.31 2015.21 2060.32
4/1/1999 1.14E+07 2024.2 2049.84 2034.49 2060.31 2034.47 2060.31 2032.28 2060.32
4/1/1999 1.14E+07 2009.72 2049.84 2019.91 2060.31 2019.83 2060.31 2015.96 2060.32
4/1/1999 1.14E+07 2009.84 2049.84 2020.05 2060.31 2019.94 2060.31 2015.92 2060.32
4/1/1999 1.14E+07 2009.87 2049.84 2020.08 2060.31 2019.96 2060.31 2015.93 2060.32
4/2/1999 1.14E+07 2009.89 2049.84 2020.1 2060.31 2019.98 2060.31 2015.96 2060.32
4/10/1999 1.12E+07 2009.91 2049.84 2020.12 2060.31 2020 2060.31 2015.98 2060.31
4/30/1999 1.09E+07 2009.91 2049.82 2020.12 2060.3 2020 2060.3 2015.98 2060.3
5/1/1999 1.09E+07 2009.91 2049.82 2020.12 2060.3 2020 2060.3 2015.98 2060.3
5/1/1999 1.09E+07 2024.2 2049.82 2034.5 2060.3 2034.48 2060.3 2032.32 2060.3
5/1/1999 1.09E+07 2009.69 2049.82 2019.87 2060.3 2019.79 2060.3 2015.9 2060.3

107
5/1/1999 1.09E+07 2009.77 2049.82 2019.97 2060.3 2019.86 2060.3 2015.79 2060.3
5/1/1999 1.09E+07 2009.76 2049.82 2019.97 2060.3 2019.85 2060.3 2015.75 2060.3
5/2/1999 1.09E+07 2009.76 2049.82 2019.96 2060.29 2019.84 2060.29 2015.74 2060.3
5/10/1999 1.09E+07 2009.74 2049.82 2019.95 2060.29 2019.83 2060.29 2015.72 2060.29
5/31/1999 1.10E+07 2009.73 2049.8 2019.93 2060.27 2019.81 2060.27 2015.7 2060.28
6/1/1999 1.10E+07 2009.73 2049.8 2019.93 2060.27 2019.81 2060.27 2015.7 2060.28
6/1/1999 1.10E+07 2024.27 2049.8 2034.57 2060.27 2034.54 2060.27 2032.42 2060.28
6/1/1999 1.10E+07 2009.77 2049.8 2019.96 2060.27 2019.88 2060.27 2016.03 2060.28
6/1/1999 1.10E+07 2009.88 2049.8 2020.08 2060.27 2019.97 2060.27 2015.98 2060.28
6/1/1999 1.10E+07 2009.89 2049.8 2020.09 2060.27 2019.98 2060.27 2015.97 2060.28
6/2/1999 1.10E+07 2009.89 2049.8 2020.1 2060.27 2019.98 2060.27 2015.97 2060.28
6/10/1999 1.10E+07 2009.9 2049.8 2020.1 2060.27 2019.99 2060.27 2015.97 2060.27
6/30/1999 1.08E+07 2009.89 2049.78 2020.09 2060.25 2019.98 2060.25 2015.96 2060.26
7/1/1999 1.08E+07 2009.89 2049.78 2020.09 2060.25 2019.98 2060.25 2015.96 2060.26
7/1/1999 1.08E+07 2024.52 2049.78 2034.82 2060.25 2034.81 2060.25 2032.82 2060.26
7/1/1999 1.08E+07 2010.03 2049.78 2020.22 2060.25 2020.14 2060.25 2016.41 2060.26
7/1/1999 1.08E+07 2010.14 2049.78 2020.35 2060.25 2020.25 2060.25 2016.4 2060.26
7/1/1999 1.08E+07 2010.16 2049.78 2020.37 2060.25 2020.26 2060.25 2016.4 2060.26
7/2/1999 1.08E+07 2010.17 2049.78 2020.39 2060.25 2020.28 2060.25 2016.42 2060.26
7/10/1999 1.07E+07 2010.18 2049.78 2020.4 2060.25 2020.29 2060.25 2016.43 2060.25
7/31/1999 1.05E+07 2010.18 2049.76 2020.39 2060.23 2020.28 2060.23 2016.43 2060.24
8/1/1999 1.05E+07 2010.18 2049.76 2020.39 2060.23 2020.28 2060.23 2016.43 2060.24
8/1/1999 1.05E+07 2024.81 2049.76 2035.13 2060.23 2035.11 2060.23 2033.29 2060.24
8/1/1999 1.05E+07 2010.32 2049.76 2020.52 2060.23 2020.44 2060.23 2016.84 2060.24
8/1/1999 1.05E+07 2010.43 2049.76 2020.65 2060.23 2020.56 2060.23 2016.85 2060.24
8/1/1999 1.05E+07 2010.45 2049.76 2020.67 2060.23 2020.57 2060.23 2016.86 2060.24
8/2/1999 1.05E+07 2010.46 2049.76 2020.69 2060.23 2020.58 2060.23 2016.88 2060.24
8/10/1999 1.04E+07 2010.48 2049.76 2020.7 2060.23 2020.6 2060.23 2016.89 2060.23
8/31/1999 1.02E+07 2010.48 2049.74 2020.7 2060.21 2020.6 2060.21 2016.9 2060.22
9/1/1999 1.02E+07 2010.48 2049.74 2020.7 2060.21 2020.6 2060.21 2016.9 2060.22
9/1/1999 1.02E+07 2024.6 2049.74 2034.91 2060.21 2034.89 2060.21 2032.98 2060.22
9/1/1999 1.02E+07 2010.06 2049.74 2020.26 2060.21 2020.18 2060.21 2016.45 2060.22
9/1/1999 1.02E+07 2010.14 2049.74 2020.35 2060.21 2020.24 2060.21 2016.37 2060.22
9/1/1999 1.02E+07 2010.12 2049.74 2020.33 2060.21 2020.22 2060.21 2016.33 2060.22
9/2/1999 1.02E+07 2010.1 2049.74 2020.31 2060.21 2020.2 2060.21 2016.3 2060.22
9/10/1999 1.03E+07 2010.07 2049.73 2020.29 2060.21 2020.17 2060.21 2016.27 2060.21
9/30/1999 1.06E+07 2010.05 2049.72 2020.26 2060.19 2020.15 2060.19 2016.24 2060.2
10/1/1999 1.06E+07 2010.05 2049.72 2020.26 2060.19 2020.15 2060.19 2016.24 2060.2
10/1/1999 1.06E+07 2024.51 2049.72 2034.82 2060.19 2034.8 2060.19 2032.84 2060.2
10/1/1999 1.06E+07 2010.01 2049.72 2020.2 2060.19 2020.12 2060.19 2016.39 2060.2
10/1/1999 1.06E+07 2010.1 2049.72 2020.32 2060.19 2020.21 2060.19 2016.36 2060.2
10/1/1999 1.06E+07 2010.11 2049.72 2020.32 2060.19 2020.21 2060.19 2016.34 2060.2
10/2/1999 1.06E+07 2010.11 2049.72 2020.32 2060.19 2020.21 2060.19 2016.34 2060.2
10/10/1999 1.06E+07 2010.11 2049.71 2020.32 2060.19 2020.21 2060.19 2016.34 2060.19
10/31/1999 1.05E+07 2010.09 2049.7 2020.31 2060.17 2020.2 2060.17 2016.32 2060.18
11/1/1999 1.05E+07 2010.09 2049.7 2020.31 2060.17 2020.2 2060.17 2016.32 2060.18
11/1/1999 1.05E+07 2024.42 2049.7 2034.72 2060.17 2034.71 2060.17 2032.71 2060.18
11/1/1999 1.05E+07 2009.9 2049.7 2020.1 2060.17 2020.01 2060.17 2016.25 2060.18
11/1/1999 1.05E+07 2009.99 2049.7 2020.2 2060.17 2020.09 2060.17 2016.18 2060.18
11/1/1999 1.05E+07 2009.98 2049.7 2020.19 2060.17 2020.08 2060.17 2016.15 2060.18
11/2/1999 1.05E+07 2009.98 2049.7 2020.19 2060.17 2020.08 2060.17 2016.14 2060.18
11/10/1999 1.06E+07 2009.96 2049.69 2020.18 2060.16 2020.06 2060.16 2016.13 2060.17
11/30/1999 1.07E+07 2009.95 2049.68 2020.16 2060.15 2020.04 2060.15 2016.11 2060.16
12/1/1999 1.07E+07 2009.95 2049.68 2020.16 2060.15 2020.04 2060.15 2016.11 2060.16
12/1/1999 1.07E+07 2024.21 2049.68 2034.51 2060.15 2034.49 2060.15 2032.4 2060.16
12/1/1999 1.07E+07 2009.69 2049.68 2019.88 2060.15 2019.8 2060.15 2015.95 2060.16
12/1/1999 1.07E+07 2009.78 2049.68 2019.98 2060.15 2019.87 2060.15 2015.86 2060.16
12/1/1999 1.07E+07 2009.77 2049.68 2019.97 2060.15 2019.86 2060.15 2015.82 2060.16

108
12/2/1999 1.07E+07 2009.75 2049.68 2019.96 2060.15 2019.84 2060.15 2015.8 2060.15
12/10/1999 1.08E+07 2009.74 2049.67 2019.94 2060.14 2019.82 2060.14 2015.78 2060.15
12/31/1999 1.09E+07 2009.71 2049.66 2019.92 2060.13 2019.8 2060.13 2015.76 2060.13
1/1/2000 1.09E+07 2009.71 2049.66 2019.92 2060.13 2019.8 2060.13 2015.76 2060.13
1/1/2000 1.09E+07 2023.83 2049.66 2034.13 2060.13 2034.1 2060.13 2031.83 2060.13
1/1/2000 1.09E+07 2009.31 2049.66 2019.49 2060.13 2019.41 2060.13 2015.42 2060.13
1/1/2000 1.09E+07 2009.38 2049.66 2019.57 2060.13 2019.46 2060.13 2015.26 2060.13
1/1/2000 1.09E+07 2009.36 2049.66 2019.55 2060.13 2019.43 2060.13 2015.2 2060.13
1/2/2000 1.09E+07 2009.34 2049.66 2019.53 2060.13 2019.41 2060.13 2015.16 2060.13
1/10/2000 1.11E+07 2009.31 2049.65 2019.5 2060.12 2019.38 2060.12 2015.13 2060.13
1/31/2000 1.14E+07 2009.28 2049.64 2019.47 2060.11 2019.34 2060.11 2015.09 2060.11
2/1/2000 1.14E+07 2009.28 2049.64 2019.47 2060.11 2019.34 2060.11 2015.09 2060.11
2/1/2000 1.14E+07 2023.51 2049.64 2033.79 2060.11 2033.76 2060.11 2031.33 2060.11
2/1/2000 1.14E+07 2008.99 2049.64 2019.17 2060.11 2019.08 2060.11 2015.01 2060.11
2/1/2000 1.14E+07 2009.07 2049.64 2019.26 2060.11 2019.14 2060.11 2014.82 2060.11
2/1/2000 1.14E+07 2009.06 2049.64 2019.25 2060.11 2019.12 2060.11 2014.76 2060.11
2/2/2000 1.14E+07 2009.05 2049.64 2019.23 2060.11 2019.1 2060.11 2014.73 2060.11
2/10/2000 1.15E+07 2009.02 2049.63 2019.21 2060.1 2019.08 2060.1 2014.7 2060.11
2/29/2000 1.16E+07 2009 2049.62 2019.18 2060.09 2019.05 2060.09 2014.67 2060.09
3/1/2000 1.16E+07 2009 2049.62 2019.18 2060.09 2019.05 2060.09 2014.67 2060.09
3/1/2000 1.16E+07 2023.53 2049.62 2033.82 2060.09 2033.79 2060.09 2031.37 2060.09
3/1/2000 1.16E+07 2009.04 2049.62 2019.22 2060.09 2019.14 2060.09 2015.1 2060.09
3/1/2000 1.16E+07 2009.15 2049.62 2019.34 2060.09 2019.22 2060.09 2014.97 2060.09
3/1/2000 1.16E+07 2009.16 2049.62 2019.35 2060.09 2019.22 2060.09 2014.94 2060.09
3/2/2000 1.16E+07 2009.16 2049.61 2019.36 2060.09 2019.23 2060.09 2014.94 2060.09
3/10/2000 1.16E+07 2009.16 2049.61 2019.35 2060.08 2019.23 2060.08 2014.94 2060.09
3/31/2000 1.14E+07 2009.15 2049.59 2019.34 2060.07 2019.21 2060.07 2014.92 2060.07
4/1/2000 1.14E+07 2009.15 2049.59 2019.34 2060.07 2019.21 2060.07 2014.92 2060.07
4/1/2000 1.14E+07 2023.9 2049.59 2034.2 2060.07 2034.17 2060.07 2031.97 2060.07
4/1/2000 1.14E+07 2009.43 2049.59 2019.62 2060.07 2019.53 2060.07 2015.65 2060.07
4/1/2000 1.14E+07 2009.55 2049.59 2019.75 2060.07 2019.64 2060.07 2015.61 2060.07
4/1/2000 1.14E+07 2009.57 2049.59 2019.78 2060.07 2019.66 2060.07 2015.62 2060.07
4/2/2000 1.14E+07 2009.6 2049.59 2019.8 2060.06 2019.69 2060.06 2015.65 2060.07
4/10/2000 1.12E+07 2009.62 2049.59 2019.82 2060.06 2019.7 2060.06 2015.67 2060.07
4/30/2000 1.09E+07 2009.62 2049.57 2019.82 2060.05 2019.71 2060.05 2015.67 2060.05
5/1/2000 1.09E+07 2009.62 2049.57 2019.82 2060.05 2019.71 2060.05 2015.67 2060.05
5/1/2000 1.09E+07 2024.88 2049.57 2035.2 2060.05 2035.2 2060.05 2033.51 2060.05
5/1/2000 1.09E+07 2010.45 2049.57 2020.66 2060.05 2020.58 2060.05 2017.13 2060.05
5/1/2000 1.09E+07 2010.61 2049.57 2020.84 2060.05 2020.75 2060.05 2017.27 2060.05
5/1/2000 1.09E+07 2010.67 2049.57 2020.9 2060.04 2020.81 2060.04 2017.35 2060.05
5/2/2000 1.08E+07 2010.73 2049.57 2020.97 2060.04 2020.87 2060.04 2017.43 2060.05
5/10/2000 1.05E+07 2010.79 2049.57 2021.02 2060.04 2020.93 2060.04 2017.5 2060.04
5/31/2000 9.53E+06 2010.82 2049.55 2021.06 2060.02 2020.97 2060.02 2017.54 2060.03
6/1/2000 9.53E+06 2010.82 2049.55 2021.06 2060.02 2020.97 2060.02 2017.54 2060.03
6/1/2000 9.53E+06 2024.99 2049.55 2035.32 2060.02 2035.31 2060.02 2033.71 2060.03
6/1/2000 9.53E+06 2010.46 2049.55 2020.67 2060.02 2020.58 2060.02 2017.1 2060.03
6/1/2000 9.54E+06 2010.54 2049.55 2020.76 2060.02 2020.67 2060.02 2017.09 2060.03
6/1/2000 9.54E+06 2010.52 2049.55 2020.75 2060.02 2020.65 2060.02 2017.06 2060.03
6/2/2000 9.56E+06 2010.51 2049.55 2020.73 2060.02 2020.63 2060.02 2017.04 2060.03
6/10/2000 9.66E+06 2010.49 2049.55 2020.72 2060.02 2020.62 2060.02 2017.02 2060.02
6/30/2000 9.92E+06 2010.48 2049.53 2020.71 2060 2020.61 2060 2017.02 2060.01
7/1/2000 9.92E+06 2010.48 2049.53 2020.71 2060 2020.61 2060 2017.02 2060.01
7/1/2000 9.92E+06 2024.66 2049.53 2034.98 2060 2034.97 2060 2033.2 2060.01
7/1/2000 9.92E+06 2010.14 2049.53 2020.34 2060 2020.25 2060 2016.64 2060.01
7/1/2000 9.92E+06 2010.21 2049.53 2020.43 2060 2020.33 2060 2016.59 2060.01
7/1/2000 9.93E+06 2010.2 2049.53 2020.42 2060 2020.31 2060 2016.56 2060.01
7/2/2000 9.95E+06 2010.18 2049.53 2020.4 2060 2020.29 2060 2016.54 2060.01
7/10/2000 1.00E+07 2010.16 2049.52 2020.38 2060 2020.27 2060 2016.51 2060
109
7/31/2000 1.03E+07 2010.14 2049.51 2020.36 2059.98 2020.25 2059.98 2016.49 2059.99
8/1/2000 1.03E+07 2010.14 2049.51 2020.36 2059.98 2020.25 2059.98 2016.49 2059.99
8/1/2000 1.03E+07 2024.59 2049.51 2034.9 2059.98 2034.89 2059.98 2033.08 2059.99
8/1/2000 1.03E+07 2010.08 2049.51 2020.28 2059.98 2020.2 2059.98 2016.59 2059.99
8/1/2000 1.03E+07 2010.18 2049.51 2020.4 2059.98 2020.3 2059.98 2016.57 2059.99
8/1/2000 1.03E+07 2010.18 2049.51 2020.4 2059.98 2020.3 2059.98 2016.57 2059.99
8/2/2000 1.03E+07 2010.19 2049.51 2020.41 2059.98 2020.3 2059.98 2016.57 2059.99
8/10/2000 1.03E+07 2010.18 2049.5 2020.4 2059.97 2020.3 2059.97 2016.56 2059.98
8/31/2000 1.02E+07 2010.17 2049.49 2020.39 2059.96 2020.29 2059.96 2016.55 2059.97
9/1/2000 1.02E+07 2010.17 2049.49 2020.39 2059.96 2020.29 2059.96 2016.55 2059.97
9/1/2000 1.02E+07 2025.38 2049.49 2035.71 2059.96 2035.72 2059.96 2034.3 2059.97
9/1/2000 1.02E+07 2010.94 2049.49 2021.16 2059.96 2021.08 2059.96 2017.83 2059.97
9/1/2000 1.02E+07 2011.09 2049.49 2021.34 2059.96 2021.26 2059.96 2018.02 2059.97
9/1/2000 1.02E+07 2011.15 2049.49 2021.4 2059.96 2021.31 2059.96 2018.1 2059.96
9/2/2000 1.02E+07 2011.21 2049.49 2021.45 2059.96 2021.37 2059.96 2018.17 2059.96
9/10/2000 9.83E+06 2011.26 2049.48 2021.5 2059.95 2021.42 2059.95 2018.23 2059.96
9/30/2000 8.98E+06 2011.29 2049.47 2021.53 2059.94 2021.45 2059.94 2018.27 2059.94
10/1/2000 8.98E+06 2011.29 2049.47 2021.53 2059.94 2021.45 2059.94 2018.27 2059.94
10/1/2000 8.98E+06 2026.81 2049.47 2037.17 2059.94 2037.2 2059.94 2036.5 2059.94
10/1/2000 8.98E+06 2012.39 2049.47 2022.63 2059.94 2022.56 2059.94 2019.91 2059.94
10/1/2000 8.98E+06 2012.56 2049.47 2022.84 2059.94 2022.78 2059.94 2020.25 2059.94
10/1/2000 8.96E+06 2012.64 2049.47 2022.92 2059.94 2022.87 2059.94 2020.37 2059.94
10/2/2000 8.87E+06 2012.72 2049.47 2023 2059.94 2022.95 2059.94 2020.48 2059.94
10/10/2000 8.43E+06 2012.81 2049.46 2023.09 2059.93 2023.03 2059.93 2020.58 2059.94
10/31/2000 7.25E+06 2012.87 2049.45 2023.15 2059.92 2023.1 2059.92 2020.65 2059.92
11/1/2000 7.25E+06 2012.87 2049.45 2023.15 2059.92 2023.1 2059.92 2020.65 2059.92
11/1/2000 7.25E+06 2027.16 2049.45 2037.52 2059.92 2037.55 2059.92 2037.03 2059.92
11/1/2000 7.25E+06 2012.62 2049.45 2022.86 2059.92 2022.79 2059.92 2020.16 2059.92
11/1/2000 7.25E+06 2012.71 2049.45 2022.98 2059.92 2022.92 2059.92 2020.36 2059.92
11/1/2000 7.25E+06 2012.7 2049.45 2022.97 2059.92 2022.91 2059.92 2020.37 2059.92
11/2/2000 7.26E+06 2012.69 2049.44 2022.96 2059.92 2022.91 2059.92 2020.37 2059.92
11/10/2000 7.32E+06 2012.69 2049.44 2022.97 2059.91 2022.91 2059.91 2020.38 2059.92
11/30/2000 7.47E+06 2012.7 2049.43 2022.98 2059.9 2022.92 2059.9 2020.39 2059.9
12/1/2000 7.47E+06 2012.7 2049.43 2022.98 2059.9 2022.92 2059.9 2020.39 2059.9
12/1/2000 7.47E+06 2027.66 2049.43 2038.04 2059.9 2038.07 2059.9 2037.77 2059.9
12/1/2000 7.47E+06 2013.18 2049.43 2023.44 2059.9 2023.37 2059.9 2021 2059.9
12/1/2000 7.47E+06 2013.32 2049.43 2023.6 2059.9 2023.56 2059.9 2021.3 2059.9
12/1/2000 7.46E+06 2013.36 2049.43 2023.65 2059.9 2023.6 2059.9 2021.38 2059.9
12/2/2000 7.42E+06 2013.4 2049.43 2023.68 2059.9 2023.64 2059.9 2021.43 2059.9
12/10/2000 7.21E+06 2013.44 2049.42 2023.73 2059.89 2023.68 2059.89 2021.48 2059.9
12/31/2000 6.64E+06 2013.47 2049.41 2023.76 2059.88 2023.71 2059.88 2021.52 2059.88
1/1/2001 6.64E+06 2013.47 2049.41 2023.76 2059.88 2023.71 2059.88 2021.52 2059.88
1/1/2001 6.64E+06 2028.28 2049.41 2038.67 2059.88 2038.7 2059.88 2038.68 2059.88
1/1/2001 6.64E+06 2013.79 2049.41 2024.05 2059.88 2023.99 2059.88 2021.85 2059.88
1/1/2001 6.63E+06 2013.91 2049.41 2024.2 2059.88 2024.16 2059.88 2022.16 2059.88
1/1/2001 6.63E+06 2013.94 2049.41 2024.23 2059.88 2024.2 2059.88 2022.22 2059.88
1/2/2001 6.60E+06 2013.97 2049.41 2024.26 2059.88 2024.23 2059.88 2022.26 2059.88
1/10/2001 6.45E+06 2014 2049.4 2024.3 2059.87 2024.26 2059.87 2022.31 2059.88
1/31/2001 6.04E+06 2014.03 2049.39 2024.33 2059.86 2024.29 2059.86 2022.34 2059.86
2/1/2001 6.04E+06 2014.03 2049.39 2024.33 2059.86 2024.29 2059.86 2022.34 2059.86
2/1/2001 6.04E+06 2028.25 2049.39 2038.64 2059.86 2038.67 2059.86 2038.63 2059.86
2/1/2001 6.04E+06 2013.7 2049.39 2023.96 2059.86 2023.9 2059.86 2021.69 2059.86
2/1/2001 6.04E+06 2013.78 2049.39 2024.08 2059.86 2024.03 2059.86 2021.93 2059.86
2/1/2001 6.04E+06 2013.77 2049.39 2024.06 2059.86 2024.02 2059.86 2021.94 2059.86
2/2/2001 6.06E+06 2013.76 2049.39 2024.05 2059.86 2024.01 2059.86 2021.93 2059.86
2/10/2001 6.16E+06 2013.75 2049.38 2024.04 2059.85 2024 2059.85 2021.92 2059.86
2/28/2001 6.37E+06 2013.75 2049.37 2024.04 2059.84 2024 2059.84 2021.92 2059.85
3/1/2001 6.37E+06 2013.75 2049.37 2024.04 2059.84 2024 2059.84 2021.92 2059.85

110
3/1/2001 6.37E+06 2028.5 2049.37 2038.89 2059.84 2038.93 2059.84 2039 2059.85
3/1/2001 6.37E+06 2014 2049.37 2024.27 2059.84 2024.21 2059.84 2022.14 2059.85
3/1/2001 6.37E+06 2014.12 2049.37 2024.42 2059.84 2024.38 2059.84 2022.45 2059.85
3/1/2001 6.37E+06 2014.14 2049.37 2024.44 2059.84 2024.41 2059.84 2022.51 2059.85
3/2/2001 6.34E+06 2014.17 2049.37 2024.47 2059.84 2024.43 2059.84 2022.54 2059.85
3/10/2001 6.22E+06 2014.19 2049.37 2024.49 2059.84 2024.45 2059.84 2022.57 2059.84
3/31/2001 5.87E+06 2014.21 2049.35 2024.51 2059.82 2024.47 2059.82 2022.6 2059.83
4/1/2001 0 2014.21 2049.35 2024.51 2059.82 2024.47 2059.82 2022.6 2059.83

111
Table C.3: CMG IMEX Numerical simulation results for assumed Skin 10.
Skin 10
Darcy Flow
Non-Darcy Flow
FG1
Non-Darcy Flow
FG2
Non-Darcy Flow
Geertsma
DATE
Gas Rate
SC -
Monthly Pbh Pr Pbh Pr Pbh Pr Pbh Pr
(ft3/day) (psi) (psi) (psi) (psi) (psi) (psi) (psi) (psi)
8/31/1997 0 0 0 0 0 0 0 0 0
9/1/1997 90.2957 0 2050.01 0 2060.53 0 2060.53 0 2060.53
9/1/1997 112.87 2034.89 2050.01 2045.29 2060.53 2045.29 2060.53 2045.65 2060.53
9/1/1997 225.739 2020.34 2050.01 2030.68 2060.53 2030.67 2060.53 2030.57 2060.53
9/1/1997 790.087 2020.42 2050.01 2030.76 2060.53 2030.76 2060.53 2030.7 2060.53
9/1/1997 3611.83 2020.41 2050.01 2030.75 2060.53 2030.75 2060.53 2030.69 2060.53
9/2/1997 17720.5 2020.4 2050.01 2030.74 2060.53 2030.74 2060.53 2030.68 2060.53
9/10/1997 88264.1 2020.39 2050.01 2030.73 2060.52 2030.73 2060.52 2030.67 2060.52
9/30/1997 270887 2020.38 2050.01 2030.72 2060.48 2030.72 2060.48 2030.66 2060.48
10/1/1997 272432 2020.38 2050.01 2030.72 2060.48 2030.72 2060.48 2030.66 2060.48
10/1/1997 272819 2030.4 2050.01 2040.8 2060.48 2040.8 2060.48 2041.2 2060.48
10/1/1997 274750 2015.62 2050.01 2025.92 2060.48 2025.89 2060.48 2024.13 2060.48
10/1/1997 284406 2015.49 2050.01 2025.8 2060.48 2025.77 2060.48 2023.94 2060.48
10/1/1997 332688 2015.27 2050.01 2025.58 2060.48 2025.55 2060.48 2023.67 2060.48
10/2/1997 574098 2015.05 2050.01 2025.36 2060.48 2025.34 2060.48 2023.41 2060.48
10/10/1997 1.78E+06 2014.83 2050.01 2025.14 2060.48 2025.11 2060.48 2023.17 2060.48
10/31/1997 5.06E+06 2014.67 2050.01 2024.97 2060.48 2024.95 2060.48 2022.98 2060.48
11/1/1997 5.06E+06 2014.67 2050.01 2024.97 2060.48 2024.95 2060.48 2022.98 2060.48
11/1/1997 5.06E+06 2028.34 2050.01 2038.72 2060.48 2038.73 2060.48 2038.47 2060.48
11/1/1997 5.06E+06 2013.79 2050.01 2024.08 2060.48 2024.04 2060.48 2021.66 2060.48
11/1/1997 5.06E+06 2013.85 2050.01 2024.15 2060.48 2024.11 2060.48 2021.76 2060.48
11/1/1997 5.07E+06 2013.81 2050.01 2024.11 2060.48 2024.07 2060.48 2021.73 2060.48
11/2/1997 5.11E+06 2013.76 2050.01 2024.06 2060.48 2024.02 2060.48 2021.67 2060.48
11/10/1997 5.32E+06 2013.69 2050.01 2023.99 2060.48 2023.95 2060.48 2021.59 2060.48
11/30/1997 5.86E+06 2013.6 2050.01 2023.9 2060.48 2023.86 2060.48 2021.5 2060.48
12/1/1997 5.86E+06 2013.6 2050.01 2023.9 2060.48 2023.86 2060.48 2021.5 2060.48
12/1/1997 5.86E+06 2027.69 2050.01 2038.06 2060.48 2038.07 2060.48 2037.56 2060.48
12/1/1997 5.87E+06 2013.17 2050.01 2023.45 2060.48 2023.41 2060.48 2020.86 2060.48
12/1/1997 5.87E+06 2013.25 2050.01 2023.54 2060.48 2023.5 2060.48 2020.96 2060.48
12/1/1997 5.87E+06 2013.23 2050.01 2023.52 2060.48 2023.48 2060.48 2020.95 2060.48
12/2/1997 5.89E+06 2013.21 2050.01 2023.5 2060.48 2023.46 2060.48 2020.93 2060.48
12/10/1997 5.97E+06 2013.17 2050.01 2023.46 2060.48 2023.42 2060.48 2020.88 2060.48
12/31/1997 6.21E+06 2013.11 2050.01 2023.4 2060.48 2023.36 2060.48 2020.81 2060.48
1/1/1998 6.21E+06 2013.11 2050.01 2023.4 2060.48 2023.36 2060.48 2020.81 2060.48
1/1/1998 6.21E+06 2027.57 2050.01 2037.95 2060.48 2037.95 2060.48 2037.42 2060.48
1/1/1998 6.21E+06 2013.08 2050.01 2023.36 2060.48 2023.32 2060.48 2020.76 2060.48
1/1/1998 6.21E+06 2013.17 2050.01 2023.47 2060.48 2023.43 2060.48 2020.9 2060.48
1/1/1998 6.21E+06 2013.18 2050.01 2023.47 2060.48 2023.43 2060.48 2020.91 2060.48
1/2/1998 6.21E+06 2013.18 2050.01 2023.47 2060.48 2023.43 2060.48 2020.92 2060.48
1/10/1998 6.19E+06 2013.16 2050.01 2023.45 2060.48 2023.41 2060.48 2020.9 2060.48
1/31/1998 6.14E+06 2013.12 2050.01 2023.42 2060.48 2023.38 2060.48 2020.86 2060.48
2/1/1998 6.14E+06 2013.12 2050.01 2023.42 2060.48 2023.38 2060.48 2020.86 2060.48
2/1/1998 6.14E+06 2027.58 2050.01 2037.96 2060.48 2037.96 2060.48 2037.45 2060.48
2/1/1998 6.14E+06 2013.09 2050.01 2023.37 2060.48 2023.33 2060.48 2020.79 2060.48
2/1/1998 6.14E+06 2013.18 2050.01 2023.48 2060.48 2023.44 2060.48 2020.93 2060.48
2/1/1998 6.14E+06 2013.19 2050.01 2023.48 2060.48 2023.44 2060.48 2020.95 2060.48
2/2/1998 6.14E+06 2013.19 2050.01 2023.48 2060.48 2023.44 2060.48 2020.95 2060.48
2/10/1998 6.12E+06 2013.18 2050 2023.47 2060.48 2023.43 2060.48 2020.94 2060.48
112
2/28/1998 6.09E+06 2013.15 2050 2023.45 2060.47 2023.41 2060.47 2020.92 2060.47
3/1/1998 6.08E+06 2013.15 2050 2023.45 2060.47 2023.41 2060.47 2020.92 2060.47
3/1/1998 6.08E+06 2027.96 2050 2038.34 2060.47 2038.35 2060.47 2038.01 2060.47
3/1/1998 6.08E+06 2013.48 2050 2023.77 2060.47 2023.73 2060.47 2021.35 2060.47
3/1/1998 6.08E+06 2013.6 2050 2023.9 2060.47 2023.86 2060.47 2021.55 2060.47
3/1/1998 6.08E+06 2013.62 2050 2023.92 2060.47 2023.88 2060.47 2021.59 2060.47
3/2/1998 6.06E+06 2013.63 2050 2023.93 2060.47 2023.9 2060.47 2021.62 2060.47
3/10/1998 5.95E+06 2013.64 2050 2023.94 2060.47 2023.91 2060.47 2021.63 2060.47
3/31/1998 5.65E+06 2013.64 2050 2023.94 2060.47 2023.9 2060.47 2021.63 2060.47
4/1/1998 5.65E+06 2013.64 2050 2023.94 2060.47 2023.9 2060.47 2021.63 2060.47
4/1/1998 5.65E+06 2026.5 2050 2036.87 2060.47 2036.86 2060.47 2035.96 2060.47
4/1/1998 5.65E+06 2011.91 2050 2022.18 2060.47 2022.14 2060.47 2019.23 2060.47
4/1/1998 5.66E+06 2011.93 2050 2022.21 2060.47 2022.15 2060.47 2019.09 2060.47
4/1/1998 5.67E+06 2011.85 2050 2022.13 2060.47 2022.07 2060.47 2018.98 2060.47
4/2/1998 5.76E+06 2011.78 2050 2022.05 2060.47 2022 2060.47 2018.89 2060.47
4/10/1998 6.20E+06 2011.7 2049.99 2021.97 2060.46 2021.92 2060.46 2018.8 2060.47
4/30/1998 7.32E+06 2011.63 2049.99 2021.9 2060.46 2021.85 2060.46 2018.72 2060.46
5/1/1998 7.32E+06 2011.63 2049.99 2021.9 2060.46 2021.85 2060.46 2018.72 2060.46
5/1/1998 7.32E+06 2026.22 2049.99 2036.58 2060.46 2036.58 2060.46 2035.51 2060.46
5/1/1998 7.32E+06 2011.75 2049.99 2022.01 2060.46 2021.97 2060.46 2019.03 2060.46
5/1/1998 7.32E+06 2011.85 2049.99 2022.13 2060.46 2022.08 2060.46 2019.06 2060.46
5/1/1998 7.32E+06 2011.86 2049.99 2022.14 2060.46 2022.08 2060.46 2019.07 2060.46
5/2/1998 7.31E+06 2011.86 2049.99 2022.14 2060.46 2022.09 2060.46 2019.07 2060.46
5/10/1998 7.25E+06 2011.86 2049.99 2022.14 2060.46 2022.08 2060.46 2019.07 2060.46
5/31/1998 7.11E+06 2011.83 2049.98 2022.11 2060.45 2022.05 2060.45 2019.04 2060.45
6/1/1998 7.11E+06 2011.83 2049.98 2022.11 2060.45 2022.05 2060.45 2019.04 2060.45
6/1/1998 7.11E+06 2024.13 2049.98 2034.47 2060.45 2034.44 2060.45 2032.52 2060.45
6/1/1998 7.11E+06 2009.52 2049.98 2019.76 2060.45 2019.72 2060.45 2016.02 2060.45
6/1/1998 7.11E+06 2009.51 2049.98 2019.75 2060.45 2019.67 2060.45 2015.58 2060.45
6/1/1998 7.14E+06 2009.41 2049.98 2019.65 2060.45 2019.56 2060.45 2015.38 2060.45
6/2/1998 7.25E+06 2009.3 2049.98 2019.54 2060.45 2019.45 2060.45 2015.24 2060.45
6/10/1998 7.85E+06 2009.19 2049.98 2019.43 2060.45 2019.33 2060.45 2015.11 2060.45
6/30/1998 9.38E+06 2009.09 2049.97 2019.33 2060.44 2019.24 2060.44 2014.99 2060.45
7/1/1998 9.38E+06 2009.09 2049.97 2019.33 2060.44 2019.24 2060.44 2014.99 2060.45
7/1/1998 9.38E+06 2022.99 2049.97 2033.3 2060.44 2033.26 2060.44 2030.74 2060.45
7/1/1998 9.38E+06 2008.49 2049.97 2018.72 2060.44 2018.66 2060.44 2014.68 2060.45
7/1/1998 9.38E+06 2008.55 2049.97 2018.78 2060.44 2018.69 2060.44 2014.28 2060.45
7/1/1998 9.39E+06 2008.53 2049.97 2018.75 2060.44 2018.66 2060.44 2014.15 2060.45
7/2/1998 9.41E+06 2008.5 2049.97 2018.72 2060.44 2018.62 2060.44 2014.1 2060.44
7/10/1998 9.54E+06 2008.45 2049.97 2018.67 2060.44 2018.57 2060.44 2014.03 2060.44
7/31/1998 9.91E+06 2008.38 2049.96 2018.61 2060.43 2018.51 2060.43 2013.96 2060.44
8/1/1998 9.91E+06 2008.38 2049.96 2018.61 2060.43 2018.51 2060.43 2013.96 2060.44
8/1/1998 9.91E+06 2024.55 2049.96 2034.88 2060.43 2034.86 2060.43 2033.05 2060.44
8/1/1998 9.91E+06 2010.18 2049.96 2020.43 2060.43 2020.39 2060.43 2016.99 2060.44
8/1/1998 9.90E+06 2010.36 2049.96 2020.62 2060.43 2020.56 2060.43 2017.03 2060.44
8/1/1998 9.88E+06 2010.45 2049.96 2020.71 2060.43 2020.65 2060.43 2017.13 2060.44
8/2/1998 9.78E+06 2010.53 2049.96 2020.8 2060.43 2020.73 2060.43 2017.23 2060.43
8/10/1998 9.29E+06 2010.6 2049.96 2020.86 2060.43 2020.8 2060.43 2017.31 2060.43
8/31/1998 7.97E+06 2010.63 2049.95 2020.89 2060.42 2020.82 2060.42 2017.34 2060.42
9/1/1998 7.97E+06 2010.63 2049.95 2020.89 2060.42 2020.82 2060.42 2017.34 2060.42
9/1/1998 7.97E+06 2022.4 2049.95 2032.72 2060.42 2032.67 2060.42 2030.03 2060.42
9/1/1998 7.97E+06 2007.77 2049.95 2017.99 2060.42 2017.93 2060.42 2013.77 2060.42
9/1/1998 7.97E+06 2007.74 2049.95 2017.94 2060.42 2017.84 2060.42 2013.03 2060.42
9/1/1998 8.00E+06 2007.61 2049.95 2017.81 2060.42 2017.7 2060.42 2012.73 2060.42
9/2/1998 8.15E+06 2007.48 2049.95 2017.68 2060.42 2017.56 2060.42 2012.55 2060.42
9/10/1998 8.89E+06 2007.35 2049.95 2017.56 2060.42 2017.44 2060.42 2012.39 2060.42
9/30/1998 1.08E+07 2007.25 2049.94 2017.45 2060.41 2017.33 2060.41 2012.27 2060.41
10/1/1998 1.08E+07 2007.25 2049.94 2017.45 2060.41 2017.33 2060.41 2012.27 2060.41

113
10/1/1998 1.08E+07 2021.54 2049.94 2031.82 2060.41 2031.76 2060.41 2028.58 2060.41
10/1/1998 1.08E+07 2007.07 2049.94 2017.28 2060.41 2017.21 2060.41 2012.88 2060.41
10/1/1998 1.08E+07 2007.16 2049.94 2017.36 2060.41 2017.25 2060.41 2012.29 2060.41
10/1/1998 1.08E+07 2007.15 2049.94 2017.35 2060.41 2017.23 2060.41 2012.16 2060.41
10/2/1998 1.08E+07 2007.14 2049.94 2017.34 2060.41 2017.22 2060.41 2012.11 2060.41
10/10/1998 1.08E+07 2007.11 2049.94 2017.31 2060.41 2017.19 2060.41 2012.07 2060.41
10/31/1998 1.09E+07 2007.06 2049.93 2017.26 2060.4 2017.14 2060.4 2012.01 2060.4
11/1/1998 1.09E+07 2007.06 2049.93 2017.26 2060.4 2017.14 2060.4 2012.01 2060.4
11/1/1998 1.09E+07 2021 2049.93 2031.28 2060.4 2031.22 2060.4 2027.81 2060.4
11/1/1998 1.09E+07 2006.52 2049.93 2016.72 2060.4 2016.65 2060.4 2011.91 2060.4
11/1/1998 1.09E+07 2006.59 2049.93 2016.78 2060.4 2016.67 2060.4 2011.44 2060.4
11/1/1998 1.09E+07 2006.57 2049.93 2016.76 2060.4 2016.63 2060.4 2011.29 2060.4
11/2/1998 1.09E+07 2006.54 2049.93 2016.73 2060.4 2016.6 2060.4 2011.23 2060.4
11/10/1998 1.10E+07 2006.51 2049.92 2016.7 2060.39 2016.57 2060.39 2011.17 2060.39
11/30/1998 1.14E+07 2006.46 2049.91 2016.65 2060.38 2016.52 2060.38 2011.12 2060.39
12/1/1998 1.14E+07 2006.46 2049.91 2016.65 2060.38 2016.52 2060.38 2011.12 2060.39
12/1/1998 1.14E+07 2020.39 2049.91 2030.66 2060.38 2030.58 2060.38 2026.9 2060.39
12/1/1998 1.14E+07 2005.91 2049.91 2016.1 2060.38 2016.02 2060.38 2010.93 2060.39
12/1/1998 1.14E+07 2005.98 2049.91 2016.16 2060.38 2016.03 2060.38 2010.51 2060.39
12/1/1998 1.14E+07 2005.96 2049.91 2016.14 2060.38 2016 2060.38 2010.37 2060.39
12/2/1998 1.14E+07 2005.93 2049.91 2016.11 2060.38 2015.97 2060.38 2010.31 2060.38
12/10/1998 1.15E+07 2005.89 2049.91 2016.07 2060.38 2015.93 2060.38 2010.26 2060.38
12/31/1998 1.18E+07 2005.84 2049.9 2016.02 2060.37 2015.88 2060.37 2010.2 2060.37
1/1/1999 1.18E+07 2005.84 2049.9 2016.02 2060.37 2015.88 2060.37 2010.2 2060.37
1/1/1999 1.18E+07 2020.8 2049.9 2031.07 2060.37 2031 2060.37 2027.5 2060.37
1/1/1999 1.18E+07 2006.38 2049.9 2016.58 2060.37 2016.51 2060.37 2011.78 2060.37
1/1/1999 1.18E+07 2006.5 2049.9 2016.7 2060.37 2016.58 2060.37 2011.4 2060.37
1/1/1999 1.18E+07 2006.53 2049.9 2016.73 2060.37 2016.6 2060.37 2011.32 2060.37
1/2/1999 1.18E+07 2006.56 2049.89 2016.75 2060.37 2016.62 2060.37 2011.33 2060.37
1/10/1999 1.16E+07 2006.57 2049.89 2016.77 2060.36 2016.64 2060.36 2011.34 2060.36
1/31/1999 1.12E+07 2006.56 2049.88 2016.75 2060.35 2016.62 2060.35 2011.32 2060.35
2/1/1999 1.12E+07 2006.56 2049.88 2016.75 2060.35 2016.62 2060.35 2011.32 2060.35
2/1/1999 1.12E+07 2020.6 2049.88 2030.88 2060.35 2030.81 2060.35 2027.27 2060.35
2/1/1999 1.12E+07 2006.13 2049.88 2016.33 2060.35 2016.25 2060.35 2011.41 2060.35
2/1/1999 1.12E+07 2006.2 2049.88 2016.39 2060.35 2016.27 2060.35 2010.95 2060.35
2/1/1999 1.12E+07 2006.19 2049.88 2016.38 2060.35 2016.24 2060.35 2010.79 2060.35
2/2/1999 1.12E+07 2006.17 2049.88 2016.36 2060.35 2016.22 2060.35 2010.73 2060.35
2/10/1999 1.13E+07 2006.15 2049.87 2016.34 2060.34 2016.2 2060.34 2010.7 2060.35
2/28/1999 1.15E+07 2006.12 2049.86 2016.31 2060.33 2016.17 2060.33 2010.67 2060.34
3/1/1999 1.15E+07 2006.12 2049.86 2016.31 2060.33 2016.17 2060.33 2010.67 2060.34
3/1/1999 1.15E+07 2020.57 2049.86 2030.84 2060.33 2030.77 2060.33 2027.21 2060.34
3/1/1999 1.15E+07 2006.12 2049.86 2016.32 2060.33 2016.24 2060.33 2011.42 2060.34
3/1/1999 1.15E+07 2006.22 2049.86 2016.41 2060.33 2016.29 2060.33 2011 2060.34
3/1/1999 1.15E+07 2006.22 2049.86 2016.41 2060.33 2016.28 2060.33 2010.87 2060.34
3/2/1999 1.15E+07 2006.22 2049.86 2016.41 2060.33 2016.28 2060.33 2010.84 2060.34
3/10/1999 1.15E+07 2006.22 2049.86 2016.41 2060.33 2016.27 2060.33 2010.82 2060.33
3/31/1999 1.14E+07 2006.2 2049.84 2016.39 2060.31 2016.25 2060.31 2010.8 2060.32
4/1/1999 1.14E+07 2006.2 2049.84 2016.39 2060.31 2016.25 2060.31 2010.8 2060.32
4/1/1999 1.14E+07 2021.08 2049.84 2031.36 2060.31 2031.3 2060.31 2027.99 2060.32
4/1/1999 1.14E+07 2006.65 2049.84 2016.86 2060.31 2016.8 2060.31 2012.36 2060.32
4/1/1999 1.14E+07 2006.77 2049.84 2016.98 2060.31 2016.87 2060.31 2011.87 2060.32
4/1/1999 1.14E+07 2006.8 2049.84 2017 2060.31 2016.88 2060.31 2011.78 2060.32
4/2/1999 1.14E+07 2006.82 2049.84 2017.03 2060.31 2016.91 2060.31 2011.78 2060.32
4/10/1999 1.12E+07 2006.84 2049.84 2017.04 2060.31 2016.92 2060.31 2011.8 2060.31
4/30/1999 1.09E+07 2006.84 2049.82 2017.04 2060.3 2016.92 2060.3 2011.8 2060.3
5/1/1999 1.09E+07 2006.84 2049.82 2017.04 2060.3 2016.92 2060.3 2011.8 2060.3
5/1/1999 1.09E+07 2021.04 2049.82 2031.32 2060.3 2031.26 2060.3 2027.97 2060.3
5/1/1999 1.09E+07 2006.56 2049.82 2016.77 2060.3 2016.7 2060.3 2012.16 2060.3
114
5/1/1999 1.09E+07 2006.65 2049.82 2016.85 2060.3 2016.74 2060.3 2011.65 2060.3
5/1/1999 1.09E+07 2006.64 2049.82 2016.84 2060.3 2016.72 2060.3 2011.53 2060.3
5/2/1999 1.09E+07 2006.63 2049.82 2016.83 2060.29 2016.71 2060.29 2011.49 2060.3
5/10/1999 1.09E+07 2006.62 2049.82 2016.82 2060.29 2016.69 2060.29 2011.47 2060.29
5/31/1999 1.10E+07 2006.6 2049.8 2016.8 2060.27 2016.68 2060.27 2011.44 2060.28
6/1/1999 1.10E+07 2006.6 2049.8 2016.8 2060.27 2016.68 2060.27 2011.44 2060.28
6/1/1999 1.10E+07 2021.16 2049.8 2031.44 2060.27 2031.38 2060.27 2028.15 2060.28
6/1/1999 1.10E+07 2006.71 2049.8 2016.92 2060.27 2016.85 2060.27 2012.49 2060.28
6/1/1999 1.10E+07 2006.81 2049.8 2017.02 2060.27 2016.91 2060.27 2011.93 2060.28
6/1/1999 1.10E+07 2006.82 2049.8 2017.02 2060.27 2016.91 2060.27 2011.83 2060.28
6/2/1999 1.10E+07 2006.83 2049.8 2017.03 2060.27 2016.91 2060.27 2011.81 2060.28
6/10/1999 1.10E+07 2006.83 2049.8 2017.03 2060.27 2016.91 2060.27 2011.8 2060.27
6/30/1999 1.08E+07 2006.82 2049.78 2017.03 2060.25 2016.9 2060.25 2011.79 2060.26
7/1/1999 1.08E+07 2006.82 2049.78 2017.03 2060.25 2016.9 2060.25 2011.79 2060.26
7/1/1999 1.08E+07 2021.51 2049.78 2031.8 2060.25 2031.74 2060.25 2028.69 2060.26
7/1/1999 1.08E+07 2007.06 2049.78 2017.28 2060.25 2017.22 2060.25 2012.93 2060.26
7/1/1999 1.08E+07 2007.17 2049.78 2017.38 2060.25 2017.28 2060.25 2012.49 2060.26
7/1/1999 1.08E+07 2007.19 2049.78 2017.4 2060.25 2017.29 2060.25 2012.4 2060.26
7/2/1999 1.08E+07 2007.2 2049.78 2017.41 2060.25 2017.3 2060.25 2012.39 2060.26
7/10/1999 1.07E+07 2007.21 2049.78 2017.43 2060.25 2017.31 2060.25 2012.4 2060.25
7/31/1999 1.05E+07 2007.21 2049.76 2017.42 2060.23 2017.31 2060.23 2012.4 2060.24
8/1/1999 1.05E+07 2007.21 2049.76 2017.42 2060.23 2017.31 2060.23 2012.4 2060.24
8/1/1999 1.05E+07 2021.9 2049.76 2032.2 2060.23 2032.15 2060.23 2029.29 2060.24
8/1/1999 1.05E+07 2007.45 2049.76 2017.68 2060.23 2017.62 2060.23 2013.53 2060.24
8/1/1999 1.05E+07 2007.56 2049.76 2017.78 2060.23 2017.69 2060.23 2013.09 2060.24
8/1/1999 1.05E+07 2007.58 2049.76 2017.8 2060.23 2017.69 2060.23 2013 2060.24
8/2/1999 1.05E+07 2007.59 2049.76 2017.81 2060.23 2017.71 2060.23 2012.99 2060.24
8/10/1999 1.04E+07 2007.61 2049.76 2017.83 2060.23 2017.72 2060.23 2013 2060.23
8/31/1999 1.02E+07 2007.61 2049.74 2017.83 2060.21 2017.72 2060.21 2013 2060.22
9/1/1999 1.02E+07 2007.61 2049.74 2017.83 2060.21 2017.72 2060.21 2013 2060.22
9/1/1999 1.02E+07 2021.55 2049.74 2031.85 2060.21 2031.8 2060.21 2028.81 2060.22
9/1/1999 1.02E+07 2007.07 2049.74 2017.28 2060.21 2017.22 2060.21 2012.93 2060.22
9/1/1999 1.02E+07 2007.14 2049.74 2017.35 2060.21 2017.25 2060.21 2012.41 2060.22
9/1/1999 1.02E+07 2007.12 2049.74 2017.33 2060.21 2017.21 2060.21 2012.28 2060.22
9/2/1999 1.02E+07 2007.1 2049.74 2017.3 2060.21 2017.19 2060.21 2012.22 2060.22
9/10/1999 1.03E+07 2007.07 2049.73 2017.28 2060.21 2017.17 2060.21 2012.19 2060.21
9/30/1999 1.06E+07 2007.05 2049.72 2017.26 2060.19 2017.14 2060.19 2012.16 2060.2
10/1/1999 1.06E+07 2007.05 2049.72 2017.26 2060.19 2017.14 2060.19 2012.16 2060.2
10/1/1999 1.06E+07 2021.49 2049.72 2031.78 2060.19 2031.73 2060.19 2028.69 2060.2
10/1/1999 1.06E+07 2007.03 2049.72 2017.25 2060.19 2017.18 2060.19 2012.9 2060.2
10/1/1999 1.06E+07 2007.13 2049.72 2017.34 2060.19 2017.24 2060.19 2012.43 2060.2
10/1/1999 1.06E+07 2007.13 2049.72 2017.34 2060.19 2017.23 2060.19 2012.32 2060.2
10/2/1999 1.06E+07 2007.13 2049.72 2017.34 2060.19 2017.23 2060.19 2012.3 2060.2
10/10/1999 1.06E+07 2007.13 2049.71 2017.34 2060.19 2017.22 2060.19 2012.29 2060.19
10/31/1999 1.05E+07 2007.11 2049.7 2017.32 2060.17 2017.21 2060.17 2012.27 2060.18
11/1/1999 1.05E+07 2007.11 2049.7 2017.32 2060.17 2017.21 2060.17 2012.27 2060.18
11/1/1999 1.05E+07 2021.35 2049.7 2031.64 2060.17 2031.59 2060.17 2028.51 2060.18
11/1/1999 1.05E+07 2006.88 2049.7 2017.1 2060.17 2017.04 2060.17 2012.69 2060.18
11/1/1999 1.05E+07 2006.97 2049.7 2017.18 2060.17 2017.08 2060.17 2012.19 2060.18
11/1/1999 1.05E+07 2006.96 2049.7 2017.17 2060.17 2017.06 2060.17 2012.08 2060.18
11/2/1999 1.05E+07 2006.96 2049.7 2017.17 2060.17 2017.05 2060.17 2012.04 2060.18
11/10/1999 1.06E+07 2006.95 2049.69 2017.15 2060.16 2017.04 2060.16 2012.02 2060.17
11/30/1999 1.07E+07 2006.93 2049.68 2017.14 2060.15 2017.02 2060.15 2012 2060.16
12/1/1999 1.07E+07 2006.93 2049.68 2017.14 2060.15 2017.02 2060.15 2012 2060.16
12/1/1999 1.07E+07 2021.08 2049.68 2031.37 2060.15 2031.31 2060.15 2028.11 2060.16
12/1/1999 1.07E+07 2006.61 2049.68 2016.82 2060.15 2016.75 2060.15 2012.4 2060.16
12/1/1999 1.07E+07 2006.69 2049.68 2016.89 2060.15 2016.79 2060.15 2011.79 2060.16
12/1/1999 1.07E+07 2006.68 2049.68 2016.88 2060.15 2016.76 2060.15 2011.65 2060.16

115
12/2/1999 1.07E+07 2006.67 2049.68 2016.87 2060.15 2016.75 2060.15 2011.61 2060.15
12/10/1999 1.08E+07 2006.65 2049.67 2016.85 2060.14 2016.73 2060.14 2011.58 2060.15
12/31/1999 1.09E+07 2006.63 2049.66 2016.83 2060.13 2016.71 2060.13 2011.55 2060.13
1/1/2000 1.09E+07 2006.63 2049.66 2016.83 2060.13 2016.71 2060.13 2011.55 2060.13
1/1/2000 1.09E+07 2020.58 2049.66 2030.86 2060.13 2030.79 2060.13 2027.36 2060.13
1/1/2000 1.09E+07 2006.1 2049.66 2016.3 2060.13 2016.22 2060.13 2011.47 2060.13
1/1/2000 1.09E+07 2006.17 2049.66 2016.36 2060.13 2016.24 2060.13 2010.99 2060.13
1/1/2000 1.09E+07 2006.15 2049.66 2016.34 2060.13 2016.21 2060.13 2010.84 2060.13
1/2/2000 1.09E+07 2006.13 2049.66 2016.32 2060.13 2016.19 2060.13 2010.79 2060.13
1/10/2000 1.11E+07 2006.1 2049.65 2016.29 2060.12 2016.16 2060.12 2010.74 2060.13
1/31/2000 1.14E+07 2006.06 2049.64 2016.25 2060.11 2016.12 2060.11 2010.71 2060.11
2/1/2000 1.14E+07 2006.06 2049.64 2016.25 2060.11 2016.12 2060.11 2010.71 2060.11
2/1/2000 1.14E+07 2020.18 2049.64 2030.44 2060.11 2030.37 2060.11 2026.75 2060.11
2/1/2000 1.14E+07 2005.7 2049.64 2015.9 2060.11 2015.82 2060.11 2010.88 2060.11
2/1/2000 1.14E+07 2005.79 2049.64 2015.97 2060.11 2015.85 2060.11 2010.44 2060.11
2/1/2000 1.14E+07 2005.77 2049.64 2015.96 2060.11 2015.82 2060.11 2010.29 2060.11
2/2/2000 1.14E+07 2005.76 2049.64 2015.94 2060.11 2015.8 2060.11 2010.24 2060.11
2/10/2000 1.15E+07 2005.74 2049.63 2015.92 2060.1 2015.78 2060.1 2010.21 2060.11
2/29/2000 1.16E+07 2005.71 2049.62 2015.89 2060.09 2015.75 2060.09 2010.17 2060.09
3/1/2000 1.16E+07 2005.71 2049.62 2015.89 2060.09 2015.75 2060.09 2010.17 2060.09
3/1/2000 1.16E+07 2020.26 2049.62 2030.53 2060.09 2030.46 2060.09 2026.87 2060.09
3/1/2000 1.16E+07 2005.81 2049.62 2016.01 2060.09 2015.94 2060.09 2011.1 2060.09
3/1/2000 1.16E+07 2005.92 2049.62 2016.11 2060.09 2015.99 2060.09 2010.68 2060.09
3/1/2000 1.16E+07 2005.92 2049.62 2016.11 2060.09 2015.98 2060.09 2010.56 2060.09
3/2/2000 1.16E+07 2005.93 2049.61 2016.12 2060.09 2015.99 2060.09 2010.54 2060.09
3/10/2000 1.16E+07 2005.93 2049.61 2016.12 2060.08 2015.99 2060.08 2010.53 2060.09
3/31/2000 1.14E+07 2005.91 2049.59 2016.1 2060.07 2015.97 2060.07 2010.51 2060.07
4/1/2000 1.14E+07 2005.91 2049.59 2016.1 2060.07 2015.97 2060.07 2010.51 2060.07
4/1/2000 1.14E+07 2020.78 2049.59 2031.06 2060.07 2031 2060.07 2027.68 2060.07
4/1/2000 1.14E+07 2006.35 2049.59 2016.56 2060.07 2016.5 2060.07 2012.02 2060.07
4/1/2000 1.14E+07 2006.47 2049.59 2016.68 2060.07 2016.57 2060.07 2011.54 2060.07
4/1/2000 1.14E+07 2006.5 2049.59 2016.7 2060.07 2016.58 2060.07 2011.46 2060.07
4/2/2000 1.14E+07 2006.52 2049.59 2016.72 2060.06 2016.6 2060.06 2011.46 2060.07
4/10/2000 1.12E+07 2006.54 2049.59 2016.74 2060.06 2016.62 2060.06 2011.48 2060.07
4/30/2000 1.09E+07 2006.54 2049.57 2016.74 2060.05 2016.62 2060.05 2011.48 2060.05
5/1/2000 1.09E+07 2006.54 2049.57 2016.74 2060.05 2016.62 2060.05 2011.48 2060.05
5/1/2000 1.09E+07 2022.15 2049.57 2032.45 2060.05 2032.41 2060.05 2029.74 2060.05
5/1/2000 1.09E+07 2007.75 2049.57 2017.99 2060.05 2017.94 2060.05 2013.94 2060.05
5/1/2000 1.09E+07 2007.91 2049.57 2018.14 2060.05 2018.06 2060.05 2013.73 2060.05
5/1/2000 1.09E+07 2007.97 2049.57 2018.21 2060.04 2018.11 2060.04 2013.73 2060.05
5/2/2000 1.08E+07 2008.03 2049.57 2018.27 2060.04 2018.17 2060.04 2013.79 2060.05
5/10/2000 1.05E+07 2008.09 2049.57 2018.33 2060.04 2018.23 2060.04 2013.85 2060.04
5/31/2000 9.53E+06 2008.13 2049.55 2018.36 2060.02 2018.27 2060.02 2013.89 2060.03
6/1/2000 9.53E+06 2008.13 2049.55 2018.36 2060.02 2018.27 2060.02 2013.89 2060.03
6/1/2000 9.53E+06 2022.14 2049.55 2032.45 2060.02 2032.41 2060.02 2029.81 2060.03
6/1/2000 9.53E+06 2007.66 2049.55 2017.89 2060.02 2017.83 2060.02 2013.79 2060.03
6/1/2000 9.54E+06 2007.73 2049.55 2017.96 2060.02 2017.87 2060.02 2013.4 2060.03
6/1/2000 9.54E+06 2007.71 2049.55 2017.94 2060.02 2017.84 2060.02 2013.28 2060.03
6/2/2000 9.56E+06 2007.7 2049.55 2017.92 2060.02 2017.82 2060.02 2013.24 2060.03
6/10/2000 9.66E+06 2007.69 2049.55 2017.91 2060.02 2017.81 2060.02 2013.22 2060.02
6/30/2000 9.92E+06 2007.68 2049.53 2017.9 2060 2017.8 2060 2013.21 2060.01
7/1/2000 9.92E+06 2007.68 2049.53 2017.9 2060 2017.8 2060 2013.21 2060.01
7/1/2000 9.92E+06 2021.71 2049.53 2032.01 2060 2031.97 2060 2029.15 2060.01
7/1/2000 9.92E+06 2007.23 2049.53 2017.45 2060 2017.39 2060 2013.32 2060.01
7/1/2000 9.92E+06 2007.3 2049.53 2017.52 2060 2017.42 2060 2012.79 2060.01
7/1/2000 9.93E+06 2007.29 2049.53 2017.5 2060 2017.4 2060 2012.65 2060.01
7/2/2000 9.95E+06 2007.27 2049.53 2017.49 2060 2017.38 2060 2012.6 2060.01
7/10/2000 1.00E+07 2007.25 2049.52 2017.47 2060 2017.36 2060 2012.57 2060

116
7/31/2000 1.03E+07 2007.23 2049.51 2017.45 2059.98 2017.34 2059.98 2012.54 2059.99
8/1/2000 1.03E+07 2007.23 2049.51 2017.45 2059.98 2017.34 2059.98 2012.54 2059.99
8/1/2000 1.03E+07 2021.65 2049.51 2031.95 2059.98 2031.9 2059.98 2029.05 2059.99
8/1/2000 1.03E+07 2007.19 2049.51 2017.41 2059.98 2017.36 2059.98 2013.29 2059.99
8/1/2000 1.03E+07 2007.29 2049.51 2017.51 2059.98 2017.41 2059.98 2012.8 2059.99
8/1/2000 1.03E+07 2007.29 2049.51 2017.51 2059.98 2017.4 2059.98 2012.67 2059.99
8/2/2000 1.03E+07 2007.29 2049.51 2017.51 2059.98 2017.4 2059.98 2012.65 2059.99
8/10/2000 1.03E+07 2007.29 2049.5 2017.51 2059.97 2017.4 2059.97 2012.64 2059.98
8/31/2000 1.02E+07 2007.28 2049.49 2017.49 2059.96 2017.39 2059.96 2012.62 2059.97
9/1/2000 1.02E+07 2007.28 2049.49 2017.49 2059.96 2017.39 2059.96 2012.62 2059.97
9/1/2000 1.02E+07 2022.8 2049.49 2033.12 2059.96 2033.08 2059.96 2030.76 2059.97
9/1/2000 1.02E+07 2008.4 2049.49 2018.64 2059.96 2018.59 2059.96 2014.82 2059.97
9/1/2000 1.02E+07 2008.55 2049.49 2018.8 2059.96 2018.72 2059.96 2014.67 2059.97
9/1/2000 1.02E+07 2008.61 2049.49 2018.85 2059.96 2018.77 2059.96 2014.7 2059.96
9/2/2000 1.02E+07 2008.67 2049.49 2018.91 2059.96 2018.83 2059.96 2014.75 2059.96
9/10/2000 9.83E+06 2008.72 2049.48 2018.96 2059.95 2018.88 2059.95 2014.81 2059.96
9/30/2000 8.98E+06 2008.75 2049.47 2018.99 2059.94 2018.91 2059.94 2014.85 2059.94
10/1/2000 8.98E+06 2008.75 2049.47 2018.99 2059.94 2018.91 2059.94 2014.85 2059.94
10/1/2000 8.98E+06 2024.72 2049.47 2035.07 2059.94 2035.06 2059.94 2033.65 2059.94
10/1/2000 8.98E+06 2010.34 2049.47 2020.6 2059.94 2020.56 2059.94 2017.47 2059.94
10/1/2000 8.98E+06 2010.51 2049.47 2020.79 2059.94 2020.74 2059.94 2017.55 2059.94
10/1/2000 8.96E+06 2010.59 2049.47 2020.87 2059.94 2020.82 2059.94 2017.65 2059.94
10/2/2000 8.87E+06 2010.68 2049.47 2020.95 2059.94 2020.9 2059.94 2017.75 2059.94
10/10/2000 8.43E+06 2010.76 2049.46 2021.04 2059.93 2020.98 2059.93 2017.85 2059.94
10/31/2000 7.25E+06 2010.82 2049.45 2021.1 2059.92 2021.04 2059.92 2017.92 2059.92
11/1/2000 7.25E+06 2010.82 2049.45 2021.1 2059.92 2021.04 2059.92 2017.92 2059.92
11/1/2000 7.25E+06 2025 2049.45 2035.36 2059.92 2035.35 2059.92 2034.11 2059.92
11/1/2000 7.25E+06 2010.51 2049.45 2020.77 2059.92 2020.73 2059.92 2017.62 2059.92
11/1/2000 7.25E+06 2010.59 2049.45 2020.86 2059.92 2020.81 2059.92 2017.58 2059.92
11/1/2000 7.25E+06 2010.58 2049.45 2020.86 2059.92 2020.8 2059.92 2017.56 2059.92
11/2/2000 7.26E+06 2010.58 2049.44 2020.85 2059.92 2020.79 2059.92 2017.55 2059.92
11/10/2000 7.32E+06 2010.58 2049.44 2020.85 2059.91 2020.79 2059.91 2017.56 2059.92
11/30/2000 7.47E+06 2010.59 2049.43 2020.86 2059.9 2020.8 2059.9 2017.57 2059.9
12/1/2000 7.47E+06 2010.59 2049.43 2020.86 2059.9 2020.8 2059.9 2017.57 2059.9
12/1/2000 7.47E+06 2025.75 2049.43 2036.11 2059.9 2036.11 2059.9 2035.17 2059.9
12/1/2000 7.47E+06 2011.31 2049.43 2021.58 2059.9 2021.54 2059.9 2018.71 2059.9
12/1/2000 7.47E+06 2011.44 2049.43 2021.73 2059.9 2021.68 2059.9 2018.84 2059.9
12/1/2000 7.46E+06 2011.48 2049.43 2021.77 2059.9 2021.72 2059.9 2018.9 2059.9
12/2/2000 7.42E+06 2011.52 2049.43 2021.81 2059.9 2021.76 2059.9 2018.95 2059.9
12/10/2000 7.21E+06 2011.56 2049.42 2021.85 2059.89 2021.8 2059.89 2018.99 2059.9
12/31/2000 6.64E+06 2011.59 2049.41 2021.88 2059.88 2021.83 2059.88 2019.03 2059.88
1/1/2001 6.64E+06 2011.59 2049.41 2021.88 2059.88 2021.83 2059.88 2019.03 2059.88
1/1/2001 6.64E+06 2026.54 2049.41 2036.91 2059.88 2036.92 2059.88 2036.33 2059.88
1/1/2001 6.64E+06 2012.08 2049.41 2022.36 2059.88 2022.32 2059.88 2019.74 2059.88
1/1/2001 6.63E+06 2012.2 2049.41 2022.5 2059.88 2022.46 2059.88 2019.92 2059.88
1/1/2001 6.63E+06 2012.23 2049.41 2022.53 2059.88 2022.49 2059.88 2019.97 2059.88
1/2/2001 6.60E+06 2012.26 2049.41 2022.55 2059.88 2022.52 2059.88 2020.01 2059.88
1/10/2001 6.45E+06 2012.29 2049.4 2022.59 2059.87 2022.55 2059.87 2020.05 2059.88
1/31/2001 6.04E+06 2012.33 2049.39 2022.62 2059.86 2022.58 2059.86 2020.09 2059.86
2/1/2001 6.04E+06 2012.33 2049.39 2022.62 2059.86 2022.58 2059.86 2020.09 2059.86
2/1/2001 6.04E+06 2026.41 2049.39 2036.79 2059.86 2036.79 2059.86 2036.15 2059.86
2/1/2001 6.04E+06 2011.9 2049.39 2022.18 2059.86 2022.14 2059.86 2019.48 2059.86
2/1/2001 6.04E+06 2011.98 2049.39 2022.27 2059.86 2022.23 2059.86 2019.57 2059.86
2/1/2001 6.04E+06 2011.97 2049.39 2022.26 2059.86 2022.21 2059.86 2019.56 2059.86
2/2/2001 6.06E+06 2011.95 2049.39 2022.24 2059.86 2022.2 2059.86 2019.54 2059.86
2/10/2001 6.16E+06 2011.95 2049.38 2022.24 2059.85 2022.19 2059.85 2019.53 2059.86
2/28/2001 6.37E+06 2011.95 2049.37 2022.24 2059.84 2022.19 2059.84 2019.53 2059.85
3/1/2001 6.37E+06 2011.95 2049.37 2022.24 2059.84 2022.19 2059.84 2019.53 2059.85
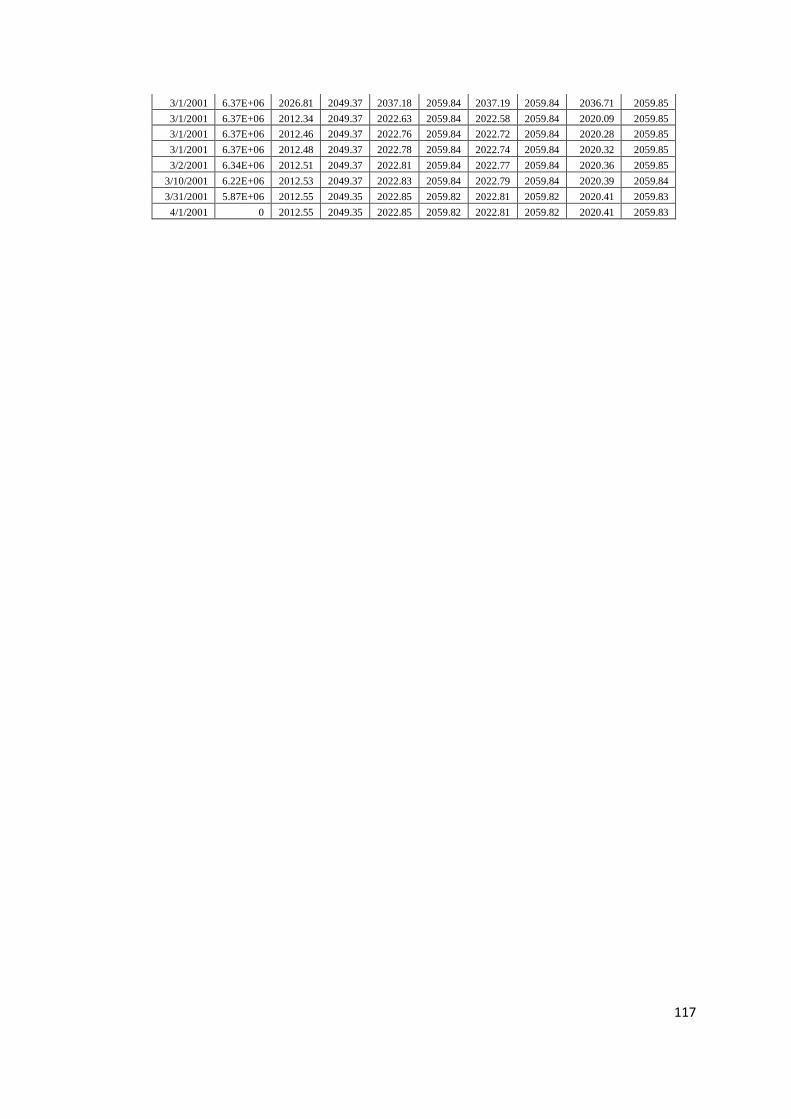
117
3/1/2001 6.37E+06 2026.81 2049.37 2037.18 2059.84 2037.19 2059.84 2036.71 2059.85
3/1/2001 6.37E+06 2012.34 2049.37 2022.63 2059.84 2022.58 2059.84 2020.09 2059.85
3/1/2001 6.37E+06 2012.46 2049.37 2022.76 2059.84 2022.72 2059.84 2020.28 2059.85
3/1/2001 6.37E+06 2012.48 2049.37 2022.78 2059.84 2022.74 2059.84 2020.32 2059.85
3/2/2001 6.34E+06 2012.51 2049.37 2022.81 2059.84 2022.77 2059.84 2020.36 2059.85
3/10/2001 6.22E+06 2012.53 2049.37 2022.83 2059.84 2022.79 2059.84 2020.39 2059.84
3/31/2001 5.87E+06 2012.55 2049.35 2022.85 2059.82 2022.81 2059.82 2020.41 2059.83
4/1/2001 0 2012.55 2049.35 2022.85 2059.82 2022.81 2059.82 2020.41 2059.83

118
Table C.4: CMG IMEX Numerical simulation results for assumed Skin 33.3.
Skin 33.3
Darcy Flow
Non-Darcy Flow
FG1
Non-Darcy Flow
FG2
Non-Darcy Flow
Geertsma
DATE
Gas Rate
SC -
Monthly Pbh Pr Pbh Pr Pbh Pr Pbh Pr
(ft3/day) (psi) (psi) (psi) (psi) (psi) (psi) (psi) (psi)
8/31/1997 0 0 0 0 0 0 0 0 0
9/1/1997 90.2957 0 2050.01 0 2060.53 0 2060.53 0 2060.53
9/1/1997 112.87 2034.48 2050.01 2044.89 2060.53 2044.89 2060.53 2045.09 2060.53
9/1/1997 225.739 2019.98 2050.01 2030.32 2060.53 2030.32 2060.53 2030.17 2060.53
9/1/1997 790.087 2020.07 2050.01 2030.41 2060.53 2030.41 2060.53 2030.29 2060.53
9/1/1997 3611.83 2020.05 2050.01 2030.39 2060.53 2030.39 2060.53 2030.28 2060.53
9/2/1997 17720.5 2020.04 2050.01 2030.38 2060.53 2030.38 2060.53 2030.27 2060.53
9/10/1997 88264.1 2020.03 2050.01 2030.37 2060.52 2030.37 2060.52 2030.25 2060.52
9/30/1997 270887 2020.02 2050.01 2030.36 2060.48 2030.36 2060.48 2030.24 2060.48
10/1/1997 272432 2020.02 2050.01 2030.36 2060.48 2030.36 2060.48 2030.24 2060.48
10/1/1997 272819 2023.66 2050.01 2034.05 2060.48 2034.05 2060.48 2033.07 2060.48
10/1/1997 274750 2008.95 2050.01 2019.26 2060.48 2019.24 2060.48 2016.57 2060.48
10/1/1997 284406 2008.82 2050.01 2019.12 2060.48 2019.1 2060.48 2015.72 2060.48
10/1/1997 332688 2008.6 2050.01 2018.9 2060.48 2018.87 2060.48 2015.26 2060.48
10/2/1997 574098 2008.38 2050.01 2018.68 2060.48 2018.65 2060.48 2014.94 2060.48
10/10/1997 1.78E+06 2008.16 2050.01 2018.46 2060.48 2018.43 2060.48 2014.68 2060.48
10/31/1997 5.06E+06 2007.99 2050.01 2018.3 2060.48 2018.27 2060.48 2014.49 2060.48
11/1/1997 5.06E+06 2007.99 2050.01 2018.3 2060.48 2018.27 2060.48 2014.49 2060.48
11/1/1997 5.06E+06 2020.53 2050.01 2030.89 2060.48 2030.88 2060.48 2028.3 2060.48
11/1/1997 5.06E+06 2006.06 2050.01 2016.36 2060.48 2016.34 2060.48 2012.33 2060.48
11/1/1997 5.06E+06 2006.12 2050.01 2016.41 2060.48 2016.37 2060.48 2012 2060.48
11/1/1997 5.07E+06 2006.08 2050.01 2016.37 2060.48 2016.33 2060.48 2011.86 2060.48
11/2/1997 5.11E+06 2006.03 2050.01 2016.32 2060.48 2016.28 2060.48 2011.79 2060.48
11/10/1997 5.32E+06 2005.96 2050.01 2016.25 2060.48 2016.21 2060.48 2011.7 2060.48
11/30/1997 5.86E+06 2005.87 2050.01 2016.16 2060.48 2016.12 2060.48 2011.6 2060.48
12/1/1997 5.86E+06 2005.87 2050.01 2016.16 2060.48 2016.12 2060.48 2011.6 2060.48
12/1/1997 5.86E+06 2019.42 2050.01 2029.78 2060.48 2029.75 2060.48 2026.76 2060.48
12/1/1997 5.87E+06 2004.99 2050.01 2015.28 2060.48 2015.25 2060.48 2010.82 2060.48
12/1/1997 5.87E+06 2005.06 2050.01 2015.35 2060.48 2015.31 2060.48 2010.56 2060.48
12/1/1997 5.87E+06 2005.05 2050.01 2015.33 2060.48 2015.29 2060.48 2010.47 2060.48
12/2/1997 5.89E+06 2005.02 2050.01 2015.31 2060.48 2015.27 2060.48 2010.43 2060.48
12/10/1997 5.97E+06 2004.98 2050.01 2015.27 2060.48 2015.22 2060.48 2010.38 2060.48
12/31/1997 6.21E+06 2004.92 2050.01 2015.21 2060.48 2015.16 2060.48 2010.31 2060.48
1/1/1998 6.21E+06 2004.92 2050.01 2015.21 2060.48 2015.16 2060.48 2010.31 2060.48
1/1/1998 6.21E+06 2019.4 2050.01 2029.75 2060.48 2029.72 2060.48 2026.71 2060.48
1/1/1998 6.21E+06 2004.98 2050.01 2015.27 2060.48 2015.25 2060.48 2010.84 2060.48
1/1/1998 6.21E+06 2005.08 2050.01 2015.36 2060.48 2015.33 2060.48 2010.62 2060.48
1/1/1998 6.21E+06 2005.08 2050.01 2015.37 2060.48 2015.32 2060.48 2010.55 2060.48
1/2/1998 6.21E+06 2005.08 2050.01 2015.36 2060.48 2015.32 2060.48 2010.54 2060.48
1/10/1998 6.19E+06 2005.06 2050.01 2015.35 2060.48 2015.31 2060.48 2010.52 2060.48
1/31/1998 6.14E+06 2005.03 2050.01 2015.31 2060.48 2015.27 2060.48 2010.47 2060.48
2/1/1998 6.14E+06 2005.03 2050.01 2015.31 2060.48 2015.27 2060.48 2010.47 2060.48
2/1/1998 6.14E+06 2019.48 2050.01 2029.84 2060.48 2029.81 2060.48 2026.85 2060.48
2/1/1998 6.14E+06 2005.07 2050.01 2015.36 2060.48 2015.33 2060.48 2010.99 2060.48
2/1/1998 6.14E+06 2005.16 2050.01 2015.45 2060.48 2015.41 2060.48 2010.76 2060.48
2/1/1998 6.14E+06 2005.16 2050.01 2015.45 2060.48 2015.41 2060.48 2010.69 2060.48
2/2/1998 6.14E+06 2005.16 2050.01 2015.45 2060.48 2015.41 2060.48 2010.68 2060.48
2/10/1998 6.12E+06 2005.16 2050 2015.44 2060.48 2015.4 2060.48 2010.66 2060.48
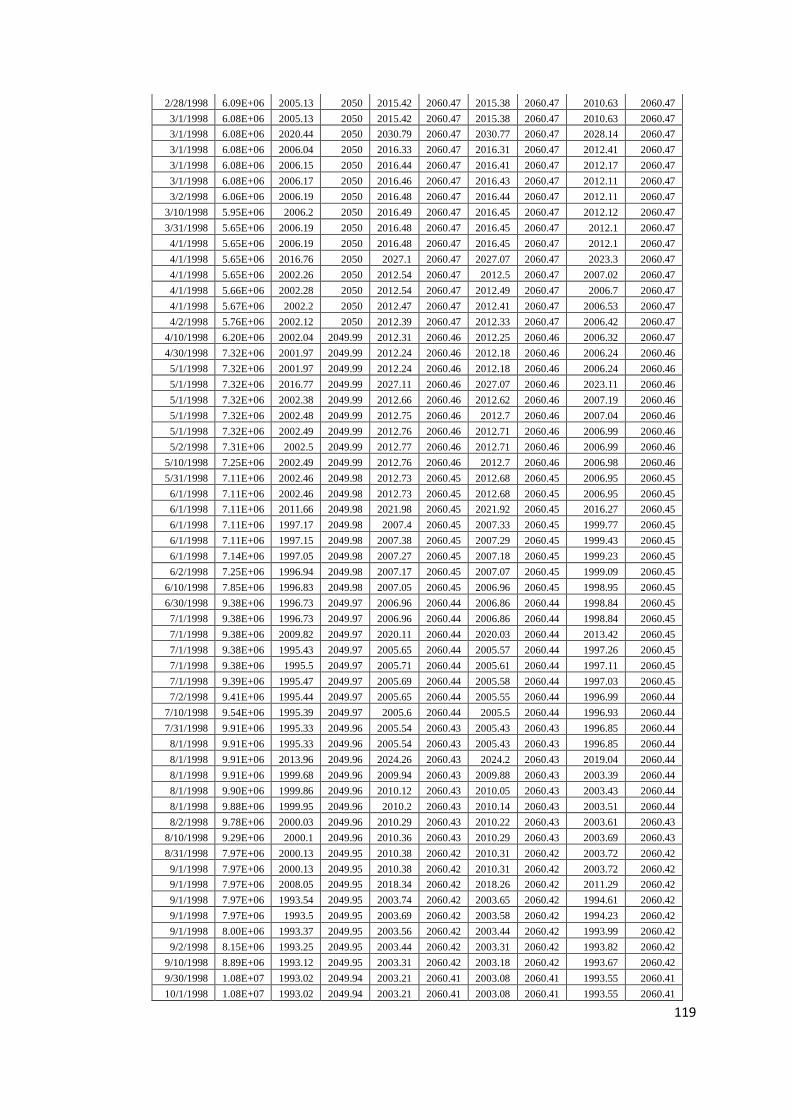
119
2/28/1998 6.09E+06 2005.13 2050 2015.42 2060.47 2015.38 2060.47 2010.63 2060.47
3/1/1998 6.08E+06 2005.13 2050 2015.42 2060.47 2015.38 2060.47 2010.63 2060.47
3/1/1998 6.08E+06 2020.44 2050 2030.79 2060.47 2030.77 2060.47 2028.14 2060.47
3/1/1998 6.08E+06 2006.04 2050 2016.33 2060.47 2016.31 2060.47 2012.41 2060.47
3/1/1998 6.08E+06 2006.15 2050 2016.44 2060.47 2016.41 2060.47 2012.17 2060.47
3/1/1998 6.08E+06 2006.17 2050 2016.46 2060.47 2016.43 2060.47 2012.11 2060.47
3/2/1998 6.06E+06 2006.19 2050 2016.48 2060.47 2016.44 2060.47 2012.11 2060.47
3/10/1998 5.95E+06 2006.2 2050 2016.49 2060.47 2016.45 2060.47 2012.12 2060.47
3/31/1998 5.65E+06 2006.19 2050 2016.48 2060.47 2016.45 2060.47 2012.1 2060.47
4/1/1998 5.65E+06 2006.19 2050 2016.48 2060.47 2016.45 2060.47 2012.1 2060.47
4/1/1998 5.65E+06 2016.76 2050 2027.1 2060.47 2027.07 2060.47 2023.3 2060.47
4/1/1998 5.65E+06 2002.26 2050 2012.54 2060.47 2012.5 2060.47 2007.02 2060.47
4/1/1998 5.66E+06 2002.28 2050 2012.54 2060.47 2012.49 2060.47 2006.7 2060.47
4/1/1998 5.67E+06 2002.2 2050 2012.47 2060.47 2012.41 2060.47 2006.53 2060.47
4/2/1998 5.76E+06 2002.12 2050 2012.39 2060.47 2012.33 2060.47 2006.42 2060.47
4/10/1998 6.20E+06 2002.04 2049.99 2012.31 2060.46 2012.25 2060.46 2006.32 2060.47
4/30/1998 7.32E+06 2001.97 2049.99 2012.24 2060.46 2012.18 2060.46 2006.24 2060.46
5/1/1998 7.32E+06 2001.97 2049.99 2012.24 2060.46 2012.18 2060.46 2006.24 2060.46
5/1/1998 7.32E+06 2016.77 2049.99 2027.11 2060.46 2027.07 2060.46 2023.11 2060.46
5/1/1998 7.32E+06 2002.38 2049.99 2012.66 2060.46 2012.62 2060.46 2007.19 2060.46
5/1/1998 7.32E+06 2002.48 2049.99 2012.75 2060.46 2012.7 2060.46 2007.04 2060.46
5/1/1998 7.32E+06 2002.49 2049.99 2012.76 2060.46 2012.71 2060.46 2006.99 2060.46
5/2/1998 7.31E+06 2002.5 2049.99 2012.77 2060.46 2012.71 2060.46 2006.99 2060.46
5/10/1998 7.25E+06 2002.49 2049.99 2012.76 2060.46 2012.7 2060.46 2006.98 2060.46
5/31/1998 7.11E+06 2002.46 2049.98 2012.73 2060.45 2012.68 2060.45 2006.95 2060.45
6/1/1998 7.11E+06 2002.46 2049.98 2012.73 2060.45 2012.68 2060.45 2006.95 2060.45
6/1/1998 7.11E+06 2011.66 2049.98 2021.98 2060.45 2021.92 2060.45 2016.27 2060.45
6/1/1998 7.11E+06 1997.17 2049.98 2007.4 2060.45 2007.33 2060.45 1999.77 2060.45
6/1/1998 7.11E+06 1997.15 2049.98 2007.38 2060.45 2007.29 2060.45 1999.43 2060.45
6/1/1998 7.14E+06 1997.05 2049.98 2007.27 2060.45 2007.18 2060.45 1999.23 2060.45
6/2/1998 7.25E+06 1996.94 2049.98 2007.17 2060.45 2007.07 2060.45 1999.09 2060.45
6/10/1998 7.85E+06 1996.83 2049.98 2007.05 2060.45 2006.96 2060.45 1998.95 2060.45
6/30/1998 9.38E+06 1996.73 2049.97 2006.96 2060.44 2006.86 2060.44 1998.84 2060.45
7/1/1998 9.38E+06 1996.73 2049.97 2006.96 2060.44 2006.86 2060.44 1998.84 2060.45
7/1/1998 9.38E+06 2009.82 2049.97 2020.11 2060.44 2020.03 2060.44 2013.42 2060.45
7/1/1998 9.38E+06 1995.43 2049.97 2005.65 2060.44 2005.57 2060.44 1997.26 2060.45
7/1/1998 9.38E+06 1995.5 2049.97 2005.71 2060.44 2005.61 2060.44 1997.11 2060.45
7/1/1998 9.39E+06 1995.47 2049.97 2005.69 2060.44 2005.58 2060.44 1997.03 2060.45
7/2/1998 9.41E+06 1995.44 2049.97 2005.65 2060.44 2005.55 2060.44 1996.99 2060.44
7/10/1998 9.54E+06 1995.39 2049.97 2005.6 2060.44 2005.5 2060.44 1996.93 2060.44
7/31/1998 9.91E+06 1995.33 2049.96 2005.54 2060.43 2005.43 2060.43 1996.85 2060.44
8/1/1998 9.91E+06 1995.33 2049.96 2005.54 2060.43 2005.43 2060.43 1996.85 2060.44
8/1/1998 9.91E+06 2013.96 2049.96 2024.26 2060.43 2024.2 2060.43 2019.04 2060.44
8/1/1998 9.91E+06 1999.68 2049.96 2009.94 2060.43 2009.88 2060.43 2003.39 2060.44
8/1/1998 9.90E+06 1999.86 2049.96 2010.12 2060.43 2010.05 2060.43 2003.43 2060.44
8/1/1998 9.88E+06 1999.95 2049.96 2010.2 2060.43 2010.14 2060.43 2003.51 2060.44
8/2/1998 9.78E+06 2000.03 2049.96 2010.29 2060.43 2010.22 2060.43 2003.61 2060.43
8/10/1998 9.29E+06 2000.1 2049.96 2010.36 2060.43 2010.29 2060.43 2003.69 2060.43
8/31/1998 7.97E+06 2000.13 2049.95 2010.38 2060.42 2010.31 2060.42 2003.72 2060.42
9/1/1998 7.97E+06 2000.13 2049.95 2010.38 2060.42 2010.31 2060.42 2003.72 2060.42
9/1/1998 7.97E+06 2008.05 2049.95 2018.34 2060.42 2018.26 2060.42 2011.29 2060.42
9/1/1998 7.97E+06 1993.54 2049.95 2003.74 2060.42 2003.65 2060.42 1994.61 2060.42
9/1/1998 7.97E+06 1993.5 2049.95 2003.69 2060.42 2003.58 2060.42 1994.23 2060.42
9/1/1998 8.00E+06 1993.37 2049.95 2003.56 2060.42 2003.44 2060.42 1993.99 2060.42
9/2/1998 8.15E+06 1993.25 2049.95 2003.44 2060.42 2003.31 2060.42 1993.82 2060.42
9/10/1998 8.89E+06 1993.12 2049.95 2003.31 2060.42 2003.18 2060.42 1993.67 2060.42
9/30/1998 1.08E+07 1993.02 2049.94 2003.21 2060.41 2003.08 2060.41 1993.55 2060.41
10/1/1998 1.08E+07 1993.02 2049.94 2003.21 2060.41 2003.08 2060.41 1993.55 2060.41

120
10/1/1998 1.08E+07 2007.06 2049.94 2017.32 2060.41 2017.22 2060.41 2009.45 2060.41
10/1/1998 1.08E+07 1992.72 2049.94 2002.91 2060.41 2002.8 2060.41 1993.37 2060.41
10/1/1998 1.08E+07 1992.8 2049.94 2002.99 2060.41 2002.87 2060.41 1993.28 2060.41
10/1/1998 1.08E+07 1992.8 2049.94 2002.98 2060.41 2002.86 2060.41 1993.24 2060.41
10/2/1998 1.08E+07 1992.79 2049.94 2002.97 2060.41 2002.84 2060.41 1993.22 2060.41
10/10/1998 1.08E+07 1992.76 2049.94 2002.94 2060.41 2002.81 2060.41 1993.18 2060.41
10/31/1998 1.09E+07 1992.7 2049.93 2002.89 2060.4 2002.76 2060.4 1993.12 2060.4
11/1/1998 1.09E+07 1992.7 2049.93 2002.89 2060.4 2002.76 2060.4 1993.12 2060.4
11/1/1998 1.09E+07 2005.92 2049.93 2016.17 2060.4 2016.06 2060.4 2007.88 2060.4
11/1/1998 1.09E+07 1991.56 2049.93 2001.74 2060.4 2001.63 2060.4 1991.72 2060.4
11/1/1998 1.09E+07 1991.63 2049.93 2001.81 2060.4 2001.67 2060.4 1991.59 2060.4
11/1/1998 1.09E+07 1991.61 2049.93 2001.78 2060.4 2001.65 2060.4 1991.53 2060.4
11/2/1998 1.09E+07 1991.58 2049.93 2001.76 2060.4 2001.62 2060.4 1991.49 2060.4
11/10/1998 1.10E+07 1991.55 2049.92 2001.72 2060.39 2001.58 2060.39 1991.45 2060.39
11/30/1998 1.14E+07 1991.5 2049.91 2001.67 2060.38 2001.53 2060.38 1991.39 2060.39
12/1/1998 1.14E+07 1991.5 2049.91 2001.67 2060.38 2001.53 2060.38 1991.39 2060.39
12/1/1998 1.14E+07 2004.68 2049.91 2014.92 2060.38 2014.8 2060.38 2006.11 2060.39
12/1/1998 1.14E+07 1990.33 2049.91 2000.5 2060.38 2000.38 2060.38 1989.94 2060.39
12/1/1998 1.14E+07 1990.4 2049.91 2000.57 2060.38 2000.42 2060.38 1989.82 2060.39
12/1/1998 1.14E+07 1990.38 2049.91 2000.54 2060.38 2000.39 2060.38 1989.76 2060.39
12/2/1998 1.14E+07 1990.35 2049.91 2000.52 2060.38 2000.37 2060.38 1989.72 2060.38
12/10/1998 1.15E+07 1990.32 2049.91 2000.48 2060.38 2000.33 2060.38 1989.68 2060.38
12/31/1998 1.18E+07 1990.27 2049.9 2000.43 2060.37 2000.28 2060.37 1989.62 2060.37
1/1/1999 1.18E+07 1990.27 2049.9 2000.43 2060.37 2000.28 2060.37 1989.62 2060.37
1/1/1999 1.18E+07 2005.95 2049.9 2016.2 2060.37 2016.08 2060.37 2007.81 2060.37
1/1/1999 1.18E+07 1991.66 2049.9 2001.84 2060.37 2001.73 2060.37 1991.89 2060.37
1/1/1999 1.18E+07 1991.78 2049.9 2001.96 2060.37 2001.83 2060.37 1991.87 2060.37
1/1/1999 1.18E+07 1991.81 2049.9 2001.99 2060.37 2001.85 2060.37 1991.89 2060.37
1/2/1999 1.18E+07 1991.83 2049.89 2002.01 2060.37 2001.88 2060.37 1991.92 2060.37
1/10/1999 1.16E+07 1991.85 2049.89 2002.03 2060.36 2001.89 2060.36 1991.93 2060.36
1/31/1999 1.12E+07 1991.83 2049.88 2002.01 2060.35 2001.88 2060.35 1991.92 2060.35
2/1/1999 1.12E+07 1991.83 2049.88 2002.01 2060.35 2001.88 2060.35 1991.92 2060.35
2/1/1999 1.12E+07 2005.3 2049.88 2015.54 2060.35 2015.43 2060.35 2007.02 2060.35
2/1/1999 1.12E+07 1990.95 2049.88 2001.13 2060.35 2001.01 2060.35 1990.89 2060.35
2/1/1999 1.12E+07 1991.02 2049.88 2001.2 2060.35 2001.06 2060.35 1990.77 2060.35
2/1/1999 1.12E+07 1991.01 2049.88 2001.18 2060.35 2001.04 2060.35 1990.72 2060.35
2/2/1999 1.12E+07 1990.99 2049.88 2001.16 2060.35 2001.02 2060.35 1990.69 2060.35
2/10/1999 1.13E+07 1990.97 2049.87 2001.14 2060.34 2001 2060.34 1990.66 2060.35
2/28/1999 1.15E+07 1990.94 2049.86 2001.11 2060.33 2000.97 2060.33 1990.63 2060.34
3/1/1999 1.15E+07 1990.94 2049.86 2001.11 2060.33 2000.97 2060.33 1990.63 2060.34
3/1/1999 1.15E+07 2005.39 2049.86 2015.64 2060.33 2015.52 2060.33 2007.11 2060.34
3/1/1999 1.15E+07 1991.07 2049.86 2001.25 2060.33 2001.13 2060.33 1991.07 2060.34
3/1/1999 1.15E+07 1991.16 2049.86 2001.34 2060.33 2001.2 2060.33 1991 2060.34
3/1/1999 1.15E+07 1991.17 2049.86 2001.34 2060.33 2001.2 2060.33 1990.97 2060.34
3/2/1999 1.15E+07 1991.17 2049.86 2001.34 2060.33 2001.2 2060.33 1990.97 2060.34
3/10/1999 1.15E+07 1991.16 2049.86 2001.34 2060.33 2001.2 2060.33 1990.97 2060.33
3/31/1999 1.14E+07 1991.14 2049.84 2001.32 2060.31 2001.17 2060.31 1990.94 2060.32
4/1/1999 1.14E+07 1991.14 2049.84 2001.32 2060.31 2001.17 2060.31 1990.94 2060.32
4/1/1999 1.14E+07 2006.65 2049.84 2016.91 2060.31 2016.8 2060.31 2008.88 2060.32
4/1/1999 1.14E+07 1992.35 2049.84 2002.54 2060.31 2002.43 2060.31 1992.94 2060.32
4/1/1999 1.14E+07 1992.46 2049.84 2002.65 2060.31 2002.53 2060.31 1992.91 2060.32
4/1/1999 1.14E+07 1992.49 2049.84 2002.68 2060.31 2002.55 2060.31 1992.92 2060.32
4/2/1999 1.14E+07 1992.51 2049.84 2002.7 2060.31 2002.57 2060.31 1992.95 2060.32
4/10/1999 1.12E+07 1992.53 2049.84 2002.72 2060.31 2002.59 2060.31 1992.97 2060.31
4/30/1999 1.09E+07 1992.53 2049.82 2002.72 2060.3 2002.59 2060.3 1992.97 2060.3
5/1/1999 1.09E+07 1992.53 2049.82 2002.72 2060.3 2002.59 2060.3 1992.97 2060.3
5/1/1999 1.09E+07 2006.36 2049.82 2016.62 2060.3 2016.51 2060.3 2008.57 2060.3
5/1/1999 1.09E+07 1992.02 2049.82 2002.21 2060.3 2002.1 2060.3 1992.48 2060.3
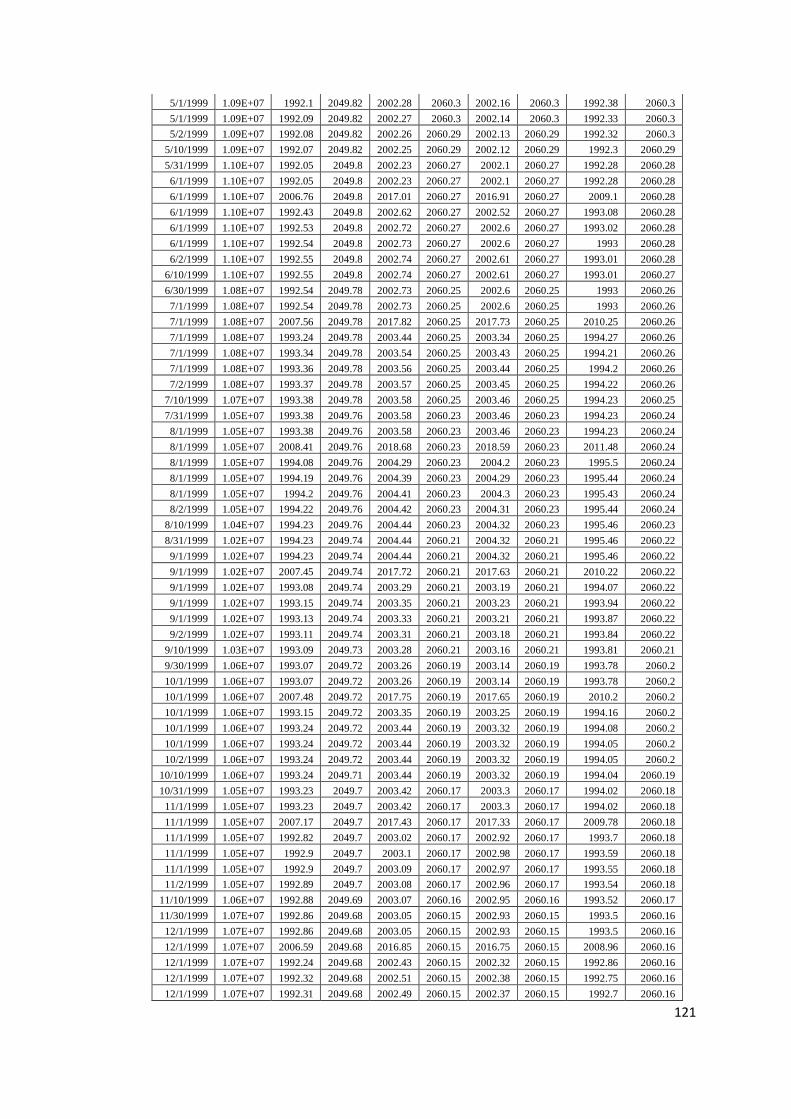
121
5/1/1999 1.09E+07 1992.1 2049.82 2002.28 2060.3 2002.16 2060.3 1992.38 2060.3
5/1/1999 1.09E+07 1992.09 2049.82 2002.27 2060.3 2002.14 2060.3 1992.33 2060.3
5/2/1999 1.09E+07 1992.08 2049.82 2002.26 2060.29 2002.13 2060.29 1992.32 2060.3
5/10/1999 1.09E+07 1992.07 2049.82 2002.25 2060.29 2002.12 2060.29 1992.3 2060.29
5/31/1999 1.10E+07 1992.05 2049.8 2002.23 2060.27 2002.1 2060.27 1992.28 2060.28
6/1/1999 1.10E+07 1992.05 2049.8 2002.23 2060.27 2002.1 2060.27 1992.28 2060.28
6/1/1999 1.10E+07 2006.76 2049.8 2017.01 2060.27 2016.91 2060.27 2009.1 2060.28
6/1/1999 1.10E+07 1992.43 2049.8 2002.62 2060.27 2002.52 2060.27 1993.08 2060.28
6/1/1999 1.10E+07 1992.53 2049.8 2002.72 2060.27 2002.6 2060.27 1993.02 2060.28
6/1/1999 1.10E+07 1992.54 2049.8 2002.73 2060.27 2002.6 2060.27 1993 2060.28
6/2/1999 1.10E+07 1992.55 2049.8 2002.74 2060.27 2002.61 2060.27 1993.01 2060.28
6/10/1999 1.10E+07 1992.55 2049.8 2002.74 2060.27 2002.61 2060.27 1993.01 2060.27
6/30/1999 1.08E+07 1992.54 2049.78 2002.73 2060.25 2002.6 2060.25 1993 2060.26
7/1/1999 1.08E+07 1992.54 2049.78 2002.73 2060.25 2002.6 2060.25 1993 2060.26
7/1/1999 1.08E+07 2007.56 2049.78 2017.82 2060.25 2017.73 2060.25 2010.25 2060.26
7/1/1999 1.08E+07 1993.24 2049.78 2003.44 2060.25 2003.34 2060.25 1994.27 2060.26
7/1/1999 1.08E+07 1993.34 2049.78 2003.54 2060.25 2003.43 2060.25 1994.21 2060.26
7/1/1999 1.08E+07 1993.36 2049.78 2003.56 2060.25 2003.44 2060.25 1994.2 2060.26
7/2/1999 1.08E+07 1993.37 2049.78 2003.57 2060.25 2003.45 2060.25 1994.22 2060.26
7/10/1999 1.07E+07 1993.38 2049.78 2003.58 2060.25 2003.46 2060.25 1994.23 2060.25
7/31/1999 1.05E+07 1993.38 2049.76 2003.58 2060.23 2003.46 2060.23 1994.23 2060.24
8/1/1999 1.05E+07 1993.38 2049.76 2003.58 2060.23 2003.46 2060.23 1994.23 2060.24
8/1/1999 1.05E+07 2008.41 2049.76 2018.68 2060.23 2018.59 2060.23 2011.48 2060.24
8/1/1999 1.05E+07 1994.08 2049.76 2004.29 2060.23 2004.2 2060.23 1995.5 2060.24
8/1/1999 1.05E+07 1994.19 2049.76 2004.39 2060.23 2004.29 2060.23 1995.44 2060.24
8/1/1999 1.05E+07 1994.2 2049.76 2004.41 2060.23 2004.3 2060.23 1995.43 2060.24
8/2/1999 1.05E+07 1994.22 2049.76 2004.42 2060.23 2004.31 2060.23 1995.44 2060.24
8/10/1999 1.04E+07 1994.23 2049.76 2004.44 2060.23 2004.32 2060.23 1995.46 2060.23
8/31/1999 1.02E+07 1994.23 2049.74 2004.44 2060.21 2004.32 2060.21 1995.46 2060.22
9/1/1999 1.02E+07 1994.23 2049.74 2004.44 2060.21 2004.32 2060.21 1995.46 2060.22
9/1/1999 1.02E+07 2007.45 2049.74 2017.72 2060.21 2017.63 2060.21 2010.22 2060.22
9/1/1999 1.02E+07 1993.08 2049.74 2003.29 2060.21 2003.19 2060.21 1994.07 2060.22
9/1/1999 1.02E+07 1993.15 2049.74 2003.35 2060.21 2003.23 2060.21 1993.94 2060.22
9/1/1999 1.02E+07 1993.13 2049.74 2003.33 2060.21 2003.21 2060.21 1993.87 2060.22
9/2/1999 1.02E+07 1993.11 2049.74 2003.31 2060.21 2003.18 2060.21 1993.84 2060.22
9/10/1999 1.03E+07 1993.09 2049.73 2003.28 2060.21 2003.16 2060.21 1993.81 2060.21
9/30/1999 1.06E+07 1993.07 2049.72 2003.26 2060.19 2003.14 2060.19 1993.78 2060.2
10/1/1999 1.06E+07 1993.07 2049.72 2003.26 2060.19 2003.14 2060.19 1993.78 2060.2
10/1/1999 1.06E+07 2007.48 2049.72 2017.75 2060.19 2017.65 2060.19 2010.2 2060.2
10/1/1999 1.06E+07 1993.15 2049.72 2003.35 2060.19 2003.25 2060.19 1994.16 2060.2
10/1/1999 1.06E+07 1993.24 2049.72 2003.44 2060.19 2003.32 2060.19 1994.08 2060.2
10/1/1999 1.06E+07 1993.24 2049.72 2003.44 2060.19 2003.32 2060.19 1994.05 2060.2
10/2/1999 1.06E+07 1993.24 2049.72 2003.44 2060.19 2003.32 2060.19 1994.05 2060.2
10/10/1999 1.06E+07 1993.24 2049.71 2003.44 2060.19 2003.32 2060.19 1994.04 2060.19
10/31/1999 1.05E+07 1993.23 2049.7 2003.42 2060.17 2003.3 2060.17 1994.02 2060.18
11/1/1999 1.05E+07 1993.23 2049.7 2003.42 2060.17 2003.3 2060.17 1994.02 2060.18
11/1/1999 1.05E+07 2007.17 2049.7 2017.43 2060.17 2017.33 2060.17 2009.78 2060.18
11/1/1999 1.05E+07 1992.82 2049.7 2003.02 2060.17 2002.92 2060.17 1993.7 2060.18
11/1/1999 1.05E+07 1992.9 2049.7 2003.1 2060.17 2002.98 2060.17 1993.59 2060.18
11/1/1999 1.05E+07 1992.9 2049.7 2003.09 2060.17 2002.97 2060.17 1993.55 2060.18
11/2/1999 1.05E+07 1992.89 2049.7 2003.08 2060.17 2002.96 2060.17 1993.54 2060.18
11/10/1999 1.06E+07 1992.88 2049.69 2003.07 2060.16 2002.95 2060.16 1993.52 2060.17
11/30/1999 1.07E+07 1992.86 2049.68 2003.05 2060.15 2002.93 2060.15 1993.5 2060.16
12/1/1999 1.07E+07 1992.86 2049.68 2003.05 2060.15 2002.93 2060.15 1993.5 2060.16
12/1/1999 1.07E+07 2006.59 2049.68 2016.85 2060.15 2016.75 2060.15 2008.96 2060.16
12/1/1999 1.07E+07 1992.24 2049.68 2002.43 2060.15 2002.32 2060.15 1992.86 2060.16
12/1/1999 1.07E+07 1992.32 2049.68 2002.51 2060.15 2002.38 2060.15 1992.75 2060.16
12/1/1999 1.07E+07 1992.31 2049.68 2002.49 2060.15 2002.37 2060.15 1992.7 2060.16

122
12/2/1999 1.07E+07 1992.29 2049.68 2002.48 2060.15 2002.35 2060.15 1992.68 2060.15
12/10/1999 1.08E+07 1992.28 2049.67 2002.46 2060.14 2002.34 2060.14 1992.66 2060.15
12/31/1999 1.09E+07 1992.25 2049.66 2002.44 2060.13 2002.31 2060.13 1992.63 2060.13
1/1/2000 1.09E+07 1992.25 2049.66 2002.44 2060.13 2002.31 2060.13 1992.63 2060.13
1/1/2000 1.09E+07 2005.49 2049.66 2015.74 2060.13 2015.63 2060.13 2007.41 2060.13
1/1/2000 1.09E+07 1991.13 2049.66 2001.31 2060.13 2001.2 2060.13 1991.26 2060.13
1/1/2000 1.09E+07 1991.2 2049.66 2001.38 2060.13 2001.24 2060.13 1991.13 2060.13
1/1/2000 1.09E+07 1991.18 2049.66 2001.36 2060.13 2001.22 2060.13 1991.07 2060.13
1/2/2000 1.09E+07 1991.16 2049.66 2001.33 2060.13 2001.19 2060.13 1991.04 2060.13
1/10/2000 1.11E+07 1991.13 2049.65 2001.3 2060.12 2001.16 2060.12 1991 2060.13
1/31/2000 1.14E+07 1991.1 2049.64 2001.27 2060.11 2001.13 2060.11 1990.97 2060.11
2/1/2000 1.14E+07 1991.1 2049.64 2001.27 2060.11 2001.13 2060.11 1990.97 2060.11
2/1/2000 1.14E+07 2004.72 2049.64 2014.96 2060.11 2014.85 2060.11 2006.29 2060.11
2/1/2000 1.14E+07 1990.38 2049.64 2000.56 2060.11 2000.43 2060.11 1990.17 2060.11
2/1/2000 1.14E+07 1990.46 2049.64 2000.63 2060.11 2000.49 2060.11 1990.07 2060.11
2/1/2000 1.14E+07 1990.44 2049.64 2000.61 2060.11 2000.47 2060.11 1990.02 2060.11
2/2/2000 1.14E+07 1990.43 2049.64 2000.6 2060.11 2000.45 2060.11 1990 2060.11
2/10/2000 1.15E+07 1990.41 2049.63 2000.58 2060.1 2000.43 2060.1 1989.97 2060.11
2/29/2000 1.16E+07 1990.38 2049.62 2000.55 2060.09 2000.4 2060.09 1989.93 2060.09
3/1/2000 1.16E+07 1990.38 2049.62 2000.55 2060.09 2000.4 2060.09 1989.93 2060.09
3/1/2000 1.16E+07 2005.08 2049.62 2015.32 2060.09 2015.2 2060.09 2006.75 2060.09
3/1/2000 1.16E+07 1990.76 2049.62 2000.94 2060.09 2000.82 2060.09 1990.74 2060.09
3/1/2000 1.16E+07 1990.86 2049.62 2001.03 2060.09 2000.9 2060.09 1990.68 2060.09
3/1/2000 1.16E+07 1990.87 2049.62 2001.04 2060.09 2000.9 2060.09 1990.66 2060.09
3/2/2000 1.16E+07 1990.88 2049.61 2001.05 2060.09 2000.91 2060.09 1990.67 2060.09
3/10/2000 1.16E+07 1990.87 2049.61 2001.05 2060.08 2000.91 2060.08 1990.67 2060.09
3/31/2000 1.14E+07 1990.86 2049.59 2001.03 2060.07 2000.89 2060.07 1990.65 2060.07
4/1/2000 1.14E+07 1990.86 2049.59 2001.03 2060.07 2000.89 2060.07 1990.65 2060.07
4/1/2000 1.14E+07 2006.32 2049.59 2016.58 2060.07 2016.47 2060.07 2008.53 2060.07
4/1/2000 1.14E+07 1992.02 2049.59 2002.21 2060.07 2002.11 2060.07 1992.59 2060.07
4/1/2000 1.14E+07 1992.14 2049.59 2002.32 2060.07 2002.2 2060.07 1992.56 2060.07
4/1/2000 1.14E+07 1992.16 2049.59 2002.35 2060.07 2002.22 2060.07 1992.56 2060.07
4/2/2000 1.14E+07 1992.18 2049.59 2002.37 2060.06 2002.24 2060.06 1992.59 2060.07
4/10/2000 1.12E+07 1992.2 2049.59 2002.39 2060.06 2002.26 2060.06 1992.61 2060.07
4/30/2000 1.09E+07 1992.2 2049.57 2002.39 2060.05 2002.26 2060.05 1992.61 2060.05
5/1/2000 1.09E+07 1992.2 2049.57 2002.39 2060.05 2002.26 2060.05 1992.61 2060.05
5/1/2000 1.09E+07 2009.47 2049.57 2019.75 2060.05 2019.67 2060.05 2012.97 2060.05
5/1/2000 1.09E+07 1995.19 2049.57 2005.42 2060.05 2005.34 2060.05 1997.2 2060.05
5/1/2000 1.09E+07 1995.35 2049.57 2005.57 2060.05 2005.47 2060.05 1997.22 2060.05
5/1/2000 1.09E+07 1995.41 2049.57 2005.63 2060.04 2005.53 2060.04 1997.28 2060.05
5/2/2000 1.08E+07 1995.47 2049.57 2005.69 2060.04 2005.59 2060.04 1997.35 2060.05
5/10/2000 1.05E+07 1995.53 2049.57 2005.75 2060.04 2005.65 2060.04 1997.42 2060.04
5/31/2000 9.53E+06 1995.56 2049.55 2005.79 2060.02 2005.69 2060.02 1997.46 2060.03
6/1/2000 9.53E+06 1995.56 2049.55 2005.79 2060.02 2005.69 2060.02 1997.46 2060.03
6/1/2000 9.53E+06 2008.96 2049.55 2019.24 2060.02 2019.16 2060.02 2012.46 2060.03
6/1/2000 9.53E+06 1994.58 2049.55 2004.8 2060.02 2004.72 2060.02 1996.33 2060.03
6/1/2000 9.54E+06 1994.66 2049.55 2004.87 2060.02 2004.77 2060.02 1996.2 2060.03
6/1/2000 9.54E+06 1994.64 2049.55 2004.85 2060.02 2004.74 2060.02 1996.13 2060.03
6/2/2000 9.56E+06 1994.62 2049.55 2004.83 2060.02 2004.73 2060.02 1996.11 2060.03
6/10/2000 9.66E+06 1994.61 2049.55 2004.82 2060.02 2004.72 2060.02 1996.09 2060.02
6/30/2000 9.92E+06 1994.6 2049.53 2004.81 2060 2004.71 2060 1996.08 2060.01
7/1/2000 9.92E+06 1994.6 2049.53 2004.81 2060 2004.71 2060 1996.08 2060.01
7/1/2000 9.92E+06 2008.04 2049.53 2018.31 2060 2018.23 2060 2011.13 2060.01
7/1/2000 9.92E+06 1993.67 2049.53 2003.88 2060 2003.79 2060 1995.01 2060.01
7/1/2000 9.92E+06 1993.74 2049.53 2003.95 2060 2003.84 2060 1994.88 2060.01
7/1/2000 9.93E+06 1993.73 2049.53 2003.93 2060 2003.82 2060 1994.82 2060.01
7/2/2000 9.95E+06 1993.71 2049.53 2003.91 2060 2003.8 2060 1994.79 2060.01
7/10/2000 1.00E+07 1993.69 2049.52 2003.89 2060 2003.78 2060 1994.77 2060

123
7/31/2000 1.03E+07 1993.67 2049.51 2003.87 2059.98 2003.76 2059.98 1994.74 2059.99
8/1/2000 1.03E+07 1993.67 2049.51 2003.87 2059.98 2003.76 2059.98 1994.74 2059.99
8/1/2000 1.03E+07 2008.05 2049.51 2018.33 2059.98 2018.24 2059.98 2011.1 2059.99
8/1/2000 1.03E+07 1993.71 2049.51 2003.92 2059.98 2003.83 2059.98 1995.07 2059.99
8/1/2000 1.03E+07 1993.8 2049.51 2004.01 2059.98 2003.9 2059.98 1994.98 2059.99
8/1/2000 1.03E+07 1993.8 2049.51 2004.01 2059.98 2003.9 2059.98 1994.95 2059.99
8/2/2000 1.03E+07 1993.81 2049.51 2004.01 2059.98 2003.9 2059.98 1994.95 2059.99
8/10/2000 1.03E+07 1993.8 2049.5 2004.01 2059.97 2003.89 2059.97 1994.94 2059.98
8/31/2000 1.02E+07 1993.79 2049.49 2003.99 2059.96 2003.88 2059.96 1994.93 2059.97
9/1/2000 1.02E+07 1993.79 2049.49 2003.99 2059.96 2003.88 2059.96 1994.93 2059.97
9/1/2000 1.02E+07 2010.86 2049.49 2021.15 2059.96 2021.08 2059.96 2014.99 2059.97
9/1/2000 1.02E+07 1996.57 2049.49 2006.81 2059.96 2006.73 2059.96 1999.2 2059.97
9/1/2000 1.02E+07 1996.72 2049.49 2006.95 2059.96 2006.87 2059.96 1999.21 2059.97
9/1/2000 1.02E+07 1996.77 2049.49 2007.01 2059.96 2006.92 2059.96 1999.25 2059.96
9/2/2000 1.02E+07 1996.83 2049.49 2007.06 2059.96 2006.97 2059.96 1999.32 2059.96
9/10/2000 9.83E+06 1996.88 2049.48 2007.12 2059.95 2007.03 2059.95 1999.38 2059.96
9/30/2000 8.98E+06 1996.91 2049.47 2007.15 2059.94 2007.06 2059.94 1999.41 2059.94
10/1/2000 8.98E+06 1996.91 2049.47 2007.15 2059.94 2007.06 2059.94 1999.41 2059.94
10/1/2000 8.98E+06 2015.09 2049.47 2025.41 2059.94 2025.36 2059.94 2020.93 2059.94
10/1/2000 8.98E+06 2000.79 2049.47 2011.06 2059.94 2011.02 2059.94 2005.26 2059.94
10/1/2000 8.98E+06 2000.97 2049.47 2011.23 2059.94 2011.18 2059.94 2005.26 2059.94
10/1/2000 8.96E+06 2001.05 2049.47 2011.31 2059.94 2011.25 2059.94 2005.32 2059.94
10/2/2000 8.87E+06 2001.13 2049.47 2011.39 2059.94 2011.33 2059.94 2005.41 2059.94
10/10/2000 8.43E+06 2001.21 2049.46 2011.48 2059.93 2011.42 2059.93 2005.51 2059.94
10/31/2000 7.25E+06 2001.27 2049.45 2011.54 2059.92 2011.48 2059.92 2005.58 2059.92
11/1/2000 7.25E+06 2001.27 2049.45 2011.54 2059.92 2011.48 2059.92 2005.58 2059.92
11/1/2000 7.25E+06 2015.07 2049.45 2025.4 2059.92 2025.36 2059.92 2021.1 2059.92
11/1/2000 7.25E+06 2000.67 2049.45 2010.93 2059.92 2010.89 2059.92 2005.08 2059.92
11/1/2000 7.25E+06 2000.75 2049.45 2011.01 2059.92 2010.95 2059.92 2004.9 2059.92
11/1/2000 7.25E+06 2000.74 2049.45 2011 2059.92 2010.94 2059.92 2004.84 2059.92
11/2/2000 7.26E+06 2000.73 2049.44 2010.99 2059.92 2010.93 2059.92 2004.82 2059.92
11/10/2000 7.32E+06 2000.73 2049.44 2011 2059.91 2010.94 2059.91 2004.82 2059.92
11/30/2000 7.47E+06 2000.75 2049.43 2011.01 2059.9 2010.95 2059.9 2004.83 2059.9
12/1/2000 7.47E+06 2000.75 2049.43 2011.01 2059.9 2010.95 2059.9 2004.83 2059.9
12/1/2000 7.47E+06 2016.92 2049.43 2027.26 2059.9 2027.23 2059.9 2023.57 2059.9
12/1/2000 7.47E+06 2002.57 2049.43 2012.85 2059.9 2012.81 2059.9 2007.78 2059.9
12/1/2000 7.47E+06 2002.7 2049.43 2012.97 2059.9 2012.93 2059.9 2007.66 2059.9
12/1/2000 7.46E+06 2002.73 2049.43 2013.01 2059.9 2012.96 2059.9 2007.66 2059.9
12/2/2000 7.42E+06 2002.77 2049.43 2013.05 2059.9 2013 2059.9 2007.69 2059.9
12/10/2000 7.21E+06 2002.81 2049.42 2013.09 2059.89 2013.04 2059.89 2007.74 2059.9
12/31/2000 6.64E+06 2002.85 2049.41 2013.13 2059.88 2013.08 2059.88 2007.78 2059.88
1/1/2001 6.64E+06 2002.85 2049.41 2013.13 2059.88 2013.08 2059.88 2007.78 2059.88
1/1/2001 6.64E+06 2018.5 2049.41 2028.85 2059.88 2028.83 2059.88 2025.78 2059.88
1/1/2001 6.64E+06 2004.13 2049.41 2014.42 2059.88 2014.39 2059.88 2010.01 2059.88
1/1/2001 6.63E+06 2004.24 2049.41 2014.53 2059.88 2014.49 2059.88 2009.83 2059.88
1/1/2001 6.63E+06 2004.27 2049.41 2014.56 2059.88 2014.52 2059.88 2009.8 2059.88
1/2/2001 6.60E+06 2004.3 2049.41 2014.59 2059.88 2014.55 2059.88 2009.82 2059.88
1/10/2001 6.45E+06 2004.34 2049.4 2014.62 2059.87 2014.58 2059.87 2009.85 2059.88
1/31/2001 6.04E+06 2004.37 2049.39 2014.65 2059.86 2014.61 2059.86 2009.88 2059.86
2/1/2001 6.04E+06 2004.37 2049.39 2014.65 2059.86 2014.61 2059.86 2009.88 2059.86
2/1/2001 6.04E+06 2017.93 2049.39 2028.28 2059.86 2028.26 2059.86 2025.07 2059.86
2/1/2001 6.04E+06 2003.51 2049.39 2013.79 2059.86 2013.76 2059.86 2009.11 2059.86
2/1/2001 6.04E+06 2003.58 2049.39 2013.86 2059.86 2013.82 2059.86 2008.87 2059.86
2/1/2001 6.04E+06 2003.57 2049.39 2013.85 2059.86 2013.8 2059.86 2008.79 2059.86
2/2/2001 6.06E+06 2003.55 2049.39 2013.83 2059.86 2013.79 2059.86 2008.75 2059.86
2/10/2001 6.16E+06 2003.54 2049.38 2013.83 2059.85 2013.78 2059.85 2008.74 2059.86
2/28/2001 6.37E+06 2003.54 2049.37 2013.83 2059.84 2013.78 2059.84 2008.74 2059.85
3/1/2001 6.37E+06 2003.54 2049.37 2013.83 2059.84 2013.78 2059.84 2008.74 2059.85

124
3/1/2001 6.37E+06 2019 2049.37 2029.35 2059.84 2029.33 2059.84 2026.46 2059.85
3/1/2001 6.37E+06 2004.61 2049.37 2014.9 2059.84 2014.88 2059.84 2010.7 2059.85
3/1/2001 6.37E+06 2004.73 2049.37 2015.02 2059.84 2014.98 2059.84 2010.49 2059.85
3/1/2001 6.37E+06 2004.75 2049.37 2015.04 2059.84 2015 2059.84 2010.45 2059.85
3/2/2001 6.34E+06 2004.77 2049.37 2015.06 2059.84 2015.02 2059.84 2010.46 2059.85
3/10/2001 6.22E+06 2004.8 2049.37 2015.09 2059.84 2015.05 2059.84 2010.48 2059.84
3/31/2001 5.87E+06 2004.81 2049.35 2015.1 2059.82 2015.07 2059.82 2010.5 2059.83
4/1/2001 0 2004.81 2049.35 2015.1 2059.82 2015.07 2059.82 2010.5 2059.83

125
Table C.5: Results for pseudo steady state radial gas flow at reservoir by Sawyer-
Brown Method.
Date
Pr,
psi
Pwf,
psi
(ΔP)² =
Pr²-
Pwf²
q,
MMscf/
D (ΔP)²/q
µg(at
Pr)
z(at
Pr)
ρ(at
Pr) Re(Pr) Ar
Dr
(E-5)
Sm
at re
ST at
re
1997/10 2003 1971 124978 5.06 24697 0.0141 0.8779 0.200
0.11024 538.6
188
51.8 51.97
1997/11 1999 1967 126271 5.86 21531 0.0141 0.8780 0.200
0.09875 538.4
188
60.2 60.31
1997/12 1995 1963 126553 6.21 20379 0.0141 0.8781 0.199
0.10439 538.1
188
57.1 57.20
1998/01 1990 1959 125893 6.14 20494 0.0141 0.8782 0.199
0.10310 537.8
188
57.4 57.52
1998/02 1987 1955 125382 6.09 20605 0.0141 0.8783 0.198
0.10198 537.6
188
57.8 57.88
1998/03 1983 1951 124005 5.65 21947 0.0141 0.8783 0.198
0.12213 537.3
188
46.1 46.27
1998/04 1978 1946 127012 7.32 17343 0.0141 0.8784 0.197
0.12657 537.0
188
47.0 47.14
1998/05 1973 1941 126040 7.11 17737 0.0141 0.8785 0.197
0.11848 536.7
188
50.0 50.11
1998/06 1967 1934 130133 9.38 13876 0.0141 0.8787 0.196
0.15601 536.3
188
39.5 39.63
1998/07 1960 1927 130494 9.91 13172 0.0141 0.8788 0.196
0.16436 535.9
188
37.6 37.78
1998/08 1955 1923 125746 7.97 15786 0.0140 0.8789 0.195
0.13186 535.5
188
44.7 44.87
1998/09 1948 1914 130918 10.80 12122 0.0140 0.8791 0.194
0.17831 535.1
189
34.8 35.00
1998/10 1946 1912 130800 10.83 12078 0.0140 0.8791 0.194
0.19206 534.9
189
31.8 32.06
1998/11 1933 1899 130345 11.35 11481 0.0140 0.8794 0.193
0.18634 534.1
189
33.1 33.33
1998/12 1926 1891 130464 11.82 11036 0.0140 0.8796 0.192
0.19344 533.7
189
32.0 32.18
1999/01 1918 1885 128236 11.18 11475 0.0140 0.8798 0.191
0.18232 533.2
189
33.1 33.34
1999/02 1912 1878 128128 11.52 11121 0.0140 0.8799 0.190
0.18746 532.8
189
32.2 32.39
1999/03 1905 1871 127134 11.43 11128 0.0139 0.8801 0.190
0.18537 532.4
190
32.2 32.42
1999/04 1899 1865 125195 10.86 11529 0.0139 0.8802 0.189
0.17575 532.0
190
33.3 33.47
1999/05 1893 1859 124783 11.04 11299 0.0139 0.8804 0.188
0.17828 531.6
190
32.6 32.84
1999/06 1887 1854 123659 10.84 11409 0.0139 0.8805 0.188
0.17455 531.3
190
32.9 33.12
1999/07 1881 1848 122243 10.50 11648 0.0139 0.8807 0.187
0.17423 530.9
190
32.3 32.46
1999/08 1875 1843 120809 10.15 11901 0.0139 0.8808 0.187
0.16270 530.6
190
34.2 34.40
1999/09 1870 1837 121069 10.61 11409 0.0139 0.8809 0.186
0.16969 530.3
190
32.9 33.07
1999/10 1864 1832 120178 10.54 11404 0.0139 0.8811 0.185
0.16809 529.9
190
32.8 33.03
1999/11 1858 1826 119737 10.68 11215 0.0139 0.8812 0.185
0.16990 529.6
191
32.3 32.50
1999/12 1852 1820 119495 10.91 10954 0.0138 0.8814 0.184
0.17314 529.3
191
31.6 31.79
2000/01 1846 1813 119634 11.36 10531 0.0138 0.8815 0.184
0.17982 528.9
191
30.4 30.65
2000/02 1840 1807 119425 11.63 10266 0.0138 0.8817 0.183
0.18366 528.6
191
29.7 29.92
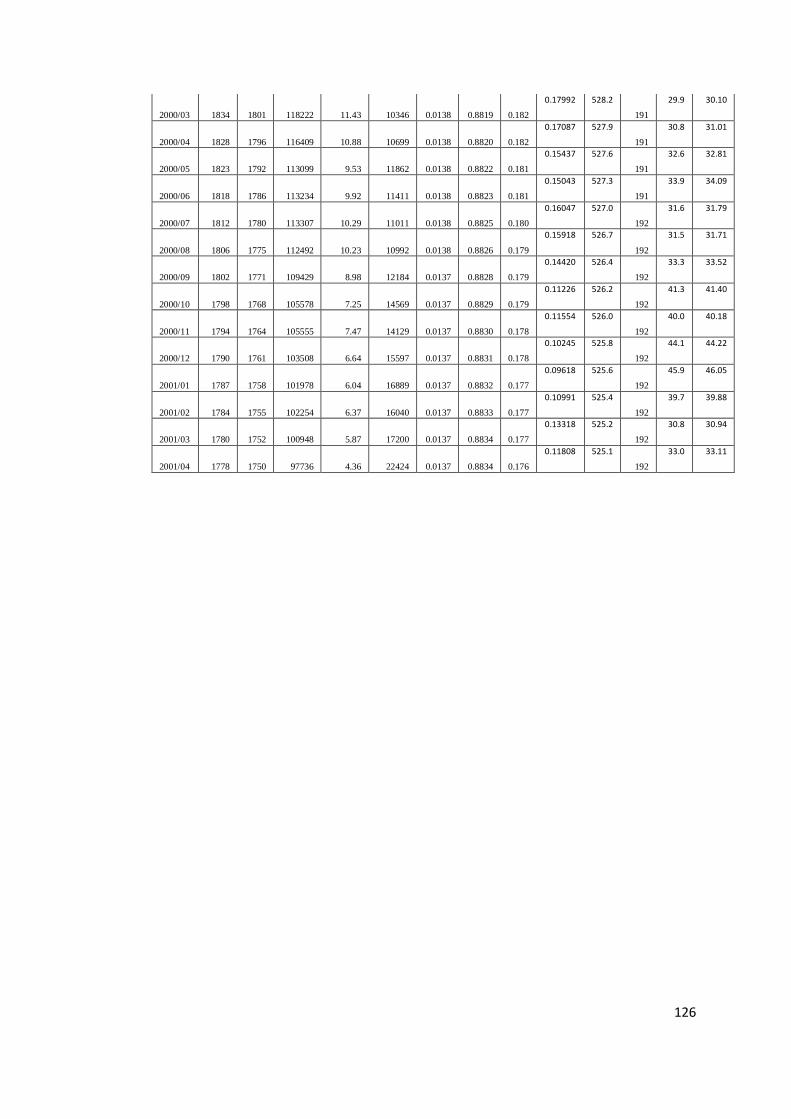
126
2000/03 1834 1801 118222 11.43 10346 0.0138 0.8819 0.182
0.17992 528.2
191
29.9 30.10
2000/04 1828 1796 116409 10.88 10699 0.0138 0.8820 0.182
0.17087 527.9
191
30.8 31.01
2000/05 1823 1792 113099 9.53 11862 0.0138 0.8822 0.181
0.15437 527.6
191
32.6 32.81
2000/06 1818 1786 113234 9.92 11411 0.0138 0.8823 0.181
0.15043 527.3
191
33.9 34.09
2000/07 1812 1780 113307 10.29 11011 0.0138 0.8825 0.180
0.16047 527.0
192
31.6 31.79
2000/08 1806 1775 112492 10.23 10992 0.0138 0.8826 0.179
0.15918 526.7
192
31.5 31.71
2000/09 1802 1771 109429 8.98 12184 0.0137 0.8828 0.179
0.14420 526.4
192
33.3 33.52
2000/10 1798 1768 105578 7.25 14569 0.0137 0.8829 0.179
0.11226 526.2
192
41.3 41.40
2000/11 1794 1764 105555 7.47 14129 0.0137 0.8830 0.178
0.11554 526.0
192
40.0 40.18
2000/12 1790 1761 103508 6.64 15597 0.0137 0.8831 0.178
0.10245 525.8
192
44.1 44.22
2001/01 1787 1758 101978 6.04 16889 0.0137 0.8832 0.177
0.09618 525.6
192
45.9 46.05
2001/02 1784 1755 102254 6.37 16040 0.0137 0.8833 0.177
0.10991 525.4
192
39.7 39.88
2001/03 1780 1752 100948 5.87 17200 0.0137 0.8834 0.177
0.13318 525.2
192
30.8 30.94
2001/04 1778 1750 97736 4.36 22424 0.0137 0.8834 0.176
0.11808 525.1
192
33.0 33.11

127
Table C.6: Results for pseudo steady state radial gas flow at bottom-hole by Sawyer-
Brown Method.
Date
Pr,
psi
Pwf,
psi
(ΔP)²=Pr²-
Pwf²
q,
MMscf/
D
(ΔP)²/
q
µg(at
Pwf)
z(at
Pwf)
ρ(at
Pwf) Re(Pwf) Awf
Dwf
(E-7)
Sm
at bh
ST at
bh
1997/10 2003 1971 124978 5.06 24697 0.01408 0.8786 0.197
2.85228 536.6
188
52.1 52.19
1997/11 1999 1967 126271 5.86 21531 0.01407 0.8787 0.196
2.55449 536.3
188
60.5 60.57
1997/12 1995 1963 126553 6.21 20379 0.01406 0.8788 0.196
2.70018 536.0
188
57.3 57.45
1998/01 1990 1959 125893 6.14 20494 0.01406 0.8789 0.195
2.66680 535.7
189
57.7 57.77
1998/02 1987 1955 125382 6.09 20605 0.01405 0.8789 0.195
2.63784 535.5
189
58.0 58.12
1998/03 1983 1951 124005 5.65 21947 0.01404 0.8790 0.195
3.15925 535.3
189
46.3 46.47
1998/04 1978 1946 127012 7.32 17343 0.01403 0.8791 0.194
3.27275 534.9
189
47.2 47.34
1998/05 1973 1941 126040 7.11 17737 0.01402 0.8792 0.194
3.06365 534.6
189
50.2 50.33
1998/06 1967 1934 130133 9.38 13876 0.01401 0.8794 0.193
4.03189 534.2
189
39.6 39.82
1998/07 1960 1927 130494 9.91 13172 0.01399 0.8796 0.192
4.24705 533.7
189
37.8 37.95
1998/08 1955 1923 125746 7.97 15786 0.01398 0.8797 0.192
3.40861 533.5
189
44.9 45.06
1998/09 1948 1914 130918 10.80 12122 0.01397 0.8799 0.191
4.60634 532.9
190
35.0 35.17
1998/10 1946 1912 130800 10.83 12078 0.01396 0.8799 0.190
4.96116 532.8
190
32.0 32.21
1998/11 1933 1899 130345 11.35 11481 0.01394 0.8802 0.189
4.81261 532.0
190
33.3 33.49
1998/12 1926 1891 130464 11.82 11036 0.01392 0.8804 0.188
4.99512 531.6
190
32.1 32.33
1999/01 1918 1885 128236 11.18 11475 0.01391 0.8806 0.188
4.70844 531.2
190
33.3 33.50
1999/02 1912 1878 128128 11.52 11121 0.01389 0.8807 0.187
4.84059 530.8
190
32.3 32.54
1999/03 1905 1871 127134 11.43 11128 0.01388 0.8809 0.186
4.78646 530.4
190
32.4 32.57
1999/04 1899 1865 125195 10.86 11529 0.01387 0.8811 0.186
4.53841 530.0
191
33.4 33.62
1999/05 1893 1859 124783 11.04 11299 0.01386 0.8812 0.185
4.60356 529.7
191
32.8 32.99
1999/06 1887 1854 123659 10.84 11409 0.01385 0.8814 0.184
4.50737 529.3
191
33.1 33.27
1999/07 1881 1848 122243 10.50 11648 0.01384 0.8815 0.184
4.49922 529.0
191
32.4 32.60
1999/08 1875 1843 120809 10.15 11901 0.01383 0.8816 0.183
4.20169 528.7
191
34.3 34.54
1999/09 1870 1837 121069 10.61 11409 0.01382 0.8818 0.183
4.38145 528.4
191
33.0 33.21
1999/10 1864 1832 120178 10.54 11404 0.01381 0.8819 0.182
4.34018 528.1
191
33.0 33.17
1999/11 1858 1826 119737 10.68 11215 0.01379 0.8821 0.181
4.38653 527.7
191
32.4 32.63
1999/12 1852 1820 119495 10.91 10954 0.01378 0.8823 0.181
4.46996 527.4
192
31.7 31.93
2000/01 1846 1813 119634 11.36 10531 0.01377 0.8824 0.180
4.64159 527.1
192
30.6 30.78
2000/02 1840 1807 119425 11.63 10266 0.01376 0.8826 0.180
4.74039 526.7
192
29.8 30.05

128
2000/03 1834 1801 118222 11.43 10346 0.01375 0.8828 0.179
4.64380 526.4
192
30.0 30.23
2000/04 1828 1796 116409 10.88 10699 0.01374 0.8829 0.178
4.41077 526.1
192
30.9 31.14
2000/05 1823 1792 113099 9.53 11862 0.01373 0.8830 0.178
3.98602 525.8
192
32.7 32.94
2000/06 1818 1786 113234 9.92 11411 0.01372 0.8832 0.177
3.88381 525.6
192
34.0 34.23
2000/07 1812 1780 113307 10.29 11011 0.01371 0.8834 0.177
4.14249 525.2
192
31.7 31.92
2000/08 1806 1775 112492 10.23 10992 0.01370 0.8835 0.176
4.10916 525.0
192
31.6 31.83
2000/09 1802 1771 109429 8.98 12184 0.01369 0.8836 0.176
3.72362 524.7
192
33.5 33.64
2000/10 1798 1768 105578 7.25 14569 0.01369 0.8837 0.175
2.90002 524.6
193
41.4 41.55
2000/11 1794 1764 105555 7.47 14129 0.01368 0.8838 0.175
2.98448 524.4
193
40.2 40.32
2000/12 1790 1761 103508 6.64 15597 0.01367 0.8839 0.175
2.64705 524.2
193
44.2 44.37
2001/01 1787 1758 101978 6.04 16889 0.01367 0.8840 0.174
2.48527 524.0
193
46.1 46.21
2001/02 1784 1755 102254 6.37 16040 0.01366 0.8841 0.174
2.83981 523.9
193
39.9 40.02
2001/03 1780 1752 100948 5.87 17200 0.01366 0.8842 0.174
3.44129 523.7
193
30.9 31.05
2001/04 1778 1750 97736 4.36 22424 0.01365 0.8842 0.174
3.05235 523.6
193
33.1 33.22

129
Curriculum Vitae
PERSONAL INFORMATION
Surname, Name: Alp, Ersen
Nationality: Republic of Turkey
Date and Place of Birth: 01.03.1953, Diyarbakir
Marital Status: Married
Phone: +90 312 426 32 62
Email: [email protected]
EDUCATION
Degree Institution Year of Graduation
MS University of Southern California 1983
Petroleum Engineering
BS Istanbul Technical University 1980
Petroleum and Natural Gas Engineering
High School Diyarbakir Lisesi 1972
WORK EXPERIENCE
Year Place Enrolment
1997 - Present Fernas Construction Co. Inc. Project Manager
1993 – 1997 Done Construction Co. Construction Manager
1992 – 1993 Aladin Middle East Oil Co. Drilling Engineer
1989 – 1992 C & G Testing Co. Testing Engineer
1987 – 1989 Oklahoma Univ. Petroleum Eng. Teach. & Research Assist.
1983 – 1987 Turkish Petroleum Inc. Research Engineer
FOREIGN LANGUAGES
Fluent English, Fluent Russian

130
PUBLICATIONS
Chilingarian G.V., Alp E., Caenn R, Al Salem M., Uslu S., Gonzales S., Dorovi R.J.,
Mathur R.M., Yen T.F. “Drilling Fluid Evaluation Using Yield Point - Plastic Viscosity
Correlation”, Energy Sources, Volume 8, Issue 2-3, (1986).
HOBBIES
Music, Languages, Aviation, Navigation