predicting trigger level for ice jam flooding of...
TRANSCRIPT
In: Cockburn, J.M.H. and Garver, J.I., Proceedings of the 2011 Mohawk Watershed Symposium, 13 Union College, Schenectady, NY, March 18, 2011
PREDICTING TRIGGER LEVEL FOR ICE JAM FLOODING OF THE LOWER MOHAWK RIVER USING LIDAR AND GIS
Foster, J.A.1, Marsellos, A.E.1, Garver, J.I.2
1Dept. of Geological Sciences, University of Florida, Gainesville , FL 32611 U.S.A. 2Dept. of Geology, Union College, Schenectady, NY 12308 U.S.A.
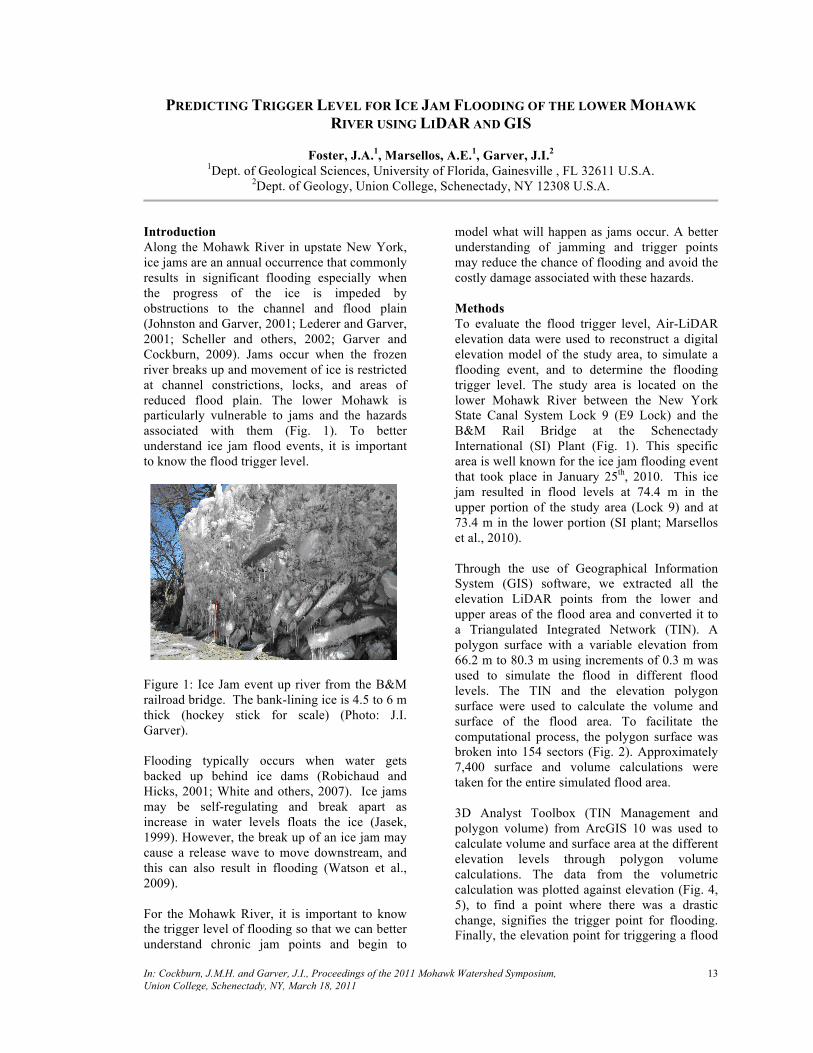
Introduction Along the Mohawk River in upstate New York, ice jams are an annual occurrence that commonly results in significant flooding especially when the progress of the ice is impeded by obstructions to the channel and flood plain (Johnston and Garver, 2001; Lederer and Garver, 2001; Scheller and others, 2002; Garver and Cockburn, 2009). Jams occur when the frozen river breaks up and movement of ice is restricted at channel constrictions, locks, and areas of reduced flood plain. The lower Mohawk is particularly vulnerable to jams and the hazards associated with them (Fig. 1). To better understand ice jam flood events, it is important to know the flood trigger level.
Figure 1: Ice Jam event up river from the B&M railroad bridge. The bank-lining ice is 4.5 to 6 m thick (hockey stick for scale) (Photo: J.I. Garver). Flooding typically occurs when water gets backed up behind ice dams (Robichaud and Hicks, 2001; White and others, 2007). Ice jams may be self-regulating and break apart as increase in water levels floats the ice (Jasek, 1999). However, the break up of an ice jam may cause a release wave to move downstream, and this can also result in flooding (Watson et al., 2009). For the Mohawk River, it is important to know the trigger level of flooding so that we can better understand chronic jam points and begin to
model what will happen as jams occur. A better understanding of jamming and trigger points may reduce the chance of flooding and avoid the costly damage associated with these hazards. Methods To evaluate the flood trigger level, Air-LiDAR elevation data were used to reconstruct a digital elevation model of the study area, to simulate a flooding event, and to determine the flooding trigger level. The study area is located on the lower Mohawk River between the New York State Canal System Lock 9 (E9 Lock) and the B&M Rail Bridge at the Schenectady International (SI) Plant (Fig. 1). This specific area is well known for the ice jam flooding event that took place in January 25th, 2010. This ice jam resulted in flood levels at 74.4 m in the upper portion of the study area (Lock 9) and at 73.4 m in the lower portion (SI plant; Marsellos et al., 2010). Through the use of Geographical Information System (GIS) software, we extracted all the elevation LiDAR points from the lower and upper areas of the flood area and converted it to a Triangulated Integrated Network (TIN). A polygon surface with a variable elevation from 66.2 m to 80.3 m using increments of 0.3 m was used to simulate the flood in different flood levels. The TIN and the elevation polygon surface were used to calculate the volume and surface of the flood area. To facilitate the computational process, the polygon surface was broken into 154 sectors (Fig. 2). Approximately 7,400 surface and volume calculations were taken for the entire simulated flood area. 3D Analyst Toolbox (TIN Management and polygon volume) from ArcGIS 10 was used to calculate volume and surface area at the different elevation levels through polygon volume calculations. The data from the volumetric calculation was plotted against elevation (Fig. 4, 5), to find a point where there was a drastic change, signifies the trigger point for flooding. Finally, the elevation point for triggering a flood
In: Cockburn, J.M.H. and Garver, J.I., Proceedings of the 2011 Mohawk Watershed Symposium, 14 Union College, Schenectady, NY, March 18, 2011
was confirmed by draping a polygon with an elevation equal to the trigger level over the TIN.
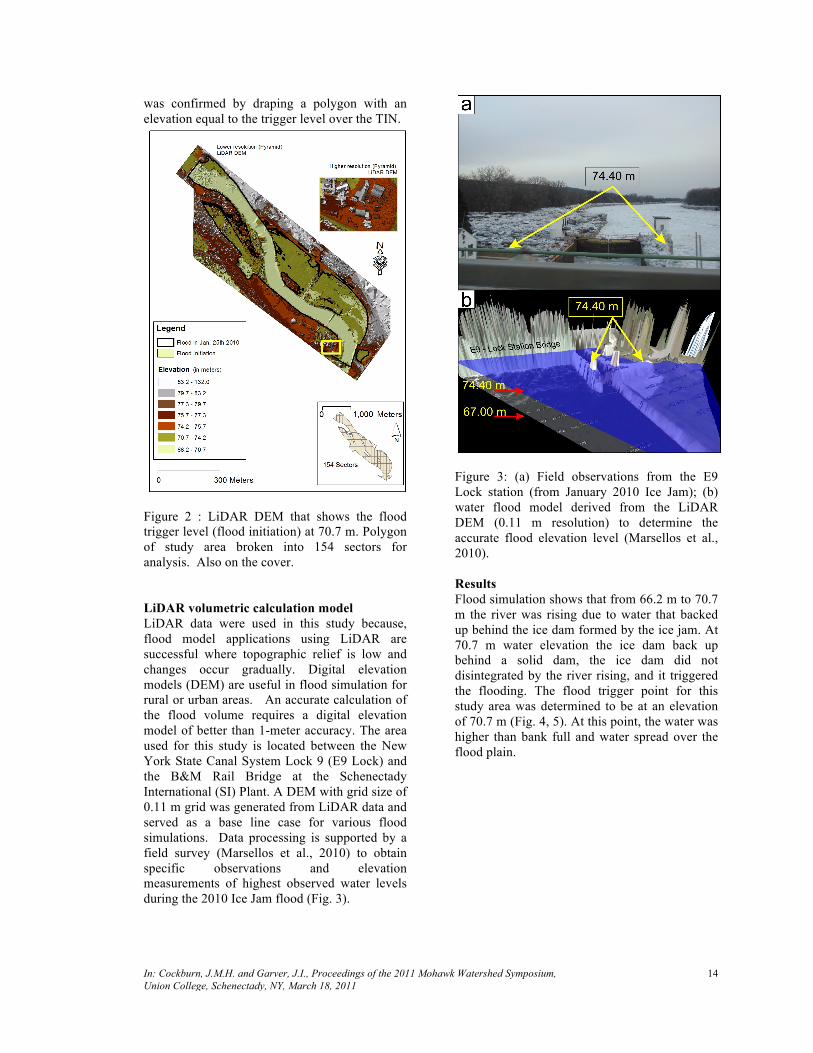
Figure 2 : LiDAR DEM that shows the flood trigger level (flood initiation) at 70.7 m. Polygon of study area broken into 154 sectors for analysis. Also on the cover. LiDAR volumetric calculation model LiDAR data were used in this study because, flood model applications using LiDAR are successful where topographic relief is low and changes occur gradually. Digital elevation models (DEM) are useful in flood simulation for rural or urban areas. An accurate calculation of the flood volume requires a digital elevation model of better than 1-meter accuracy. The area used for this study is located between the New York State Canal System Lock 9 (E9 Lock) and the B&M Rail Bridge at the Schenectady International (SI) Plant. A DEM with grid size of 0.11 m grid was generated from LiDAR data and served as a base line case for various flood simulations. Data processing is supported by a field survey (Marsellos et al., 2010) to obtain specific observations and elevation measurements of highest observed water levels during the 2010 Ice Jam flood (Fig. 3).
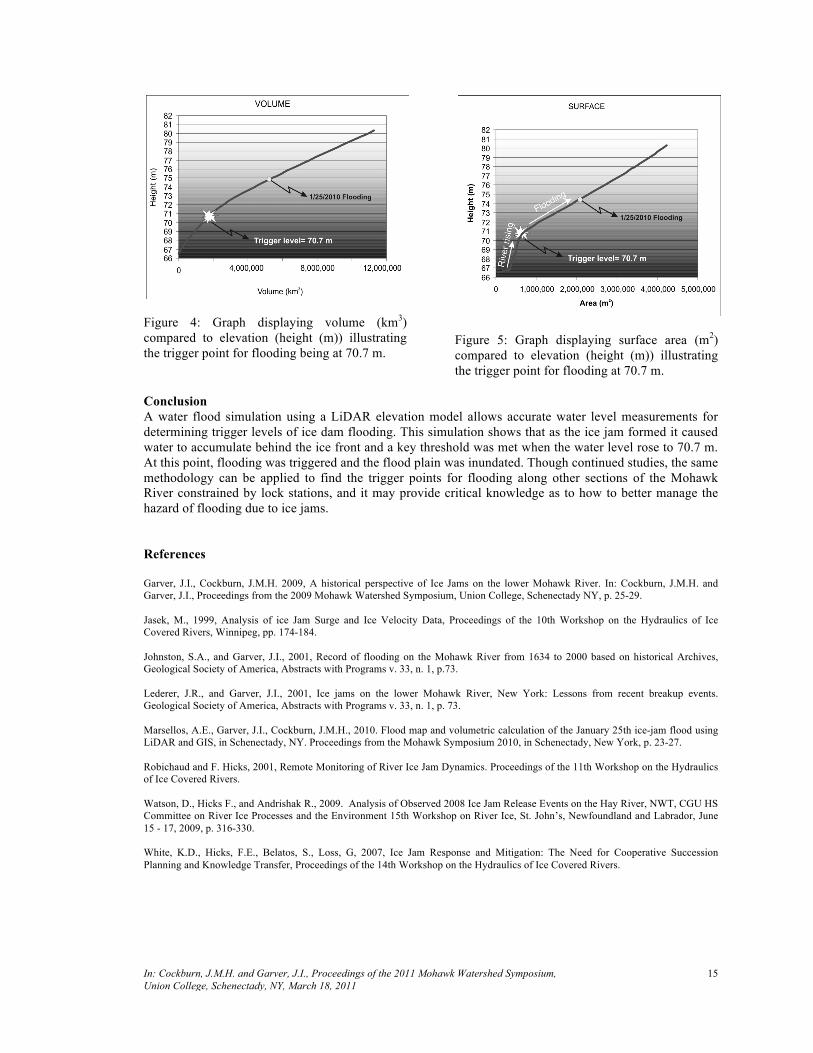
Figure 3: (a) Field observations from the E9 Lock station (from January 2010 Ice Jam); (b) water flood model derived from the LiDAR DEM (0.11 m resolution) to determine the accurate flood elevation level (Marsellos et al., 2010). Results Flood simulation shows that from 66.2 m to 70.7 m the river was rising due to water that backed up behind the ice dam formed by the ice jam. At 70.7 m water elevation the ice dam back up behind a solid dam, the ice dam did not disintegrated by the river rising, and it triggered the flooding. The flood trigger point for this study area was determined to be at an elevation of 70.7 m (Fig. 4, 5). At this point, the water was higher than bank full and water spread over the flood plain.
In: Cockburn, J.M.H. and Garver, J.I., Proceedings of the 2011 Mohawk Watershed Symposium, 15 Union College, Schenectady, NY, March 18, 2011
Figure 4: Graph displaying volume (km3) compared to elevation (height (m)) illustrating the trigger point for flooding being at 70.7 m.
Figure 5: Graph displaying surface area (m2) compared to elevation (height (m)) illustrating the trigger point for flooding at 70.7 m.
Conclusion A water flood simulation using a LiDAR elevation model allows accurate water level measurements for determining trigger levels of ice dam flooding. This simulation shows that as the ice jam formed it caused water to accumulate behind the ice front and a key threshold was met when the water level rose to 70.7 m. At this point, flooding was triggered and the flood plain was inundated. Though continued studies, the same methodology can be applied to find the trigger points for flooding along other sections of the Mohawk River constrained by lock stations, and it may provide critical knowledge as to how to better manage the hazard of flooding due to ice jams. References Garver, J.I., Cockburn, J.M.H. 2009, A historical perspective of Ice Jams on the lower Mohawk River. In: Cockburn, J.M.H. and Garver, J.I., Proceedings from the 2009 Mohawk Watershed Symposium, Union College, Schenectady NY, p. 25-29. Jasek, M., 1999, Analysis of ice Jam Surge and Ice Velocity Data, Proceedings of the 10th Workshop on the Hydraulics of Ice Covered Rivers, Winnipeg, pp. 174-184. Johnston, S.A., and Garver, J.I., 2001, Record of flooding on the Mohawk River from 1634 to 2000 based on historical Archives, Geological Society of America, Abstracts with Programs v. 33, n. 1, p.73. Lederer, J.R., and Garver, J.I., 2001, Ice jams on the lower Mohawk River, New York: Lessons from recent breakup events. Geological Society of America, Abstracts with Programs v. 33, n. 1, p. 73. Marsellos, A.E., Garver, J.I., Cockburn, J.M.H., 2010. Flood map and volumetric calculation of the January 25th ice-jam flood using LiDAR and GIS, in Schenectady, NY. Proceedings from the Mohawk Symposium 2010, in Schenectady, New York, p. 23-27. Robichaud and F. Hicks, 2001, Remote Monitoring of River Ice Jam Dynamics. Proceedings of the 11th Workshop on the Hydraulics of Ice Covered Rivers. Watson, D., Hicks F., and Andrishak R., 2009. Analysis of Observed 2008 Ice Jam Release Events on the Hay River, NWT, CGU HS Committee on River Ice Processes and the Environment 15th Workshop on River Ice, St. John’s, Newfoundland and Labrador, June 15 - 17, 2009, p. 316-330. White, K.D., Hicks, F.E., Belatos, S., Loss, G, 2007, Ice Jam Response and Mitigation: The Need for Cooperative Succession Planning and Knowledge Transfer, Proceedings of the 14th Workshop on the Hydraulics of Ice Covered Rivers.