predicting hearing aid microphonepreference in everyday ... · ole dyrlund † abstract seventeen...
TRANSCRIPT

365
*Army Audiology and Speech Center, Walter Reed Army Medical Center; †GN ReSound, Taastrup, Denmark
Reprint requests: Brian E. Walden, Ph.D., Army Audiology and Speech Center, Walter Reed Army Medical Center, 6900 GeorgiaAvenue, NW, Washington, DC 20307-5001; Phone: 202-782-8601; Fax: 202-782-9228; E-mail: [email protected]
Parts of the work reported here were presented at the 2003 annual convention of the American Academy of Audiology, April2003, San Antonio, TX.
This work was sponsored by GN ReSound, Taastrup, Denmark, through a Cooperative Research and Development Agreementwith the Clinical Investigation Regulatory Office, United States Army Medical Department, Ft. Sam Houston, TX.
Predicting Hearing Aid MicrophonePreference in Everyday Listening
Brian E. Walden*Rauna K. Surr*Mary T. Cord*Ole Dyrlund†
Abstract
Seventeen hearing-impaired adults were fit with omnidirectional/directionalhearing aids, which they wore during a four-week trial. For each listening sit-uation encountered in daily living during a total of seven days, participantsselected the preferred microphone mode and described the listening situationin terms of five environmental variables, using a paper and pencil form. Resultsindicated that hearing-impaired adults typically spend the majority of theiractive listening time in situations with background noise present and sur-rounding the listener, and the signal source located in front and relatively near.Microphone preferences were fairly evenly distributed across listening situa-tions but differed depending on the characteristics of the listening environment.The omnidirectional mode tended to be preferred in relatively quiet listeningsituations or, in the presence of background noise, when the signal sourcewas relatively far away. The directional mode tended to be preferred whenbackground noise was present and the signal source was located in front ofand relatively near the listener. Results suggest that knowing only signal loca-tion and distance and whether background noise is present or absent,omnidirectional/directional hearing aids can be set in the preferred mode inmost everyday listening situations. These findings have relevance for coun-seling patients when to set manually switchable omnidirectional/directionalhearing aids in each microphone mode, as well as for the development of auto-matic algorithms for selecting omnidirectional versus directional microphoneprocessing.
Key Words: Directional microphones, everyday listening situations, hearingaids
Abbreviations: AASC = Army Audiology and Speech Center; BN = back-ground noise; BTE = behind the ear; DA = directional advantage; DIR =directional; DFS = digital feedback suppression; HAUL = Hearing Aid Use Log;HINT = Hearing in Noise Test; ITE = in the ear; OMNI = omnidirectional; PLS= prototype listening situation; RTS = reception threshold for sentences; SNR= signal-to-noise ratio; WDRC = wide dynamic range compression
J Am Acad Audiol 15:365–396 (2004)

Studies conducted in audiometric testsuites have shown significantimprovement in aided speech
recognition in noise with directionalmicrophones in comparison to omnidirectionalmicrophones (Valente et al, 1995; Rickettsand Dahr, 1999). This difference between thetwo microphone modes is referred to as thedirectional benefit or advantage. Althoughbenefit from directional microphones has beendocumented in everyday listening as well(Killion et al, 1998; Preves et al, 1999; Kochkin,2000), some studies suggest that directionaladvantages comparable to those observed incontrolled clinical test environments are notobserved in listening environments typicallyencountered in daily living (Nielsen andLudvigsen, 1978; Valente et al, 1995). Thisdiscrepancy between test booth and field datamay be because test booth measures tend to
overestimate the directional advantage thatwill actually be obtained in everyday listening(Amlani, 2001). The specific test conditionstypically used in the test booth involve thesignal being presented from the front and thenoise from the sides and/or back of the listener.Such conditions should favor directionalmicrophones. Laboratory studies have shownthat directional benefit is influenced by theamount of spatial separation between signaland noise sources, the distance between thesignal source and the listener, and the amountof reverberation introduced (Leeuw andDreschler, 1991; Ricketts, 2000). As theenvironmental conditions encountered ineveryday listening deviate from relativelyideal laboratory conditions, the directionaladvantage is diminished (Studebaker et al,1980; Madison and Hawkins, 1983; Hawkinsand Yacullo, 1984).
366
Journal of the American Academy of Audiology/Volume 15, Number 5, 2004
SumarioSe adaptaron auxiliares auditivos direccionales/omnidireccionales a diecisieteadultos hipoacúsicos, quienes los utilizaron durante un período de cuatrosemanas. Para cada situación auditiva en la vida diaria durante un total desiete días, los participantes seleccionaron la escogencia preferida de micrófonoy describieron tal situacion auditiva en términos de variables ambientales,utilizando una fórmula para llenar con lápiz. Los resultados indicaron que losadultos hipoacúsicos pasaron la mayor parte de su tiempo activo de audiciónen situaciones con ruido de fondo presente y rodeando el sujeto, y con la fuentede estímulo ubicada al frente y relativamente cerca. Las preferencias demicrófono se distribuyeron uniformemente en todas las situaciones auditivas,pero difirieron dependiendo de las características de los ambientes de escucha.Se prefirió el modo omnidireccional en situaciones auditivas de relativa quietudo en presencia de ruido de fondo, cuando la fuente de estímulo estabarelativamente lejana. Se prefirió el modo direccional cuando había ruido defondo presente y la fuente de estímulo se localizaba al frente y relativamentecerca del sujeto. Los resultados sugieren que conociendo solamente lalocalización y la distancia de la señal, y si existe o no ruido de fondo presente,se pueden programar los micrófonos omnidireccionales/direccionales en el modopreferido, para la mayor cantidad de situaciones auditivas cotidianas. Estoshallazgos tienen relevancia para aconsejar a los pacientes usando auxiliaresauditivos omnidireccionales/direccionales con interruptores manuales, sobrecuándo activar cada modalidad de micrófono, al igual que para el desarrollode algoritmos automáticos que seleccionen el procesamiento del micrófonoomnidireccional versus el direccional.
Palabras Clave: Micrófonos direccionales, situaciones auditivas cotidianas,auxiliares auditivos
Abreviaturas: AASC = Centro de Audición y Lenguaje del Ejército; BN = ruidode fondo; BTE = retroauricular; DA = ventaja direccional; DIR = direccional; DFS= supresión digital de la retroalimentación; HAUl = bitácora de uso del auxiliarauditivo; HINT = Prueba de audición en ruido; ITE = intraauricular; OMNI =omnidireccional; PLS = situación auditiva prototipo; RTS = Umbral de recepciónde frases; SNR = tasa de relación señal/ruido; WDRC = compresión de rangodinámico amplio

Walden et al (2000) conducted a clinicaltrial of a digital hearing aid with theomnidirectional/directional option thatillustrated the disparity between test boothand field data. Test booth speech recognitionscores in noise showed highly significantdirectional advantages, but subjective ratingsin daily use showed minimal directionalbenefit. Walden et al suggested a number ofpossible explanations for the discrepancybetween directional microphone benefitobserved in an audiometric suite and ineveryday use, including the likelihood thatmost real-life listening situations may notclosely match the acoustics of the test booth.
Although a variety of factors may contributeto a directional advantage, it appears that thebenefit obtained from either microphone typeis particularly dependent on the physicalcharacteristics of the listening environment.From this perspective, only when a specific setof environmental conditions exists in everydaylistening will one or the other microphone modeprovide superior performance.
Two recent studies (Cord et al, 2002; Surret al, 2002) were designed to explore issuessurrounding the use of dual-microphone hearingaids in everyday listening. Cord et al exploredthe benefits of directional microphonetechnology in real-world situations experiencedby successful users of switchableomnidirectional/directional hearing aids.Telephone interviews and paper-and-pencilquestionnaires were used to assess perceivedperformance with each microphone mode. Theresults suggested that the benefit of directionalmicrophones in everyday listening is highlydependent on the specific characteristics of thelistening situations encountered. Participantsperceived that the directional microphone modewas superior to the omnidirectional microphonemode with background noise present; the signalsource located in front of the listener andspatially separated from the source of thebackground noise; low reverberation; and thetalker close to the listener. In Surr et al, 11experienced hearing aid users were fit withdigital hearing aids featuring switchableomnidirectional and adaptive-directional modes.For six weeks, their task was to identify anddescribe at least one listening situation each dayin which one microphone mode performed betterthan the other using a checklist daily journalformat. Although all participants reporteddifficulty in identifying situations where theyperceived a difference between the two
microphone modes, descriptions favoring thedirectional mode outnumbered those for theomnidirectional mode. The results indicatedthat location of the primary talker, presence orabsence and type of background noise, andtype of space in which the communicationoccurred influenced microphone preference.
Taken together, the Cord et al (2002) andSurr et al (2002) studies suggest that thefollowing characteristics of a listeningenvironment serve as major determinants insuccess with either omnidirectional ordirectional hearing aid microphones: (a)presence/absence of background noise, (b)location of the signal source, (c) distance of thelistener from the signal source, (d) amount ofreverberation present, and (e) location of thenoise source in relation to the signal source.Neither study definitively determined howoften participants could tell a difference betweenthe microphone modes in everyday listeningsituations, or how frequently specific situationsfavoring one mode or the other wereencountered. However, results from Cord et alsuggested that situations favoring theomnidirectional mode might occur significantlymore frequently in everyday life than situationsfavoring the directional mode.
The study reported here was intended todetermine the extent to which the preferencesof hearing-impaired patients for theomnidirectional versus the directional modein everyday listening situations could bepredicted from the characteristics of thelistening environments. Participants wereasked to describe the listening environmentsthat they encountered in everyday living, andto give a microphone preference for eachlistening situation encountered. In addition,participants described how long they were ineach listening situation and whether theyconsidered it to be easy or difficult. Thefollowing questions were addressed:
1. What are the characteristics of everyday listening situations typically encountered by hearing-impaired adults?
2. How often in everyday living are listening situations encountered in which there is a distinct preference for the omnidirectional mode or for the directional mode?
3. To what extent can microphone preferences be predicted from the characteristics of the listening environment?
Microphone Preference/Walden et al
367

METHOD
The Model
These questions require that everydaylistening situations be characterized in a waythat permits description and analysis. Clearly,listening situations encountered in daily livingcan vary in virtually an infinite variety ofways. The model depicted in Figure 1 wasused to categorize everyday listeningenvironments according to binaryrepresentations of five acoustic (i.e., signaland noise) characteristics (left column),resulting in 24 unique categories or “prototypelistening situations” (PLS).The order in whichthe five variables are represented in the model(from top to bottom) is relatively arbitrary.The model takes the input signal (e.g., a talkerlocated in the environment) and successivelyadds binary variables, resulting in row 1(background noise) having two conditions, row2 (signal location) having four conditions, row3 (signal distance) having eight conditions,and row 4 (reverberation) having 16 conditions.Row 5 (noise location) has only 16 conditions,as well, because there is no noise locationwhen background noise is absent from the
environment.The resulting 24 “paths” from thetop to the bottom of the model describe 24different general types of listening situations(i.e., 24 different combinations of the fiveenvironmental variables).Although it may beargued that no two listening situationsencountered in everyday living are exactlyalike, for the purposes of this study it isassumed that the range of everyday listeningsituations encountered by hearing-impairedadults is meaningfully categorized into these24 PLS.The numbers in parentheses in Figure1 will be discussed later.
Based on earlier behavioral studies(Walden et al, 2000; Cord et al, 2002; Surr etal, 2002), the five environmental variablesincluded in the model appeared to influencemicrophone performance in everyday listeningsituations. This view is consistent with thepurpose and operation of directionalmicrophones (see, for example, Ricketts, 2001).Other things being equal, the directional modeshould be preferred when background noiseis present, and the omnidirectional modeshould be preferred in quiet, or at least thereshould not be a strong preference for thedirectional mode in quiet. Similarly, thedirectional mode should be preferred when thesignal source is located in front of the listener,
Journal of the American Academy of Audiology/Volume 15, Number 5, 2004
368
Listening Environment(1599)
Present(1006)
Absent(593)
Front(758)
Other(239)
1 2 3 4 5 6 7 8 9 10 11 12 13 14 15 16 17 18 19 20 21 22 23 24}
Front(510)
Other(79)
Background Noise:
Signal Location:
Signal Distance: Near(657)
Near(170)
Near(421)
Near(55)
Far(97)
Far(66)
Far(83)
Far(24)
(346)Low(44)
Low(128)
Low(46)(311)
High(53)
High(42)
High(20)
Low(201)
High(220)
Low(19)
High(64)
Low(39)
High(16)
Low(11)
High(13)
Oth(301)
Noise Location:* Oth(275)
Oth(44)
Frnt(45)
Frnt(36)
Oth(43)
Oth(122)
Frnt(0)
Frnt(10)
Oth(39)
Oth(44)
Frnt(6)
Frnt(3)
Oth(20)
Frnt(2)
Frnt(0)
PrototypeListeningSituation
*Oth=Noise from back, sides, diffuseFrnt=Noise from in front of listener
Figure 1. Model defining 24 prototype listening situations based on binary representations of five environmentalvariables. The numbers in parentheses are discussed later.
HighReverberation:
Low

when the signal source is located near to thelistener, when reverberation is low, and whenthe noise source is located other than in frontof the listener. Conversely, the omnidirectionalmode should be preferred (or there shouldnot be a strong preference for the directionalmode) when the signal source is located otherthan in front of the listener, when the signalsource is located far from the listener, whenreverberation is high, and when the noisesource is located in front of the listener.
Although these predictions may apply “otherthings being equal” (i.e., in a theoretical sense),the influence of each of these environmentalvariables does not occur in isolation from theinfluences of each of the other variables. Rather,they coexist with each other to define theacoustic environment. Consequently, even if theassumed influence described above is correctfor each environmental variable consideredindependently, it is not immediately apparentwhich of the two microphone modes will bepreferred in a listening situation where theassumptions lead to contradictory predictions.Thus, for example, it is not self-evident whichmicrophone mode would be preferred in alistening situation with background noise present(predicts directional mode) and the signal at adistance (predicts omnidirectional mode). Forsuch listening situations, the preferredmicrophone mode must be determinedempirically. The primary purpose of this studyis to describe microphone preferences
(omnidirectional, directional, no difference) foreach of the 24 PLS in order to determine if suchpreferences can be predicted from the acousticcharacteristics of the listening environment.
Participants
Participants were 17 adults with impairedhearing who were fit with switchableomnidirectional/directional hearing aids at theArmy Audiology and Speech Center (AASC)at least three months and not more than 72months preceding enrollment. Although noparticipant was excluded on the basis of gender,16 of the participants were male, reflecting thedemographics of the AASC’s hearing-impairedpopulation. Their mean age was 70.8 years(SD = 9.6; range = 47–81). The mean years ofhearing aid use prior to enrollment was 13.6years (SD = 9.1; range = 2–33).
Participants had bilateral, symmetricsensorineural hearing impairments that fellwithin the fitting guidelines of the hearing aidused in the study. Sensorineural hearing loss(cochlear site of lesion) was verified by differencesbetween air- and bone-conduction thresholdsof 10 dB or less, by normal tympanograms (TypeA; Jerger classification, 1970), and by thepresence of ipsilateral acoustic reflexes for a1000 Hz tone. Unaided monosyllabic word-recognition ability in quiet (NU-6) was 50% orbetter in each ear at a comfortable listeninglevel. The mean audiogram for the 17
Microphone Preference/Walden et al
369
0
20
40
60
80
1000.1 1 10
Frequency (kHz)
Thr
esho
ld (
dB H
L)
RightLeft
Figure 2. Mean audiometric data for the 17 participants. The error bars indicate one standard deviation.

participants is shown in Figure 2. On average,participants had moderate-to-severe, graduallysloping, bilaterally symmetrical, sensorineuralhearing loss. Mean word-recognition ability(NU-6) in quiet at a comfortable listening levelwas 81.1% (SD: 10.9; range: 64–96) for the rightears and 76.1% (SD: 14.5; range: 52–100) for theleft ears.
Participants had to be successful users ofswitchable omnidirectional/directional hearingaids at the time of enrollment. Specifically,they had to report using their own hearingaids at least four hours per day and eachmicrophone mode (omnidirectional,directional) a minimum of 10% of the time.Further, they had to affirm that the directionalmicrophone option had been a useful featureof their hearing aid. Potential participantswere screened with a test of speech recognitionin noise while wearing the behind-the-earversion of the GN ReSound Canta7 to makesure that they obtained a directionaladvantage. This testing is described in moredetail below.
Hearing Aids and Fitting Procedures
All participants were fitted with binauralGN ReSound Canta750D in-the-earinstruments using the Audiogram+ fittingalgorithm of Aventa 1.2 software. The Canta7
is an open-platform digital, multiband,multimemory hearing aid with variable widedynamic range compression (WDRC). Thesyllabic compression threshold is 40 to 48 dBSPL, and the compression ratio ranges from1:1 to 3:1 (program dependent in eachchannel). The attack time is specified as 4msec and release time as 80 msec. Theinstrument has no user-operated volumecontrol. Directionality is achievedelectronically via a two-microphone systemand features an adaptive polar pattern option,as well as several fixed pattern choices. Theadaptive option was used throughout thisstudy. The first two memories wereprogrammed with the manufacturer’s “basicprogram” using the participant’s hearingthreshold data. The standard omnidirectionalmicrophone mode was programmed into oneof these two memories, and the directionalmode was programmed into the other. Thesetwo programs will be hereafter designatedas OMNI (omnidirectional) and DIR(directional). A push button on the faceplateof the instrument allowed the wearer to switchbetween programs. An appropriate number ofaudible tones informed the user whetherprogram #1 or program #2 had been activated.
The frequency responses of the OMNIand the DIR were equalized (using the MaxBass Boost option in the fitting software) to
Journal of the American Academy of Audiology/Volume 15, Number 5, 2004
370
0
10
20
30
40
0.1 1 10
Frequency (kHz)
Gai
n (d
B)
Figure 3. Mean 2-cc coupler gain of the test instrument averaged for the right and left ear fittings. The meas-urements were made in the omnidirectional mode using three input levels: 50 dB SPL (the top curve), 65 dBSPL (one of the middle curves), and 80 dB SPL (bottom curve). In addition, the measurements were made indirectional mode with a 65 dB SPL input signal. The results intertwine with the corresponding omnidirectionalline. Further, the DSL[i/o] target user-gain levels are shown by the symbols without a connecting line (see textfor further explanation).

minimize the effect of the low-frequency roll-off typically associated with directionalmicrophones. The digital feedback suppression(DFS) feature was activated for severalparticipants as needed. Despite severe high-frequency hearing loss for many participants,prescribed high-frequency gain did not haveto be reduced for anyone due to feedbackproblems. A digital noise reduction option,also available in these instruments, was notused in this study.
Two opportunities were available to makechanges in the prescribed fitting parametersin response to the participant’s subjectiveevaluation, at the time of the fitting and,again, after one-week use of the hearing aids.Manufacturer’s guidelines for fine-tuning wereemployed. Changes to the prescribed fittingparameters were minor, if any, and relativelysymmetric for the right and left fittings.Program adjustments were made while theparticipant listened in the OMNI mode, andthey were extended to the DIR mode.
The hearing aids were tested in a Fonix6500 test box with the front microphoneopening closest to the reference circle. Themean frequency responses for the final fittings,averaged for the right and left hearing aids,for three input levels of speech-weighted noise(50, 65, and 80 dB SPL) are shown in Figure3. These 2-cc coupler measurements weremade in the OMNI mode and show thecharacteristic decrease in gain with increasinginput level of WDRC circuits. Thismeasurement was also obtained in the DIRmode with the 65 dB SPL input level (one ofthe middle lines overlapping the responsecurve for the corresponding curve for theOMNI mode) to examine the conformity ofthe frequency responses between the OMNIand the DIR, and thus to assure that thefrequency-gain characteristics of the twoprograms were similar. The symbols withoutconnecting lines show user gain for 65 dBinput that were calculated using the DesiredSensation Levels (DSL[i/o] version 4.0) for theaverage audiogram of the participants for anITE (in-the-ear) instrument with WDRC circuitand variable compression ratios.
Overview of Study Design
This study investigated microphone modepreferences in a manually switchableomnidirectional/directional digital hearing
aid. The two microphone modes werecompared in a variety of everyday listeningsituations encountered by the participantsover a four-week period, using a paper andpencil log form that was completed by theparticipant. Eight of the participants, selectedat random, wore the device programmed withthe OMNI mode in memory 1 and the DIRmode in memory 2, whereas the remainingnine participants wore the test hearing aidwith DIR programmed into memory 1 andOMNI programmed into memory 2. Thesewere referred to as “program #1” and “program#2” to the participants. They were told thatthese programs processed sound differently,similar to the two programs in their ownhearing aids. However, they were not givenany details regarding the type of signalprocessing provided by either program.
Participation in the study involved two“pre-trial” periods of two weeks and one week,respectively, followed by a four-week trialduring which the study field data wereobtained. Progress during the four-week trialwas monitored by weekly phone calls by oneof the investigators. Specifically, theparticipant was questioned regardingadherence to the daily schedule of completinglog forms, number of daily entries, details ofentries, and any unforeseen problems thatmay have been encountered as a result ofparticipating in the study.
Schedule of Participation
Participation in this study took sevenweeks to complete and required four clinicvisits. The schedule of events for these foursessions was as follows:
Session 1. Routine tests of hearing,including pure-tone audiometry,tympanometry, acoustic reflexes, andmonosyllabic word recognition in quiet wereadministered to determine if prospectiveparticipants met the audiometric selectioncriteria for inclusion in the study. Next, theBTE (behind-the-ear) version of the Canta7(Canta770D) was temporarily fit to each earusing foam earplugs without venting, and theHearing In Noise Test (HINT; Nilsson et al,1994) was administered for theomnidirectional and directional modes.Participants had to obtain a directionaladvantage of at least 1.5 dB (95% confidenceinterval; Nilsson et al, 1994) to be enrolled inthe study. The HINT test procedures will be
Microphone Preference/Walden et al
371
discussed later in this paper. If a directionaladvantage ≥1.5 dB was obtained, an earmoldimpression was made of each ear. Finally,participants were given ten blank log forms,instructed how to fill them out, and givenpractice with the help of one of theinvestigators in filling out the form in twolistening environments, a large hospital lobbyand a small conference room. Participantswere instructed to fill out ten of these logsduring the next two weeks while wearingtheir own hearing aids, switching regularlybetween the two programs (OMNI and DIR)when new listening situations wereencountered.
Session 2 (approximately two weeksfollowing Session 1). One of the investigatorsreviewed the ten log forms that theparticipants had completed during the priortwo weeks to make sure that they were fillingthem out correctly. The ITE test instrumentwas custom fit to each ear, and the participantswere familiarized with the operation of thesedevices. Participants were given another tenblank log forms and instructed to fill them outduring the next week while they were wearingthe test instruments.
Session 3 (approximately one weekfollowing Session 2). Participants were askedto report on how they were doing with the testhearing aids. Log forms from the previousweek were reviewed to make sure that theywere completed correctly, and programmingadjustments to the hearing aids were made,if needed. The electroacoustic measurementsdescribed above were obtained with eachinstrument to make sure that it wasamplifying sound as prescribed. Speechrecognition ability in noise was measured ina sound-treated test booth using the HINT inthe OMNI and DIR modes, and the directionaladvantage was computed. Finally, theparticipant was given a large supply of blanklog forms and instructed to fill them out overthe next four weeks. Detailed instructions onhow and when to fill out the forms wereprovided.
Session 4 (approximately four weeksfollowing Session 3). Logs from the previousfour weeks were collected and reviewed. TheHINT was administered again for both theOMNI and DIR modes, and the directionaladvantage was determined.
Hearing Aid Use Log
The Hearing Aid Use Log (HAUL) wasused to record the characteristics of everylistening situation encountered during a totalof seven days of the four-week trial—one foreach day of the week. Because it was importantthat the listening situations recorded be asrepresentative as possible of listeningsituations normally encountered by theparticipants in daily living, participants wererequested to complete logs in one-third dayblocks of time: mornings (rising to noon) for oneweek, afternoons (noon to 5:00 p.m.) a secondweek, and evenings (5:00 p.m. to retiring) athird week. The order in which these one-third day blocks of data were acquired wereassigned by the investigators and randomizedacross participants over the first three weeksof the four-week trial. Given that completinglogs for several hours within a day may nothave been possible on some days, a fourthtrial week was included so that participantscould make up any (one-third) days missedduring the first three weeks of the trial.
During the seven days that were surveyedby each participant, every major activelistening situation that was encountered wasto be described, that is, every listeningsituation that lasted more than a few minutes.Although performance in more briefcommunication encounters may be significant,it was impractical to request that participantsevaluate such listening situations because ofthe amount of time that was required tocomplete each log. Only listening situations inwhich active listening took place were included.Generally, this meant situations in which theparticipant was listening to speech, or activelylistening to nonspeech sounds (e.g., music,sounds of nature). Listening situations thatwere encountered repeatedly (e.g., watchingtelevision in the participant’s living room,listening to the radio in the car) were ratedseparately each time the person entered intothe listening situation.
Participants were instructed, uponentering each new listening environment, toswitch between memories 1 and 2 until theydetermined if one or the other was preferable.The participants then rated their preferencefor these two memories (microphone modes)using a three-point scale, with the middlerating indicating no preference. The HAULused a check-box format to characterize eachlistening environment in terms of location
Journal of the American Academy of Audiology/Volume 15, Number 5, 2004
372

(indoors, car, outdoors), the size of the indoorspace (small, average, large; compared toaverage living room), presence or absence ofcarpeting, location of the primary talker/soundsource (front, side, back), distance from theprimary talker/sound source (<3 ft, 4–10 ft,>11 ft), presence or absence of backgroundnoise, and location of background noise (front,side/back, all around).
Based on the HAUL responses, eachlistening situation encountered by eachparticipant was categorized into one of 24PLS. Consistent with the binary model, thecategories of signal location and noise locationwere reduced to “front” and “other,” those ofsignal distance to “near” (≤10 feet) and “far”(≥11 feet). The latter distinction was madebased on Surr et al (2002). Becausereverberation was not measured directly,high- and low-reverberation environmentswere identified indirectly based on otherenvironmental characteristics. Specifically,outdoor locations and the passengercompartment of automobiles were assumed tobe low-reverberation environments. Indoorlocations that were equal in size or smallerthan an average living room were assumed tobe low-reverberation environments if theywere carpeted. Otherwise, they were regardedas high-reverberation environments. Indoorspaces that were larger than an average livingroom were assumed to be high-reverberationenvironments.
Participants also indicated on the HAULthe duration (in minutes) they werecommunicating/listening in each situation.Finally, they rated the listening situation aseither easy or difficult. The latterdetermination was made while wearing thehearing aids in the preferred microphonemode.
At the end of the trial period, participantswere asked to estimate the overall percentageof time they used the hearing aids in each ofthe two memories during those periods of thetrial when they were wearing the test hearingaids but were not completing HAULassignments. Because participants completedthe HAUL for a total of one week during themonth-long trial, this amounted to three-quarters of the trial period.
Speech Recognition in Noise
The HINT assesses the ability to repeatsentences in the presence of background noise.
It was administered for each microphonemode on three occasions (see above). Theorder of testing of the OMNI and DIRprograms was randomized across participants.Two 10-sentence lists (a total of 20 sentences)were presented to obtain a score. Prior toeach test administration, a 10-sentencepractice list was administered to familiarizethe participant with the test conditions.Testing was performed in a sound-treatedaudiometric test suite following standardcalibration procedures. Test materials werepresented to the participant in the sound fieldwith the test sentences presented through aloudspeaker positioned at 0 degrees azimuthand the competing correlated noise comingfrom loudspeakers at 90, 180, and 270 degreesazimuth.
Commercially available compact discrecordings of the HINT, consisting of 25 10-sentence lists, were used. Test sentences werepresented in speech-shaped noise. Thecompeting noise was presented at a fixedlevel of 65 dBA, and the presentation level ofthe test sentences was adjusted adaptively in2 dB steps until the participant could correctlyrepeat half of the sentences. All words of asentence had to be repeated correctly for asentence to be counted as correct. The levelof the test sentences (in dB) that yieldedcorrect recognition of 50% of the sentences wasrecorded as the Reception Threshold forSentences (RTS in dB).
The test sentences and the competingnoise were digitized, and computer-controlledadjustments of the attenuator were made inresponse to the tester’s manual indication ofcorrect or incorrect responses. The directionaladvantage was derived automatically usingthe following definition of the directionaladvantage (DA):
DA = RTSOMNI - RTSDIR
RESULTS
Hearing in Noise Test
The mean omnidirectional and directionalRTS for the three administrations of the HINTare summarized in Figure 4. The averagedirectional advantage for the screening,pre-trial, and post-trial administrations were4.6, 3.9, and 3.3 dB, with standard deviationsof 1.9, 1.5, and 2.8, respectively. Individual
Microphone Preference/Walden et al
373

scores ranged from -1.9 to 9.0 dB across thethree sessions. These data are consistent withthose of Ricketts (2000) for a variety of noisesource locations and testing environments. Atwo-factor repeated measures analysis ofvariance (ANOVA) of the RTS data revealedsignificant main effects for microphone mode(F = 38.4; p < .001) and test session (F = 6.03;p < .005). Significantly lower RTS scores(better sentence recognition in noise) wereobserved for the directional mode, across thethree administrations of the test. Further,significantly higher RTS scores were obtainedfor the initial screening administration of theHINT with the BTE hearing aids comparedto the two administrations with the ITEinstruments. The interaction betweenmicrophone mode and test session was notstatistically significant. A separate ANOVAwas performed on the pre-trial and post-trialHINT data with the ITE test instrumentsand revealed that the main effect formicrophone mode was significant (F = 24.05;p < .001). However, the main effect for testsession was not significant (F = 0.58; p = .45),and the interaction between microphone modeand test session was not significant. Theseresults, therefore, indicated that meanperformance with the test instrument did notdiffer significantly between the pre-trial andpost-trial administrations of the HINT.
Description of Everyday ListeningSituations
Recall that each participant was requiredto complete a HAUL for every active listeningsituation (other than brief communicationencounters) that occurred during (a total of)seven days. Hence, the number of listeningsituations that were recorded depended on thenature and extent of each participant’s dailyactivities. A total of 1599 listening situationswas described. The mean number of logs (i.e.,listening situations) completed by each of the17 participants was 94.1 (SD: 39.1; range:54–185). Each was categorized into one ofthe 24 PLS, based on the data recorded on theHAUL describing that listening environment.Three examples of specific listening situationsdescribed by the participants under 21 of the24 PLS are provided in the Appendix. Onlytwo examples are provided for PLS14 becauseonly two descriptions within this PLS wereobtained. No examples for PLS6 and PLS16are given because none were encountered bythe participants.
Because participants completed a newHAUL each time a different listening situationwas encountered, no matter how often it wasencountered in daily living, many of thelistening situations recorded for a givenparticipant are of the same listeningenvironment. By allowing duplicate
Journal of the American Academy of Audiology/Volume 15, Number 5, 2004
374
55
60
65
70
75
Screening Pre-Trial Post-Trial
HINT Administration
RT
S (
dBA
)
OMNI DIR
Figure 4. Mean RTS scores for the omnidirectional mode and the directional mode for administrations of theHINT. The error bars indicate one standard deviation.

descriptions, the 1599 listening situationsrepresent the range of listening situationsencountered by these hearing-impaired adultsweighted by the frequency with which eachtype of listening situation is encountered.Further, participants were required toestimate the total length of time that theywere in each listening situation. These dataprovide additional importance weightinginformation regarding the listening situations,which will be described later in this section.
The frequencies of occurrence of listeningsituations according to the five environmentalvariables of interest are summarized withinthe parentheses in Figure 1. Each rowrepresents the distribution of the totallistening situations described by theparticipants according to one or more of theenvironmental variables. It should be notedthat the row totals do not add up to 1599 inevery case, as participants occasionally failedto fill in some information about listeningsituations on their logs. The first row(background noise) categorizes the listeningsituations according to whether noise waspresent or absent. In this case, 1006 listeningsituations were described in which noise waspresent, and 593 situations were described inwhich noise was absent. Rows two throughfive further subdivide the total listeningsituations according to signal location, signaldistance, reverberation, and noise location.
Because noise location does not apply to the593 situations in which noise was absent,there are no data entered for these situationsin the noise location row.
Although Figure 1 provides a completeaccounting of frequency of occurrence oflistening situations according to the model, thedistribution of the listening situationsaccording to each of the five variablesindependently is not easily deciphered fromthese data, other than for the first variable(row 1: background noise, present or absent).The frequency of occurrence of listeningsituations for each of the five environmentalvariables, pooled across the other fourenvironmental variables, is shown in Figure5. It is apparent that the most commonlyoccurring listening situations encountered bythe participants involved a signal location infront of the listener and relatively near.Background noise was often present but rarelyreported as located in front of the listener.Finally, environments that were categorizedas low reverberation and as high reverberationwere encountered with almost equalfrequency.
Table 1 lists each of the 24 PLS describedby the model according to frequency ofoccurrence, from the PLS that wasencountered most frequently by theparticipants (PLS1) to the two PLS that werenever encountered (PLS6 and PLS16). The
Microphone Preference/Walden et al
375
0
500
1000
1500
Fre
quen
cy o
f Occ
urre
nce
BackgroundNoise
SignalLocation
SignalDistance
Reverberation NoiseLocation
Present Absent Front Other Near Far Low High Other Front
Figure 5. Distribution of the listening situations for each of the five environmental variables described by themodel, pooled across the other four variables.

first data column (Frequency) gives thenumber of listening situations encountered bythe participants for each PLS, and the seconddata column shows the frequency of each PLSin percent (Percentage) of the total listeningsituations encountered. Hence, the mostfrequently encountered type of listeningsituation involved background noise presentand located other than in front of the listener,the signal located in front of the listener andrelatively near, and relatively lowreverberation (PLS1). Such listeningsituations constituted 19.1% of all listeningsituations encountered by the participants.
Table 2 gives the average time, inminutes, that the 17 participants reportedbeing in each of the PLS. These data areorganized similarly to the frequency ofoccurrence data in Table 1, with the PLSlisted according to the average time thatparticipants remained in each, from thelongest (PLS24) to those that were neverencountered (PLS6 and PLS16). It is notable
that the average length of time thatparticipants reported being in the PLS withthe longest average duration (PLS24) was151.3 minutes, or more than two and a halfhours. The average length of time thatparticipants reported being in the PLS withthe shortest average duration (PLS12) wasnearly 19 minutes. Hence, reflecting the timerequired to assess a listening situation and fillout the HAUL, participants generallycompleted logs on listening situations thatlasted several minutes, and briefcommunication encounters were infrequentlyreported.
Figure 6 shows the average time (inminutes) that participants remained inlistening situations, for each of the fiveenvironmental variables pooled across theother four variables. Thus, for example, theaverage time spent in listening situationswhere background noise was present was49.7 minutes, whereas the average time thatthey spent in listening situations where
Journal of the American Academy of Audiology/Volume 15, Number 5, 2004
376
Table 1. The 24 Prototype Listening Situations Ranked by Frequency of Occurrence
Signal Signal BNPLS BN Location Distance Reverberation Location Frequency Percentage
1 Present Front Near Low Other 301 19.1
3 Present Front Near High Other 275 17.5
18 Absent Front Near High 220 14.0
17 Absent Front Near Low 201 12.8
9 Present Other Near Low Other 122 7.8
20 Absent Front Far High 64 4.1
2 Present Front Near Low Front 45 2.9
5 Present Front Far Low Other 44 2.8
13 Present Other Far Low Other 44 2.8
7 Present Front Far High Other 43 2.7
11 Present Other Near High Other 39 2.5
21 Absent Other Near Low 39 2.5
4 Present Front Near High Front 36 2.3
15 Present Other Far High Other 20 1.3
19 Absent Front Far Low 19 1.2
22 Absent Other Near High 16 1.0
24 Absent Other Far High 13 0.8
23 Absent Other Far Low 11 0.7
8 Present Front Far High Front 10 0.6
10 Present Other Near Low Front 6 0.4
12 Present Other Near High Front 3 0.2
14 Present Other Far Low Front 2 0.1
6 Present Front Far Low Front 0 0
16 Present Other Far High Front 0 0
Total: 1573 100.0

Microphone Preference/Walden et al
377
Table 2. The 24 Prototype Listening Situations Ranked by Average Time Spent in Them
Signal Signal BNPLS BN Location Distance Reverberation Location Time (minutes)
24 Absent Other Far High 151.3
13 Present Other Far Low Other 123.3
5 Present Front Far Low Other 75.3
23 Absent Other Far Low 66.2
20 Absent Front Far High 65.1
17 Absent Front Near Low 59.9
19 Absent Front Far Low 54.7
11 Present Other Near High Other 49.4
4 Present Front Near High Front 49.3
8 Present Front Far High Front 49.0
2 Present Front Near Low Front 48.3
9 Present Other Near Low Other 47.9
7 Present Front Far High Other 47.1
3 Present Front Near High Other 46.8
22 Absent Other Near High 45.9
21 Absent Other Near Low 44.6
1 Present Front Near Low Other 42.6
15 Present Other Far High Other 39.9
18 Absent Front Near High 39.2
10 Present Other Near Low Front 38.3
14 Present Other Far Low Front 20.0
12 Present Other Near High Front 18.7
6 Present Front Far Low Front 0
16 Present Other Far High Front 0
Total: 1222.8
0
20
40
60
80
Ave
rage
Tim
e (M
inut
es)
BackgroundNoise
SignalLocation
SignalDistance
Reverberation NoiseLocation
Present Absent Front Other Near Far Low High Other Front
Figure 6. Average time (in minutes) spent in listening situations, for each of the five environmental variables,pooled across the other four variables.

background noise was absent was 52.1minutes. In general, the length of time thatparticipants tended to stay in a listeningsituation did not vary greatly with theenvironmental variable. On average,participants tended to stay in active listeningsituations around 45–60 minutes. The mostnotable exception to this general trend was forthe signal distance variable. The averagetime spent in listening situations in which thesignal was relatively near (≤10 feet) was 47.0minutes, whereas the average time spent insituations where the signal was relatively farwas 74.7 minutes. There was some tendencyfor participants to stay longer in listeningsituations where the signal was located otherthan in front, compared to in front of thelistener.
A comparison of Tables 1 and 2 suggeststhat the PLS that were encountered mostoften were not necessarily the ones in whichthe participant stayed the longest. That is tosay, the order in which the PLS are listed in
these two tables is not the same. Thisobservation was confirmed statistically bycomputing a Spearman Rank Correlationbetween the rank scores (1–24) for the 24PLS in Table 1 with those in Table 2. Theresulting Spearman correlation coefficientwas 0.36, suggesting only a modestrelationship.
Table 3 combines the data presented inTables 1 and 2. Specifically, the frequency ofoccurrence of the 24 PLS (from Table 1) wasmultiplied by the average time thatparticipants reported being in each of these24 types of listening situations (from Table 2).The resulting products are shown in the firstdata column (Time x Frequency). Theseproducts were then normalized by dividingeach by the sum of all 24 products. Thisresulted in 24 percentages (totaling 100%)that estimate the percentage of theparticipants’ total active listening time ineach of the 24 PLS. The 24 listening situationsare ordered from the one in which the
Journal of the American Academy of Audiology/Volume 15, Number 5, 2004
378
Table 3. The 24 Prototype Listening Situations Ranked by Total Active Listening Time
Signal Signal BN Time xPLS BN Location Distance Reverberation Location Frequency Percentage
3 Present Front Near High Other 12,870.0 15.9
1 Present Front Near Low Other 12,822.6 15.9
17 Absent Front Near Low 12,039.9 14.9
18 Absent Front Near High 8624.0 10.7
9 Present Other Near Low Other 5843.8 7.2
13 Present Other Far Low Other 5425.2 6.7
20 Absent Front Far High 4166.4 5.2
5 Present Front Far Low Other 3313.2 4.1
2 Present Front Near Low Front 2173.5 2.7
7 Present Front Far High Other 2025.3 2.5
24 Absent Other Far High 1967.0 2.4
11 Present Other Near High Other 1926.6 2.4
4 Present Front Near High Front 1774.8 2.2
21 Absent Other Near Low 1739.4 2.2
19 Absent Front Far Low 1039.3 1.3
15 Present Other Far High Other 798.0 1.0
22 Absent Other Near High 734.4 0.9
23 Absent Other Far Low 728.2 0.9
8 Present Front Far High Front 490.0 0.6
10 Present Other Near Low Front 229.8 0.3
12 Present Other Near High Front 56.1 0.1
14 Present Other Far Low Front 40.0 0.0
6 Present Front Far Low Front 0 0
16 Present Other Far High Front 0 0
Total: 80,827.5 100.0
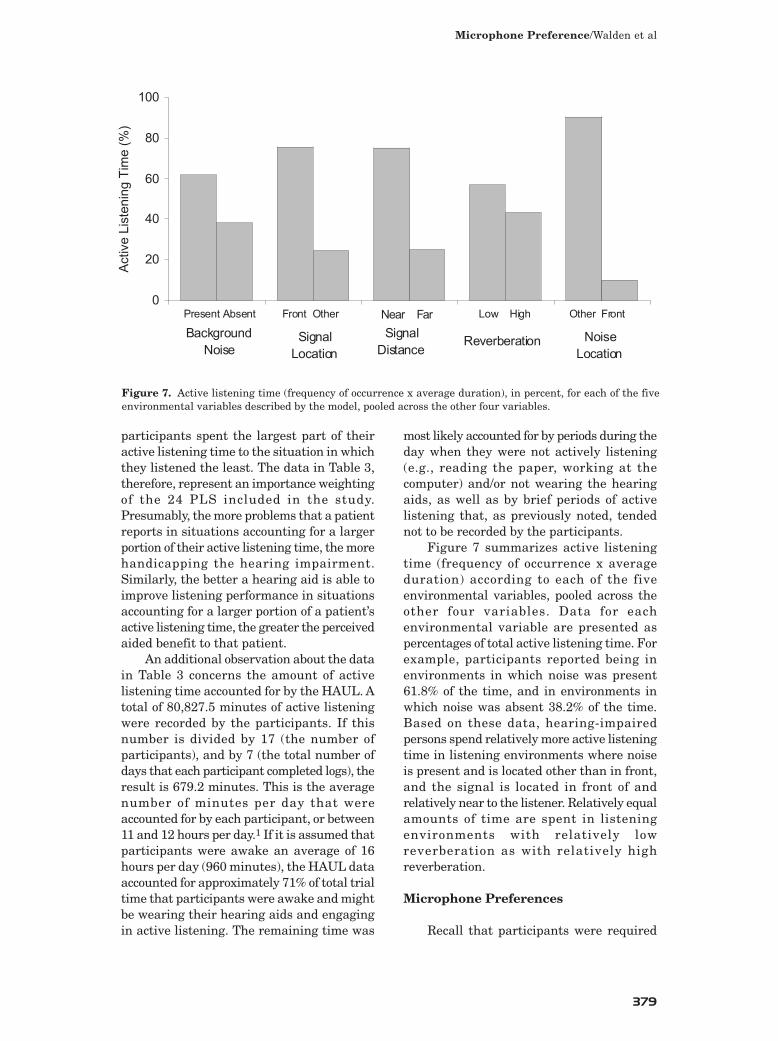
participants spent the largest part of theiractive listening time to the situation in whichthey listened the least. The data in Table 3,therefore, represent an importance weightingof the 24 PLS included in the study.Presumably, the more problems that a patientreports in situations accounting for a largerportion of their active listening time, the morehandicapping the hearing impairment.Similarly, the better a hearing aid is able toimprove listening performance in situationsaccounting for a larger portion of a patient’sactive listening time, the greater the perceivedaided benefit to that patient.
An additional observation about the datain Table 3 concerns the amount of activelistening time accounted for by the HAUL. Atotal of 80,827.5 minutes of active listeningwere recorded by the participants. If thisnumber is divided by 17 (the number ofparticipants), and by 7 (the total number ofdays that each participant completed logs), theresult is 679.2 minutes. This is the averagenumber of minutes per day that wereaccounted for by each participant, or between11 and 12 hours per day.1 If it is assumed thatparticipants were awake an average of 16hours per day (960 minutes), the HAUL dataaccounted for approximately 71% of total trialtime that participants were awake and mightbe wearing their hearing aids and engagingin active listening. The remaining time was
most likely accounted for by periods during theday when they were not actively listening(e.g., reading the paper, working at thecomputer) and/or not wearing the hearingaids, as well as by brief periods of activelistening that, as previously noted, tendednot to be recorded by the participants.
Figure 7 summarizes active listeningtime (frequency of occurrence x averageduration) according to each of the fiveenvironmental variables, pooled across theother four variables. Data for eachenvironmental variable are presented aspercentages of total active listening time. Forexample, participants reported being inenvironments in which noise was present61.8% of the time, and in environments inwhich noise was absent 38.2% of the time.Based on these data, hearing-impairedpersons spend relatively more active listeningtime in listening environments where noiseis present and is located other than in front,and the signal is located in front of andrelatively near to the listener. Relatively equalamounts of time are spent in listeningenvironments with relatively lowreverberation as with relatively highreverberation.
Microphone Preferences
Recall that participants were required
Microphone Preference/Walden et al
379
0
20
40
60
80
100
Act
ive
List
enin
g T
ime
(%)
Present Absent Front Other Low High Other Front
BackgroundNoise
SignalLocation
SignalDistance
Reverberation NoiseLocation
Near Far
Figure 7. Active listening time (frequency of occurrence x average duration), in percent, for each of the fiveenvironmental variables described by the model, pooled across the other four variables.
to switch between the omnidirectional anddirectional modes of the test instruments inevery major listening situation that wasencountered (for a total of one week during aone-month period) and to determine if eithermicrophone mode was preferred or if therewas no preference. None of the threepreference categories dominated participant
ratings. Expressed as percentages of the 1599listening situations, the omnidirectional modewas favored in 37.4%, the directional mode in33.0%, and there was no preference for eithermicrophone mode in the remaining 29.6%.Although these mean percentages suggest arelatively similar distribution of preferencesfor the three categories across participants,
Journal of the American Academy of Audiology/Volume 15, Number 5, 2004
380
0
20
40
60
BN Present; Signal Front; Signal Near; Rev.Low; BN Other
Pre
fere
nce
(%)
OMNI DIR No Preference
n = 301
PLS1
x2 = 43.21; p < 0.001
0
20
40
60
BN Present; Signal Front; Signal Near; Rev.Low; BN Front
Pre
fere
nce
(%)
OMNI DIR No Preference
n = 45
PLS2
x2 = 8.75; p < 0.05
0
20
40
60
BN Present; Signal Front; Signal Near; Rev.High; BN Other
Pre
fere
nce
(%)
OMNI DIR No Preference
n = 275
PLS3
x2 = 6.89; p < 0.05
0
20
40
60
BN Present; Signal Front; Signal Near; Rev.High; BN Front
Pre
fere
nce
(%)
OMNI DIR No Preference
n = 36
PLS4
x2 = 5.03; p = 0.08
0
20
40
60
BN Present; Signal Front; Signal Far; Rev.Low; BN Other
Pre
fere
nce
(%)
OMNI DIR No Preference
n = 44
PLS5
x2 = 1.71; p = 0.43
0
20
40
60
BN Present; Signal Front; Signal Far; Rev.Low; BN Front
Pre
fere
nce
(%) n = 0
PLS6
0
20
40
60
BN Present; Signal Front; Signal Far; Rev.High; BN Other
Pre
fere
nce
(%)
OMNI DIR No Preference
PLS7
n = 43 x2 = 0.18; p = 0.92
0
20
40
6080
BN Present; Signal Front; Signal Far; Rev.High; BN Front
Pre
fere
nce
(%)
OMNI DIR No Preference
PLS8
n = 10x2 = 8.51; p < 0.05
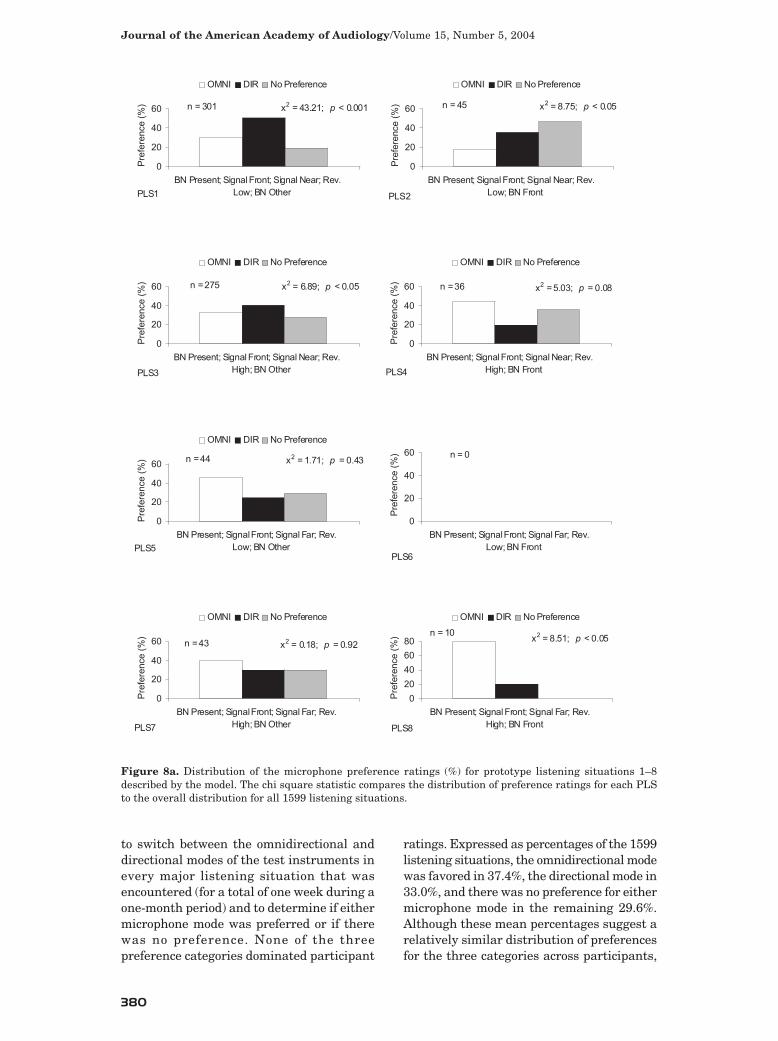
Figure 8a. Distribution of the microphone preference ratings (%) for prototype listening situations 1–8described by the model. The chi square statistic compares the distribution of preference ratings for each PLSto the overall distribution for all 1599 listening situations.
individuals varied considerably. For example,one participant preferred the omnidirectionalmode in 90% of all the listening situationsencountered, while another preferred thedirectional mode in 73% of listening situations.The most extreme participant, in this regard,did not prefer either microphone mode in 99%of all listening situations that he encounteredduring the trial.
Figure 8 shows the breakdown ofparticipant ratings for each of the 24 PLSdescribed by the model. It is clear that therelative frequencies of the three preferenceratings varied across the PLS. Hence,microphone preferences interacted with thelistening environment. This observation wasconfirmed statistically via a chi squareanalysis. The chi square statistic associated
Microphone Preference/Walden et al
381
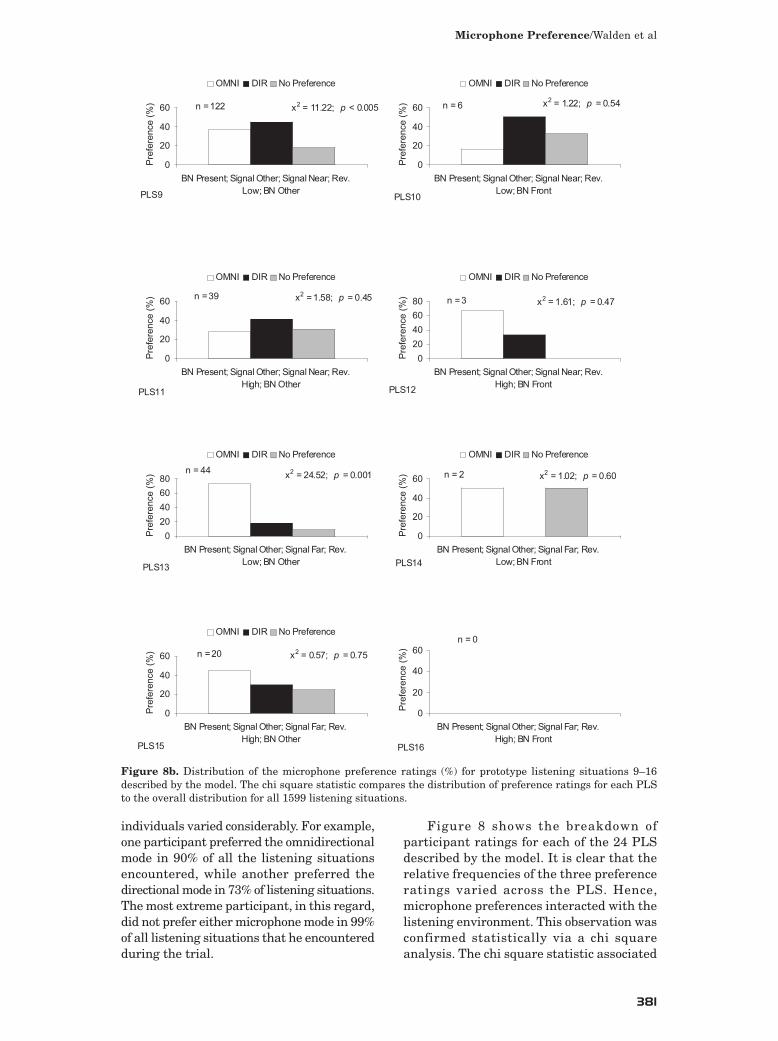
Figure 8b. Distribution of the microphone preference ratings (%) for prototype listening situations 9–16described by the model. The chi square statistic compares the distribution of preference ratings for each PLSto the overall distribution for all 1599 listening situations.
0
20
40
60
BN Present; Signal Other; Signal Near; Rev.Low; BN Other
Pre
fere
nce
(%)
OMNI DIR No Preference
n = 122
PLS9
x2 = 11.22; p < 0.005
0
20
40
60
BN Present; Signal Other; Signal Near; Rev.Low; BN Front
Pre
fere
nce
(%)
OMNI DIR No Preference
n = 6
PLS10
x2 = 1.22; p = 0.54
0
20
40
60
BN Present; Signal Other; Signal Near; Rev.High; BN Other
Pre
fere
nce
(%)
OMNI DIR No Preference
n = 39
PLS11
x2 = 1.58; p = 0.45
0
20
40
6080
BN Present; Signal Other; Signal Near; Rev.High; BN Front
Pre
fere
nce
(%)
OMNI DIR No Preference
n = 3
PLS12
x2 = 1.61; p = 0.47
0
20
40
6080
BN Present; Signal Other; Signal Far; Rev.Low; BN Other
Pre
fere
nce
(%)
OMNI DIR No Preference
n = 44
PLS13
x2 = 24.52; p = 0.001
0
20
40
60
BN Present; Signal Other; Signal Far; Rev.Low; BN Front
Pre
fere
nce
(%)
OMNI DIR No Preference
n = 2
PLS14
x2 = 1.02; p = 0.60
0
20
40
60
BN Present; Signal Other; Signal Far; Rev.High; BN Other
Pre
fere
nce
(%)
OMNI DIR No Preference
n = 20
PLS15
x2 = 0.57; p = 0.75
0
20
40
60
BN Present; Signal Other; Signal Far; Rev.High; BN Front
Pre
fere
nce
(%)
n = 0
PLS16

with each panel compares the distributionof preference ratings for each listeningsituation to the mean distribution for all1599 listening situations given above.Statistical significance (p < .10)2 wasachieved in 14 of the 19 PLS for which atleast ten descriptions were obtained. Thesedata, therefore, suggest that thecharacteristics of the listening environment
significantly influenced microphonepreference in the majority of listeningsituations encountered.
Predicting Microphone Preferences
This section describes the extent to whichmicrophone preference can be predicted fromthe characteristics of everyday listening
Journal of the American Academy of Audiology/Volume 15, Number 5, 2004
382
Figure 8c. Distribution of the microphone preference ratings (%) for prototype listening situations 17–24 describedby the model. The chi square statistic compares the distribution of preference ratings for each PLS to the over-all distribution for all 1599 listening situations.
0
20
40
60
BN Absent; Signal Front; Signal Near; Rev.Low
Pre
fere
nce
(%)
OMNI DIR No Preference
n = 201 x2 = 50.66; p < 0.001
PLS17
0
20
40
60
BN Absent; Signal Front; Signal Near; Rev.High
Pre
fere
nce
(%)
OMNI DIR No Preference
n = 220 x2 = 1.84; p = 0.40
PLS18
0
20
40
60
BN Absent; Signal Front; Signal Far; Rev.Low
Pre
fere
nce
(%)
OMNI DIR No Preference
n = 19 x2 = 10.07; p < 0.01
PLS19
0
20
40
6080
BN Absent; Signal Front; Signal Far; Rev.High
Pre
fere
nce
(%)
OMNI DIR No Preference
n = 64 x2 = 25.92; p < 0.001
PLS20
0
20
40
60
BN Absent; Signal Other; Signal Near; Rev.Low
Pre
fere
nce
(%)
OMNI DIR No Preference
n = 39 x2 = 9.14; p < 0.05
PLS21
0
20
40
6080
BN Absent; Signal Other; Signal Near; Rev.High
Pre
fere
nce
(%)
OMNI DIR No Preference
n = 16 x2 = 8.29; p < 0.05
PLS22
0
20
40
6080
BN Absent; Signal Other; Signal Far; Rev.Low
Pre
fere
nce
(%)
OMNI DIR No Preference
PLS23
n = 11 x2 = 7.78; p < 0.05
020406080
100
BN Absent; Signal Other; Signal Far; RevHigh
Pre
fere
nce
(%)
OMNI DIR No Preference
n = 13x2 = 22.14; p < 0.001
PLS24

situations. This will be explored within theframework of the model in Figure 1. Figure9 reports the distribution of microphonepreferences for each environmental variableincluded in the model. The data in each panelprovide the distribution for each binarycondition of that variable, pooled across theother four variables. The chi square statisticfor each panel compares the two distributionswithin that panel; that is, the distribution ofmicrophone preferences for each binarycondition of that environmental variable. Thechi square statistic was significant for four ofthe five environmental variables. Thedistribution of microphone preferences didnot differ significantly for listening situationswith relatively low reverberation compared tothose with relatively high reverberation. For
the background noise variable, there was aslight preference for the directional modewhen noise was present and a rather distinctpreference for the omnidirectional mode whennoise was absent or no preference wasexpressed. There was no significant preferencefor either microphone mode when the signalwas located in front of the listener. However,there was a distinct preference for theomnidirectional mode when the signal waslocated other than in front. Similarly, therewas no distinct preference for eithermicrophone mode when the signal source wasnear, but a very distinct preference for theomnidirectional mode when the signal waslocated relatively far away. Finally, for thebackground noise location variable, there wasa slight preference for the directional mode
Microphone Preference/Walden et al
383
Figure 9. Distribution of microphone preferences (%) for each of the environmental variables included in themodel. The chi square compares the two distributions in each panel.
0
20
40
60
Present Absent
Background Noise
Pre
fere
nce
(%)
OMNI DIR No Preference
n = 1006 n = 593x2 = 68.63; p < 0.001
0
20
40
60
Front Other
Signal Location
Pre
fere
nce
(%)
OMNI DIR No Preference
n = 1268n = 318
x2 = 9.36; p < 0.01
0
20
40
60
Near Far
Signal Distance
Pre
fere
nce
(%)
OMNI DIR No Preference
n = 1307 n = 271
x2 = 62.99; p < 0.001
0
20
40
60
Low High
Reverberation
Pre
fere
nce
(%)
OMNI DIR No Preference
n = 854 n = 745x2 = 2.06; p = 0.36
0
20
40
60
Other Front
Background Noise Location
Pre
fere
nce
(%)
OMNI DIR No Preference
n = 902
n = 104x2 = 10.27; p < 0.01

when the background noise was located otherthan in front of the listener, and a slightpreference for the omnidirectional mode whenthe noise source was located primarily infront or no preference was expressed. Overall,the data depicted in Figure 9 suggest that theinfluence of the presence or absence ofbackground noise, signal location, and signaldistance are greater than those ofreverberation and background noise location.Notably, preferences for the omnidirectionalmode largely appear to account for thesignificant differences observed.
A primary purpose of this study was toprovide guidance to hearing-impaired patientsfit with switchable omnidirectional/directionalhearing aids regarding the microphone mode(OMNI or DIR) most likely to be preferred invarious types of everyday listening situations.To address this issue, the no preference ratingswere deleted from the analysis. The rationalehere was that the hearing aid must be set inone microphone mode or the other in everylistening situation encountered. Hence, evenif there were a substantial number of nopreference ratings for a particular PLS, ifone of the two microphone modes wassignificantly preferred to the other, it wasregarded as the preferred mode for that PLS.A chi square statistic was computed for each
PLS comparing the observed distribution ofOMNI and DIR microphone preferences to a50/50 chance preference. Prototype listeningsituations for which fewer than fivedescriptions were provided by the participants(PLS6, PLS10, PLS12, PLS14, PLS16, PLS23)were not included in this analysis. Five ofthese six PLS involve background noiselocated in front of the listener, which appearsto occur relatively infrequently in dailylistening (see Figure 1).
Table 4 categorizes the 18 PLS for whichat least five descriptions were obtainedaccording to the microphone preferencecategory. The omnidirectional mode wassignificantly preferred (p < .10) in nine PLS;the directional mode was significantlypreferred in three PLS; and no significantpreference for either mode was expressed inthe remaining six PLS. Inspection of theenvironmental characteristics of the PLS witheach of these three groups reveals someconsistent trends. First, five of the nine PLSwhere the omnidirectional mode was preferredinvolved the absence of background noise.Further, in three of the four PLS wherebackground noise was present and theomnidirectional mode was significantlypreferred, the signal source was locatedrelatively far from the listener. In contrast,
Journal of the American Academy of Audiology/Volume 15, Number 5, 2004
384
Table 4. Prototype Listening Situations Grouped by Microphone Preference
Omnidirectional
Signal Signal BNPLS BN Location Distance Reverberation Location
4 Present Front Near High Front5 Present Front Far Low Other8 Present Front Far High Front13 Present Other Far Low Other17 Absent Front Near Low19 Absent Front Far Low20 Absent Front Far High21 Absent Other Near Low24 Absent Other Far High
Directional
1 Present Front Near Low Other2 Present Front Near Low Front3 Present Front Near High Other
No Preference
7 Present Front Far High Other9 Present Other Near Low Other11 Present Other Near High Other15 Present Other Far High Other18 Absent Front Near High22 Absent Other Near High

noise was present in each of the three PLSwhere the directional mode was preferred,as well as the signal being in front of andnear to the listener.
Table 4, like Figure 9, suggests that thepresence/absence of background noise, signallocation, and signal distance may have agreater influence on microphone preferencesthan reverberation and noise location.Assuming that it does not make any differencewhich of the two microphone modes areactivated for the six PLS within the “nopreference” category in Table 4, we may ask:Can only these three environmental variables
accurately predict the preferred microphonemode for the remaining 12 PLS where asignificant preference was expressed for onemicrophone mode or the other? If thedirectional mode were activated only whenbackground noise is present and the signal isin front of and relatively close to the listener(otherwise the hearing aid would remain inthe omnidirectional mode), the device wouldbe set in the less preferred microphone modeonly in PLS4 listening situations (BN[background noise] present, signal front, signalnear, reverberation high, BN location front).In this case, a preference for the directional
Microphone Preference/Walden et al
385
Mea
n D
iffic
ulty
Rat
ing
n = 1548
1
1.25
1.5
1.75
2
1 3 5 7 9 11 13 15 17 19 21 23
Figure 10. Mean difficulty ratings for each of the 19 prototype listening situations that were encountered atleast ten times by the participants.
1
1.25
1.5
Mea
n D
iffic
ulty
Rat
ing
BackgroundNoise
Signal Location
SignalDistance
Reverberation NoiseLocation
Present Absent Front Other Near Far Low High Other Front
Figure 11. Mean difficulty ratings of listening situations grouped according to the five environmental variables.

mode would be predicted, whereas theomnidirectional mode is actually significantlypreferred. However, referring to Table 3, suchlistening situations constituted an average ofonly 2.2% of the participants’ active listeningtime.
Overall, these data suggest that theomnidirectional mode will be preferred inmost listening situations, or neithermicrophone mode will be preferred. Only inrather specific listening environments—generally those where background noise ispresent and the signal is located in front of andrelatively close to the listener—will thedirectional mode be preferred. However, againreferring to Table 3, such listening situations(PLS1, PLS2, PLS3) constituted more thanone-third of the total active listening time ofthe study participants.
Difficulty of Prototype ListeningSituations
Participants were required to rate eachlistening situation encountered as either easyor difficult. This rating was assigned based onaided performance in the preferredmicrophone mode. Of the 1585 listeningsituations that received a difficulty ratingfrom the participants, 1261 (79.6%) wereregarded as relatively easy and 324 (20.4%)as relatively difficult. For purposes of analysis,listening situations labeled as “easy” and as“difficult” were assigned numerical values of1 and 2, respectively. The mean difficultyrating for each of the 19 PLS that were
encountered at least ten times by theparticipants is shown in Figure 10. Asexpected, a rather clear distinction existedbetween the PLS involving background noise(PLS1-16) and those where background noisewas absent (PLS17–24). This is seen moreclearly in Figure 11, which depicts meandifficulty ratings according to eachenvironmental variable.
Figure 12 shows the mean difficultyrating of these 1548 listening situationsgrouped according to microphone preferencecategory. Overall, listening situations in whichthe omnidirectional mode was preferred wererated as easier than listening situations inwhich the directional mode was preferred.Notably, listening situations in which neithermicrophone mode was preferred wereregarded as most difficult. A chi squareanalysis comparing the number of easy anddifficult ratings assigned to each of the threemicrophone preference categories revealed asignificant difference (χ2 = 34.89; p < .001)among the difficulty ratings of the listeningsituations depending on the preferredmicrophone mode.
Microphone Mode Use Pattern
Recall that participants were engaged infilling out the HAUL a total of seven daysduring the four-week trial period. During thefirst three weeks, participants filled out logsduring morning, afternoon, or evening blocksof time. The final week was devoted tocompleting any HAUL assignments that were
Journal of the American Academy of Audiology/Volume 15, Number 5, 2004
386
1
1.25
1.5
1.75
OMNI DIR No Preference
Me
an
Diff
icu
lty R
atin
g n = 1548
Figure 12. Mean difficulty ratings of the listening situations grouped according to microphone preference cat-egory. The error bars indicate one standard deviation.
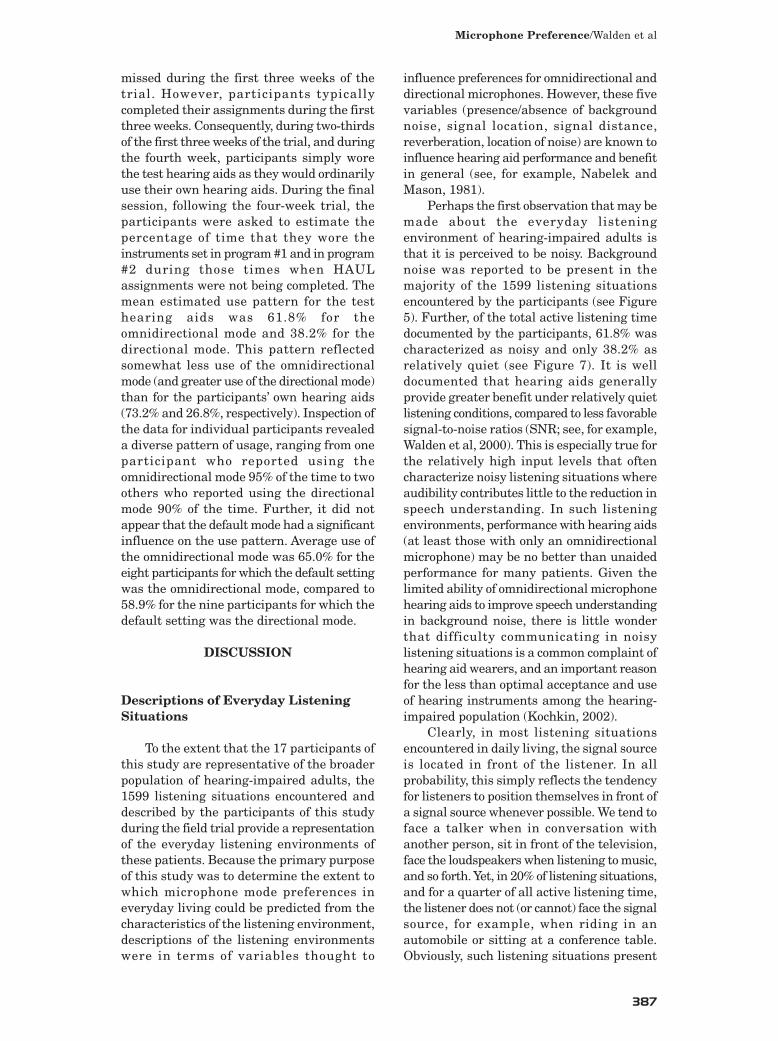
missed during the first three weeks of thetrial. However, participants typicallycompleted their assignments during the firstthree weeks. Consequently, during two-thirdsof the first three weeks of the trial, and duringthe fourth week, participants simply worethe test hearing aids as they would ordinarilyuse their own hearing aids. During the finalsession, following the four-week trial, theparticipants were asked to estimate thepercentage of time that they wore theinstruments set in program #1 and in program#2 during those times when HAULassignments were not being completed. Themean estimated use pattern for the testhearing aids was 61.8% for theomnidirectional mode and 38.2% for thedirectional mode. This pattern reflectedsomewhat less use of the omnidirectionalmode (and greater use of the directional mode)than for the participants’ own hearing aids(73.2% and 26.8%, respectively). Inspection ofthe data for individual participants revealeda diverse pattern of usage, ranging from oneparticipant who reported using theomnidirectional mode 95% of the time to twoothers who reported using the directionalmode 90% of the time. Further, it did notappear that the default mode had a significantinfluence on the use pattern. Average use ofthe omnidirectional mode was 65.0% for theeight participants for which the default settingwas the omnidirectional mode, compared to58.9% for the nine participants for which thedefault setting was the directional mode.
DISCUSSION
Descriptions of Everyday ListeningSituations
To the extent that the 17 participants ofthis study are representative of the broaderpopulation of hearing-impaired adults, the1599 listening situations encountered anddescribed by the participants of this studyduring the field trial provide a representationof the everyday listening environments ofthese patients. Because the primary purposeof this study was to determine the extent towhich microphone mode preferences ineveryday living could be predicted from thecharacteristics of the listening environment,descriptions of the listening environmentswere in terms of variables thought to
influence preferences for omnidirectional anddirectional microphones. However, these fivevariables (presence/absence of backgroundnoise, signal location, signal distance,reverberation, location of noise) are known toinfluence hearing aid performance and benefitin general (see, for example, Nabelek andMason, 1981).
Perhaps the first observation that may bemade about the everyday listeningenvironment of hearing-impaired adults isthat it is perceived to be noisy. Backgroundnoise was reported to be present in themajority of the 1599 listening situationsencountered by the participants (see Figure5). Further, of the total active listening timedocumented by the participants, 61.8% wascharacterized as noisy and only 38.2% asrelatively quiet (see Figure 7). It is welldocumented that hearing aids generallyprovide greater benefit under relatively quietlistening conditions, compared to less favorablesignal-to-noise ratios (SNR; see, for example,Walden et al, 2000). This is especially true forthe relatively high input levels that oftencharacterize noisy listening situations whereaudibility contributes little to the reduction inspeech understanding. In such listeningenvironments, performance with hearing aids(at least those with only an omnidirectionalmicrophone) may be no better than unaidedperformance for many patients. Given thelimited ability of omnidirectional microphonehearing aids to improve speech understandingin background noise, there is little wonderthat difficulty communicating in noisylistening situations is a common complaint ofhearing aid wearers, and an important reasonfor the less than optimal acceptance and useof hearing instruments among the hearing-impaired population (Kochkin, 2002).
Clearly, in most listening situationsencountered in daily living, the signal sourceis located in front of the listener. In allprobability, this simply reflects the tendencyfor listeners to position themselves in front ofa signal source whenever possible. We tend toface a talker when in conversation withanother person, sit in front of the television,face the loudspeakers when listening to music,and so forth. Yet, in 20% of listening situations,and for a quarter of all active listening time,the listener does not (or cannot) face the signalsource, for example, when riding in anautomobile or sitting at a conference table.Obviously, such listening situations present
Microphone Preference/Walden et al
387

a particular challenge to hearing aidperformance, especially for devices equippedwith directional microphones. For the vastmajority (approximately 83%) of listeningsituations encountered in daily life, the signalsource is relatively close to the listener, thatis, within ten feet. It should be noted that thedistinction between “near” and “far” (≤10 feet,≥11 feet, respectively) was based on thefindings of Surr et al (2002). It is unlikely thatthis distinction corresponds to the criticaldistance (the distance for which direct andreflected sound pressures are equal and,therefore, directional microphones may beminimally effective; Ricketts and Mueller,1999) in most everyday listeningenvironments. Regardless, in those noisylistening situations where the signal sourceis relatively far away, aided performance islikely to suffer. Obviously, the efficiency ofdirectional microphones will diminish inreverberant environments as the distancefrom the signal source is increased. However,it is likely that aided performance withstandard omnidirectional microphones willsuffer as well. Although talkers will oftenraise their voices in background noise whenthe listener is at a distance, it is still likely thatthe SNR at the listener ’s ear will getprogressively poorer as the distance betweentalker and listener increases, assuming thatthe source of the background noise is spatiallyseparated from the signal source. Hence, it isreasonable to expect that the perceived benefitof hearing aids in background noise will belimited when the signal is located at adistance, whether or not the instruments areequipped with directional microphones.
Slightly more listening situationsencountered by the participants in daily livingwere categorized as low reverberant than ashigh reverberant. Similarly, participantsreported the average length of time spent inlow-reverberant environments to be slightlylonger than for high-reverberant environments(see Figure 6). Recall that the distinctionbetween low and high reverberation was madeindirectly, based on the characteristics of thelistening environment, primarily the size of theroom and/or whether or not it was carpeted.Hence, some measurement error in thisvariable is inevitable. Still, it does not appearthat one or the other category of listeningenvironments is encountered predominantlyin everyday listening. It is well known thathigh levels of reverberation have a deleterious
effect on speech understanding and may limitbenefit from amplification (see, for example,Walden et al, 1998, 1999). Further,reverberation may limit the efficiency ofdirectional microphones because of reflectedsound energy. To the extent that relativelyhigh reverberation may limit hearing aidperformance, the data of this study suggestthat it is a commonly occurring condition ineveryday listening, both in terms of thefrequency with which such listening situationsare encountered and the amount of time spentin these listening situations.
Results for the fifth environmentalvariable explored in this study—location of thebackground noise—suggest that the noisesource is rarely located directly in front ofthe listener. Rather, in most noisy listeningsituations, the source of the noise comesprimarily from the sides or back or, mostcommonly, is all around in the environment(see below). The primary determinant in thelistener’s ability to understand speech is theSNR delivered to the ear. In hearing aidswith directional microphones, some spatialseparation of the signal and noise sources inthe listening environment is necessary foran improved SNR in the directional mode.From the perspective of this environmentalvariable, the most problematic listeningsituations are those where the signal andnoise come from the same location.Fortunately, it appears that this conditionoccurs relatively infrequently in everydaylistening. However, it is also probably thecase that the noise is all around in most noisylistening situations, rather than localized toone specific location to the sides or behind thelistener. The participants of this studyperceived the noise to be “all around” in 762(75.7%) of the 1006 listening situations inwhich noise was present, rather than in frontof, to the side of, or behind them. Given thatthe Canta750D defaults to a hypercardioidpolar response when the adaptive algorithmcannot detect a noise peak to the sides orbehind the listener, this polar response mayhave been activated in the majority of noisylistening environments encountered by theparticipants in daily living.
Table 3, which combines the frequency ofoccurrence data of Table 1 with the length oftime data of Table 2, provides some of thepotentially most useful data from this study.Four of the 24 PLS (PLS3, PLS1, PLS17,PLS18) accounted for 57.4% of the
Journal of the American Academy of Audiology/Volume 15, Number 5, 2004
388

participants’ active listening time. Each ofthese PLS involves the signal in front of andrelatively near to the listener. The first twoalone (PLS3, PLS1) accounted for nearly one-third of all active listening time. Backgroundnoise was present in both cases. In the othertwo frequently occurring PLS (PLS17,PLS18), accounting for approximately 25% ofall active listening time, background noisewas absent. Given that the latter two typesof listening situations are relatively easy forhearing aid wearers (see Figure 10), itappears that considerable benefit to thepatient can be achieved by improving speechunderstanding when the talker is located infront of and relatively near to the listener andbackground noise is present and spatiallyseparated from the talker. Fortunately, theseare the environmental conditions in whichdirectional microphones should be especiallyeffective.
Microphone Preferences
Traditional wisdom holds that the defaultsetting for hearing aids equipped withswitchable omnidirectional/directionalmicrophones should be the omnidirectionalmode, and the hearing aid should be switchedinto the directional mode only occasionallywhen environmental circumstances warrant.The implication is that the device will be inthe omnidirectional mode most of the time.Cord et al (2002), in fact, found that patientsfit with switchable omnidirectional/directionalhearing aids reported, on average, that theyused their hearing aids set in the directionalmode only 22.3% of the time. The results ofthe current study suggest that, on average, thedirectional mode will be preferred in one-third of all listening situations encountered,and the omnidirectional mode will be preferredin approximately 37% of everyday listeningsituations. In approximately 30% of everydaylistening situations, neither microphone modewill be preferred. Given that theomnidirectional and directional modes werepreferred in relatively similar percentages ofeveryday listening situations, based on thesedata alone, it might be argued that eithermicrophone mode could serve as the defaultsetting. Later in this discussion, however, itwill be argued that the omnidirectional modeis probably the more suitable default setting.
Clearly, microphone mode preferencesdepended on the acoustic characteristics of the
listening environment (see Figure 8). That isto say, the overall distribution of microphonemode preferences across all 1599 listeningsituations was not maintained for each of the24 PLS. Rather, the preferred microphonemode varied systematically with thecharacteristics of the listening environment.This finding is a prerequisite for developingeffective strategies for setting the hearingaid in the optimal microphone mode based onan analysis of the listening environment.
Model Predictions
The primary purpose of this study was todetermine the extent to which the microphonemode (omnidirectional vs. directional)generally preferred by hearing-impairedpatients in a given listening situation ispredictable from the characteristics of thatenvironment. As has been previously noted,the everyday listening situations encounteredby hearing-impaired persons are virtuallyinfinitely variable. In order to bring somestructure to the task, five binaryenvironmental variables, which were assumedto influence microphone performance, wereused to create 24 PLS. These are assumed torepresent, at least to a first approximation, therange of everyday listening situationsencountered in daily living.
When the influence of the five variablesis considered separately (see Figure 9), it isapparent that the effect of each binarycondition (noise present vs. absent, signalfront vs. other, etc.) is not symmetrical. Thatis to say, the histograms for theomnidirectional and directional modesbetween the binary conditions of a givenvariable are not reciprocals of each other.Thus, for example, although there is a distinctgeneral preference for the omnidirectionalmode when background noise is absent,preference for the directional mode whenbackground noise is present is less distinct.Similarly, there is a distinct generalpreference for the omnidirectional mode whenthe signal is located other than in front, butno preference for the directional mode whenthe signal is in front. A similar pattern isobserved for signal distance, where theomnidirectional mode is clearly preferredwhen the signal is relatively far from thelistener, but only a slight general preferenceof the directional mode when the signal isrelatively near. Perhaps the one exception to
Microphone Preference/Walden et al
389
this trend is for the background noise locationvariable. Here, there is a small preference forthe omnidirectional mode (compared to thedirectional mode) when the noise is locatedin front of the listener, and a slightly greaterpreference for the directional mode when thenoise is located other than in front.
The overall impression created by themicrophone preference data for the fiveenvironmental variables considered separatelyis that preference for the omnidirectionalmode may be more easily predicted from asingle characteristic of the environment thanpreference for the directional mode. It is onlywhen several environmental conditions existsimultaneously that a strong directionalpreference will exist. Consequently, the Figure9 data suggest that it may be more importantfor the hearing aid to be set in theomnidirectional mode in listening situationsthat generally favor an omnidirectionalmicrophone than for it to be set in thedirectional mode when one or twoenvironmental conditions generally favordirectional microphones. From thisperspective, a conservative switching strategyof “when in doubt, stay in omnidirectional”would appear appropriate. This finding, incombination with the frequency with whichno microphone preference is expressed indaily listening situations, suggests that theomnidirectional mode is the appropriatedefault setting, and the device should switchto the directional mode only when thecharacteristics of the listening environmentwarrant it.
The microphone preference data for eachof the 24 PLS (see Figure 8 and Table 4)generally support these conclusions. Only threePLS were identified in which there was asignificant preference for the directional mode,whereas nine PLS significantly favor theomnidirectional mode. However, as has beenpreviously noted, the three PLS favoring thedirectional mode (PLS1, PLS2, PLS3)accounted for more than one-third of the activelistening time of the participants in this study(see Table 3). Therefore, although theomnidirectional mode again appears to be theappropriate default setting for most patients,it is critically important that the device switchto the directional mode when environmentalconditions favor it.
Of the five environmental variablesexamined in this study, three appear mostuseful in determining when the device
should switch to the directional mode:presence/absence of background noise, signallocation, and signal distance. Knowledge ofonly these three environmental variablesprovides a guide for wearers of switchableomnidirectional/directional hearing aids.Specifically, the results of this study suggestthat the device should be switched to thedirectional mode when background noise ispresent, the signal source is located in front ofthe listener, and the signal source is relativelynearby, roughly ten feet or less. Following thissimple strategy, the hearing aid will be set inthe less preferred microphone mode only in onetype of listening situation (PLS4)—whenbackground noise is present, the signal sourceis in front and near, and reverberation is highand the background noise is located in front ofthe listener. However, because the participantsspent only about 2% of their active listeningtime in such listening situations, which wererated easiest of all the PLS involvingbackground noise (see Figure 10), the overallimpact of this error would seem to be minimalfor most patients.
The significant influence of signal distanceon microphone preferences deserves additionalcomment. Discussions in the literature of theeffects of signal distance on directionalmicrophone performance generally focus onreverberation and the critical distance from thesignal source in a particular listeningenvironment where the direct and reflectedsound pressures are equal (see, for example,Ricketts and Henry, 2002). As the distancebetween the signal source and the listenerincreases, the intensity of the reflected energyarriving at the hearing aid in relation to thedirect energy increases. At the critical distance,direct and reflected energy are equal.Directional hearing aid technology dependson, among other things, a greater proportionof direct energy than reflected energy arrivingat the front microphone. Directionalmicrophones may be expected to provide benefitgenerally in near-field listening environments.Recall that the “critical distance” observed bySurr et al (2002) in our earlier field study ofdirectional benefit was approximately 10–11feet. Directional microphones generallyappeared to provide significant benefit withinthis distance, but less so for greater distances.Although the critical distance is dependent onthe size of the room, as well as the amount ofreverberation present, it is likely that criticaldistance in most listening environments
Journal of the American Academy of Audiology/Volume 15, Number 5, 2004
390

encountered by hearing-impaired persons issomewhat less than ten feet. It appearspossible, therefore, that the influence of signaldistance on microphone preferences observedin this study might involve more than simplythe influence of reverberation. In addition tochanges in the ratio of direct to reflected soundenergy, there are other acoustic effects ofincreasing the distance of the listener fromthe signal source. The most obvious is decreasedintensity due to the inverse square law. Also,as has already been suggested, it is likely thatthe SNR in a noisy listening environment isgenerally poorer as the distance between thesignal source and listener increases because thelistener will typically be closer to the source(s)of the background noise, except in thoserelatively rare listening environments wherethe signal and noise sources are coming fromthe same location.
Although full compensation of the normal6 dB/octave roll-off in frequency responseimposed by directional microphones was usedin this study, participants frequently observedthat overall output seemed lower when thedevice was in the directional mode. Althoughfull compensation in the directional modeequates the frequency responses of the twomicrophone modes for signals presented fromthe front (see Figure 3), it does not equate forthe effects of the nulls in the polar responsecreated by the directional processing. Hence,overall output in the directional mode mayoften be lower than in the omnidirectionalmode, and overall audibility could be affected.This may explain why there was a ratherdistinct preference for the omnidirectionalmode when the signal source was far from thelistener but a somewhat less distinct preferencefor the directional mode when the signal sourcewas relatively near.
Difficulty of Listening Situations
The difficulty rating data provide agenerally encouraging representation of the performance of the switchableomnidirectional/directional hearing aids likethe one used in this study. Participants ratednearly 80% of the listening situations thatthey encountered as relatively easy whilewearing the device in the preferred mode,including many listening situations wherebackground noise was present. Yet, as expected,noisy listening situations remained moredifficult on average than quiet environments.
Generally, the mean difficulty ratings accordingto the five environmental variables (see Figure11) were as expected; that is, background noiseabsent was easier than background noisepresent; signal sources located in front of thelistener were easier than those located otherthan in front; signals located relatively near tothe listener were easier than those locatedfarther away; and low-reverberationenvironments were easier than high-reverberation environments. The meandifficulty ratings for listening situationsgrouped according to background noise locationwere, perhaps, less intuitive. On average,listening situations where the noise sourcewas located in front of the listener (and,therefore, most often coming from the samelocation as the signal source) were rated aseasier than situations where the noise sourcewas located other than in front. Given thatdirectional microphones generally cannotimprove the SNR (compared to theomnidirectional mode) when the noise sourceis located in front, one might have expectedsuch situations to be more difficult than thosein which there was spatial separation of thesignal and noise sources. Although anexplanation for this finding is not apparent inthe data, it may be that the SNR at thelistener’s ear is generally more favorable whenthe signal and noise sources are both at thesame location in the listening environment. If,for example, a talker is speaking very near aloud noise source, she or he is likely to speaklouder to be heard, thereby improving the SNRat the listener’s ear. In contrast, when thenoise source is spatially separated from thetalker (and, therefore, closer to the listener), thetalker may be less likely to raise his/her voiceas much to be heard over the noise. Althoughdirectional microphones may improve the SNRslightly under such circumstances, the averageimprovement may be less than that resultingfrom the increased vocal effort that occurswhen the talker is closer to the noise source.
Notwithstanding this interpretation, thedifficulty data clearly suggest that thedirectional microphones made certain listeningsituations easier for the participants. The meandifficulty rating for listening situations wherethere was a significant preference for thedirectional mode revealed less difficulty thanfor listening situations where there was nopreference for either microphone mode (seeFigure 12). Inspection of the PLS where neithermicrophone mode provided superior
Microphone Preference/Walden et al
391

performance (see Table 4) reveals thatbackground noise was present in four of thesesix cases (PLS7, PLS9, PLS11, PLS15). Of these,PLS7, PLS11, and PLS15 tended to be the mostdifficult listening situations for the participants(see Figure 10). Two of these involve the signalsource being located relatively far from thelistener, and all three involve relatively highreverberation. To improve aided performancein background noise, therefore, it appears thatthe related issues of signal distance andreverberation must be addressed. Fortunately,however, such listening situations appear toconstitute a rather small percentage of theactive listening time of hearing-impairedpatients (see Table 3). In this regard, the “goodnews” from the difficulty rating data is that thetwo PLS (PLS3, PLS1) that account for thegreatest percentage of active listening time(31.8%) were rated among the easiest, onaverage, of the PLS involving backgroundnoise. Further, these most frequentlyencountered listening situations were ratedas not much more difficult, on average, thanthose PLS where background noise was absent.It appears clear, therefore, that the directionalmode can provide significant benefit in preciselythose listening situations where it is mostimportant to do so.
Microphone Mode Use Pattern
Although participants were required toswitch between the omnidirectional and thedirectional modes in every listening situationencountered during those periods of the trialwhen HAULassignments were being completed,during approximately three-quarters of themonth-long trial they were free to use the devicesas they wished. On average, participantsreported using the hearing aids set in theomnidirectional mode the majority of the time(61.8%). This finding is generally consistentwith an earlier study (Cord et al, 2002), whichfound that patient’s fit with switchableomnidirectional/directional hearing aids reportedusing the omnidirectional mode approximately78% of the time. Obviously, somewhat greateruse of the directional mode was observed in thecurrent study (38.2%) than was observed inCord et al (22.3%), which involved patients fitwith devices from a variety of manufacturers,as long as 24 months preceding theirparticipation in the study. It is notable that theaverage time that patients used the test hearingaids in the directional mode during the timewhen they were not completing HAUL
assignments (38.2%) was roughly similar to thecombined active listening time for the threePLS for which there was a significant preferencefor the directional mode (34.5%). In this regard,it must be recalled that the participants didnot explicitly know the nature of the signalprocessing provided by programs #1 and #2.The similarity of these numbers suggests that,with experience, patients are able to determinewhen directional microphones will be of benefitand appropriately set their hearing aids in thatmode, consistent with the findings of Cord et al.
Although the average microphone modeuse data lend themselves to the interpretationsabove, perhaps the most striking characteristicof these data is the variability acrossparticipants. When not completing HAULassignments, some participants used theomnidirectional mode almost exclusively,whereas other participants used primarily thedirectional mode. There are several possiblesources of this variability. First, persons withimpaired hearing likely vary in their ability tomake use of the directional processing.Consistent with this view, laboratory studieshave shown that directional benefit variessignificantly across listeners (Ricketts andMueller, 2000). Notably, Cord et al (2004) foundthat the size of the directional advantageobtained in a laboratory setting had littlepredictive relationship with success in everydaylistening with directional microphone technology.
Another possible source of variability inthe use of the directional mode amongparticipants is that they may have varied in theirunderstanding of the environmental conditionsthat would favor either program #1 or program#2 use. If some participants did not learn whenit was appropriate to activate one mode or theother, they may have simply relied on one modeand rarely switched to the other. However, suchan explanation is inconsistent with the data ofCord et al (2002), as well as the similarity in thisstudy of the average use of the directional mode(38.2%) with the average active listening timein listening environments in which directionalprocessing should be effective (34.5%). Further,that the default setting did not seem to have amajor influence on the use pattern of themicrophone modes argues against the possibilitythat many of the participants did not discoverwhen to activate the directional mode. Forexample, the DIR mode was the default settingfor the participant who reported usingomnidirectional mode 95% of the time. Thisindividual, therefore, appears to prefer theomnidirectional mode in most everyday listening
Journal of the American Academy of Audiology/Volume 15, Number 5, 2004
392

situations that he encounters. Thisinterpretation is consistent with his use of theomnidirectional mode 90% of the time with hisown hearing aids.
Another possible cause of the variability inmicrophone mode use pattern acrossparticipants is individual differences in theinfluence of the environmental variables onmicrophone performance. If, for example, thepatient’s audiogram significantly affected theinfluence of background noise, signal location,and so forth on microphone mode performance,variability in their use pattern could result. Itseems unlikely, however, that this might explainmost of the variability. First, the participantsin this study were relatively homogeneous interms of standard audiometric variables.Further, Ricketts and Mueller (2000) did not finda predictive relationship between audiometricvariables and the magnitude of the directionaladvantage in a test booth environment.
Clearly, some patients encounter listeningsituations in which directional microphonesshould provide a performance advantage moreoften than other patients. Such differences ineveryday listening environments should alsoresult in variability in microphone use. Althoughit certainly can be argued that directionalmicrophones benefit patients who use theminfrequently but appropriately, patients whofrequently encounter listening environmentswhere directional microphones can functioneffectively should profit more from thistechnology.
It should be noted that a single make andmodel hearing aid, utilizing a specific type ofdirectional processing (adaptive directionality),was utilized in this study. Ricketts (2000) showedthat all commercially available directionalhearing aids do not perform the same.Consequently, some specific differences in resultsmight be expected, should the study be repeatedwith different instruments. It seems likely,however, that the general effects of theenvironmental variables discussed here wouldbe similar across a variety of current directionaltechnology. Finally, although the results of thisstudy provide insight into the performance ofdirectional processing in everyday listeningenvironments, the effects of other signalprocessing techniques, such as noise cancellation,require similar study.
CONCLUSIONS
The results of this study suggest that, for theaverage adult with impaired hearing, the
majority of active listening time in daily living isin the presence of background noise. Additionally,the vast majority of daily listening time is typicallywith the signal source located in front of andrelatively close to the listener, and with thebackground noise source spatially separated fromthe signal source, that is, not coming from the samelocation in the listening environment. Each ofthese environmental conditions should beconducive to effective directional microphonesignal processing. With current directionalmicrophone technology, the directional modeshould be activated when background noise ispresent and the signal source is located in frontof and is within approximately ten feet of thelistener. For the typical adult, this will constituteabout one-third of all active listening time. Underother environmental conditions, theomnidirectional mode should be used. Performancein some noisy listening environments will notimprove significantly from the processing providedby current directional microphone hearing aids.These typically involve listening with the signalsource located at a distance and in the presenceof high levels of reverberation.
Although these general guidelines mayprovide a useful strategy for setting switchableomnidirectional/directional hearing aids in thepreferred microphone mode, there will be instanceswhere they will not result in the preferredmicrophone setting. Even for PLS wherestatistically significant differences were observedbetween the two microphone modes, preferencesfor both microphone modes occurred (see Figure8). Following these guidelines should increasethe likelihood that the hearing aid will be set inthe preferred mode; however, it does not insureit. Hence, when less than satisfactory performanceis obtained, patients should be encouraged toswitch microphone modes.
Considerable variability exists acrossindividuals in the listening environmentsfrequently encountered and the improvement inspeech understanding in noise that is obtainedfrom a given amount of directional processing. Itis also likely that the opportunity and/orwillingness to change difficult listening situationsto favor directional microphones vary acrossindividuals. Therefore, these factors should beassessed clinically to determine the potentialbenefit of directional microphone technology forindividual patients.
Acknowledgment. This work was sponsored by GNReSound, Taastrup, Denmark, through a CooperativeResearch and Development Agreement with the ClinicalInvestigation Regulatory Office, United States Army
Microphone Preference/Walden et al
393

Medical Department, Ft. Sam Houston, TX. Local mon-itoring of the study was provided by the Departmentof Clinical Investigation, Walter Reed Army MedicalCenter, Washington, DC, under Work Unit No. 02-25004. All persons included in this study volunteeredto participate and provided informed consent. The opin-ions and assertions presented are the private views ofthe authors and are not to be construed as official oras necessarily reflecting the views of the Departmentof the Army, the Department of Defense, or GN ReSound.Parts of the work reported here were presented at the2003 annual convention of the American Academy ofAudiology, San Antonio, TX. The technical assistanceof Laurel Olson, Van Summers, and Ken Grant is grate-fully acknowledged.
NOTES
1. Although participants completed logs only one-third of each day over a three-week period, this analy-sis describes the average number of minutes per dayaccounted for by the logs as if participants recordedtheir active listening encounters in seven full days.
2. Statistical tests were conducted with alpha setto .10, rather than the more traditional .05 level ofsignificance. Although this is a less stringent statis-tical test in terms of Type I error (i.e., concluding thata distribution is significantly different from the over-all distribution when it is not), it reduces the likeli-hood of a Type II error (i.e., concluding that a distri-bution is the same as the overall distribution, whena significant difference exists).
REFERENCES
Amlani AM. (2001) Efficacy of directional microphonehearing aids: a meta-analytic perspective. Am J Audiol2:202–214.
Cord MT, Surr RK, Walden BE, Dyrlund O. (2004)Relationship between laboratory measures of direc-tional advantage and everyday success with directionalmicrophone hearing aids. J Am Acad Audiol15:353–364.
Cord MT, Surr RK, Walden BE, Olson L. (2002)Performance of directional microphone hearing aidsin everyday life. J Am Acad Audiol 6:295–307.
Hawkins DB, Yacullo WS. (1984) Signal-to-noise ratioadvantage of binaural hearing aids and directionalmicrophones under different levels of reverberation.J Speech Hear Disord 49:278–286.
Jerger J. (1970) Clinical experience with impedanceaudiometry. Arch Otolaryngol 92:311–324.
Killion M, Schulien R, Christensen L, Fabry D, RevittL, Niquette P, King C. (1998) Real world performanceof an ITE directional microphone. Hear J 51:24–26,30, 32–36, 38.
Kochkin S. (2000) Customer satisfaction with singleand multiple microphone digital hearing aids. HearRev 7:24–34.
Kochkin S. (2002) Consumers rate improvements soughtin hearing instruments. Hear Rev 9:18–20, 22.
Leeuw AR, Dreschler WA. (1991) Advantages of direc-tional hearing aid microphones related to roomacoustics. Audiology 30:330–344.
Madison TK, Hawkins DB. (1983) The signal-to-noiseratio advantage of directional microphones. HearInstrum 34:18, 49.
Nabelek AK, Mason D. (1981) Effect of noise and rever-beration on binaural and monaural word identificationby subjects with various audiograms. J Speech HearRes 24:375–383.
Nielson HB, Ludvigsen C. (1978) Effect of hearing aidwith directional microphones in different acoustic envi-ronments. Scand Audiol 7:217–224.
Nilsson M, Soli SD, Sullivan JA. (1994) Developmentof the Hearing in Noise Test or the measurement ofspeech reception thresholds in quiet and in noise. JAcoust Soc Am 95:1085–1099.
Preves DA, Sammeth CA, Wynne MK. (1999) Fieldtrial evaluations of a switched directional/omnidirec-tional in-the-ear hearing instrument. J Am Acad Audiol10:273–284.
Ricketts TA. (2000) Impact of noise source configura-tion on directional hearing aid benefit and performance.Ear Hear 21:194–205.
Ricketts TA. (2001) Directional Hearing Aids. TrendsAmplification 5:139–176.
Ricketts TA, Dahr S. (1999) Aided benefit across direc-tional and omni-directional hearing aid microphonesfor behind-the-ear hearing aids. J Am Acad Audiol10:180–189.
Ricketts TA, Henry P. (2002) Evaluation of an adap-tive, directional-microphone hearing aid. Int J Audiol41:100–112.
Ricketts TA, Mueller HG. (1999) Making sense of direc-tional microphone hearing aids. Am J Audiol 8:117–127.
Ricketts TA, Mueller HG. (2000) Predicting directionalhearing aid benefit for individual listeners. J Am AcadAudiol 11:561–569.
Studebaker G, Cox RM, Formby C. (1980) The effectof environment on the directional performance of head-worn hearing aids. In: G. Studebaker and I Hochberg,eds. Acoustical Factors Affecting Hearing AidPerformance. Baltimore: University Park Press.
Surr RK, Walden BE, Cord MT, Olson L. (2002)Influence of environmental factors on hearing aid micro-phone preference. J Am Acad Audiol 6:308–322.
Valente M, Fabry DA, Potts LG. (1995) Recognition ofspeech in noise with hearing aids using dual micro-phones. J Am Acad Audiol 6:440–449.
Walden BE, Surr RK, Cord MT, Edwards B, Olson L.(2000) Comparison of benefits provided by differenthearing aid technologies. J Am Acad Audiol 11:540–560.
Walden BE, Surr RK, Cord MT, Pavlovic CV. (1998) Aclinical trial of the ReSound BT2 Personal HearingSystem. Am J Audiol 7:85–100.
Walden BE, Surr RK, Cord MT, Pavlovic CV. (1999)A clinical trial of the ReSound IC4 hearing device.Am J Audiol 8:65–78.
Journal of the American Academy of Audiology/Volume 15, Number 5, 2004
394

APPENDIX
Everyday Listening Situations withinEach PLS
PLS1 (BN Present, Signal Front,Signal Near, Reverberation Low, BNLocation Other)
1. Listening to music on radio while driving car.
2. Ordering food at McDonald’s drive-through window.
3. Talking with coworker in parking lot.
PLS2 (BN Present, Signal Front,Signal Near, Reverberation Low, BNLocation Front)
1. Helping wife on computer.2. Seated in car, talking to someone out
the car window.3. Meeting with coworkers in computer
area; seated with back to wall.
PLS3 (BN Present, Signal Front, SignalNear, Reverberation High, BNLocation Other)
1. Talking with friend in subway station.2. Talking with gym instructor in
gymnasium.3. Talking with clerk at large home-
improvement store.
PLS4 (BN Present, Signal Front,Signal Near, Reverberation High, BNLocation Front)
1. Having blood drawn in blood lab; seated with back to wall.
2. Talking with coworker in small, uncarpeted office; noise from hallway behind coworker.
3. Talking to motel desk clerk, printer running behind her.
PLS5 (BN Present, Signal Front,Signal Far, Reverberation Low, BNLocation Other)
1. Talking to someone on busy city street (traffic noise).
2. Husband reading out loud from across the room with TV on.
3. Talking with merchant at farmer’s market.
PLS6 (BN Present, Signal Front,Signal Far, Reverberation Low, BNLocation Front)
None
PLS7 (BN Present, Signal Front,Signal Far, Reverberation High, BNLocation Other)
1. Trying to hear person in a crowded golf course clubhouse before a tournament.
2. Listening to minister during church reception.
3. Talking with person at the laundromat.
PLS8 (BN Present, Signal Front,Signal Far, Reverberation High, BNLocation Front)
1. Watching TV on kitchen counter and conversing with wife in kitchen while having breakfast at kitchen table.
2. Talking with waiter in restaurant, seated with back to wall.
3. Listening for number to be called in busy hospital pharmacy.
PLS9 (BN Present, Signal Other,Signal Near, Reverberation Low, BNLocation Other)
1. Driving car while in conversation with three family members.
2. Conversation seated next to friend while riding on subway train.
3. Monitoring computers and phones at work while listening to TV.
PLS10 (BN Present, Signal Other,Signal Near, Reverberation Low, BNLocation Front)
1. Conversation seated beside husband on bench with back to wall, while waiting outside car inspection station.
2. Driving car and talking with passenger in front seat, radio on.
3. At softball game, talking with other spectators.
PLS11 (BN Present, Signal Other,Signal Near, Reverberation High, BNLocation Other)
1. Conversation with family member at a Chuck E. Cheese restaurant.
2. Bridge party with 12 people.3. In barber shop, talking with barber
while having hair cut.
PLS12 (BN Present, Signal Other,Signal Near, Reverberation High, BNLocation Front)
1. Lion’s Club meeting—presiding over meeting and listening to speaker while seated facing audience.
Microphone Preference/Walden et al
395

Journal of the American Academy of Audiology/Volume 15, Number 5, 2004
2. In kitchen washing dishes, wife talking from behind.
3. Listening to radio while working at computer in basement study.
PLS13 (BN Present, Signal Other,Signal Far, Reverberation Low, BNLocation Other)
1. Listening to nature sounds in arboretum with people walking around.
2. Talking to husband while working in yard with dog barking next door.
3. On golf course with three friends.
PLS14 (BN Present, Signal Other,Signal Far, Reverberation Low, BNLocation Front)
1. Three-way conversation in driveway; one person in car with engine running.
2. Seated at a large conference table; several people talking at once.
PLS15 (BN Present, Signal Other,Signal Far, Reverberation High, BNLocation Other)
1. Cleaning up kitchen while discussing the day’s plans with family.
2. In kitchen washing dishes and listening to TV in next room.
3. Listening to the radio while cleaning the basement.
PLS16 (BN Present, Signal Other,Signal Far, Reverberation High, BNLocation Front)
None
PLS17 (BN Absent, Signal Front,Signal Near, Reverberation Low)
1. Listening to music CD on computer while reading e-mail.
2. Having dinner at home with wife.3. Watching a movie on TV in living room.
PLS18 (BN Absent, Signal Front,Signal Near, Reverberation High)
1. Listening to teacher in Spanish class with two other students.
2. Speaking with veterinarian at animal clinic.
3. Conversation with doctor in examination room.
PLS19 (BN Absent, Signal Front, SignalFar, Reverberation Low)
1. Conversation with family member at the park.
2. Talking with wife seated across the living room.
3. Talking with friend on practice green at golf course.
PLS20 (BN Absent, Signal Front,Signal Far, Reverberation High)
1. Talking to spouse in basement.2. Listening to minister during church
service.3. Listening to string quartet in
auditorium.
PLS21 (BN Absent, Signal Other,Signal Near, Reverberation Low)
1. Talking with two family members on patio.
2. Driving car and listening to conversation between spouse and friend.
3. Overhearing conversation in doctor’s waiting room.
PLS22 (BN Absent, Signal Other,Signal Near, Reverberation High)
1. In kitchen looking out window, wife talking from behind.
2. Searching for something in basement with wife.
3. Conversation with wife while both moving about kitchen.
PLS23 (BN Absent, Signal Other,Signal Far, Reverberation Low)
1. Talking with wife from another room in the house.
2. Playing golf with three friends.3. Listening to sounds of nature while
working in garden.
PLS24 (BN Absent, Signal Other,Signal Far, Reverberation High)
1. Cooking breakfast and talking with wife seated at kitchen table.
2. Listening to talker at meeting with 20 attendees while seated at large rectangular table.
3. Listening to choir and organ in church balcony.
396