illustrative example of the effects of wdrc on short …
TRANSCRIPT
Ear and Hearing Supplement to Alexander and Masterson “Effects of WDRC release time and number of channels on output SNR and speech recognition”
1
ILLUSTRATIVE EXAMPLE OF THE EFFECTS OF WDRC ON SHORT-TERM SPEECH AND MASKER LEVELS
Using the prescriptive fitting parameters for a listener with a hearing loss representative of the group
mean (Listener 13 in Table I), the sentence “A tusk is used to make costly gifts” was processed with the 6
combinations of RT and number of channels at 0 dB input SNR. The phase inversion technique was used to
extract the processed speech and masker signals. The extracted signals for the different processing conditions
were compared with another to better understand how they affect the short-term output levels and
consequently influence perception. Most of the level differences in the processed signals between conditions
occurred at high frequencies, where nonlinear amplification was greatest for this particular example. Therefore,
illustrative examples for the band centered at 8000 Hz are shown in Figures S1 – S6, which compare the 1/3-
octave band levels using a 20-ms Hann window with 50% overlap. The effects that will be described also apply
to lower frequencies to varying extents depending on the amount of nonlinear gain and the input SNR. Figures
S1 and S2 plot the speech and steady masker levels for 4- and 16-channel WDRC, respectively, using solid black
(speech) and dotted gray (masker) lines. Output levels for the long and short RT are plotted in panels (a) and
(b), respectively, and differences between the two are plotted in panel (c), along with the differences in short-
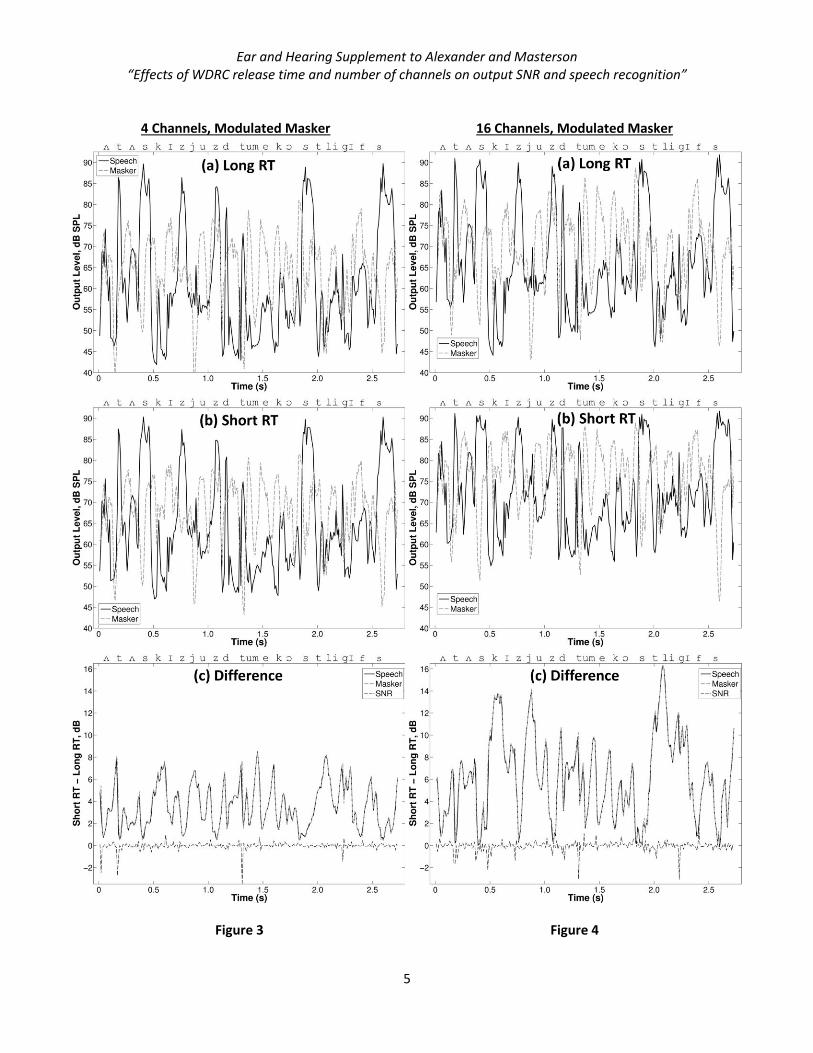
term SNR (light dotted black line). Output levels with the modulated maskers are plotted in the same way for 4-
and 16-channel WDRC in Figures S3 and S4, respectively. A phonetic transcription of the speech at each time
segment is shown at the top of the panels. Consistent with the ANOVA results from the main study, levels for
both the speech and maskers in each example were higher for the short RT than for the long RT, in part because
the short RT allowed gain in the high-frequency channel to recover more quickly for lower-intensity segments
after going into compression for the fricatives /s/ and /z/ and the intense bursts of the stops /t/ and /d/.
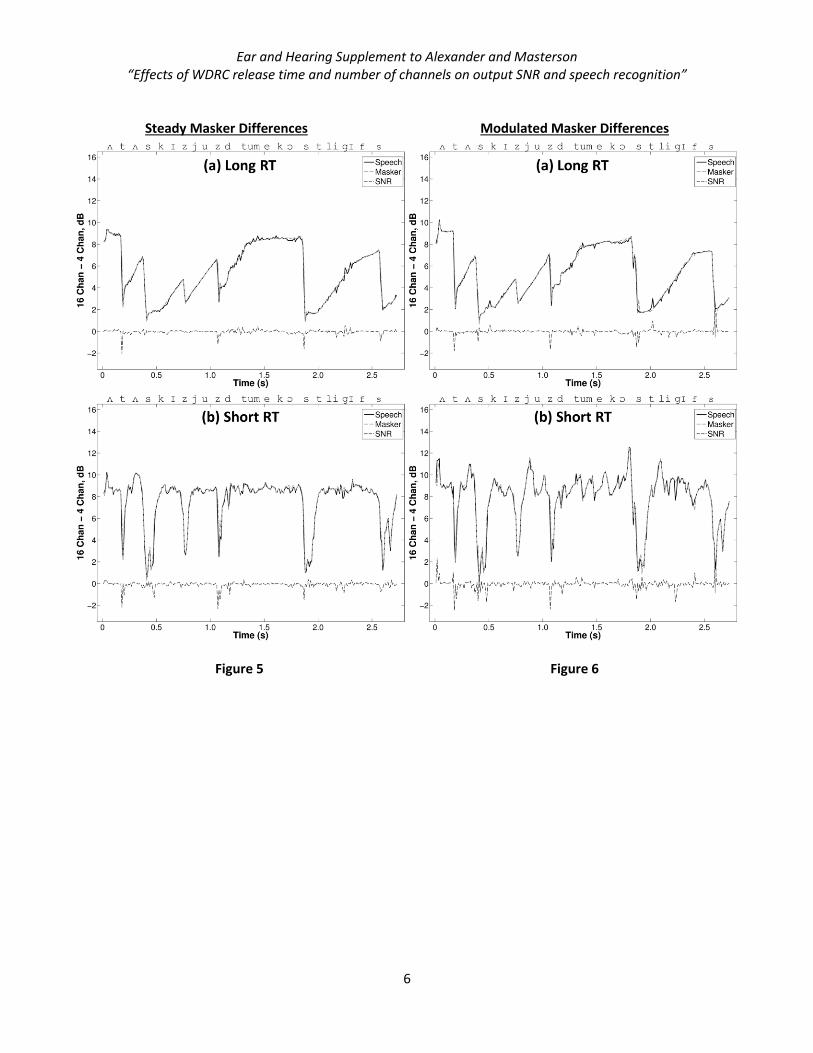
For the steady and modulated maskers, respectively, Figures S5 and S6 compare the level differences for
16- and 4-channel WDRC for the long RT (panel a) and the short RT (panel b). As shown, speech and masker
levels increased as the number of channels increased, especially following the fricatives and stop consonants. In

Ear and Hearing Supplement to Alexander and Masterson “Effects of WDRC release time and number of channels on output SNR and speech recognition”
2
fact, the ANOVA results from the main study had indicated that the number of channels had the greatest effect
on the amplified speech and masker levels (e.g., compare the effect of going from 4 to 16 channels in Figure S5a
to the effect of changing RT in Figure S1c). This occurred because with fewer and wider channels, lower-
intensity segments of the spectrum often shared the same channel as higher-intensity segments. Because
higher-intensity segments controlled the compressor, less-than-ideal gain was applied to lower-intensity
segments. As more and narrower channels were added, the likelihood increased that lower-intensity segments
fell within their own channel and received additional gain. Figures S5 and S6 show that the differences in level
for 16- and 4-channel WDRC were greater with the short RT (panel b) than with the long RT (panel a). The lack
of a RT x channels interaction for the amplified signal levels indicates that the influence of these two factors was
independent.
Reduced temporal contrast is a byproduct of compression because the noise floor of the speech is
increased relative to its peaks, which effectively decreases the modulation depth of the temporal envelope. In
the examples shown, this is indicated by the elevated levels of the speech signal in the high-frequency band
during the production of vowels and low- to mid-frequency consonants. The presence of a masker increases the
effect and leads to concomitant changes in the long-term SNR. This effect on temporal contrast is most clearly
illustrated in Figures S1 and S2 by comparing the levels of the peaks of speech, which correspond to the
fricatives and stop consonants, to the levels of the interposing steady masker. On the high end of the
continuum, Contrast was approximately 15-20 dB with 4 channels and the long RT (Figure S1a). When RT was
made short (Figure S1b), contrast reduced by about 5 dB and when the number of channels increased to 16 with
the long RT (Figure S2a), contrast reduced further, especially toward the end of the RT when masker levels were
highest. On the low end of the continuum, contrast was only about 7 dB with 16 channels and the short RT
(Figure S2b).

Ear and Hearing Supplement to Alexander and Masterson “Effects of WDRC release time and number of channels on output SNR and speech recognition”
3
SUPPLEMENT FIGURE CAPTIONS
Figure S1. Following 4-channel WDRC with the long RT (a) and the short RT (b), the phase inversion technique
was used to estimate the short-term, real-ear output levels for the 1/3-octave band centered at 8000 Hz for the
sentence, “A tusk is used to make costly gifts” (solid black line) in the presence of a steady masker (dotted gray
line) mixed at 0 dB input SNR. The prescriptive fitting parameters for a listener with a hearing loss
representative of the group mean (Listener 13 in Table 1) were used for this example. (c) displays the difference
in levels for the speech and masker when processed with the short and the long RT as well as the difference in
short-term output SNR (dotted black line).
Figure S2. Same as in Figure S1 for 16-channel WDRC with a steady masker.
Figure S3. Same as in Figure S1 for 4-channel WDRC with a modulated, masker.
Figure S4. Same as in Figure S1 for 16-channel WDRC with a modulated masker.
Figure S5. The difference in levels for the speech (solid black line) and steady masker (dotted gray line) for 16-
channel WDRC (Figure S2) and those for 4-channel WDRC (Figure S1) are plotted separately for the long RT (a)
and the short RT (b). The difference in short-term output SNR (dotted black line) is also plotted.
Figure S6. Same as in Figure S5, except for with a modulated masker.

Ear and Hearing Supplement to Alexander and Masterson “Effects of WDRC release time and number of channels on output SNR and speech recognition”
4
4 Channels, Steady Masker 16 Channels, Steady Masker
Figure 1 Figure 2
Ear and Hearing Supplement to Alexander and Masterson “Effects of WDRC release time and number of channels on output SNR and speech recognition”
5
4 Channels, Modulated Masker 16 Channels, Modulated Masker
Figure 3 Figure 4
Ear and Hearing Supplement to Alexander and Masterson “Effects of WDRC release time and number of channels on output SNR and speech recognition”
6
Steady Masker Differences Modulated Masker Differences
Figure 5 Figure 6