predicting electrocardiogram and arterial blood pressure ... · pdf file1 predicting...
TRANSCRIPT

1
Predicting Electrocardiogram and Arterial Blood Pressure
Waveforms with Different Echo State Network Architectures
ABSTRACT
Alarm fatigue caused by false alarms and
alerts is an extremely important issue for medical
staff in Intensive Care Units. The ability to
predict and classify ECG and ABP patient
waveforms can potentially help the staff and
hospital systems better classify a patient’s
waveforms and subsequent alarms. This project
approaches this problem by evaluating the
effectiveness of different Echo State Network
(ESN) architectures at predicting ECG and ABP
waveforms. Several architectures and metrics are
evaluated showing similar performance between
parallel ESN architectures and integrated
architectures. The results also suggest potentially
greater benefit of larger integrated reservoirs at
predicting ECG waveforms and the adaptability
of such models across individuals. Although
there are limitations to this analysis, the work
presented here offers a unique way of
understanding and predicting a patient’s
waveforms and provides suggestions for further
extensions of this research.
1. INTRODUCTION and MOTIVATION
Intensive Care Units (ICUs) are designed to
handle the most physiologically fragile patients in
the hospital [12]. As a result, ICUs utilize a wide
spectrum of machines, technologies, and tests to
help its medical staff better understand and care
for patients. However, the wide array of stand-
alone machines often collect data and produce
alarms and alerts independently, leaving the
difficult integration tasks up to the medical staff.
Time sensitive decisions, identifying non-critical
alarms, are just some of the problems faced by
ICU medical staffs. Studies have shown that
staffs in ICUs face an extraordinary amount of
alarms each day, some as much as 1,000 alarms a
day, most of which are non-actionable or not
necessary for patient care [7, 17]. Excess
amounts of non-critical alarms can lead to alarm
fatigue which can adversely affect patient care [4,
5, 11]. While there is ongoing research to
effectively minimize false alarms, such as
allowing nurses to adjust alarm thresholds, much
work is still needed to better classify and develop
systems that are less error prone to false alarms
[5, 10]. One of the main challenges that arise is
the development of algorithms robust enough to
understand, integrate, and predict multiple
physiological waveforms from patient data that
can better classify and interpret alarms.
The recent release of clinical ICU patient data
makes it possible to develop better models and
support tools to aid medical workers in
understanding and filtering the abundance of
information and alarms they are exposed to [14].
This publically available database, MIMIC II
(Multiparameter Intelligent Monitoring in
Intensive Care II), has already been analyzed and
used in several ways, for example to develop
decision support systems to better categorize and
classify mortality rates in the ICU [2, 3, 6, 14,
15]. Furthermore, a study has previously used
this data and an expert review panel to reclassify
five common ICU alarms into true alarms and
false alarms. They developed an algorithm that
classified alarms based on both electrocardiogram
(ECG) and arterial blood pressure (ABP)
waveforms immediately prior to the machine
generated alarms. When tested, the algorithm
Allan Fong
Department of Computer Science
University of Maryland, College Park

2
suppressed approximately 59.7% of the false
alarms [1]. While their algorithm is focused on
classification, this project aims to complement
their work by developing a neural network that
can predict an individual’s waveform. An
effective predictive model can help medical
staff better anticipate a patient’s condition as
well as the occurrence of false alarms.
The purpose of this project is to use recurrent
neural network models to predict an
individual’s waveform. These networks will be
learning to predict an individual’s ECG and ABP
waveform data, which can potentially help
prioritize alarms as well as predict life-
threatening situations in the ICU. This project
uses the clinical ICU patient data previously
discussed to develop, train, and test various Echo
State Network (ESN) architectures at predicting a
patient’s ECG and ABP. ESNs were chosen for
this project because they have been previously
shown to accurately predict chaotic time series
without the need to train the specific internal
representations of the system [9, 16]. These
advantages make ESNs very attractive for
predicting ECG and ABP time series which are
both chaotic and difficult to learn. The rest of
this paper describes the data, approach taken,
evaluations, discussion of the results, and
suggestions for future work.
2. DATA SOURCE
The data used for this project comes from the
Multi-Parameter Intelligent Monitoring for
Intensive Care II (MIMIC II) database which is
publically available [13, 14, 15]. The complete
database currently contains data from
approximately 33,000 patients collected over 7
years (beginning in 2001) from Boston’s Beth
Israel Deaconess Medical Centers, and combines
both clinical and physiological data. The adult
patient ages ranged from 18 to over 90 years
(mean 68 years), and were collected from 48
medical, surgical, and coronary intensive care
beds. Each patient record typically contains data
from two electrocardiogram (ECG) leads, arterial
blood pressure (ABP) and pulmonary arterial
pressure (PAP) stored at 125Hz over time
intervals that can range between a few hours to a
few days, a sample of the raw data is shown in
Figure 1. The ECG was originally sampled at
500Hz but was compressed to 125Hz while still
preserving the peaks [1]. The resulting database
is quite large (over 3TB). This project focuses on
the data from the ECG II and ABP data from six
randomly select patients. ECG II data was
selected because it appeared to be more available
from a cursory look at the patient records. ABP
was selected because of its relationship to ECG in
the interpretation and classification of alarms [1].
3. METHOD
This project evaluates the performance of
three different types of ESN architectures at
predicting two related physiological waveforms.
There are many parameters and conditions
associated with a basic ESN, such as reservoir
size, activation rule, learning rates, etc. Some
preliminary analysis was done to identify
reasonable ranges of interesting parameters. The
following sections first describe the data and
preprocessing of the data. Next, a basic ESN
architecture, was implemented, tested, and
applied to both ECG and ABP waveforms which
help fix some network parameters, such as
activation and learning rules. These parameters
were then used to build three different types of
ESNs which were evaluated on predictive
performance.
Figure 1: Samples of standard ECG II and ABP waveforms.
This data was from patient a41278.

3
3.1 Data Processing
Although the data was publically available, a
specialized WFDB (WaveForm DataBase)
software package was required to download,
interpret, and format the data [13]. Cygwin was
used to connect directly to the server to download
and format the data. Unfortunately, this process
was done manually because of the complex
nature of the data and some limitations of
Cygwin. The downloaded data was converted to
comma separable version files which were
readable in Matlab.
Some basic preprocessing was needed to make
the magnitudes for the two waveforms
comparable. A simple smoothing function, that
averaged the data points in a 5-time step moving
window, was applied to both the ECG and ABP
data. This window size was effective at
smoothing the waveform while maintaining the
important features of the waves. The ABP data
was also normalized to fall within the values 0
and 1. The ECG was vertically shifted up by the
minimal value so it would be within the same
range as the ABP data. These transformations
were done to make the two waveforms more
comparable and similar in magnitude while
maintaining unique features.
3.2 Building and Testing a Basic ESN
A standard ESN, Figure 2, was first built, in
Matlab, adopted from Jaeger and Tong’s previous
work [9, 16]. This standard architecture has four
sets of unique weights: Win_hidden were randomly
assigned fully connected weights between the
input node to the reservoir nodes, Whidden were
sparsely connected, randomly assigned recurrent
weights between the reservoir nodes, Whidden_out
were randomly assigned fully connected weights
from the reservoir nodes to the output node, and
Win_out were randomly assigned weights from the
input node to the output node. Note that this
architecture does not have connections from the
output nodes back to the hidden nodes. This was
done to reduce the model complexity and to align
more fully with some of the models previously
discussed. Weights were initially assigned
random values between -0.5 and 0.5. Similar to
previous work, approximately 20% of the
possible connections in the reservoir had non-
zero weights and scaled with a spectral radius of
0.98, using equation 1:
where α is the spectral radius, W’hidden is the
weight matrix for the reservoir prior to
transformation, and λmax is the maximum
eigenvalue of W’hidden [16].
The activation for the hidden nodes, Ahidden,
and output nodes, Aout, is:
The learning rule and training only applied to the
connections between the hidden nodes and the
output nodes; all other weights remained
unchanged through initialization, training, and
testing. Although several learning techniques to
train these weights were tried, such as linear
regression, simplified error back propagation, and
other learning functions, a simple learning rule
that incrementally changed the weight based on
the product of the learning rate and the training
error, was shown to be both effective and fast.
To prevent excessive oscillations in weights, a
minimal error threshold was applied such that
weights would not change if the absolute value of
Figure 2: Basic ESN with learning only on Whidden_out (dashed
arrows).

4
the error was less than 0.0001 (determined
empirically).
The basic ESN was first tested with a trivial
simulated sine wave. The data was divided into
training data (2,000 time-steps) and testing data
(1,000 time-steps). The ESN, with 600 reservoir
nodes and a learning rate of n = 0.0001, was
initialized by passing all the data through the
reservoir once to let the internal transients of the
system dissipate. Next the training data was
introduced to the network and the hidden-to-
output weights were allowed to learn. The
purpose of this project was to develop a model
that could predict a waveform; hence the teacher
signal was the input signal 100 time-steps to the
right (100 time-steps in the future). This trivial
example verified the basic workings of this
network. Mean Square Error (MSE) was used to
evaluate this and subsequent test predictions:
where N is the total number to time-steps in the
test prediction, t(n) is the actual teacher value at
time-step n, and a(n) is the output predicted value
at time-step n.
This trivial but useful prediction
demonstration resulted in a low MSEtest of 0.025
(run results in the Appendix).
3.3 Refining ESN Parameters
It was next necessary to identify some useful
ESN parameter ranges for the ECG and ABP
waveform data. Identifying which parameters to
set and the ranges of interest made the
comparisons of different ESN architectures more
appropriate. Two separate ESNs with similar
architectures to the ESN mentioned above were
used to predict ECG and ABP waveforms 625
time-steps into the future. Different combinations
of reservoir sizes and learning rates were tried
because of their influence on how the waveforms
were represented, decomposed, and learned by
the system.
A cursory assessment was first completed with
the ECG data, varying the number of hidden
nodes (100, 500, 750, and 1000) and the learning
rates (0.01, 0.001, and 0.0001). The data was
divided into initializing (1-5,000 time-steps),
training (5,001-8,000 time-steps), and testing
segments (8,001-10,000 time-steps). The data
was tested 10 times for each combination. As
shown in Table 1, reservoirs with nodes ranging
between 100 and 750 and learning rates ranging
from 0.001 and 0.0001 had on average better
performance, prompting additional investigation.
Table 1: ECG MSE test results (standard deviations)
MSE
test
100 500 750 1000
0.01 3.78e42
(6.55e42)
7.83e7
(1.26e8)
4.1e13
(7.1e13)
4.6e76
(8.0e76)
0.001 0.026
(0.023)
18.39
(31.07)
1.42
(2.32)
1.6e6
(2.7e6)
0.0001 0.013
(0.0018)
0.02
(0.0029)
0.043
(0.031)
0.11
(0.14)
Reservoir size and learning rate ranges were
further investigated with higher fidelity. The
network ran ten more times with randomly
initialized weights with new combinations of
reservoir sizes (100, 200, 300, 400, 500, 600, and
700) and learning rates (0.001, 0.0005, and
0.0001). The results suggested that learning rates
of 0.0001 and reservoir sizes of 500 or less than
300 tended to have better performance.
Although both reservoir size and learning rate
Figure 3: Lowering learning rates tend to reduce the average
ECG MSE (error bars/marks show one standard deviation
from the mean). Results without a lower error bar indicate
significantly larger differences only meaningful in the
positive direction.
5
affected performance, the latter had much more
influence on the results, as shown by the
overlapping error marks in Figure 3. As a result,
a learning rate of 0.0001 and a reservoir size of
500 were used for the ECG components of the
test ESN architectures. A reservoir size of 500
was chosen because it had slightly less variability
compared to sizes of 300 nodes or less.
A similar analysis, done using ABP data,
suggested a learning rate of 0.0001 and a
reservoir size of 400 for the ABP components of
the test ESN architectures.
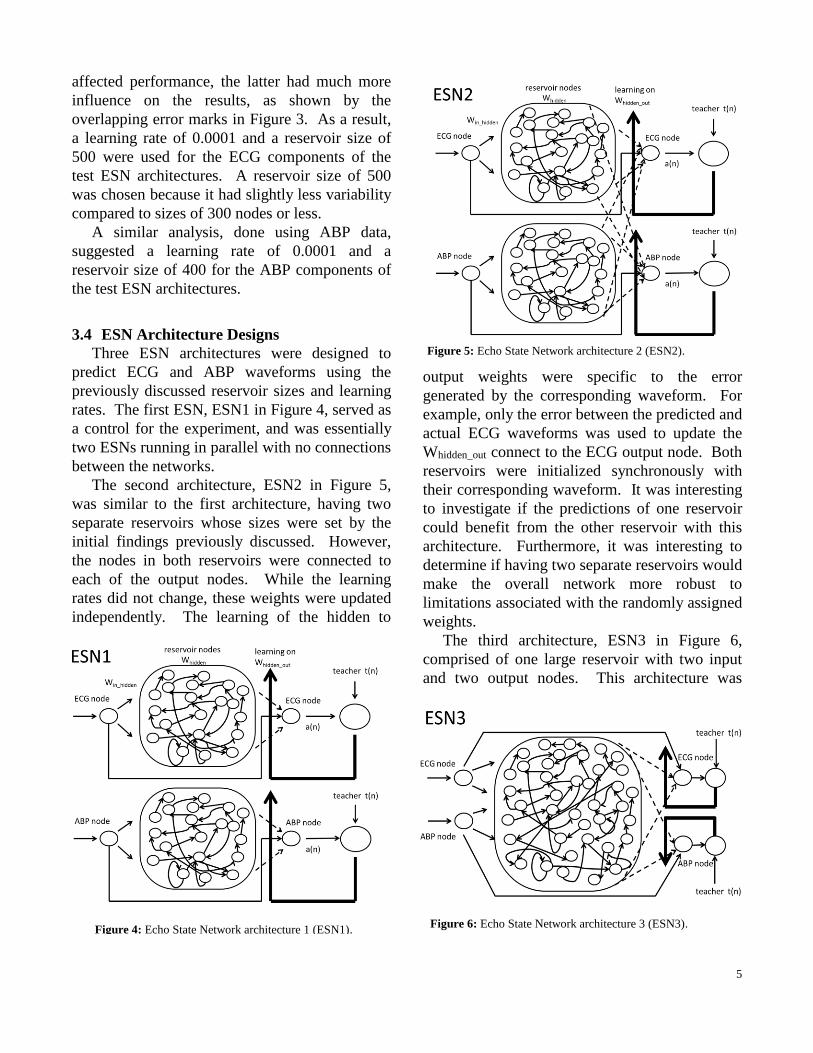
3.4 ESN Architecture Designs
Three ESN architectures were designed to
predict ECG and ABP waveforms using the
previously discussed reservoir sizes and learning
rates. The first ESN, ESN1 in Figure 4, served as
a control for the experiment, and was essentially
two ESNs running in parallel with no connections
between the networks.
The second architecture, ESN2 in Figure 5,
was similar to the first architecture, having two
separate reservoirs whose sizes were set by the
initial findings previously discussed. However,
the nodes in both reservoirs were connected to
each of the output nodes. While the learning
rates did not change, these weights were updated
independently. The learning of the hidden to
output weights were specific to the error
generated by the corresponding waveform. For
example, only the error between the predicted and
actual ECG waveforms was used to update the
Whidden_out connect to the ECG output node. Both
reservoirs were initialized synchronously with
their corresponding waveform. It was interesting
to investigate if the predictions of one reservoir
could benefit from the other reservoir with this
architecture. Furthermore, it was interesting to
determine if having two separate reservoirs would
make the overall network more robust to
limitations associated with the randomly assigned
weights.
The third architecture, ESN3 in Figure 6,
comprised of one large reservoir with two input
and two output nodes. This architecture was
Figure 4: Echo State Network architecture 1 (ESN1).
Figure 5: Echo State Network architecture 2 (ESN2).
Figure 6: Echo State Network architecture 3 (ESN3).

6
chosen to investigate how single reservoir
systems compared to multiple reservoir systems
when predicting multiple related waveforms. It
was interesting to test if initializing and training
one reservoir with two related waveforms could
lead to better performance. To be consistent with
ESN1 and ESN2, both the inputs and outputs
were fully connected to the hidden nodes but
inputs were only connected to their corresponding
output waveform node. The other network
parameters, such as spectral radius, Whidden
sparsity, were consistent with ESN1 and ESN2.
This ensured that the analysis would primarily
focus on differences resulting from the network
architecture. Nevertheless, a single reservoir
system can perform differently based on its size.
As a result, ESN3 with reservoirs of 800 and 700
nodes were also investigated. ESN3 was
initialized with both waveforms, and similar to
ESN2, the fully connected weights from the
hidden to each output node were different and
were trained based on the error associated with
their corresponding predicted waveforms.
The performance of these three architectures
was assessed on MSE, equation 1, and the
maximum prediction error (max error) between
the performance and the actual waveform for
both ECG and ABP data. A 10,000 time-step
sample from patient record a41278 was used for
this analysis. The data was divided into
initializing (1-5,000), training (5,001-8,000), and
testing segments (8,001-10,000). Initialization,
training, and testing with all the networks
followed the sample protocol. After testing, the
ECG and ABP MSE and max error were
evaluated using one-way ANOVA. This was
used to determine if there were statistically
significant differences between the ECG and
ABP MSE and max error for the different
architecture types (ESN1, ESN2, ESN3-900,
ESN3-800, ESN3-700). Based on these results,
randomly sampled data from five individuals
(a41325, a40416, a40076, a40432, and a41563)
were used to evaluate the consistency and
performance of one of the higher performing
networks.
4. RESULTS
Each ESN architecture ran thirty times with
randomly initialized weights. The networks were
evaluated on their prediction/test MSE and the
maximum error values for both ECG and ABP
waveforms. Figures 7 and 8 show data from a
training and testing ESN1 run. In Figure 7, the
ESN1 was able to learn and adjust to match the
phase and magnitude of an ABP waveform as
well as have decent predictive performance.
Additional, sample results from ESN1, ESN2,
and ESN3-900 are included in the Appendix.
The boxplots in Figures 9 and 10 show the
Figure 7: Sample ABP training run.
Figure 8: Sample ABP test prediction.
Figure 9: Boxplot of ECG test MSE for the different
ESN architectures.

7
Figure 12: Median results for a) ECG MSE, b) ABP MSE, c)
ECG max error, and d) ABP max error.
MSE from both the ECG and ABP results binned
by architecture type. The outliers were most
likely caused by poor randomly initialized
weights. These outliers (results greater than three
standard deviations from the mean) were
removed, approximately five per factor level, for
the remainder of the analysis. Similar boxplots
for the maximum error results were produced and
included in the Appendix.
Next the Kolmogorov-Smirnov (KS) test was
used to test both the ECG and ABP MSE results
for normality. Although the KS values for the
ECG and ABP distributions were 0.5 and 0.53
respectively, parametric statistical tests could still
be applicable considering the sample size.
One-way ANOVAs were used to evaluate the
MSE and max error of the predictions. The
factors levels were the different architectures
(ESN1, ESN2, ESN3-900, ESN3-800, and ESN3-
700). Table 2 shows the F-values and the
corresponding probability values of both the MSE
and max errors for the different waveforms.
Table 2: ANOVA results
F-value (p-value) ECG ABP
MSE 1.48 (0.21) 1.19 (0.32)
Max Error 1.65 (0.17) 2.22 (0.071)
The results from the ABP max error analysis
were marginally significant (p-value = 0.071),
while the other evaluations were less significant.
The ABP max error significance was most likely
driven by the poor performance from ESN3-800
and ESN3-700 as shown in Figure 11. The
ANOVA tests used factor level means for
statistical comparisons which showed little
statistical differences. However, there are
interesting trends to note from the median metric
values, Figure 12. ESN3-900 tended to predict
ECG waveforms slightly better than ESN1 and
ESN2. However, ESN3’s performance decreased
quickly with less hidden nodes. This may be due
to the inability of the reservoir to correctly learn
the two waveforms. In general, ESN1 gave a
much better prediction for the ABP waveform,
although ESN3-900 had comparable performance
in terms of ABP max error predictions. These
results showed that there was no significant
difference in the architectures at predicting two
related waveforms together. There may also be
increases in performance when combining
waveforms in a single reservoir that is
Figure 10: Boxplot of ABP test MSE for the different
ESN architectures.
Figure 11: Marginal significance most likely driven by
ESN3-800 and ESN3-700.
a b
c d

8
approximately similar in size to the two
individual reservoirs. This showed the potential
benefits of combining reservoirs to predict
different but related waveforms.
Lastly, ESN3-900 was tested and compared
using randomly sampled data from five
individuals. ESN3-900 was chosen because its
performance was similar to the basic ESN1
architecture and it was easier and faster to
implement. The results showed that the ECG and
ABP, Figure 13 and 14, performance across
subjects were fairly similar, with the exception of
patient 3. Though further work is needed, these
results suggest that this architecture may be
robust enough to be applied to different patients
with little customization.
The next section will discuss these results in
more detail as well as the limitations,
improvements, recommendations, and further
extensions and questions that can be investigated.
5. DISCUSSION
The ability to predict and classify the ECG and
ABP waveforms of patients is extremely
important for the medical staff in Intensive Care
Units. This project approached this problem by
evaluating the effectiveness of different Echo
State Network (ESN) architectures at predicting
ECG and ABP waveforms. The results showed
that there was little significant difference in
performance when predicting ECG and ABP
waveforms using the different ESN architectures.
However, ESN3 showed potential benefits of
using one large reservoir, especially when
predicting the ECG waveform. ESN3 was also
test with different individuals with comparable
results.
5.1 ECG versus ABP
The ESN architectures in general tended to
have much better performance predicting ECG
compared to ABP. This might be because the
ECG waveforms have higher frequencies then the
ABP waveforms. The loosely coupled
subsystems in the reservoir might resonate or
echo at higher frequencies better compared to
lower frequencies. Furthermore, the ability of
one larger reservoir to predict the waveforms was
dramatically worsened as the size of the reservoir
decreased. As the reservoir size decreased, the
performance degradation was much more
apparent with ABP then with ECG. This might
also suggest that any coupling of ECG and ABP
waveforms is biased toward the faster
waveforms. This is an area that will require
further investigation.
5.2 ESN3 Adaptability
Furthermore, analysis of ESN3-900 with five
different individuals showed that this network
architecture could be adaptable to different
subjects. Without changing the parameters of the
model, ESN3-900 resulted in similar performance
Figure 13: ECG MSE results for ESN3-900 tested with five
randomly selected patients.
Figure 14: ABP MSE results for ESN3-900 tested with five
randomly selected patients.

9
for four of the five randomly selected patients.
Having a model that can be applied to different
patients with little or no tailoring is attractive, and
can be very beneficial in developing a predictive
system for hospitals.
5.3 Two versus One Reservoir
Although this project was in some sense
exploratory, it does highlight some potential
advantages of having one large reservoir for
learning and predicting two related waveforms.
The performance of ESN3-900 was comparable
to ESN1 and ESN3, and was easier to implement.
This analysis hints at interactions between how
these waveforms are learned and stored in the
reservoir. This could be investigated further and
in more detail, perhaps starting with simpler, less
chaotic waveforms. There are many questions to
ask: for example, could initializing two reservoirs
separately and then combining and reinitializing
them lead to more robust internal subsystems in
the reservoir? These and other queries can help
further the understanding of Echo State Networks
and make them more applicable for engineering
and other applications.
5.4 Limitations
There are limitations associated with this
project, some of which were already discussed. It
would always be helpful to collect more data, test
more patients, and try different combinations of
waveforms (not just the ECG II and ABP
waveforms). Furthermore, the parameters for
each network (besides the learning rates and
reservoir sizes) could be optimized more
individually. This would greatly increase the
number of factors to control for but with more
time, a detailed factor level analysis of the
network parameters would be very insightful.
Data transformations of the results might also
provide more normalized data. However, more
research is needed to understand what these
transformations mean intuitively for the results
before they should be applied.
5.5 Alarm Classification
A model that can predict ECG and ABP
waveforms can naturally be extended to classify
waveforms and predict alarms. A model that can
forecast the accuracy of ECG alarms or classify
false alarms based on predicted waveforms will
be extremely beneficial to medical staff,
especially those in the ICU. There are several
types of alarms in the ICU, each with unique
waveform patterns, and this work can be
extended to investigate the differences between
predicted waveforms during a false alarm and a
true alarm. Models that can extrapolate what a
patient’s waveforms will be like even a few
seconds after an alarm can help medical staff and
hospital systems better understand and classify
alarms, with the ultimate goal of reducing false
alarms, alarm fatigue, and improving patient care.
6. CONCLUSION
Alarm fatigue caused by bedside machines is a
serious issue in Intensive Care Units. Part of this
problem is the inability of these machines to
predict and classify a patient’s ECG and ABP
waveforms. This study evaluated different Echo
State Network architectures for predicting ECG
and ABP waveforms. The results showed that a
large ESN reservoir architecture, ESN3-900, that
combines both waveforms had a similar
performance to separate smaller reservoirs. ECG
was generally predicted more accurately
suggesting that the ESN with combined
waveforms tended to learn the higher frequency
waveform better. Furthermore, results showed
the potential benefits for applying a large ESN
reservoir for different individuals, which could be
very helpful for hospital systems. This paper also
discussed limitations of this project, as well as
suggestions for future works, especially to
investigate the one versus two reservoir
interactions and applications for predictive alarm
classifications.
7. ACKNOWLEDGEMENTS
The author is very thankful for the support and
guidance from Dr. Ranjeev Mittu (Naval

10
Research Laboratory), who initially proposed the
vision for this project, and Professor Reggia.
8. REFERENCES
[1] Aboukhalil, Anton, et al. "Reducing false
alarm rates for critical arrhythmias using the
arterial blood pressure waveform." Journal of
biomedical informatics41.3 (2008): 442.
[2] Celi, Leo A., et al. "A Database-driven
Decision Support System: Customized
Mortality Prediction." Journal of
Personalized Medicine 2.4 (2012): 138-148.
[3] Celi, Leo A., et al. "Collective Experience: A
Database-Fuelled, Inter-Disciplinary Team-
Led Learning System." Journal of Computing
Science and Engineering 6.1 (2012): 51-59.
[4] Cvach, Maria. "Monitor alarm fatigue: An
integrative review." Biomedical
Instrumentation & Technology 46.4 (2012):
268-277.
[5] Edelson, M. “Safety First.” Hopkins Medicine
(2013): 24-31.
[6] Fuchs, Lior, et al. "ICU admission
characteristics and mortality rates among
elderly and very elderly patients." Intensive
care medicine 38.10 (2012): 1654-1661.
[7] Graham, Kelly Creighton, and Maria Cvach.
"Monitor alarm fatigue: standardizing use of
physiological monitors and decreasing
nuisance alarms." American Journal of
Critical Care 19.1 (2010): 28-34.
[8] Jaeger, Herbert. "Reservoir riddles:
Suggestions for echo state network
research." Neural Networks, 2005. IJCNN'05.
Proceedings. 2005 IEEE International Joint
Conference on. Vol. 3. IEEE, 2005.
[9] Jaeger, Herbert, and Harald Haas.
"Harnessing nonlinearity: Predicting chaotic
systems and saving energy in wireless
communication." Science 304.5667 (2004):
78-80.
[10] Konkani, Avinash, Barbara Oakley, and
Thomas J. Bauld. "Reducing Hospital Noise:
A Review of Medical Device Alarm
Management." Biomedical Instrumentation &
Technology 46.6 (2012): 478-487.
[11] Mathews, Simon C., and Peter J. Pronovost.
"The need for systems integration in health
care." JAMA: the journal of the American
Medical Association 305.9 (2011): 934-935.
[12] MIT. “MIMIC II.”
http://mimic.physionet.org/UserGuide/node8.
html (2013).
[13] PhysioNet. “WFDB Software Package.”
http://physionet.org/physiotools/wfdb.shtml
(2013).
[14] Saeed, Mohammed, et al. "Multiparameter
Intelligent Monitoring in Intensive Care II
(MIMIC-II): a public-access intensive care
unit database." Critical care medicine 39.5
(2011): 952.
[15] Scott, Daniel J., et al. "Accessing the public
MIMIC-II intensive care relational database
for clinical research." BMC medical
informatics and decision making13.1 (2013):
9.
[16] Tong, Matthew H., et al. "Learning
grammatical structure with echo state
networks." Neural Networks 20.3 (2007):
424-432.
[17] Tsien, Christine L., and James C. Fackler.
"Poor prognosis for existing monitors in the
intensive care unit." Critical Care
Medicine 25.4 (1997): 614-619.

11
APPENDIX
Results from sine wave predictions
This trivial example generated very low training MSE (0.0213) and test MSE (0.0250).
The parameters in this model could be optimized further, however because this was just to show a proof
of concept, the parameters were not further optimized.
Results from testing ABP MSE for different combinations of reservoir size and learning rates
Sample test results from ESN1, ESN2, and ESN3-900 (please note that these results were selected at
random and do not reflect the best performing runs)
ECG_ESN1

12
ABP_ESN1
ECG_ESN2
ABP_ESN2

13
ECG_ESN3
.
ABP_ESN3
Boxplot for ECG and ABP max error results binned by ESN architecture type