predictability study of isip reading and staar … study of isip reading and staar reading:...
TRANSCRIPT

ISIP READING AND STAAR READING PREDICTABILITY STUDY 1
Predictability Study of ISIP Reading and STAAR Reading:
Prediction Bands
February 2016
Chalie Patarapichayatham, Ph.D.
Southern Methodist University
ISIP READING AND STAAR READING PREDICTABILITY STUDY 2
Abstract
This study provided evidence that Istation’s Indicators of Progress (ISIP™) Reading cut scores
can predict passing scores for the State of Texas Assessments of Academic Readiness (STAAR)
Reading tests. This study used ISIP Early Reading (3rd grade), ISIP Advanced Reading (4th–8th
grades), and STAAR Reading tests. All data came from one district in the state of Texas and
were collected in the 2014–2015 school year. There were 3,397 3rd grade students; 3,400 4th
grade students; 3,556 5th grade students; 1,116 6th grade students; 730 7th grade students; and
449 8th grade students, totaling 12,648 students. Simple linear regression analysis was applied
for each grade’s data. Predictability “bands” were further computed by using the confidence
interval (CI) approach to obtain the ISIP Reading cut score to predict passing STAAR Reading
tests. Results of a simple linear regression showed that the ISIP Reading measures are highly
predictive of STAAR Reading scores. The ISIP Reading cut scores to predict passing STAAR
Reading tests for 2015–2016, 2016–2017, 2017–2018, 2018–2019, 2019–2020, 2020–2021,
2021–2022 Recommended Level II, and Recommended Level III standards are reported.

ISIP READING AND STAAR READING PREDICTABILITY STUDY 3
Introduction
Istation’s Indicators of Progress, also known as ISIP, is a sophisticated Internet- and
Web-delivered computer-adaptive testing (CAT) system that provides continuous progress-
monitoring (CPM) assessment in the critical domains of reading in prekindergarten through 8th
grade. It is built using two-parameter Item Response Theory and driven by a fully CAT
algorithm. ISIP gathers and reports frequent information about student progress in these critical
domains throughout and across academic years (Patarapichayatham, Fahle, & Roden, 2013).
The purpose of ISIP is to measure reading ability and identify deficits in critical areas in
order to provide continuous differentiated instruction. ISIP accomplishes this by delivering short
tests, at least monthly, that target critical areas to inform instruction. It is realistic to administer
ISIP assessments for an entire classroom, an entire school, and even an entire district in a single
day with adequate computer resources. Student results are immediately available online for
teachers and administrators, illustrating each student’s past and present performance and skill
growth. Teachers are alerted when students are not making adequate progress so that the
instructional program can be modified before a pattern of failure becomes established (Mathes,
2011). For full information about ISIP Early Reading (for grades pre-K–3) and ISIP Advanced
Reading (for grades 4–8), see Mathes (2011) and Mathes, Torgesen, and Herron (2011).
The State of Texas Assessments of Academic Readiness (STAAR) program was
implemented in the state of Texas in spring 2012 and includes annual assessments for (a) reading
and mathematics for grades 3 through 8, (b) writing for grades 4 and 7, (c) science for grades 5
and 8, (d) social studies for grade 8, and (e) end-of-course (EOC) assessments for English I,
English II, Algebra I, biology, and US history. In spring 2016, STAAR English III and Algebra
II will be available for districts to administer as optional assessments.

ISIP READING AND STAAR READING PREDICTABILITY STUDY 4
One of the state’s goals in developing STAAR is that Texas will be among the top 10
states for graduating college-ready students by the 2019–2020 school year. The curriculum
assessed on STAAR is the state-mandated curriculum, the Texas Essential Knowledge and Skills
(TEKS). These standards are designed to prepare students to succeed in postsecondary
opportunities and to compete globally. Within the STAAR Reading test for grades 3 through 8,
three content areas are assessed: Category 1, understanding and analysis across genres; Category
2, understanding and analysis of literary texts; and Category 3, understanding and analysis of
informational texts (http://tea.texas.gov/).
ISIP Early Reading, developed in 2006, and ISIP Advanced Reading, developed in 2010,
have been delivered to more than four million students in the United States of America and in six
other countries. A majority of these students are from the state of Texas and have been required
to take the STAAR Reading assessment. Patarapichayatham, Fahle, and Roden (2013) studied
the relationship between ISIP Reading and STAAR Reading by applying Pearson product-
moment correlation analysis, multiple linear regression analysis, and multiple logistic regression
for 3rd–8th grade data. They found that the ISIP Reading end-of-the-year (EOY) scores were
higher than the ISIP Reading middle-of-the-year (MOY) scores on both overall scores and each
sub-skill score across grades, indicating that students improved their reading ability by the end of
the year. The correlations between ISIP Reading and STAAR Reading tests were very strong
across grades, indicating that students who perform well on ISIP Reading are very likely to
perform very well on STAAR Reading. They also found that ISIP Reading measures are highly
predictive of STAAR Reading scores.
Patarapichayatham, Fahle, and Roden (2014) also proposed ISIP Reading cut scores to
predict passing STAAR Reading Level II phase-in 1 standards. The cut scores were 229; 1,798;
ISIP READING AND STAAR READING PREDICTABILITY STUDY 5
1,844; 1,920; 1,950; and 1,949 for grades 3 through 8, respectively. The STAAR Reading Level
II phase-in 1 standards were in effect for the 2011–2012, 2012–2013, 2013–2014, and 2014–
2015 school years. The STAAR Reading performance standards had been at phase-in 1 for four
years. The Texas Education Agency (TEA) announced that STAAR Reading Level II phase-in 2
performance standards will be used for 2015–2018, and STAAR Reading Level II phase-in 3
performance standards will be used for 2018–2021. Patarapichayatham (2015) also updated ISIP
Reading cut scores for STAAR Reading Level II final standards.
Under new proposed rules from the Texas Commissioner of Education, the traditional
phase-in approach (larger jumps to more rigorous performance standards every few years) is
replaced with a standard progression approach from 2015–2016 through the 2021–2022 school
year. Under the standard progression approach, students are expected to increase by small points
every year from 2015–2016 through the 2021–2022 school year (tea.texas.gov). The STAAR
Reading performance standards are shown in Table 3. Overall, the STAAR Reading performance
standards increase approximately 20 points yearly for each grade level from the 2015–2016
standards to 2021–2022 Recommended Level II standards. This means that student scores must
increase about 20 points yearly in order to pass the STAAR Reading test. To be more precise,
3rd grade students need to score 1,345 in order to meet the STAAR Reading performance
standards in the 2015–2016 school year but need to score 1,365 (20 more points than the
previous year) in order to pass the STAAR Reading test in the 2016–2017 school year.
Moreover, 3rd grade students need to score 1,386 (21 more points than the previous year) in
order to pass the STAAR Reading test in the 2017–2018 school year. STAAR Reading
performance standards increase 85 points from 2021–2022 Recommended Level II standards to
Recommended Level III standards.
ISIP READING AND STAAR READING PREDICTABILITY STUDY 6
Since the traditional phase-in approach is replaced with a standard progression approach
from 2015–2016 through the 2021–2022 school year, Istation needs to update the prediction
bands. For this reason, this study aims to identify the ISIP Reading cut score to predict passing
STAAR Reading tests. Simple linear regression results were used to obtain the prediction bands
by using the confidence interval (CI) approach. ISIP Overall Reading Ability at the end of the
year (EOY) scores were used as the predictor, and the STAAR Reading scale score was the
outcome variable. The samples were taken from students in one district in the state of Texas.
Methods
Measures
Results from ISIP Early Reading for 3rd grade, ISIP Advanced Reading for 4th–8th
grades, and STAAR Reading tests for 3rd–8th grades from the 2014–2015 school year were
used. ISIP Overall Reading Ability EOY scores from the 2014–2015 school year and STAAR
Reading scores from 2014–2015 for these same students were used. The Overall Reading Ability
scores are computed from four different sub-skills: reading comprehension, spelling, vocabulary,
and connected text fluency. The ISIP Reading scale scores and the STAAR Reading scale scores
were used. Table 1 shows the Pearson product-moment correlation coefficients. The correlations
between ISIP Reading and STAAR Reading scores were relatively high, indicating a strong
relationship between ISIP Reading measures and STAAR Reading tests. The correlation co-
efficients were 0.737, 0.735, 0.706, 0.752, 0.549, and 0.628 for grades 3 through 8, respectively.
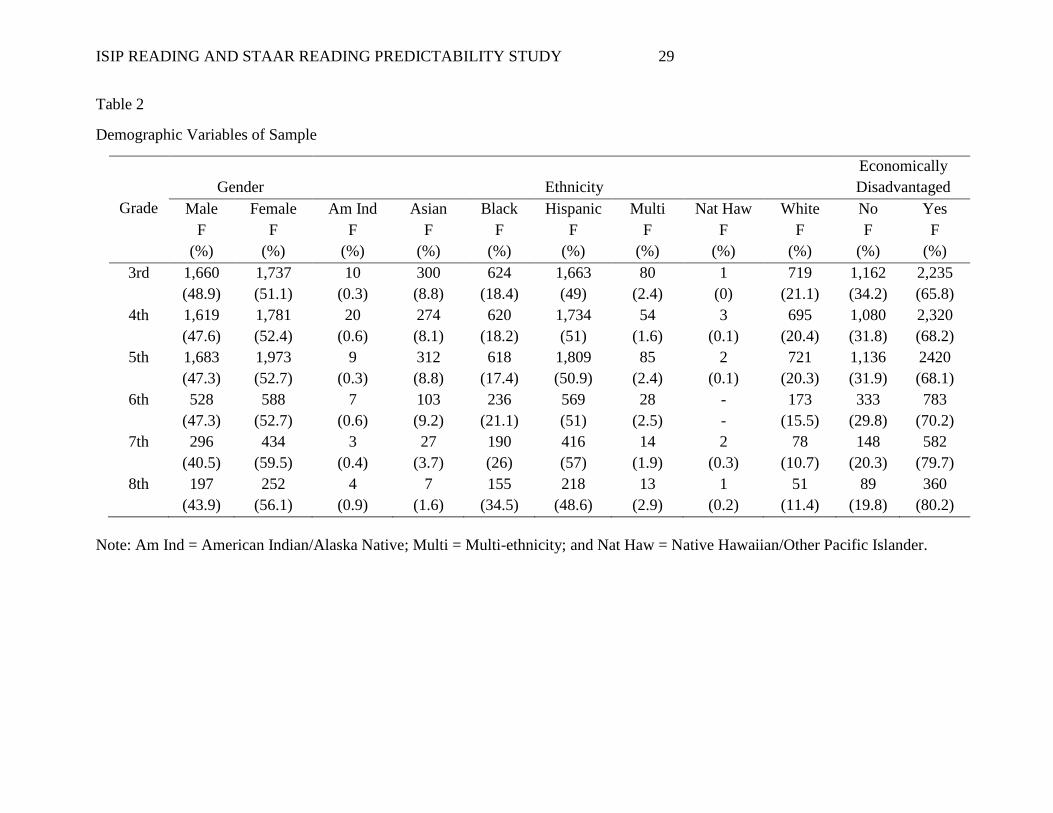
Samples
The sample included 12,648 students from 3rd through 8th grade in one district in the
state of Texas. There were 3,397 3rd grade students; 3,400 4th grade students; 3,556 5th grade
students; 1,116 6th grade students; 730 7th grade students; and 449 8th grade students. The
ISIP READING AND STAAR READING PREDICTABILITY STUDY 7
original data file had approximately 4,000 students per grade. Due to the listwise deletion on
SPSS, all missing data was deleted from an analysis. The means of STAAR Reading scores were
1,438.26; 1,509.61; 1,566.24; 1,574.71; 1,566.60; and 1,588.16 for grades 3 through 8,
respectively. The means of ISIP Overall Reading Ability EOY scores were 253.00; 1,958.99;
2,036.32; 2,066.62; 2,017.96; and 2,087.84 for grades 3 through 8, respectively. The
demographic variables are shown in Table 2. Approximately half of the sample was male and the
other half female. Half of the sample was Hispanic, whereas the other half of the sample was all
other ethnicities combined. And approximately 70 percent of the sample was economically
disadvantaged students.
Analysis
The purpose of this study was to determine the ISIP Reading cut scores to predict passing
STAAR Reading tests for grades 3 through 8. The simple linear regression analysis was applied
for each grade’s data by using SPSS software version 22. The ISIP Overall Reading Ability EOY
score was the predictor, and the STAAR Reading score was the outcome variable. I first ran the
simple linear regression. The y for each grade’s data was computed (see Part I result). Then the
confidence interval (CI) was further computed.
Prediction bands commonly arise in regression analysis. The goal of a prediction band is
to cover with a prescribed probability the values of one or more future observations from the
same population from which a given data set was sampled. There are two types of prediction
bands: confidence interval (CI) and prediction interval (PI). A CI is used in statistical analysis to
represent the uncertainty in an estimate of a curve or function of the data. The 95 percent
confidence intervals enclose the area that I can be 95 percent certain contains the true curve. If I
have many data points, the confidence intervals will be near the line or curve, and most of the
ISIP READING AND STAAR READING PREDICTABILITY STUDY 8
data will lie outside the confidence intervals. The 95 percent prediction intervals enclose the area
that I expect to enclose 95 percent of future data points. They are wider than confidence bands,
and they are much wider with large data sets.
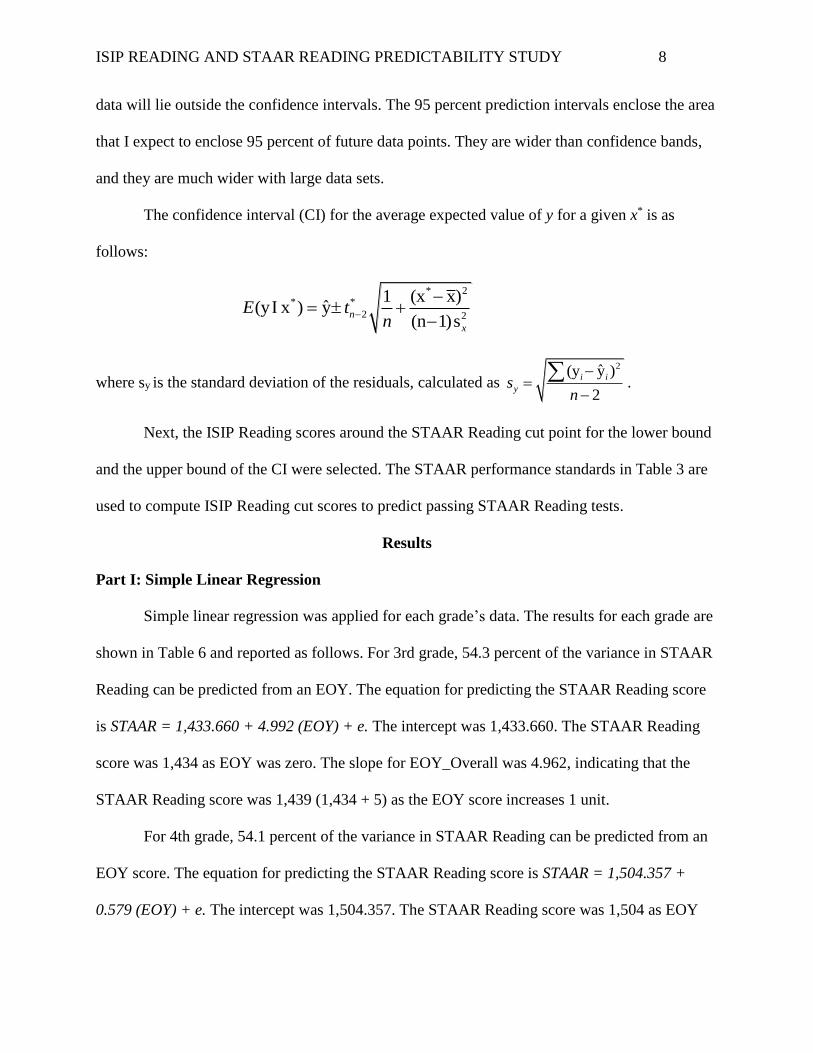
The confidence interval (CI) for the average expected value of y for a given x* is as
follows:
* 2* *
2 2
(x x)1ˆ(y x ) y
(n 1)sn
x
E tn
where sy is the standard deviation of the residuals, calculated as
2ˆ(y y )
2
i i
ysn
.
Next, the ISIP Reading scores around the STAAR Reading cut point for the lower bound
and the upper bound of the CI were selected. The STAAR performance standards in Table 3 are
used to compute ISIP Reading cut scores to predict passing STAAR Reading tests.
Results
Part I: Simple Linear Regression
Simple linear regression was applied for each grade’s data. The results for each grade are
shown in Table 6 and reported as follows. For 3rd grade, 54.3 percent of the variance in STAAR
Reading can be predicted from an EOY. The equation for predicting the STAAR Reading score
is STAAR = 1,433.660 + 4.992 (EOY) + e. The intercept was 1,433.660. The STAAR Reading
score was 1,434 as EOY was zero. The slope for EOY_Overall was 4.962, indicating that the
STAAR Reading score was 1,439 (1,434 + 5) as the EOY score increases 1 unit.
For 4th grade, 54.1 percent of the variance in STAAR Reading can be predicted from an
EOY score. The equation for predicting the STAAR Reading score is STAAR = 1,504.357 +
0.579 (EOY) + e. The intercept was 1,504.357. The STAAR Reading score was 1,504 as EOY
ISIP READING AND STAAR READING PREDICTABILITY STUDY 9
was zero. The slope for EOY was 0.579, indicating that the STAAR Reading score was 1,505
(1,527 + 1) as the EOY score increases 1 unit.
For 5th grade, 49.9 percent of the variance in STAAR Reading can be predicted from an
EOY score. The equation for predicting the STAAR Reading score is STAAR = 1,559.765 +
0.544 (EOY) + e. The intercept was 1,559.765. The STAAR Reading score was 1,560 as EOY
was zero. The slope for EOY was 0.544, indicating that the STAAR Reading score was 1,561
(1,560 + 1) as the EOY score increases 1 unit.
For 6th grade, 56.5 percent of the variance in STAAR Reading can be predicted from an
EOY score. The equation for predicting the STAAR Reading score is STAAR = 1,569.804 +
0.464 (EOY) + e. The intercept was 1,569.804. The STAAR Reading score was 1,570 as EOY
was zero. The slope for EOY was 0.464, indicating that the STAAR Reading score was 1,570
(1,570 + 0) as the EOY score increases 1 unit.
For 7th grade, 30.1 percent of the variance in STAAR Reading can be predicted from an
EOY score. The equation for predicting the STAAR Reading score is STAAR = 1,562.742 +
0.269 (EOY) + e. The intercept was 1,562.742. The STAAR Reading score was 1,563 as EOY
was zero. The slope for EOY was 0.269, indicating that the STAAR Reading score was 1,563
(1,563 + 1) as the EOY score increases 1 unit.
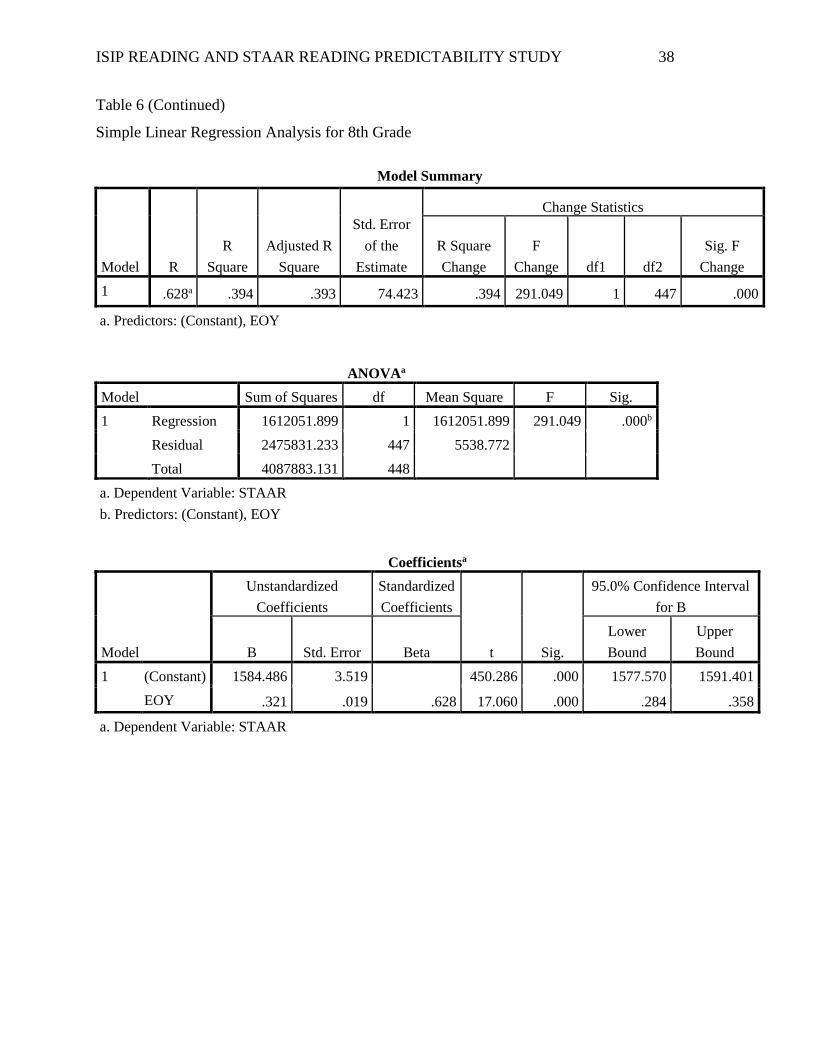
For 8th grade, 39.4 percent of the variance in STAAR Reading can be predicted from an
EOY score. The equation for predicting the STAAR Reading score is STAAR = 1,584.486 +
0.321 (EOY) + e. The intercept was 1,584.486. The STAAR Reading score was 1,584 as EOY
was zero. The slope for EOY was 0.321, indicating that the STAAR Reading score was 1,584
(1,584 + 0) as the EOY score increases 1 unit.

ISIP READING AND STAAR READING PREDICTABILITY STUDY 10
In summary, the findings demonstrate that ISIP Overall Reading Ability EOY scores are
a reasonably good predictor. The prediction coefficients (R2) were relatively high across grades,
indicating that ISIP Reading measures are predictive of STAAR Reading tests across grades.
Part II: Prediction Bands
The confidence interval (CI) was applied to obtain the prediction band for each grade
within each STAAR Reading performance standards from simple linear regression results. The
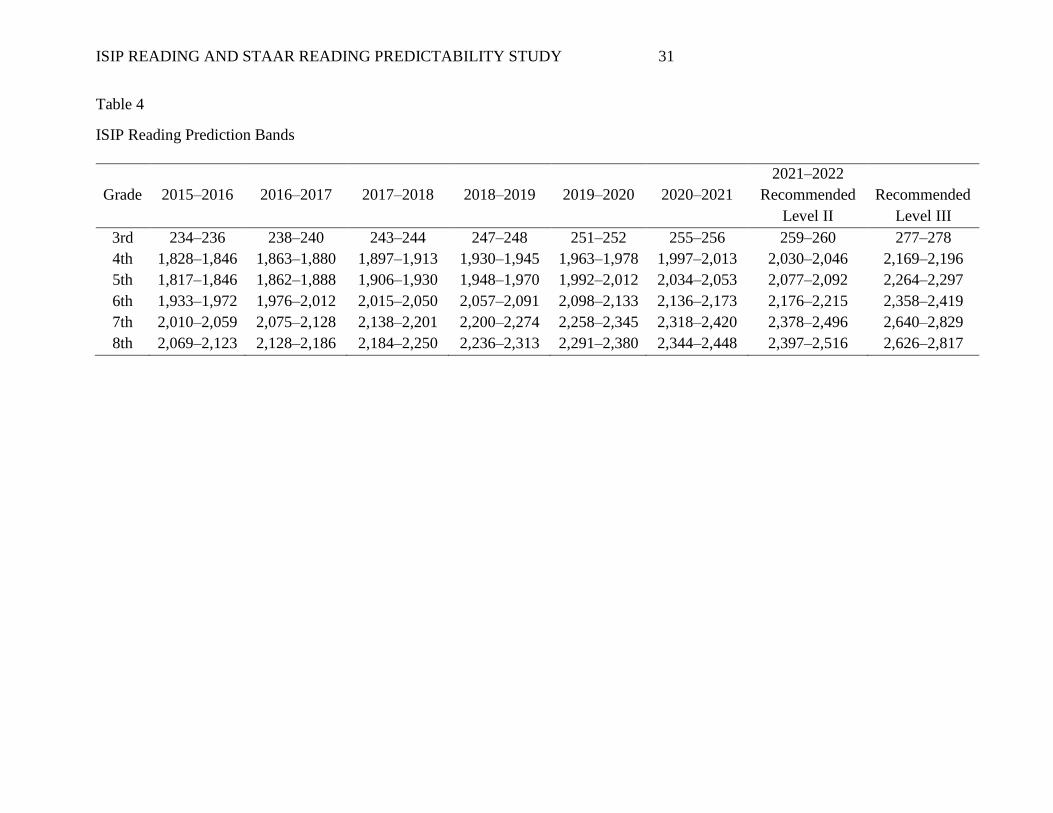
confidence level was set at 0.95. Table 4 shows the prediction bands for 2015–2016, 2016–2017,
2017–2018, 2018–2019, 2019–2020, 2020–2021, 2021–2022 Recommended Level II, and 2021–
2022 Recommended Level III STAAR Reading performance standards across grades, and Table
5 shows ISIP Reading cut scores to predict passing STAAR Reading tests. The results are
reported as follows.
2015–2016 STAAR Reading Performance Standards
For 3rd grade, the prediction band ranges from 234 to 236. The ISIP Early Reading score
at 236 is the cut score. It is 95 percent certain that a group of students who have an ISIP Early
Reading score of 236 will score higher than the STAAR Reading cut score 1,345. In other words,
3rd grade students who score 236 or higher on ISIP Early Reading will almost certainly pass
STAAR Reading tests.
For 4th grade, the prediction band ranges from 1,828 to 1,846. The ISIP Advanced
Reading score at 1,846 is the cut score. It is 95 percent certain that a group of students who have
an ISIP Advanced Reading score of 1,846 will score higher than the STAAR Reading cut score
1,434. In other words, 4th grade students who score 1,846 or higher on ISIP Advanced Reading
will almost certainly pass STAAR Reading tests.
ISIP READING AND STAAR READING PREDICTABILITY STUDY 11
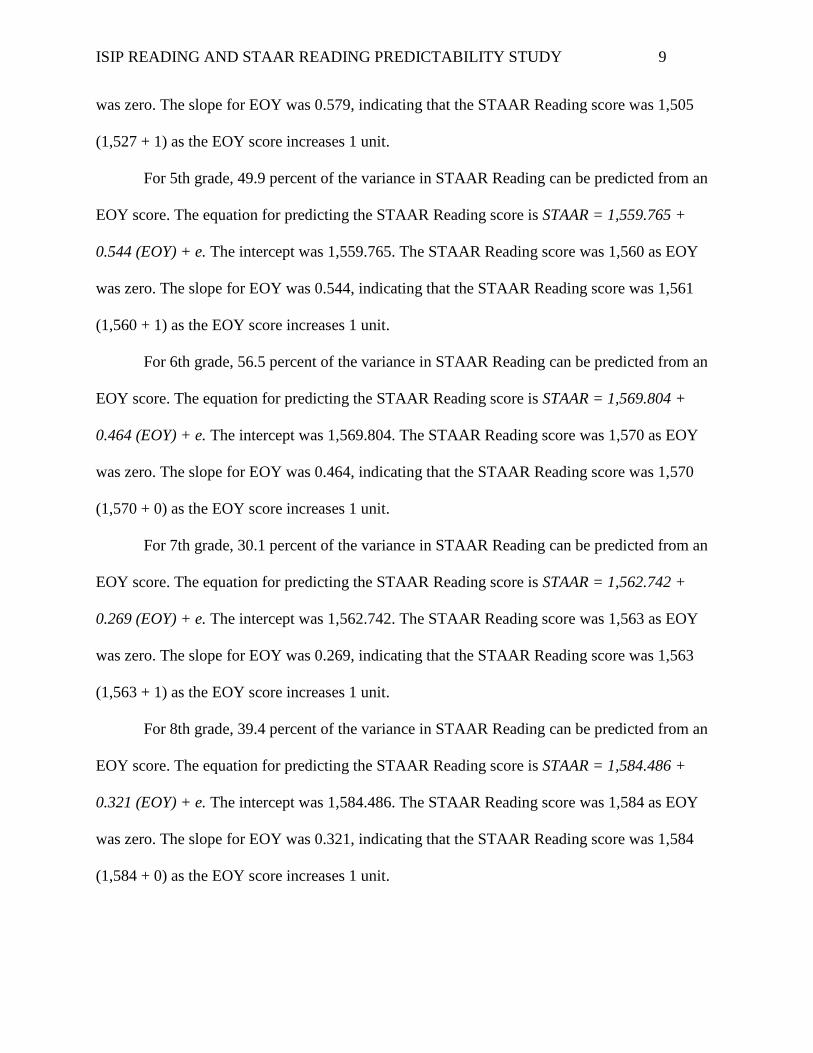
For 5th grade, the prediction band ranges from 1,817 to 1,846. The ISIP Advanced
Reading score at 1,846 is the cut score. It is 95 percent certain that a group of students who have
an ISIP Advanced Reading score of 1,846 will score higher than the STAAR Reading cut score
1,470. In other words, 5th grade students who score 1,846 or higher on ISIP Advanced Reading
will almost certainly pass STAAR Reading tests.
For 6th grade, the prediction band ranges from 1,933 to 1,972. The ISIP Advanced
Reading score at 1,972 is the cut score. It is 95 percent certain that a group of students who have
an ISIP Advanced Reading score of 1,972 will score higher than the STAAR Reading cut score
1,517. In other words, 6th grade students who score 1,972 or higher on ISIP Advanced Reading
will almost certainly pass STAAR Reading tests.
For 7th grade, the prediction band ranges from 2,010 to 2,059. The ISIP Advanced
Reading score at 2,059 is the cut score. It is 95 percent certain that a group of students who have
an ISIP Advanced Reading score of 2,059 will score higher than the STAAR Reading cut score
1,567. In other words, 7th grade students who score 2,059 or higher on ISIP Advanced Reading
will almost certainly pass STAAR Reading tests.
For 8th grade, the prediction band ranges from 2,069 to 2,123. The ISIP Advanced
Reading score at 2,123 is the cut score. It is 95 percent certain that a group of students who have
an ISIP Advanced Reading score of 2,123 will score higher than the STAAR Reading cut score
1,587. In other words, 8th grade students who score 2,123 or higher on ISIP Advanced Reading
will almost certainly pass STAAR Reading tests.
2016–2017 STAAR Reading Performance Standards
For 3rd grade, the prediction band ranges from 238 to 240. The ISIP Early Reading score
at 240 is the cut score. It is 95 percent certain that a group of students who have an ISIP Early

ISIP READING AND STAAR READING PREDICTABILITY STUDY 12
Reading score of 240 (4 points higher than previous year cut score) will score higher than the
STAAR Reading cut score 1,365 (20 points higher than previous year cut score). In other words,
3rd grade students who score 240 or higher on ISIP Early Reading will almost certainly pass
STAAR Reading tests.
For 4th grade, the prediction band ranges from 1,863 to 1,880. The ISIP Advanced
Reading score at 1,880 is the cut score. It is 95 percent certain that a group of students who have
an ISIP Advanced Reading score of 1,880 (34 points higher than previous year cut score) will
score higher than the STAAR Reading cut score 1,454 (20 points higher than previous year cut
score). In other words, 4th grade students who score 1,880 or higher on ISIP Advanced Reading
will almost certainly pass STAAR Reading tests.
For 5th grade, the prediction band ranges from 1,862 to 1,888. The ISIP Advanced
Reading score at 1,888 is the cut score. It is 95 percent certain that a group of students who have
an ISIP Advanced Reading score of 1,888 (42 points higher than previous year cut score) will
score higher than the STAAR Reading cut score 1,489 (19 points higher than previous year cut
score). In other words, 5th grade students who score 1,888 or higher on ISIP Advanced Reading
will almost certainly pass STAAR Reading tests.
For 6th grade, the prediction band ranges from 1,976 to 2,012. The ISIP Advanced
Reading score at 2,012 is the cut score. It is 95 percent certain that a group of students who have
an ISIP Advanced Reading score of 2,012 (30 points higher than previous year cut score) will
score higher than the STAAR Reading cut score 1,536 (19 points higher than previous year cut
score). In other words, 6th grade students who score 2,012 or higher on ISIP Advanced Reading
will almost certainly pass STAAR Reading tests.
ISIP READING AND STAAR READING PREDICTABILITY STUDY 13
For 7th grade, the prediction band ranges from 2,075 to 2,128. The ISIP Advanced
Reading score at 2,128 is the cut score. It is 95 percent certain that a group of students who have
an ISIP Advanced Reading score of 2,128 (69 points higher than previous year cut score) will
score higher than the STAAR Reading cut score 1,585 (18 points higher than previous year cut
score). In other words, 7th grade students who score 2,128 or higher on ISIP Advanced Reading
will almost certainly pass STAAR Reading tests.
For 8th grade, the prediction band ranges from 2,128 to 2,186. The ISIP Advanced
Reading score at 2,186 is the cut score. It is 95 percent certain that a group of students who have
an ISIP Advanced Reading score of 2,186 (63 points higher than previous year cut score) will
score higher than the STAAR Reading cut score 1,606 (19 points higher than previous year cut
score). In other words, 8th grade students who score 2,123 or higher on ISIP Advanced Reading
will almost certainly pass STAAR Reading tests.
2017–2018 STAAR Reading Performance Standards
For 3rd grade, the prediction band ranges from 243 to 244. The ISIP Early Reading score
at 244 is the cut score. It is 95 percent certain that a group of students who have an ISIP Early
Reading score of 244 (4 points higher than previous year cut score) will score higher than the
STAAR Reading cut score 1,386 (21 points higher than previous year cut score). In other words,
3rd grade students who score 244 or higher on ISIP Early Reading will almost certainly pass
STAAR Reading tests.
For 4th grade, the prediction band ranges from 1,897 to 1,913. The ISIP Advanced
Reading score at 1,913 is the cut score. It is 95 percent certain that a group of students who have
an ISIP Advanced Reading score of 1,913 (33 points higher than previous year cut score) will
score higher than the STAAR Reading cut score 1,473 (19 points higher than previous year cut
ISIP READING AND STAAR READING PREDICTABILITY STUDY 14
score). In other words, 4th grade students who score 1,913 or higher on ISIP Advanced Reading
will almost certainly pass STAAR Reading tests.
For 5th grade, the prediction band ranges from 1,906 to 1,930. The ISIP Advanced
Reading score at 1,930 is the cut score. It is 95 percent certain that a group of students who have
an ISIP Advanced Reading score of 1,930 (42 points higher than previous year cut score) will
score higher than the STAAR Reading cut score 1,508 (19 points higher than previous year cut
score). In other words, 5th grade students who score 1,930 or higher on ISIP Advanced Reading
will almost certainly pass STAAR Reading tests.
For 6th grade, the prediction band ranges from 2,015 to 2,050. The ISIP Advanced
Reading score at 2,050 is the cut score. It is 95 percent certain that a group of students who have
an ISIP Advanced Reading score of 2,050 (38 points higher than previous year cut score) will
score higher than the STAAR Reading cut score 1,554 (18 points higher than previous year cut
score). In other words, 6th grade students who score 2,050 or higher on ISIP Advanced Reading
will almost certainly pass STAAR Reading tests.
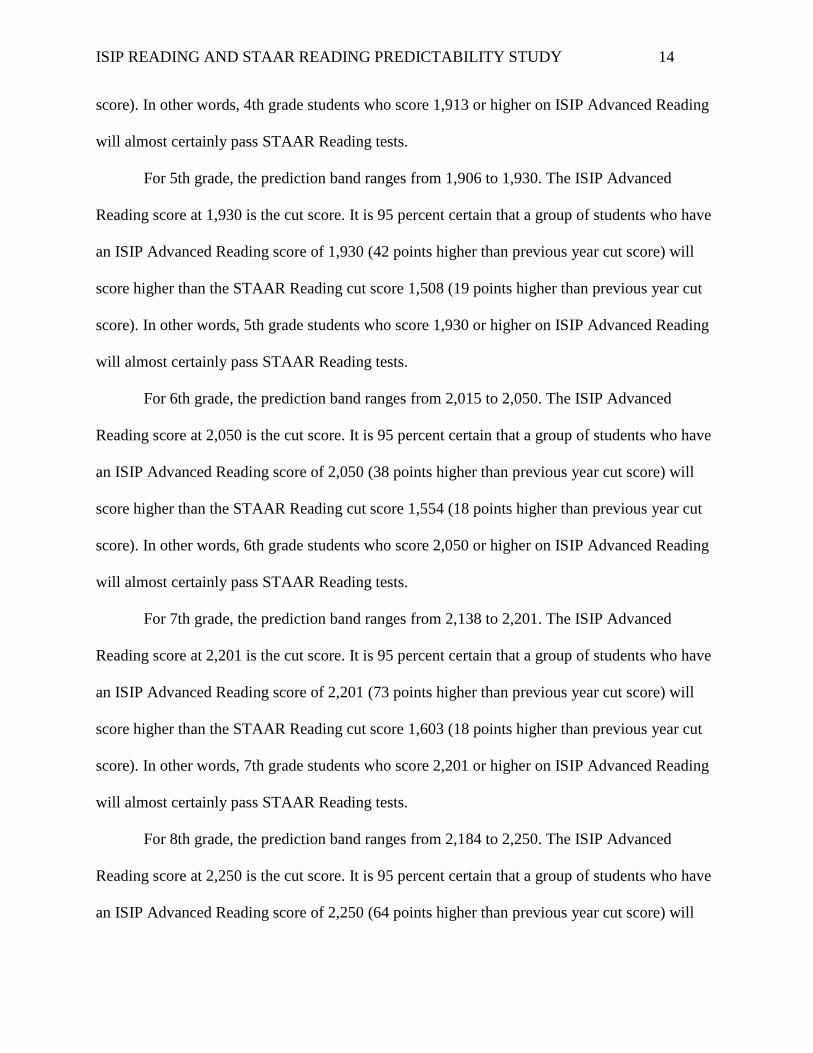
For 7th grade, the prediction band ranges from 2,138 to 2,201. The ISIP Advanced
Reading score at 2,201 is the cut score. It is 95 percent certain that a group of students who have
an ISIP Advanced Reading score of 2,201 (73 points higher than previous year cut score) will
score higher than the STAAR Reading cut score 1,603 (18 points higher than previous year cut
score). In other words, 7th grade students who score 2,201 or higher on ISIP Advanced Reading
will almost certainly pass STAAR Reading tests.
For 8th grade, the prediction band ranges from 2,184 to 2,250. The ISIP Advanced
Reading score at 2,250 is the cut score. It is 95 percent certain that a group of students who have
an ISIP Advanced Reading score of 2,250 (64 points higher than previous year cut score) will
ISIP READING AND STAAR READING PREDICTABILITY STUDY 15
score higher than the STAAR Reading cut score 1,625 (19 points higher than previous year cut
score). In other words, 8th grade students who score 2,250 or higher on ISIP Advanced Reading
will almost certainly pass STAAR Reading tests.
2018–2019 STAAR Reading Performance Standards
For 3rd grade, the prediction band ranges from 247 to 248. The ISIP Early Reading score
at 248 is the cut score. It is 95 percent certain that a group of students who have an ISIP Early
Reading score of 248 (4 points higher than previous year cut score) will score higher than the
STAAR Reading cut score 1,406 (20 points higher than previous year cut score). In other words,
3rd grade students who score 248 or higher on ISIP Early Reading will almost certainly pass
STAAR Reading tests.
For 4th grade, the prediction band ranges from 1,930 to 1,945. The ISIP Advanced
Reading score at 1,945 is the cut score. It is 95 certain that a group of students who have an ISIP
Advanced Reading score of 1,945 (32 points higher than previous year cut score) will score
higher than the STAAR Reading cut score 1,492 (19 points higher than previous year cut score).
In other words, a group of 4th grade students who score 1,945 or higher on ISIP Advanced
Reading will almost certainly pass STAAR Reading tests.
For 5th grade, the prediction band ranges from 1,948 to 1,970. The ISIP Advanced
Reading score at 1,970 is the cut score. It is 95 certain that a group of students who have an ISIP
Advanced Reading score of 1,970 (40 points higher than previous year cut score) will score
higher than the STAAR Reading cut score 1,526 (18 points higher than previous year cut score).
In other words, 5th grade students who score 1,970 or higher on ISIP Advanced Reading will
almost certainly pass STAAR Reading tests.
ISIP READING AND STAAR READING PREDICTABILITY STUDY 16
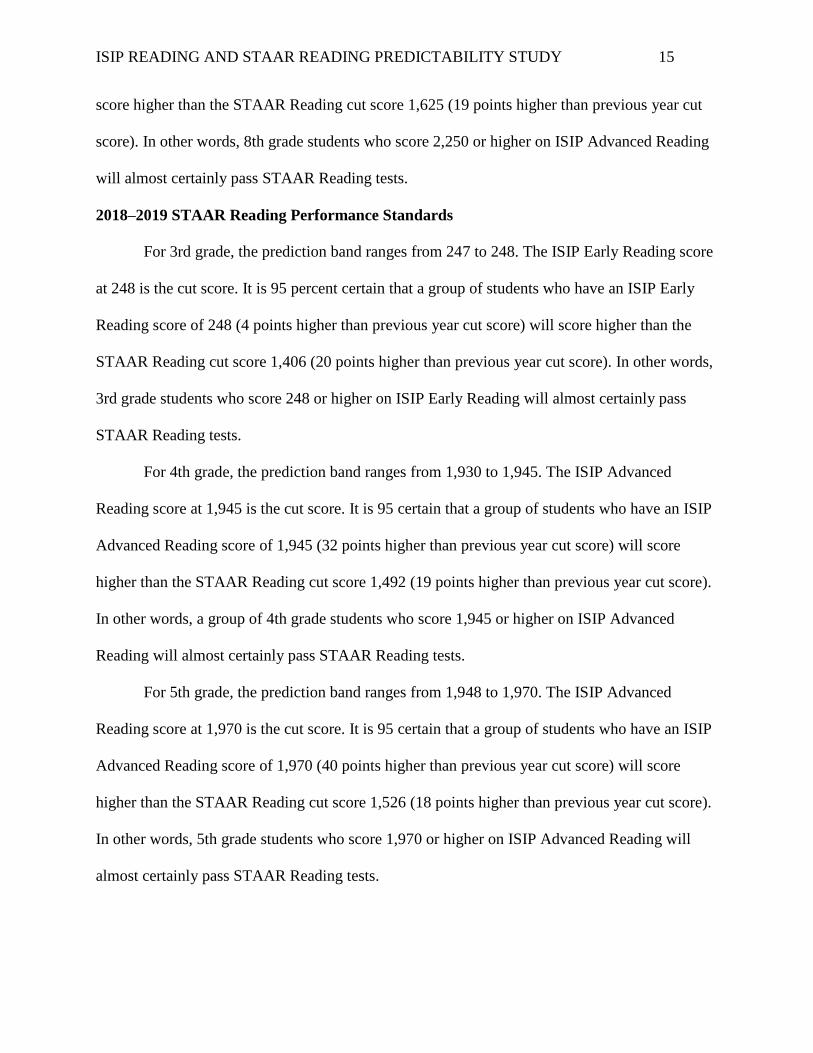
For 6th grade, the prediction band ranges from 2,057 to 2,091. The ISIP Advanced
Reading score at 2,091 is the cut score. It is 95 certain that a group of students who have an ISIP
Advanced Reading score of 2,091 (41 points higher than previous year cut score) will score
higher than the STAAR Reading cut score 1,573 (19 points higher than previous year cut score).
In other words, 6th grade students who score 2,091 or higher on ISIP Advanced Reading will
almost certainly pass STAAR Reading tests.
For 7th grade, the prediction band ranges from 2,200 to 2,274. The ISIP Advanced
Reading score at 2,274 is the cut score. It is 95 percent certain that a group of students who have
an ISIP Advanced Reading score of 2,274 (73 points higher than previous year cut score) will
score higher than the STAAR Reading cut score 1,621 (18 points higher than previous year cut
score). In other words, 7th grade students who score 2,274 or higher on ISIP Advanced Reading
will almost certainly pass STAAR Reading tests.
For 8th grade, the prediction band ranges from 2,236 to 2,313. The ISIP Advanced
Reading score at 2,313 is the cut score. It is 95 percent certain that a group of students who have
an ISIP Advanced Reading score of 2,313 (63 points higher than previous year cut score) will
score higher than the STAAR Reading cut score 1,643 (18 points higher than previous year cut
score). In other words, 8th grade students who score 2,313 or higher on ISIP Advanced Reading
will almost certainly pass STAAR Reading tests.
2019–2020 STAAR Reading Performance Standards
For 3rd grade, the prediction band ranges from 251 to 252. The ISIP Early Reading score
at 252 is the cut score. It is 95 percent certain that a group of students who have an ISIP Early
Reading score of 252 (4 points higher than previous year cut score) will score higher than the
STAAR Reading cut score 1,427 (21 points higher than previous year cut score). In other words,
ISIP READING AND STAAR READING PREDICTABILITY STUDY 17
3rd grade students who score 252 or higher on ISIP Early Reading will almost certainly pass
STAAR Reading tests.
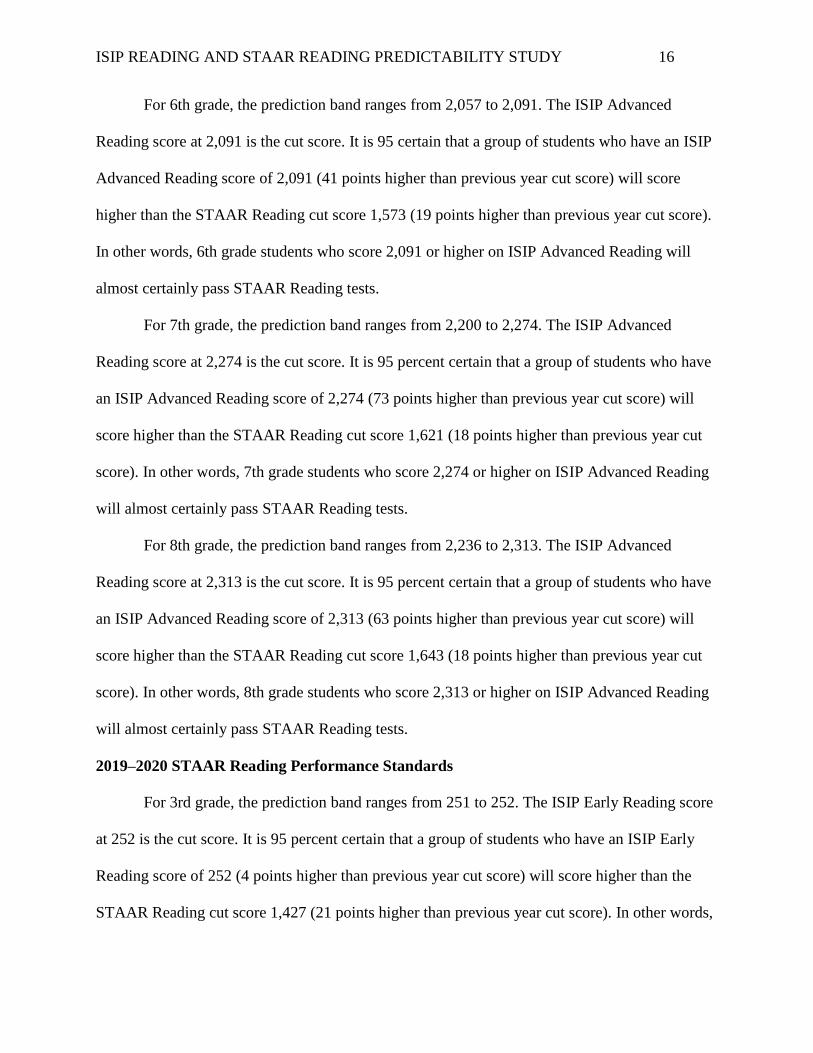
For 4th grade, the prediction band ranges from 1,963 to 1,978. The ISIP Advanced
Reading score at 1,978 is the cut score. It is 95 percent certain that a group of students who have
an ISIP Advanced Reading score of 1,978 (33 points higher than previous year cut score) will
score higher than the STAAR Reading cut score 1,511 (19 points higher than previous year cut
score). In other words, 4th grade students who score 1,978 or higher on ISIP Advanced Reading
will almost certainly pass STAAR Reading tests.
For 5th grade, the prediction band ranges from 1,992 to 2,012. The ISIP Advanced
Reading score at 2,012 is the cut score. It is 95 percent certain that a group of students who have
an ISIP Advanced Reading score of 2,012 (42 points higher than previous year cut score) will
score higher than the STAAR Reading cut score 1,545 (19 points higher than previous year cut
score). In other words, 5th grade students who score 2,012 or higher on ISIP Advanced Reading
will almost certainly pass STAAR Reading tests.
For 6th grade, the prediction band ranges from 2,098 to 2,133. The ISIP Advanced
Reading score at 2,133 is the cut score. It is 95 percent certain that a group of students who have
an ISIP Advanced Reading score at 2,133 (42 points higher than previous year cut score) will
score higher than the STAAR Reading cut score 1,592 (19 points higher than previous year cut
score). In other words, 6th grade students who score 2,133 or higher on ISIP Advanced Reading
will almost certainly pass STAAR Reading tests.
For 7th grade, the prediction band ranges from 2,258 to 2,345. The ISIP Advanced
Reading score at 2,345 is the cut score. It is 95 percent certain that a group of students who have
an ISIP Advanced Reading score of 2,345 (71 points higher than previous year cut score) will

ISIP READING AND STAAR READING PREDICTABILITY STUDY 18
score higher than the STAAR Reading cut score 1,638 (17 points higher than previous year cut
score). In other words, 7th grade students who score 2,345 or higher on ISIP Advanced Reading
will almost certainly pass STAAR Reading tests.
For 8th grade, the prediction band ranges from 2,291 to 2,380. The ISIP Advanced
Reading score at 2,380 is the cut score. It is 95 percent certain that a group of students who have
an ISIP Advanced Reading score of 2,380 (67 points higher than previous year cut score) will
score higher than the STAAR Reading cut score 1,662 (19 points higher than last previous cut
score). In other words, 8th grade students who score 2,380 or higher on ISIP Advanced Reading
will almost certainly pass STAAR Reading tests.
2020–2021 STAAR Reading Performance Standards
For 3rd grade, the prediction band ranges from 255 to 256. The ISIP Early Reading score
at 256 is the cut score. It is 95 percent certain that a group of students who have an ISIP Early
Reading score of 256 (4 points higher than previous year cut score) will score higher than the
STAAR Reading cut score 1,447 (20 points higher than previous year cut score). In other words,
3rd grade students who score 256 or higher on ISIP Early Reading will almost certainly pass
STAAR Reading tests.
For 4th grade, the prediction band ranges from 1,997 to 2,013. The ISIP Advanced
Reading score at 2,013 is the cut score. It is 95 percent certain that a group of students who have
an ISIP Advanced Reading score of 2,013 (35 points higher than previous year cut score) will
score higher than the STAAR Reading cut score 1,531 (20 points higher than previous year cut
score). In other words, 4th grade students who score 2,013 or higher on ISIP Advanced Reading
will almost certainly pass STAAR Reading tests.
ISIP READING AND STAAR READING PREDICTABILITY STUDY 19
For 5th grade, the prediction band ranges from 2,034 to 2,053. The ISIP Advanced
Reading score at 2,053 is the cut score. It is 95 percent certain that a group of students who have
an ISIP Advanced Reading score of 2,053 (41 points higher than previous year cut score) will
score higher than the STAAR Reading cut score 1,563 (18 points higher than previous year cut
score). In other words, 5th grade students who score 2,053 or higher on ISIP Advanced Reading
will almost certainly pass STAAR Reading tests.
For 6th grade, the prediction band ranges from 2,136 to 2,173. The ISIP Advanced
Reading score at 2,173 is the cut score. It is 95 percent certain that a group of students who have
an ISIP Advanced Reading score of 2,173 (40 points higher than previous year cut score) will
score higher than the STAAR Reading cut score 1,610 (18 points higher than previous year cut
score). In other words, 6th grade students who score 2,173 or higher on ISIP Advanced Reading
will almost certainly pass STAAR Reading tests.
For 7th grade, the prediction band ranges from 2,318 to 2,420. The ISIP Advanced
Reading score at 2,420 is the cut score. It is 95 percent certain that a group of students who have
an ISIP Advanced Reading score of 2,420 (75 points higher than previous year cut score) will
score higher than the STAAR Reading cut score 1,656 (18 points higher than previous year cut
score). In other words, 7th grade students who score 2,420 or higher on ISIP Advanced Reading
will almost certainly pass STAAR Reading tests.
For 8th grade, the prediction band ranges from 2,344 to 2,448. The ISIP Advanced
Reading score at 2,448 is the cut score. It is 95 percent certain that a group of students who have
an ISIP Advanced Reading score of 2,448 (68 points higher than previous year cut score) will
score higher than the STAAR Reading cut score 1,681 (19 points higher than previous year cut

ISIP READING AND STAAR READING PREDICTABILITY STUDY 20
score). In other words, 8th grade students who score 2,448 or higher on ISIP Advanced Reading
will almost certainly pass STAAR Reading tests.
2020–2021 Recommended Level II STAAR Reading Performance Standards
For 3rd grade, the prediction band ranges from 259 to 260. The ISIP Early Reading score
at 260 is the cut score. It is 95 percent certain that a group of students who have an ISIP Early
Reading score of 260 (4 points higher than previous year cut score) will score higher than the
STAAR Reading cut score 1,468 (21 points higher than previous year cut score). In other words,
3rd grade students who score 260 or higher on ISIP Early Reading will almost certainly pass
STAAR Reading tests.
For 4th grade, the prediction band ranges from 2,030 to 2,046. The ISIP Advanced
Reading score at 2,046 is the cut score. It is 95 certain that a group of students who have an ISIP
Advanced Reading score of 2,046 (33 points higher than last year cut score) will score higher
than the STAAR Reading cut score 1,550 (19 points higher than previous year cut score). In
other words, 4th grade students who score 2,046 or higher on ISIP Advanced Reading will
almost certainly pass STAAR Reading tests.
For 5th grade, the prediction band ranges from 2,077 to 2,092. The ISIP Advanced
Reading score at 2,092 is the cut score. It is 95 certain that a group of students who have an ISIP
Advanced Reading score of 2,092 (39 points higher than previous year cut score) will score
higher than the STAAR Reading cut score 1,582 (19 points higher than previous year cut score).
In other words, 5th grade students who score 2,092 or higher on ISIP Advanced Reading will
almost certainly pass STAAR Reading tests.
For 6th grade, the prediction band ranges from 2,176 to 2,215. The ISIP Advanced
Reading score at 2,215 is the cut score. It is 95 certain that a group of students who have an ISIP
ISIP READING AND STAAR READING PREDICTABILITY STUDY 21
Advanced Reading score of 2,215 (42 points higher than previous year cut score) will score
higher than the STAAR Reading cut score 1,629 (19 points higher than previous year cut score).
In other words, 6th grade students who score 2,215 or higher on ISIP Advanced Reading will
almost certainly pass STAAR Reading tests.
For 7th grade, the prediction band ranges from 2,378 to 2,496. The ISIP Advanced
Reading score at 2,496 is the cut score. It is 95 percent certain that a group of students who have
an ISIP Advanced Reading score of 2,496 (76 points higher than previous year cut score) will
score higher than the STAAR Reading cut score 1,674 (18 points higher than previous year cut
score). In other words, 7th grade students who score 2,496 or higher on ISIP Advanced Reading
will almost certainly pass STAAR Reading tests.
For 8th grade, the prediction band ranges from 2,397 to 2,516. The ISIP Advanced
Reading score at 2,516 is the cut score. It is 95 percent certain that a group of students who have
an ISIP Advanced Reading score of 2,516 (68 points higher than previous year cut score) will
score higher than the STAAR Reading cut score 1,700 (19 points higher than previous year cut
score). In other words, 8th grade students who score 2,516 or higher on ISIP Advanced Reading
will almost certainly pass STAAR Reading tests.
2020–2021 Recommended Level III STAAR Reading Performance Standards
For 3rd grade, the prediction band ranges from 277 to 278. The ISIP Early Reading score
at 278 is the cut score. It is 95 percent certain that a group of students who have an ISIP Early
Reading score of 278 (8 points higher than 2020–2021 Recommended Level II cut score) will
score higher than the STAAR Reading cut score 1,555 (87 points higher than 2020–2021
Recommended Level II cut score). In other words, 3rd grade students who score 278 or higher on
ISIP Early Reading will almost certainly pass STAAR Reading tests at Level III standards.
ISIP READING AND STAAR READING PREDICTABILITY STUDY 22
For 4th grade, the prediction band ranges from 2,169 to 2,196. The ISIP Advanced
Reading score at 2,196 is the cut score. It is 95 percent certain that a group of students who have
an ISIP Advanced Reading score of 2,196 (150 points higher than 2020–2021 Recommended
Level II cut score) will score higher than the STAAR Reading cut score 1,633 (83 points higher
than 2020–2021 Recommended Level II cut score). In other words, 4th grade students who score
2,196 or higher on ISIP Advanced Reading will almost certainly pass STAAR Reading tests at
Level III standards.
For 5th grade, the prediction band ranges from 2,264 to 2,297. The ISIP Advanced
Reading score at 2,297 is the cut score. It is 95 percent certain that a group of students who have
an ISIP Advanced Reading score of 2,297 (205 points higher than 2020–2021 Recommended
Level II cut score) will score higher than the STAAR Reading cut score 1,667 (85 points higher
than 2020–2021 Recommended Level II cut score). In other words, 5th grade students who score
2,296 or higher on ISIP Advanced Reading will almost certainly pass STAAR Reading tests at
Level III standards.
For 6th grade, the prediction band ranges from 2,358 to 2,419. The ISIP Advanced
Reading score at 2,419 is the cut score. It is 95 percent certain that a group of students who have
an ISIP Advanced Reading score of 2,419 (204 points higher than 2020–2021 Recommended
Level II cut score) will score higher than the STAAR Reading cut score 1,718 (89 points higher
than 2020–2021 Recommended Level II cut score). In other words, 6th grade students who score
2,419 or higher on ISIP Advanced Reading will almost certainly pass STAAR Reading tests at
Level III standards.
For 7th grade, the prediction band ranges from 2,640 to 2,829. The ISIP Advanced
Reading score at 2,829 is the cut score. It is 95 percent certain that a group of students who have

ISIP READING AND STAAR READING PREDICTABILITY STUDY 23
an ISIP Advanced Reading score of 2,829 (333 points higher than 2020–2021 Recommended
Level II cut score) will score higher than the STAAR Reading cut score 1,753 (79 points higher
than 2020–2021 Recommended Level II cut score). In other words, 7th grade students who score
2,829 or higher on ISIP Advanced Reading will almost certainly pass STAAR Reading tests at
Level III standards.
For 8th grade, the prediction band ranges from 2,626 to 2,817. The ISIP Advanced
Reading score at 2,817 is the cut score. It is 95 percent certain that a group of students who have
an ISIP Advanced Reading score of 2,817 (301 points higher than 2020–2021 Recommended
Level II cut score) will score higher than the STAAR Reading cut score 1,783 (83 points higher
than 2020–2021 Recommended Level II cut score). In other words, 8th grade students who score
2,817 or higher on ISIP Advanced Reading will almost certainly pass STAAR Reading tests at
Level III standards.
In summary, STAAR Reading performance standards increase approximately 20 points
yearly for each grade level from 2015–2016 standards to 2021–2022 Recommended Level II
standards. Using 2015–2016 ISIP Reading cut scores as a base line, the results show that ISIP
Reading cut scores also increase constantly. ISIP Reading cut scores for 3rd grade increase 4
points for each STAAR Reading performance standards (see Table 5). The ISIP Reading gain
scores are all 4 points for 2015–2016 standards to 2021–2022 Recommended Level II standards.
ISIP Reading cut scores for 4th grade increase approximately 30 points continuously over years.
The ISIP Reading gain scores are 34, 33, 32, 33, 35, and 33 for 2015–2016 standards to 2021–
2022 Recommended Level II standards, respectively. ISIP Reading cut scores for 5th grade
constantly increase approximately 40 points. The ISIP Reading gain scores are 42, 42, 40, 42, 41,
and 39 for 2015–2016 standards to 2021–2022 Recommended Level II standards, respectively.
ISIP READING AND STAAR READING PREDICTABILITY STUDY 24
Similar to 5th grade, ISIP Reading cut scores increase approximately 40 points for 6th grade.
The ISIP Reading gain scores are 30, 38, 41, 42, 40, and 42 for 2015–2016 standards to 2021–
2022 Recommended Level II standards, respectively. ISIP Reading cut scores for 7th and 8th
grade increase approximately 70 points for each year. The ISIP Reading gain scores are 69, 73,
73, 71, 75, and 76 for 7th grade and 63, 64, 63, 67, 68, and 68 for 8th grade for 2015–2016
standards to 2021–2022 Recommended Level II standards, respectively.
STAAR Reading performance standards increase approximately 80 points from 2021–
2022 Recommended Level II standards to 2021–2022 Recommended Level III standards. The
results show that ISIP Reading gain scores are 8, 150, 205, 204, 333, and 301 for grades 3
through 8, respectively. 3rd grade students need 8 more points on ISIP Reading scores to be able
to meet STAAR Reading Recommended Level III standards; 4th grade students need 150; 5th
grade students need 205; 6th grade students need 204; 7th grade students need 333; and 8th grade
students need 301 more points. Figure 1 shows ISIP Reading cut scores and STAAR
performance standards for 2015–2016 (pink lines), 2016–2017 (green lines), 2017–2018 (purple
lines), 2018–2019 (gray lines), 2019–2020 (yellow lines), 2020–2021 (light green lines), 2020–
2021 Recommended Level II (orange lines) and Recommended Level III (blue lines) for 3rd
grade. Even though only the 3rd grade graph is presented, similar patterns are found across
grades.
Conclusions
These results of simple linear regression add to the evidence that ISIP Reading tests are
predictive of STAAR Reading tests across grades and are consistent with prior studies
(Patarapichayatham, Fahle, & Roden, 2013; Patarapichayatham, Fahle, & Roden, 2014;
Patarapichayatham, 2015). The ISIP Reading tests can serve as predictors of how students will

ISIP READING AND STAAR READING PREDICTABILITY STUDY 25
score on STAAR Reading tests. The ISIP Reading cut scores to predict passing STAAR Reading
tests are useful for school administrators, superintendents, teachers, and parents to predict
students’ performance on STAAR Reading tests. Also, teachers can use ISIP Reading cut scores
to encourage students to improve their reading ability in order to meet STAAR performance
standards. Teachers and parents can compare a student’s ISIP Overall Reading Ability score
directly with the ISIP Reading cut score.
To benefit from these results, teachers would ideally begin tracking to their students’
scores from the beginning of the school year. By comparing a student’s score with the ISIP
Reading cut score, teachers can immediately tell how much a student must improve his or her
reading ability in order to meet the ISIP Reading cut score, which means a likely chance of
passing the STAAR Reading test. For example, under the 2015–2016 school year, the ISIP
Reading cut score for 3rd grade is 236. If a 3rd grade student scores 230 at the beginning of the
year (September assessment), the teacher will know that this particular student has room to grow:
the student will need about 6 more points to meet ISIP Reading cut score at the end of the year.
The teacher can work closely with this student to improve reading skills throughout school year.
Even though this study suggests that teachers use ISIP Reading cut scores to prepare
students for STAAR Reading tests, it must be understood that complete certainty of passing the
STAAR Reading test is actually unknown. To be more specific, the graph on Figure 1 shows that
ISIP Reading cut scores and STAAR Reading performance standards create four meaningful
quadrants. Quadrant I shows students who met the ISIP Reading cut score and passed the
STAAR Reading test. A majority of students are in this quadrant, indicating that ISIP Reading
tests are predictive of STAAR Reading tests. Quadrant II shows students who did not meet the
ISIP Reading cut score but passed the STAAR Reading test. Only a few students are in Quadrant
ISIP READING AND STAAR READING PREDICTABILITY STUDY 26
II, confirming that ISIP Reading tests are highly correlated with STAAR Reading tests. Quadrant
III shows students who did not meet the ISIP Reading cut score and did not pass the STAAR
Reading test. Many students fall into Quadrant III, showing that if students do not do well on
ISIP Reading tests, it will be almost impossible for them to pass STAAR Reading tests. Again,
this finding also confirms a relationship between ISIP Reading tests and STAAR Reading tests.
Quadrant IV shows students who met the ISIP Reading cut score but did not pass the STAAR
Reading test. A few students fall in this quadrant, unfortunately. However, it must be noted that
there are many other factors that may affect students’ STAAR Reading scores beside their
reading ability. For example, if a student has a physical issue (e.g., sickness or stress) before or
during the STAAR Reading test, he or she may or may not pass, despite having met the ISIP
Reading cut score.
Overall, I conclude that ISIP Reading tests are predictive of STAAR Reading tests across
grades. ISIP Reading curriculum and ISIP Reading tests definitely can be used to prepare
students for the STAAR Reading tests. If a student does very well on ISIP Reading tests, it is
likely that he or she will almost certainly pass STAAR Reading tests in spring.
ISIP READING AND STAAR READING PREDICTABILITY STUDY 27
References
Mathes, P. (2011). Technical manual: Istation’s Indicators of Progress, Advanced Reading:
Computer adaptive testing system for continuous progress monitoring of reading growth
for students grade 4 to grade 8.
Mathes, P., Torgesen, J., & Herron, J. (2011). Technical manual: Istation’s Indicators of
Progress, early reading: computer adaptive testing system for continuous progress
monitoring of reading growth for students pre-K to grade 3.
Patarapichayatham, C., Fahle, W., & Roden, T. R. (2013). ISIP reading versus STAAR reading:
The predictability study. Dallas, TX: Istation.
Patarapichayatham, C., Fahle, W., & Roden, T. R. (2014). Predictability study of ISIP Reading
and STAAR Reading: Prediction bands. Dallas, TX: Istation.
Patarapichayatham, C. (2015). Predictability study of ISIP Reading and STAAR Reading:
Prediction bands. Dallas, TX: Istation.

ISIP READING AND STAAR READING PREDICTABILITY STUDY 28
Table 1
Descriptive Statistics of ISIP Reading and STAAR Reading Scale Scores
Grade
ISIP STAAR Correlation between
ISIP and STAAR n Mean SD Mean SD
3rd 3,397 253.00 22.05 1,438.26 143.58 0.737
4th 3,400 1,958.99 183.54 1,509.61 138.77 0.735
5th 3,556 2,036.32 192.12 1,566.24 137.30 0.706
6th 1,116 2,066.62 228.89 1,574.71 139.10 0.752
7th 730 2,017.96 192.99 1,566.60 92.05 0.549
8th 449 2,087.84 191.12 1,588.16 95.52 0.628
ISIP READING AND STAAR READING PREDICTABILITY STUDY 29
Table 2
Demographic Variables of Sample
Grade
Gender
Ethnicity
Economically
Disadvantaged
Male
F
(%)
Female
F
(%)
Am Ind
F
(%)
Asian
F
(%)
Black
F
(%)
Hispanic
F
(%)
Multi
F
(%)
Nat Haw
F
(%)
White
F
(%)
No
F
(%)
Yes
F
(%)
3rd 1,660
(48.9)
1,737
(51.1)
10
(0.3)
300
(8.8)
624
(18.4)
1,663
(49)
80
(2.4)
1
(0)
719
(21.1)
1,162
(34.2)
2,235
(65.8)
4th 1,619
(47.6)
1,781
(52.4)
20
(0.6)
274
(8.1)
620
(18.2)
1,734
(51)
54
(1.6)
3
(0.1)
695
(20.4)
1,080
(31.8)
2,320
(68.2)
5th 1,683
(47.3)
1,973
(52.7)
9
(0.3)
312
(8.8)
618
(17.4)
1,809
(50.9)
85
(2.4)
2
(0.1)
721
(20.3)
1,136
(31.9)
2420
(68.1)
6th 528
(47.3)
588
(52.7)
7
(0.6)
103
(9.2)
236
(21.1)
569
(51)
28
(2.5)
-
-
173
(15.5)
333
(29.8)
783
(70.2)
7th 296
(40.5)
434
(59.5)
3
(0.4)
27
(3.7)
190
(26)
416
(57)
14
(1.9)
2
(0.3)
78
(10.7)
148
(20.3)
582
(79.7)
8th 197
(43.9)
252
(56.1)
4
(0.9)
7
(1.6)
155
(34.5)
218
(48.6)
13
(2.9)
1
(0.2)
51
(11.4)
89
(19.8)
360
(80.2)
Note: Am Ind = American Indian/Alaska Native; Multi = Multi-ethnicity; and Nat Haw = Native Hawaiian/Other Pacific Islander.

ISIP READING AND STAAR READING PREDICTABILITY STUDY 30
Table 3
STAAR Reading Performance Standards
Grade
STAAR Reading Performance Standards
2015–2016
2016–2017
2017–2018
2018–2019
2019–2020
2020–2021
2021–2022
Recommended
Level II
Recommended
Level III
3rd 1,345 1,365 1,386 1,406 1,427 1,447 1,468 1,555
4th 1,434 1,454 1,473 1,492 1,511 1,531 1,550 1,633
5th 1,470 1,489 1,508 1,526 1,545 1,563 1,582 1,667
6th 1,517 1,536 1,554 1,573 1,592 1,610 1,629 1,718
7th 1,567 1,585 1,603 1,621 1,638 1,656 1,674 1,753
8th 1,587 1,606 1,625 1,643 1,662 1,681 1,700 1,783
ISIP READING AND STAAR READING PREDICTABILITY STUDY 31
Table 4
ISIP Reading Prediction Bands
Grade
2015–2016
2016–2017
2017–2018
2018–2019
2019–2020
2020–2021
2021–2022
Recommended
Level II
Recommended
Level III
3rd 234–236 238–240 243–244 247–248 251–252 255–256 259–260 277–278
4th 1,828–1,846 1,863–1,880 1,897–1,913 1,930–1,945 1,963–1,978 1,997–2,013 2,030–2,046 2,169–2,196
5th 1,817–1,846 1,862–1,888 1,906–1,930 1,948–1,970 1,992–2,012 2,034–2,053 2,077–2,092 2,264–2,297
6th 1,933–1,972 1,976–2,012 2,015–2,050 2,057–2,091 2,098–2,133 2,136–2,173 2,176–2,215 2,358–2,419
7th 2,010–2,059 2,075–2,128 2,138–2,201 2,200–2,274 2,258–2,345 2,318–2,420 2,378–2,496 2,640–2,829
8th 2,069–2,123 2,128–2,186 2,184–2,250 2,236–2,313 2,291–2,380 2,344–2,448 2,397–2,516 2,626–2,817
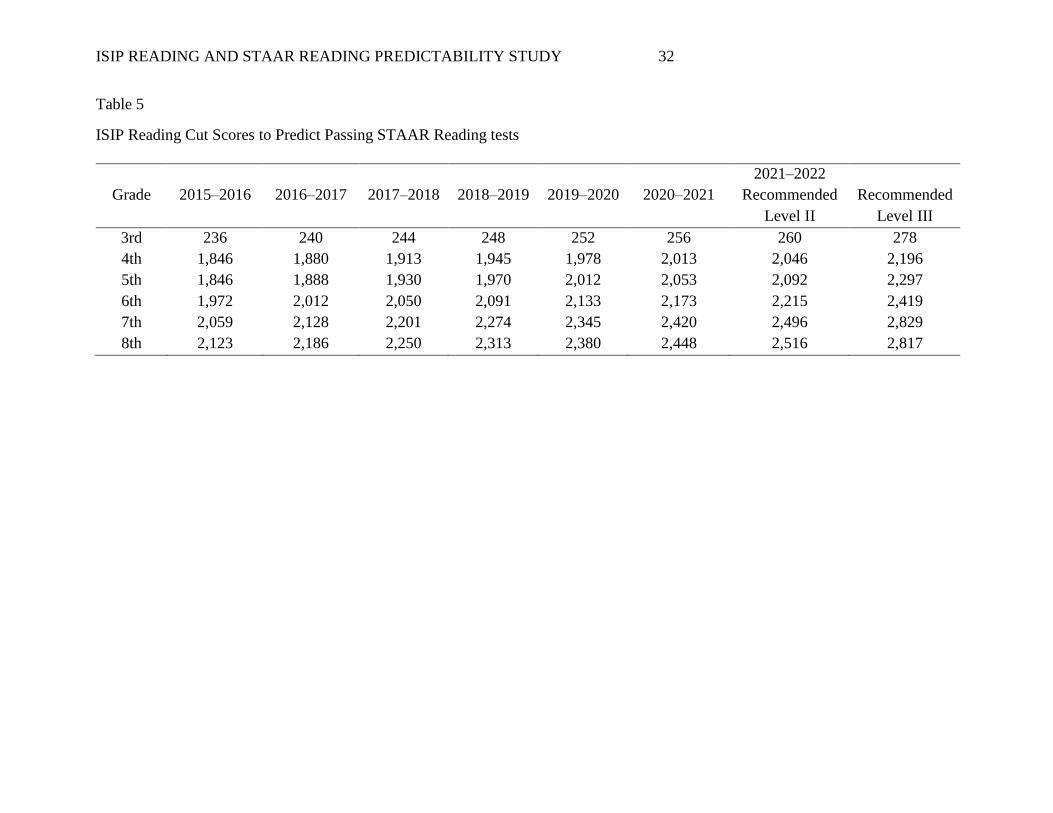
ISIP READING AND STAAR READING PREDICTABILITY STUDY 32
Table 5
ISIP Reading Cut Scores to Predict Passing STAAR Reading tests
Grade
2015–2016
2016–2017
2017–2018
2018–2019
2019–2020
2020–2021
2021–2022
Recommended
Level II
Recommended
Level III
3rd 236 240 244 248 252 256 260 278
4th 1,846 1,880 1,913 1,945 1,978 2,013 2,046 2,196
5th 1,846 1,888 1,930 1,970 2,012 2,053 2,092 2,297
6th 1,972 2,012 2,050 2,091 2,133 2,173 2,215 2,419
7th 2,059 2,128 2,201 2,274 2,345 2,420 2,496 2,829
8th 2,123 2,186 2,250 2,313 2,380 2,448 2,516 2,817

ISIP READING AND STAAR READING PREDICTABILITY STUDY 33
Table 6
Simple Linear Regression Analysis for 3rd Grade
Model Summary
Model R
R
Square
Adjusted R
Square
Std. Error
of the
Estimate
Change Statistics
R Square
Change F Change df1 df2
Sig. F
Change
1 .737a .543 .542 97.129 .543 4026.310 1 3395 .000
a. Predictors: (Constant), EOY
ANOVAa
Model Sum of Squares df Mean Square F Sig.
1 Regression 37984689.516 1 37984689.516 4026.310 .000b
Residual 32028834.153 3395 9434.119
Total 70013523.669 3396
a. Dependent Variable: STAAR
b. Predictors: (Constant), EOY
Coefficientsa
Model
Unstandardized
Coefficients
Standardized
Coefficients
t Sig.
95.0% Confidence Interval
for B
B Std. Error Beta
Lower
Bound
Upper
Bound
1 (Constant) 1433.660 1.668 859.472 .000 1430.389 1436.930
EOY 4.962 .078 .737 63.453 .000 4.809 5.115
a. Dependent Variable: STAAR

ISIP READING AND STAAR READING PREDICTABILITY STUDY 34
Table 6 (Continued)
Simple Linear Regression Analysis for 4th Grade
Model Summary
Model R
R
Square
Adjusted R
Square
Std. Error of
the Estimate
Change Statistics
R Square
Change F Change df1 df2
Sig. F
Change
1 .735a .541 .541 94.051 .541 4001.416 1 3398 .000
a. Predictors: (Constant), EOY
ANOVAa
Model Sum of Squares df Mean Square F Sig.
1 Regression 35394663.498 1 35394663.498 4001.416 .000b
Residual 30057124.032 3398 8845.534
Total 65451787.529 3399
a. Dependent Variable: STAAR
b. Predictors: (Constant), EOY
Coefficientsa
Model
Unstandardized
Coefficients
Standardized
Coefficients
t Sig.
95.0% Confidence Interval
for B
B Std. Error Beta
Lower
Bound
Upper
Bound
1 (Constant) 1504.357 1.615 931.436 .000 1501.190 1507.524
EOY .579 .009 .735 63.257 .000 .561 .597
a. Dependent Variable: STAAR

ISIP READING AND STAAR READING PREDICTABILITY STUDY 35
Table 6 (Continued)
Simple Linear Regression Analysis for 5th Grade
Model Summary
Model R
R
Square
Adjusted R
Square
Std. Error of
the Estimate
Change Statistics
R Square
Change F Change df1 df2
Sig. F
Change
1 .706a .499 .499 97.206 .499 3538.344 1 3554 .000
a. Predictors: (Constant), EOY
ANOVAa
Model Sum of Squares df Mean Square F Sig.
1 Regression 33434011.304 1 33434011.304 3538.344 .000b
Residual 33581943.519 3554 9449.056
Total 67015954.822 3555
a. Dependent Variable: STAAR
b. Predictors: (Constant), EOY
Coefficientsa
Model
Unstandardized
Coefficients
Standardized
Coefficients
t Sig.
95.0% Confidence Interval
for B
B Std. Error Beta
Lower
Bound
Upper
Bound
1 (Constant) 1559.765 1.634 954.728 .000 1556.561 1562.968
EOY .544 .009 .706 59.484 .000 .526 .562
a. Dependent Variable: STAAR

ISIP READING AND STAAR READING PREDICTABILITY STUDY 36
Table 6 (Continued)
Simple Linear Regression Analysis for 6th Grade
Model Summary
Model R
R
Square
Adjusted R
Square
Std. Error
of the
Estimate
Change Statistics
R Square
Change F Change df1 df2
Sig. F
Change
1 .752a .565 .565 91.780 .565 1447.274 1 1114 .000
a. Predictors: (Constant), EOY
ANOVAa
Model Sum of Squares df Mean Square F Sig.
1 Regression 12191156.425 1 12191156.425 1447.274 .000b
Residual 9383810.669 1114 8423.528
Total 21574967.093 1115
a. Dependent Variable: STAAR
b. Predictors: (Constant), EOY
Coefficientsa
Model
Unstandardized
Coefficients
Standardized
Coefficients
t Sig.
95.0% Confidence Interval
for B
B Std. Error Beta
Lower
Bound
Upper
Bound
1 (Constant) 1569.804 2.750 570.758 .000 1564.407 1575.200
EOY .464 .012 .752 38.043 .000 .440 .488
a. Dependent Variable: STAAR

ISIP READING AND STAAR READING PREDICTABILITY STUDY 37
Table 6 (Continued)
Simple Linear Regression Analysis for 7th Grade
Model Summary
Model R
R
Square
Adjusted R
Square
Std. Error
of the
Estimate
Change Statistics
R Square
Change
F
Change df1 df2
Sig. F
Change
1 .549a .301 .300 77.017 .301 313.446 1 728 .000
a. Predictors: (Constant), EOY
ANOVAa
Model Sum of Squares df Mean Square F Sig.
1 Regression 1859255.049 1 1859255.049 313.446 .000b
Residual 4318253.538 728 5931.667
Total 6177508.588 729
a. Dependent Variable: STAAR
b. Predictors: (Constant), EOY
Coefficientsa
Model
Unstandardized
Coefficients
Standardized
Coefficients
t Sig.
95.0% Confidence Interval
for B
B Std. Error Beta
Lower
Bound
Upper
Bound
1 (Constant) 1562.742 2.859 546.629 .000 1557.130 1568.355
EOY .269 .015 .549 17.704 .000 .239 .298
a. Dependent Variable: STAAR
ISIP READING AND STAAR READING PREDICTABILITY STUDY 38
Table 6 (Continued)
Simple Linear Regression Analysis for 8th Grade
Model Summary
Model R
R
Square
Adjusted R
Square
Std. Error
of the
Estimate
Change Statistics
R Square
Change
F
Change df1 df2
Sig. F
Change
1 .628a .394 .393 74.423 .394 291.049 1 447 .000
a. Predictors: (Constant), EOY
ANOVAa
Model Sum of Squares df Mean Square F Sig.
1 Regression 1612051.899 1 1612051.899 291.049 .000b
Residual 2475831.233 447 5538.772
Total 4087883.131 448
a. Dependent Variable: STAAR
b. Predictors: (Constant), EOY
Coefficientsa
Model
Unstandardized
Coefficients
Standardized
Coefficients
t Sig.
95.0% Confidence Interval
for B
B Std. Error Beta
Lower
Bound
Upper
Bound
1 (Constant) 1584.486 3.519 450.286 .000 1577.570 1591.401
EOY .321 .019 .628 17.060 .000 .284 .358
a. Dependent Variable: STAAR

ISIP READING AND STAAR READING PREDICTABILITY STUDY 39
Figure 1. ISIP Reading cut scores and STAAR performance standards
Pink = 2015–2016
Green = 2016–2017
Purple = 2017–2018
Gray = 2018–2019
Yellow = 2019–2020
Light Green = 2020–2021
Orange = 2020–2021 Recommended Level II
Blue = 2020–2021 Recommended Level III