pradhan mantri krishi sinchayee yojana … mantri krishi sinchayee yojana (pmksy) department of...
TRANSCRIPT

PRADHAN MANTRI KRISHI SINCHAYEE YOJANA (PMKSY)
Department of Agriculture, Cooperation & Farmer Welfare
Ministry of Agriculture & Farmer Welfare
Government of India
DISTRICT IRRIGATION PLAN
LOHARDAGA DISTRICT (JHARKHAND)
MAY-2016
PRADHAN MANTHRI KRISHI SINCHAYEE YOJANA (PMKSY) PROGRAMME
OF LOHARADAGA DISTRICT
Shri Raguhubar Das, Hon’ble Chief Minister, Jharkhand State
Shri Chandra Prakash Choudhary, Hon’ble Minister, Water Resources
District Level Implementation Committee
1. Dr.Bhuvnesh Pratap Singh, IAS - Chairman Deputy Commissioner, Lohardaga
2. Shri S.R. Natesha - Member Divisional Forest Officer, Lohardaga
3. Shri Daniel Kandulna - Member Deputy Development Commissioner, Lohardaga
4. Mrs. Shraddha Toppo - Nodal Officer District Agriculture Officer, Lohardaga
5. Shri Mahesh Bhagat - Member District Planning Officer, Lohardaga
6. Shri Ram Pratap Prasad Singh - Member Executive Engineer, Minor Irrigation, Lohardaga
7. Shri Keshav Prasad - Member District Statistics Officer, Lohardaga
8. Dr. Debashish Ghosh - Member District Animal Husbandry Officer, Lohardaga
9. Shri Ashok Kr. Sinha - Member District Dairy Development Officer, Lohardaga
10. Shri Harendra Kumar - Member District Horticulture Officer, Lohardaga
11. Shri Birendra Kr. Binha - Member District Fisheries Officer, Lohardaga
12. Shri Anil Kumar - Member Soil Conservation Officer
13. Shri Alok Dev - Member Junior Engineer, Soil Conservation, Lohardaga

14. Dr. Shankar Kr. Singh I/C Head & Scientist, KVK, Lohardaga - Member
15. Shri Bipin Bihari Sinha - Member Executive Engineer, PHED, Lohardaga
16. Lead Bank Manager, Lohardaga - Member
17. BPD BAU Society, BAU, Ranchi - Consultant

PRADHAN MANTHRI KRISHI SINCHAYEE YOJANA (PMKSY) PROGRAMME
OF LOHARADAGA DISTRICT
Honourable People’s Representatives of Lohardaga
1. Shri Sudarshan Bhagat
Hon’ble Member of Parliament Lohardaga Constituency –cum- Minister of State
for Rural Development
2. Shri Dhiraj Prasad Sahu
Hon’ble Member of Parliament Rajya Sabha
3. Shri Sukhdeo Bhagat
Hon’ble Member of Legislative Assembly, Lohardaga Constituency
4. Shri Chamra Linda
Hon’ble Member of Legislative Assembly, Bishunpur Constituency

LOHARDAGA DISTRICT IRRIGATION PLAN 2016-2021 (PMKSY)
Dr. Bhuvnesh Pratap Singh, IAS
Deputy Commissioner, Lohardaga
Preparation and Compilation
Business Planning & Development – Birsa Agricultural University Society,
Birsa Agricultural University, Ranchi
Shri Siddharth Jaiswal-Secretary / CEO
Shri Anand Kr Singh-Asstt Manager /RA
Shri Bijendra Kumar –Office Asstt
Email:- [email protected]
Contact No: - 0651-2450307
CHAPTER
CONTENTS Page No
- List of Tables I-III
- List of Figures IV
- Abbreviations V
- Executive Summary VI-X
1 Introduction 1-19
2 Literature Review 20-30
3 Methodology and Approach to Preparation of DIP 31-36
4 Data Requirement For Preparation of District Irrigation Plan 37-42
5 Hydrology 43-48
6 Ground Water Resources 49-50
7 Component A: AIBP 51
8 Component B : Har Khet Ko Pani 52
9 Component C : Per Drop More `Crop 53-54
10 Component D : Watershed Development 55
11
Developments in New Agricultural Production System in
Lohardaga 57-62
12 Cost of Project 63-78
13 Probable Benefits from this Plan 79
14 Conclusions & Recommendations 80
15 Bibliography 81
16 Lohardaga District Maps 82-97
17 ANNEXURE 98-203

i
LIST OF TABLES
S. No
Table Description
Page No.
1 Table 1.1: Lohardaga District – at a Glance 10-11
2 Table 1.2 : Population (as per Census Report-2011) 12
3 Table 1.3: Soils of the Lohardaga district and their extent 14
4 Table 1.4: Soils under different reaction classes 15
5 Table 1.5: Organic carbon status 16
6 Table 4.1: Type of Data Required 37
7 Table 4.2: Details of Chapters in district Irrigation Plan 38-42
8 Table 5.1: Irrigated area (ha) in Lohardaga district 43
9 Table 5.2-5.2.3 Soil Erosion and Runoff Status 44-46
10 Table 5.3.1-5.3.2 : Area-wise, crop wise irrigation Status 47-48
11 Table 6.1: Irrigated area (ha) in Lohardaga
district
49
COST OF PMKSY PROJECT TABLE
12 Table 12.1: Strategic Action Plan for Irrigation in Kairo
block of Lohardaga district under PMKSY
63
13 Table 12.2: Strategic Action Plan for Irrigation in
Lohardaga block of Lohardaga district under PMKSY
64-65
14 Table 12.3: Strategic Action Plan for Irrigation in Senha
block of Lohardaga district under PMKSY
66-67
15 Table 12.4: Strategic Action Plan for Irrigation in
Bhandra block of Lohardaga district under PMKSY
68-70
16 Table 12.5: Strategic Action Plan for Irrigation in
Peshrar block of Lohardaga district under PMKSY
71-72
17 Table 12.6: Strategic Action Plan for Irrigation in Kuru
block of Lohardaga district under PMKSY
73-74
18 Table 12.7: Strategic Action Plan for Irrigation in Kisko 75-76

ii
block of Lohardaga district under PMKSY
19 Table 12.8: Strategic Action Plan Lohardaga district
under PMKSY
77-78
BLOCK WISE TABLES
20 Table.1.1 District Profile – Lohardaga district 99
21 Table.1.2.1 Demography – Lohardaga Block 100-102
22 Table.1.2.2 Demography – Bhandra Block 103-105
23 Table.1.2.3 Demography – Senha Block 106-108
24 Table.1.2.4 Demography – Kairo Block 109-110
25 Table.1.2.5 Demography – Kuru Block 111-114
26 Table.1.2.6 Demography – Kisko Block 115-117
27 Table.1.2.7 Demography – Peshrar Block 118-121
28 Table.1.3.1 Biomass and Livestock – Kisko Block 122
29 Table.1.3.2 Biomass and Livestock – Peshrar Block 122
30 Table.1.3.3 Biomass and Livestock – Kuru Block 123
31 Table.1.3.4 Biomass and Livestock – Kairo Block 123
32 Table.1.3.5 Biomass and Livestock – Lohardaga Block 124
33 Table.1.3.6 Biomass and Livestock – Senha Block 124
34 Table.1.3.7 Biomass and Livestock – Bhandra Block 125
35 Table.1.4.1 Agro Ecology, Climate, Hydrology and
Topography
125
36 Table.1.4.2 Agro Ecology, Climate, Hydrology and
Topography
126
37 Table.1.4.3 Agro Ecology, Climate, Hydrology and
Topography
126
38 Table.1.4.4 Agro Ecology, Climate, Hydrology and
Topography
127
39 Table.1.4.5 Agro Ecology, Climate, Hydrology and 127
iii
Topography
40 Table.1.4.6Agro Ecology, Climate, Hydrology and
Topography
128
41 Table.1.4.7 Agro Ecology, Climate, Hydrology and
Topography
128
42 Table.1.6.1-1.6.4 Soil Erosion and Runoff Status 129-132
43 Table.1.7.1 -1.7.6 (All Blocks) Land Use Pattern 133-149
44 Table.2.1.1 -2.2.6 (All Blocks) District Water profile 150-161
45 Table.2.3.1-2.3.6 (All Blocks) Irrigation based
Classification
162-168
46 Table.3.1 Water Availability 169
47 Table.3.2.1-3.2.7(All Blocks) Status of ground Water
Availability
170-176
48 Table.3.3.1-3.4.7(All Blocks) Status of Command Area 177-183
49 Table.4.1 Water Requirement/Demand 184
50 Table.4.2-4.3 Crop Water Requirement 185-186
51 Table.4.4 Industrial Water Demand 187
52 Table.5-5.6 (All Blocks) M .I Division 188-203

iv
LIST OF FIGURES
FIGURE
TITLE
Page No.
1 1.1 Soil Map of Lohardaga District 15
2 District Location Map of Lohardaga district 83
3 Land use / Land cover map of Lohardaga District 84
4 Geo-morphology Map of Lohardaga District 85
5 Digital Elevation Model of Lohardaga District 86
6 Contour Map of Lohardaga District 87
7 Geology Map of Lohardaga District 88
8 Forest Map of Lohardaga District 89
9 Drainage & Surface Waterbody Map of Lohardaga
District
90
10 Ground Water Potential Map of Lohardaga District 91
11 Micro-watershed Map of Lohardaga District 92
12 Watershed Map of Lohardaga District 93
13 Ongoing PMKSY (IWMP) & Proposed PMKSY Map of
Lohardaga District
94
14 Satellite (LISS – III) View of Lohardaga District 95
15 Soil Reaction (pH) of Lohardaga District 96
16 Organic Carbon of Lohardaga District 97

v
LIST OF ABBREVIATIONS
BCM Billion Cubic Metre
CWC Central Water Commission
DIP District Irrigation Plan
DRDA District Rural Development Agency
GD Ground Water Department
GWL Ground Water Level
GP Gram Panchayat
Ha Hectare
IWRM Integrated Water Resources Management
INRM Intergraded Natural Resources Management
ITDA Intergraded Tribal Development Agency
M Meter
Mm Millimetre
MCM Million Cubic Meter
PMKSY Pradha Mantri Krishi Sinchayee Yojana
Sq km Square Kilometre

vi
Executive Summary
This plan is aimed to provide a technical model to make Lohardaga district sustainable for
agricultural water need. District Irrigation Plan (DIP) of Lohardaga district has been drafted
as per Pradhan Mantri Krishi Sinchayee Yojana (PMKSY) operational guide lines issued by
Govt. of India. There is a huge gap between the irrigation potential created and utilized of the
district. To abridge this gap to the maximum extent a comprehensive district irrigation plan is
prepared for Lohardaga District under PMKSY.
To this effect Pradhan Mantri Krishi Sinchayee Yojana (PMKSY) has been formulated with
the vision of extending the coverage of irrigation through 'Har Khet ko pani' and improving
water use efficiency 'More crop per drop' in a focused manner with end to end solution on
source creation, distribution, management, field application and extension activities.
The main objective of the plan is to improve irrigation and farm productivity, to achieve this
convergence of investments in the irrigation at field level, expand cultivable area through
assured irrigation, To improve on-farm water use efficiency to reduce wastage of water,
enhance the adoption of precision-irrigation and other water-saving technologies, Water
conservation and cutting down on wastage is key to bring irrigation facilities to every farm,
Enhancing adoption of precision-irrigation crop rotation and other water-saving technologies.
The approach and strategy of PMKSY is to increase in irrigation coverage, enhancement in
use of augmented resources by bridging the gap between irrigation potential created and
utilized, improvement/strengthening of water distribution network, enhancement of water use
efficiency, sustainable & efficient management of water resources etc. The DIP have been
prepared at two levels i.e., block & district. Keeping in the view the convenience of map
preparation and data collection, the work is primarily done at block level. The block wise
irrigation plan prepared is a replica of the district irrigation plan.
Chapter 1 deals with the general information of the district such as district profile,
demography, biomass & livestock, agro- ecology, climate, hydrology and topography, soil
profile, soil erosion and runoff status & land use pattern of district.
vii
Chapter 2 deals with the literature review, aspects of ground water, irrigation, agriculture,
rainfed agriculture, water resource planning & management and opinions of various authors.
Chapter 3 is about the Methodology and approaches for preparation of DIP, block level plans
were prepared which is replicated at DIP plan. The analysis of the Input Data is the backbone
of the DIP in terms of getting the statistical profile of the individual block and the district as a
whole. The physical features, demographic / economic / social data, land use pattern and the
metrological data will give an overview of the block / district will help in preparation of the
statistical scenario essential for analysis. The output of DIP would broadly attempt to focus
on bringing out the actionable areas in the following domain depending on the availability of
data from various agencies/ departments. It also mainly speaks about the steps involved in
the preparation of District plan.
Chapter 4 speaks about the Data requirement for preparation of the DIP and identification of
the related departments and agency of Lohardaga District.
Chapter 5 deals with the district water profile such as area wise, crop wise irrigation status,
production & productivity of major crops, irrigation based classification, such as status of
availability of water, ground water availability, command area development, existing type of
irrigation & water requirement and demand such as domestic demand, crop demand, live
stock demand, industrial water demand, water demand for power generation, total water
demand of the district for various sectors, water budget which includes water availability,
water demand and gaps.
Chapter 6 deals with the district ground water resources, ground water quality, ground water
development and management & ground water recharge a plan and ground water issue which
includes the farmer’s distress condition, drinking water facilities and recommendations.
Chapter 7 deals with the “Accelerated Irrigation Benefit Program (AIBP)” and its objective,
scope. The cost under this component is Rs. 1.21 Crore.
Chapter 8 deals with the “Har Khet Ko Pani”, with the objective of Enhancing the physical
access of water on the farm and expand cultivable area under assured irrigation and scope to
ensure & access the irrigation facility to every farm land. The main activities covered under

viii
this scheme is creation of new water sources through Minor Irrigation (both surface &
ground water), Repair, restoration & renovation of water bodies, Diversion of water from
source of different location where it is plenty to nearby water scarce areas, lift irrigation from
water bodies/ rivers at lower elevation to supplement requirements beyond IWMP and
MGNREGS irrespective of irrigation command. The cost under this component is Rs. 161.64
Crore.
Chapter 9 deals with the 'PER DROP MORE CROP' where the Micro Irrigation is objective
of enhancing the crop productivity by improving the water use efficiency through micro
irrigation systems. The main objective under this scheme is to increase the production,
productivity & quality, conservation & sustainable use of water, higher efficiency in the
agriculture sector, improve water use efficiency, higher fertilizer use efficiency & saving in
expenses of the labour. The activities covering under this programme are capacity building,
training and awareness campaign including low cost publications, use of pico projectors and
low cost films for encouraging potential use of water source through technological,
agronomic and management practices including community irrigation. Under Supplementary
water management activities main focus on secondary storage structures at tail end of canal
system to store water when available in abundance (rainy season) from perennial sources like
streams for use during dry periods through effective on- farm management. The extension
workers will be empowered to disseminate relevant technologies under PMKSY only after
requisite training is provided to them especially in the area of promotion of scientific
moisture conservation and agronomic measures, improved/innovative distribution system
like pipe & box outlet system, etc. Information Communication Technology (ICT)
interventions through NeGP-A to be made use in the field of water use efficiency, precision
irrigation technologies, on farm water management, crop alignment, etc. The cost of the
component is Rs. 72.68 crores.
Chapter 10 deals with PMKSY Watershed Development, with focus on effective
management of runoff water and improved soil & moisture conversation activities such as
ridge area treatment, drainage line treatment, rain water harvesting, newly created water
harvesting structure such as Farm ponds, check dams, nallah bunds, Percolation tanks, other
ground water recharge structure, fishery ponds/cattle ponds and water harvesting structures.
The cost of watershed component is Rs 86.53 Crores.

ix
In terms of convergence with MGNREGA, newly created water conversion, water
harvesting, creation of irrigation canals & drains, providing infrastructure for irrigation, land
development, renovation of water bodies including desilting, renovation & maintenance of
irrigation canals & drains. The main activities to be taken up are Institution & Capacity
Building, Natural Resource Management, Livelihood activities, Productive Enhancement.
The cost of component is Rs 76.52 Crores.
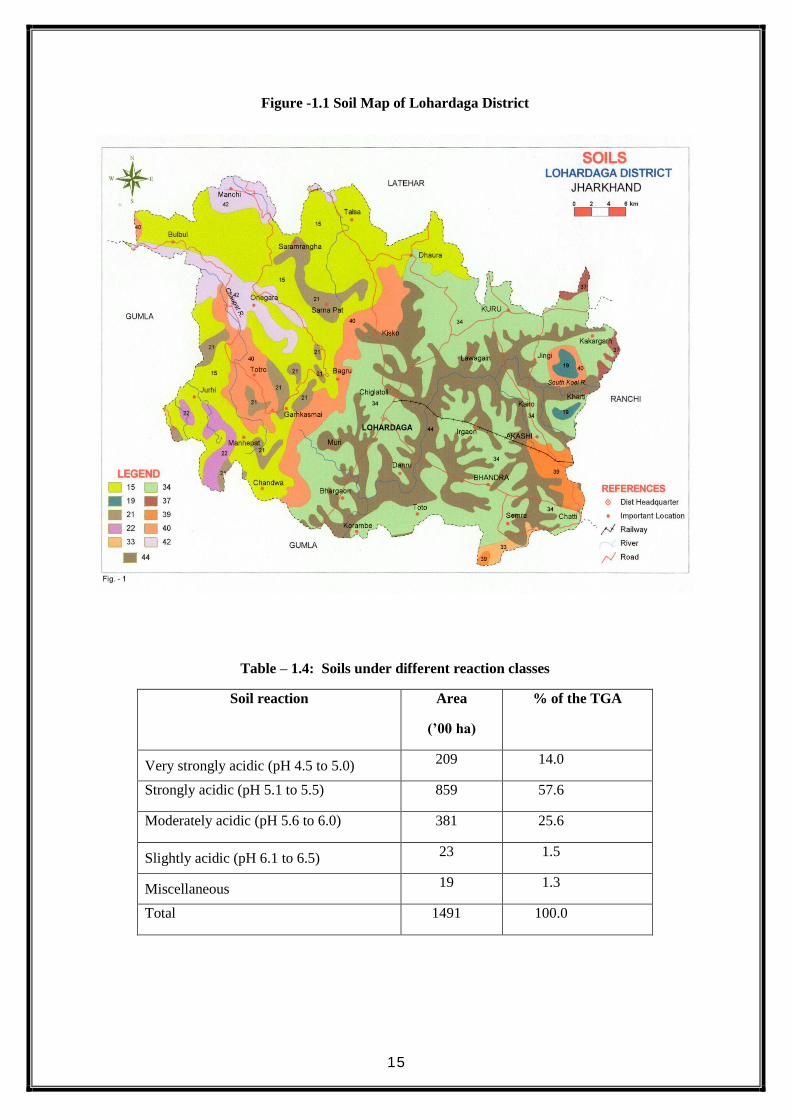
Chapter 11, deals agriculture in the district is transforming from traditional to modern ways.
The soils occurring in different landforms have been characterised during soil resource
mapping of the state on 1:250,000 scale (Haldar et al. 1996) and three soil orders namely
Entisols, Inceptisols and Alfisols were observed in Lohardaga district (Fig.1 and table 1).
Alfisols were the dominant soils covering 52.6 percent of total geographical area followed by
Inceptisols (25.1 %) and Entisols (21.1 %). All the soils are acidic in reaction. The soil pH
ranges from 4.5 to 6.4. The soil reaction classes with area are given in table 2 and figure 2.
The data reveals that strongly acidic soils cover 57.6 % area of the district followed by
moderately acidic (25.6 % of TGA), very strongly acid (14.0% of TGA) and slightly acid
(1.5 % of TGA). The organic carbon content in the district ranges from 0.25 to 1.17%. They
are mapped into three classes i.e., low (below 0.5 %), medium (0.5-0.75 %) and high (above
0.75 %). The details are given in table 3 and figure 3. From table 3 it is seen that 37.6 percent
area have low surface organic carbon content. Medium and high organic carbon content
constitute 28.2 and 32.9 percent area respectively. Low organic carbon content may be due to
high temperature regime of the area, which accelerates the rate of decomposition of organic
carbon.
Analyses from the crops identified clearly states if we increase the irrigation area, the more
production will be generated, which income level of the farmer household will increase to
40%. The activities related to the agriculture and allied activities like poultry, dairy, goatery,
piggery and sericulture/apiculture will be taken up by 2020 ,rising of vegetable
crops/floriculture/medicinal and aromatic plants, Agro-Forestry/Agro-Horti/Agro-
Silvi/Agro-Pasture/Agro-Horti-Forestry cropping systems can be encouraged for
establishment of agro based industries and thereby employment opportunities will also
increase and it also avoid the rural people to migrate urban areas by this finally it will lead to
rural prosperity.

x
Chapter 13 deals about Profitable benefit of the plan to achieve the irrigation to every farm,
enhance cropping & productivity and to achieve rural prosperity.
Chapter 14 deals about the conclusion which reveals DIP will fulfill the resource gap in the
irrigation chain. Irrigation to every farm will be achieved through completion of ongoing
major & medium projects. This action plan proposes for better water use efficiency and
management along with best distribution of water sources.
The costs in different components of DIP for Lohardaga district are summarized as below:
Component Amount (Rs. in Lakhs)
AIBP 121.00
Har Khet ko Pani 16163.98
Per drop more crop 7267.55
PMKSY Watershed 8652.97
Convergence with MGNREGA 7652.26
State Planned schemes of Irrigation 71451.01
TOTAL 111308.77

1
Chapter No -1
1.0 INTRODUCTION
The major objective of PMKSY is to achieve convergence of investments in irrigation at the
field level, expand cultivable area under assured irrigation, improve on-farm water use
efficiency to reduce wastage of water, enhance the adoption of precision-irrigation and other
water saving technologies (More crop per drop), enhance recharge of aquifers and introduce
sustainable water conservation practices by exploring the feasibility of reusing treated
municipal waste water for peri-urban agriculture and attract greater private investment in
precision irrigation system.
PMKSY has been conceived amalgamating ongoing schemes viz. Accelerated Irrigation
Benefit Programme (AIBP) of the Ministry of Water Resources, River Development &
Ganga Rejuvenation (MoWR, RD&GR), Integrated Watershed Management Programme
(IWMP) of Department of Land Resources (DoLR) and the On Farm Water Management
(OFWM) of Department of Agriculture and Cooperation (DAC). The scheme will be
implemented by Ministry of Agriculture, Water Resources and Rural Development. Ministry
of Rural Development is to mainly undertake rain water conservation, construction of farm
pond, water harvesting structures, small check dams and contour bunding etc. MoWR, RD
&GR, is to undertake various measures for creation of assured irrigation source, construction
of diversion canals, field channels, water diversion/lift irrigation, including development of
water distribution systems. Ministry of Agriculture will promote efficient water conveyance
and precision water application devices like drips, sprinklers, pivots, rain-guns in the farm
“(Jal Sinchan)”, construction of micro-irrigation structures to supplement source creation
activities, extension activities for promotion of scientific moisture conservation and
agronomic measures.
Programme architecture of PMKSY will be to adopt a ‘decentralized State level planning and
projectised execution’ structure that will allow States to draw up their own irrigation
development plans based on District Irrigation Plan (DIP) and State Irrigation Plan (SIP). It
will be operative as convergence platform for all water sector activities including drinking
water & sanitation, MGNREGA, application of science & technology etc. through
comprehensive plan. State Level Sanctioning Committee (SLSC) chaired by the Chief
Secretary of the State with the authority to oversee its implementation and sanction of
projects.

2
The programme will be supervised and monitored by an Inter-Ministerial National Steering
Committee (NSC) will be constituted under the Chairmanship of Prime Minister with Union
Ministers from concerned Ministries. A National Executive Committee (NEC) constituted
under the Chairmanship of Vice Chairman, NITI Aayog to oversee programmme
implementation, allocation of resources, inter ministerial coordination, monitoring &
performance assessment, addressing administrative issues etc.
Components and responsible Ministries/ Departments
1. AIBP by MoWR, RD &GR to focus on faster completion of ongoing Major and
Medium Irrigation including National Projects.
2. PMKSY (Har Khet ko Pani) by MoWR,RD & GR Creation of new water sources
through Minor Irrigation (both surface and ground water).
Repair, restoration and renovation of water bodies; strengthening carrying capacity of
traditional water sources, construction rain water harvesting structures (Jal Sanchay);
Command area development, strengthening and creation of distribution network from
source to the farm.
Improvement in water management and distribution system for water bodies to take
advantage of available source, which is not utilised to its fullest capacity (deriving
benefits from low hanging fruits). At least 10% of the command area to under
micro/precision irrigation.
Diversion of water from source of different location where it is plenty to nearby water
scarce areas, lift irrigation from water bodies/rivers at lower elevation to supplement
requirements beyond IWMP and MGNREGS irrespective of irrigation command.
Creation and rejuvenation of traditional water storage systems like Jal Mandir
(Gujarat); Khatri, Kuhl (H.P.); Zabo (Nagaland); Eri, Ooranis (T.N.); Dongs
(Assam); Katas, Bandhas (Odisha and M.P.) etc. at feasible locations.
3. PMKSY (Watershed) by Dept. of Land Resources, MoRD Water harvesting
structures such as check dams, nala bund, farm ponds, tanks etc.
Capacity building, entry point activities, ridge area treatment, drainage line treatment,
soil and moisture conservation, nursery raising, afforestation, horticulture, pasture
development, livelihood activities for the asset-less persons and production system &
micro enterprises for small and marginal farmers etc.

3
Effective rainfall management like field bunding, contour bunding/trenching,
staggered trenching, land levelling, mulching etc.
4. PMKSY (Per drop more crop) by Dept. of Agriculture & Cooperation, MoA
Programme management, preparation of State/District Irrigation Plan, approval of
annual action plan, Monitoring etc.
Promoting efficient water conveyance and precision water application devices like
drips, sprinklers, pivots, rain-guns in the farm (Jal Sinchan).
Topping up of input cost particularly under civil construction beyond permissible
limit (40%), under MGNREGS for activities like lining inlet, outlet, silt traps
distribution system etc.
Construction of micro irrigation structures to supplement source creation activities
including tube wells and dug wells (in areas where ground water is available and not
under semi critical /critical /over exploited category of development) which are not
supported under PMKSY (WR), PMKSY (Watershed) and MGNREGS.
Secondary storage structures at tail end of canal system to store water when available
in abundance (rainy season) or from perennial sources like streams for use during dry
periods through effective on-farm water management.
Water lifting devices like diesel/ electric/ solar pumpsets including water carriage
pipes.
Extension activities for promotion of scientific moisture conservation and agronomic
measures including cropping alignment to maximise use of available water including
rainfall and minimise irrigation requirement (Jal sarankchan).
Capacity building, training for encouraging potential use water source through
technological, agronomic and management practices including community irrigation.
Awareness campaign on water saving technologies, practices, programmes etc.
Organisation of workshops, conferences, publication of booklets, pamphlets, success
stories, documentary, advertisements etc.
Improved/innovative distribution system like pipe and box outlet system with
controlled outlet and other activities of enhancing water use efficiency.
4
District Irrigation Plans (DIPs)
District Irrigation Plan (DIP) shall be the cornerstone for planning and implementation of
PMKSY. DIP will identify the gaps in irrigation infrastructure after taking into consideration
the District Agriculture Plans (DAPs) already prepared for Rashtriya Krishi Vikas Yojana
(RKVY) vis-à-vis irrigation infrastructure currently available and resources that would be
added during XII Plan from other ongoing schemes (both State and Central), like Mahatma
Gandhi National Rural Employment Guarantee Scheme(MGNREGS), Rashtriya Krishi
Vikash Yojana (RKVY), Rural Infrastructure Development Fund (RIDF), Member of
Parliament Local Area Development (MPLAD) Scheme, Member of Legislative Assembly
Local Area Development (MLALAD) Scheme, Local body funds etc. The gaps indentified
under Strategic Research & Extension Plan (SREGP) are be used in preparation of DIP.
DIPs will present holistic irrigation development perspective of the district outlining medium
to long term development plans integrating three components viz. water sources, distribution
network and water use applications incorporating all usage of water like drinking & domestic
use, irrigation and industry. Preparation of DIP will be taken up as joint exercise of all
participating departments. DIP will form the compendium of all existing and proposed water
resource network system in the district.
The DIPs may be prepared at two levels, the block and the district. Keeping in view the
convenience of map preparation and data collection, the work would be primarily done at
block level. Block wise irrigation plan is to be prepared depending on the available and
potential water resources and water requirement for agriculture sector prioritising the
activities based on socio-economic and location specific requirement. In case of planning is
made based on basin/sub basin level, the comprehensive irrigation plan may cover more than
one district. The activities identified in the basin/sub-basin plan can be further segregated
into district/block level action plans. Use of satellite imagery, topo sheets and available
database may be appropriately utilised for developing irrigation plans at least on pilot basis to
begin with and subsequently extended to all projects.
5
Background
Hon’ble President in his address to the joint Session of the Parliament of 16th Lok Sabha
indicated that “Each drop of water is precious. Government is committed to giving high
priority to water security. It will complete the long pending irrigation projects on priority and
launch the ‘Pradhan Mantri Krishi Sinchayee Yojana’ with the motto of ‘Har Khet Ko
Paani’.
There is a need for seriously considering all options including linking of rivers, where
feasible; for ensuring optimal use of our water resources to prevent the recurrence of floods
and drought. By harnessing rain water through ‘Jal Sanchay’ and ‘Jal Sinchan’, we will
nurture water conservation and ground water recharge. Micro irrigation will be to ensure ‘Per
drop-More crop’. Out of about 141 m.Ha of net area sown in the country, about 65 million
hectare (or 45%) is presently covered under irrigation. Substantial dependency on rainfall
makes cultivation in unirrigated areas a high risk, less productive profession. Empirical
evidences suggest that assured or protective irrigation encourages farmers to invest more in
farming technology and inputs leading to productivity enhancement and increased farm
income. The overreaching vision of Pradhan Mantri Krishi Sinchayee Yojana (PMKSY) will
be to ensure access to some means of protective irrigation to all agricultural farms in the
country, to produce ‘per drop more crop’, thus bringing much desired rural prosperity.
Vision
To use the available water resources in the district to the maximum potential in an efficient
way catering to the basic needs of every living being and enhancing the livelihoods of rural
population to the maximum extent thus alleviating poverty in a sustainable way without
compromising the interests of future generations.
Objective
The broad objectives of PMKSY will be:-
a) Achieve convergence of investments in irrigation at the field level (preparation of district
level and, if required, sub district level water use plans).
b) Enhance the physical access of water on the farm and expand cultivable area under
assured irrigation (Har Khet ko pani).

6
c) Integration of water source, distribution and its efficient use, to make best use of water
through appropriate technologies and practices.
d) Improve on-farm water use efficiency to reduce wastage and increase availability both in
duration and in extent.
e) Enhance the adoption of precision-irrigation and other water saving technologies (More
crop per drop).
f) Enhance recharge of aquifers and introduce sustainable water conservation practices.
g) Ensure the integrated development of rainfed areas using the watershed approach towards
soil and water conservation, regeneration of ground water, arresting runoff, providing
livelihood options and other NRM activities.
h) Promote extension activities relating to water harvesting, water management and crop
alignment for farmers and grass root level field functionaries.
i) Explore the feasibility of reusing treated municipal wastewater for peri-urban agriculture.
j) Attract greater private investments in irrigation.
This will in turn increase agricultural production and productivity and enhance farm
income.
Strategy /approach
To achieve above objectives, PMKSY will strategize by focussing on end-to end solution
in irrigation supply chain, viz. water sources, distribution network, efficient farm level
applications, extension services on new technologies & information etc. Broadly,
PMKSY will focus on:-
a) Creation of new water sources; repair, restoration and renovation of defunct water
sources; construction of water harvesting structures, secondary & micro storage,
groundwater development, enhancing potentials of traditional water bodies at village
level like Jal Mandir (Gujarat); Khatri, Kuhl (H.P.); Zabo (Nagaland); Eri, Ooranis
(T.N.); Dongs (Assam); Katas, Bandhas (Odisha and M.P.) etc.
b) Developing/augmenting distribution network where irrigation sources (both assured and
protective) are available or created;
c) Promotion of scientific moisture conservation and run off control measures to improve
ground water recharge so as to create opportunities for farmer to access recharged water
through shallow tube/dug wells;

7
d) Promoting efficient water conveyance and field application devices within the farm viz,
underground piping system, Drip & Sprinklers, pivots, rain-guns and other application
devices etc.
e) Encouraging community irrigation through registered user groups/farmer producers’
organisations/NGOs.
f) Farmer oriented activities like capacity building, training and exposure visits,
demonstrations, farm schools, skill development in efficient water and crop management
practices (crop alignment) including large scale awareness on more crop per drop of
water through mass media campaign, exhibitions, field days, and extension activities
through short animation films etc.
g) The aforesaid areas only outline the broad contours of PMKSY; combination of
interventions may be required depending on location specific conditions and
requirements, which will be identified through District and State Irrigation Plans.
Methodology
The preparation of District Irrigation plan is an integration of geospatial technology, Space
application technologies and spatial and non-spatial data.
1. Transformation of available thematic information (district provided Gyan data) on to the
village level on Bhuvan portal and extract geo-referenced village map data.
2. Integration of thematic layers with socio-economic data for classification of area into
specific composite land units on village level.
3. Preparation of appropriate action plan based on potential of composite land units and
developmental needs of study area is on the basis of available data.
4. Field visit to validate the recommended measures with respect to the ground situation and
requirement of the local people.
5. Finalization of development plans based on field observation.
Available thematic information for preparation for water resource and land resource
development plan.
Landuse / land cover map
Groundwater potential map
Soil map - depth, texture, erosion and land capability
Slope map.
High resolution Satellite mage through Bhuvan portal.

8
Lithology.
Hydro geomorphology.
Area for development of water resources structure geospatial technology has been used in
this process first identify the area of crop land based on high resolution satellite data and
then identify the irrigated area by different source of irrigation methods. To identify the
un irrigated area an overlay method is used. District irrigation plan covers the fallowing
planning component of the district in sustainable development approach:
Increase in vegetation/biomass in the district.
More number of surface water bodies in district.
Shift from annual crop to perennial.
Increase in the extent of crop area.
Improvement in the soil moisture availability
Reclamation of waste lands.
Convergence of investments in irrigation at the field level.
Enhance the physical access of water on the farm and expand cultivable area
under assured irrigation (Har Khet ko pani)
Best use of water through appropriate technologies and practices.
Improve on-farm water use efficiency.
Enhance the adoption of precision-irrigation and other water saving technologies
(More crop per drop).
Enhance recharge of aquifers and introduce sustainable water conservation
practices.
Ensure the integrated development of rainfed areas.
Promote extension activities relating to water harvesting, water management and
crop alignment for farmers and grass root level field functionaries.
Explore the feasibility of reusing treated municipal waste water for peri-urban
agriculture,
Attract greater private investments in irrigation.

9
Preparation of DIP will be taken up as joint exercise of all participating departments. DIP
will form the compendium of all existing and proposed water resource network system in the
district.
Based on above, an attempt has been made to prepare a District Irrigation Plan for Lohardaga
District in Jharkhand State. The State Government and the District Administration were also
requested to take up on priority the preparation of DIP and also various state Government
departments at district level were requested to provide the data inputs so that a draft DIP for
the district can be prepared. A preliminary discussion was held with Deputy Commissioner
Lohardaga by CEO, BPD-BAU Society, a Unit of Birsa Agricultural University, Ranchi,
Jharkhand and thereafter an approach to DIP was sent to the district administration in May,
2016.
1.1 District Profile
The District of Lohardaga is located in the south western part of Jharkhand State
between 23°30' and 23°40' north latitudes and 84°40' and 84°50' east longitudes covering an
area of 1491 km² in the tribal belt of Chotanagpur plateau.
Lohardaga district came into existence after Ranchi was split into three districts namely
Ranchi, Lohardaga and Gumla way back in 1983. The district is named after the town of
Lohardaga, the administrative headquarters of the district. Lohardaga was given the position
of a sub division in 1972 and a district in 1983. In Jain texts there is reference to Lord
Mahavir's visit to Lore-a-Yadaga, which means 'river of tears' in Mundari. 'Ain-e-akbari', the
famous book on Akbar, also mentions a place called 'Kismate Lohardaga'. The word
Lohardaga may be made of two hindi words, Lohar meaning 'ironmonger', and Daga
meaning center', which makes the literal meaning of Lohardaga as 'center of iron mining'.
District has a number of small hill blocks covered with forests. The general slope of the
district is from west to east. The main rivers of the district are South Koel, Sankh, Nandni,
Chaupat's and Fulijhar etc. These are mainly Rain fed Rivers and dried up in the summer
months. Some springs are also seen in the hilly tract of the district. Geologically the area in
comprised with Archean Granites and Gneisses. In the uplands considerable thickness of
late-rite of Pleistocene age is found in the Granite and Gneisses tracts. Alluvium of recent to
sub-recent age is found in the river valleys. The most important mineral of the district is
bauxite. Other minerals which are found in the district are feldspar, fire clay and china clay

10
and have less economic importance. The major part of the district is covered with Golden
Alluvium, Red and Sandy and Red and Gravelly soils. Late-rite and Red and Yellow soils are
also found elsewhere in the district. The district enjoys a healthy and pleasant climate
throughout the year. The annual average temperature is 23° centigrade and the district
receives an annual average rainfall of 1000-1200 mm. The rainfall increases from west to
east.
Table – 1.1: Lohardaga District – at a Glance
1 Location
North Latitude : 23.30" to 23.40"
East Longitude : 84.40" to 81.50"
Altitude : 2200' to 3200' above MSL
2 Average Annual Rainfall : 1137.4 MM
3 Administrative Units
No. of subdivision : 1 (Lohardaga Sadar)
No. of Block : 7
No. of Panchayats : 66
No. of Villages : 355
4 Geographical area (‘ooo ha )
Total geographical area : 153.62
Total forest area : 44.36
Barren and uncultivated land : 9.4
Cultivated waste land : 43.77
Net Sown area : 49.34
Total cropped area : 55.07
Cropping Intensity : 112
5 Population (2011 census)
Total Population (in lakh) : 4.6174
Total Rural Population : 4.04 (87.57%)
Population Density (Number/Sq.Km.) : 310
Literacy (%) : 67.61
Male literacy : 77.41
Female : 57.69
Total ST Population (lakh) : 2.627 (56.89%)
Total SC Population (lakh) : 0.153 (3.32%)
6 Working population
Total working population (in lakh) : 2.21
Total cultivators (lakh) : 0.998

11
Total Agricultural laborer : 0.808
Total laborers engaged in household industry : 0.04
Other workers : 0.363
7 Operational holding ( in ‘000)
Marginal farmer (holding less than 1 ha)
: 28.6
Small farmers and Medium farmer ( holding 1
ha to less then 4 ha) : 16.41
Large farmers (holding 4 ha to less then 10 ha)
: 3.88
Total
: 48.89
8 Livestock (in ‘000)
Total Population : 563.13
Total Cattle : 151.25
Total Buffalo : 4.78
Total Sheep : 2.16
Total Goat : 117.63
Total Pig : 11.46
Total poultry : 268.72
Total Ducks : 7.13
1.2 Divisions
The administrative set up of all the district is divided into 7 development blocks: Lohardaga,
Kuru, Bhandra, Kairo, Kisko, Peshrar and Senha. The district includes 7 Police stations
having 355 villages spread over in 66 gram Panchayats. Lohardaga is the only town in the
district.
1.3 Demographics
According to the 2011 census Lohardaga district has a population of 461,738. This gives it a
ranking of 549th in India (out of a total of 640).The district has a population density of
310 inhabitants per square kilometer (800 /sq mi) It’s population growth rate over the
decade 2001-2011 was 26.67 %. Lohardaga has a sex ratio of 985 females for every 1000 males,
and a literacy rate of 67.61 %.
About 60% of the total population of the district is tribal population, Oraon is the major tribal
inhabitant of the district; the other primitive tribes are Asur, Birijia etc. still preserving their
additional old culture in the district.

12
Table – 1.2 : Population (as per Census Report-2011)
Sl.
No
.
Name Of
Block/Muncipalit
y
Population 0 to 6 Year
Population Literates
Person
s Males
Female
s
Person
s
Male
s
Female
s
Person
s Males
Female
s
1 Kisko 54968 27707 27261 9194 4656 4538 29811 17568 12243
2 Peshrar 31034 15762 15272 5969 2995 2974 13921 8684 5237
3 Kuru 84842 42449 42393 14568 7513 7055 47990 27610 20380
4 Kairo 37908 18857 19051 6249 3130 3119 20462 11894 8568
5 Lohardaga(Sadar
) 68591 34528 34063 11035 5642 5393 39618 23004 16614
6 Senha 69666 35230 34436 11512 5845 5667 39002 23095 15907
7 Bhandra 57332 28727 28605 9623 4892 4731 30125 17656 12469
8 LOHARDAGA
(Muncipality) 57397 29315 28082 7529 3919 3610 42708 22998 19710
District Total
46173
8
23257
5 229163 75679
3859
2 37087
26363
7
15250
9 111128
1.4 Education and Health Services
There are 445 Primary schools, 227 Primary with Upper Primary schools, 26 Primary with
Upper Primary & Sec/Higher Secondary schools, 23 Upper Primary & Sec/Higher Secondary
schools, 2 colleges and one teacher’s training school in the district. In this district, there is a
district hospital, one referral hospital, five primary health sub-centres, ten additional primary
health centres, seventy three health sub-centres.
1.5 Economy
There is a total absence of large scale industries in the district. People are engaged in small
scale industries like making of stone chips, bricks, soaps, oil, candles, aluminums goods,
wooden furniture, earthen pots, bamboo baskets, weaving of cloths and carpets etc. The

13
district is not having good network of communication. No national highway passes through
the district and Lohardaga town is located on the state highway between Ranchi and
Rourkela. Lohardaga is also connected with Ranchi by a metre gauge railway line.
1.6 Physiography
The district is divided into two broad physical divisions:
1. Hilly Tract and
2. Plateau Region
The Hilly Tract is extended in the West and North-Western parts of the district which
includes the parts of Kisko, Senha and Kuru development blocks. The high hill tops of this
region are known as Pat. The region is covered mainly with sal forests.
1.7 Geomorphology
The Plateau region is a part of the Gumla plateau, comprised with entire part of Lohardaga
and Bhandra development blocks and some parts of Senha, Kuru and Kisko developments
blocks. This region has a number of small hill blocks covered with forests. The general slope
of the district is from west to east. Geologically the area in comprised with Archean Granites
and Gneisses. In the uplands considerable thickness of late-rite of Pleistocene age is found in
the Granite and Gneisses tracts. Alluvium of recent to sub-recent age is found in the river
valleys. The most important mineral of the district is bauxite. Other minerals which are found
in the district are feldspar, fire clay and china clay and have less economic importance.
1.8 Drainage
The main rivers of the district are South Koel, Sankh, Nandni, Chaupat’s and Phuljhar etc.
These are mainly Rain fed rivers and dry up in the summer months. Some springs are also
seen in the hilly tract of the district.
1.9 Soils
The major part of the district is covered with Golden Alluvium, Red and Sandy and Red and
Gravelly soils. Late-rite and Red and Yellow soils are also found elsewhere in the district.
Soil of Lohardaga is sedimentary in nature. As per soil survey, conducted earlier, soil of this
region is yellow-reddish and yellow, medium to deep, light textured soil. Soil of the area is
light with good drainage. Soil acidity ranges from high to medium (PH
4.0-6.0). Soil is
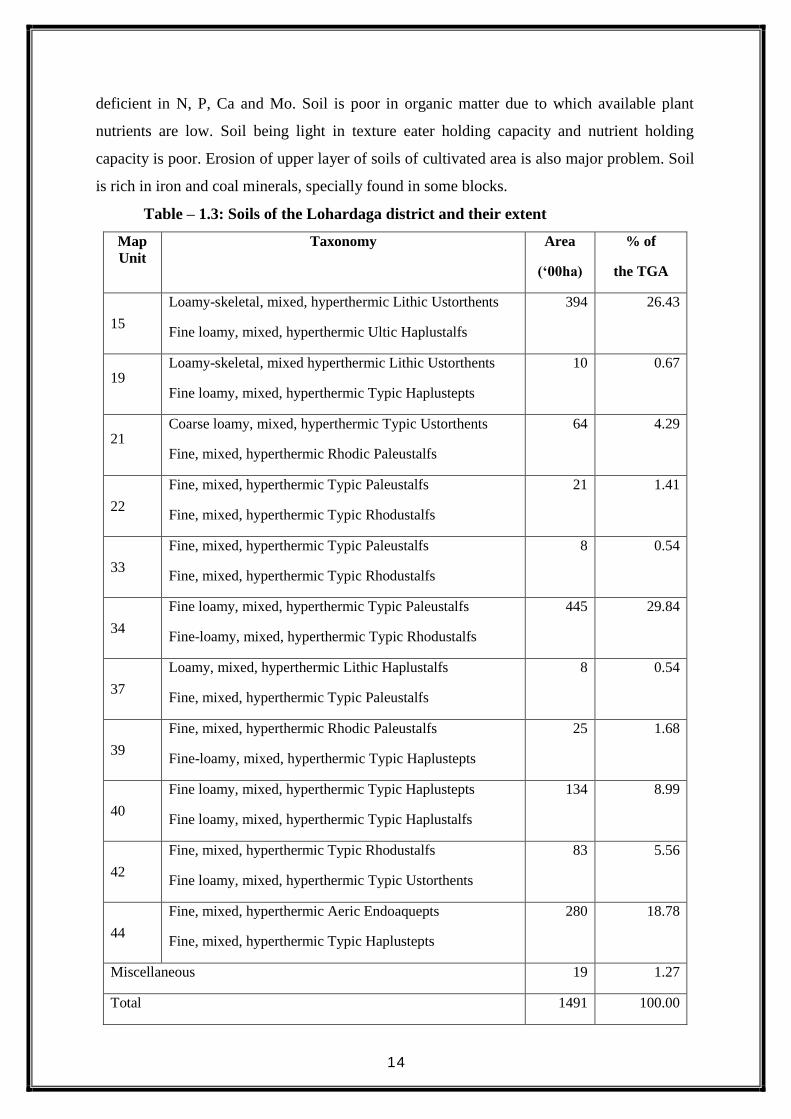
14
deficient in N, P, Ca and Mo. Soil is poor in organic matter due to which available plant
nutrients are low. Soil being light in texture eater holding capacity and nutrient holding
capacity is poor. Erosion of upper layer of soils of cultivated area is also major problem. Soil
is rich in iron and coal minerals, specially found in some blocks.
Table – 1.3: Soils of the Lohardaga district and their extent
Map
Unit
Taxonomy Area
(‘00ha)
% of
the TGA
15
Loamy-skeletal, mixed, hyperthermic Lithic Ustorthents
Fine loamy, mixed, hyperthermic Ultic Haplustalfs
394 26.43
19 Loamy-skeletal, mixed hyperthermic Lithic Ustorthents
Fine loamy, mixed, hyperthermic Typic Haplustepts
10 0.67
21 Coarse loamy, mixed, hyperthermic Typic Ustorthents
Fine, mixed, hyperthermic Rhodic Paleustalfs
64 4.29
22
Fine, mixed, hyperthermic Typic Paleustalfs
Fine, mixed, hyperthermic Typic Rhodustalfs
21 1.41
33
Fine, mixed, hyperthermic Typic Paleustalfs
Fine, mixed, hyperthermic Typic Rhodustalfs
8 0.54
34
Fine loamy, mixed, hyperthermic Typic Paleustalfs
Fine-loamy, mixed, hyperthermic Typic Rhodustalfs
445 29.84
37
Loamy, mixed, hyperthermic Lithic Haplustalfs
Fine, mixed, hyperthermic Typic Paleustalfs
8 0.54
39
Fine, mixed, hyperthermic Rhodic Paleustalfs
Fine-loamy, mixed, hyperthermic Typic Haplustepts
25 1.68
40
Fine loamy, mixed, hyperthermic Typic Haplustepts
Fine loamy, mixed, hyperthermic Typic Haplustalfs
134 8.99
42
Fine, mixed, hyperthermic Typic Rhodustalfs
Fine loamy, mixed, hyperthermic Typic Ustorthents
83 5.56
44
Fine, mixed, hyperthermic Aeric Endoaquepts
Fine, mixed, hyperthermic Typic Haplustepts
280 18.78
Miscellaneous 19 1.27
Total 1491 100.00
15
Figure -1.1 Soil Map of Lohardaga District
Table – 1.4: Soils under different reaction classes
Soil reaction Area
(’00 ha)
% of the TGA
Very strongly acidic (pH 4.5 to 5.0) 209 14.0
Strongly acidic (pH 5.1 to 5.5) 859 57.6
Moderately acidic (pH 5.6 to 6.0) 381 25.6
Slightly acidic (pH 6.1 to 6.5) 23 1.5
Miscellaneous 19 1.3
Total 1491 100.0

16
Table - 1.5: Organic carbon status
Organic carbon
(%)
Area
(’00 ha)
% of the TGA
Low (below 0.50 %) 561 37.6
Medium (0.50-0.75 %) 421 28.2
High (above 0.75 %) 490 32.9
Miscellaneous 19 1.3
Total 1491 100.0
1.10 Land Use and Land Cover:
In Lohardaga mainly complex-divorce and risk porn (CDR) production system of agriculture
prevail. Farmers are mostly resource poor and depended on household input used in
agriculture. Agriculture is the mainly practiced in rainfed condition. About 7_10 per cent of
the cultivable area is irrigated. Rabi crops are cultivated in pockets only where assured
irrigation is available. Free grazing is also a social problem which hinders rabi cropping.
The inhabitants of this district mainly depend on agriculture, forest produce and seasonal
migration to different parts of the country. 80% of the population depends upon agriculture.
The main crop of this area is paddy. In the small irrigated area wheat is grown to meet the
annual food sufficiency. Also this district is linked with larger vegetable markets like
Jamshedpur, Rourkela and Calcutta. There is a cold storage in the district. But profitable
vegetable cultivation is being limited to road side non-tribals. Generally, villagers of the
district keep plough animals. Also they keep goats and poultry birds as buffer. Although
there is a dairy chilling plant in the district head quarter, dairy is practiced by very few
people mainly non-tribal.
The net sown area is only 55% of the total area of the district. Two blocks i.e. Kisko & Senha
have large area under dense forest cover. The forest cover is around 32-35% of the total area
of the district. The average land holding per household is 1.65 Ha. The per capita agriculture
land is around 0.28 Ha. Net irrigated area is 13.4% of net sown area (0.8% by canals, 7% by
wells, 2% by tanks & 3.6% by lift irrigation & others).

17
There is scarcity of sufficient and dependable source of irrigation because of the district
being hilly. The means of irrigation in the district are river, canal, ponds and wells. The main
crop of the district is rice followed by millets (marua, gondli and maize), pulses (Pigeon pea,
Black gram), wheat, oil seeds (Sarguja and groundnuts) and vegetables like Pea, Potato,
Brinjal, Tomato and Cauliflower.
With the available resources and potentialities, for socio-economic growth, the district
deserves proper attention for resources planning which could magnify the district in every
field of development.
Moisture stress is the main production problem for rabi cropping. Other factors are attitude or
ignorance of people, lack of capital, unavailability of short duration variety. Upland soil
commonly called lalki on Balas our is suitable for Groundnut. Farmers have their own
criteria and acreage under Ragi, Horse gram, Sorghum has decreased. Farmers are aware of
social forestry and they developed nursery for Aakashmani, mango and Eucalyptus.
Cropping system is diverse, complex and not free from problems. Gall midge is the major
insect of rice. Stem borer occurs every year in damage and damage the crop. It was observed
that the damages are more due to insect then diseases.
Villagers rear animals domestically for milk, meat as well as draught purpose. Goat and
poultry population is more the cow and bullock. The breed in livestock is mostly of
indigenous type. The average Goat per household is 8-10, whereas the average number of
cow is 3-5. Mostly free grazing is practiced in the village. Supplementary food is given to
cow, buffalo and bullock but not in balanced combination. Subabool, Bakain & Jackfruit are
commonly used foot and mouth disease, hemorrhagic septicemia are major disease found in
Cattle. Ranikhet disease and skin disease is very common in birds and goat respectively.
Blocks in Lohardaga
There are 7 blocks in Lohardaga district, namely Bhandra, Kisko, Lohardaga, Kuru, Kairo,
Peshrar and Senha. Lohardaga is one of the poorest districts of Jharkhand; it is predominantly
rural, with heavy dependence on agriculture and low industrial investments. Around 50% of
the households below poverty line of the district are in the sample blocks.
1. Bhandra: Bhandra block is situated in southwest part of Lohardaga district. The
block has a geographical area of 195.76 sq kms. As per the Panchayat notification 45

18
villages in the block are part of 09 Gram Panchayats. According to Census 2011, total
population of the block is 57332, male population was 28727, female 28605,
population of 0-6 ages 9623.
2. Kisko: Kisko is the second poorest block of Lohardaga district. It is situated in the
northwest part of Lohardaga district. The block touches another district of Jharkhand
and is surrounded by Latehar district in the north, Kuru block in the east, and
Lohardaga block in south. The 52 villages of Kisko block are organized under 09
Gram Panchayats. Total population of the block was 54968, with 27,707 males and
27,261 females. The population in 0-6 age group was 9,194.
3. Lohardaga: Lohardaga block is situated in the midst of Lohardaga district. Ranchi
Rourkela road bisects it across north-south axis. The block is surrounded by Senha
and Bhandra in the south, Kisko in the north, east by Kuru, west by Kisko and Senha
and south east by Kairo. District head quarter of Lohardaga is situated in this block.
According to Panchayat notification there are 12 Gram Panchayats and 38 villages in
the block, Total population of the block was 12,5988. Male, female, 0-6 age group
populations were 63843, 63145, and 18564, respectively. The population data
includes the population of municipal areas. There is a major steel plant (Birla
industries) situated in Lohardaga town. However, majority of population earns its
livelihood from agriculture.
4. Senha: The block is situated in the southern region of Lohardaga district. Boundaries
of Senha block touches Gumla district in the south and west, Bhandra block in the
east, and Lohardaga block in the north. 11 Gram Panchayats cover 53 villages, with a
total population of 63918. Male population was 31,956, female population 31,062.
There were 11,512 persons in 0-6 years age group. There is a Navodaya Vidyalaya
located at JOGNA that provided quality education and also undertakes local talent
search in the block.
5. Kuru: The block is situated in the East region of Lohardaga district. It has 14 gram
panchayats covered by 65 villages with a total population of 83,922, male population
was 41,989, female population 41,933. There were 14,568 persons in 0-6 years age
group.
6. Kairo: The Boundaries of Kairo block touches Ranchi district and Bhandra, Kuru,
Lohardaga blocks of the Lohardaga district. It has 06 Gram Panchayats cover 26
villages, with a total population of 30380. Male population was 15,098, female
population 15,292. There were 6,249 persons in 0-6 years age group.

19
7. Peshrar: The Boundaries of Peshrar block touches Gumla district, Latehar district
and Kisko, Senha block of the Lohardaga district. It has 05 Gram Panchayats cover
74 villages, with a total population of 31034. Male population was 15,762, female
population 15,272. There were 5,969 persons in 0-6 years age group.
Villages:
The district has 355 villages with an average population of around 1030 persons, or about
200 households. These villages are actually habitations, comprising of homogenous tribal or
caste groups, called "toli" (In North Bihar plains, a similar habitation is called "tola"). Thus,
Oraons would have a toli, Munda toli would comprise of Munda tribespersons, and so on.
Agro-ecological Situation
The planning commission, Govt. of India, has divided the whole Country into 15 agro
climatic zone. Jharkhand state falls under VIIth
Agro climatic zone. This state is also divided
into three agro climatic regions i.e. IVth
, Vth
and VIth
. Among the three Lohardaga district
comes under the north-eastern plateau zone (Agro-climatic Zone V) Agro climatic region.
Based on the variation in topography, soil types and its problem, source of irrigation,
cropping pattern, forest area district has been divided into three agro-Ecological situation
(AESs) for the purpose of Strategic Research & Extension Plan. One representative village of
each AES was selected for participatory data collection through multidisciplinary AES terms.
These AES are named as under:
AES-I : Upland rainfed gravel, Forest, Sandy loam soil
AES-II : Undulated rainfed forest covered red soil
AES-III : Medium land irrigated, through well, grey soil
20
CHAPTER NO -2
LITERATURE REVIEW PMKSY
Water is central for the survival of life, and without it plant and animal life would not been
possible. Water is a central component of Earth's system, providing important controls on the
world's weather and climate. Water is also central to our economic well-being, supporting
agriculture, forestry, navigation, waste processing, and hydroelectricity. Recreation and
tourism are other primary uses supported by water. The crisis about water resources
development and management arises in Lohardaga District, Jharkhand state mostly because
of the following
a) The disproportionate availability of utilizable water.
b) It is characterized by its highly uneven spatial distribution.
Accordingly, the importance of water has been recognized in the Jharkhand state and greater
emphasis is being laid on its economic use and better management. Although the water in the
dams, lakes and reservoirs represents a relatively small percentage of total available water on
earth, dams are used as a reliable source of drinking water supply mainly for irrigation.
Water availability in the dams is an important source of agricultural water need, power
generation and recreation. Changes in the water levels are because of temporal variation of
inflow to the existing dams. These changes mainly reflect changes in rainfall, evapo-
transpiration (ET), infiltration, runoff and human activities over the catchment area. It is
observed that these fluctuations constitute a sensitive indicator of past and present climate
and human activity changes at a local and regional scale.
Groundwater Recharge/Depletion
Ground water resources may be termed as subsurface hydrosphere resources. It includes all
waters below land surface and in the saturation zone that are in direct contact with soil or
grounds .With the increasing demand of water due to population growth and resulting
increase in agricultural and economic activities, groundwater extraction is increasing at a
very fast pace, resulting in rapidly lowering of water table year after year. Due to this
situation, infiltration and further percolation are increasing, making less contribution of base
flow to the surface flow and thereby reducing the surface runoff.

21
Due to excessive pumped withdrawal of groundwater and corresponding negligible recharge
by natural process the groundwater is steadily dropping. In these circumstances, results (Solis
et al. 2011) show that groundwater banking can significantly improve water management in
the basin, increasing system storage, improving water supply for users in the basin, and
enhancing compliance with the treaty obligations. Since the 1970s, groundwater banking
studies have considered the economic and the hydraulic feasibility of storing water in
aquifers in wet periods and recovering it later in dry periods.
The development of groundwater banks requires the assessment of hydrogeology and water
quality, legal and financial issue, as well as proper water planning and management.
Intensive use of groundwater resources for agricultural production is proving to be
catastrophic in many arid and semiarid regions of the world, including some developed
countries like Spain, Mexico, Australia, and parts of US, and developing countries like India,
China and Pakistan etc.
Total (761BCM) and agricultural (688 BCM) water withdrawals in India are highest in the
world. More than half of the irrigation requirements of India are met from groundwater, and
number of mechanized bore wells in India have increased from 1 million in 1960 to more
than 20 million in 2000. A recent ground water depletion study in the northwestern Indian
states of Haryana, Punjab and Rajasthan is illustrative of common regional groundwater
depletion problem in India.
Irrigated Agriculture:
India has the largest irrigated agriculture with 65 million ha net irrigated area (21 million ha
through surface and 44 million ha through groundwater) India's canal systems are designed to
mobilize and move around 300 billion cubic meter (BCM) of water annually in a normal year
providing about 15,000 cubic meter (150 cm) per ha. Whereas, 300 BCM of groundwater
pumping from 44 million ha land indicates that water utilization per ha in uplands is about
6800 m3 (i.e., 68 cm) (Shah, 2011) which clearly points out the gross inefficient use of water
in surface irrigation schemes as compared to the groundwater irrigated areas.
The Government of India's huge investments in water resources development since
independence has helped the country to become self-sufficient in food production. However,
the irrigated area expansion is not in tune with the rate of capital investments made in this
field. The performance of public funded irrigation projects is continually declining over the
years due to systemic maintenance issues, inefficient delivery systems as well as inefficient
management at field level. Serious issues are arising due to the existence of huge disparity in

22
water access and utilization among head and tail end users, which has resulted in the over
exploitation of groundwater, thus declining the groundwater table in the canal irrigated areas
as well. Further, an increased cost of cultivation and soil salinity results in unsustainable
agriculture in such irrigated areas. Moreover, the storage capacity of most of the large and
medium capacity reservoirs has declined (both live and dead storage capacity) by 20-30%
over the years due to the excessive siltation leading to less water availability.
In addition, the individual farmers have made huge private investments for developing and
using groundwater resources, significantly enhancing the irrigated areas. Innovations in
pumping technology along with free or subsidized power supply has accelerated the
groundwater extraction, resulting in overexploitation and declining groundwater resources to
unsustainable levels in many parts of the country. In irrigated areas, the farmers' have
switched over to high water requiring and economically remunerative crops and intensive
cultivation. These unsustainable practices are threatening agriculture and food security in the
country. The latest reports from the GRACE Mission of NASA showed continued
groundwater decline of 4.0+/- 1.0 cm/yr, equivalent height of water (17.7645 km3/yr) over
the Indian states of Rajasthan, Punjab, Haryana, and Delhi. During the study period of
August 2002 to October 2008, the groundwater depletion was equivalent to a net loss of 109
km3 of water in northwest India. Such high rates of groundwater exploitation has increased
the percentage of 'unsafe' districts from 9% to 30% in a span of nine years between 1995 and
2004 (Vijay Shankar and Kulkarni, 2011) thereby reducing well-being, particularly for the
poorest members of society (Anantha, 2013).
For enhancing the water use efficiency (WUE) and minimizing the unproductive evaporation
loss of water, the government has promoted micro irrigation (MI) systems using sprinklers
and drip as key demand management interventions for water saving purposes. Properly
designed and managed MI systems can save up to 40% to 80% of water through increased
WUE up to 100% when compared to a mere 30-40% of water under the conventional surface
irrigation system . Large scale investments by the government and private individuals on the
use of micro-irrigation especially in horticulture and high-value crops has benefited large
numbers of farmers across the region in terms of water saving, enhancing crop productivity,
increased area under irrigation, improved income and livelihoods. In India, total potential
area coverage under MI is about 44 million ha through groundwater resources. Out of this,
about 30 million ha area is suitable for sprinkler irrigation for crops like cereals, pulses, and
oilseeds in addition to fodder crops. This is followed by drip irrigation with a potential of
around 12 million ha under cotton, sugarcane, fruits and vegetables, spices and some pulse

23
crops like pigeon pea, etc. The percentage of actual area against the potential area estimated
under drip irrigation in different states ranges from negligible in Nagaland to as much as 50%
in undivided Andhra Pradesh (presently Andhra Pradesh and Telangana state), followed by
Maharashtra (43%), and Tamil Nadu with 24%. In case of sprinkler irrigation, the percentage
of actual area against the potential area estimated was as lower as 0.01% (Bihar) and the
highest was 52% (Andhra Pradesh). Compared to the potential of 42 million ha in the
country, area under MI during 2011 accounted only 3.87 million ha (1.42 million ha under
drip and 2.44 million ha under sprinkler) which is about 9.16% of the entire potential, which
shows huge scope to harness the full potential. Along with technological innovation,
infrastructure development, institutional arrangement, and right water policy are needed to
scale-up suitable interventions, which can bridge the demand-supply gap.
In spite of a huge potential to adopt and harness benefits from MI, the rate of adoption of MI
technology is still low in the country. Only a few states like Telangana, Andhra Pradesh,
Maharashtra, and Tamil Nadu have adopted significant areas under micro-irrigation. The
poor adoption is attributed to number of factors such as high cost, complexity of the
technology, and other socio-economic issues such as lack of access to credit facilities,
fragmented landholdings, localized crop pattern, etc. Further, in the absence of improper
design of irrigation system is another important factor forcing poor adoption of micro-
irrigation especially among the small and marginal farmers. Evidence shows that the system
design is followed according to a fixed protocol set by the irrigation consultants irrespective
of the available resources and without considering farmers' wisdom as well as relevance. For
example, a farmer who owns a high discharge capacity pump-set can irrigate more area
potentially. Micro-irrigation system for relatively smaller acreage with this pump set will
generally lead to underutilization of pump capacity. Farmers, in such cases, are reluctant to
practice micro-irrigation as number of irrigations and the total energy requirement is much
higher than the traditional practices of surface irrigation. Therefore, the MI system design
needs to take into consideration, the resource availability and farmers' concerns. In some
parts of Tamil Nadu, farmers were ignorant about the maintenance package to be adopted for
the drip system, which acted as one of the constraints for its adoption. In addition, the lack of
skill and knowledge of the farmers' about the drip irrigation and its maintenance practices
itself, remained as constraints for its adoption. High costs of the soluble fertilizers also
restricted the use of efficient fertigation practices by the farmers.
With the increasing water scarcity, farmers in rural and peri-urban areas are using untreated
domestic wastewater for agricultural purpose, thus increasing the risk of nitrate pollution as

24
well as health hazards for the agricultural workers and consumers. For example,
approximately 16,000 ha of land in and downstream of Hyderabad are irrigated with
wastewater or a combination of wastewater and groundwater. Along the 10 km stretch of the
Musi River (Krishna River basin, Southern India) where wastewater from Hyderabad is
disposed-off. However, there are also higher risks associated to human health and the
environment by using the wastewater.
The important issues emerging from the irrigated agriculture scenario need urgent attention
to address the issues of sustainability of food production. This is possible only by enhancing
the efficiency of the irrigation schemes, minimizing the transmission losses, minimizing the
land degradation (salinisation, water logging and pollution of groundwater and environment),
controlling overexploitation of groundwater, and increasing the agricultural productivity as
well as profitability, thus protecting the environment. Further, to overcome the labor scarcity,
cooperative farming can be encouraged by involving Self-Help Groups (SHGs) and
Production Groups, along with mechanization of agricultural operations.
Rainfed Agriculture:
Rainfed agriculture covers a continuum of agriculture and comprises of areas that are
completely dependent on rain and areas with supplemental irrigation through rainwater
harvesting or groundwater recharge. Seventy six million ha (56% of arable land) rainfed
areas .in the country support 40% of human population, 78% of cattle, 64% of sheep and
75% of goat population. Rainfed agriculture has a large share of cropped area under rice
(42%), pulses (77%), oilseeds (66%) and nutritious cereals (85%). As estimated by the
Technical Committee on Watershed Development (2006), even in the best possible scenario
of irrigation development, about 40% of the additional supply of food grains needed to match
the future rise in demand will have to be generated from the rainfed agriculture in India. In a
country like India, with an average rainfall of 1100 mm per annum, there exists a problem of
physical water scarcity in rainfed areas which can be counted as the prime areas in terms of
low agricultural productivity (1 to 1.5 t per ha), poverty, food insecurity, and malnutrition.
Further, rainfed agriculture is also prone to severe land degradation and much vulnerable to
the adverse impacts of climate change.
Globally, rainfed agriculture covers 80% of agriculture and varies across regions (60% in
Asia and 97% in Africa). Rainfed agriculture, has a vast untapped potential and without
harnessing this large potential, food security for the growing population cannot be achieved

25
sustainably with scarce water and land resources. In India as well as in other parts of Asia and
Africa, rainfed agriculture is neglected over the period by the researchers, development
investors, and policy makers alike. However, currently the potential of rainfed agriculture is
well recognized and efforts are being made to harness the untapped potential. For example, in
India in spite of the available soil moisture, two million ha black cotton soil areas during the
rainy season in Madhya Pradesh and 12 million ha areas in Indo Gangetic plains are left
fallow in rabi after growing rice. With the accessibility to technologies for managing the soil
water and improved crop cultivars, 13 million ha can be brought under double cropping,
thereby solving the problem of pulses and oil seeds shortages in due time. It is well
established that 2/3rd of food production uses soil moisture (green water). However, while
considering water management for agriculture, blue water has been largely emphasized, as it
is visible and huge quantity of soil moisture (green water) is neglected. The current WUE in
rainfed agriculture varies from 35 to 45% with huge amount of fresh water harvesting, as soil
moisture during monsoon period is lost through the non-productive evaporation resulting in
poor water use efficiency.
The groundwater is a major source of water in rainfed system (62% of irrigated area) and this
resource is unsustainably overexploited resulting in changed hydrogeological regime that has
resulted in the alteration of natural recharge components to a great extent. It is estimated that
out of the 5842 assessment units, 802 units have been categorized as over-exploited, 169 as
critical and 523 units as semi-critical. About 58% of the replenishable groundwater in the
country is already exploited through tube wells and dug wells. However, extraction through
tube wells is causing steady depletion of the groundwater table, particularly in the alluvial
belts of the country as well as causing degradation in the quality of groundwater.
Groundwater management, policies and institutional innovations are urgently needed for the
protection of this valuable source and for the sake of human survival.
Watershed programs in the country underwent a great transformation in the year
2008 by bringing together all the watershed programs under one ministry (convergence) and
adopted livelihood approach (holistic system approach) and demand-based projects from the
states, with increased emphasis on capacity building. Although, changes were made at the
national level, many states still continued with the new watershed guideline programs in
business as usual, without internalizing the concept of convergence, collective and
participatory livelihood approach, objective monitoring and evaluation using remote sensing,

26
and GIS tools. India is having unique position in the world due to its watershed
implementation.
However, urgent steps are needed in terms of institutional, technical, and policy innovations
to harness the maximum benefits using science-led and demand driven watershed
implementation for transforming the rainfed agriculture scenario in the country. New
watershed initiatives such as "Neeranchal" would further upgrade the Integrated Watershed
Development Program (IWMP) and benefit the country at the same time.
The Government of Karnataka with technical support from the ICRISAT-led consortium
initiated a mission program "Bhoochetana", which was implemented in developed watersheds
to help increase the agricultural productivity in the state. In Bhoochetana, soil health mapping
was used as an entry point activity and based on the soil health mapping of the whole state in
2009-10, taluk wise balanced and integrated nutrient management recommendations were
developed, disseminated to the farmers' through farmer facilitators, wall writings, soil health
cards, and internet. In addition, it also ensured the availability of these inputs at the village
level as well. Through the convergence of schemes, incentivized supply of micronutrients and
improved seeds along with innovative monitoring and evaluation system resulted in increased
productivity for different crops by 20 to 66 per cent over the farmers' conventional
management practices. During 2009 to 2013, more than 5 million farmers' benefitted and net
economic benefits through increased production were estimated to the tune of US $ 353
million (Rs 1963 crores). Based on the success of Bhoochetana project, the GOK decided to
undertake a integrated system approach converging agriculture, horticulture, and livestock in
four districts through a project named "Bhoosamrudhi. With the technical support from the
eight international research institutions along with state agricultural universities led by
ICRISAT, this project is presently being implemented in all the districts in a phased manner.
(GOK, 2015). In addition to convergence state level, another innovative mechanism for
convergence involved appointing a special fully dedicated Joint Collector at district level,
along with allocation of resources with accountability to deliver double-digit growth, by
implementing the identified growth engines in different sectors. It is an innovative approach
to break the existing silos and achieve convergence for attaining efficiency and impacts at the
ground level.
Similarly, concerted efforts in Gujarat resulted in a large number of rainwater harvesting
structures in farmers' fields. In addition, annual campaigns, soil health mapping, and new
technologies were helpful in increasing the awareness in this part owing to this

27
implementation, this state managed to achieve 10 per cent annual growth rate as against the 2
to 3% growth rate in the country over the last decade. All these examples showed that with a
strong political will on ground, remarkable impacts can be achieved in rainfed areas.
Although, good examples of improved technologies for increasing agricultural productivity
and profitability in rainfed areas are available and demonstrated by the scientists at pilot
scales in different parts of the country, large-scale impacts have been eluding in the rainfed
areas. Over the years, with increasing frequency of longer dry spells and droughts along with
heavy intensity rainfall events, rainfed farmers are facing more difficulties and resorting to
extreme steps like suicides. There is an urgent need to transform the rainfed agriculture not
only for increasing the agricultural production, profits and for minimizing land degradation
but to make it attractive for the youth and women as a respectable profession, by using
scientific tools for mechanization, knowledge sharing, establishing market linkages and value
addition. Such practices ensure larger share of benefits through processing etc. that are
retained in the villages with substantially increased investments, enabling policies and
institutions.
Projects such as Mission kakatiya in Telangana State, Bhoochetana, Bhoosamrudhi in
Karnataka, Rythu Kosam in Andhra Pradesh, Gravity irrigation in Jharkhand and exceptional
development in Gujarat, are few examples of scaling up the initiatives and harnessing the
benefits for the farmers. At country level, such initiatives need to be scaled up through
innovative technology driven institutional mechanisms with decentralized accountability for
achieving the large-scale impacts.
Water Resource Planning and Management:
Water management is the branch of science and technology covering the account, studies, use
and conservation of water resources as well as control of adverse effect of water, a sphere of
activities responsible for water resources management with a view to meet the demands of
population and national economy for water, to ensure rational use of water resources and
their protection from pollution and depletion, to ensure operation of water management
schemes, as well as to prevent and eliminate the adverse effect of water. Effective measures
to cope with long term, drought and water scarcity are limited and difficult to implement due
to a variety of stakeholders involved and lack of adequate means to negotiate new policies.

28
Without water survival of mankind is impossible. Therefore, water resource plans and
management policies are essentially be adopted to manage this scarce resource with
maintaining the environmental sustainability.
Water resources management efforts have been shifted from engineering (e.g. Dam and water
channel construction) to economic/resource based water management approach .The UN
Charter of year 2002 accepts the Rights to Safe Water with respect to safety, affordability and
accessibility as a basic human right. Water is the most precious natural resource and is a
critical element in any kind of development planning. We should aim at providing adequate
water supply at a suitable pressure for various uses such as, domestic, irrigation, drinking,
sanitation, industrial, commercial, construction and other uses and at the same time protecting
the environment.
Irrigation activities in India alone consume about 80% of available water as the practices
adopted are outdated and largely wasteful. Improved methods of irrigation are available today
whereby the same amount of crops can be grown using only about 20% of the irrigation water
presently being used. So, water conservation is an urgent necessity with enough storage by
rain water harvesting, economizing on water use, reducing waste to the minimum, recycling
and reusing of used water.
Water savings from agriculture are considered the most critical measure for long term,
sustainable management of the watershed. The major components in the water management
system should include assessment and optimization of supply, demand management,
participatory and transparent management operating system, market based regulatory
mechanism, and combining authority with responsibility taking care of ecological
sustainability. Zajac (1995) as cited by Draper (2008) described two important
characterizations: Rule Fairness (or Procedural Justice) and Outcome Fairness (or
Distributive Justice) for effective water management. Sustainable plans and policies are
more likely to be those that reflect a consensus, to the extent possible, among all impacted
stakeholders. Compromises are often necessary for participatory water resources planning
and management (Takayanagi et al. 2011). The various demands for water are all essential to
our way of life: economic growth and prosperity, agriculture, and improved quality of life.
For water resource planning and management, we have to consider our stakeholders and their
interest; our legal and political constraints; and technical information and knowledge, which
has also been described by Liu et al. (2005), Frevert et al. (2006) and Lemeshko (2011). Kar

29
D. (2011) emphasizes to use benchmarking techniques to improve the operating efficiency of
the entire distribution system. Infiltration supports groundwater recharge, decrease
groundwater salinity, allows smaller diameters for sewers (resulting in cost reduction), and
improves the water quality of receiving waters. Therefore, Best Management Practices
(BMP's) based on infiltration are the foundation of many low impact development and green
infrastructure practices (Chahar et al. 2012). Groundwater banking is one approach leading to
better water management. Deficits occur when the bank is empty, and the other two sources
are unable to satisfy the demand.
Since independence of India and till formation of the State of Jharkhand in 2000, some
investments were made in the water sector for the development of water storage projects and
other water supply related schemes. This resulted in:
i. Creation of irrigation potential from a few thousand ha. to around 3.00 lakh ha. and
there by increased agriculture productivity and agro-based industries;
ii. Enhancing the drinking water supplies to the major cities and towns as well as to rural
areas; and
iii. Made available industrial water supplies to spur industrial growth.
However, inadequate measures of the last 63 years of the water challenges require immediate
attention. The isolated and fragmented approach adopted to surface and groundwater
development and management is deteriorating water qualities of both, surface as well as
groundwater, due to release of untreated effluent by the industries and municipal bodies and
some parts of the State is facing scarcity of water during non-rainy season.
State Water Policy (2011) of Jharkhand State fixes water use priority with the following
strategy:
First, the State will adopt a new State Water Policy framework to create the enabling
environment for better and more equitable and productive water resources management in an
environmentally sustainable manner for promoting growth reduction in poverty and
minimizing regional imbalance,
Second, the State will restructure the fundamental roles and relationships of the State and the
water users. To create the incentive for water users’ organizations and entities to participate
more fully in water resources management to manage, operate and maintain their water

30
distribution and service facilities and grant these, and new water users’ organizations and
entities a stable and predictable entitlements of water so that they can decide on the best use
of water without bureaucratic interference.
Third, the State will create a new institutional arrangement at the State level and at the river
basin level to guide and regulate water resources planning, development; to decentralize the
responsibility for water resources planning, development, management, operation and
maintenance functions to the river basin and sub-basin level by suitably defining the
responsibility and powers of proposed river valley institutions. The State will also review the
existing institutional arrangement in the water sector and appropriately restructure and adjust
them.
Fourth, the State will place a high priority on promoting technology to improve efficiency
and productivity, expansion of the knowledge base of the sector and the development of
human resource capacity and capability.
Fifth, the State will formulate appropriate legislation/administrative orders and enabling rules
to give effect to the above mentioned strategies in short time. To begin with, the State will
introduce farmer’s management of irrigation system and create State water authority, and
river basin authorities by enacting through appropriate act/legislation/rules/administrative
orders.
All existing problems become even more acute in low-water periods, the large lengths of
which, along with extreme runoff deficiencies have a strong effect on the strategy and tactics
of water management (Danil'yan et al. 2006).
31
CHAPTER NO - 3
3.0 METHODOLOGY AND APPROACH FOR PREPARATION OF DIP
As per PMKSY guidelines, the District Level Implementation Committee (DLIC) under
PMKSY to be chaired by the District /Collector/District Magistrate and the DLIC will
oversee the implementation and interdepartmental coordination at district level and will inter-
alia have following role:
a. To act as the field level coordinator between the various implementation agencies/line
departments in the District and to ensure that the agreed District Irrigation Plan /
Annual Irrigation Plan is successfully implemented
b. To prepare the District Irrigation Plan (DIP), showing the contribution of various
funding streams and programmes towards specific outputs and outcomes and seek
approval of the SLSC for the same.
Deputy Commissioner is the chairman of the DLIC and also responsible for the
implementation of the DIP in the district.
The DIPs are prepared at two levels, the block and the district. Keeping in view the
convenience of map preparation and data collection, the work would be primarily done at
block level. Block wise irrigation plan is to be prepared depending on the available and
potential water resources and water requirement for agriculture sector prioritizing the
activities based on socio-economic and location specific requirement. In case of planning is
made based on basin/sub basin level, the comprehensive irrigation plan may cover more than
one district. The activities identified in the basin/sub-basin plan can be further segregated into
district/block level action plans. Use of GIS Maps in land use maps in district, soil type maps
of the district, CCA Maps ( Kharif, Rabi, Hot Weather), cropping pattern((Kharif, Rabi, Hot
Weather), irrigation methods used such as canal, river irrigation, open well, tube well, tanks
& water bodies, area yet to get irrigation, satellite imagery, topo sheets and available database
may be appropriately utilised for developing irrigation plans at least on pilot basis to begin
with and subsequently may be extended to all projects. DPRs of watershed a project has been
taken into account while preparation of DIPs. The block wise master plan is to be approved
by inter-mediate level block panchayat and to be forwarded to the district planning committee

32
for inclusions in the district master plan i.e., DIP. The DIPs are to be vetted by the Governing
body of Zilla Parishad and subsequently be incorporated in the State Irrigation Plan (SIP).
For creating access to water source either assured or protective to each farm will require a
demand and supply assessment of crop water requirement, effective rainfall and potential
source of existing & new water sources considering geo-hydrological and agro ecological
scenario of the block. The master plan will include information on all sources of available
water, distribution network, defunct water bodies, new potential water sources both surface
and sub- surface systems, application & conveyance provisions, crops and cropping system
aligned to available/designed quantity of water and suitable to local agro ecology. All
activities pertaining water harvesting, water augmentation from surface/sub surface sources,
distribution and application of water including repair renovation and restoration of water
bodies, major medium and minor irrigation works, command area development etc. are to be
taken up within the frame work of this master plan. Emphasis is to be given for deriving
potential benefit from low hanging fruits like extending the reach/coverage of water source
through effective distribution and application mechanism, reducing the gap between potential
created and utilized through more focus on command area development and precision
irrigation. Proper integration of creation of source like dams and water harvesting structures,
distribution system like canals and command area development works and precision farming
to be made for deriving best possible use of water resources. Steps may also be taken for use
of urban treated waste water for irrigation purpose.
For respective blocks a command area may be identified for this purpose and adjoining
agricultural land of urban habitation. However, the recommended norms of treated sewage
quality for specified activities at point of use be ensured during use of recycled water.
Accordingly, an attempt was made to set up an Approach for preparing the District Irrigation
Plan. The DIP should cover broadly all the areas connected to water availability, requirement,
use, development and management. Therefore the data pertaining to preparation of DIP
would be multi-sectoral. The data requirement of the district would require information of
Physical features, Land use pattern, Demographic / Economic / Social, Meteorological,
Hydrological, Current surface & Ground water utilization and future requirement, Existing
and proposed Water Resources schemes, Irrigation Potential created, old water bodies etc.,
Agricultural / Irrigation statistics, Water Quality etc. Further, the Central agencies i.e. CGWB
can provide the updated information of the district level GW maps as the existing information

33
available was 8-10 year back and other information and data available on CWC INDIA-RIS
portal, Remote Sensing , CWC can also be utilized for preparation of requisite district Maps
in GIS for the following:
i. Land Use and Land Cover Map
ii. Annual Average Rainfall
iii. Slope Map
iv. River Network and Water Sheds of District
v. River Network, Dam , Barrage structures of District
vi. Irrigation Command Area
vii. Water Bodies map of District
viii. Irrigated & Un-irrigated Area Map
ix. Ground Water Level
There is a need for coordination among Central / State Agencies for data collection at the
district level as various central / state agencies are required to be involved for providing
desired data. The agencies having the required input data are Central Agencies such as
Central Water Commission (CWC), Central Ground Water Board (CGWB), Central Pollution
Control Board (CPCB), Indian Meteorological Department (IMD). The State agencies at
district / state capital level would be Irrigation & Water Resources Department, Minor
Irrigation Department, Command Area Development Authority, Agriculture Department,
Forest Department, Revenue Department, State Ground water Department, State Census
Department, State Planning Department. The involvement of the agencies corresponding to a
particular data type is shown in the Approach prepared for DIP in the next Para. The major
part of the data required is to be furnished by the State Agencies. Accordingly a mechanism
needs to be drawn up through a meeting at the appropriate level for mobilizing the District &
State agencies to furnish the required data through a nodal officer nominated by the State
Government for collection and compilation of the data from the various district agencies.

34
3.1 COORDINATION AMONG CENTRAL, STATE, DISTRICT AGENCIES FOR
DATA COLLECTION
Following Central and State agencies need to be involved for providing desired data:
3.1.1 CENTRAL AGENCIES
- Central Water Commission (CWC)
- Central Ground Water Board (CGWB)
- Indian Meteorological Department (IMD)
3.1.2 STATE AGENCIES
- Irrigation & Water Resources Department, Minor Irrigation Department
- Command Area Development Authority
- Agriculture Department
- Forest Department
- Revenue Department
- State Ground water Department
- State Census Department
- State Planning Department
3.1.3 DISTRICTDEPARTMENTS/AGENCIES
- Irrigation & Water Resources Department, Minor Irrigation Department.
- Agriculture
- District Chief Planning Office
- Fisheries
- Horticulture
- DWMA (District Water Management Agency)
The involvement of the agencies corresponding to a particular data type is shown above. It is
apparent from the above that the major volume of the required data is to be furnished by the
State, district departments/Agencies and accordingly a mechanism needs to be drawn up
through a meeting at the appropriate level for mobilizing the state agencies to furnish the
required data. Further it would be also appropriate if a nodal officer from the State
Government is identified for collection and compilation of the data from the various state
agencies.

35
3.2 ANALYSIS OF THE INPUT DATA
All the data described under Annexure will form the backbone of the DIP in terms of getting
the statistical profile of the individual blocks and the district as a whole. The physical
features, demographic / economic / social data, land use pattern and the meteorological data
will give an overview of the blocks / district and will form the statistical scenario essential for
further analysis and suggestions.
The harnessed water availability in the blocks will mainly be obtained from the canal
supplies, the ground water recharge, and the water available in the small water bodies and the
check dams built across various blocks in the district. The analysis will further look into the
avenues of increasing the water availability in the blocks through various schemes which are
ongoing / contemplated.
The present and projected water requirement is also essential for getting the surplus / deficit
scenario of the blocks and the district. The agricultural, domestic, industrial, energy, etc water
requirements will be calculated by utilizing the various parameters which have been included
in the data requirement such as gross sown area / net sown area / gross irrigated area / net
irrigated area, present and projected population, industrial units, power plants, etc. The
harnessed water availability factoring also the water quality issues and the present /projected
water requirement will give a surplus deficit scenario of the blocks / district which will in fact
be the cornerstone for making the SWOT analysis of the district.
Based on the above the actionable suggestions will be proposed that can be taken up in a
phased manner for implementation of the schemes so that the resource can be utilized
sustainably in the future.
3.3 OUTPUT OF THE DIP
The DIP would broadly attempt to focus on bringing out the actionable areas in the following
domain subject to the availability of data from various agencies:
3.3.1 SUPPLY MANAGEMENT
Projects (Major/Medium/Minor/Old Water Bodies schemes / Ground water Development
Schemes etc.) that need to be formulated to cater present and future demands of various
sectors at the block level.

36
Early completion of ongoing projects under various schemes for catering to the water
requirement
Identification of sources and funding arrangements for various projects in the pipeline
Water Quality issues & concerns and action required to be taken to address them
Identification of Irrigation Potential Created (IPC) and Irrigation Potential Utilized
and the reasons for the gap between IPC and IPU
Command area development program in the various command areas
Need for increased focus on improving water conveyance efficiency and water
application efficiency in the command areas
3.3.2 DEMAND MANAGEMENT
a) The existing pricing policy, revenue collection and maintenance of water delivery
infrastructure / facilities.
b) Role of Water User Association through Participatory Irrigation Management for
demand management.
3.4 STEPS INVOVLED FOR PREPARATION OF DIP
Step 1: Input Data Identification
Step 2: Identification of line Departments/ Agencies of Central, State & District
Step 3: Identification of Nodal officer for District for coordination with line Departments/
Agencies
Step 4: Collection, Compilation of Data for Statistical Details of the District
Step 5: Analysis of the Statistical Details of the District
Step 6: SWOT Analysis Scenario of the District, Block-wise
Step 7: Actionable Areas of implementation of DIP.
Step 8: Development Strategy, Management Strategy, R&D Strategy, Funding Arrangement
Step 9: Monitoring & Evaluation.
On the above lines the present DIP for Lohardaga district is prepared duly taking into
consideration the data collected from all the line departments and converging the data of all
the departments in each block and thus a realistic action plan is arrived as presented in the
format 5.1 for 4 years. The total requirement of this comprehensive DIP is coming to Rs.
1,188.4003 Crores for 5 years.

37
CHAPTER NO-4
4.0 DATA REQUIREMENT FOR PREPARATION OF DISTRICT IRRIGATION
PLAN
4.1 IDENTIFICATION OF DATA REQUIREMENT FOR PREPARING THE
PLAN
The DIP will cover broadly all the areas connected to water availability, requirement, use,
development and management. Therefore the data pertaining to preparation of DIP would be
multi-sectoral and broadly would be as below:
Table – 4.1: Type of Data Required
S.No. Type of Data Required
1 Physical features
2 Land use pattern
3 Demographic / Economic / Social
4 Meteorological
5 Hydrological
6 Current water utilization and future requirement
7 Existing and proposed Water Resource schemes, Irrigation Potential created,
old water bodies, etc.
8 Agricultural / Irrigation statistics
9 Water Quality & Sanitation
10 Revenue collection
11 Disaster related information

38
4.2 DATA REQUIREMENT FOR PREPARATION OF DISTRICT
IRRIGATION PLAN FOR LOHARDAGA DISTRICT
Table 4.2: Details of Chapters in district Irrigation Plan
Sl.
No.
Suggested Chapters Details of the Chapters Department / Agency
of the Govt.
1 Physical and
Geographical features
Total geographical area of the
district (RD)
No of administrative blocks in
the district and their areas (RD)
River basins/Sub-basins covering
the District (ID)
Catchment area of each of the
basins covered in the district
(ID)
Topographical features of the
district (ID)
1. Percentage in terms of hilly areas
and plain land
2. Soil types in percentage
Forest area / Reserved wild life
sanctuaries of the district (FD)
Area under tribal population
(RD)
1. Irrigation Dept.
(ID)
2. Forest Dept.
(FD)
3. Revenue Dept.
(RD)
2 Land use pattern Block-wise area of
the following: (SID / SAD / RD)
Under Barren land / Urban
settlement/Grasslands/Wetlands /
permanent pasture, etc.
Total cultivable area
Gross sown
Net sown area
Gross irrigated area
Net irrigated area
Total rainfed area
Block-wise Cropping Pattern
during Kharif, Rabi and Zaied
(SID / SAD / RD)
1. Irrigation Dept.
(ID)
2. Revenue Dept.
(RD)
3. State Agriculture
Dept. (SAD)
{Block wise data
may be collected.
Data may also be
available in District
Agricultural Plan
under Rashtriya
Krishi Vikas Yojana
(RKVY)}
3 Demographic /
Economic / Social
List of cities, towns and villages
in the district along with major
industrial centres, tourist spots,
etc (District Census Deptt)
Current population of the district
block wise and the future
projected population for 2015,
2020 (District Census Deptt)
Percentage of population
employed in agriculture,
1. District Census
Dept.
2. District
Agriculture Dept.
(AD)
{Block wise data
may be collected.
Data may also be

39
manufacturing and services
sectors block-wise (District
Census Dept)
Block-wise Current level of food
grain production (AD)
Level of productivity (Kg/ha or
tonnes / ha) in various regions
(AD)
Current and Projected food grain
requirement in 2015 and 2020
(AD)
Per capita block wise for
population engaged in
agriculture and other sectors
(State Census Dept. / State
Revenue Dept)
available in District
Agricultural Plan
under Rashtriya
Krishi Vikas Yojana
(RKVY)}
4 Meteorological Average monthly rainfall
showing spatial and temporal
variations Block-wise
(IMD/CPO Lohardaga)
Average monthly Temperature in
various blocks (IMD / CPO)
Potential Evapo-transpiration
(PET) (IMD / CPO)
(Block wise data may be collected)
1. IMD
2. CPO Lohardaga
5 Hydrological Major canal networks including
Main Canal, Branch Canal,
Distributaries, Minors, Feeder
Channels etc. supplying water to
the district Block-wise including
their carrying capacity (ID)
List of all water bodies including
their carrying capacity in the
district and their Unique Codes
Block-wise (ID)
Historical peak discharge in the
last 5 years, 10 years, 20 years,
50 years (as available) (ID)
Replenishable ground water
resources (Block-wise) (GWB)
Over-exploited blocks (GWB)
1. Irrigation Dept.
(ID)
2. Ground water
(GWB)
6 Current water utilization
and future requirement
Current water utilization for
various sectors such as irrigation,
domestic, industrial, energy, etc.
for both surface and ground
water (SID )
1. Canal Water supplies including
water supplied through pump
canal system, lift irrigation
schemes, etc.
1. Irrigation Dept.
(ID)
2. Ground water
(GWB)

40
2. Ground Water draft (GWB)
3. Water supplied from various
water bodies (ID)
4. Projected scenario of water
requirement in 2015 and 2020
Block-wise for: (ID)
irrigation,
domestic uses
energy generation
industrial uses
navigation,
ecology, etc.
(Block wise data may be collected
and used)
7 Supply side management Total number of Major, Medium
and Minor projects completed,
ongoing and planned in the
district for irrigation,
hydroelectric power generation,
water supply, flood control and
Drainage (Block-wise) (ID)
The Irrigation Potential Created
(IPC) in the district (Block-wise)
(ID)
Break-up of the projects in terms
of storage, diversion, lift
irrigation, etc. (Block-wise) (ID)
Total live storage capacity
created and under construction
(Block-wise) (ID)
Possible sites for creation of new
storages, diversion structures, lift
irrigation schemes, etc and the
extent of irrigation potential and
other benefits that can be
generated through such schemes
(Block-wise) (ID)
T-Diagram of the entire canal
network in the district (Main
canal / DYs / Minors / Sub-
minors) showing the existing
gaps (This might help to pinpoint
the IPC and IPU gap) (ID)
Total financial assistance under
various schemes received from
Central Government so far like
AIBP / National scheme
/NABARD, etc (ID)
Total number of old water bodies
in the district (block-wise) and
those planned to be covered
1. Irrigation Dept.
(ID)
2. Agriculture
Dept (AD)
3. (GWB)

41
under RRR and the potential
likely to be recovered from
them and irrigation, drinking
water, and other benefits that can
be accrued from them (ID)
Total number of check dams
constructed in various blocks (ID
/ AD)
Current status of water use
efficiency for surface as well as
ground water (the figure may
indicate the conveyance
efficiency and field application
efficiency separately in various
regions) (ID)
Status of conjunctive use of
surface and ground water (ID /
GWB)
(Block wise data may be collected
and used)
8 Agricultural / Irrigation
statistics
Area under different types of
crops in the district during
Kharif, Rabi and Hot summer
(AD)
Irrigation potential created
block-wise (ID)
Irrigation potential utilized
block-wise (ID)
Gap between irrigation potential
created and utilized (ID)
Reasons for the gap between IPC
and IPU (ID)
Area already covered and
proposed to be covered under
micro-irrigation (ID / AD)
Length of the canal system
already lined and proposed to be
lined in the near future (ID)
Food grain production from
irrigated area and rainfed area
(AD)
{Block wise data may be collected
and used Data may also be available
in District Agricultural Plan under
Rashtriya Krishi Vikas Yojana
(RKVY)}
1. Irrigation Dept.
(ID)
2. Agriculture
Dept (AD)
3. (CPO)
9 Demand side
management
Current water pricing model
followed in the district and
proposed changes in near future
(ID)
1. Irrigation Dept.
(ID)

42
Total annual revenue
requirement for maintenance of
irrigation facilities (ID)
Annual expenditure incurred for
the last 10 years year wise on
maintenance of irrigation
facilities in the district (ID)
Revenue assessed from the
existing pricing policy in
percentage terms of annual
maintenance requirement (ID)
Ratio of revenue realized to
revenue assessed (ID)
Creation of Water User
Association for Participatory
Irrigation Management (ID)

43
CHAPTER NO-5
Hydrology
From the Hydrological point of view, Lohardaga district comes under the influence of three
river systems namely the Damodar (Ganga basin), North Koel and South Koel with a number
of small rain fed rivers like Shankh, Nandini, Puljhar & Soha which dry up in summer
months. The district has a surface flow of 481 MCM which till recently has been largely
untapped. Most of the nallahs have enough flow during the monsoon but the flow is
considerably reduced in lean periods and there is not enough storage even for individual
pump sets. The district is divided into 5 major watersheds:
1. Auranga, Gowa
2. Phuljhar
3. Upper Damodar
4. Upper North Koel
5. Upper South Koel
Table 5.1: Irrigated area (ha) in Lohardaga district
S.No. Particulars Area in ha
1. Net Irrigated Area 7752
2. Source of Irrigation
(i) By Channels 2611
(ii) By Well 2754
(iii) By Pond 329
(iv) By Tube wells 438
(v) By Lift Irrigation 548
(vi) Others 1072

44
Table 5.2: Soil Erosion and Runoff Status
5.2.1 Soil Erosion and Runoff Status
Name of the State:- Jharkhand
Name of the Distrist:- Lohardaga
Name ot the Block: Kuru
Name of the Micro Watershed
Name of the
Sediment Monitoring
Station
Longitude Latitude Soil Erosion (Tone/ha)
Runoff
Drought Frequenc
y
Peak Rate (cum/hr)
Frequency of peak (No in Months)
Total Runoff Volume of Rainy Season (ha-m)
Time of return of Maximum flood
Buchi nala 84 41 12 .12 23 3312.99 14 890 1668.9 5 Years
10 Years
In years
Tana bhagat 84 43 45. 19 23 34 39 14 702 1668.9
Anand pur 84 42 10.28 23 34 43. 59 14 760
Bara jharia 842 10 28 4 23 34 43 .58 14.67 876
Sarna 84 42 10 28 23 34 43 .59 14 896
Pawan Ghat 84 42 10 .28 23 34 43.59 14.45 752
Jagasi Nala 84 42 10 .28 23 34 43.59 14 980
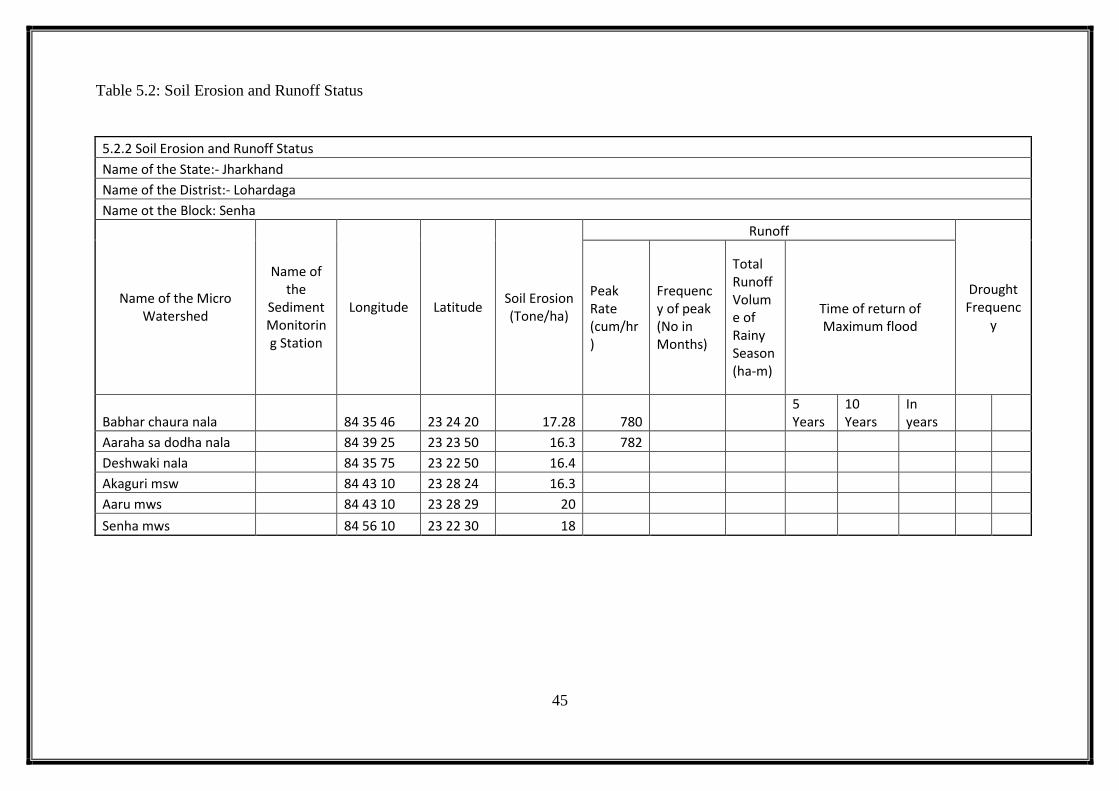
45
Table 5.2: Soil Erosion and Runoff Status
5.2.2 Soil Erosion and Runoff Status
Name of the State:- Jharkhand
Name of the Distrist:- Lohardaga
Name ot the Block: Senha
Name of the Micro Watershed
Name of the
Sediment Monitoring Station
Longitude Latitude Soil Erosion (Tone/ha)
Runoff
Drought Frequenc
y
Peak Rate (cum/hr)
Frequency of peak (No in Months)
Total Runoff Volume of Rainy Season (ha-m)
Time of return of Maximum flood
Babhar chaura nala 84 35 46 23 24 20 17.28 780 5 Years
10 Years
In years
Aaraha sa dodha nala 84 39 25 23 23 50 16.3 782
Deshwaki nala 84 35 75 23 22 50 16.4
Akaguri msw 84 43 10 23 28 24 16.3
Aaru mws 84 43 10 23 28 29 20
Senha mws 84 56 10 23 22 30 18

46
5.2.3 Soil Erosion and Runoff Status
Name of the State:- Jharkhand
Name of the Distrist:- Lohardaga
Name ot the Block: Lohardaga
Name of the Micro Watershed
Name of the
Sediment Monitoring
Station
Longitude Latitude Soil Erosion (Tone/ha)
Runoff
Drought Frequenc
y
Peak Rate (cum/hr)
Frequency of peak (No in Months)
Total Runoff Volume of Rainy Season (ha-m)
Time of return of Maximum flood
Kutmu mws 84 39 00 23 21.10 54 780 5 Years
10 Years
In years
Nadiya mws 84 39 40 23 21 .10 43 780
Juriya mws 84 40 41 23 34 00 48 760

47
Table 5.31: Area-wise, crop wise irrigation Status
5.31: Area-wise, crop wise irrigation Status
Name of the State:- Jharkhand
Name of the Distrist:- Lohardaga
Name ot the Block: Lohardaga
Kharif (Area in ha) Rabi (Area in ha) Summer Crop (Area in ha) Total (Area in ha) Horticulture & Plantation
Crops (Area in ha)
Crop type Irrigated Rainfed Total Irrigated Rainfed Total Irrigated Rainfed Total Irrigated Rainfed Total Irrigated Rainfed Total
A)Paddy - 5149.19 5149.19 761.5 - 761.5 25.14 - 25.14 786.64 5149.19 5935.83 - - -
B)Coarse Cereals
- 610.12 610.12
- - - 66.67
- 66.67 66.67 610.12 676.79
- - -
C) Pulses - 220.18 220.18 105.24 118.18 223.42 - - - 105.24 338.36 443.6 - - -
D) Oil Seeds - 70.08 70.08 21.02 25.26 46.28 - - - 21.02 95,34 116.36 - - -
E) Fibre - 1 1 7.35 - 7.35 - - - 7.35 1 8.35 - - -
F) Any other crops..
159.55 331.09 490.64 596.23 -
596.23 271.58 315.72 587.3 1027.36 646.81 1674.17 - - -
Mango - - - - - - - - - - - - 0 174.64 174.64
Guava - - - - - - - - - - - - 0 30 30
Jackfruit - - - - - - - - - - - - 0 20 20
Litchi - - - - - - - - - - - - 0 0.4 0.4
Banana - - - - - - - - - - - - 0 3.7 3.7
Watermelon - - - - - - - - - - - - 1.41 0 1.41
Kharbuja - - - - - - - - - - - - 1.98 0 1.98
Any Frout - - - - - - - - - - - - 5 2 7
Leaf vegetable - - - - - - - - - - - - 36.99 0 36.99
leady finger - - - - - - - - - - - - 49.25 0 49.25
Pumkin - - - - - - - - - - - - 57.93 0 57.93
Patato - - - - - - - - - - - - 105 0 105
Any vegetable - - - - - - - - - - - - 53.07 0 53.07
Mary vegetable or any flower
- - - - - - - - - - - - 2 0 2

48
5.3.2: Area-wise, crop wise irrigation Status
Name of the State:- Jharkhand
Name of the Distrist:- Lohardaga
Name ot the Block: Senha
Kharif (Area in ha) Rabi (Area in ha) Summer Crop (Area in ha) Total (Area in ha) Horticulture & Plantation
Crops (Area in ha)
Crop type Irrigated Rainfed Total Irrigated Rainfed Total Irrigated Rainfed Total Irrigated Rainfed Total Irrigated Rainfed Total
A)Paddy - 2398.47 2398.47 780.38 - 780.38 73.09 - 73.09 853.47 2398.47 3251.94 - - -
B)Coarse Cereals - 591.24 591.24 - - - 81.02 - 81.02 81.02 591.24 672.26 - - -
C) Pulses - 237.14 237.14 180 295.51 47^51 - - - 180 532.65 712.65 - - -
D) Oil Seeds - 126.02 126.02 35.12 7.28 42.4 - - - 35.12 133.3 168.42 - - -
E) Fibre - 29.26 29.26 - - - - - - 0 29.26 29.26 - - -
F) Any other crops..
417.25 279.71 696.96 800.6 800.6 418.43 267.42 685.85 1636.28 547.13 2183.41 - - -
Mango - - - - - - - - - - - - 0 344.56 344.56
Guava - - - - - - - - - - - - 0 20.45 20.45
Jackfruit - - - - - - - - - - - - 0 20 20
Litchi - - - - - - - - - - - - 0 0.8 0.8
Banana - - - - - - - - - - - - 0 0.4 0.4
Watermelon - - - - - - - - - - - - 12.82 0 12.82
Kharbuja - - - - - - - - - - - - 2.81 0 2.81
Any Frout - - - - - - - - - - - - 6 2 8
Leaf vegetable - - - - - - - - - - - - 47.25 0 47.25
leady finger - - - - - - - - - - - - 115.54 0 115.54
Pumkin - - - - - - - - - - - - 101.02 0 101.02
Patato - - - - - - - - - - - - 115 0 115
Any vegetable - - - - - - - - - - - - 301.53 0 301.53
Mary vegetable or any flower
- - - - - - - - - - - - 3 0 3

49
CHAPTER NO -6
Ground Water Resources
The dynamic ground water resource potential of the district has been estimated as per the
methodology given by the Ground Water Estimation Committee 1997 (GEC 1997). As per
the revised methodology the resource assessment is done on watershed basis and is
apportioned from the watersheds - (sub-basins) to mandal. Based on the percentage of ground
water utilization, the watersheds/mandals are categorized into four categories.
Ground Water Development
Irrigation and drinking water needs in the district are mainly met through ground water. Out
of 7,752 ha area irrigated, nearly 86.17 % (6680 ha) is met by ground water.
Table 6.1: Irrigated area (ha) in Lohardaga district
S.No. Particulars Area in ha
1. Net Irrigated Area 7752
2. Source of Irrigation
(i) By Channels 2611
(ii) By Well 2754
(iii) By Pond 329
(iv) By Tube wells 438
(v) By Lift Irrigation 548
(vi) Others 1072
The main ground water abstraction structures used for domestic purposes are dug wells and
borewells / tube wells. Small diameter dug wells of 1 to 4 m with a depth of 5 to 33 m
(average 15 m) are in vogue. The water from these wells is lifted by means of bucket and
rope and by electric motors of 1 to 2 HP for domestic purposes. For irrigation purposes, large
diameter dug wells/-dugcum-bore wells, especially in non-command areas are in operation.
In hard rock areas, depth of dug well varies between 4 to 22 m with a yield of 10 to 277
m3/day with a general yield range from 50 to 80 m
3/day. The bore wells/tube wells are
operated by electric motors fitted with submersible pumps of 5 to 10 HP. In soft rocks, depth
of open wells varies between 6 to 16.75 m with yield in the range of 30 to 100 m3/day
(average of 50 m3/day). In alluvial (un-consolidated formation), depth of open wells varies
between 5 to 10 m with a yield a 100 to 300 m3/day. The dug/dug-cum-bore wells are
operated mostly by 3-7.5 HP pumps and also by diesel engines fitted with centrifugal pumps.
The weathered and fractured zones are tapped by bore wells of 30-100 m depth with
discharge varies between 3.6 to 18 m3/hr. The maximum depth of potential aquifers
identified by CGWB in hard rock areas is down to a depth of 125 m. The depth of tube wells

50
constructed in semi-consolidated rocks varies between 70 to 200 m with a yield of 10-50 m3
/hr. The filter point wells constructed in alluvium formations are of 5 to 10 m depth, with a
yield rate of 25 to 50 m3/hr.
RECOMMENDATIONS
1. In non-command area, where further development of groundwater is possible the sites
should be selected on scientific basis.
2. In non-command area, ground water resources are scarce, therefore, less water
intensive crops to be raised and alternative irrigation methods like drip and sprinkler
irrigation may be encouraged and farmers may be given loans with enhanced subsidy.
Technical guidance has to be provided to the illiterate farmers in maintaining those
irrigation equipment.
3. To stop surface run off and to enhance ground water storage, ground water
conservation and artificial recharge structures must be taken up, on suitable locations.
4. Watershed management plans with people’s participation must be adopted and impact
assessment studies should be carried out on scientific basis.
5. Peoples’ Participatory Programme along with mass awareness programmes must be
conducted widely on regular basis in the rural areas to educate the farmers regarding
the water management and to update their knowledge.
6. Training for local government functionaries, NGOs, voluntary organizations engaged
in watershed development activity to be given in scientific selection of sites, design of
structures, for construction of rainwater harvesting and artificial recharge structures.
7. There should be a complete institutional credit cover to small and marginal farmers
for drilling deep bore wells in ground water potential areas, for procuring water
saving equipment like drip and sprinkler systems, etc. Insurance facility should be
provided to cover the health of farmers and their families, damaged crops due to
severe drought conditions, unforeseen loss, market rates for the agriculture produce,
etc.
8. To minimize the dependence solely on agriculture, the government should provide
loan facility with enhanced subsidy to the farmers to initiate dairy and poultry farm
for supplementary income.
9. In order to impart education to the farmers, regarding cropping pattern, hybrid
varieties, pesticides, irrigation techniques etc., ‘-Agri-clinics’ may be established in
rural areas for every five villages in non-command areas.
10. The spacing norms between two adjacent bore wells, as per the norms of APWALTA
act, should be strictly implemented.
51
CHAPTER NO -7
Accelerated Irrigation Benefit Program
Background:
Major & medium irrigation projects are capital intensive in nature. The State Governments
with resources find themselves unable to meet desired fund demands of all the projects.
Therefore, the project completion gets delayed and a large number of projects in the country
have spilled over from one plan to another. Further, funds spent on these projects are locked
up and the country is not able to derive the desired benefits. This was a matter of grave
concern for the Union Government. Against this background, the Accelerated Irrigation
Benefit Programme (AIBP) was launched by Government of India during 1996-97 to provide
financial assistance to State Governments for accelerating the pace of irrigation development
in the country.

52
CHAPTER NO -8
Har Khet Ko Panti
Objective:
Enhance the physical access of water on the farm and expand cultivable area under assured
irrigation.
Scope:
To ensure and access to irrigation facility to every farm land by next five year (2016-2021).
The main activities covered under this scheme is creation of new water sources through
Minor Irrigation (both surface & ground water), Repair, restoration & renovation of water
bodies, Diversion of water from source of different location where it is plenty to nearby
water scarce areas, lift irrigation from water bodies/ rivers at lower elevation to supplement
requirements beyond IWMP and MGNREGS irrespective of irrigation command. The cost
under this component is Rs. 161.64 crores. The detailed budget for this component has been
prepared block wise and attached as Annexure.
53
CHAPTER NO -9
Per Drop More Crop
Objective:
To enhance the crop productivity by improving the water use efficiency through micro
irrigation systems.
Scope:
Promoting efficient water convenience and precision water application devices like drip,
Sprinklers in the farm.
Activities:
1. Construction of micro irrigation structure to supplement source creation activities
including tube wells and dug wells (in areas where ground water to available and not
under semi critical/critical/over exploited category of development) which are not
supported under PMKSY (WR), PMKSY (Watershed) and MGNREGS.
2. Secondary storage structure at tail end of canal system to store water when available
in abundance (rainy season) or from perennial sources like streams for use during dry
periods through effective on-farm water management.
3. Capacity building, training foe encouraging potential water source through
technological agronomic and management practices including community irrigation.
4. Awareness campaign on water saving technologies, practice, programmes, etc.
organization of workshops, conferences, publication of booklets, pamphlets, success
stories, documentary, advertisements etc.
5. Improved/ innovative distribution system like pipe and box outlet system with
controlled outlet and other activities of enhancing water use efficiency.
6. Topping of a input cost particularity under civil construction beyond permissible limit
(40%), under MGNREGS for activities like lining inlet, outlet silt traps, distribution
system etc.
7. Drought proofing to check dams/water harvesting structure.
8. On farm development like distribution pipe/raised bed and furrow systems etc.

54
Outcome:
1. Increase production, Productivity & Quality.
2. Conservation and sustainable use of water.
3. Higher energy efficiency in agriculture sector.
4. Improves water use efficiency.
5. Higher fertilizer use efficiency.
6. Saving in expensive labour.
Cost of the Component:
The cost of the component is Rs. 72.67 Crores.

55
CHAPTER NO -10
Watershed Development
Objective:
The major objective of the watershed development is to improve the ground water level by
constructing the water harvesting structure.
Scope:
To improve soil moisture by doing the gully control works and thus improving the
productivity of the land and prevent soil erosion.
Activities:
1. Water harvesting structures such as check dams, nala bund, farm ponds, tanks, etc.
2. Capacity building, entry point activities, ridge area treatment, drainage line treatment,
soil and moisture conservation, horticulture, pasture development, livelihood
activities for the asset-less persons and production system & micro enterprises for
small and marginal farmers etc.
3. Effective rain fall management like field bunding, contour bunding / trenching,
staggered trenching, land leveling, mulching etc.
4. Focusing on areas under entry point activity such as solar street lights, Community
shed, RO plant, etc. under natural resource management focusing on check dams mini
percolation tanks NADEP compost percolation tank etc., Institution and capacity
building to the farmer house-holds, Livelihood related activities, productivity
enhancement.
5. The Integrated Watershed Management Programme is implemented in Kisko,
Lohardaga, kuru, and Senha blocks of the Lohardaga district under supervision of
Jharkhand state watershed mission. The Six IWPM projects have been sanctioned in
Lohardga district till 2016. The detail of all six project are as following:
Sr.No.
Name of the
project
Department
Project
Implementing
Agency
Project
Sanction
Year
Project
Area (ha)
Total
Project
Cost (in
lakh)
1. IWMP/1/2010-11 Divisional forest
officer lohardaga
2010-11 4550.24 ha 546.03

56
2. IWMP/2/2012-2013 Samriddhi
foundation 2012-13 5543.42 ha 831.51
3. IWMP/3/2013-14
Parivesh society 2012-13 5555.86 ha 833.38
4. IWMP/4/2014 Soil Conservation
officer lohardaga 2013-14 5392.25 ha 808.84
5. IWMP/5/2014-15 Soil Conservation
officer lohardaga 2013-14 5000 ha. 750
Cost of the component: The cost of the watershed component is Rs 163.05 Crores.
Convergence with MGNREGA
The following project Converges with MGNREGA:
Water harvesting structure on individual lands of vulnerable sections, creation of new
irrigation sources, up gradation/desilting of traditional water bodies, water
conservation works etc.
Supplementing soil and water conservation works in the identified back ward rainfall
blocks by overlying of the plant with that of watershed project for development to full
potential.
Desiltation of canal & distribution of existing water bodies strengthening of
bunds/embankment etc.
Outcome:
Creation of durable assets.
Cost of the component: The cost of the component for convergence with MGNREGA is Rs
76.52 Crores.

57
CHAPTER NO -11
Developments in New Agricultural Production Systems in Lohardaga
Introduction:
The agriculture in Lohardaga district is transforming from traditional to modern ways. The
shifting cultivation is gradually vanishing and even the tribal farmers are adopting new
technologies where irrigation facilities are expanding. At the same time, in the low potential
areas, farmers are taking to organic farming with the encouragement of NGOs and companies
marketing organic cotton. The mono-culture of rice is giving way to a desirable rotation with
vegetables. As the awareness levels of farmers improve, adoption of new and sustainable
technologies is taking place and agriculture is poised to take a big leap forward.
Growth drivers:
Vegetables is giving good results in the recent years in the soils and it has further potential to
increase the incomes of the farmers by adopting new, short duration varieties. Sorghum has
potential to give higher yields by following improved technologies and organic farming in
some areas. The performance of vegetables during 2007-08 has been quite good and it may
attract more and more areas. Seed village program is becoming popular and farmers are
acquiring skills needed for seed productions. As more areas come under irrigation, there is a
possibility of the district emerging as a seed production center. Besides these opportunities in
crop production, there are tremendous growth prospects in the allied sectors. Livestock sector
has contributed well to the incomes of farmers even in the drought years and it has further
prospects of accelerated growth. The private dairy processing units are providing scope to
dairy farmers to look for better prices and quicker marketing facilities. Obviously, livestock
and poultry sectors are important growth drivers for the uplift of rural economy. The
horticulture sector in general and vegetable cultivation in particular can be a growth driver in
the district because of the changing consumption preferences of consumers and increasing
incomes of the urban people. By making appropriate investments, fisheries sector can emerge
as an important growth driver. Stocking and feeding interventions to achieve increases in fish
production per unit area can lead to achievement of a high growth rate in the fisheries sector.
Sericulture also has potential to record high growth because of the limited area under

58
mulberry in the base years. Besides the opportunities in primary sectors, the secondary and
tertiary sectors can also emerge as good growth drivers during the next five years.
Innovative schemes:
The schemes to improve the organic matter content in the soil and productivity of crops are
quite innovative. Although they involve substantial investments, the schemes of green
manuring and gypsum application in the irrigated areas of the district are helpful both in the
reclamation of the soils as well as in improving the organic matter content in the soils along
with the availability of both the macro as well as the micro nutrients.
Similarly, the schemes to produce seeds of different crops through seed village production
program are also quite innovative. For the first time, a logical link and sequence is
established between the production and supply of nucleus, breeder, foundation and certified
seeds in the district. Dependence on seed produced in other districts was causing serious
bottlenecks in the supply of seed to the farmers on time. The massive program of seed
production will remove this bottleneck and will contribute significantly to the productivity of
crop.
Farm mechanization is another innovative scheme. Many farmers migrate seasonally to the
urban centers in Ranchi & West Bengal. It has created acute labor scarcity in the rural areas.
The National Rural Employment Guarantee Act has been instrumental in improving the
purchasing power of the working class, but has also exerted an upward pressure on the
wages. Under these circumstances, mechanization has become inevitable. Helping the
farmers through subsidies in accessing the farm machinery and equipment is quite an
innovative scheme. Farmers can improve precision and minimize losses due to farm
mechanization.
The proposal to take up diversification in marginal lands in favor of plantation crops is
another innovative scheme. These trees can yield fruits from which –bio-fuels can be
produced. The trials on the research stations have vindicated their economic viability on less
fertile lands. Some of these marginal lands are unable to yield viable crop yields and, in that
sense, does not involve much sacrifice and opportunity cost. With the oil prices soaring in the
international market, this tree crop holds enormous opportunities for earning profits.

59
The scheme of model farmers is the most innovative scheme to bridge the extension gap
effectively. Even with some increase in the extension manpower, it is literally not possible to
reach all the farmers and transfer the technologies to them. Farmers also need someone
locally to whom they can look at as a friend and guide. These model farmers will have
opportunities to imbibe the latest technologies from the scientists and extension workers.
They can effectively transmit the information to other farmers. Since they are provided with
some honorarium to cover their expenses, they can serve as an effective link between
extension officers and farmers.
Drip irrigation is another innovative scheme to improve water use efficiency in a water
scarce environment. Its potential was not capitalized in the district. The present scheme of
using drip sets in the cultivation of vegetables and fruits are quite an innovative and
profitable investment. In rabi groundnut, there is a good scope for sprinkler irrigation to
obtain maximum returns per unit of water.
Scheme to expand area under banana is another innovative method of developing horticulture
in the district. Fruit crops have a good potential to perform well in Lohardaga district.
Supply of hybrid seeds of vegetables is another innovative scheme. The productivity of
vegetables can be increased easily by 20 to 50% by adopting hybrid varieties of vegetables.
The yields of vegetables are quite low in the district and with the new initiative; they are
likely to go up. It will improve the economic viability of vegetable cultivation in the district.
Induction of milch animals and heifer calves is quite an innovative scheme. It is being tried
on a substantive scale. The productivity of local milch animals is quite low and their response
to good feed and fodder management is not economical. By inducting milch animals with
higher potential, there is a scope to achieve a break-through in milk production in the district.
While the induction of milch animals will contribute to increase in milk production
immediately, the induction of heifer calves will ensure the increase in milk production in the
future. Better health care and insurance coverage will complete the package to increase
profits and to cover risks. Since the animals are being supplied on 50% subsidy tying them
up with bank loans for the remaining amount, insurance coverage is automatically there.

60
Provision of bulk milk cooling centers at five locations in the district is another innovative
scheme. The induction of milch animals is likely to create surpluses in milk production,
which need to be procured and stored under hygienic conditions. Availability of milk cooling
centers will reduce the chances of spoilage of milk and helps in processing it locally.
Establishing fish markets at important locations in the district and opening retail outlets will
help the fishermen and farmers to get better prices for their produce. Certainly, creation of
markets will increase the demand for fish and will reduce the losses and transaction costs.
Both the producers and consumers will benefit from this initiative.
Although, the support to sericulture is quite limited under RKVY, the catalytic development
scheme being implemented by the department is quite an innovative scheme. It is
contributing to the development of the sericulture both on the farm and non-farm sectors.
The program of Jalayagnam has raised the hopes of the farmers about agriculture. Expansion
of surface irrigation will contribute to the increase in ground water. It will help in the
conjunctive use of both surface and ground water. This program will make a substantial
difference to farming in the district.
Marketing is the essence of agriculture. Realization of a remunerative price and cutting down
the marketing costs are important to keep the interests of both the producers and consumers
safe from the exploitation by middlemen. Creation of more marketing infrastructure will cut
down the costs of transportation and the time needed for marketing. The massive program for
expansion of marketing infrastructure will help in farmers realizing better prices for their
produce.
Strengthening of rural credit will facilitate the adoption of new technologies. The recent loan
waiver has reduced the debt burden of the farmers. They can start from a clean slate and
obtain fresh loans both for crop production and development. This substantial expansion of
credit targets for the next five years will reduce the dependence of farmers on non-
institutional sources of credit at high and usurious rates of interest.

61
How farm productivity will increase further:
Identification of suitable crops according to the season and soil types
Follow deep summer ploughing at least once in three year s
As per the soil testing report fertilizer management can be adopted
Use healthy seeds of high yielding varieties (HYV) suitable to the area
Application of FYM/organic manures/tank silt etc. as per the availability regularly
As per the sowing window crops can be sown (time of sowing is very important)
Maintaining optimum plant stand (gap filling and thinning can be done within 10
days after emergence)
Integrated nutrient management (INM), integrated pest management (IPM) and
integrated weed management (IWM) practices can be adopted
Follow proper crop rotation regularly (avoid mono-cropping)
Keep weed free situation up to 1/ 3rd
of the crop life cycle
Need based plant protection measures can be adopted and avoid indiscriminate use of
agricultural chemicals for control of pest, disease and weeds
Supplemental irrigation can be provided during the critical crop growth periods
(water sensitive stages)
Provide proper drainage channels and avoid water log situations
Harvest and thresh the crop at right time
Construction of farm ponds and provide supplemental irrigations during critical crop
growth periods/during dry spell time
Watershed activities can be promoted for enhancing the cropping intensity so that
productivity can be improved
How it will lead to rural prosperity:
Rural prosperity can be improved by involving the agriculture and allied activities
like poultry, dairy, goatery, piggery and sericulture/apiculture simultaneously
(integrated farming system approach)

62
Rising of vegetable crops/floriculture/medicinal and aromatic plants
Encourage Orchard cultivation (mango/ sapota/ guava/ amla/ custard/ ber/tamarind/
moringa / curry leaf, etc.)
Agro-Forestry/Agro-Horti/Agro-Silvi/Agro-Pasture/Agro-Horti-Forestry cropping
systems can be encouraged for establishment of agro based industries and thereby
employment opportunities will also increase and it also avoid the rural people to
migrate urban areas.
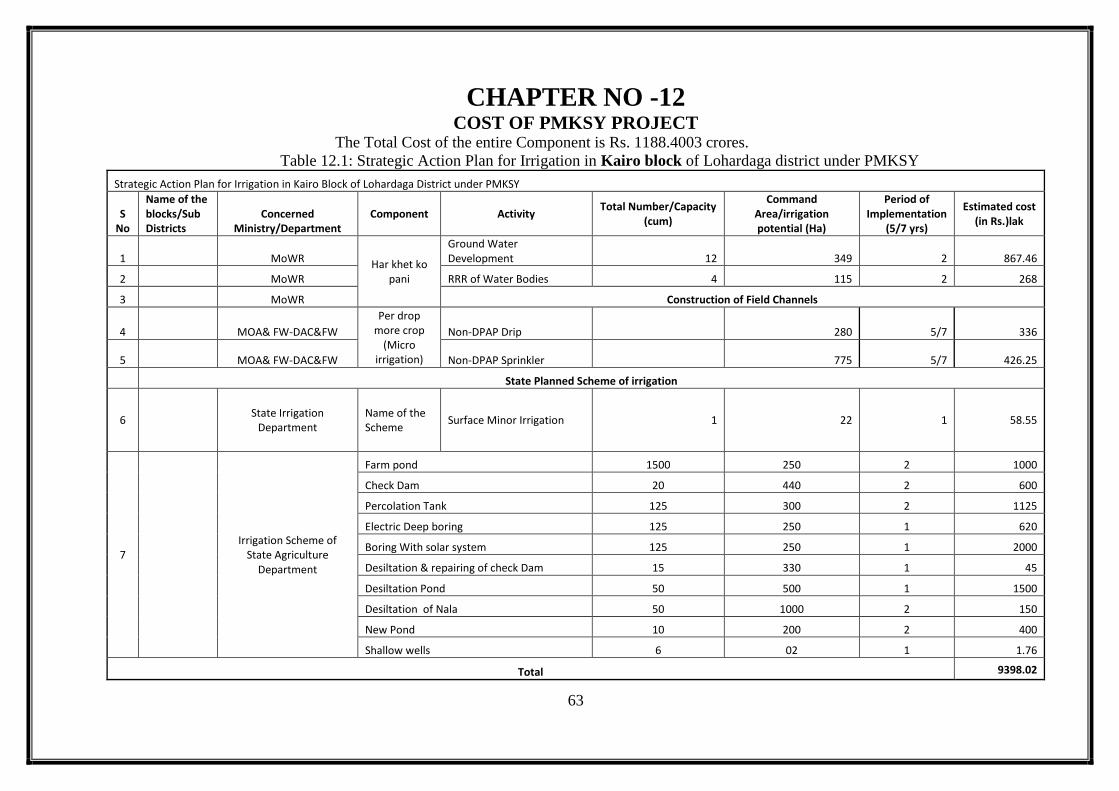
63
CHAPTER NO -12 COST OF PMKSY PROJECT
The Total Cost of the entire Component is Rs. 1188.4003 crores.
Table 12.1: Strategic Action Plan for Irrigation in Kairo block of Lohardaga district under PMKSY
Strategic Action Plan for Irrigation in Kairo Block of Lohardaga District under PMKSY
S No
Name of the blocks/Sub Districts
Concerned Ministry/Department
Component Activity Total Number/Capacity
(cum)
Command Area/irrigation potential (Ha)
Period of Implementation
(5/7 yrs)
Estimated cost (in Rs.)lak
1 MoWR Har khet ko pani
Ground Water Development 12 349 2 867.46
2 MoWR RRR of Water Bodies 4 115 2 268
3 MoWR Construction of Field Channels
4 MOA& FW-DAC&FW
Per drop more crop
(Micro irrigation)
Non-DPAP Drip 280 5/7 336
5 MOA& FW-DAC&FW Non-DPAP Sprinkler 775 5/7 426.25
State Planned Scheme of irrigation
6 State Irrigation
Department Name of the Scheme
Surface Minor Irrigation 1 22 1 58.55
7
Irrigation Scheme of State Agriculture
Department
Farm pond 1500 250 2 1000
Check Dam 20 440 2 600
Percolation Tank 125 300 2 1125
Electric Deep boring 125 250 1 620
Boring With solar system 125 250 1 2000
Desiltation & repairing of check Dam 15 330 1 45
Desiltation Pond 50 500 1 1500
Desiltation of Nala 50 1000 2 150
New Pond 10 200 2 400
Shallow wells 6 02 1 1.76
Total 9398.02

64
Table 12.2: Strategic Action Plan for Irrigation in Lohardaga block of Lohardaga district under PMKSY
Strategic Action plan for Irrigation in Lohardaga Block of Lohardaga District under PMKSY
S No
Name of the
blocks/Sub Districts
Concerned Ministry/Departmen
t
Component
Activity Total
Number/Capacity(cum)
Command Area/irrigatio
n potential (Ha)
Period of Implementation(5/
7 yrs)
Estimated cost (in
Rs.)lak
1 MoWR
Ground Water Development 6 328 2 580
2 MoWR RRR of Water Bodies 16 451 2 857
3 MoWR Construction of Field Channels
4 MOA& FW-DAC&FW Per drop more crop
(Micro Irrigation)
Non-DPAP Drip 480 5/7 576
5 MOA& FW-DAC&FW Non-DPAP Sprinkler 975 5/7 536.25
6 DoLR-MoRD
PMKSY Watershed
Newly created WHS
6.1 DoLR-MoRD Farm Ponds 92 460 4-5 year 469
6.2 DoLR-MoRD Check Dams 35 700 4-5 year 420
6.3 DoLR-MoRD Nallah Bunds 300 300 4-5 year 30
6.5 DoLR-MoRD Percolation Tanks 64 12.8 4-5 year 76.8
6.6 DoLR-MoRD CCT 20 2 4-5 year 5
6.7 DoLR-MoRD SCT 55 5.5 4-5 year 13.75
6.8 DoLR-MoRD Plantation 100 0 4-5 year 25
6.9 DoLR-MoRD Gavien Structure 20 2 4-5 year 70.8
6.1 DoLR-MoRD Loose Bolder Structure 1500 600 4-5 year 375
6.1 DoLR-MoRD Field bunding 485 97 4-5 year 155.2

65
1
6.12 DoLR-MoRD WAT 419 20.95 4-5 year 46.09
7 DoLR-MoRD Renovated WHS
7.1 DoLR-MoRD Farm Ponds 29 145 4-5 year 130.5
7.2 DoLR-MoRD Check Dams 15 300 4-5 year 67.5
7.3 DoLR-MoRD Nallah Bunds 69 69 4-5 year 3.45
7.4 DoLR-MoRD Percolation Tanks 28 5.6 4-5 year 21
7.5 DoLR-MoRD Other Ground Water Recharge Structure 300 300 4-5 year 45
8 State Planned Scheme of irrigation
9 State Irrigation
Department
Name of the Scheme Medium Irrigation 1 520 5 320
10
Irrigation Scheme of State Agriculture
Department
Farm pond 1000 166 2 660
Check Dam 10 220 2 300
Percolation Tank 75 180 2 675
Electric Deep boring 100 250 1 496
Boring With solar system 100 250 1 1600
Desiltation & repairing of check Dam 10 330 1 30
Desiltation Pond 50 500 1 1500
Desiltation of Nala 50 1000 2 150
New Pond 10 200 2 400
Total 13418.94

66
Table 12.3: Strategic Action Plan for Irrigation in Senha block of Lohardaga district under PMKSY
Strategic Action plan for Irrigation in Senha Block of Lohardaga District under PMKSY
S No
Name of the
blocks/Sub Districts
Coccerned Ministry/Departmen
t
Component
Activity Total
Number/Capacity(cum)
Command Area/irrigatio
n potential (Ha)
Period of Implementation(5/
7 yrs)
Estimated cost (in
Rs.)
1
MoWR Har khet ko
pani Lift Irrigation
2 MoWR Ground Water Development 7 1258 3 2619.63
3 MoWR
RRR of Water Bodies 13 467 2 740
4 MOA& FW-DAC&FW Per drop more crop
(Micro Irrigation)
Non-DPAP Drip 530 5/7 636
5 MOA& FW-DAC&FW Non-DPAP Sprinkler 1075 5/7 591.25
6 State Planned Scheme of irrigation
6.1
State Irrigation Department
Name of the Scheme Major Irrigation 1 2000 4 1000
6.2
State Irrigation Department
Name of the Scheme Surface Minor Irrigation 5 337 1 844.89

67
Name of the Scheme
7
Irrigation Scheme of State Agriculture
Department
Farm pond 1500 250 ha 2 1000
Check Dam 20 440 ha 2 600
Percolation Tank 125 300 ha 2 1125
Electric Deep boring 125 250 ha 1 600
Boring With solar system 125 250 ha 1 2000
Desiltation & repairing of check Dam 15 330 ha 1 600
Desiltation Pond 50 500 ha 1 1500
Desiltation of Nala 50 1000 ha 2 600
New Pond 10 200 2 400
Total 14856.77

68
Table 12.4: Strategic Action Plan for Irrigation in Bhandra block of Lohardaga district under PMKSY
Strategic Action plan for Irrigation in Bhandra Block of Lohardaga District under PMKSY
S No
Name of the
blocks/Sub Districts
Coccerned Ministry/Departmen
t
Component
Activity Total
Number/Capacity(cum)
Command Area/irrigatio
n potential (Ha)
Period of Implementation(5/
7 yrs)
Estimated cost (in
Rs.)
1 MoWR Har khet ko
pani
Ground Water Development 8 207 2 602.13
2 MoWR RRR of Water Bodies 11 332 2 645
3 MOA& FW-DAC&FW Per drop
more crop (Micro
Irrigation)
Non-DPAP Drip 510 5/7 612
4 MOA& FW-DAC&FW Non-DPAP Sprinkler 1045 5/7 574.75
5 DoLR-MoRD
PMKSY Watershed
Newly created WHS
5.1 DoLR-MoRD Farm Ponds 27 135 4-5 year 137
5.2 DoLR-MoRD Check Dams 6 120 4-5 year 72
5.3 DoLR-MoRD Nallah Bunds 120 120 4-5 year 12
5.4 DoLR-MoRD Percolation Tanks 64 12.8 4-5 year 76.8
5.5 DoLR-MoRD CCT 120 12 4-5 year 30
5.6 SCT 72 7.2 4-5 year 18
5.7 Plantation 150 0 4-5 year 37.5
5.8 Gabion Structure 20 2 4-5 year 70.8

69
5.9 Gully Pluging 1204 0 4-5 year 2648
5.1 Loose Bolder Structure 98 39.2 4-5 year 24.5
5.10 Field bunding 289 57.8 4-5 year 92.48
5.11 WAT 247 12.35 4-5 year 27.17
5.12 DoLR-MoRD
Fishery ponds/cattle pond
6 DoLR-MoRD Renovated WHS
6.1 DoLR-MoRD Farm Ponds 5 25 4-5 year 22.5
6.2 DoLR-MoRD Check Dams 5 100 4-5 year 22.5
6.3 DoLR-MoRD Nallah Bunds 5 5 4-5 year 0.25
6.4 DoLR-MoRD Percolation Tanks 6 1.2 4-5 year 4.5
6.5 DoLR-MoRD Other Ground Water Recharge Structure 3 3 4-5 year 0.45
6.6 DoLR-MoRD Fishery ponds/Cattle pond 5 0 4-5 year 22.7
Conversion with
MANREGA
3105.6
7 State Planned Scheme of irrigation
8 State Irrigation
Department
Name of the Scheme
Surface Minor Irrigation 5 479 1 598.94
9
Irrigation Scheme of State Agriculture
Department
Name of the
Scheme
Farm pond 1500 250 ha 2 1000
Check Dam 20 440 ha 2 600
Percolation Tank 125 300 ha 2 1125
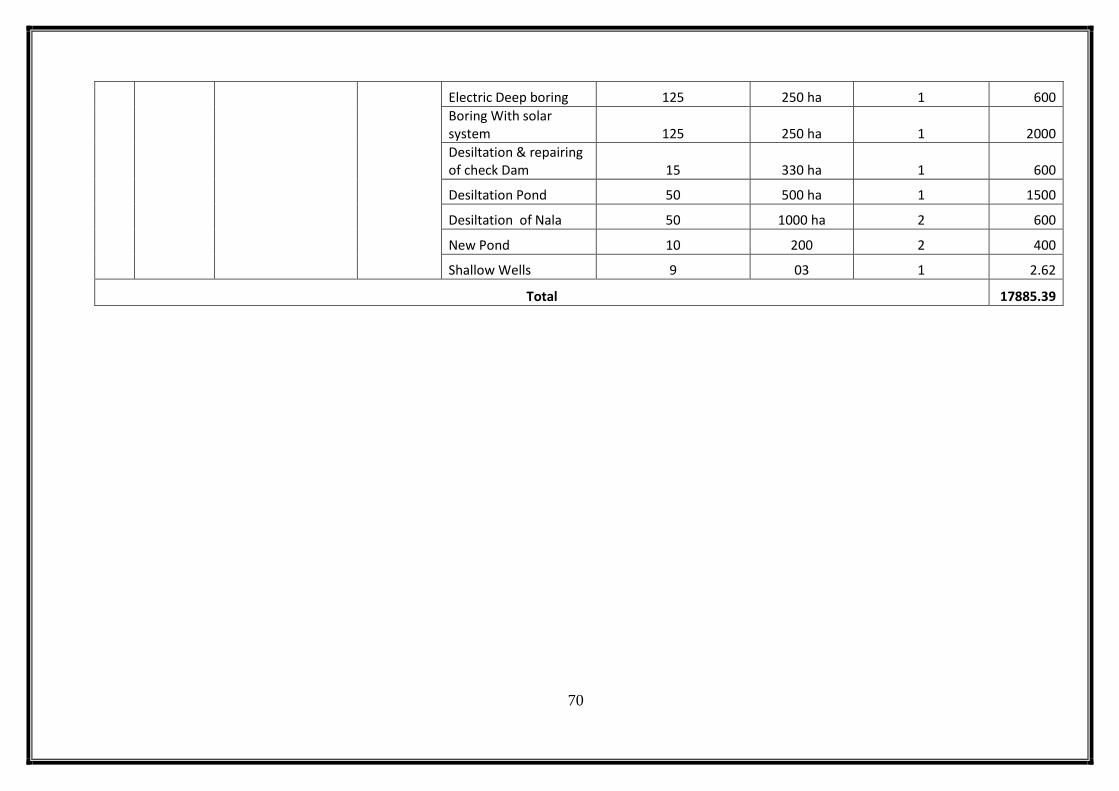
70
Electric Deep boring 125 250 ha 1 600
Boring With solar system 125 250 ha 1 2000
Desiltation & repairing of check Dam 15 330 ha 1 600
Desiltation Pond 50 500 ha 1 1500
Desiltation of Nala 50 1000 ha 2 600
New Pond 10 200 2 400
Shallow Wells 9 03 1 2.62
Total 17885.39
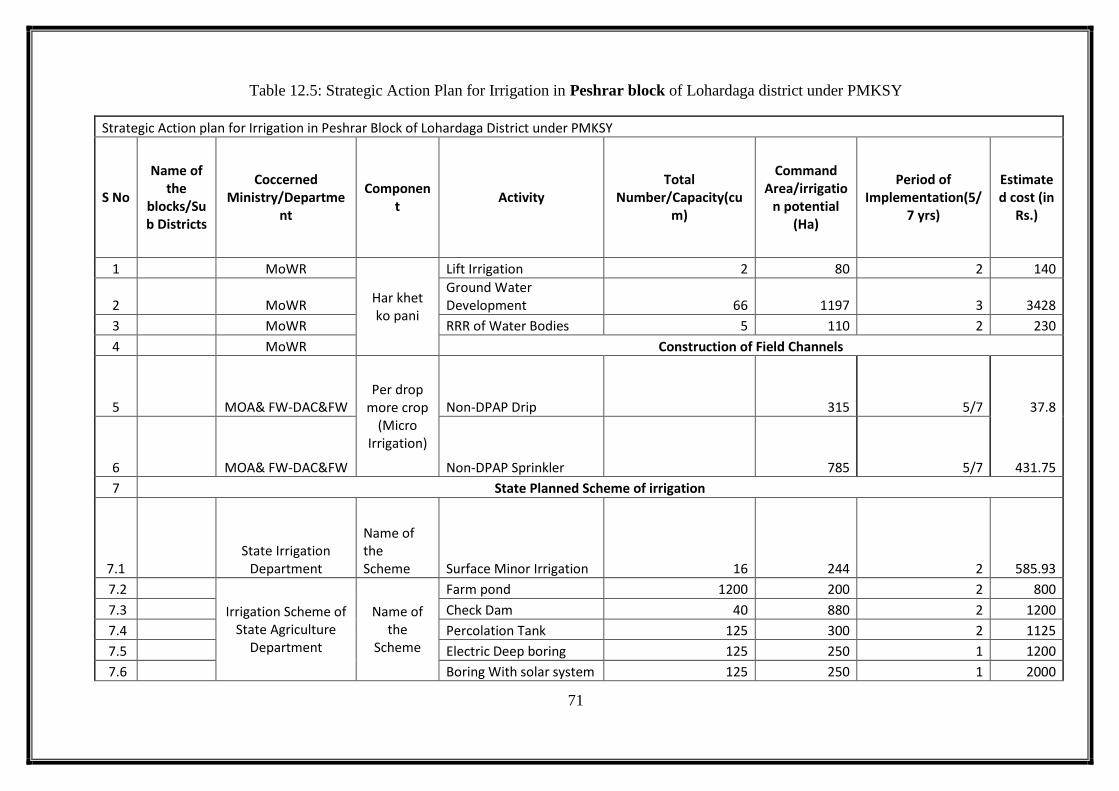
71
Table 12.5: Strategic Action Plan for Irrigation in Peshrar block of Lohardaga district under PMKSY
Strategic Action plan for Irrigation in Peshrar Block of Lohardaga District under PMKSY
S No
Name of the
blocks/Sub Districts
Coccerned Ministry/Departme
nt
Component
Activity Total
Number/Capacity(cum)
Command Area/irrigatio
n potential (Ha)
Period of Implementation(5/
7 yrs)
Estimated cost (in
Rs.)
1 MoWR
Har khet ko pani
Lift Irrigation 2 80 2 140
2 MoWR Ground Water Development 66 1197 3 3428
3 MoWR RRR of Water Bodies 5 110 2 230
4 MoWR Construction of Field Channels
5 MOA& FW-DAC&FW Per drop
more crop (Micro
Irrigation)
Non-DPAP Drip 315 5/7 37.8
6 MOA& FW-DAC&FW Non-DPAP Sprinkler 785 5/7 431.75
7 State Planned Scheme of irrigation
7.1 State Irrigation
Department
Name of the Scheme Surface Minor Irrigation 16 244 2 585.93
7.2
Irrigation Scheme of State Agriculture
Department
Name of the
Scheme
Farm pond 1200 200 2 800
7.3 Check Dam 40 880 2 1200
7.4 Percolation Tank 125 300 2 1125
7.5 Electric Deep boring 125 250 1 1200
7.6 Boring With solar system 125 250 1 2000

72
7.7 Desiltation & repairing of check Dam 20 440 1 1200
7.8 Desiltation Pond 50 500 1 1500
7.9 Desiltation of Nala 50 1000 2 1200
7.10 New Pond 10 200 2 400
Total 15478.48

73
Table 12.6: Strategic Action Plan for Irrigation in Kuru block of Lohardaga district under PMKSY
Strategic Action plan for Irrigation in Kuru block of Lohardaga District under PMKSY
S No
Name of the
blocks/Sub Districts
Concerned Ministry/Departmen
t
Component
Activity Total
Number/Capacity(cum)
Command Area/irrigatio
n potential (Ha)
Period of Implementation(5/
7 yrs)
Estimated cost (in
Rs.)
1 MoWR Har khet ko
pani
Ground Water Development 14 1117 3 2690
2 MoWR RRR of Water Bodies 25 649 3 995
3 MOA& FW-DAC&FW Per drop
more crop (Micro
Irrigation)
Non-DPAP Drip 795 5/7 657.25
4 MOA& FW-DAC&FW Non-DPAP Sprinkler 1195 5/7 657.25
5 DoLR-MoRD
PMKSY Watershed
Newly created WHS
5.1 DoLR-MoRD Farm Ponds 26 62 4-5 year 132
5.2 DoLR-MoRD Check Dams 6 120 4-5 year 72
5.3 DoLR-MoRD Nallah Bunds 120 120 4-5 year 12
5.4 DoLR-MoRD Percolation Tanks 64 12.8 4-5 year 76.8
5.5 DoLR-MoRD CCT 120 12 4-5 year 30
5.6 DoLR-MoRD SCT 50 5 4-5 year 12.5
5.7 DoLR-MoRD Plantation 200 0 4-5 year 50
5.8 DoLR-MoRD Gavien Structure 40 4 4-5 year 141.6
5.9 DoLR-MoRD Other Ground Water Recharge Structure 21 21 4-5 year 6.09
5.10 DoLR-MoRD
Fishery ponds/Cattle pond 1204 0 4-5 year 264.8
5.11 DoLR-MoRD Loose Bolder Structure 98 39.2 4-5 year 24.5

74
5.12 DoLR-MoRD Field bunding 289 57.8 4-5 year 92.48
6 DoLR-MoRD WAT 247 12 4-5 year 27.17
6.1 DoLR-MoRD Renovated WHS
6.2 DoLR-MoRD Farm Ponds 5 25 4-5 year 22.5
6.3 DoLR-MoRD Check Dams 5 100 4-5 year 22.5
6.4 DoLR-MoRD Nallah Bunds 5 5 4-5 year 0.25
6.5 DoLR-MoRD Percolation Tanks 6 1.2 4-5 year 4.5
6.6 DoLR-MoRD Other Ground Water Recharge Structure 3 3 4-5 year 0.45
7 Fishery ponds/Cattle pond 5 0 4-5 year 22.7
Conversion with
MANREGA
429.93
State Planned Scheme of irrigation
7.1
Irrigation Scheme of State Agriculture
Department
Name of the Scheme
Farm pond 1500 250 2 1000
Check Dam 20 440 2 600
Percolation Tank 125 300 2 1125
Electric Deep boring 125 250 1 620
Boring With solar system 125 250 1 2000
Desiltation & repairing of check Dam 15 330 1 45
Desiltation Pond 50 500 1 1500
Desiltation of Nala 50 1000 2 150
New Pond 10 200 2 400
Total 13986.71

75
Table 12.7: Strategic Action Plan for Irrigation in Kisko block of Lohardaga district under PMKSY
Strategic Action plan for Irrigation in Kisko Block of Lohardaga District under PMKSY
S No Name of the blocks/Sub
Districts
Coccerned Ministry/Department
Component Activity Total
Number/Capacity(cum)
Command Area/irrigation potential (Ha)
Period of Implementation(5/7
yrs)
Estimated cost (in Rs.)
1 MoWR Har khet ko
pani
Ground Water Development 5 680 3 1011.76
2 MoWR RRR of Water Bodies 10 390 2 490
3 MOA& FW-DAC&FW Per drop
more crop (Micro
Irrigation)
Non-DPAP Drip 510 5/7 612
4 MOA& FW-DAC&FW Non-DPAP Sprinkler 1060 5/7 583
5 DoLR-MoRD
PMKSY Watershed
Newly created WHS
5.1 DoLR-MoRD Farm Ponds 37 185 4-5 year 188
5.2 DoLR-MoRD Check Dams 21 540 4-5 year 252
5.3 DoLR-MoRD Nallah Bunds 60 60 4-5 year 6
5.4 DoLR-MoRD Percolation Tanks 64 12.8 4-5 year 76.8
5.5 DoLR-MoRD CCT 80 8 4-5 year 20
5.6 DoLR-MoRD SCT 50 5 4-5 year 12.5
5.7 DoLR-MoRD Plantation 105 0 4-5 year 26.25
5.8 DoLR-MoRD Gavien Structure 10 1 4-5 year 35.4
5.9 DoLR-MoRD Gully Pluging 3000 0 4-5 year 660
5.10 DoLR-MoRD Loose Bolder Structure 2500 1000 4-5 year 625
5.11 DoLR-MoRD Field bunding 512 102.4 4-5 year 163.84
5.12 DoLR-MoRD Gravity Irrigation System 1 20 4-5 year 55
5.13 DoLR-MoRD WAT 62 5.05 4-5 year 6.82
6 DoLR-MoRD Renovated WHS

76
6.1 DoLR-MoRD Farm Ponds 37 185 4-5 year 166.5
6.2 DoLR-MoRD Check Dams 6 120 4-5 year 27
6.3 DoLR-MoRD Nallah Bunds 7 7 4-5 year 0.35
6.4 DoLR-MoRD Percolation Tanks 5 1 4-5 year 3.75
6.5 DoLR-MoRD Other Ground Water Recharge Structure 4 4 4-5 year 0.6
6.6 DoLR-MoRD Fishery ponds/Cattle pond 2 0 4-5 year 39.08
Conversion with
MANREGA
1229.49
7 State Planned Scheme of irrigation
7.1 State Irrigation
Department Name of the Scheme
Major Irrogation 2 2450 7 12500
7.2
State Irrigation
Department Name of the Scheme
Surface Minor Irrigation
1 55 1 132.32
7.3
Irrigation Scheme of State Agriculture
Department
Name of the Scheme
Farm pond 1200 200 2 800
7.4 Check Dam 20 440 2 600
7.5 Percolation Tank 125 300 2 1125
7.6 Electric Deep boring 125 250 1 620
7.7 Boring With solar system 125 250 1 2000
7.8
Desiltation & repairing of check Dam 15 330 1 45
7.9 Desiltation Pond 50 500 1 1500
7.10 Desiltation of Nala 50 1000 2 150
7.11 New Pond 10 200 2 400
Total 26163.45

77
Table 12.7: Strategic Action plan for Lohardaga District under PMKSY
S No
Name of the
blocks/Sub Districts
Concerned Ministry/Department Component Activity
Total Number/Capacity(cum)
Command Area/irrigation potential (Ha)
Period of Implementation(5/7
yrs) Estimated cost
(in Rs.lakh)
1
MoWR AIBP
0 0 0 0.00
2 MoWR
Har khet ko pani
Lift Irrigation 2 80 2 140.00
3 MoWR Ground Water Development 118 5136
3 11798.98
4 MoWR RRR of Water Bodies 84 2514 3 4225
5 MOA & FW-DAC & FW Per drop more crop
(Micro Irrigation)
Non-DPAP Drip 3420 5-7 Year 3467.05
6 MOA & FW-DAC & FW Non-DPAP Sprinkler 6910 5-7 Year
3800.5
7 DoLR-MoRD
PMKSY Watershed
Newly created WHS
7.1 DoLR-MoRD Farm Ponds 339 1578.62 4-5 year 1728.9
7.2 DoLR-MoRD Check Dams 132 2640 4-5 year 1584
7.3 DoLR-MoRD Nallah Bunds 600 600 4-5 year 60
7.4 DoLR-MoRD Percolation Tanks 692 138.4 4-5 year 830.4
7.5 DoLR-MoRD Percolation Tanks 64 12.8 4-5 year 76.8
7.6 DoLR-MoRD CCT 340 34 4-5 year 85
7.7 DoLR-MoRD SCT 227 22.7 4-5 year 56.75
7.8 DoLR-MoRD Plantation 555 0 4-5 year 138.75
7.9 DoLR-MoRD Gavien Structure 90 9 4-5 year 318.6
7.10 Gully Pluging 10142 0 4-5 year 7321.82
7.11 Other Ground Water Recharge Structure 21 21
4-5 year 6.09
7.12 DoLR-MoRD Loose Bolder Structure 4196 1678.4 4-5 year 1049
7.13 DoLR-MoRD Field bunding 1575 315 4-5 year 504
7.14 Gravity Irrigation System 1 20 4-5 year 55
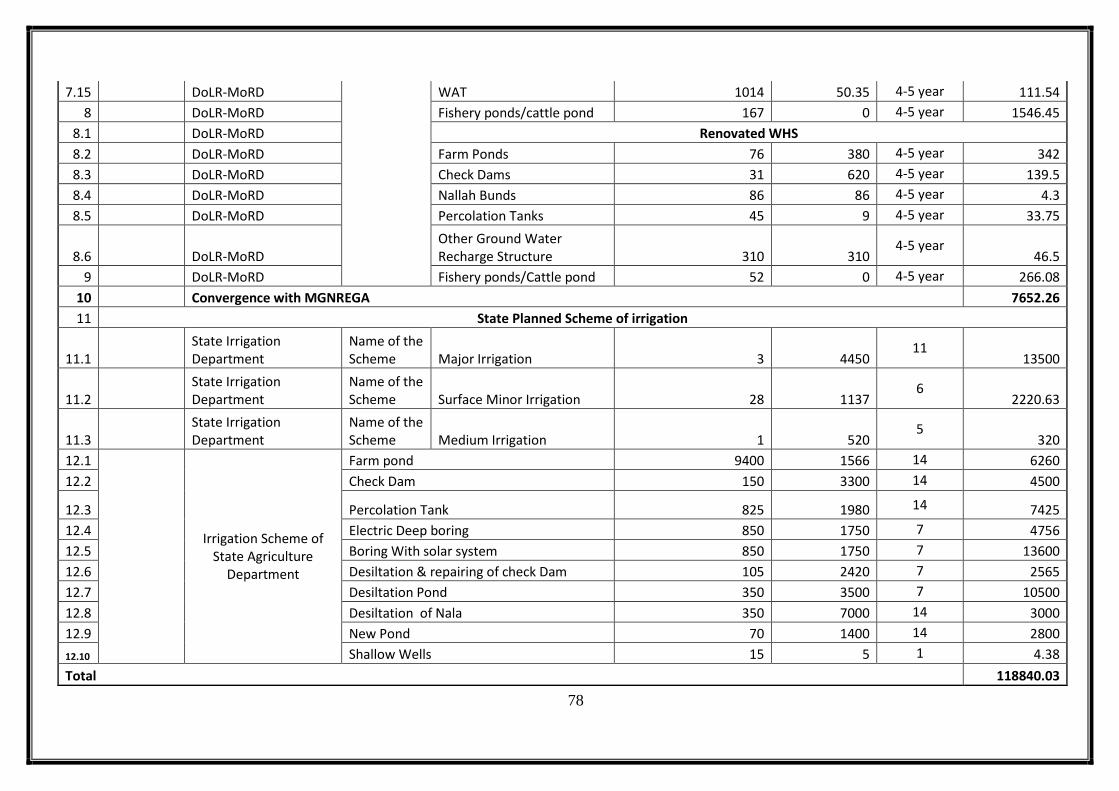
78
7.15 DoLR-MoRD WAT 1014 50.35 4-5 year 111.54
8 DoLR-MoRD Fishery ponds/cattle pond 167 0 4-5 year 1546.45
8.1 DoLR-MoRD Renovated WHS
8.2 DoLR-MoRD Farm Ponds 76 380 4-5 year 342
8.3 DoLR-MoRD Check Dams 31 620 4-5 year 139.5
8.4 DoLR-MoRD Nallah Bunds 86 86 4-5 year 4.3
8.5 DoLR-MoRD Percolation Tanks 45 9 4-5 year 33.75
8.6 DoLR-MoRD Other Ground Water Recharge Structure 310 310
4-5 year 46.5
9 DoLR-MoRD Fishery ponds/Cattle pond 52 0 4-5 year 266.08
10
Convergence with MGNREGA 7652.26
11 State Planned Scheme of irrigation
11.1 State Irrigation Department
Name of the Scheme Major Irrigation 3 4450
11 13500
11.2 State Irrigation Department
Name of the Scheme Surface Minor Irrigation 28 1137
6 2220.63
11.3 State Irrigation Department
Name of the Scheme Medium Irrigation 1 520
5 320
12.1
Irrigation Scheme of State Agriculture
Department
Farm pond 9400 1566 14 6260
12.2 Check Dam 150 3300 14 4500
12.3 Percolation Tank 825 1980 14 7425
12.4 Electric Deep boring 850 1750 7 4756
12.5 Boring With solar system 850 1750 7 13600
12.6 Desiltation & repairing of check Dam 105 2420 7 2565
12.7 Desiltation Pond 350 3500 7 10500
12.8 Desiltation of Nala 350 7000 14 3000
12.9 New Pond 70 1400 14 2800
12.10 Shallow Wells 15 5 1 4.38
Total 118840.03

79
CHAPTER NO -13
PROBABLE BENEFITS OF THE PLAN
Following benefits are intended from the proposed DIP (Lohardaga):
1. The total cropped area of Lohardaga district is 55070 ha. Though, this whole area was
under agriculture most of the 95% area was utilized for Kharif crops.
2. Through PMKSY, we are envisaging to increase irrigation potential in the district.
The model irrigation plan envisages educating the farmers to adhere to the scientific
practices in the command area. This will increase the crop production per unit area of
agriculture land and ensure the recycling of ground water in a balanced manner.
3. Under Har Kheth ko Paani, Minor and Lift irrigation projects proposed shall enable to
provide irrigation access to some of the remote tribal blocks in the district favoring
second cropping during the Rabi season. As such majority of the tribal agriculture in
Adilabad is rainfed and the aforementioned minor irrigation projects will facilitate
better availability of water.
4. A lot of Water Harvesting and conservation structures, like Farm Ponds, Check
Dams, Percolation Tanks, Nalah bunds are proposed which shall enhance the Net
Irrigated Area. This shall be undertaken in convergence with MGNREGS and
Integrated Watershed Management Program.
5. On the other hand, there is depletion of ground water levels in Lohardaga district.
Hence the plan has proposed for many ground water table recharge structures. This
shall favor micro irrigation activities in the region mainly drip and sprinkler
irrigation. This will also spur a change in cropping patterns and farmers will show
interests towards vegetable and other horticultural crops. This can be boost
commercial precision agriculture fostering local economy. There is high potential for
micro irrigation in Lohardaga and the plan has proposed for maximum utilization of
the same. Nearly 15% of the total cropped area can be brought under micro-irrigation
system.
6. Target of “More Crop per Drop” will be achieved.
7. New Structures shall provide more surface water opportunities and shall act as
support for the live stock. This is one of the major water needs that go unnoticed. The
plan has proposed for cattle troughs and village ponds that favor cattle and other
livestock.
8. Increased Water Availability shall spur many Agro-based industries in the region
providing employment generation.

80
CHAPTER NO -14
Conclusion
1. The holistic irrigation plan was prepared at Block level & District level
2. PMKSY DIP will fulfill the resource gap in the irrigation chain.
3. Irrigation to every farm will be achieved through completion of major, medium &
surface minor projects proposed.
4. Under Per Drop More crop, we will achieve enhance cropping & productivity which
leads to rural prosperity.
5. Total gross potential area of Lohardaga for agriculture is 105,244 ha.
6. Irrigated area of Lohardaga is 7752 ha. Hence 97,492 ha has to be irrigated.
7. This action plan proposes for better water use efficiency & management along with
best distribution of water sources.
Recommendation
Lohardaga district has high availability of water both through rainfall and rivers, streams
intersecting the mainland. However much of the potential has not been capitalized till date.
Pradhan Mantri Krishi Sinchayee Yojana is a boon at this important juncture of Lohardaga.
The district has to undergo a transformational phase of development mainly in irrigation as
agriculture is the spine of the Lohardaga’s economy. Access to irrigation to small and
marginal farmers who comprise nearly 70 % of total farmers, alone shall bring a synergy in
rural economy and it is high time the water potential of Lohardaga is utilized to its fullest.

81
CHAPTER NO -15
Bibliography
1. www.PMKSY.gov.in
2. www.Bhuvan.nrsc.gov.in
3. www.indiawether.gov.in
4. www.cgwb.gov.in
5. www.cwc.gov.in
6. Census department of Lohardaga
7. Irrigation department Lohardaga
8. Ground water department Lohardaga
9. District watershed development
10. Censes report Lohardaga
11. Jharkhand State Remote Sensing Agency
12. District Agriculture Department, Lohardaga
13. District Horticulture Department, Lohardaga
14. District Rural Development Department
15. Indian Council of Agricultural Research
16. Krishi Vigyan Kendra, Lohardaga
17. Birsa Agricultural University, Ranchi

82
LOHARDAGA DISTRICT MAPS
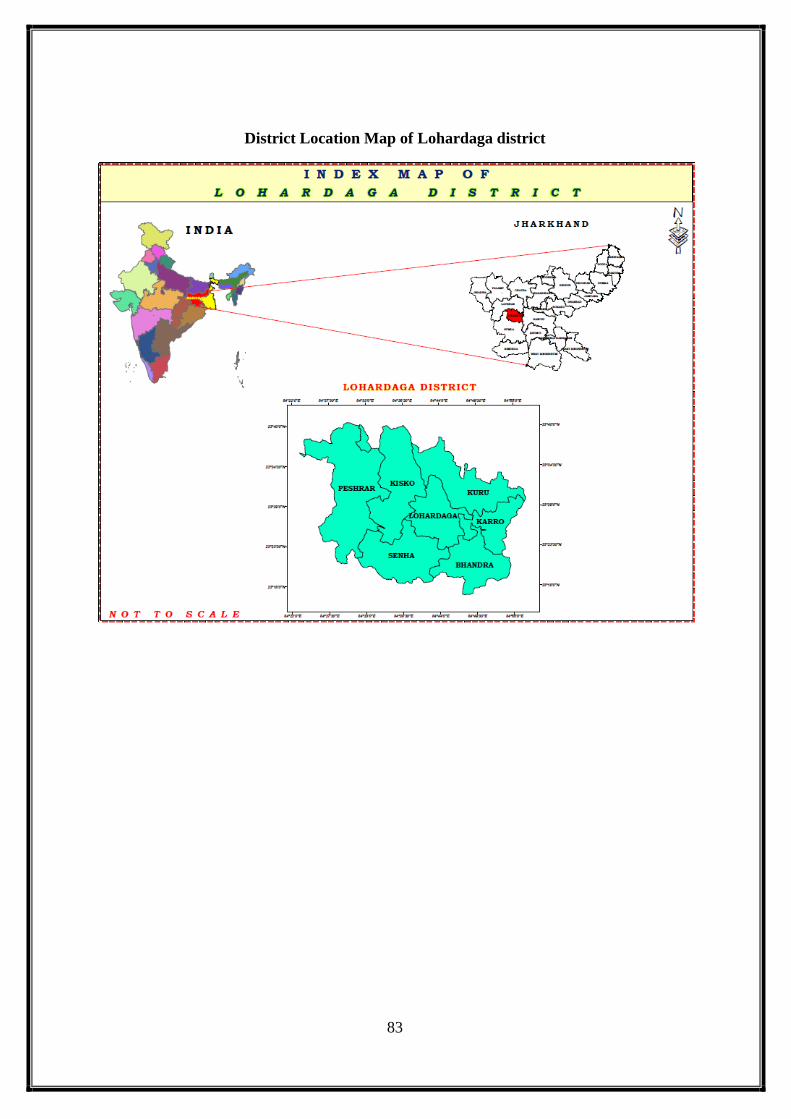
83
District Location Map of Lohardaga district

84
Land use / Land cover map of Lohardaga District

85
Geo-morphology Map of Lohardaga District

86
Digital Elevation Model of Lohardaga District

87
Contour Map of Lohardaga District

88
Geology Map of Lohardaga District

89
Forest Map of Lohardaga District
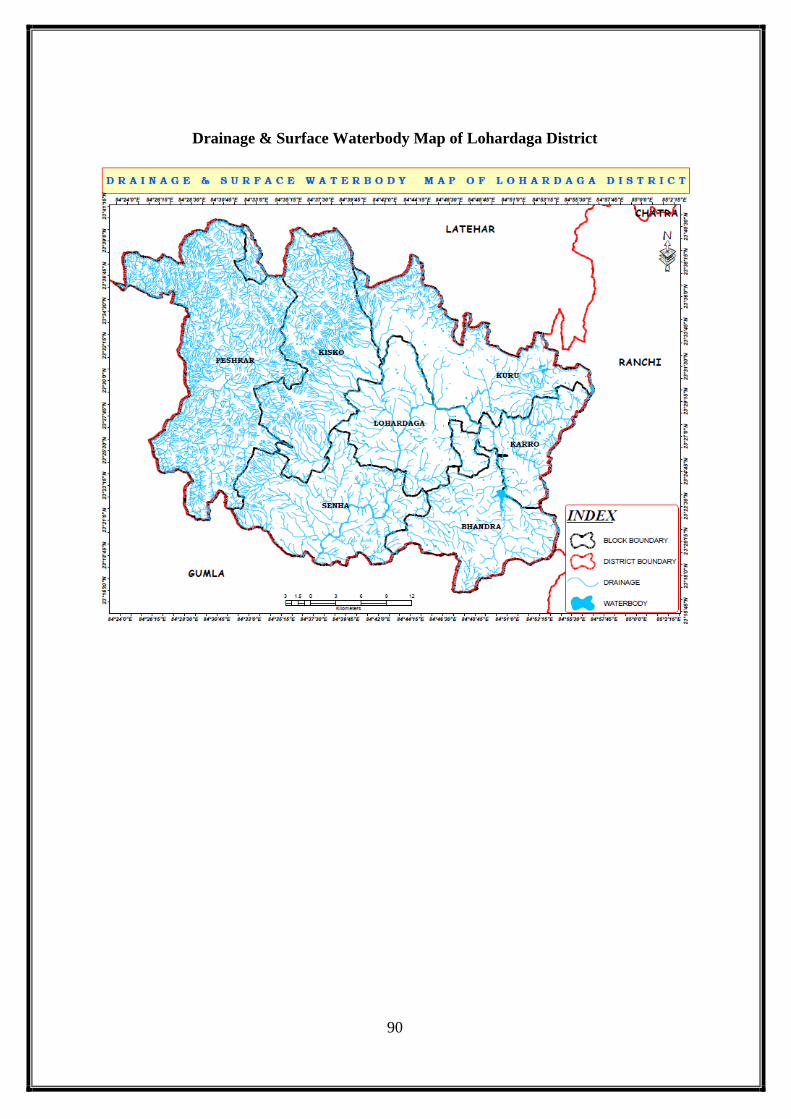
90
Drainage & Surface Waterbody Map of Lohardaga District

91
Ground Water Potential Map of Lohardaga District
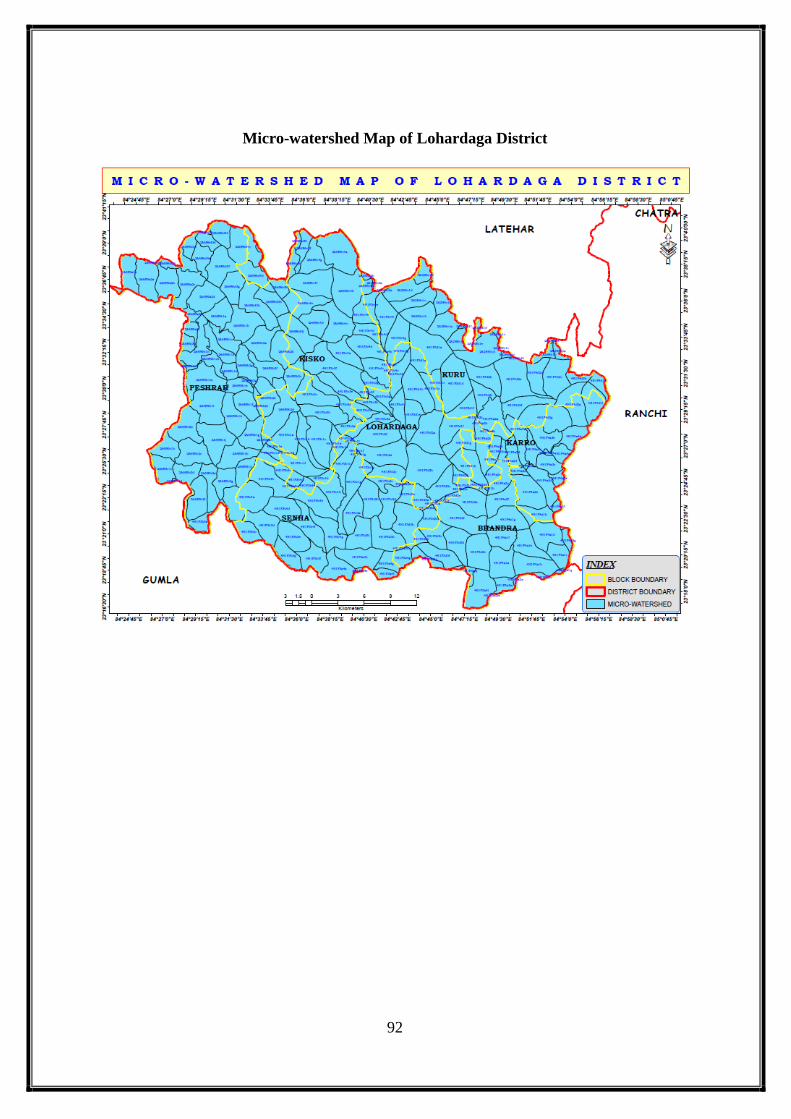
92
Micro-watershed Map of Lohardaga District

93
Watershed Map of Lohardaga District
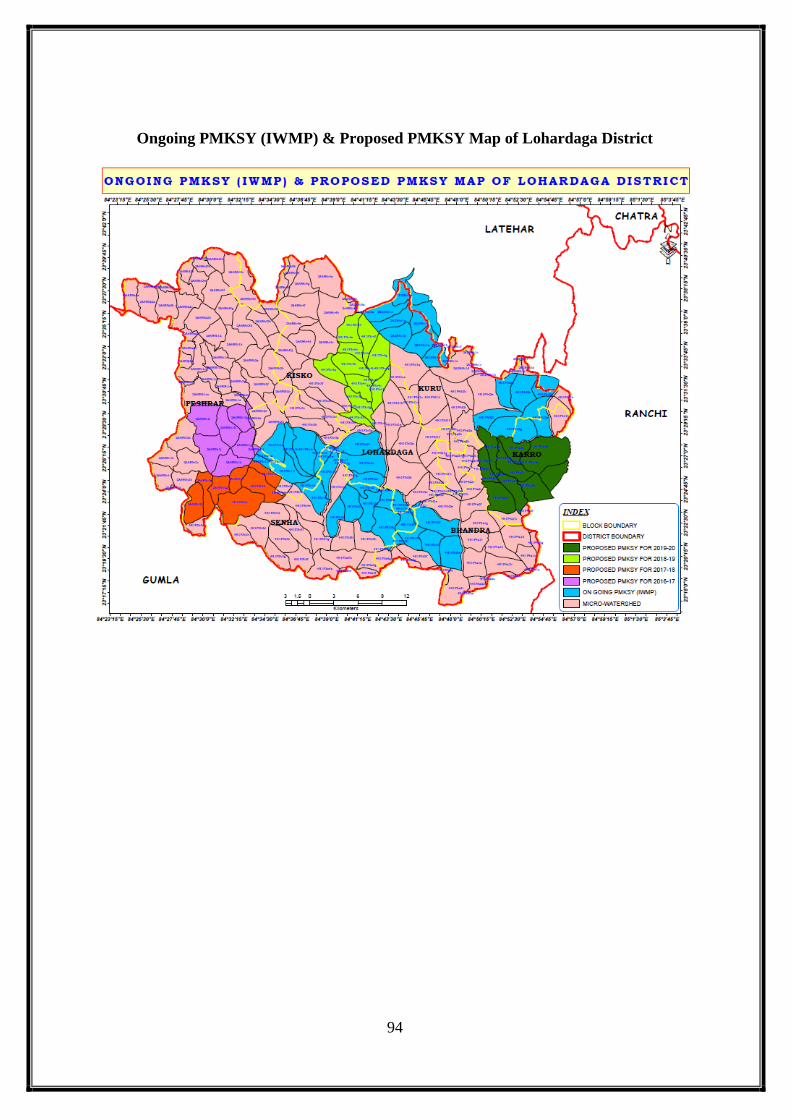
94
Ongoing PMKSY (IWMP) & Proposed PMKSY Map of Lohardaga District

95
Satellite (LISS – III) View of Lohardaga District

96
Soil Reaction (pH) of Lohardaga District

97
Organic Carbon of Lohardaga District

98
BLOCK WISE TABLES

99
Table.1.1 District Profile – Lohardaga district
1.1.1 District profile
S. No. Name of the District District code Latitude longitude
1 Lohardaga 11 23.30' N to 23.40' N 84.40' E to 84.50' E

100
Table.1.2.1 Demography – Lohardaga Block
1:2 Demography
Name of the State:- Jharkhand
Name of the District:- Lohardaga
Name of the Block:Lohardaga
Name of the Gram Panchayat
Name of the Villages covered
Code of Villages covered
Population SC ST General Total
M F CH*
Total
No of household
No of Members
No of household
No of Members
No of household
No of Members
No of household
No of Members
Bagha Bagha 363104 925 100
3
298 1928 - - 328 1784 28 144 356 1928
Bansari 363107 524 521 180 1045 - - 129 789 34 256 163 1045
Nadi Nagra 363106 549 516 155 1065 - - 154 943 13 122 167 1065
Anne 363105 511 532 152 1043 - - 166 833 24 210 190 1043
Bhatkhijri Bhatkhijri 363089 767 783 253 1550 - - 219 1096 67 454 286 1550
Mundo 363088 515 513 160 1028 - - 141 564 75 464 216 1028
Bakarni 363108 333 320 102 653 - - 121 609 12 44 133 653
Irgaon 363109 554 514 199 1068 - - 186 1055 3 13 189 1068
Tigra Tigra 363084 122
4
123
4
422 2458 - - 202 1012 269 1446 471 2458
Ita 363085 726 722 226 1448 - - 232 976 72 472 304 1448
Bhujania 363087 105
8
107
1
355 2129 18 95 260 1308 112 726 390 2129
Bejwali 363086 291 290 82 581 - - 104 572 2 9 106 581

101
Jori Jori 363075 112
0
107
7
394 2197 30 159 205 1037 153 1001 388 2197
Saheda 363076 485 498 190 983 4 20 135 879 16 84 155 983
Kutmu 363078 104
1
102
2
327 2063 5 27 321 1634 80 402 406 2063
Oaina 363077 856 847 278 1703 - - 199 998 117 705 316 1703
Hesal Hesal 363099 113
6
114
5
405 2281 16 85 336 1635 110 561 462 2281
Kurse 363097 922 848 308 1770 - - 167 671 191 1099 358 1770
Kujra 363096 838 744 278 1582 - - 140 701 167 881 307 1582
Kuji 363098 450 480 138 930 - - 139 695 46 235 185 930
Manho Manho 363094 108
9
107
8
334 2167 55 285 245 1246 90 636 390 2167
Kaimo 363095 935 908 342 1843 1 6 280 1400 102 437 383 1843
Banjar
Kisko
363074 556 561 191 1117 1 1 160 816 54 300 215 1117
Baxi 363072 283 304 125 587 - - 93 587 - - 93 587
Budgawa 363073 172 180 60 352 - - 66 292 12 60 78 352
Nigni Nigni 363080 201
9
192
9
581 3948 79 396 256 1283 473 2269 808 3948
Brahmandih
a
363079 822 727 258 1549 8 43 255 1289 43 217 306 1549
Harmu Harmu 363082 133
3
125
5
402 2588 1 4 483 2394 38 190 522 2588
Nadia 363081 133
0
137
6
431 2706 6 37 403 2046 124 623 533 2706
Juria Juria 363083 264
3
275
5
913 5398 6 29 694 3751 322 1618 1022 5398
Arkosa Arkosa 363091 130
0
134
8
480 2648 1 6 324 1705 185 937 510 2648
Bhaxo 363092 102
5
100
8
330 2033 17 89 366 1926 3 18 386 2033
Rampur Rampur 363090 170
5
163
4
545 3339 10 58 210 1056 487 2225 707 3339
Khakparta 363093 776 815 239 1591 2 9 260 1323 103 259 327 1591

102
Hirhi Hirhi 363101 152
2
149
6
523 3018 - - 396 1981 127 1037 523 3018
Brantpur 363103 303 292 89 595 - - 125 588 1 7 126 595
Hendlaso 363100 157
5
148
7
502 3062 80 415 239 1251 250 1396 569 3062
Budbrantpur 363102 271 281 87 552 - - 93 552 - - 93 552

103
Table.1.2.2 Demography – Bhandra Block
1:2 Demography
Name of the State:- Jharkhand
Name of the District:- Lohardaga
Name of the Block: Bhandra
Name of the Gram Panchayat
Name of the Villages covered
Code of Villages covered
Population SC ST General Total
M F CH*
Total
No of household
No of Members
No of household
No of Members
No of household
No of Members
No of household
No of Members
Bhandra Bhandra 363177 175
5
179
0
608 3545 21 112 250 1252 383 2181 654 3545
Kaspur 363175 774 761 215 1535 10 51 247 1305 35 179 292 1535
Nawdiha 363176 173 212 80 385 - - 71 371 3 14 74 385
Pajhri 363189 273 235 94 508 - - 70 421 17 87 87 508
Wakil
Ambwa
363190 88 80 23 168 - - 31 157 2 11 33 168
Udrangi Udrangi 363168 113
3
111
3
405 2246 - - 208 1041 221 1205 429 2246
Ambera 363170 758 729 260 1487 - - 169 849 105 638 274 1487
Baimari 363169 145 139 56 284 - - 54 284 - - 54 284
Hati 363174 496 542 178 1038 1 1 148 753 46 284 195 1038
Bhansmund
o
363167 729 800 279 1529 - - 244 1223 52 306 296 1529
Masmano Masmano 363164 116
9
112
3
377 2292 60 315 140 713 321 1264 521 2292
Toto 363163 761 719 259 1480 1 4 220 1317 30 159 251 1480
Budka 363165 598 557 213 1155 - - 177 886 43 269 220 1155
Bedal 363166 111
9
108
7
329 2206 - - 242 1211 178 995 420 2206
Bhawro Bhawro 363178 189 187 575 3766 30 158 392 1910 380 1698 802 3766

104
3 3
Balsota 363188 411 388 159 799 - - 84 420 59 379 143 799
Sorda 363179 881 878 342 1759 - - 145 729 196 1030 341 1759
Gadarpo Gadarpo 363180 749 710 271 1459 - - 235 1413 9 46 244 1459
Porha 363181 419 440 161 859 - - 151 756 24 103 175 859
Palmi 363182 686 635 195 1321 - - 209 1048 44 273 253 1321
Semra 363186 332 360 134 692 - - 107 536 33 156 140 692
Dhanamunji 363187 427 422 126 849 - - 140 749 20 100 160 849
Tilsiri 363184 241 267 91 508 - - 83 327 36 181 119 508
Amdari 363183 205 234 78 439 - - 66 351 15 88 81 439
Jamgain Jamgain 363206 964 999 349 1963 10 58 347 1837 12 68 369 1963
Kota 363203 240 258 82 498 - - 94 498 - - 94 498
Dumri 363204 473 506 149 979 - - 174 970 2 9 176 979
Pandaria 363205 633 613 194 1246 - - 193 1087 31 159 224 1246
Jhiko 363207 831 804 292 1635 18 101 246 1069 90 465 354 1635
Bitpi 363185 352 372 119 724 - - 135 694 6 30 141 724
Akasi Kumharia 363173 117
0
114
9
377 2319 - - 131 658 334 1661 465 2319
Akasi 363172 134
0
123
4
487 2574 - - 269 1348 239 1226 508 2574
Banda 363171 651 617 278 1268 - - 70 354 161 914 231 1268
Bhita Bhita 363195 885 862 287 1747 - - 223 1119 145 628 368 1747
Makunda 363193 423 416 131 839 - - 143 833 1 6 144 839
Nagri 363194 284 319 107 603 - - 98 585 3 18 101 603
Teterpoka 363192 353 345 109 698 - - 46 230 98 468 144 698
Kachmachi 363202 464 467 174 931 - - 156 781 52 150 208 931
Dhobali 363191 333 324 114 657 - - 112 657 - - 112 657

105
Bargain Kajo 363196 405 393 132 798 - - 108 540 52 258 160 798
Bargain 363197 721 757 251 1478 1 2 123 569 180 907 304 1478
Kundo 363201 426 413 127 839 8 44 139 696 18 99 165 839
Khas Khijri 363198 595 610 201 1205 - - 240 1174 6 31 246 1205
Bamandiha 363199 386 372 108 758 1 7 125 531 42 220 168 758
Jharo 363200 610 625 189 1235 24 126 75 381 164 728 263 1235

106
Table.1.2.3 Demography – Senha Block
1:2 Demography
Name of the State:- Jharkhand
Name of the District:- Lohardaga
Name of the Block:Senha
Name of the Gram Panchayat
Name of the Villages covered
Code of Villages covered
Population SC ST General Total
M F CH* Total
No of household
No of Members
No of household
No of Members
No of household
No of Members
No of household
No of Members
Senha Senha 363157 356
2
344
9
103
4
7011 65 343 378 1908 902 4760 1345 7011
Alloudi Arra 363121 263 281 125 544 2 10 70 354 52 180 124 544
Uru 363120 390 402 133 792 2 8 114 713 13 71 129 792
Sake 363117 243 220 132 463 - - 74 430 6 33 80 463
Heswy 363116 571 574 214 1145 6 31 160 811 47 303 213 1145
Chow 363112 134 148 51 282 - - 56 240 8 42 64 282
Churku 363113 343 356 93 699 - - 141 687 2 12 143 699
Chandwa 363110 225 233 109 458 - - 96 410 8 48 104 458
Garhgaon 363111 197 225 88 422 - - 72 342 15 80 87 422
Alloudi 363115 541 557 196 1098 6 29 170 862 42 207 218 1098
Murki
todar
Manhe 363122 589 619 254 1208 - - 192 961 28 247 220 1208
Dandru 363119 405 382 137 787 41 219 82 494 13 74 136 787
Chukni 363118 249 245 79 494 - - 69 429 13 65 82 494
Todar 363129 801 776 295 1577 - - 214 1074 52 503 266 1577
Murki 363128 637 619 191 1256 - - 221 1105 33 151 254 1256
Bansri 363127 477 507 182 984 - - 182 984 - - 182 984
Gobarsela 363126 194 192 71 386 - - 66 336 10 50 76 386

107
Buti Kandra 363141 398 425 162 823 - - 131 818 1 5 132 823
Buti 363140 968 974 416 1942 20 111 247 1418 80 413 347 1942
Jhakra 363139 801 725 262 1526 9 51 90 464 219 1011 318 1526
Chamdu 363114 434 458 163 892 36 184 93 608 18 100 147 892
Mentgara 363138 179 188 60 367 - - 73 367 - - 73 367
Jamira 363137 249 257 116 506 - - 85 503 1 3 86 506
Bhargaon Doka 363134 393 394 127 787 - - 137 682 20 105 157 787
Parhi 363135 761 698 262 1459 - - 242 1214 33 245 275 1459
Kundgari 363136 526 494 172 1020 1 5 162 947 13 68 176 1020
Bhargaon 363132 110
4
102
9
380 2133 - - 276 1382 131 751 407 2133
Arru Arru 363130 200
3
190
9
636 3912 68 350 270 1458 420 2104 758 3912
Kalhepat 363133 105
6
926 334 1982 - - 178 891 216 1091 394 1982
Jogna 363131 904 745 158 1649 20 117 187 937 66 595 273 1649
Badla Badla 363125 206
6
203
0
701 4096 40 213 605 3051 130 832 775 4096
Arahasa 363124 401 403 136 804 - - 135 677 30 127 165 804
Chandkop
a
363123 807 767 277 1574 39 205 144 734 119 635 302 1574
Dandu Ekaguri 363158 101
9
105
9
398 2078 - - 313 1567 103 511 416 2078
Chitri 363159 780 720 275 1500 - - 94 501 187 999 281 1500
Dandu 363155 141
1
137
0
502 2781 27 148 255 1288 266 1345 548 2781
Todar Todar 363161 107
1
102
1
339 2092 1 5 160 823 242 1264 403 2092
Serenghat
u
363160 491 491 126 982 1 6 140 714 58 262 199 982
Sithio 363162 881 850 212 1731 24 126 170 850 167 755 361 1731
Barhi 363152 801 788 281 1589 12 67 160 824 141 698 313 1589

108
Chatakpur 363153 340 317 134 657 2 8 55 301 81 348 138 657
Jhaljhamir
a
Datri 363154 461 422 151 883 2 7 155 770 20 106 177 883
Jhaljhamir
a
363147 113
8
111
2
408 2250 - - 348 1786 44 464 392 2250
Ghata 363148 482 510 186 992 - - 125 638 47 354 172 992
Gageya 363151 447 436 157 883 - - 150 769 13 114 163 883
Pali 363149 71 69 24 140 - - 28 140 - - 28 140
Patlo 363150 184 205 60 389 - - 71 337 12 52 83 389
Ugra Ugra 363146 847 884 338 1731 1 2 163 822 193 907 357 1731
Merho 363156 423 417 126 840 2 11 149 718 19 111 170 840
Murpa 363145 374 357 146 731 - - 105 551 42 180 147 731
Ichri 363143 246 239 76 485 - - 84 485 - - 84 485
Tengaria 363644 213 255 80 468 - - 75 387 15 81 90 468
Korambe 363142 757 731 242 1488 25 131 182 929 41 428 248 1488

109
Table.1.2.4 Demography – Kairo Block
1:2 Demography
Name of the State:- Jharkhand
Name of the District:- Lohardaga
Name of the Block:Kairo
Name of the Gram Panchayat
Name of the Villages covered
Code of Villages covered
Population SC ST General Total
M F CH*
Total
No of household
No of Members
No of household
No of Members
No of household
No of Members
No of household
No of Members
Kairo Kairo 363046 230
9
224
4
731 4553 70 368 320 1613 501 2572 891 4553
Utka 363047 855 832 292 1687 - - 139 695 191 992 330 1687
Guri Guri 363060 908 994 370 1902 - - 290 1458 82 444 372 1902
Baghi 363059 377 370 85 747 - - 101 519 56 228 157 747
Nagra 363057 809 884 308 1693 9 46 246 1334 60 313 315 1693
Chipo 363058 538 508 186 1046 - - 158 809 34 237 192 1046
Sadhawe Sadhawe 363050 101
0
101
4
303 2024 2 11 239 1200 140 813 381 2024
Baxi 363048 118 121 40 239 - - 45 239 - - 45 239
Eradon 363049 301 351 97 652 20 105 104 546 1 1 125 652
Tati 363051 315 330 126 645 - - 86 451 49 194 135 645
Kharta 363052 780 798 257 1578 3 18 227 1264 54 296 284 1578
Hanhat Hanhat 363056 188
6
195
4
589 3840 5 26 416 2086 325 1728 746 3840
Todang 363055 336 329 96 665 - - 115 665 - - 115 665
Gitilgarh 363053 759 779 281 1538 - - 218 1095 71 443 289 1538
Huddu 363054 597 650 257 1247 - - 256 1236 2 11 258 1247
Gajni Chalho 363067 544 532 150 1076 6 26 160 816 42 234 208 1076
Mahuwar
i
363066 558 528 203 1086 10 52 169 938 18 96 197 1086

110
Ulti 363068 250 255 89 505 - - 82 505 - - 82 505
Gajni 363065 873 908 291 1781 5 29 198 996 217 785 320 1781
Garadih 363069 928 895 410 1823 - - 99 524 204 1299 303 1823
Khanda 363064 400 399 140 799 - - 138 708 13 91 151 799
Narawli Narawli 363063 113
2
118
9
407 2321 7 40 313 1575 94 706 414 2321
Pachagai
n
363062 302 310 76 612 - - 90 450 33 162 123 612
Khas
Ambwa
363061 692 678 246 1370 - - 178 902 85 468 263 1370
Nagjuwa 363070 368 364 124 732 - - 71 376 77 356 148 732
Cherima 363071 828 878 282 1706 1 5 115 585 230 1116 346 1706
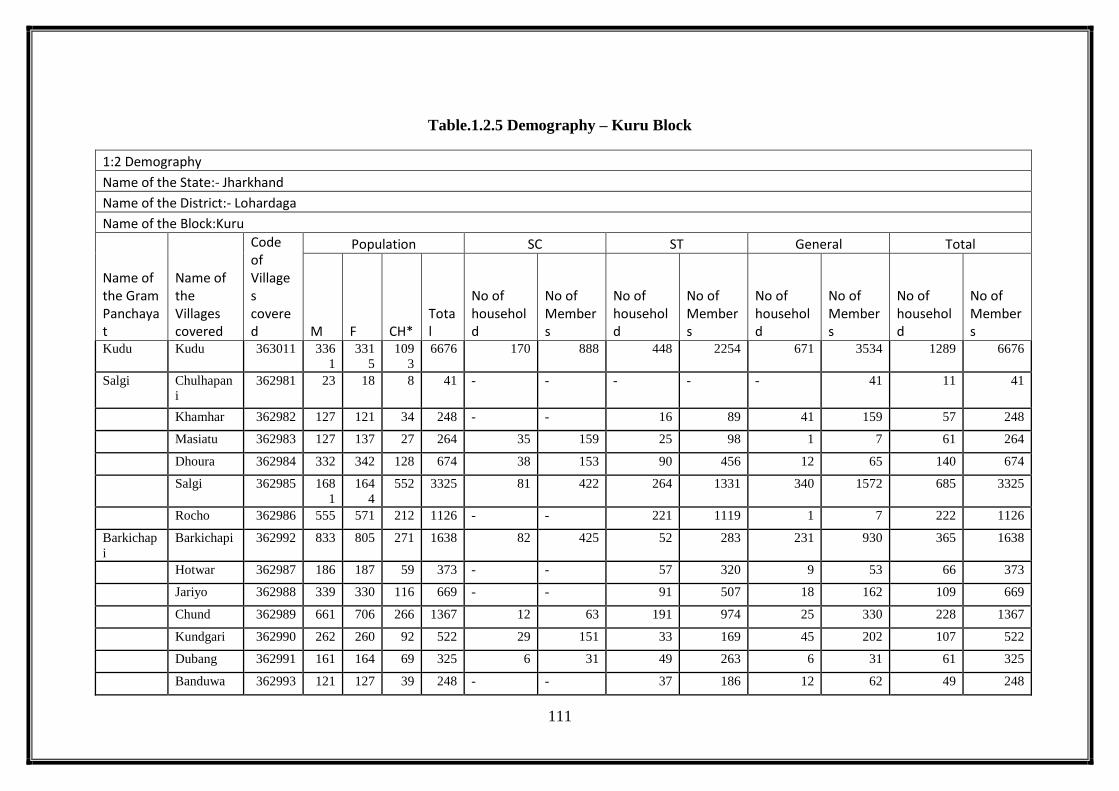
111
Table.1.2.5 Demography – Kuru Block
1:2 Demography
Name of the State:- Jharkhand
Name of the District:- Lohardaga
Name of the Block:Kuru
Name of the Gram Panchayat
Name of the Villages covered
Code of Villages covered
Population SC ST General Total
M F CH* Total
No of household
No of Members
No of household
No of Members
No of household
No of Members
No of household
No of Members
Kudu Kudu 363011 336
1
331
5
109
3
6676 170 888 448 2254 671 3534 1289 6676
Salgi Chulhapan
i
362981 23 18 8 41 - - - - - 41 11 41
Khamhar 362982 127 121 34 248 - - 16 89 41 159 57 248
Masiatu 362983 127 137 27 264 35 159 25 98 1 7 61 264
Dhoura 362984 332 342 128 674 38 153 90 456 12 65 140 674
Salgi 362985 168
1
164
4
552 3325 81 422 264 1331 340 1572 685 3325
Rocho 362986 555 571 212 1126 - - 221 1119 1 7 222 1126
Barkichap
i
Barkichapi 362992 833 805 271 1638 82 425 52 283 231 930 365 1638
Hotwar 362987 186 187 59 373 - - 57 320 9 53 66 373
Jariyo 362988 339 330 116 669 - - 91 507 18 162 109 669
Chund 362989 661 706 266 1367 12 63 191 974 25 330 228 1367
Kundgari 362990 262 260 92 522 29 151 33 169 45 202 107 522
Dubang 362991 161 164 69 325 6 31 49 263 6 31 61 325
Banduwa 362993 121 127 39 248 - - 37 186 12 62 49 248

112
Chotkicha
pi
362994 378 391 147 769 - - 72 375 77 394 149 769
Sundru Sundru 362998 124
5
118
7
492 2432 15 80 26 143 352 2209 393 2432
Sukumar 362996 595 623 222 1218 - - 119 626 113 592 232 1218
Bisramgar
h
362999 533 559 200 1092 5 25 86 445 149 622 240 1092
Opa 362997 391 386 101 777 28 146 80 417 58 214 166 777
Kamle 362995 310 313 111 623 - - 59 308 67 315 126 623
Chiri Chiri 363001 130
9
121
9
491 2528 - - 252 1297 216 1231 468 2528
Kadak 363002 783 843 284 1626 - - 241 1471 30 155 271 1626
Jima Jima 363000 221
9
209
1
712 4310 38 200 452 2282 333 1828 823 4310
Chandu 363007 765 747 270 1512 - - 1 5 272 1507 273 1512
Tiko 363009 475 453 190 928 9 52 145 745 18 131 172 928
Lawagain Lawagain 363003 170
3
172
2
619 3425 1 4 292 1498 398 1923 691 3425
Jangi 363005 314 328 96 642 - - 89 598 9 44 98 642
Nantilo 363006 108
0
100
9
393 2089 4 21 162 820 237 1248 403 2089
Kolsimri Kolsimri 363004 127
4
129
2
393 2566 30 162 372 1875 132 529 534 2566
Umri 363016 682 734 237 1416 - - 220 1122 60 294 280 1416
Sinjo 363017 474 476 150 950 - - 48 255 127 695 175 950
Bardih 363018 214 210 68 424 - - 52 285 36 139 88 424
Sukruhutu 363019 333 307 99 640 2 10 68 339 65 291 135 640
Jingi Jingi 363024 108
7
109
2
357 2179 32 173 220 1114 164 892 416 2179
Tan 363022 417 468 136 885 11 61 174 788 6 36 191 885
Jonjro 363020 104
2
105
1
336 2093 - - 197 1008 184 1085 381 2093
Makra 363021 74 63 29 137 - - 27 137 - - 27 137
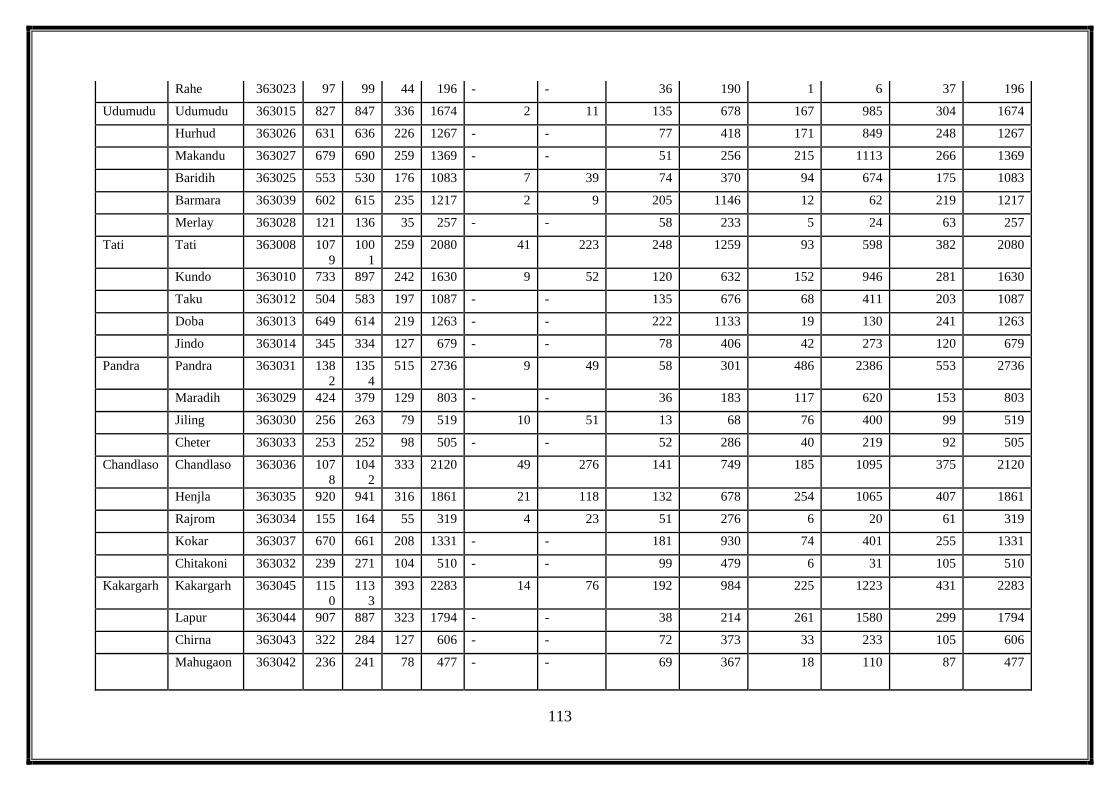
113
Rahe 363023 97 99 44 196 - - 36 190 1 6 37 196
Udumudu Udumudu 363015 827 847 336 1674 2 11 135 678 167 985 304 1674
Hurhud 363026 631 636 226 1267 - - 77 418 171 849 248 1267
Makandu 363027 679 690 259 1369 - - 51 256 215 1113 266 1369
Baridih 363025 553 530 176 1083 7 39 74 370 94 674 175 1083
Barmara 363039 602 615 235 1217 2 9 205 1146 12 62 219 1217
Merlay 363028 121 136 35 257 - - 58 233 5 24 63 257
Tati Tati 363008 107
9
100
1
259 2080 41 223 248 1259 93 598 382 2080
Kundo 363010 733 897 242 1630 9 52 120 632 152 946 281 1630
Taku 363012 504 583 197 1087 - - 135 676 68 411 203 1087
Doba 363013 649 614 219 1263 - - 222 1133 19 130 241 1263
Jindo 363014 345 334 127 679 - - 78 406 42 273 120 679
Pandra Pandra 363031 138
2
135
4
515 2736 9 49 58 301 486 2386 553 2736
Maradih 363029 424 379 129 803 - - 36 183 117 620 153 803
Jiling 363030 256 263 79 519 10 51 13 68 76 400 99 519
Cheter 363033 253 252 98 505 - - 52 286 40 219 92 505
Chandlaso Chandlaso 363036 107
8
104
2
333 2120 49 276 141 749 185 1095 375 2120
Henjla 363035 920 941 316 1861 21 118 132 678 254 1065 407 1861
Rajrom 363034 155 164 55 319 4 23 51 276 6 20 61 319
Kokar 363037 670 661 208 1331 - - 181 930 74 401 255 1331
Chitakoni 363032 239 271 104 510 - - 99 479 6 31 105 510
Kakargarh Kakargarh 363045 115
0
113
3
393 2283 14 76 192 984 225 1223 431 2283
Lapur 363044 907 887 323 1794 - - 38 214 261 1580 299 1794
Chirna 363043 322 284 127 606 - - 72 373 33 233 105 606
Mahugaon 363042 236 241 78 477 - - 69 367 18 110 87 477

114
Jajgunda 363041 147 155 60 302 - - 31 176 14 126 45 302
Fhulsuri 363038 924 908 364 1832 36 190 110 558 213 184 359 1832
Chadra 363040 131 139 49 270 - - 50 265 1 5 51 270

115
Table.1.2.6 Demography – Kisko Block
1:2 Demography
Name of the State:- Jharkhand
Name of the District:- Lohardaga
Name of the Block:Kisko
Name of the Gram Panchayat
Name of the Villages covered
Code of Villages covered
Population SC ST General Total
M F CH*
Total
No of household
No of Members
No of household
No of Members
No of household
No of Members
No of household
No of Members
Parhepat Parhepat 362896 167
9
167
1
534 3350 80 416 335 1695 272 1239 687 3350
Kisko 362897 126
0
101
8
351 2278 6 28 229 1151 198 1099 433 2278
Hondga 362886 801 806 260 1607 40 204 75 389 211 1014 326 1607
Devdaria Devdaria 362873 502 455 106 957 - - 137 823 24 134 161 957
Lawadag 362874 149 159 75 308 - - 31 169 33 139 64 308
Jabang 362875 197 184 81 381 - - 65 380 1 1 66 381
Kharcha 362876 403 339 142 742 3 15 96 490 42 237 141 742
Uldag 362877 282 241 97 523 1 1 70 352 28 170 99 523
Bahabar 362878 48 42 10 90 - - 16 61 5 29 21 90
Kharia 362879 354 355 146 709 30 151 108 511 9 47 147 709
Pakhar Pakhar 362872 111
7
101
7
501 2134 - - 421 2118 5 16 426 2134
Saleya 362880 919 915 386 1834 4 22 322 1635 16 177 342 1834
Tisia 362881 530 512 186 1042 9 47 197 897 18 98 224 1042
Hutap 362882 375 366 103 741 10 53 99 512 32 176 141 741
Nawadih Durhul 362883 262 284 80 546 - - 72 404 25 142 97 546
Nari 362884 114
7
115
7
374 2304 39 207 77 399 332 1702 448 2304
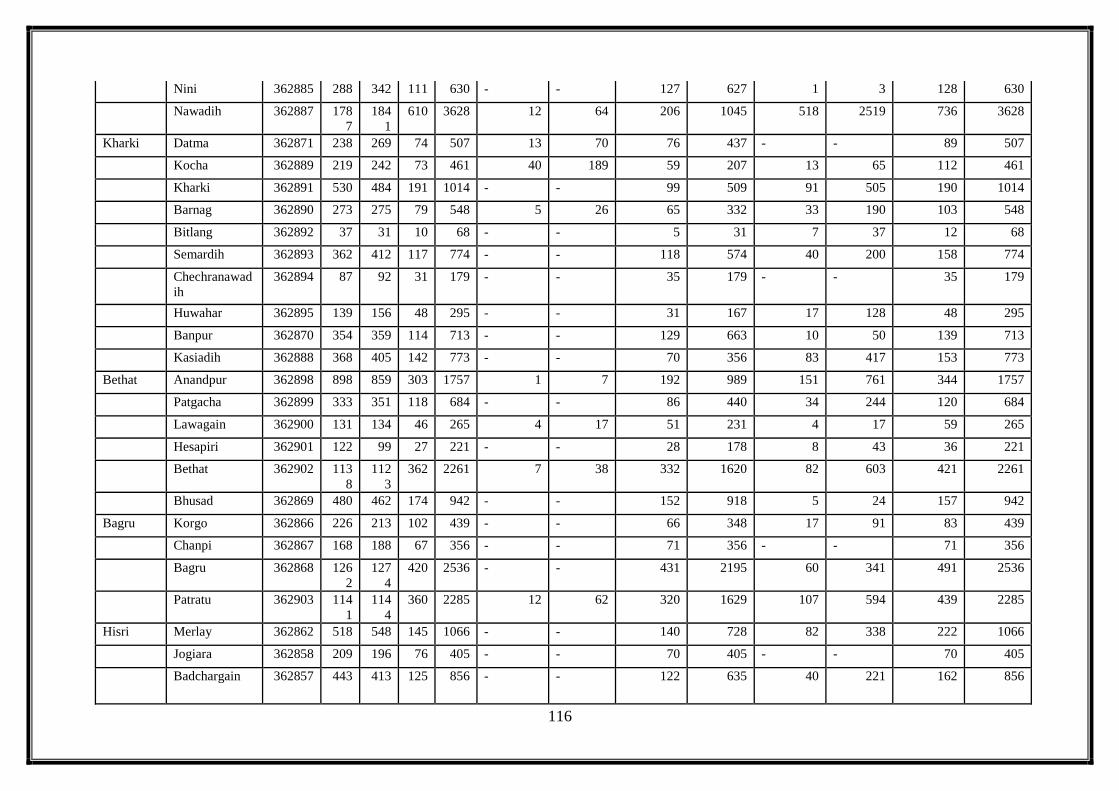
116
Nini 362885 288 342 111 630 - - 127 627 1 3 128 630
Nawadih 362887 178
7
184
1
610 3628 12 64 206 1045 518 2519 736 3628
Kharki Datma 362871 238 269 74 507 13 70 76 437 - - 89 507
Kocha 362889 219 242 73 461 40 189 59 207 13 65 112 461
Kharki 362891 530 484 191 1014 - - 99 509 91 505 190 1014
Barnag 362890 273 275 79 548 5 26 65 332 33 190 103 548
Bitlang 362892 37 31 10 68 - - 5 31 7 37 12 68
Semardih 362893 362 412 117 774 - - 118 574 40 200 158 774
Chechranawad
ih
362894 87 92 31 179 - - 35 179 - - 35 179
Huwahar 362895 139 156 48 295 - - 31 167 17 128 48 295
Banpur 362870 354 359 114 713 - - 129 663 10 50 139 713
Kasiadih 362888 368 405 142 773 - - 70 356 83 417 153 773
Bethat Anandpur 362898 898 859 303 1757 1 7 192 989 151 761 344 1757
Patgacha 362899 333 351 118 684 - - 86 440 34 244 120 684
Lawagain 362900 131 134 46 265 4 17 51 231 4 17 59 265
Hesapiri 362901 122 99 27 221 - - 28 178 8 43 36 221
Bethat 362902 113
8
112
3
362 2261 7 38 332 1620 82 603 421 2261
Bhusad 362869 480 462 174 942 - - 152 918 5 24 157 942
Bagru Korgo 362866 226 213 102 439 - - 66 348 17 91 83 439
Chanpi 362867 168 188 67 356 - - 71 356 - - 71 356
Bagru 362868 126
2
127
4
420 2536 - - 431 2195 60 341 491 2536
Patratu 362903 114
1
114
4
360 2285 12 62 320 1629 107 594 439 2285
Hisri Merlay 362862 518 548 145 1066 - - 140 728 82 338 222 1066
Jogiara 362858 209 196 76 405 - - 70 405 - - 70 405
Badchargain 362857 443 413 125 856 - - 122 635 40 221 162 856

117
Chotchargain 362865 248 242 82 490 - - 38 203 54 287 92 490
Agardih 362859 209 238 76 447 - - 79 440 1 7 80 447
Barwatoli 362860 117 97 31 214 - - 29 161 9 53 38 214
Jamhare 362861 137 134 57 271 - - 50 263 2 8 52 271
Hisri 362864 196
2
195
2
680 3914 8 46 222 1117 572 2751 802 3914
Areya Charhu 362906 671 648 213 1319 - - 72 387 212 932 284 1319
Tetratand 362856 416 403 135 819 - - 120 641 24 178 144 819
Mahugaon 362855 367 349 145 716 - - 86 430 37 286 123 716
Areya 362904 889 851 266 1740 - - 180 941 123 799 303 1740
Nirhu 362905 642 658 242 1300 - - 142 681 116 619 258 1300
Bonga 362863 258 262 89 520 - - 101 510 2 10 103 520

118
Table.1.2.7 Demography – Peshrar Block
1:2 Demography
Name of the State:- Jharkhand
Name of the District:- Lohardaga
Name of the Block:Peshrar
Name of the Gram Panchayat
Name of the Villages covered
Code of Villages covered
Population SC ST General Total
M F CH*
Total
No of household
No of Members
No of household
No of Members
No of household
No of Members
No of household
No of Members
Peshrar Bulbul 362907 156 164 46 320 - - 44 320 - - 44 320
Kerar 362908 456 451 187 907 - - 158 907 10 53 168 960
Bondobar 362945 556 502 208 1058 - - 240 1057 1 1 241 1058
Honhe 362909 130 119 54 249 - - 48 242 1 7 49 249
Madanpur 362934 102 120 46 222 - - 45 172 9 50 54 222
Duggu 362935 218 218 90 436 - - 83 404 6 32 89 436
Chinpur 362936 175 161 58 336 1 2 29 154 34 180 64 336
Chanlagi 362940 97 114 47 211 - - 51 211 - - 51 211
Pesrar 362941 693 615 289 1308 2 8 198 1006 66 294 266 1308
Rorad Putrar 362937 363 337 174 700 - - 123 700 - - 123 700
Kawatand 362938 419 410 169 829 - - 153 829 - - 153 829
Onegara 362939 533 497 209 1030 - - 170 971 11 59 181 1030
Rorad 362942 106
2
103
2
434 2094 - - 350 1936 31 158 381 2094
Husru 362943 84 71 35 155 - - 29 155 - - 29 155
Kekrang 362944 276 288 117 564 - - 119 564 - - 119 564
Hesag Badi 362947 139 119 48 258 - - 44 257 1 1 45 258
Hesag 362948 437 466 161 903 - - 143 758 21 145 164 903

119
Dundru 362957 264 259 89 523 - - 87 466 10 57 97 523
Pundag 362946 215 235 111 450 - - 61 326 30 124 91 450
Pahardandu 362949 140 134 54 274 45 204 3 14 11 56 59 274
Batru 362956 53 72 25 125 - - 18 113 2 12 20 125
Uperturiadih 362955 150 159 38 309 - - 65 309 - - 65 309
Hendehas 362950 261 240 101 501 - - 71 391 23 110 94 501
Titro 362951 34 40 17 74 - - 15 74 - - 15 74
Kham 362952 57 57 25 114 - - 22 114 - - 22 114
Jawal 362954 208 174 63 382 - - 60 349 6 33 66 382
Baladih 362953 215 205 80 420 - - 73 419 1 1 74 420
Mungo 362979 162 147 46 309 - - 64 309 - - 64 309
Bidni 362980 234 235 128 469 - - 48 259 43 210 91 469
Garhsamar 362975 348 341 141 689 4 19 122 618 10 52 136 689
Nawadih 362976 99 100 41 199 - - 37 174 5 25 42 199
Fatehpur 362977 129 118 53 247 - - 32 195 10 52 42 247
Nicheturiadi
h
362978 168 176 56 344 - - 49 267 15 77 64 344
Tuimu Judni 362959 125 135 51 260 - - 41 260 - - 41 260
Pitroul 362960 128 112 30 240 - - 35 205 7 35 42 240
Garatu 362964 81 75 28 156 - - 30 156 - - 30 156
Sindur 362966 174 205 82 379 - - 77 372 1 7 78 379
Nindi 362962 90 79 40 169 - - 31 169 - - 31 169
Henhe 362963 175 140 65 315 - - 48 315 - - 48 315
Chaprong 362971 151 143 32 294 - - 41 262 6 32 47 294
Tuimu 362972 810 673 319 1483 - - 237 1405 15 78 252 1483
Hudmud 362973 112 86 34 198 - - 33 198 - 33 198

120
Ganeshpur 362974 127 123 55 250 - - 46 250 - 46 250
Sanay 362961 98 109 41 207 - - 24 168 15 92 39 260
Manhepat 362970 288 304 117 592 - - 86 592 - - 86 592
Chadi 362969 70 72 41 142 - - 23 142 - - 23 142
Gamharia 362968 148 171 71 319 - - 57 296 4 23 61 319
Rankuli 362967 83 69 28 152 - - 10 50 21 102 31 152
Hundi 362958 92 99 35 191 - - 30 168 4 23 34 191
Churwe 362965 165 143 55 308 - - 47 307 1 1 48 308
Seram Seram 362921 624 619 222 1243 2 8 207 1068 21 167 230 1243
Kurse 362910 115 104 40 219 1 6 42 212 1 1 44 219
Partu 362911 185 193 83 378 - - 73 378 - - 73 378
Manha 362912 119 107 39 226 - - 50 210 3 16 53 226
Manchi 362913 245 262 98 507 5 29 50 247 60 231 115 507
Kotsa 362915 88 107 41 195 - - 46 195 - - 46 195
Bahagara
**
- - - - - - - - - - - - -
Sangodih 362917 274 314 145 588 7 42 112 546 - - 119 588
Kopia 362918 122 109 31 231 25 137 1 6 18 88 44 231
Semmuwa 362919 182 165 63 347 42 243 8 41 13 63 67 347
Semratand 362920 232 230 85 462 45 270 32 174 4 18 81 462
Murmu 362914 397 398 182 795 25 137 48 290 62 368 135 795
Kita 362923 88 79 30 167 3 15 27 151 1 1 31 167
Pahargir 362924 48 48 16 96 - - 23 96 - - 23 96
Rubed 362925 205 188 59 393 1 3 32 170 42 220 75 393
Mukrum 362922 105 102 41 207 - - 34 180 5 27 39 207
Bariatu 362926 394 413 183 807 6 30 3 15 137 762 146 807
Pandepura 362927 54 42 13 96 - - 5 24 15 72 20 96

121
Keradih 362928 52 51 19 103 - - 66 - 37 21 103
Saryupowa 362929 67 58 20 125 - - 21 118 1 7 22 125
Barwadih 362930 133 140 59 273 3 17 48 250 1 6 52 273
Jamdih 362931 68 60 23 128 - - 20 102 5 26 25 128
Ambapawa 362932 129 112 40 241 - - 49 241 - - 49 241
Makka 362933 288 278 95 566 1 3 92 506 12 60 105 566

122
Table.1.3.1 Biomass and Livestock – Kisko Block
1:3 Biomass and Livestock
Name of the State- Jharkhand
Name of the District- Lohardaga
Name of the Block-Kisko
Small Animals Large Animals
Poultry (No.)
Ducks (No.)
Pigs (Nos.)
Goats (Nos.)
Sheeps (Nos.)
Indigenous Cow (Nos.)
Hybrid Cow (Nos.)
In descriptive Buffalo (Nos.)
Hybrid Buffalo (Nos.)
Any other Milch or Meat Animal (Nos.)
Draft Animal (Buffalo/yak/bulls/any other (Nos.)
30523 749 1762 15801 277 3475 111 242 81 5014 11909
Table.1.3.2 Biomass and Livestock – Peshrar Block
1:3 Biomass and Livestock
Name of the State- Jharkhand
Name of the District- Lohardaga
Name of the Block-Peshrar
Small Animals Large Animals
Poultry (No.)
Ducks (No.)
Pigs (Nos.)
Goats (Nos.)
Sheeps (Nos.)
Indigenous Cow (Nos.)
Hybrid Cow (Nos.)
In descriptive Buffalo (Nos.)
Hybrid Buffalo (Nos.)
Any other Milch or Meat Animal (Nos.)
Draft Animal (Buffalo/yak/bulls/any other (Nos.)
17921 106 1565 13258 0 4475 0 363 120 3684 9877

123
Table.1.3.3 Biomass and Livestock – Kuru Block
1:3 Biomass and Livestock
Name of the State- Jharkhand
Name of the District- Lohardaga
Name of the Block-Kuru
Small Animals Large Animals
Poultry (No.)
Ducks (No.)
Pigs (Nos.)
Goats (Nos.)
Sheeps (Nos.)
Indigenous Cow (Nos.)
Hybrid Cow (Nos.)
In descriptive Buffalo (Nos.)
Hybrid Buffalo (Nos.)
Any other Milch or Meat Animal (Nos.)
Draft Animal (Buffalo/yak/bulls/any other (Nos.)
60433 2264 2207 23465 108 5394 573 731 241 6065 14220
Table.1.3.4 Biomass and Livestock – Kairo Block
1:3 Biomass and Livestock
Name of the State- Jharkhand
Name of the District- Lohardaga
Name of the Block-Kairo
Small Animals Large Animals
Poultry (No.)
Ducks (No.)
Pigs (Nos.)
Goats (Nos.)
Sheeps (Nos.)
Indigenous Cow (Nos.)
Hybrid Cow (Nos.)
In descriptive Buffalo (Nos.)
Hybrid Buffalo (Nos.)
Any other Milch or Meat Animal (Nos.)
Draft Animal (Buffalo/yak/bulls/any other (Nos.)
28286 969 958 13906 61 2908 242 640 202 3311 6936

124
Table.1.3.5 Biomass and Livestock – Lohardaga Block
1:3 Biomass and Livestock
Name of the State- Jharkhand
Name of the District- Lohardaga
Name of the Block-Lohardaga
Small Animals Large Animals
Poultry (No.)
Ducks (No.)
Pigs (Nos.)
Goats (Nos.)
Sheeps (Nos.)
Indigenous Cow (Nos.)
Hybrid Cow (Nos.)
In descriptive Buffalo (Nos.)
Hybrid Buffalo (Nos.)
Any other Milch or Meat Animal (Nos.)
Draft Animal (Buffalo/yak/bulls/any other (Nos.)
40931 1071 1203 13496 53 3932 382 365 113 3098 12017
Table.1.3.6 Biomass and Livestock – Senha Block
1:3 Biomass and Livestock
Name of the State- Jharkhand
Name of the District- Lohardaga
Name of the Block-Senha
Small Animals Large Animals
Poultry (No.)
Ducks (No.)
Pigs (Nos.)
Goats (Nos.)
Sheeps (Nos.)
Indigenous Cow (Nos.)
Hybrid Cow (Nos.)
In descriptive Buffalo (Nos.)
Hybrid Buffalo (Nos.)
Any other Milch or Meat Animal (Nos.)
Draft Animal (Buffalo/yak/bulls/any other (Nos.)
61574 817 1183 20555 1614 4929 526 497 165 5176 15910

125
Table.1.3.7 Biomass and Livestock – Bhandra Block
1:3 Biomass and Livestock
Name of the State- Jharkhand
Name of the District- Lohardaga
Name of the Block-Bhandra
Small Animals Large Animals
Poultry (No.)
Ducks (No.)
Pigs (Nos.)
Goats (Nos.)
Sheeps (Nos.)
Indigenous Cow (Nos.)
Hybrid Cow (Nos.)
In descriptive Buffalo (Nos.)
Hybrid Buffalo (Nos.)
Any other Milch or Meat Animal (Nos.)
Draft Animal (Buffalo/yak/bulls/any other (Nos.)
25736 606 1797 14844 16 4368 632 589 193 4219 14770
Table.1.4.1 Agro Ecology, Climate, Hydrology and Topography
Min
.Max.
Me
an
Min
.Max.
Me
anMin. Max.
Mea
n
1 -Plain
& 15983.6 1286 107 52 36 7 9 22 42 31 13 27 21 20 35 28
1145.
7 mm
1075
mm800 642 652 647
Agro
Ecol
ogic
al
Zon
Type
of
terrain
Block
Area
(ha)
Nor
mal
Ann
ual
Raln
S.N
o
Maximum Rainfall
Up to 15
Min
Name of the State : Jharkhand
Aver
age
Mon
thly
Rain
No of
Rainy
Days
(No)
Average Weekly Temperature © Elevation
Winter (oct- Rainy ( june-sept)
Name of the District : Lohardaga
Name of the Block : Lohardaga
Period
Rainy
Seas
on
Wint
er
Mean
Potential Evapo-
Beyon
d 15
but up
to 30
Beyo
nd
30
but
Period
Summ
er
Ma
x.
summer ( April -
Cu
mul
atv
e
Mi
n.
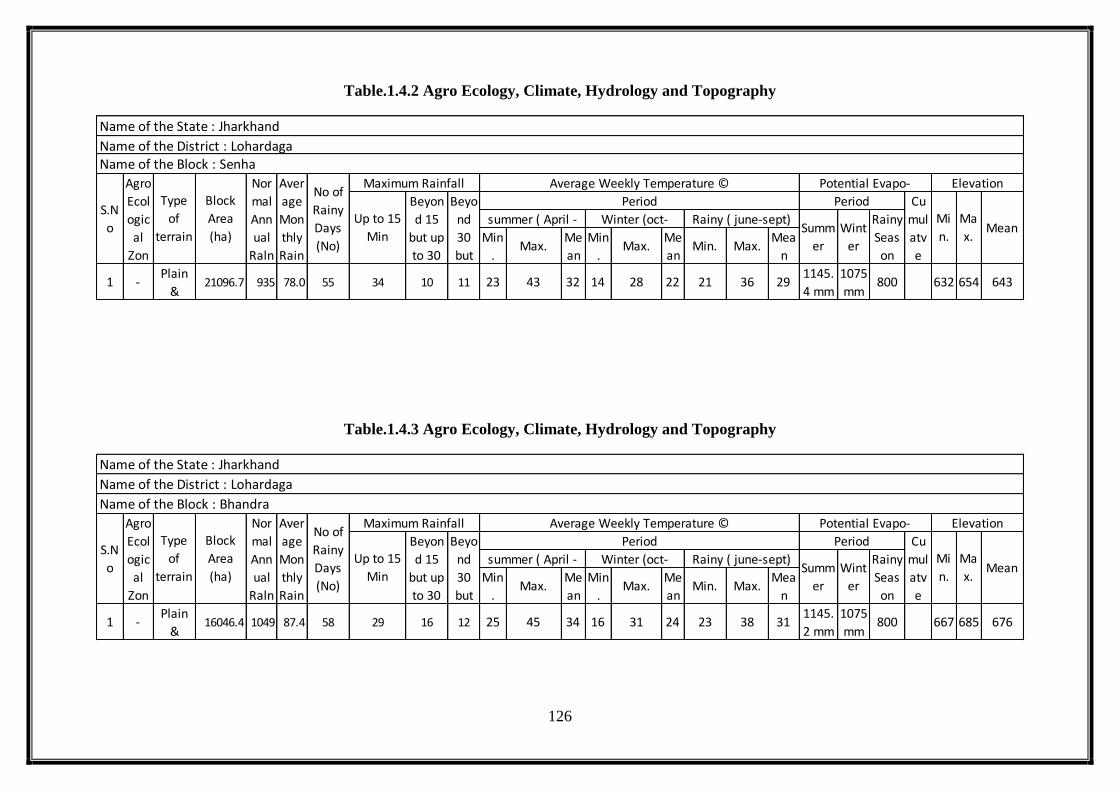
126
Table.1.4.2 Agro Ecology, Climate, Hydrology and Topography
Min
.Max.
Me
an
Min
.Max.
Me
anMin. Max.
Mea
n
1 -Plain
& 21096.7 935 78.0 55 34 10 11 23 43 32 14 28 22 21 36 29
1145.
4 mm
1075
mm800 632 654 643
summer ( April -
Maximum Rainfall
Up to 15
Min
Beyon
d 15
but up
to 30
Beyo
nd
30
but
Rainy ( june-sept)Winter (oct-
Name of the State : Jharkhand
Name of the District : LohardagaName of the Block : Senha
Elevation
S.N
o
Agro
Ecol
ogic
al
Zon
Type
of
terrain
Block
Area
(ha)
Nor
mal
Ann
ual
Raln
Summ
er
Rainy
Seas
on
PeriodPeriod
Aver
age
Mon
thly
Rain
No of
Rainy
Days
(No)
Mi
n.
Ma
x.Mean
Average Weekly Temperature © Potential Evapo-
Wint
er
Cu
mul
atv
e
Table.1.4.3 Agro Ecology, Climate, Hydrology and Topography
Min
.Max.
Me
an
Min
.Max.
Me
anMin. Max.
Mea
n
1 -Plain
& 16046.4 1049 87.4 58 29 16 12 25 45 34 16 31 24 23 38 31
1145.
2 mm
1075
mm800 667 685 676
S.N
o
Agro
Ecol
ogic
al
Zon
Type
of
terrain
Block
Area
(ha)
Nor
mal
Ann
ual
Raln
Summ
er
Rainy ( june-sept)
No of
Rainy
Days
(No)
Aver
age
Mon
thly
Rain
Up to 15
MinMean
Period
Average Weekly Temperature ©
Beyon
d 15
but up
to 30
Rainy
Seas
on
Mi
n.Wint
er
Winter (oct- summer ( April -
ElevationMaximum Rainfall Potential Evapo-
Name of the State : Jharkhand
Name of the District : Lohardaga
Name of the Block : Bhandra
Beyo
nd
30
but
Period Cu
mul
atv
e
Ma
x.

127
Table.1.4.4 Agro Ecology, Climate, Hydrology and Topography
Min
.Max.
Me
an
Min
.Max.
Me
anMin. Max.
Mea
n
1 -Plain
& 21711.20 1224 102.0 60 37 12 11 21 41 30 12 26 20 19 34 27
1145.
1 mm
1075
mm800 670 682 676
No of
Rainy
Days
(No)
S.N
o
Agro
Ecol
ogic
al
Zon
Type
of
terrain
Average Monthly Rainfal (mm)Mean
Winter (oct- summer ( April -
Beyon
d 15
but up
to 30
Block
Area
(ha)
Nor
mal
Ann
ual
Raln
Mi
n.
Ma
x.
Period
Rainy ( june-sept) Rainy
Seas
on
Period
Up to 15
Min
Beyo
nd
30
but
Maximum Rainfall Average Weekly Temperature © Potential Evapo-
Cu
mul
atv
e
Summ
er
Wint
er
Elevation
Name of the State : Jharkhand
Name of the District : Lohardaga
Name of the Block : Kuru
Table.1.4.5 Agro Ecology, Climate, Hydrology and Topography
Min
.Max.
Me
an
Min
.Max.
Me
anMin. Max.
Mea
n
1 -Plain
& 25350.5 1193 99.4 48 29 9 10 20 40 29 11 25 19 18 33 26
1145.
3 mm
1075
mm800 628 658 643
Name of the District : Lohardaga
S.N
o
Agro
Ecol
ogic
al
Zon
Type
of
terrain
Block
Area
(ha)
Name of the Block : Kisko
Average Weekly Temperature ©
Name of the State : Jharkhand
Maximum Rainfall
Rainy
Seas
on
Cu
mul
atv
e
Mi
n.
Ma
x.Wint
er
Summ
er
Elevation
Mean
Beyo
nd
30
but
Potential Evapo-
Period
Up to 15
Min
Beyon
d 15
but up
to 30
Winter (oct- summer ( April -
Period
Rainy ( june-sept)
Nor
mal
Ann
ual
Raln
Average Monthly Rainfal (mm)
No of
Rainy
Days
(No)

128
Table.1.4.6Agro Ecology, Climate, Hydrology and Topography
Min
.Max.
Me
an
Min
.Max.
Me
anMin. Max.
Mea
n
1 -Plain
& 10528 1186 98.8 57 32 13 12 24 44 33 15 30 23 22 37 30
1145.
9 mm
1075
mm800 667 681 674
Name of the State : Jharkhand
Block
Area
(ha)
Nor
mal
Ann
ual
Raln
Winter (oct- summer ( April -
Beyo
nd
30
but
No of
Rainy
Days
(No)
S.N
o
Agro
Ecol
ogic
al
Zon
Mi
n.
Ma
x.Summ
er
Wint
er
Rainy
Seas
on
Type
of
terrain
Average
Monthly
Rainfal
(mm)
Up to 15
Min
Rainy ( june-sept)
Maximum Rainfall
Beyon
d 15
but up
to 30
Elevation
Mean
Cu
mul
atv
e
Period
Potential Evapo- Average Weekly Temperature ©
Name of the District : Lohardaga
Name of the Block : Kairo
Period
Table.1.4.7Agro Ecology, Climate, Hydrology and Topography
Min
.Max.
Me
an
Min
.Max.
Me
anMin. Max.
Mea
n
1 -Plain
& 38441.7 1064 88.7 58 41 7 11 19 39 28 10 24 18 17 32 27
1145.
5 mm
1075
mm800 684 698 691
S.N
o
Agro
Ecol
ogic
al
Zon
Type
of
terrain
Block
Area
(ha)
Nor
mal
Ann
ual
Raln
Average
Monthly
Rainfal
(mm)
Period PeriodNo of
Rainy
Days
(No)
Maximum Rainfall
Up to 15
Min
Beyon
d 15
but up
to 30
Beyo
nd
30
but
Winter (oct-
Average Weekly Temperature ©
Wint
er
Potential Evapo-
Name of the State : Jharkhand
Name of the District : Lohardaga
Name of the Block : Pesrar
Rainy
Seas
on
Cu
mul
atv
e
summer ( April - Rainy ( june-sept)Summ
er
Elevation
Mi
n.
Ma
x.Mean

129
Table.1.6.1 Soil Erosion and Runoff Status
Peak
Rate
(cum/
hr)
Freque
ncy of
peak
(No in
Month
s)
Total
Runoff
Volum
e of
Rainy
Season
(ha-m)
Buchi nala 84 41 12 .12 23 3312.99 14 890 1668.9 5 Years 10 Years In years
Tana bhagat 84 43 45. 19 23 34 39 14 702 1668.9
Anand pur 84 42 10.28 23 34 43. 59 14 760
Bara jharia 842 10 28 4 23 34 43 .58 14.67 876
Sarna 84 42 10 28 23 34 43 .59 14 896
Pawan Ghat 84 42 10 .28 23 34 43.59 14.45 752
Jagasi Nala 84 42 10 .28 23 34 43.59 14 980
Name of the State:- Jharkhand
Name of the Distrist:- Lohardaga
Name ot the Block: Kuru
Time of return of Maximum
flood
Runoff
Name of the Micro
Watershed
Name of
the
Sediment
Monitorin
g Station
Longitude LatitudeSoil Erosion
(Tone/ha)
Drought
Frequency

130
Table.1.6.2 Soil Erosion and Runoff Status
Peak
Rate
(cum/
hr)
Freque
ncy of
peak
(No in
Month
s)
Total
Runoff
Volum
e of
Rainy
Season
(ha-m)
Babhar chaura nala 84 35 46 23 24 20 17.28 780 5 Years 10 Years In years
Aaraha sa dodha nala 84 39 25 23 23 50 16.3 782
Deshwaki nala 84 35 75 23 22 50 16.4
Akaguri msw 84 43 10 23 28 24 16.3
Aaru mws 84 43 10 23 28 29 20
Senha mws 84 56 10 23 22 30 18
Name of the Distrist:- Lohardaga
Name of the State:- Jharkhand
Name ot the Block: Senha
Time of return of Maximum
flood
Soil Erosion
(Tone/ha)LatitudeLongitude
Name of
the
Sediment
Monitorin
g Station
Name of the Micro
Watershed
Drought
Frequency
Runoff

131
Table.1.6.3 Soil Erosion and Runoff Status
Name of the State:- Jharkhand
Name of the Distrist:- Lohardaga
Name ot the Block: Bhandra
Runoff
Name of the Micro Watershed
Name of the Sediment Monitoring Station
Longitude Latitude Soil Erosion (Tone/ha)
Peak Rate (cum/hr)
Frequency of peak (No in Months)
Total Runoff Volume of Rainy Season (ha-m)
Time of return of Maximum flood
Drought Frequenc
y
Buchi nala 84 41 12 .12 23 3312.99 5 Years
10 Years
In years
Tana bhagat 84 43 45. 19 23 34 39 21 458
Anand pur 84 42 10.28 23 34 43. 59
Bara jharia 842 10 28 4 23 34 43 .58
Sarna 84 42 10 28 23 34 43 .59
Pawan ghat 84 42 10 .28 23 34 43.59
Jagasi nala 84 42 10 .28 23 34 43.59

132
Table.1.6.4 Soil Erosion and Runoff Status
Name of the State:- Jharkhand
Name of the Distrist:- Lohardaga
Name ot the Block: Lohardaga
Name of the Micro Watershed
Name of the
Sediment Monitoring
Station
Longitude Latitude Soil Erosion (Tone/ha)
Runoff
Drought Frequenc
y
Peak Rate (cum/hr)
Frequency of peak (No in Months)
Total Runoff Volume of Rainy Season (ha-m)
Time of return of Maximum flood
Kutmu mws 84 39 00 23 21.10 54 780 5 Years
10 Years
In years
Nadiya mws 84 39 40 23 21 .10 43 780
Juriya mws 84 40 41 23 34 00 48 760

133
Table.1.7.1 Land Use Pattern
Name of the State : Jharkhand
Name of the District : Lohardaga
Name of the Block : kairo
Area in Ha
S No
Name of the Gram panchayat
Name of the Villages covered
Total Geographical Area
Area under Agriculture
Area under Forest
Area under Wasteland
Ares under other uses
Gross Cropped Area (1)
Net Sown
Area (2)
Area sown more than once (1-2)
Cropping Intensity
(%)
1 kairo
kairo 836.94 688.10 538.19 149.91 78.21 16.43 117.74 14.67
2 Utka 252.49 206.02 167.29 38.73 81.20 0.00 22.7 23.77
3
Sarabe
Bakshi 326.34 180.89 155.28 25.61 85.84 62.32 68.53 14.60
4 Eradon 294.11 224.82 186.56 38.26 82.98 0.00 23.91 45.38
5 sarabe 508.66 427.61 245.24 182.37 57.35 0.81 63.91 16.33
6 Tati 322.66 235.44 192.62 42.82 81.81 11.13 25.56 50.53
7 Kharta 573.98 408.17 348.25 59.92 85.32 65.16 53.96 46.69
8
Hanhat
Gitilgarh 493.75 304.57 248.13 56.44 81.47 2.68 93.77 92.73
9 Hudu 404.64 277.45 224.26 53.19 80.83 70.82 51.79 4.58
10 Torang 184.19 133.36 105.39 27.97 79.03 0.00 11.76 39.07
11 Hanhat 834.97 605.98 539.54 66.44 89.04 20.44 40.90 167.65
12 Guri
Nagra 569.08 463.71 415.58 48.13 89.62 0.00 27.3 78.07
13 Cipo 364.39 267.51 245.98 21.53 91.95 0.00 14.10 82.78
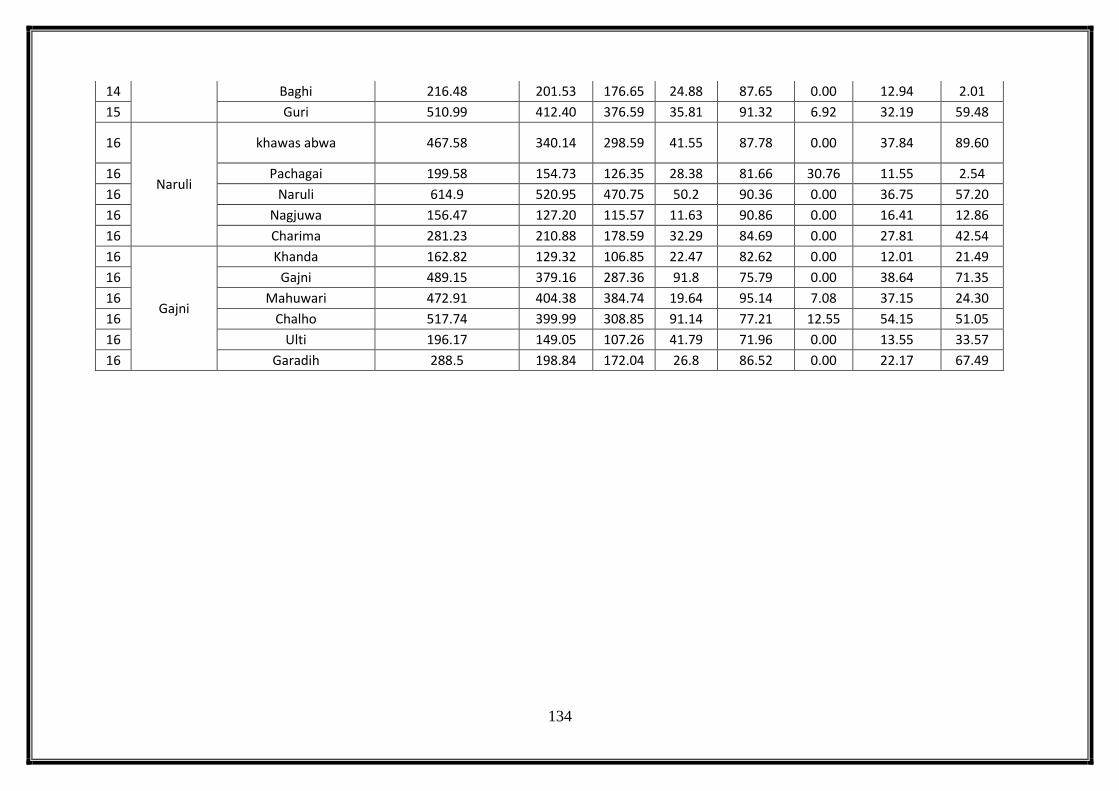
134
14 Baghi 216.48 201.53 176.65 24.88 87.65 0.00 12.94 2.01
15 Guri 510.99 412.40 376.59 35.81 91.32 6.92 32.19 59.48
16
Naruli
khawas abwa 467.58 340.14 298.59 41.55 87.78 0.00 37.84 89.60
16 Pachagai 199.58 154.73 126.35 28.38 81.66 30.76 11.55 2.54
16 Naruli 614.9 520.95 470.75 50.2 90.36 0.00 36.75 57.20
16 Nagjuwa 156.47 127.20 115.57 11.63 90.86 0.00 16.41 12.86
16 Charima 281.23 210.88 178.59 32.29 84.69 0.00 27.81 42.54
16
Gajni
Khanda 162.82 129.32 106.85 22.47 82.62 0.00 12.01 21.49
16 Gajni 489.15 379.16 287.36 91.8 75.79 0.00 38.64 71.35
16 Mahuwari 472.91 404.38 384.74 19.64 95.14 7.08 37.15 24.30
16 Chalho 517.74 399.99 308.85 91.14 77.21 12.55 54.15 51.05
16 Ulti 196.17 149.05 107.26 41.79 71.96 0.00 13.55 33.57
16 Garadih 288.5 198.84 172.04 26.8 86.52 0.00 22.17 67.49

135
Table.1.7.2 Land Use Pattern
Name of the State:- Jharkhand
Name of the Distrist:- Lohardaga
Name ot the Block:Kisko
Sl
N
o
Name of
the Gram
Panchaya
t
Name of the
Villages Covered
Total
Geographic
al Area
Area under Agriculture
Area
under
Forest
Area
under
Wastela
nd
Area
under
other
uses
Gross
Croppe
d Area
(1)
Net
Sown
Area
(2)
Area
Sown
more
than
once
(1-2)
Croppin
g
Intensit
y (%)
1 Areya Areya
894.24 357.696 391.05 156.42 257.08 102.83
2
53.58
8 34.26 0 2.3 0.92 107.5 43
2 Areya Bonga
399.79 159.916 226.19 90.476 197.48 78.992 11.48
4 12.69 0 2.28 0.912 14.08 5.632
3 Areya Charhu
737.45 294.98 288.01 115.204 203 81.2 34.00
4 29.52 12.2 2.08 0.832 105.8 42.32
4 Areya Mahugaon
18.58 7.432 129.86 51.944 100.72 40.288 11.65
6 22.44 0 2.15 0.86 22.61 9.044
5 Areya Nirhu
979.74 391.896 206.69 82.676 197.07 78.828 3.848 4.65 28.4 8.3 3.32 167.4
6
66.98
4
6 Areya Tetradanr
648.6 259.44 309.43 123.772 209.35 83.74 40.03
2 32.34 0 3.05 1.22 59.65 23.86
7 Bagru Bagru 2596.7
3 1038.69 756.54 302.616 636.85 254.74
47.87
6 15.82
482.45
2 73.99 29.596
157.3
6
62.94
4
8 Bagru Chanpi
839.37 335.748 181 72.4 100.89 40.356 32.04
4 44.26 234.06 7.55 3.02 0 0
9 Bagru Korgo 1777.8
4 711.136 164.5 65.8 136.06 54.424
11.37
6 17.29 570.38 11.82 4.728 16.2 6.48
10 Bagru Patratu 1303.1
6 521.264 767.71 307.084 706.8 282.72
24.36
4 7.93 0 60.17 24.068
208.5
4
83.41
6
11 Bethat Anandpur
583.72 233.488 206.35 82.54 167.72 67.088 15.45
2 18.72 0 16.25 6.5 48.7 19.48

136
12 Bethat Bethat 1163.4
3 465.372 611.85 244.74 513.58
205.43
2
39.30
8 16.06 0 25.4 10.16
112.8
5 45.14
13 Bethat Bhusar 1742.6
9 697.076 439.82 175.928 309.57
123.82
8 52.1 29.61 319.26 42.29 16.916 5.75 2.3
14 Bethat Hesapiri
553.89 221.556 176.05 70.42 75.39 30.156 40.26
4 57.18 0 145.1 58.04 189.4 75.76
15 Bethat Lawagain
415.11 166.044 212.3 84.92 178.16 71.264 13.65
6 16.08 0 6.2 2.48 31.1 12.44
16 Bethat Patachha
246.83 98.732 273.4 109.36 147.38 58.952 50.40
8 46.09 0 4 1.6 14.5 5.8
17
Deodari
ya Bahabar 1167.9
2 467.168 140.26 56.104 58.32 23.328
32.77
6 58.42 427.16 4.5 1.8 26.93
10.77
2
18
Deodari
ya Deodariya 3258.9
8 1303.59
2632.5
2
1053.00
8
1182.9
2
473.16
8
579.8
4 55.07 800 10.3 4.12 48.19
19.27
6
19
Deodari
ya Jogiara 506.02 202.408 138.93 55.572 133.5 53.4 2.172 3.91 80.8 4.2 1.68 159.2
6
63.70
4
20
Deodari
ya Khariya 2817.2
8 1126.91
1350.5
6 540.224
1230.5
2
492.20
8
48.01
6 8.89 606.88 6.27 2.508 51.04
20.41
6
21
Deodari
ya Kocha 788.42 315.368 435.99 174.396 419.57 167.82
8 6.568 3.77
124.16
8 0 0 50.22
20.08
8
22
Deodari
ya lawadag 900.01 360.004 383.09 153.236 366.04 146.41
6 6.82 4.45 200 7.14 2.856 20.2 8.08
23
Deodari
ya Uldag 2179.4
5 871.78 619.61 247.844 578.56
231.42
4 16.42 6.63
600.00
8 9.1 3.64 74.82
29.92
8
24 Hisri Agardih
581.83 232.732 246.15 98.46 180.83 72.332 26.12
8 26.54 81.796 0 0 3.42 1.368

137
25 Hisri Barchaogain 1007.7
1 403.084 233.23 93.292 176.35 70.54
22.75
2 24.39
241.61
6 8.35 3.34 57.25 22.9
26 Hisri Barwatoli
52.87 21.148 45.51 18.204 37.95 15.18 3.024 16.61 0 3.13 1.252 2.76 1.104
27 Hisri Chhotchorgain
754.94 301.976 163.4 65.36 150.01 60.004 5.356 8.19 179.14 2 0.8 19.43 7.772
28 Hisri Hisri
2612.7 1045.08 894.2 357.68 828.38 331.35
2
26.32
8 7.36
378.45
2 47.08 18.832 109.4 43.76
29 Hisri Jamhre
422.07 168.828 218.98 87.592 190.33 76.132 11.46 13.08 0 5 2 36.17 14.46
8
30 Hisri Jogiara
647.67 259.068 349.31 139.724 159.46 63.784 75.94 54.35 109.8 1 0.4 24.68 9.872
31 Hisri Marlle
643.74 257.496 350.76 140.304 297.05 118.82 21.48
4 15.31 0 10.21 4.084 28.25 11.3
32 Kharki Banpur
884.93 353.972 225.9 90.36 129.09 51.636 38.72
4 42.86 93.976 45.1 18.04 47.4 18.96
33 Kharki Barnag
448.73 179.492 128.55 51.42 21.62 8.648 42.77
2 83.18 20.052 10.1 4.04 62.65 25.06
34 Kharki Bitlaung
267.09 106.836 234.45 93.78 49.97 19.988 73.79
2 78.69 0 14.5 5.8 24.42 9.768
35 Kharki
Chhechhranawa
dih 148.55 59.42 64.57 25.828 53.5 21.4 4.428 17.14 0 5.7 2.28 11.55 4.62
36 Kharki Datma
789.6 315.84 216.72 86.688 151.3 60.52 26.16
8 30.19 69.62 80.3 32.12
114.3
5 45.74
37 Kharki Huahar
80.3 32.12 191.2 76.48 30.8 12.32 64.16 83.89 0 2 0.8 5.71 2.284
38 Kharki Kasiydih
604.2 241.68 149.34 59.736 93.6 37.44 22.29
6 37.32 60.68 74.15 29.66 58.7 23.48
39 Kharki Kharki
552.26 220.904 170.5 68.2 73.6 29.44 38.76 56.83 0 35.25 14.1 51.85 20.74
40 Kharki Kocha
529.17 211.668 178.61 71.444 4.32 1.728 69.71
6 97.58 70.34 16.3 6.52 35.05 14.02
41 Kharki Semardih 1939.0
2 775.608 127.97 51.188 61.44 24.576
26.61
2 51.99 47.792 138.3 55.32 241 96.4

138
42 Nawadih Durhul
632.15 252.86 197.19 78.876 120.45 48.18 30.69
6 38.92 29 90.2 36.08 58.1 23.24
43 Nawadih Nari
862.15 344.86 205.14 82.056 177.12 70.848 11.20
8 13.66 76.72 46.1 18.44 104.4 41.76
44 Nawadih Nawadih
742.03 296.812 242.66 97.064 170.68 68.272 28.79
2 29.66 0 87.6 35.04 117.6 47.04
45 Nawadih Nini
664.61 265.844 170.39 68.156 120.21 48.084 20.07
2 29.45 0 46.25 18.5 93.2 37.28
46 Pakhar Hutap
630.22 252.088 64.55 25.82 33.03 13.212 12.60
8 48.83 89.84 28.87 11.548 145.1 58.04
47 Pakhar Pakhar 8216.6
7 3286.67 80.4 32.16 36.1 14.44 17.72 55.10
2543.2
4 405.1 162.04
286.2
5 114.5
48 Pakhar Salaiya 6840.0
3 2736.01 109.5 43.8 20.64 8.256
35.54
4 81.15
2268.3
8
295.0
5 118.02 227.9 91.16
49 Pakhar Tisiya 1225.2
3 490.092 123.45 49.38 20.18 8.072
41.30
8 83.65
259.73
2 150.7 60.28 136.9 54.76
50
Parhepa
t Hondaga 825.03 330.012 246.75 98.7 149.98 59.992 38.70
8 39.22 0 48.2 19.28 103.7 41.48
51
Parhepa
t Kisko 982.06 392.824 303.71 121.484 228.31 91.324 30.16 24.83 0 104.7 41.88 176.9
5 70.78
52
Parhepa
t Parhepat 1329.7
1 531.884 301.9 120.76 251.46
100.58
4
20.17
6 16.71 0 114.6 45.84
233.0
5 93.22

139
Table.1.7.3 Land Use Pattern
Name of the State:- Jharkhand
Name of the Distrist:- Lohardaga
Area in ha
Name ot the Block: Kuru
S.No
Name of the Gram Panchayat
Name of the Villages covered
Total Geographical Area
Area under Agriculture
Gross Cropped Area (1)
Net Sown Area (2)
Area sown more then once (1-2)
Cropping intensity (%)
Area under Forest
Area under Wasteland
Area under other uses
1
Salgi
Chulhapani 262.29 13.89 9.89 4.00 248.08 0.02 0.30
2 Khamhar 426.50 106.01 100.01 6.00 295.64 5.89 18.96
3 Masiyatu 219.00 69.00 65.00 4.00 124.62 12.39 12.86
4 Rocho 588.72 491.05 480.00 11.05 12.89 33.54 45.17
5 Dhawra 835.90 326.78 310.00 16.78 449.81 13.20 46.11
6 Salgi 1527.00 920.11 875.00 45.11 416.54 190.81
7
Barkichanpi
Barkichanpi 256.45 220.27 195.00 25.27 48.16 4.02 2.00
8 Chund 324.73 246.15 227.00 19.15 22.31 5.16 51.11
9 Dunabg 566.66 122.13 101.00 21.13 324.66 5.69 114.18
10 Banduwa 296.10 102.17 91.50 10.67 167.26 2.50 24.15
11 Chotkichanpi 188.20 168.73 158.00 10.73 0.00 1.11 18.36
12 Jario 184.06 128.62 117.00 11.62 0.00 5.36 50.13
13 Hotwar 179.94 139.06 127.06 12.00 30.82 2.89 7.17
14 Kundgarha 319.00 126.77 116.77 10.00 174.17 8.17 9.00
15
Sundru
Sundru 276.64 123.75 115.75 8.00 125.19 0.00 27.70
16 Kamle 242.76 151.52 141.00 10.52 60.24 6.31 24.69
17 Bishramgarh 388.68 202.05 188.67 13.38 104.69 0.00 81.94
18 Oppa 529.46 272.08 231.00 41.08 177.56 14.33 65.49
19 Sukumar 277.04 177.73 153.00 24.73 6.68 85.80 6.83
20 Jima Jima 763.52 749.81 710.00 39.81 39.81 0.00 13.71

140
21 Chandu 143.62 99.96 90.00 9.96 9.96 0.00 25.62
22 Tiko 423.52 167.21 156.00 11.21 11.21 90.34 124.37
23
Chiri
Chiri 412.13 298.98 252.00 46.98 16.98 33.11 51.38
24 Kadak 563.42 481.89 447.00 34.89 34.89 72.00 9.53
25
Lawagain
Lawagain 717.56 545.11 505.85 39.26 39.26 8.09 20.21
26 Nantilo 242.63 224.74 205.00 19.74 19.74 0.00 17.89
27 Jangi 136.00 103.57 92.00 11.57 11.51 0.00 32.43
28
Kolsimri
Kolsimri 633.40 565.33 488.00 77.33 0.00 41.75 26.32
29 Umri 492.75 409.01 372.00 37.01 1.20 71.50 11.04
30 Sinjo 91.46 82.96 71.96 11.00 0.00 1.32 7.18
31 Bardih 144.20 101.55 85.65 15.90 0.00 5.16 10.49
32 Sukurhutu 232.95 214.40 182.00 32.40 1.78 2.83 13.94
33
Tati
Tati 561.65 416.56 356.56 60.00 6.78 76.98 61.33
34 Taku 208.16 181.81 146.81 35.00 14.81 0.00 11.54
35 Kundo 454.04 168.07 153.07 15.00 181.96 25.72 78.29
36 Doba 474.01 294.57 264.22 30.35 77.78 36.62 65.04
37 Jido 175.10 146.20 132.10 14.10 8.05 5.97 14.81
38 Kuru kuru 574.18 447.27 387.29 59.98 0.00 62.12 64.79
39
Pandra
Pandra 278.38 222.27 162.27 60.00 0.00 9.32 46.79
40 Chetar 88.43 47.96 41.89 6.07 0.00 0.00 40.47
41 Jilling 91.85 75.46 69.39 6.07 0.00 8.13 8.26
42 Maradih 158.96 106.29 94.29 12.00 0.00 2.83 49.84
43
Chandlaso
Chandlaso 268.04 229.36 205.36 24.00 0.00 2.14 15.50
44 Henjla 428.97 254.13 228.13 26.00 118.98 7.48 48.38
45 Kokar 313.00 231.67 205.67 26.00 43.14 5.77 32.42
46 Chitakoni 129.68 125.64 113.00 12.64 0.00 0.00 4.04
47 Rajrom 69.63 56.23 47.63 8.60 0.00 2.72 14.42
48
Urumuru
Urumuru 264.61 224.14 183.26 40.88 0.00 0.00 40.47
49 Merle 135.49 110.82 10.82 100.00 0.00 7.36 17.31
50 Barmara 565.31 299.94 264.94 35 121.2 47.02 97.09
51 Makandu 325.01 225.35 205.35 20 0 39.16 60.5
52 Bardih 114.44 61.21 52.21 9 46.54 5.44 1.25
53 Hurhad 143.88 117.59 103.59 14 0 5.02 21.27

141
54
Jingi
Jingi 410.09 299.06 269.06 30 51.6 10.64 48.74
55 Chadra 117.13 101.09 91 10.09 14.44 1.68 3.71
56 Jonjro 482 336.19 303.19 33 102.54 10.46 32.81
57 Makra 132.4 102.17 92 10.17 0 1.79 28.44
58 Rahe 107.41 48.5 40.5 8 46.54 4.65 7.72
59 Tan 392.65 288.51 258.51 30 51.6 19.64 32.9
60
Kakargarh
Kakargarh 295.24 265.27 242.27 23 13.48 0 16.49
61 Fulsuri 361.1 282.85 252 30.85 35.61 10.25 32.39
62 Lapur 221.97 188.52 170.52 18 20.64 0.09 11.95
63 Chirna 283.75 177.39 163.39 14 50.37 4.76 51.26
64 Mahugaon 120.06 105.69 94.69 11 0 0 14.37
65 Jajgunda 109.08 100.73 90.73 10 0 1.67 6.68
21741.99 14490.90 12955.82 1535.08 0.00 3981.72 947.91 2242.34

142
Table.1.7.4 Land Use Pattern
Name of the State:- Jharkhand
Name of the Distrist:- Lohardaga
Area in ha
Name ot the Block: Bhandra
S.No
Name of the Gram Panchaya
t
Name of the Villages
covered Total Geographical
Area
Area under Agriculture
Gross Cropped Area (1)
Net Sown Area (2)
Area sown more then once (1-2)
Cropping intensity (%)
Area under Forest
Area under Wasteland
Area under other uses
1
Akashi
Akashi 2369.63 1999.04 1499.28 499.76 110.31 251.28 9.00
2 Kumhariya 973.13 726.08 551.82 174.26 0.00 239.05 8.00
3 Banda 1081.05 586.35 381.13 205.22 0.00 488.70 6.00
4
Jamgain
Jamgain 1261.04 877.28 575.07 302.21 0.00 373.78 10.00
5 Jhiko 1003.06 684.97 444.00 240.97 0.00 309.09 9.00
6 Pandariya 685.83 531.63 350.00 181.63 0.00 121.20 6.00
7 Dumri 651.58 432.59 284.00 148.63 0.00 313.49 5.50
8 Kota 311.45 200.46 137.00 63.46 0.00 108.49 2.50
9 Bitipi 790.07 539.07 370.00 169.07 0.00 248.00 3.00
10
Gadarpo
Porha 1056.60 769.45 577.08 192.37 2.46 278.69 6.00
11 Gadarpo 1029.16 685.76 548.60 137.16 1.46 334.94 7.00
12 Palmi 1554.33 1033.73 825.72 208.01 0.00 512.60 8.00
13 Amdari 688.57 405.51 280.35 125.16 2.61 277.45 3.00
14 Tilsiri 477.47 376.94 245.01 131.93 0.00 98.03 2.50
15 Semra 518.75 386.62 270.63 115.99 0.00 130.63 1.50

143
16 Dhanamunji 688.57 377.53 345.01 32.52 0.00 307.00 4.00
17
Bhouro
Bhouro 2304.53 1254.23 1003.38 250.85 7.50 999.80 8.00
18 Soranda 1312.14 933.08 746.46 186.62 17.76 254.50 7.00
19 Balsota 568.93 324.51 259.60 64.91 240.44 4.00
20
Masmano
Masmano 1558.59 1131.07 735.19 395.88 17.86 401.66 8.00
21 Toto 1414.98 705.28 425.82 279.46 0.00 702.70 7.00
22 Burka 833.13 814.93 570.45 244.48 0.60 63.60 4.00
23 Bedal 1272.33 933.00 653.66 279.34 37.40 295.13 6.00
24
Udrangi
Udrangi 1001.51 609.52 457.14 152.38 26.15 360.84 5.00
25 Ambera 603.20 399.49 307.60 91.89 0.00 200.71 3.00
26 Hati 626.43 324.96 243.72 81.24 0.00 298.47 3.00
27 Bhesmundo 1266.05 810.93 567.65 243.28 0.00 450.12 5.00
28 Baimari 368.40 138.79 104.09 34.70 0.00 228.11 1.50
29
Bargain
Baragain 738.96 344.76 231.00 113.76 0.00 392.20 2.00
30 Kanjo 642.53 453.78 310.00 143.78 0.00 185.75 3.00
31 Khwas Khijri 751.10 424.59 233.00 191.59 6.90 316.11 3.50
32 Bamandiha 411.06 213.35 140.00 73.35 0.00 195.25 3.00
33 Jharochtti 224.64 151.49 89.00 62.49 0.00 71.15 2.00
34 Kundo 737.44 456.15 229.00 227.15 0.00 276.29 3.00
35
Bhitha
Bhitha 1057.38 916.02 824.91 91.11 0.00 134.36 7.00
36 Kachmachi 710.18 394.53 355.07 39.46 6.80 305.85 3.00
37 Dhobali 266.93 122.08 109.87 12.21 0.00 143.35 1.00
38 Teterpoka 375.05 194.78 175.30 19.48 0.00 178.77 1.50
39 Makunda 511.25 383.64 345.27 38.37 0.00 125.61 2.00
40 Nagri 398.26 291.81 262.62 29.19 0.00 104.95 1.50

144
41
Bhandra
Bhandra 1240.79 766.54 613.23 153.31 0.00 468.25 6.00
42 Kaspur 2168.97 524.72 419.77 104.95 0.00 1636.25 8.00
43 Nawadih 206.99 144.88 115.90 28.98 0.00 60.02 2.00
44 Pajhri 426.60 201.43 161.14 40.29 0.00 222.76 2.50
45 Wakil Ambwa 181.12 141.32 113.05 28.27 0.00 38.30 1.50
Total 39319.76 25118.67 18487.5
9 6631.1
2 0.00 237.81 13743.72 205.00
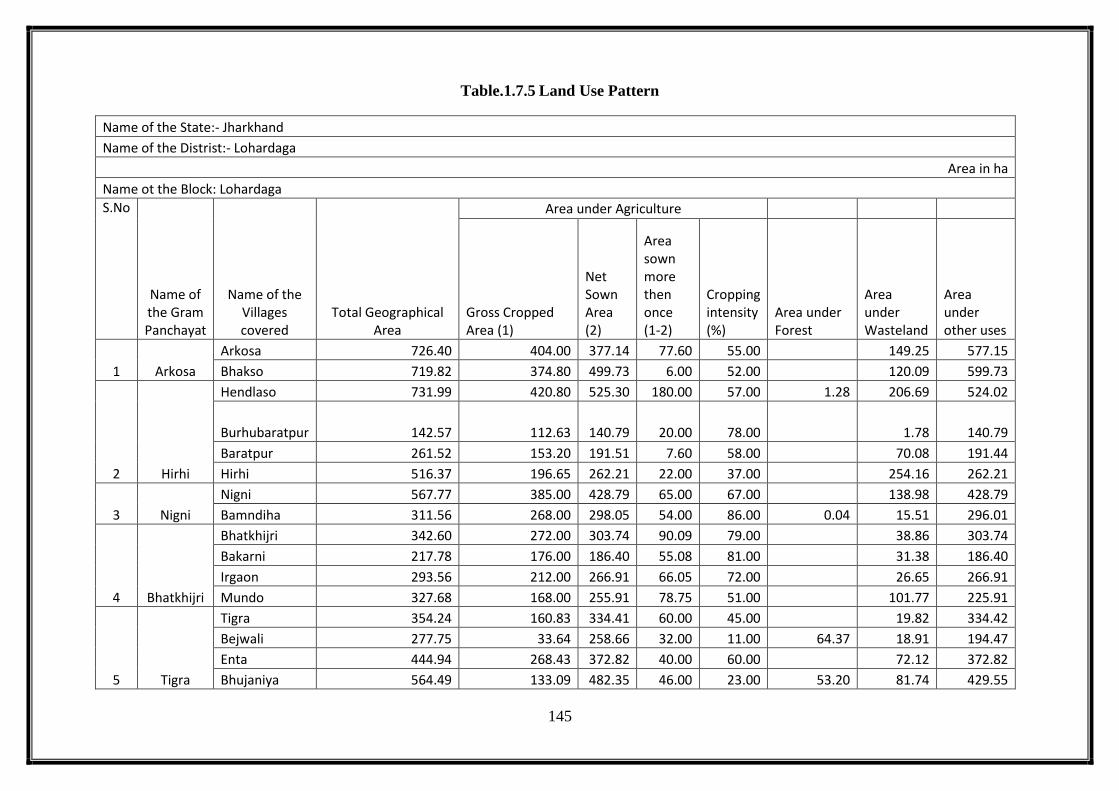
145
Table.1.7.5 Land Use Pattern
Name of the State:- Jharkhand
Name of the Distrist:- Lohardaga
Area in ha
Name ot the Block: Lohardaga
S.No
Name of the Gram Panchayat
Name of the Villages covered
Total Geographical Area
Area under Agriculture
Gross Cropped Area (1)
Net Sown Area (2)
Area sown more then once (1-2)
Cropping intensity (%)
Area under Forest
Area under Wasteland
Area under other uses
1 Arkosa
Arkosa 726.40 404.00 377.14 77.60 55.00 149.25 577.15
Bhakso 719.82 374.80 499.73 6.00 52.00 120.09 599.73
2 Hirhi
Hendlaso 731.99 420.80 525.30 180.00 57.00 1.28 206.69 524.02
Burhubaratpur 142.57 112.63 140.79 20.00 78.00 1.78 140.79
Baratpur 261.52 153.20 191.51 7.60 58.00 70.08 191.44
Hirhi 516.37 196.65 262.21 22.00 37.00 254.16 262.21
3 Nigni
Nigni 567.77 385.00 428.79 65.00 67.00 138.98 428.79
Bamndiha 311.56 268.00 298.05 54.00 86.00 0.04 15.51 296.01
4 Bhatkhijri
Bhatkhijri 342.60 272.00 303.74 90.09 79.00 38.86 303.74
Bakarni 217.78 176.00 186.40 55.08 81.00 31.38 186.40
Irgaon 293.56 212.00 266.91 66.05 72.00 26.65 266.91
Mundo 327.68 168.00 255.91 78.75 51.00 101.77 225.91
5 Tigra
Tigra 354.24 160.83 334.41 60.00 45.00 19.82 334.42
Bejwali 277.75 33.64 258.66 32.00 11.00 64.37 18.91 194.47
Enta 444.94 268.43 372.82 40.00 60.00 72.12 372.82
Bhujaniya 564.49 133.09 482.35 46.00 23.00 53.20 81.74 429.55
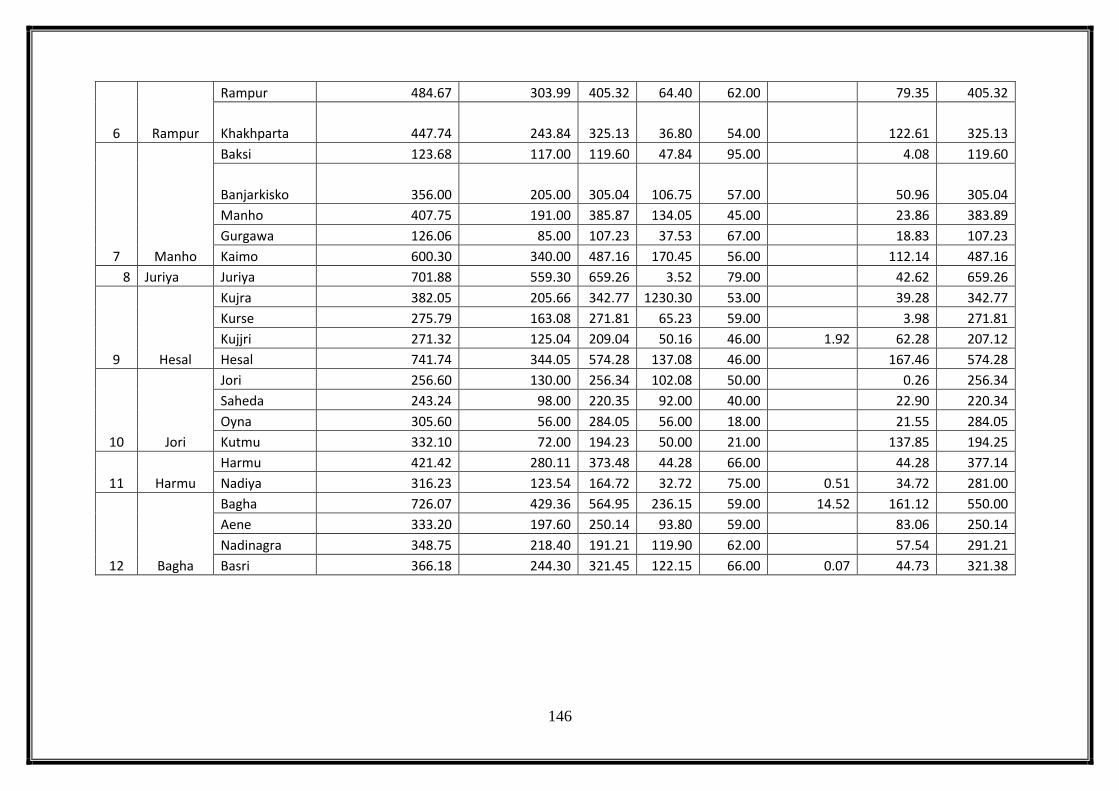
146
6 Rampur
Rampur 484.67 303.99 405.32 64.40 62.00 79.35 405.32
Khakhparta 447.74 243.84 325.13 36.80 54.00 122.61 325.13
7 Manho
Baksi 123.68 117.00 119.60 47.84 95.00 4.08 119.60
Banjarkisko 356.00 205.00 305.04 106.75 57.00 50.96 305.04
Manho 407.75 191.00 385.87 134.05 45.00 23.86 383.89
Gurgawa 126.06 85.00 107.23 37.53 67.00 18.83 107.23
Kaimo 600.30 340.00 487.16 170.45 56.00 112.14 487.16
8 Juriya Juriya 701.88 559.30 659.26 3.52 79.00 42.62 659.26
9 Hesal
Kujra 382.05 205.66 342.77 1230.30 53.00 39.28 342.77
Kurse 275.79 163.08 271.81 65.23 59.00 3.98 271.81
Kujjri 271.32 125.04 209.04 50.16 46.00 1.92 62.28 207.12
Hesal 741.74 344.05 574.28 137.08 46.00 167.46 574.28
10 Jori
Jori 256.60 130.00 256.34 102.08 50.00 0.26 256.34
Saheda 243.24 98.00 220.35 92.00 40.00 22.90 220.34
Oyna 305.60 56.00 284.05 56.00 18.00 21.55 284.05
Kutmu 332.10 72.00 194.23 50.00 21.00 137.85 194.25
11 Harmu
Harmu 421.42 280.11 373.48 44.28 66.00 44.28 377.14
Nadiya 316.23 123.54 164.72 32.72 75.00 0.51 34.72 281.00
12 Bagha
Bagha 726.07 429.36 564.95 236.15 59.00 14.52 161.12 550.00
Aene 333.20 197.60 250.14 93.80 59.00 83.06 250.14
Nadinagra 348.75 218.40 191.21 119.90 62.00 57.54 291.21
Basri 366.18 244.30 321.45 122.15 66.00 0.07 44.73 321.38

147
Table.1.7.6 Land Use Pattern
Name of the State : Jharkhand
Name of the District : Lohardaga
Name of the Block : Senha
Area in Ha
Name of the gram Panchayt
Name of the villages Covered
Code of villages Covered
Total Geographical Area
Area under Agriculture
Area under Forest
Area under
Wasteland
Ares under
other uses Gross Cropped
Area (1)
Net Sown
Area (2)
Area sown more than once (1-2)
Cropping Intensity
(%)
Alaudi
arra 814.83 482.76 100.93 35.50 228.84 67.85 35.38
urhu 1969.31 932.32 80.27 20.04 935.35 80.03 21.61
sake 313.47 327.23 70.01 20.17 920.19 51.78 4.27
Hesway 1220.13 909.71 86.9 30.78 256.95 35.09 18.44
chau 714.93 328.23 68.03 39.87 368.65 8 10.05
churku 608.21 539.02 93.8 20.77 37.32 15.45 16.42
chandwa 898.19 439.1 109.6 10.79 294.88 154.21 10.00
gargaun 1143.27 498.38 140.16 16.78 623.50 11.09 10.30
alaudi 775.09 696.4 100.94 20.3 48.50 12.5 17.69
Total 8457.43 5153.15 850.64 215.00 3714.18 436 144.16
Murki Torar
manhe 753.98 765.69 137.4 35.5 158.76 115.43 14.10
dandu 656.63 467.7 87 20.69 82.11 81.22 16.60
chwkni 667.08 462.19 91.4 27.41 150.40 40.77 13.72
bansari 713.14 622.11 308.64 76.51 0.00 46.98 44.05
gobersela 337.05 293.05 167.3 125.43 0.00 13.1 30.90
murki 744.28 704.12 243.07 150.89 0.00 23.32 16.84
torar 254.38 239.75 105.1 25.95 0.00 58.13 56.50

148
Total 12583.97 8707.76 1990.55 677.38 4105.45 814.95 336.87
Buti
Kandra 920.26 583.21 101.25 23.89 179.05 110.98 470.20
jmira 490.6 388.7 101.2 14.02 0.00 74.22 27.68
Jhakhara 656.51 564.82 120 11.73 0.00 37.4 60.99
chamru 433.42 262.4 80.34 58.8 0.00 30.7 20.24
Mentgara 575.75 472.57 280.67 13.2 62.30 29.36 11.52
buti 1047.58 895.27 140.38 9.87 46.43 65.37 40.51
Total 4124.12 3166.97 823.84 131.51 287.78 348.03 631.14
Bhargaun
Doka 706.94 620.22 185.33 56.84 0.00 48.62 38.10
Kundgari 919.48 720.44 390 49.5 102.00 66.18 30.86
Parhi 1022.35 811.9 77.5 30.73 102.50 65.33 42.62
Bhargaun 1146.31 1075.54 128.51 10.1 0.00 70.28 40.49
Total 3795.08 3228.1 781.34 147.17 204.50 250.41 152.07
Arhu
Jogna 752.68 694.04 205.24 104.92 49.00 23.6 35.04
Kalhepath 781.77 698.32 225.34 48.3 0.00 41.3 42.15
Arhu 1289.54 1022.80 180.00 14.31 155.57 48.60 62.57
Total 2823.99 2415.16 610.58 167.53 204.57 113.50 139.76
Senha Senha 2858.98 2337.27 471.53 66.82 166.05 205.33 150.33
Total 2858.98 2337.27 471.53 66.82 166.05 205.33 150.33
Badla
Chandkopa 1074.66 893.90 469.76 409.44 0.00 90.55 90.21
Arahansa 599.69 397.55 315.95 96.81 0.00 150.91 51.23
Badla 2343.51 1761.19 709.81 462.51 320.00 391.15 191.17
4017.86 3052.64 1495.52 968.76 320.00 632.61 332.61
Dandu
Chitri 830.47 691.43 414.80 78.60 0.00 58.65 80.39
Ekaguri 1376.69 870.89 522.40 168.40 11.36 190.82 303.72
Dardu 1040.35 638.67 472.40 190.50 18.47 72.72 310.49
Total 3247.51 2200.99 1409.60 437.50 29.83 322.19 694.60
Torar
Chatkpur 468.82 380.13 258.41 48.50 0.00 55.75 32.94
Serenghatu 607.47 353.79 229.90 81.50 0.00 100.81 152.87

149
Sithio 1170.25 862.24 560.40 105.10 12.56 102.85 192.60
Barhi 1286.56 914.06 507.60 178.50 15.15 155.85 201.50
Torar 650.39 530.20 360.99 63.73 0.00 59.70 60.49
Total 4183.49 3040.42 1917.30 477.33 27.71 474.96 640.40
Jhaljmira
datri 1120.51 702.97 568.50 148.40 40.33 150.81 226.40
Pali 269.79 702.97 568.50 148.40 40.30 150.81 226.40
Patlo 760.87 571.99 240.94 233.51 0.00 60.25 128.63
Ghata 651.03 493.06 424.44 62.92 0.00 64.90 93.07
Gageya 455.58 341.75 301.85 236.39 0.00 47.42 66.41
Jhaljmira 2323.71 901.04 460.29 361.46 1033.97 120.37 268.23
Total 5581.49 3713.78 2564.52 1191.08 1114.60 594.56 1009.14
Ugara
Korambey 2197.10 1062.40 601.04 103.80 547.81 480.20 106.25
Merho 1038.11 716.47 470.15 113.56 60.55 218.48 103.16
Murpa 766.51 497.44 313.01 86.85 76.70 157.02 112.03
Ichri 418.56 342.81 228.26 182.35 0.00 25.15 50.96
Tengariya 424.60 322.26 236.39 76.03 0.00 60.24 42.10
Ugara 1588.83 1149.48 642.23 74.00 239.50 37.20 162.65
Total 6433.71 4090.86 2491.08 636.59 924.56 978.29 577.15
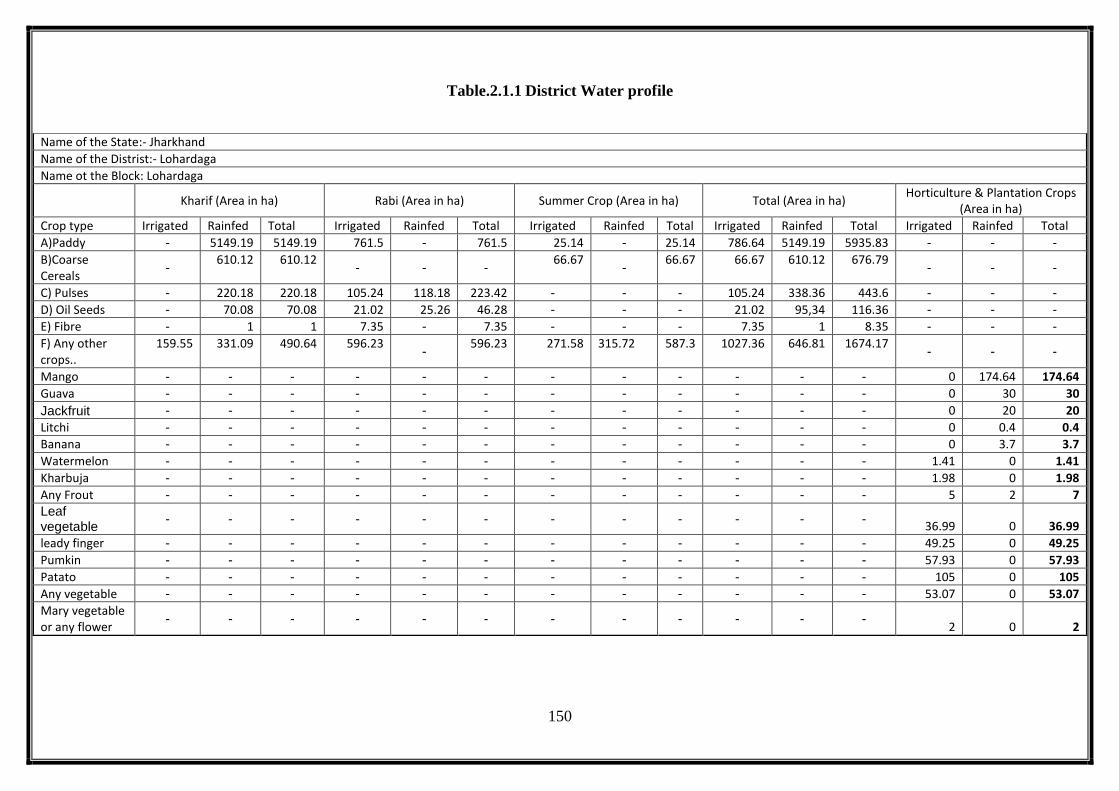
150
Table.2.1.1 District Water profile
Name of the State:- Jharkhand
Name of the Distrist:- Lohardaga
Name ot the Block: Lohardaga
Kharif (Area in ha) Rabi (Area in ha) Summer Crop (Area in ha) Total (Area in ha) Horticulture & Plantation Crops
(Area in ha)
Crop type Irrigated Rainfed Total Irrigated Rainfed Total Irrigated Rainfed Total Irrigated Rainfed Total Irrigated Rainfed Total
A)Paddy - 5149.19 5149.19 761.5 - 761.5 25.14 - 25.14 786.64 5149.19 5935.83 - - -
B)Coarse Cereals
- 610.12 610.12
- - - 66.67
- 66.67 66.67 610.12 676.79
- - -
C) Pulses - 220.18 220.18 105.24 118.18 223.42 - - - 105.24 338.36 443.6 - - -
D) Oil Seeds - 70.08 70.08 21.02 25.26 46.28 - - - 21.02 95,34 116.36 - - -
E) Fibre - 1 1 7.35 - 7.35 - - - 7.35 1 8.35 - - -
F) Any other crops..
159.55 331.09 490.64 596.23 -
596.23 271.58 315.72 587.3 1027.36 646.81 1674.17 - - -
Mango - - - - - - - - - - - - 0 174.64 174.64
Guava - - - - - - - - - - - - 0 30 30
Jackfruit - - - - - - - - - - - - 0 20 20
Litchi - - - - - - - - - - - - 0 0.4 0.4
Banana - - - - - - - - - - - - 0 3.7 3.7
Watermelon - - - - - - - - - - - - 1.41 0 1.41
Kharbuja - - - - - - - - - - - - 1.98 0 1.98
Any Frout - - - - - - - - - - - - 5 2 7
Leaf vegetable
- - - - - - - - - - - - 36.99 0 36.99
leady finger - - - - - - - - - - - - 49.25 0 49.25
Pumkin - - - - - - - - - - - - 57.93 0 57.93
Patato - - - - - - - - - - - - 105 0 105
Any vegetable - - - - - - - - - - - - 53.07 0 53.07
Mary vegetable or any flower
- - - - - - - - - - - - 2 0 2
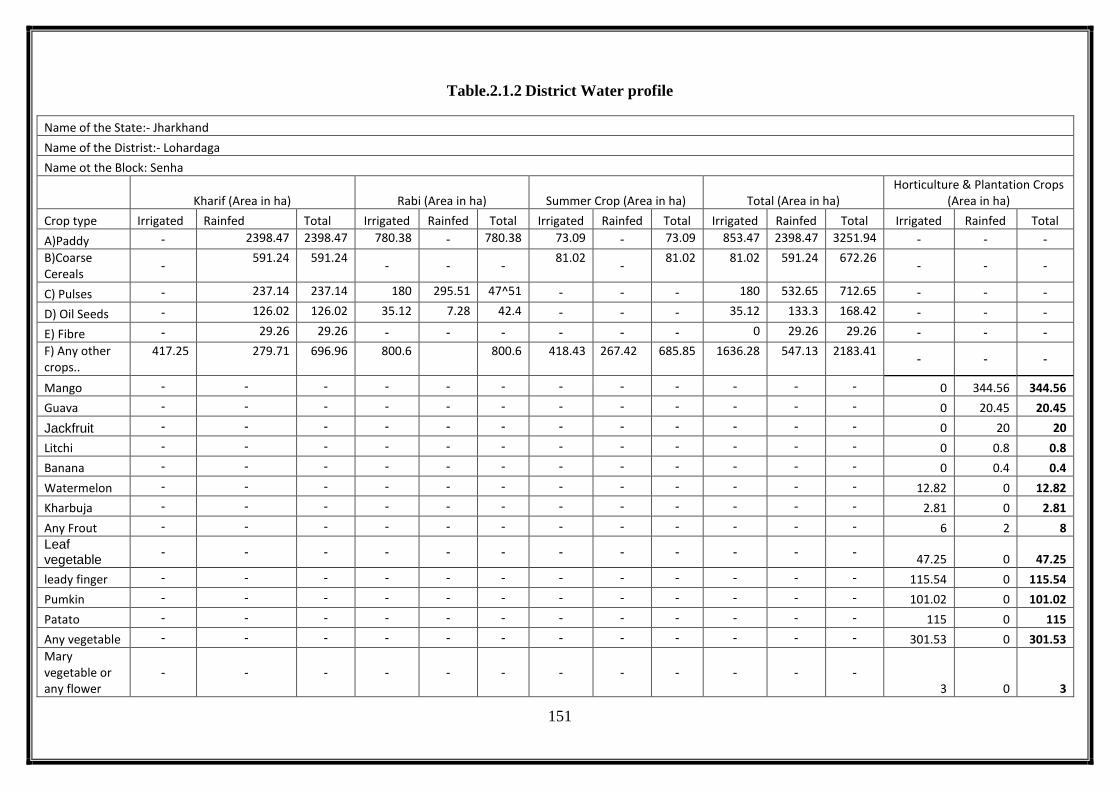
151
Table.2.1.2 District Water profile
Name of the State:- Jharkhand
Name of the Distrist:- Lohardaga
Name ot the Block: Senha
Kharif (Area in ha) Rabi (Area in ha) Summer Crop (Area in ha) Total (Area in ha) Horticulture & Plantation Crops
(Area in ha)
Crop type Irrigated Rainfed Total Irrigated Rainfed Total Irrigated Rainfed Total Irrigated Rainfed Total Irrigated Rainfed Total
A)Paddy - 2398.47 2398.47 780.38 - 780.38 73.09 - 73.09 853.47 2398.47 3251.94 - - -
B)Coarse Cereals
- 591.24 591.24
- - - 81.02
- 81.02 81.02 591.24 672.26
- - -
C) Pulses - 237.14 237.14 180 295.51 47^51 - - - 180 532.65 712.65 - - -
D) Oil Seeds - 126.02 126.02 35.12 7.28 42.4 - - - 35.12 133.3 168.42 - - -
E) Fibre - 29.26 29.26 - - - - - - 0 29.26 29.26 - - -
F) Any other crops..
417.25 279.71 696.96 800.6 800.6 418.43 267.42 685.85 1636.28 547.13 2183.41 - - -
Mango - - - - - - - - - - - - 0 344.56 344.56
Guava - - - - - - - - - - - - 0 20.45 20.45
Jackfruit - - - - - - - - - - - - 0 20 20
Litchi - - - - - - - - - - - - 0 0.8 0.8
Banana - - - - - - - - - - - - 0 0.4 0.4
Watermelon - - - - - - - - - - - - 12.82 0 12.82
Kharbuja - - - - - - - - - - - - 2.81 0 2.81
Any Frout - - - - - - - - - - - - 6 2 8 Leaf vegetable
- - - - - - - - - - - - 47.25 0 47.25
leady finger - - - - - - - - - - - - 115.54 0 115.54
Pumkin - - - - - - - - - - - - 101.02 0 101.02
Patato - - - - - - - - - - - - 115 0 115
Any vegetable - - - - - - - - - - - - 301.53 0 301.53
Mary vegetable or any flower
- - - - - - - - - - - -
3 0 3

152
Table.2.1.3 District Water profile
Name of the State:- Jharkhand
Name of the Distrist:- Lohardaga
Name ot the Block: Bhandra
Kharif (Area in ha) Rabi (Area in ha) Summer Crop (Area in ha) Total (Area in ha) Horticulture & Plantation Crops (Area in
ha)
Crop type Irrigated Rainfed Total Irrigated Rainfed Total Irrigated Rainfed Total Irrigated Rainfed Total Irrigated Rainfed Total
A)Paddy - 3687.78 3687.78 1515.62 - 1515.62 17.2 - 17.2 1532.82 3687.78 5220.6 - - -
B)Coarse Cereals
- 914.02 914.02 152.4
- 152.4 166.6
- 166.6 319 914.02 1233.02
- - -
C) Pulses - 355.2 355.2 1606.05 47 1653.05 - - - 1606.05 402.2 2008.25 - - -
D) Oil Seeds - 128.64 128.64 216.9 0.7 217.6 - - - 216.9 129.34 346.24 - - -
E) Fibre - 45.43 45.43 - - - - - - - 45.43 45.43 - - -
F) Any other crops..
803.08 821.38 1624.46 3589.95 -
3589.95 632 242.6 874.6 5025.03 1063.98 6089.01 - - -
Mango - - - - - - - - - - - - 0 525 525
Guava - - - - - - - - - - - - 0 11.35 11.35
Jackfruit - - - - - - - - - - - - 0 30 30
Litchi - - - - - - - - - - - - 0 2.5 2.5
Banana - - - - - - - - - - - - 0 8 8
Watermelon - - - - - - - - - - - - 15 0 15
Kharbuja - - - - - - - - - - - - 0 0 0
Any Frout - - - - - - - - - - - - 1 3.2 4.2
Leaf vegetable
- - - - - - - - - - - - 102.65 0 102.65
leady finger - - - - - - - - - - - - 34.35 0 34.35
Pumkin - - - - - - - - - - - - 114.5 0 114.5
Patato - - - - - - - - - - - - 150 0 150
Any vegetable - - - - - - - - - - - - 130.3 0 130.3
Mary vegetable or any flower
- - - - - - - - - - - -
1 0 1

153
Table.2.1.4 District Water profile
Name of the State:- Jharkhand
Name of the Distrist:- Lohardaga
Name ot the Block: Bhandra
Kharif (Area in ha) Rabi (Area in ha) Summer Crop (Area in ha) Total (Area in ha) Horticulture & Plantation Crops (Area in ha)
Crop type Irrigated Rainfed Total Irrigated Rainfed Total Irrigated Rainfed Total Irrigated Rainfed Total Irrigated Rainfed Total
A)Paddy
67.23 2546.4 2613.63 553.51 553.51 36.59 36.59 657.33 2546.4 3203.73 - - 67.23
B)Coarse Cereals
327.36 327.36 16.83 97.55 114.38 30.77 30.77 47.6 424.91 472.51 0.00 - -
C) Pulses
363.83 363.83 102.65 257.28 359.93 0 102.65 621.11 723.76 - - -
D) Oil Seeds
149.5 149.5 224.92 37.31 262.23 0 224.92 186.81 411.73 - - -
E) Fibre
31.92 31.92 0 0 0 31.92 31.92 - - -
F) Any other crops..
403.63 111.01 514.64 673.39 10.97 684.36 152.44 295.13 447.57 1229.46 417.11 1646.57 - - -
Mango
- - - - - - - - - - - - 0 330.66 330.66
Guava
- - - - - - - - - - - - 0 1.87 1.87
Jackfruit
- - - - - - - - - - - - 0 40 40
Litchi
- - - - - - - - - - - - 0 0.5 0.5
Banana
- - - - - - - - - - - - 0 1 1
Watermelon
- - - - - - - - - - - - 4.47 0 4.47
Kharbuja
- - - - - - - - - - - - 1.35 0 1.35
Any Frout
- - - - - - - - - - - - 2 1 3
Leaf vegetable
- - - - - - - - - - - - 23.2 0 23.2
leady finger
- - - - - - - - - - - - 135.34 0 135.34
Pumkin
- - - - - - - - - - - - 42.8 0 42.8
Patato
- - - - - - - - 0.00 - - - 115 0 115

154
Table.2.1.5 District Water profile
Crop type Irrigated Rainfed Total Irrigated Rainfed Total Irrigated Rainfed Total Irrigated Rainfed Total Irrigated Rainfed Total
A)Paddy 2591.41 2591.41 388.97 388.97 62.7 62.7 451.67 2591.41 3043.08 - - -
B)Coarse Cereals 316.7 316.7 0 52.76 52.76 52.76 316.7 369.46 - - -
C) Pulses 162.01 162.01 386 335.4 721.4 0 386 497.41 883.41 - - -
D) Oil Seeds 129.05 129.05 91.8 15.25 107.05 0 91.8 144.3 236.1 - - -
E) Fibre 8.34 8.34 0 0 0 8.34 8.34 - - -
F) Any other crops.. 295.21 165.03 460.24 1203.42 19.9 1223.32 813.82 179.07 992.89 2312.45 364 2676.45 - - -
Mango - - - - - - - - - - - - 0 125 125
Guava - - - - - - - - - - - - 0 9.24 9.24
Jackfruit - - - - - - - - - - - - 0 20 20
Litchi - - - - - - - - - - - - 0 2.8 2.8
Banana - - - - - - - - - - - - 0 7.5 7.5
Watermelon - - - - - - - - - - - - 7 0 7
Kharbuja - - - - - - - - - - - - 6.5 0 6.5
Any Frout - - - - - - - - - - - - 2.5 1 3.5
Leaf vegetable - - - - - - - - - - - - 43.05 0 43.05
leady finger - - - - - - - - - - - - 89.85 0 89.85
Pumkin - - - - - - - - - - - - 51 0 51
Patato - - - - - - - - - - - - 105 0 105
Any vegetable - - - - - - - - - - - - 51.8 0 51.8
Mary vegetable or any flower - - - - - - - - - - - - 0.4 0 0.4
Name of the State:- Jharkhand
Name of the Distrist:- Lohardaga
Name ot the Block: Kairo
Horticulture & Plantation Crops (Area in ha)Summer Crop (Area in ha) Total (Area in ha)Rabi (Area in ha)Kharif (Area in ha)

155
Table.2.1.6 District Water profile
Crop type Irrigated Rainfed Total Irrigated Rainfed Total Irrigated Rainfed Total Irrigated Rainfed Total Irrigated Rainfed Total
A)Paddy 36.2 2662.61 2698.81 298.03 298.03 53.67 53.67 387.9 2662.61 3050.51 - - -
B)Coarse Cereals 494.62 494.62 9.06 52.52 61.58 44.8 44.8 53.86 547.14 601 - - -
C) Pulses 323.59 323.59 55.27 138.53 193.8 0 55.27 462.12 517.39 - - -
D) Oil Seeds 148.35 148.35 121.11 20.08 141.19 0 121.11 168.43 289.54 - - -
E) Fibre 32.94 32.94 0 0 0 32.94 32.94 - - -
F) Any other crops.. 442 210.39 652.39 362.59 5.9 368.49 307.38 302.9 610.28 1111.97 519.19 1631.16 - - -
Mango - - - - - - - - - - - - 0 10 10
Guava - - - - - - - - - - - - 0 5 5
Jackfruit - - - - - - - - - - - - 0 40.5 40.5
Litchi - - - - - - - - - - - - 0 0 0
Banana - - - - - - - - - - - - 0 5.5 5.5
Watermelon - - - - - - - - - - - - 0 0 0
Kharbuja - - - - - - - - - - - - 0 0 0
Any Frout - - - - - - - - - - - - 2.5 1 3.5
Leaf vegetable - - - - - - - - - - - - 25.05 0 25.05
leady finger - - - - - - - - - - - - 35.35 0 35.35
Pumkin - - - - - - - - - - - - 20 0 20
Patato - - - - - - - - - - - - 60 0 60
Any vegetable - - - - - - - - - - - - 40 0 40
Mary vegetable or any flower - - - - - - - - - - - - 0 0 0
Name of the State:- Jharkhand
Name of the Distrist:- Lohardaga
Kharif (Area in ha) Rabi (Area in ha) Summer Crop (Area in ha) Total (Area in ha)Horticulture & Plantation Crops (Area in ha)
Name ot the Block: Pesrar

156
Table.2.2.1 District Water profile
SeasonCereal
s
Coarse
CereaisPulses
Oil
Seeds
Fiber
Crops
Any
other
crops
Area
(ha)
Productio
n (qut/yr)
Produc
tivity
or
yield
Cost of
Cultiva
tion
(Rs./ha
Productio
n (qtn/yr)
produc
tiveity
(kgs/h
a)
Cost of
Cultica
tion
(Rs./ha
Productio
n (qtn/yr)
productivei
ty (kgs/ha)
Cost of
Culticati
on
(Rs./ha)
A. kharif 3521.1 837 4202 36 30250 15000 12000 39900 18000 17000 112000 20000 18000
B. Rabi 902.3 46.01
Summer
Horticultura
l &
Total
Rainfed Irrigated Total
Name of the State: Jharkhand
Name of the Distrist: Lohardaga
Name ot the Block: Peshrar
Crop Sown

157
Table.2.2.2 District Water profile
Cereal
s
Coarse
CerealsPulses
Oilsee
ds
Fibre
Crops
Any
other
Crops
Area
(ha)
Productio
n (qtn/yr)
Productivit
y or Yield
(kgs/ha)
Cost of
cultiva
ti on (
Rs./ha)
Productio
n (qtn/yr)Productivity or Yield (kgs/ha)
Cost of
cultivati on
( Rs./ha)
Productio
n (qtn/yr)
Productivit
y or Yield
(kgs/ha)
Cost of
cultivati
on (
Rs./ha)
A. kharif 5102 1267.63 218.92 81.6 52.05 2713.8 54260 20000 18000 59700 25000 22000 113960 22500 20000
B. Rabi 1488.6 0 0 127.13 88.02 0
summer 11.60 113.01 0
Horticultura
l &
Total
Crop Sown Rainfed
Name of the State : Jharkhand
Name of the District : Lohardaga
Name of the Block : kairo
Season
TotalIrrigated

158
Table.2.2.3 District Water profile
Name of the state - JharlhandJharkhand
Name of the District- LohardagaLohardaga
Name of the Block - BhandraBhandra
Cereal
s
Coarse
cerealsPulses
Oil
Seeds
Fibrecr
ops
Anyoth
er
crops
Area (ha)Productio
n (qtn/yr)
Productivit
y or yleld
(Kgs/ha)
Cost
of
Cultiva
tion
Productio
n (qtn/yr)Productivity (kgs/ha)
Cost of
Cultivation
(Rs./ha)
Productio
n (qtn/yr)
Productivit
y (kgs/ha)
Cost of
cultivati
on
(Rs.ha)
A. Khafir 4900 115 380 245 65 5705 &
B. Rabi 997.50 1855 1627 30 4509.50 &
Total (Area in ha)
Season
Crop Sown Rabi (Area in ha) Summer crop (Area in ha)
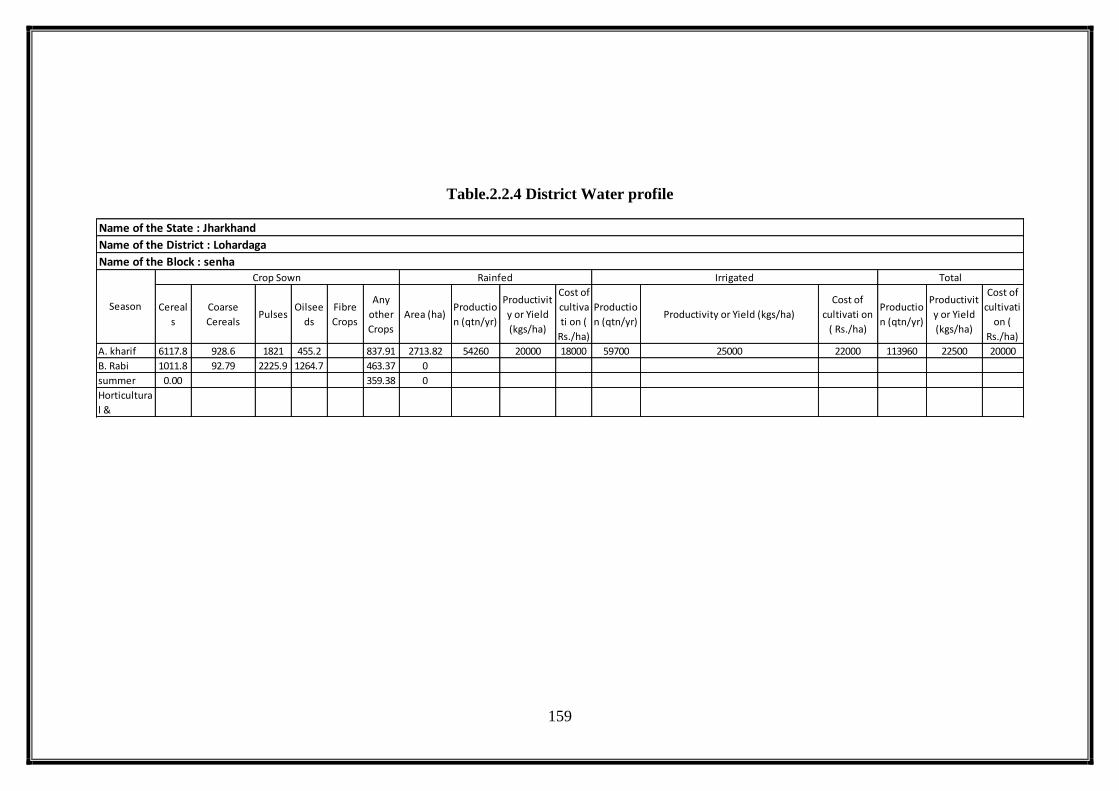
159
Table.2.2.4 District Water profile
Cereal
s
Coarse
CerealsPulses
Oilsee
ds
Fibre
Crops
Any
other
Crops
Area (ha)Productio
n (qtn/yr)
Productivit
y or Yield
(kgs/ha)
Cost of
cultiva
ti on (
Rs./ha)
Productio
n (qtn/yr)Productivity or Yield (kgs/ha)
Cost of
cultivati on
( Rs./ha)
Productio
n (qtn/yr)
Productivit
y or Yield
(kgs/ha)
Cost of
cultivati
on (
Rs./ha)
A. kharif 6117.8 928.6 1821 455.2 837.91 2713.82 54260 20000 18000 59700 25000 22000 113960 22500 20000
B. Rabi 1011.8 92.79 2225.9 1264.7 463.37 0
summer 0.00 359.38 0
Horticultura
l &
Total
Name of the State : Jharkhand
Name of the District : Lohardaga
Name of the Block : senhaCrop Sown Rainfed Irrigated
Season

160
Table.2.2.5 District Water profile
SeasonCereal
s
Coarse
CereaisPulses
Oil
Seeds
Fiber
Crops
Any
other
crops
Area (ha)Productio
n (qut/yr)
Productivit
y or yield
(Kgs/ha)
Cost of
Cultiva
tion
(Rs./ha
)
Productio
n (qtn/yr)productiveity (kgs/ha)
Cost of
Cultication
(Rs./ha)
Productio
n (qtn/yr)
productivei
ty (kgs/ha)
Cost of
Culticati
on
(Rs./ha)
A. kharif 3951.9 2032 196.94 194.55 4.13 916.15 3951.86 79037 20000 18000 84000 25000 22000 163037 22500 20000
B. Rabi 2071.2 1343.35 1610 237.5 - 4273.4 0
Summer 113.01 0
Horticultura
l &
Plantation
Name ot the Block: Kuru
Crop Sown Rainfed Irrigated Total

161
Table.2.2.6 District Water profile
Season Cereal s
Coarse Cereais Pulses
Oil Seeds
Fiber Crops
Any other crops
Area (ha) Productio n (qut/yr)
Productivit y or yield (Kgs/ha)
Cost of Cultiva tion (Rs./ha )
Productio n (qtn/yr) productiveity (kgs/ha)
Cost of Cultication (Rs./ha)
Productio n (qtn/yr)
productivei ty (kgs/ha)
Cost of Culticati on (Rs./ha)
A. kharif 4382 931.61 173.8 79.68 10 100 4381.99 yr 30qt 51200 yr 30qt 51000 B. Rabi 321.26 - - 359.99 - 45 54.25 yr 18qt 46550 yr 18qt 46550 Summer 154.61 18.8 - 0 Horticultura l & Plantation
Name ot the Block: Kisko Crop Sown Rainfed Irrigated Total
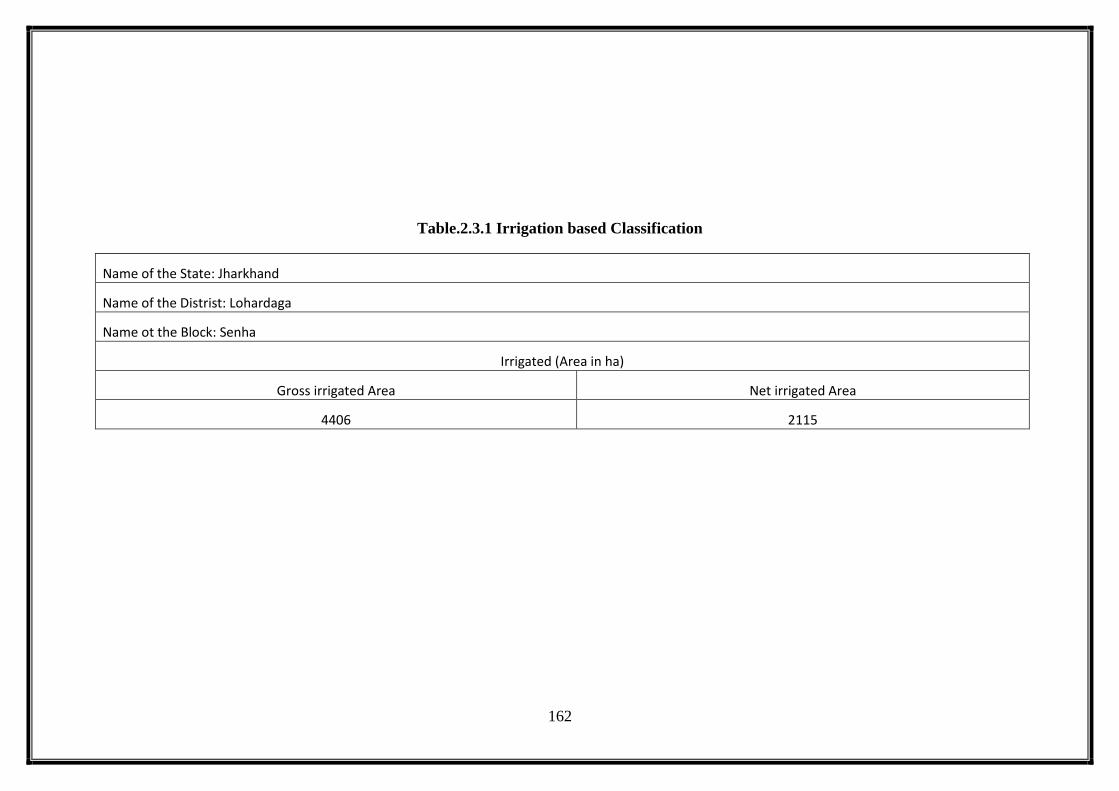
162
Table.2.3.1 Irrigation based Classification
Name of the State: Jharkhand
Name of the Distrist: Lohardaga
Name ot the Block: Senha
Irrigated (Area in ha)
Gross irrigated Area Net irrigated Area
4406 2115

163
Table.2.3.2 Irrigation based Classification
Name of the State: Jharkhand
Name of the Distrist: Lohardaga
Name ot the Block: Kisko
Irrigated (Area in ha)
Gross irrigated Area Net irrigated Area
4408 2455

164
Table.2.3.3 Irrigation based Classification
Name of the State: Jharkhand
Name of the Distrist: Lohardaga
Name ot the Block: Lohardaga
Irrigated (Area in ha)
Gross irrigated Area Net irrigated Area
3355 1825

165
Table.2.3.4 Irrigation based Classification
Name of the State: Jharkhand
Name of the Distrist: Lohardaga
Name ot the Block: Bhandra
Irrigated (Area in ha)
Gross irrigated Area Net irrigated Area
8639 4300

166
Table.2.3.5 Irrigation based Classification
Name of the State: Jharkhand
Name of the Distrist: Lohardaga
Name ot the Block: Kuru
Irrigated (Area in ha)
Gross irrigated Area Net irrigated Area
4351 2314

167
Table.2.3.6 Irrigation based Classification
Name of the State: Jharkhand
Name of the Distrist: Lohardaga
Name ot the Block: Peshrar
Irrigated (Area in ha)
Gross irrigated Area Net irrigated Area
1025 455

168
Table.2.3.6 Irrigation based Classification
Name of the State : Jharkhand
Name of the District : Lohardaga
Name of the Block : kairo
Irrigated ( Area in ha)
Gross Irrigated Area Net Irrigated Area
2670.06 2230.24

169
Table.3.1 Water Availability
3.1 Status of Water Availablity
BCM per Ha
S.No. Sources Kharif Rabi Summer Total
1 Suface Irrigation
(i) Canal (Major & Medium Irrigation) 0.09184 0.01341 0.00123 0.10648
(ii) Minor Irrigarion tanks 0.04668 0.00978 0.00 0.05646
(iii) Lift Irrigation/Dicersion 0.01392 0.0038 0.00 0.01772
(iv) Various Water bodies including Rain Water Harvesting 0.19038 0.0331 0.00082 0.2243

170
Table.3.2.1 Status of ground Water Availability
Name of the State : Jharkhand
Name of the District : Lohardaga
Name of the Block : Bhandra
Status of Block as per Central Ground Water
Board Noticication
Ground Water (HAM/BCM)
Critical Semi-
Critical Safe Draft-HAM Recharge-HAM Gap-HAM
- - Yes 631.15 159.32 471.83

171
Table.3.2.2 Status of ground Water Availability
Name of the Block : Kisko
Status of Block as per Central Ground Water
Board Noticication Ground Water (BCM)
Critical Semi-
Critical Safe Draft-HAM Recharge-HAM Gap-HAM
- - Yes 309.96 97.01 212.95

172
Table.3.2.3 Status of ground Water Availability
Name of the Block : Kuru
Status of Block as per Central Ground Water
Board Noticication Ground Water (BCM)
Critical Semi-
Critical Safe Draft-HAM Recharge-HAM Gap-HAM
- - Yes 598.92 167.38 431.54
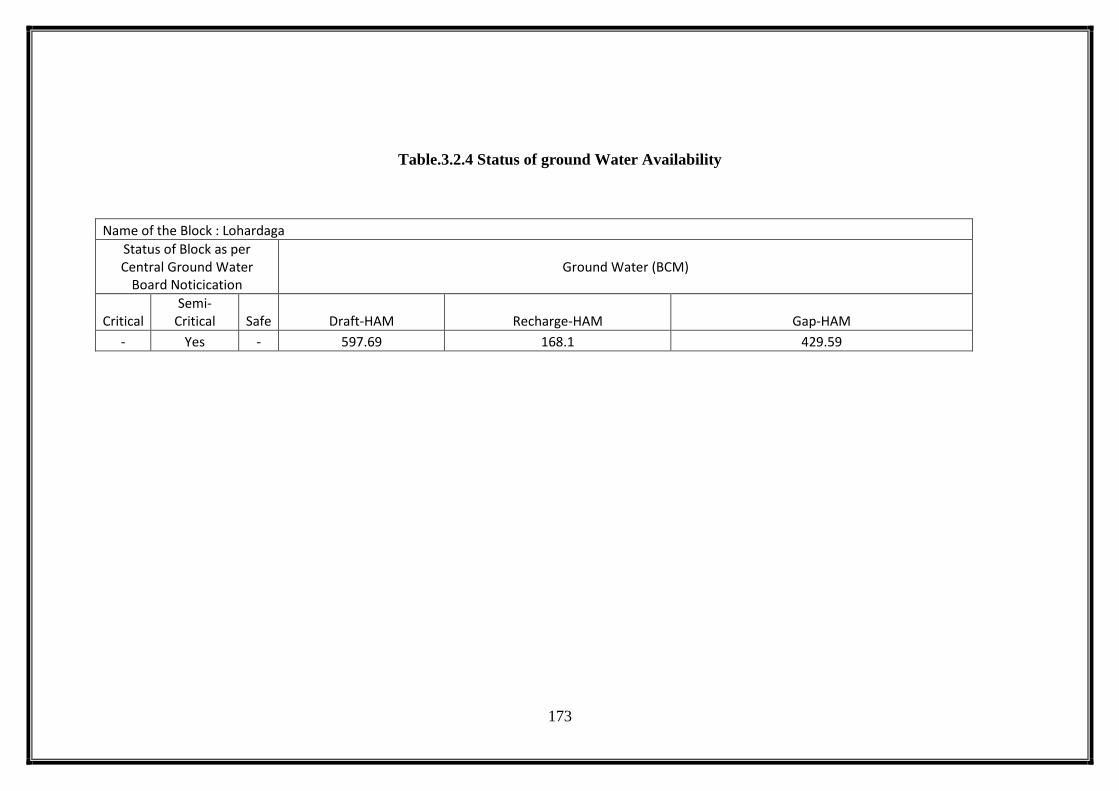
173
Table.3.2.4 Status of ground Water Availability
Name of the Block : Lohardaga
Status of Block as per Central Ground Water
Board Noticication Ground Water (BCM)
Critical Semi-
Critical Safe Draft-HAM Recharge-HAM Gap-HAM
- Yes - 597.69 168.1 429.59
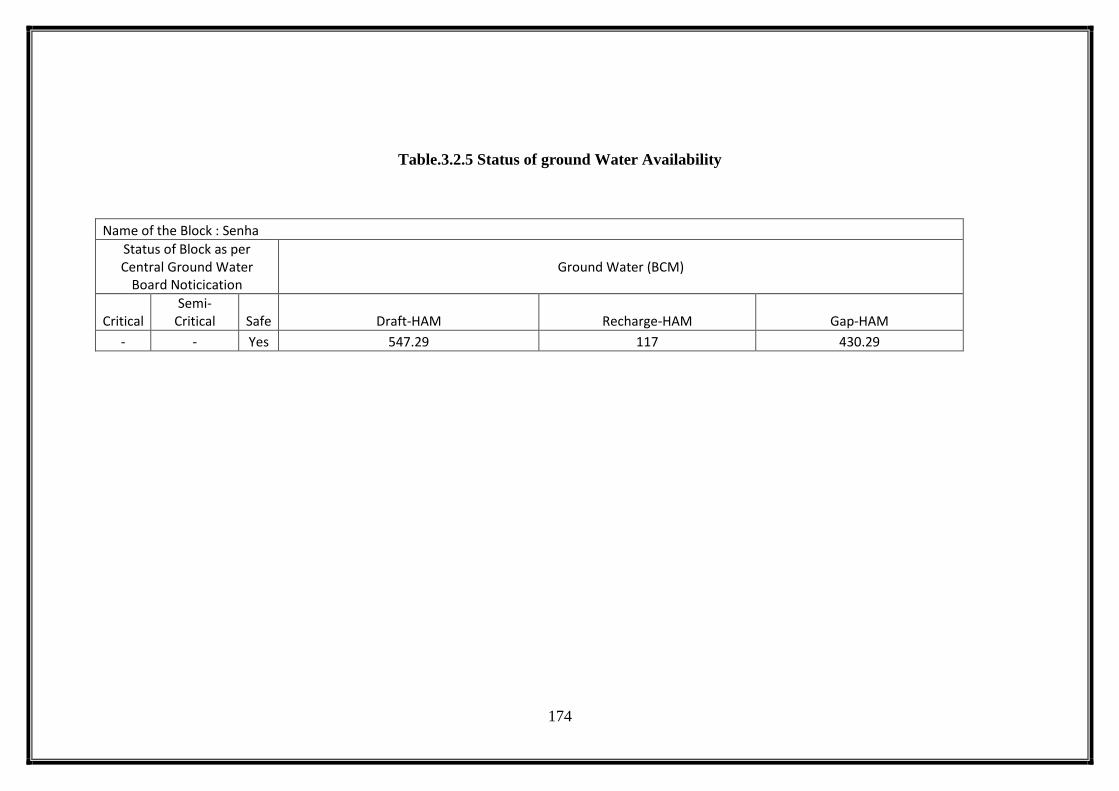
174
Table.3.2.5 Status of ground Water Availability
Name of the Block : Senha
Status of Block as per Central Ground Water
Board Noticication Ground Water (BCM)
Critical Semi-
Critical Safe Draft-HAM Recharge-HAM Gap-HAM
- - Yes 547.29 117 430.29

175
Table.3.2.6 Status of ground Water Availability
Name of the Block : Kairo
Status of Block as per Central Ground Water
Board Noticication Ground Water (BCM)
Critical Semi-
Critical Safe Draft-HAM Recharge-HAM Gap-HAM
- - Yes 160.3 138.16 22.14

176
Table.3.2.7 Status of ground Water Availability
Name of the Block : Pesrar
Status of Block as per Central Ground Water
Board Noticication Ground Water (BCM)
Critical Semi-
Critical Safe Draft-HAM Recharge-HAM Gap-HAM
- - Yes 297.6 107.52 190.08
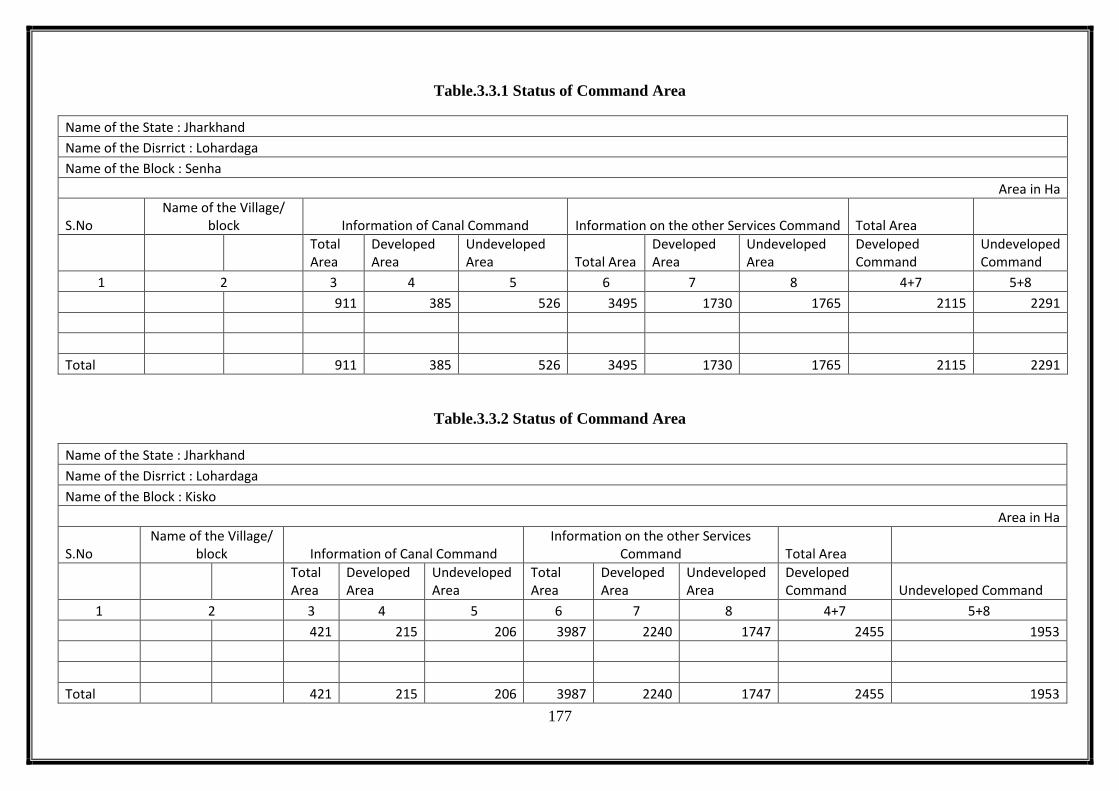
177
Table.3.3.1 Status of Command Area
Name of the State : Jharkhand
Name of the Disrrict : Lohardaga
Name of the Block : Senha
Area in Ha
S.No Name of the Village/
block Information of Canal Command Information on the other Services Command Total Area
Total Area
Developed Area
Undeveloped Area Total Area
Developed Area
Undeveloped Area
Developed Command
Undeveloped Command
1 2 3 4 5 6 7 8 4+7 5+8
911 385 526 3495 1730 1765 2115 2291
Total 911 385 526 3495 1730 1765 2115 2291
Table.3.3.2 Status of Command Area
Name of the State : Jharkhand
Name of the Disrrict : Lohardaga
Name of the Block : Kisko
Area in Ha
S.No Name of the Village/
block Information of Canal Command Information on the other Services
Command Total Area
Total Area
Developed Area
Undeveloped Area
Total Area
Developed Area
Undeveloped Area
Developed Command Undeveloped Command
1 2 3 4 5 6 7 8 4+7 5+8
421 215 206 3987 2240 1747 2455 1953
Total 421 215 206 3987 2240 1747 2455 1953

178
Table.3.3.3 Status of Command Area
Name of the State : Jharkhand
Name of the Disrrict : Lohardaga
Name of the Block : Lohardaga
Area in Ha
S.No Name of the Village/
Block Information of Canal Command Information on the other Services Command Total Area
Total Area
Developed Area
Undeveloped Area Total Area
Developed Area
Undeveloped Area
Developed Command
Undeveloped Command
1 2 3 4 5 6 7 8 4+7 5+8
3355 1825 1530 1825 1530
Total 3355 1825 1530 1825 1530
Table.3.3.4 Status of Command Area
Name of the State : Jharkhand
Name of the Disrrict : Lohrdaga
Name of the Block : Bhandra
Area in Ha
S.No Name of the Village/
Block Information of Canal Command Information on the other Services Command Total Area
Total Area
Developed Area
Undeveloped Area Total Area
Developed Area
Undeveloped Area
Developed Command
Undeveloped Command
1 2 3 4 5 6 7 8 4+7 5+8
4450 1800 2650 4189 2500 1689 4300 4339
Total 4450 1800 2650 4189 2500 1689 4300 4339
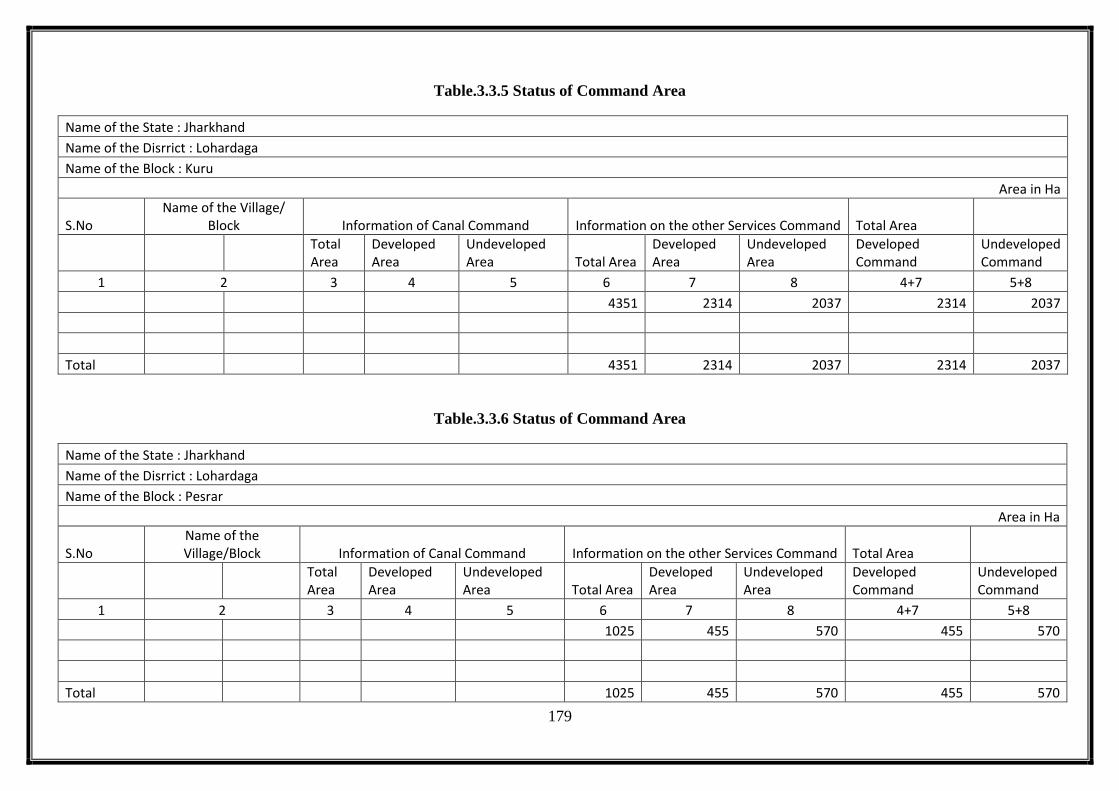
179
Table.3.3.5 Status of Command Area
Name of the State : Jharkhand
Name of the Disrrict : Lohardaga
Name of the Block : Kuru
Area in Ha
S.No Name of the Village/
Block Information of Canal Command Information on the other Services Command Total Area
Total Area
Developed Area
Undeveloped Area Total Area
Developed Area
Undeveloped Area
Developed Command
Undeveloped Command
1 2 3 4 5 6 7 8 4+7 5+8
4351 2314 2037 2314 2037
Total 4351 2314 2037 2314 2037
Table.3.3.6 Status of Command Area
Name of the State : Jharkhand
Name of the Disrrict : Lohardaga
Name of the Block : Pesrar
Area in Ha
S.No Name of the Village/Block Information of Canal Command Information on the other Services Command Total Area
Total Area
Developed Area
Undeveloped Area Total Area
Developed Area
Undeveloped Area
Developed Command
Undeveloped Command
1 2 3 4 5 6 7 8 4+7 5+8
1025 455 570 455 570
Total 1025 455 570 455 570
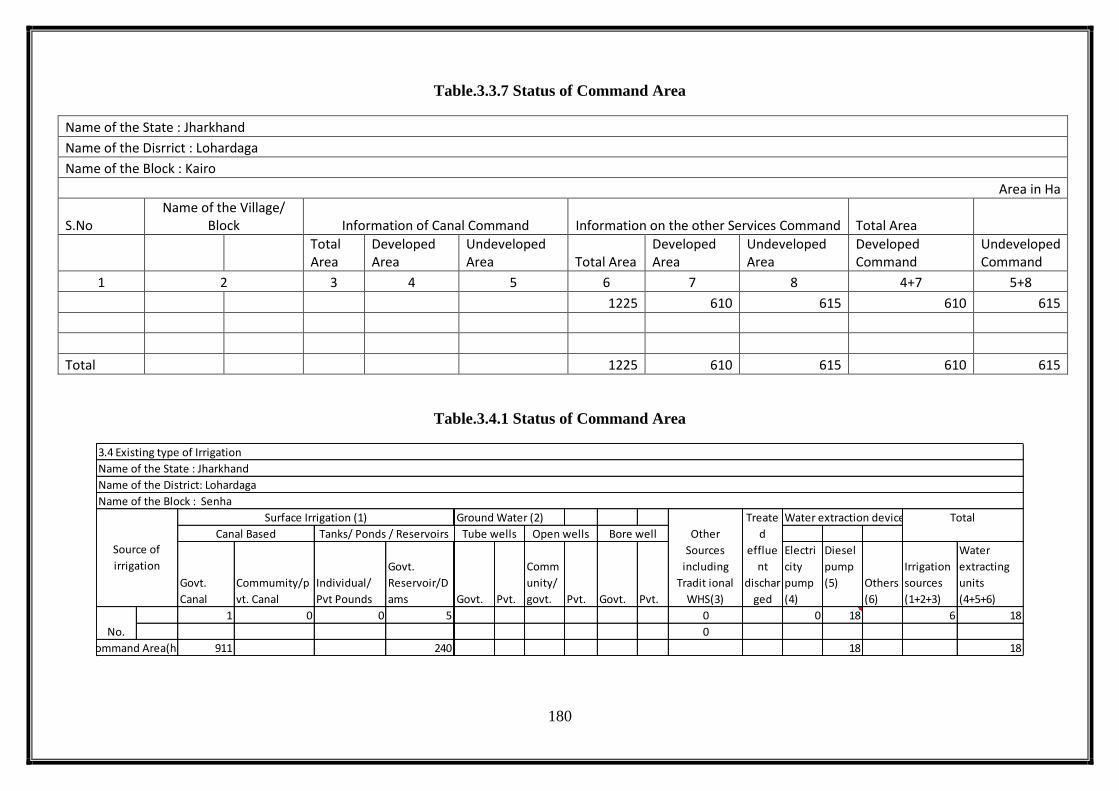
180
Table.3.3.7 Status of Command Area
Name of the State : Jharkhand
Name of the Disrrict : Lohardaga
Name of the Block : Kairo
Area in Ha
S.No Name of the Village/
Block Information of Canal Command Information on the other Services Command Total Area
Total Area
Developed Area
Undeveloped Area Total Area
Developed Area
Undeveloped Area
Developed Command
Undeveloped Command
1 2 3 4 5 6 7 8 4+7 5+8
1225 610 615 610 615
Total 1225 610 615 610 615
Table.3.4.1 Status of Command Area
Ground Water (2) Water extraction devices / Lift
Govt.
Canal
Commumity/p
vt. Canal
Individual/
Pvt Pounds
Govt.
Reservoir/D
ams Govt. Pvt.
Comm
unity/
govt. Pvt. Govt. Pvt.
Electri
city
pump
(4)
Diesel
pump
(5) Others
(6)
Irrigation
sources
(1+2+3)
Water
extracting
units
(4+5+6)
1 0 0 5 0 0 18 6 18
0
911 240 18 18Command Area(ha)
Tanks/ Ponds / Reservoirs Tube wells
Treate
d
efflue
nt
dischar
ged
Other
Sources
including
Tradit ional
WHS(3)
Open wellsCanal Based
Total
Source of
irrigation
Surface Irrigation (1)
Bore well
No.
3.4 Existing type of Irrigation
Name of the State : Jharkhand
Name of the District: Lohardaga
Name of the Block : Senha

181
Table.3.4.2 Status of Command Area
Ground Water (2) Water extraction devices / Lift
Govt. CanalCommumity/pvt. CanalIndividual/ Pvt PoundsGovt. Reservoir/DamsGovt. Pvt. Community/govt.Pvt. Govt. Pvt.
Electri
city
pump
(4)
Diesel
pump
(5) Others
(6)
Irrigation
sources
(1+2+3)
Water
extracting
units
(4+5+6)
1 0 0 7 0 0 18 8 18
0
421 315 18
Tube wells Open wells
Name of the State : Jharkhand
Name of the District: Lohardaga
Name of the Block : Kisko
Command Area(ha)
Source of
irrigation
Total
Tanks/ Ponds / Reservoirs
Surface Irrigation (1)
Bore well
No.
Canal Based Other
Sources
including
Tradit ional
WHS(3)
Treate
d
efflue
nt
dischar
ged
Table.3.4.3 Status of Command Area
Ground Water (2) Water extraction devices / Lift
Govt. CanalCommumity/pvt. CanalIndividual/ Pvt PoundsGovt. Reservoir/DamsGovt. Pvt. Community/govt.Pvt. Govt. Pvt.
Electri
city
pump
(4)
Diesel
pump
(5) Others
(6)
Irrigation
sources
(1+2+3)
Water
extracting
units
(4+5+6)
0 0 0 4 0 1 7 4 7
0
200 7 7
Tanks/ Ponds / Reservoirs
Treate
d
efflue
nt
dischar
ged
Other
Sources
including
Tradit ional
WHS(3)
No.
Command Area(ha)
Tube wells
Source of
irrigation
Surface Irrigation (1)
Canal Based
Name of the District: Lohardaga
Name of the Block : Lohardaga
Open wells
Name of the State : Jharkhand
Total
Bore well
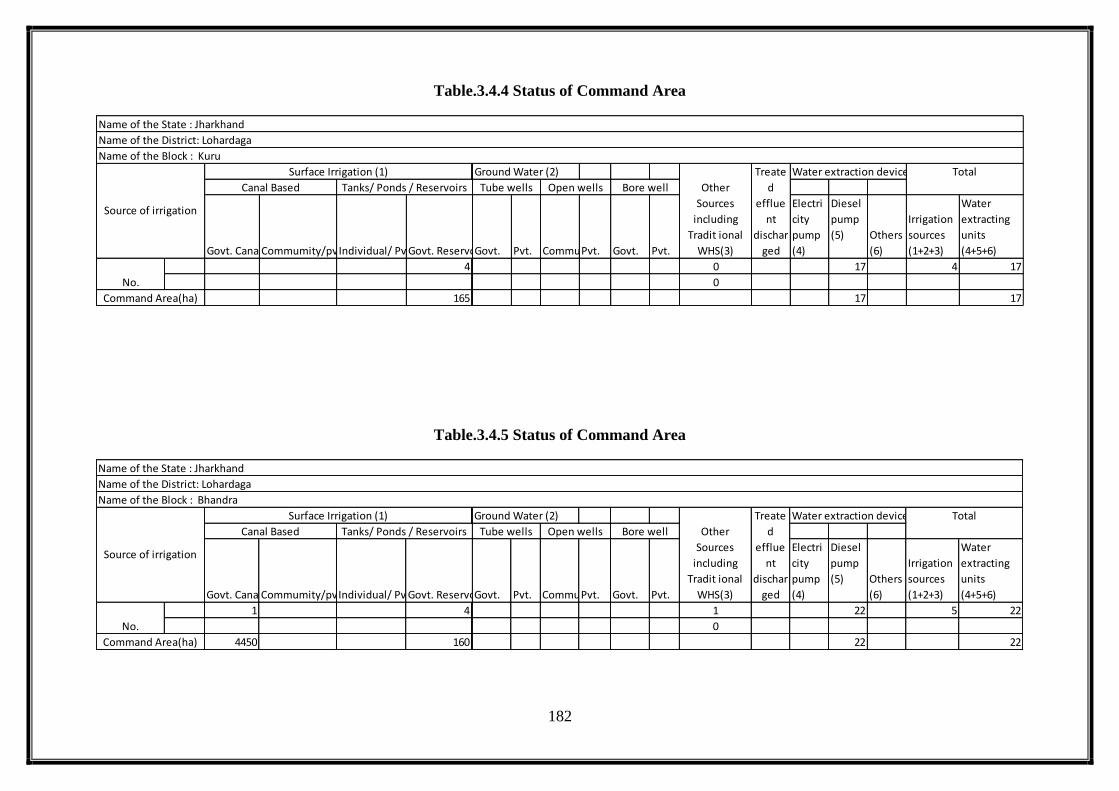
182
Table.3.4.4 Status of Command Area
Ground Water (2) Water extraction devices / Lift
Govt. CanalCommumity/pvt. CanalIndividual/ Pvt PoundsGovt. Reservoir/DamsGovt. Pvt. Community/govt.Pvt. Govt. Pvt.
Electri
city
pump
(4)
Diesel
pump
(5) Others
(6)
Irrigation
sources
(1+2+3)
Water
extracting
units
(4+5+6)
4 0 17 4 17
0
165 17 17
Canal Based
No.
Name of the Block : Kuru
Name of the District: Lohardaga
Tube wells
Command Area(ha)
Name of the State : Jharkhand
Source of irrigation
Treate
d
efflue
nt
dischar
ged
Total
Other
Sources
including
Tradit ional
WHS(3)
Open wells Bore well
Surface Irrigation (1)
Tanks/ Ponds / Reservoirs
Table.3.4.5 Status of Command Area
Ground Water (2) Water extraction devices / Lift
Govt. CanalCommumity/pvt. CanalIndividual/ Pvt PoundsGovt. Reservoir/DamsGovt. Pvt. Community/govt.Pvt. Govt. Pvt.
Electri
city
pump
(4)
Diesel
pump
(5) Others
(6)
Irrigation
sources
(1+2+3)
Water
extracting
units
(4+5+6)
1 4 1 22 5 22
0
4450 160 22 22
Source of irrigation
Open wells
Treate
d
efflue
nt
dischar
ged
Other
Sources
including
Tradit ional
WHS(3)
Tube wellsTanks/ Ponds / Reservoirs
No.
Surface Irrigation (1)
Command Area(ha)
Canal Based
Name of the Block : Bhandra
Total
Bore well
Name of the State : Jharkhand
Name of the District: Lohardaga
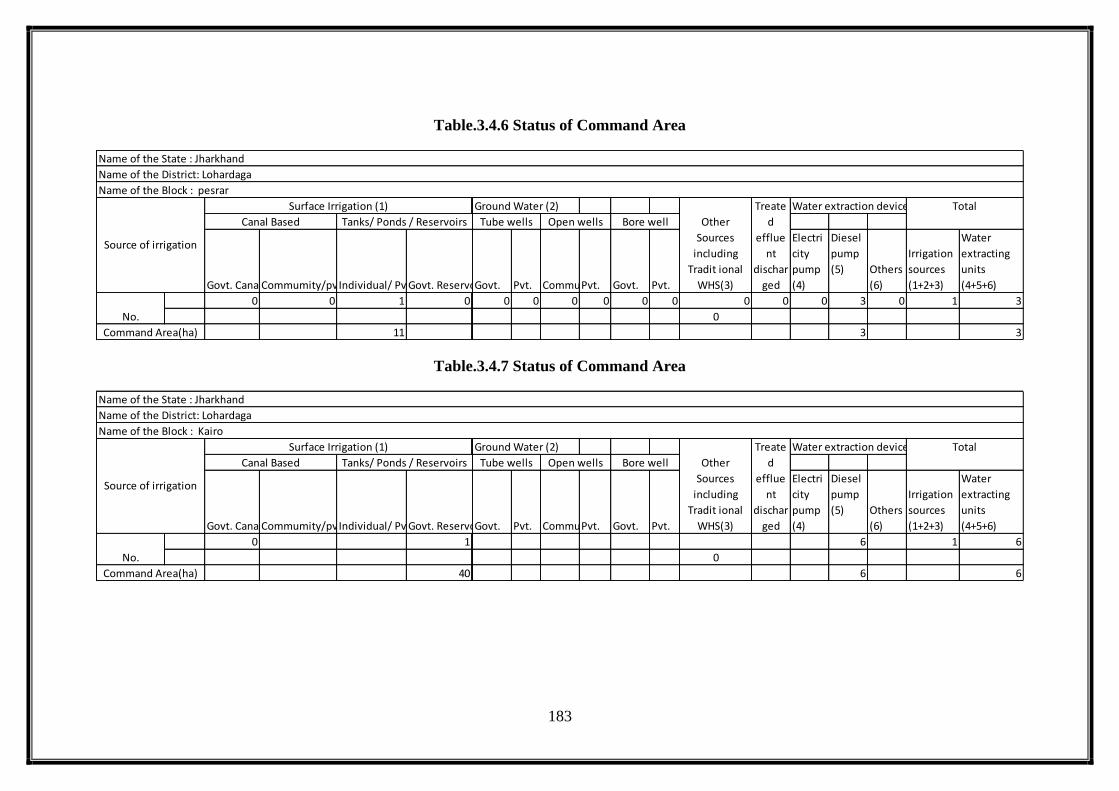
183
Table.3.4.6 Status of Command Area
Ground Water (2) Water extraction devices / Lift
Govt. CanalCommumity/pvt. CanalIndividual/ Pvt PondsGovt. Reservoir/DamsGovt. Pvt. Community/govt.Pvt. Govt. Pvt.
Electri
city
pump
(4)
Diesel
pump
(5) Others
(6)
Irrigation
sources
(1+2+3)
Water
extracting
units
(4+5+6)
0 0 1 0 0 0 0 0 0 0 0 0 0 3 0 1 3
0
11 3 3
Canal Based
No.
Surface Irrigation (1) Treate
d
efflue
nt
dischar
ged
Name of the State : Jharkhand
Tanks/ Ponds / Reservoirs Tube wells
Source of irrigation
Bore well
Name of the District: Lohardaga
Open wells Other
Sources
including
Tradit ional
WHS(3)
Name of the Block : pesrar
Command Area(ha)
Total
Table.3.4.7 Status of Command Area
Ground Water (2) Water extraction devices / Lift
Govt. CanalCommumity/pvt. CanalIndividual/ Pvt PoundsGovt. Reservoir/DamsGovt. Pvt. Community/govt.Pvt. Govt. Pvt.
Electri
city
pump
(4)
Diesel
pump
(5) Others
(6)
Irrigation
sources
(1+2+3)
Water
extracting
units
(4+5+6)
0 1 6 1 6
0
40 6 6
Tube wellsCanal Based Tanks/ Ponds / Reservoirs
Treate
d
efflue
nt
dischar
ged
Other
Sources
including
Tradit ional
WHS(3)
Source of irrigation
Open wells Bore well
Command Area(ha)
Name of the Block : Kairo
Surface Irrigation (1) Total
No.
Name of the State : Jharkhand
Name of the District: Lohardaga

184
Table.4.1 Water Requirement/Demand
4.1 Domestic Water Demand
Block Population in 2015 Projected population in 2020 Gross Water Demand
(BCM)
Lohardaga 141069 160934 0.000011
Senha 77524 88441 0.0000061
Bhandra 63675 72642 0.000005
Kisko 61068 69669 0.0000048
Kuru 94255 107529 0.0000075
Kairo 42076 48000 0.0000033
Pesrar 33482 38137 0.000026
Total - 513149 585352 0.0000637
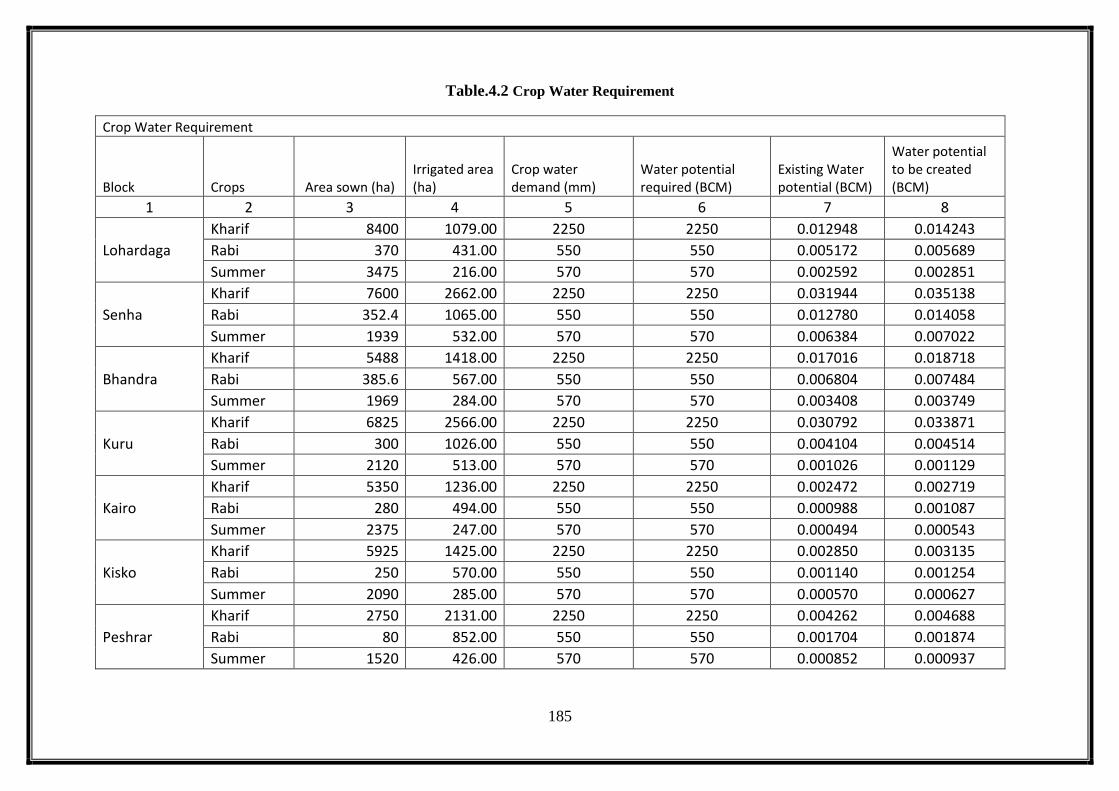
185
Table.4.2 Crop Water Requirement
Crop Water Requirement
Block Crops Area sown (ha) Irrigated area (ha)
Crop water demand (mm)
Water potential required (BCM)
Existing Water potential (BCM)
Water potential to be created (BCM)
1 2 3 4 5 6 7 8
Lohardaga
Kharif 8400 1079.00 2250 2250 0.012948 0.014243
Rabi 370 431.00 550 550 0.005172 0.005689
Summer 3475 216.00 570 570 0.002592 0.002851
Senha
Kharif 7600 2662.00 2250 2250 0.031944 0.035138
Rabi 352.4 1065.00 550 550 0.012780 0.014058
Summer 1939 532.00 570 570 0.006384 0.007022
Bhandra
Kharif 5488 1418.00 2250 2250 0.017016 0.018718
Rabi 385.6 567.00 550 550 0.006804 0.007484
Summer 1969 284.00 570 570 0.003408 0.003749
Kuru
Kharif 6825 2566.00 2250 2250 0.030792 0.033871
Rabi 300 1026.00 550 550 0.004104 0.004514
Summer 2120 513.00 570 570 0.001026 0.001129
Kairo
Kharif 5350 1236.00 2250 2250 0.002472 0.002719
Rabi 280 494.00 550 550 0.000988 0.001087
Summer 2375 247.00 570 570 0.000494 0.000543
Kisko
Kharif 5925 1425.00 2250 2250 0.002850 0.003135
Rabi 250 570.00 550 550 0.001140 0.001254
Summer 2090 285.00 570 570 0.000570 0.000627
Peshrar
Kharif 2750 2131.00 2250 2250 0.004262 0.004688
Rabi 80 852.00 550 550 0.001704 0.001874
Summer 1520 426.00 570 570 0.000852 0.000937

186
Table.4.3 Crop Water Requirement
4.3 Livestock Water Demand
Block Total number of live stock Present water demand
(BCM) Water demand in 2020
(BCM)
Kisko 69944 1.412169185 1.623994562
Kairo 58419 0.967724679 1.112883381
Peshrar 51369 1.235574002 1.420910102
Kuru 115701 1.84414343 2.120764944
Lohardaga 76661 1.330407347 1.529968448
Senha 112946 1.831329861 2.10602934
Bhandra 67770 1.651307454 1.899003572
Lohardaga Town 10324 0.222741653 0.2561529

187
Table.4.4 Industrial Water Demand
Industrial Water Demand
Block Name of the industry Water demand Water demand in 2020
Lohardaga Rani Rice Mill 10000 lit/Day >10% (11000lit/day)Aprox
Senha Kamla Devi Rice Mill 10000 lit/Day >10%(11000lit/day)Aprox

188
Table. 5.1 Details of activities under Peshrar block
Sl No.
Name of Scheme Estimate
Cost Block
Irrigated Area
Remarks
1 2 3 4 5 6
State Plan (New)
1 Construction of 15 meter check dam on onegara river 39.22 Peshrar 25
Sarface Minor Irrigation Scheme
2 Construction of 15 meter check dam on Jawakhad river 36.82 Peshrar 20
3 Construction of 10 meter check dam on chunghat river at village Rorad 36.46 Peshrar 20
4 Construction of 15 meter check dam on dhahukheta 38.39 Peshrar 20
5 Construction of 15 meter check dam on Lanka nala near chelo tree 47.26 Peshrar 22
6 Construction of 12 meter check dam on Masna nala at chapal 40.64 Peshrar 20
7 Construction of 20 meter check dam on Mandap Nala 44.63 Peshrar 21
8 Construction of 20 meter check dam on Baherakona nala at village peshrar 47.72 Peshrar 22
9 Construction of 15 meter check dam on Karamboha nala at village peshrar 43.08 Peshrar 21
10 Construction of Guardwall near the house of farmar suraj of village bondobar 47.09 Peshrar 0
11 Construction of 210 meter Guardwall from parsa daranga till the house of Birsu 49.16 Peshrar 0
12 Construction of 610 meter irrigating drain from charanva to manjhes at village muramu 47.75 Peshrar 25
13 Construction of 235 meter Guardwall from Shiv Temple to Kolhari river bank 49.71 Peshrar 0
14 Lift irrigation on river near muramu communal building 6.000 Peshrar 8
15 Lift irrigation on kelari river, muramu 6.000 Peshrar 10
16 Lift irrigation on Rorad river 6.000 Peshrar 10
Total - 585.93 16 244
New Check Dam
17 Construction of check Dam and Guardwall on gala river near tedhi kusum manha riverbank at village partu
110.00 Peshrar 55
Ground Water Development
18 Construction of check Dam and Guardwall on gala river, upside of bridge near bhagat river bank at village sangodih
120.00 Peshrar 48
19 Construction of series check Dam and Guardwall on jalsahi river at village Mecca 340.00 Peshrar 150

189
20 Construction of check Dam at latapani 90.00 Peshrar 40
21 Construction of series check Dam and Guardwall on saheda nala at village sangodih 350.00 Peshrar 140
22 Construction of series check Dam and Guardwall on Mangardaha nala at village sangodih 160.00 Peshrar 70
23 Construction of series check Dam and Guardwall on Kalashdubua nala at village Dugu 180.00 Peshrar 80
24 Construction of series check Dam and Guardwall on Khikhir river at village Siram 180.00 Peshrar 80
25 Construction of check Dam and Guardwall near Lahasun jhariya at village Hudmud 48.00 Peshrar 20
26 Construction of series check Dam and Guardwall on Kataribari Nala at village Madanpur 190.00 Peshrar 80
27 Construction of check Dam and Guardwall at buchidari at village Rorad 50.00 Peshrar 25
28 Construction of check Dam on Dagduba Nala 80.00 Peshrar 35
29 Construction of check Dam on Dhabaidah 80.00 Peshrar 35
30 Construction of check Dam on Sirukhand 80.00 Peshrar 30
31 Construction of check Dam on Dhudhmatiya Nala at village kerar 50.00 Peshrar 20
32 Construction of check Dam on Koyala Dhola at village Sangodih Tola Ambvatikar 50.00 Peshrar 20
33 Construction of check Dam on Khand Nala near daru tilai hill 70.00 Peshrar 30
34 Construction of check Dam on Chhandru Basriya Nala 60.00 Peshrar 28
35 Construction of check Dam at Bidni Purna Toli Khand 65.00 Peshrar 30
36 Construction of check Dam on Khabh Tanri Nala 60.00 Peshrar 28
37 Construction of check Dam on Hendehans Sarna Nala 65.00 Peshrar 28
38 Construction of check Dam on Hesag Langada Aam Nala 75.00 Peshrar 35
39 Construction of check Dam near Shiv temple at village muramu 90.00 Peshrar 45
40 Construction of check Dam on gala river near Primary School at village manha 90.00 Peshrar 45
41 Construction of check Dam on Kotam Nala 80.00 Peshrar 35
42 Construction of check Dam on kada sarna nala at village Kaovadand 50.00 Peshrar 25
43 Construction of check Dam on Dari Kona at village Ganeshpur 50.00 Peshrar 25
44 Construction of check Dam on Khapra Matti river at village Manhe Pat 50.00 Peshrar 25
45 Construction of check Dam on Batru Kadru Kona Nala 85.00 Peshrar 40
46 Construction of check Dam on Batru Kadru Kona Nala 80.00 Peshrar 40
47 Construction of check Dam on Upar Turiyadih Barikona Nala 85.00 Peshrar 35
48 Construction of check Dam on Harin Duba Nala 75.00 Peshrar 35
49 Construction of check Dam on Kera Nala 70.00 Peshrar 30

190
50 Construction of check Dam on Hulhuliya Nala 70.00 Peshrar 30
Total - 3428.00 34 1517
Renovation Work
51 Renovation of Murmu L.I. Scheme 70.00 Peshrar 30
RRR
52 Renovation of Village Sembhua L.I. Scheme 70.00 Peshrar 30
Total - 140.00 2 60
Under RRR Schemes
53 Renovation ofpeshrar sarna Talab 30.00 Peshrar 15
54 Renovation of Upper Baghi Bandh 30.00 Peshrar 20
55 Renovation of Tammahi Bandh At Kerar 30.00 Peshrar 15
Total - 90.00 3 50
Grand Total- 230.00 5 110
New L.I.Scheme
56 Construction of L.I.Scheme At dumuhan in Vill. Sangodih Tola 70.00 Peshrar 40 New
L.I.Scheme Construction of L.I.Scheme at village mecca 70.00 Peshrar 40
Total - 140.00 2 80

191
Table.5.2 Details of activities under Kisko block
Sl No.
Name of Scheme Estimate Cost Block Irrigated Area Remarks
1 2 3 4 5 6
State Plan (New)
1
Construction work of series check dam at Sukri River
132.32 Kisko 55 Sarface Minor Irrigation Scheme
Total - 132.32 1 55
New Check Dam
1 Construction work of series check dam at Arya Nala
264.76 Kisko 80
Ground Water Development
2 Construction work of series check dam at Kisko River
272.00 Kisko 200
3 Construction work of check Dam on Dumgarwa Nala of Bahabar Village
165.00 Kisko 150
4 Construction work of series check Dam on Ghaghari Nala of Nirhu Village
220.00 Kisko 150
5 Construction work of check Dam near house of chunni oraon at bonga
90.00 Kisko 100
Total - 1011.76 5 680
Under RRR Schemes
1 Renovation of Bagru Pond 30.00 Kisko 15
RRR
2 Renovation of Khariya Pond 45.00 Kisko 15
3 Renovation of Kochabaghi Dam 35.00 Kisko 25
4 Renovation of Aanandpur M.I. Scheme 150.00 Kisko 75
Total - 260.00 4 130
M.I Schemes
Renovation of Lawangai M.I. Scheme 20.00 Kisko 100

192
Renovation of Semardih M.I. Scheme 30.00 Kisko 60
Renovation of Bandi Toli M.I. Scheme 60.00 Kisko 20
Renovation of Patratu M.I. Scheme 70.00 Kisko 25
Renovation of Banpur M.I. Scheme 30.00 Kisko 25
Renovation of Datma M.I. Scheme 20.00 Kisko 30
Total - 230.00 6 260
G. Total - 490.00 10 390
Major Irrigation Schemes
Construction of daharbati Irrigation scheme 4500.00 Kisko 450
Major Irrigation Schemes Construction of Kisko reservoir scheme
8000.00 Kisko 2000
Total - 12500.00 2 2450

193
Table.5.3 Details of activities under Senha block
Sl No.
Name of Scheme Estimate Cost Block Irrigated Area Remarks
1 2 3 4 5 6
New Check Dam
1 Construction of Daka Nala series check dam 121.3857 Senha 155
Ground Water Development
2 Construction of Bokta Nala check dam 67.566 Senha 52
3 Construction of Kajarhat Nala check dam 78.924 Senha 51
4 Construction of Neem Toli check dam 51.75 Senha 30
5 Construction of series check dam on Dhardhariya Nala near saki village
500.00 Senha 250
Total - 819.6257 5 538
New M.I. Schemes
1 Weir scheme and irrigating nala construction work on phuljhar nala near chhata patthar
1000.00 Senha 400
2 Weir scheme and irrigating nala construction work on Kerajhariya river down side of chamru village
800.00 Senha 320
Total - 1800.00 2 720
G. Total - 2619.63 7 1258
M.I. Schemes
1 Renovation of Akaguri M.I. Scheme 60.00 Senha 40
RRR
2 Renovation of Chhapar dam M.I. Scheme 50.00 Senha 30
Total - 110.00 2 70
Repairing Work of Check Dam
1 Renovation of check dam on bokta nala near plot of pawar jalil ansari at barhi village
30.00 Senha 15
2 Renovation of check dam on bokta nala at sarna asthal at barhi village
35.00 Senha 20

194
3 Renovation of check dam on bokta nala near Thuti Tetar at barhi village
40.00 Senha 25
Total - 105.00 3 60
L.I.Schemes
1 Renovation work of Banki river - 1 L.I. Scheme 65.00 Senha 45
2 Renovation work of Banki river - 2 L.I. Scheme 70.00 Senha 50.00
3 Renovation work of Arru L.I. Scheme 65.00 Senha 80.00
4 Renovation work of Jhakharabuti L.I. Scheme 65.00 Senha 30.00
5 Renovation work of Serenghatu L.I. Scheme 65.00 Senha 32.00
6 Renovation work of Senha L.I. Scheme 65.00 Senha 40.00
7 Renovation work of Jogna L.I. Scheme 65.00 Senha 30.00
8 Renovation work of Korambey L.I. Scheme 65.00 Senha 30.00
Total - 525.00 8 337
Grand total- 740.00 13 467
State Plan (New)
Sarface Minor Irrigation Scheme
1 Construction of check dam on Banki river at village badla
132.29 Senha 55
2 Construction of check dam on Banki river at village bodha toli
182.21 Senha 75
3 Construction of check dam on Banki river at village gobar sela
130.23 Senha 50
4 Construction of series check dam on phulhar nala
169.81 Senha 65
5 Construction of series check dam on phuljhar nala
230.35 Senha 92
Total - 844.89 5 337
Major Irrigation Schemes
Weir scheme at village chamru 1000 Senha 2000 Major Irrigation
Schemes Total - 1000 1 2000

195
Table.5.4 Details of activities under Kuru block
Sl No.
Name of Scheme Estimate Cost Block Irrigated Area Remarks
1 2 3 4 5 6
New Check Dam
1 Construction scheme of Larsemra river check dam 50.00 Kuru 25
Ground Water Development
2 Construction scheme of Parsa Chaora Nala check dam 66.00 Kuru 30
3 Construction of Dabba Pathar check dam 73.00 Kuru 30
4 Construction of Purna Gadari check dam 61.00 Kuru 22
5 Construction of check dam on Dhobi Ghat of Tati Tikko river 70.00 Kuru 25
6 Renovation work of Lapur check dam 20.00 Kuru 15
7 Construction work of check dam on Jario Nala of Barki Chapi Village
50.00 Kuru 25
8 Construction work of check dam on Fulsari Hathigara Nala
50.00 Kuru 25
9 Construction of check dam on Rangrorya Nala at Dhora
60.00 Kuru 30
10 Construction work of check dam on Hotwar Nala of Hotwar Village
60.00 Kuru 20
11 Construction work of check dam on Salgi Charagaadi
80.00 Kuru 25
Total - 640.00 11 272
New M.I. Scheme
Renovation work of Nandani Wear at Sinjo Baridih 800.00 Kuru 400
Renovation work of Wear at Larsemra river 250.00 Kuru 125
Renovation work of Burhu Baratpur M.I. Scheme 1000.00 Kuru 320
Total - 2050.00 3 845
G. Total - 2690.00 14 1117

196
M.I. Scheme
1 Renovation work of Salgi Rocho M.I. Scheme 120.00 Kuru 50
RRR
2 Renovation work of Saphi M.I. Scheme 70.00 Kuru 100
3 Renovation work of Taan M.I. Scheme 85.00 Kuru 35
4 Renovation work of Lawagain Pond 30.00 Kuru 15
5 Renovation work of Madrsa Lapur Pond 20.00 Kuru 10
6 Renovation work of Kesaw Band at Chiri Village Kuru 10
7 Renovation work of Kherwagara Pond 40.00 Kuru 10
8 Renovation work of Salgi Pond 35 Kuru 20
9 Renovation work of Kuru Pond 25 Kuru 20
10 Renovation work of Opa Pond 25 Kuru 10
11 Renovation work of Sundaru Pond 35 Kuru 20
12 Renovation work of Sukumar Pond 35 Kuru 20
Total - 520.00 12 320
Repairing Work of Check Dam
1 Renovation work of check dam no - 1 at Doba Nala - 1 30.00 Kuru 25
2 Renovation work of check dam no - 2 at Doba Nala 25.00 Kuru 20
3 Renovation work of check dam on Saphi Nala at Pandara
25.00 Kuru 24
4 Renovation work of check dam on Saphi Nala at Chetar 20.00 Kuru 25
5 Renovation work of check dam on Lapur Nala 20.00 Kuru 15
6 Renovation work of check dam on Saphi Nala at Makandu
20.00 Kuru 20
7 Renovation work of check dam on Sundru Kamle Nala 20.00 Kuru 15
8 Renovation work of check dam on Karak Nala 25.00 Kuru 20
9 Renovation work of check dam on Pandra Nala 25.00 Kuru 25
Total - 210.00 9 189
L.I. Scheme
Renovation work of Jingi L.I. Scheme 65.00 Kuru 35
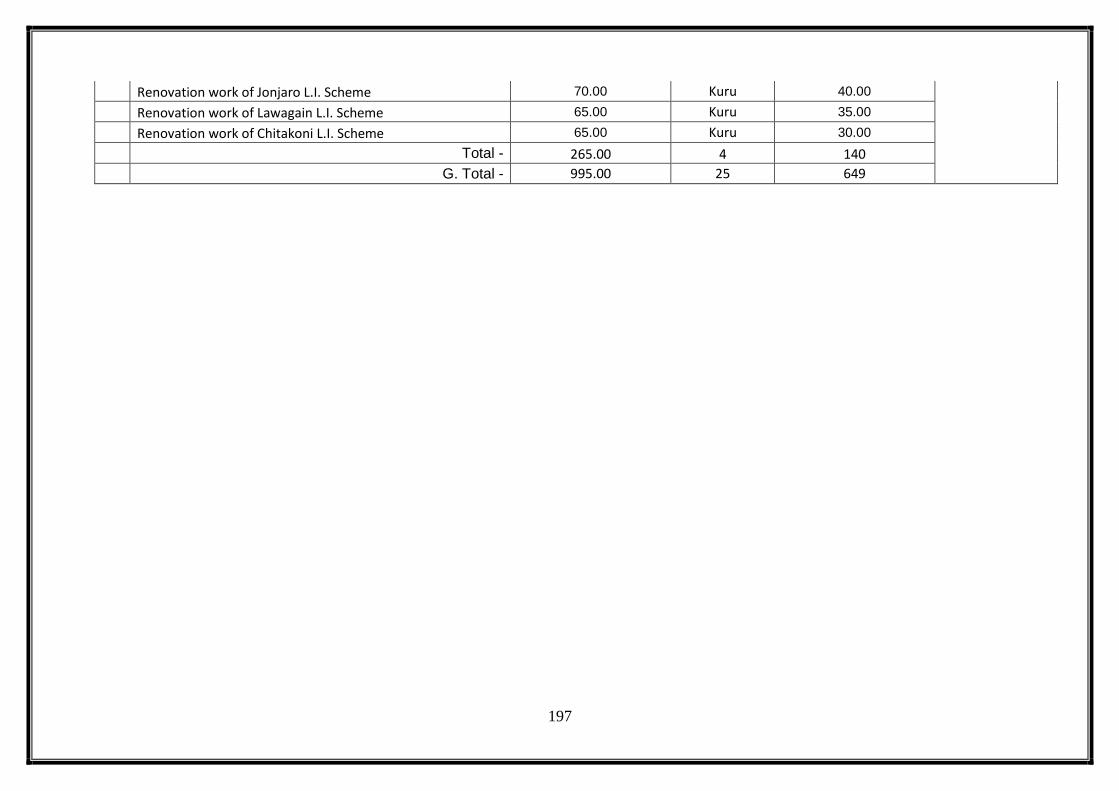
197
Renovation work of Jonjaro L.I. Scheme 70.00 Kuru 40.00
Renovation work of Lawagain L.I. Scheme 65.00 Kuru 35.00
Renovation work of Chitakoni L.I. Scheme 65.00 Kuru 30.00
Total - 265.00 4 140
G. Total - 995.00 25 649

198
Table.5.5 Details of activities under Lohardaga block
Sl No.
Name of Scheme Estimate Cost Block Irrigated Area Remarks
1 2 3 4 5 6
New Check Dam
1 Construction of Jori Serie Check Dam 200.00 Lohardaga 200
Ground Water Development
2 Construction of Hirhi Check Dam 65.00 Lohardaga 22
3 Construction of Kujra Check Dam 85.00 Lohardaga 28
4 Construction of Kujra Mahua Toli Check Dam
80.00 Lohardaga
28
5 Construction of Sengra Toli oyana Check Dam
75.00 Lohardaga
25
6 Construction of Kurse Kumba Toli Check Dam
75.00 Lohardaga
25
Total - 580.000 6 328
Under RRR Schemes
Renovation of Viktoriya Pond 200.00 Lohardaga 150
RRR
Renovation of Bhaxso L.I. Scheme 55.00 Lohardaga 10
Renovation of Khakhaparta Pond 65.00 Lohardaga 15
Total - 320.000 3 175
L.I. Schemes
Renovation of Patra Toli L.I.Scheme 60.00 Lohardaga 30
Arkosa L.I.Scheme 70.00 Lohardaga 30
Renovation of Kaimo L.I. Scheme 65.00 Lohardaga 30
Renovation of Manho L.I. Scheme 60.00 Lohardaga 30
Renovation of Juriya L.I. Scheme 65.00 Lohardaga 30
Renovation of Kujara L.I. Scheme 60.00 Lohardaga 30
Total - 380.00 6 180

199
M.I. Schemes
Renovation of Chipo M.I.Scheme 35.00 Lohardaga 22
Renovation of Mundo M.I.Scheme 30.00 Lohardaga 20
Renovation of Arkosa M.I.Scheme 35.00 Lohardaga 22
Renovation of Hirhi Pond 22.00 Lohardaga 12
Renovation of Bhujaniya Pond 15.00 Lohardaga 10
Renovation of Tigara Pond 20.00 Lohardaga 10
Total - 157.00 6 96
G. total - 857.00 15 451
Construction of Burhubarathpur M.I. scheme
320 Lohardaga 520 Medium Irrigation scheme
Total - 320 520

200
Table.5.6 Details of activities under Bhandra block
Sl No.
Name of Scheme Estimate Cost Block Irrigated Area Remarks
1 2 3 4 5 6
State Plan (New)
1 Construction of Phulhar Nala Series Check Dam
197.385 Bhandra 201
Sarface Minor Irrigation Scheme
2 Construction of Lalka Nala Check Dam 72.980 Bhandra 33
3 Construction of Jharo Nala Check Dam 63.110 Bhandra 22
4 Construction of Bhujaniya Nala Check Dam
58.920 Bhandra 22
5 Construction of Porha Nala Series Check Dam
206.544 Bhandra 201
Total - 598.940 5 479
New Check Dam
Construction of Ambera Nala Check Dam 58.92 Bhandra 22
Ground Water Development
Construction of Bokta Nala Check Dam 72.20 Bhandra 25
Construction of Bitpi Nala Check Dam 71.01 Bhandra 25
Construction of Bhais mundo Nala Check Dam 90.00 Bhandra 30
Construction of Bhita Nala Check Dam 90.00 Bhandra 30
Construction of Palmi Nala Check Dam 70.00 Bhandra 25
Construction of Kuri Sokra Nala Check Dam 75.00 Bhandra 25
Construction of Chhapar Toli Patra Nala Check Dam 75.00 Bhandra 25
Total - 602.130 8 207
Under RRR Schemes
Renovation of Hirankatta M.I. Scheme 90.00 Bhandra 45 RRR

201
Renovation of Sokra Pond 50.00 Bhandra 20
Renovation of Bhaismundo M.I. Scheme 70.00 Bhandra 30
Renovation of Masmano Pond 40.00 Bhandra 15
Renovation of Udrangi Pond 40.00 Bhandra 10
Total - 290.00 5 120
L.I. Schemes
Renovation of Masmano L.I.Scheme 65.000 Bhandra 30
Total - 65.00 1 30
M.I. Schemes
Renovation of Jhariya Nala M.I.Scheme 80.00 Bhandra 22
Renovation of Akhileswar M.I.Scheme 100.00 Bhandra 60
Renovation of Bhaismundo M.I.Scheme 70.00 Bhandra 25
Renovation of Chatti Check Dam 20.00 Bhandra 25
Renovation of Check Dam at Phulhar River 20.00 Bhandra 50
Total - 290.00 5 182
G. total - 645.00 11 332

202
Table.5.7 Details of activities under Kairo block
Sl No.
Name of Scheme Estimate Cost Block Irrigated Area Remarks
1 2 3 4 5 6
State Plan (New)
1 Construction of Pahar Nala Check Dam Nos - 2 58.55 Kairo 22 Sarface Minor Irrigation Scheme
Total - 58.55 1 22
New Check Dam
2 Construction of Garadih Nala Check Dam Nos. - 1 92.97 Kairo 30
Ground Water
Development
3 Construction of Garadih Nala Check Dam Nos. - 2 93.03 Kairo 30
4 Construction of Garadih Nala Check Dam Nos. - 3 97.55 Kairo 30
5 Construction of Khanda Nala Check Dam Nos. - 1 116.33 Kairo 35
6 Construction of Ulti Nala Check Dam Nos. – 2 63.93 Kairo 22
7 Construction of Pahar Nala Check Dam Nos - 1 54.47 Kairo 20
8 Construction of Pahar Nala Check Dam Nos - 3 (Kharta) 59.18 Kairo 22
9 Construction of Sarabey Nala Check Dam 70.00 Kairo 50
10 Construction of Dumar Toli Nala Check Dam 45.00 Kairo 20
11 Construction of Tata Nala Check Dam 40.00 Kairo 20
12 Construction of Gajni Nala Check Dam 90.00 Kairo 50
13 Construction of Hanhat Nala Check Dam 45.00 Kairo 20
Total - 867.46 12 349

203
Under RRR Schemes
14 Revovation of bhouro pond at Sarabey 40.00 Kairo 20
RRR
15 Renovation of Hanhat Dam 88.00 Kairo 25
16 Renovation of Raj Dam 65.00 Kairo 20
17 Renovation of Chalho Dam 75.00 Kairo 50
Total - 268.00 4 115