practical application of population health and wellbeing approaches in the new policy context...
TRANSCRIPT

Practical application of population health and wellbeing approaches in
the new policy context
Professor Chris Bentley
HINSTHINSTAssociatesAssociatesHINSTHINSTAssociatesAssociates

Messages from the Past

Ronald Labonte
Well being and Health
Physiological risksHigh blood pressureHigh cholesterolStress hormonesAnxiety/depression
Behavioural risksSmokingPoor dietLack of activitySubstance abuse
Psycho-social risks:IsolationLack of social supportPoor social networksLow self-esteemHigh self-blameLow perceived powerLoss of meaning/purpose of life
Risk conditions – e.g.:PovertyLow social statusUnemploymentDangerous environmentsDiscriminationSteep power heirarchyGaps/weaknesses in services and support

2005
2010 2015
2020
Health Inequalities
Different Gestation Times for Interventions
A
B
C
For example intervening to reduce risk of mortality in people with established disease such as CVD, cancer, diabetes
For example intervening through lifestyle and behavioural change such as stopping smoking, reducing alcohol related harm and weight management to reduce mortality in the medium term
For example intervening to modify the social determinants of health such as worklessness, poor housing, poverty and poor education attainment to impact on mortality in the long term

Partnership, Vision and Strategy,
Leadership and Engagement
Population LevelInterventions
Intervention Through
Communities
Intervention Through Services
Systematic and scaled interventions through
services
Systematic community engagement
Service engagement with the community
Producing Percentage Change at Population Level C. Bentley2007

Achieving Percentage Change in Population Outcomes
Programme characteristics will include being :-
– Evidence based – concentrate on interventions where research findings and professional consensus are strongest
– Outcomes orientated – with measurements locally relevant and locally owned
– Systematically applied – not depending on exceptional circumstances and exceptional champions
– Scaled up appropriately – “industrial scale” processes require different thinking to small “ bench experiments”
– Appropriately resourced – refocus on core budgets and
services rather than short bursts of project funding
– Persistent – continue for the long haul, capitalising on, but not dependant on fads, fashion and policy priorities

'Spearhead' deaths as a % of England total: 2006 to July 2011month by month counts and 12 months smoothed - ONS provisional death registrations
26.0%
26.5%
27.0%
27.5%
28.0%
28.5%
29.0%
29.5%
30.0%
% o
f E
ng
lan
d d
eath
s
month by month
12 month smoothed
population proportion
T Hennell 2011

Circulatory <75 standardised mortality: Spearhead Gapschange in absolute gap between annual mortality rates for spearhead areas and the England
average
-60%
-50%
-40%
-30%
-20%
-10%
0%
10%
1995 1996 1997 1998 1999 2000 2001 2002 2003 2004 2005 2006 2007 2008 2009 2010
ann
ual
cir
cula
tory
mo
rtal
ity
gap
co
mp
ared
to
th
at f
or
the
bas
elin
e ye
ars
1995
-97
persons
male
female
target reduction

Components of the <75 gap by broad category of deathstandardised mortality gaps for spearhead areas compared to each year's England <75 mortality
0%
5%
10%
15%
20%
25%
30%
1995 1996 1997 1998 1999 2000 2001 2002 2003 2004 2005 2006 2007 2008 2009 2010
ca
us
e o
f d
ea
th g
ap
s r
ela
tiv
e t
o E
ng
lan
d a
ve
rag
e <
75
mo
rta
lity
in
ye
ar
other
digestive
cancer
circulatory

Health and Wellbeing Boards
A shaky start?

A few early concerns• Limited membership v. unmanageably large• JSNAs very variable; not bottom-up and top-down;
not driving the agenda• Little knowledge or acknowledgement of Public
Health Outcomes Framework• Role not clear: strategic ‘forum’ (talking shop), or
performance managing function• Early HWS pink and fluffy; missing tangible stated
outcomes with strategy for delivery• Who is accountable for delivery of each priority to
the Board • Missing opportunities on ‘causes of the causes’

“ Social injustice is killing on a grand
scale “
Sir Michael Marmot
2010
With thanks to Mike GradyUniversity College London/Marmot Review Team

Inequality in Early Cognitive Development of British Children in the 1970 Cohort, 22 months to 10 years
0
10
20
30
40
50
60
70
80
90
100
22 26 30 34 38 42 46 50 54 58 62 66 70 74 78 82 86 90 94 98 102 106 110 114 118
months
Ave
rag
e p
osi
tio
n in
dis
trib
uti
on
High Q at 22m
Low Q at 22m
Source: Feinstein, L. (2003) ‘Inequality in the Early Cognitive Development of British Children in the 1970 Cohort’, Economica (70) 277, 73-97
High SES Low SES

Per cent achieving 5+ A* - C grades inc Maths and English at GCSE by IDACI decile of pupil residence: England 2007
25.329.9
34.239.2
44.749.5
53.857.8
61.968.4
0
10
20
30
40
50
60
70
80
0-10% 10-20%
20-30%
30-40%
40-50%
50-60%
60-70%
70-80%
80-90%
90-100%
% achieving 5+ A*-C GCSEs inc Maths and English
Income Deprivation Affecting Children Index (IDACI) Least deprived
Source: DCFS 2009
Most deprived

Clinical Commissioning Groups
Inherent Schizophrenia?
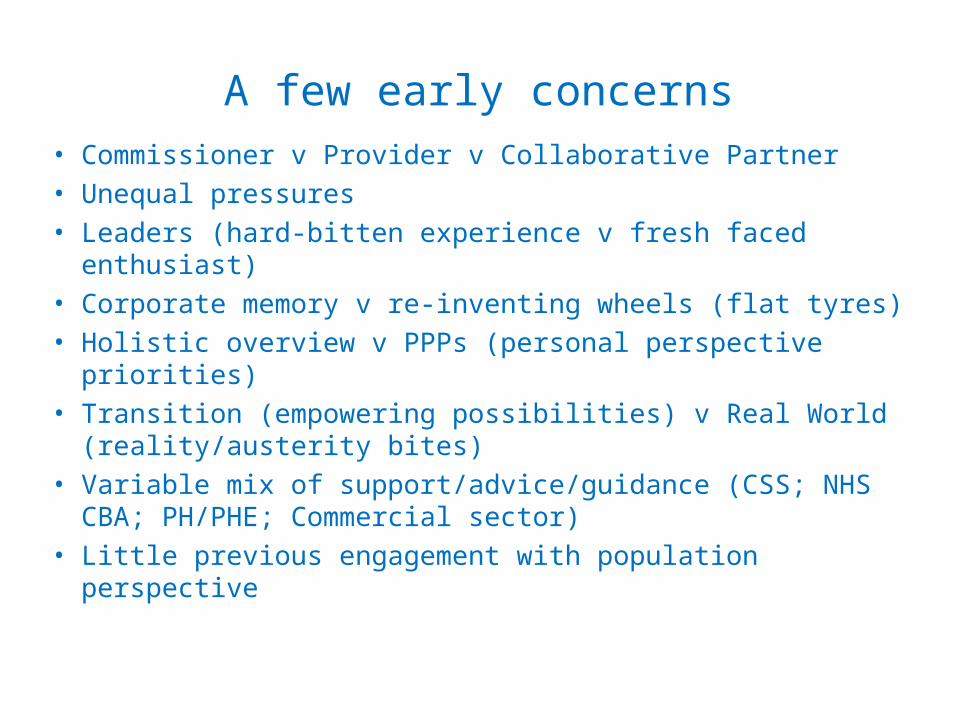
A few early concerns• Commissioner v Provider v Collaborative Partner• Unequal pressures• Leaders (hard-bitten experience v fresh faced
enthusiast)• Corporate memory v re-inventing wheels (flat tyres)• Holistic overview v PPPs (personal perspective
priorities)• Transition (empowering possibilities) v Real World
(reality/austerity bites)• Variable mix of support/advice/guidance (CSS; NHS
CBA; PH/PHE; Commercial sector)• Little previous engagement with population perspective

Primary Care Direct Action
HWBB
JSNA
HWBS
Commissioning
Primary Care
Commissioned Service
Primary Care Contribution to Health Improvement
CCG contribution
NHS Commissioning Board

18
• What is our ambition? What realistic but testing target are we aiming for?
• Can this be stated in terms that are easily understood and ‘owned’ by local stakeholders? In particular can it be pinned down to numbers?
• What are the main contributory factors responsible for the current adverse situation?
• What interventions could contribute substantially to these sort of numbers? Can they be delivered with sufficient system, scale and sustainability
• Can a realistic business case be developed to demonstrate appropriate return on investment?
Outline

Case Study 1
Oldham CCG
19

20
Setting Ambitions: Best in Peer Group (Males)
Male All Age All Cause Mortality (AAACM) Rates by GP Consortia, 2007-09
*Peer group = Former Spearhead PCTs in ‘Centres with Industry’ ONS area classification
Eng
land
ave
rage
500
550
600
650
700
750
800
850
900
950
GP Consortia in Peer Group*
Mo
rta
lity
Ra
te p
er
10
0,0
00
Oldham
SouthBirmingham

21
Estimating the scale of the challenge (Males)
Oldham Male AAACM rate 2001-2009, forecast and trajectory to 2013-15 ambition
500
550
600
650
700
750
800
850
900
950
1000
01-03 02-04 03-05 04-06 05-07 06-08 07-09 08-10 09-11 10-12 11-13 12-14 13-15
3 year average
Mal
e A
AA
CM
per
100
,000
Target
Actual
Forecast
Equivalent to 417 (13%) fewer male deaths in 2013-15
270 fewer deaths in 2013-15 expected based on current trend

22
Estimating the scale of the challenge : Summary
2007-09AAACM
(rate)
2013-15 ambition
(rate)
2007-09 deaths
(number)
2013-15 ambition(number)
Required reduction(number)
Expected reduction (number)
Additional reductionRequired
Males 833.6 721.2 3100 2683 417 270 147
Females 597.7 497.8 3410 2774 636 297 339
Persons - - 6510 5457 1053 567 486
Reductions in mortality numbers necessary to meet 2013-15 targets

23
Identifying ‘excess’ mortality by age group
Number of excess deaths by age group in Oldham compared to England average, 2006-08
0
50
100
150
200
250
<1yr
1-4 5-9 10-14
15 -19
20 -24
25 -29
30 -34
35 -39
40 -44
45 -49
50 -54
55 -59
60 -64
65 -69
70 -74
75 -79
80 -84
85+
Age group
Exc
ess
deat
hs 2
006-
08(p
erso
ns)
Source: Derived from London Public Health Observatory Health Inequalities Intervention Tool data

24
Identifying ‘excess’ mortality by cause
Number of excess deaths in Oldham by cause, gender and broad age groupcompared to England average, 2006-08
0
50
100
150
200
250
CH
D
Str
oke
All
canc
ers
CO
PD
Pne
umon
ia
Live
r di
seas
e
Dia
bete
s
Oth
er c
ause
s
CH
D
Str
oke
All
canc
ers
CO
PD
Pne
umon
ia
Live
r di
seas
e
Dia
bete
s
Oth
er c
ause
s
Exc
ess
num
ber
of d
eath
s 20
06-0
8
75+ years
<75 years
Source: Derived from NCHOD standardised mortality ratios (SMR) and mortality numbers by age and cause.Excess mortality = ‘observed’ minus ‘expected’ deaths
Males Females
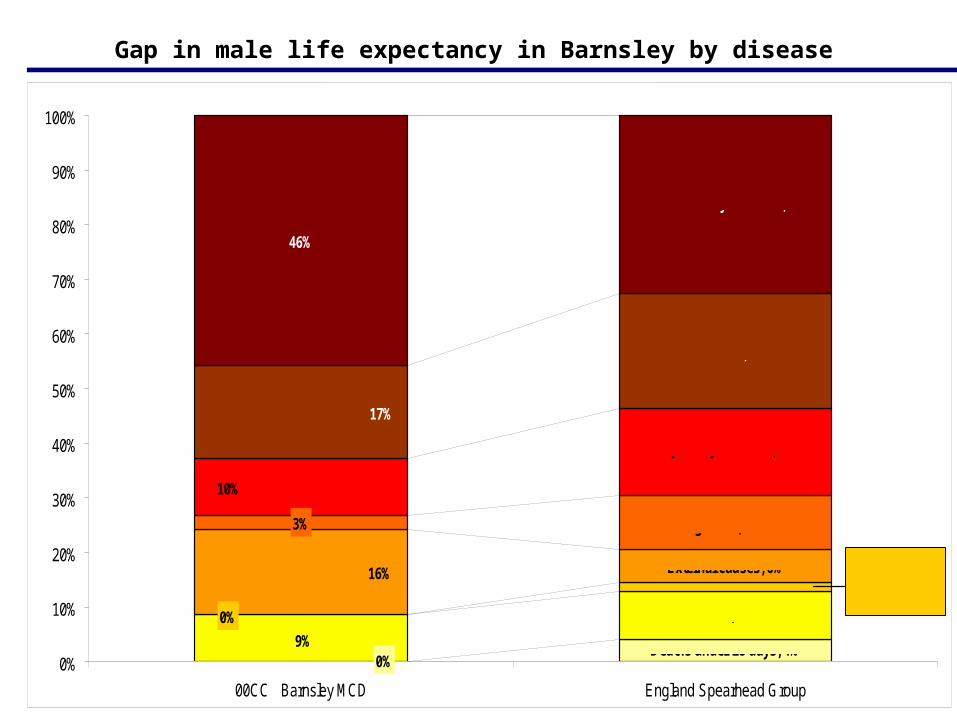
Breakdown of the life expectancy gap by disease, males
3%
0%9%
0%
16%
10%
17%
46%
0%
10%
20%
30%
40%
50%
60%
70%
80%
90%
100%
00CC Barnsley MCD England Spearhead Group
All circulatory diseases, 33%
All cancers, 21%
Respiratory diseases, 16%
Digestive, 10%
External causes, 6% Infectious and parasitic diseases, 2%
Other, 9%
Deaths under 28 days, 4%
Gap in male life expectancy in Barnsley by disease

26
Potential impact of evidence-based interventions on reducing mortality numbers
InterventionDeaths
postponedTreatment population
NNT to postpone one death
Secondary prevention following CVD eventFour treatments (beta blocker, aspirin, ACE inhibitor, statin)
Currently untreated: CVD deaths averted 31 4,335 136
Currently partially treated: CVD deaths averted 61 15,335 253
Additional treatment for hypertensives
Additional hypertensive therapy 62Statin treatment for hypertensives with high CVD risk 27
Warfarin for atrial fibrillation >65 years
Stroke deaths averted 17 609 35
Improving diabetes management
Reducing blood sugars (HbA1c) over 7.5 by one unit 13 3,092 232
Treating CVD risk among COPD patients
Statins for eligible mild & moderate COPD patients 45 1,833 40
Total 258 - -
38,053 425
NNT = Number Needed to Treat to postpone one death

27
Aim: Deliver a short-term plan to place the PCT on a target AAACM trajectory for males
The Plan: Focus on six evidence based interventions:1. Full implementation of evidence based treatments for patients with CVD who are
currently untreated2. Full implementation of evidence based treatments for patients with CVD who are
currently partially treated3. Finding and treating undiagnosed hypertensives4. Moving patients on Atrial Fibrillation registers from aspirin to warfarin 5. Statins to address CVD risk among COPD patients. 6. Reducing blood sugar in diabetic patients
Expected Outcomes• Improved management of primary and secondary prevention of CVD• Postponement of up to 257 deaths from CVD if the interventions are fully
implemented, although this would depend on pace of incremental delivery • Achieving 38% of full implementation of all interventions would deliver the AAACM
target although again this depends on pace of incremental delivery
Using the model: a worked example (1)
Source: Rochdale PCT AAACM Recovery Plan, Nov 2010

28
Using the model: a worked example (3)
• Intervention:Statins to address CVD risk among patients with mild or moderate COPD
• Evidence Base: Observational studies show CVD is the leading cause of mortality among patients with mild and moderate COPD, yet CVD risk is often untreated among this patient group
• Treatment population: Aim to increase coverage from 26% to 66% of all COPD patients. (Current treatment coverage of 26% estimated from local audit of COPD registers plus estimate of undiagnosed COPD from APHO prevalence estimate.) Equates to an additional 2,450 COPD patients on a statin
• Outcomes: Estimated 55 deaths prevented (consistent with model which shows effect of additional 40% COPD patients on a statin)
• Costs: Recurrent costs of £95,000 (includes finding additional patients)

Case Study 2
Atypical situation – Blackpool PCT
29

30
Setting Ambitions: Best in Peer Group (Males)
Male All Age All Cause Mortality (AAACM) Rates by GP Consortia, 2008-10
*Peer group = PCTs in ‘Costal and Countryside ’ ONS area classification

31
Setting Ambitions: Best in Peer Group (Males)
Male All Age All Cause Mortality (AAACM) Rates by GP Consortia, 2008-10
*Peer group = Former Spearheads in the NHS North West Clinical Commissioning groups

32
Estimating the scale of the challenge : Summary
Reductions in mortality numbers necessary to meet 2014-16 targets
2008-10 2014-16 2008-10 2014-16 Required Expected Additional AAACM Ambition deaths Ambition reduction reduction reduction
(rate) (rate) (number) (number) (number) (number) requiredMales 932.3 693.9 2812 2093 719 281 438
Females 604.3 512.2 2771 2349 422 188 234
Persons 5583 4441 1142 469 673

Excess Male Mortality (%) Blackpool vs. All Spearheads

Excess Female Mortality (%) Blackpool vs. All Spearheads

Gap in male life expectancy in Blackpool by disease

36
Potential impact of evidence-based interventions on reducing mortality numbers
NNT = Number Needed to Treat to postpone one death

Proportionate Need for Levels of ARH Service Proportionate Need for Levels of ARH Service (not to scale)(not to scale)
Tier 1
Tier 2
Tier 3
Tier 4
er
Tier 1
Tier 2
Tier 4
Blackpool
Tier 3
Average Borough

Case Study 3
Good average health with pockets of deprivation
Kent CC
38

All age, all cause mortality rates, 3-year averages, Kent & Medway

Slope Index for Medway (Males)

Slope Index for Medway (Males)
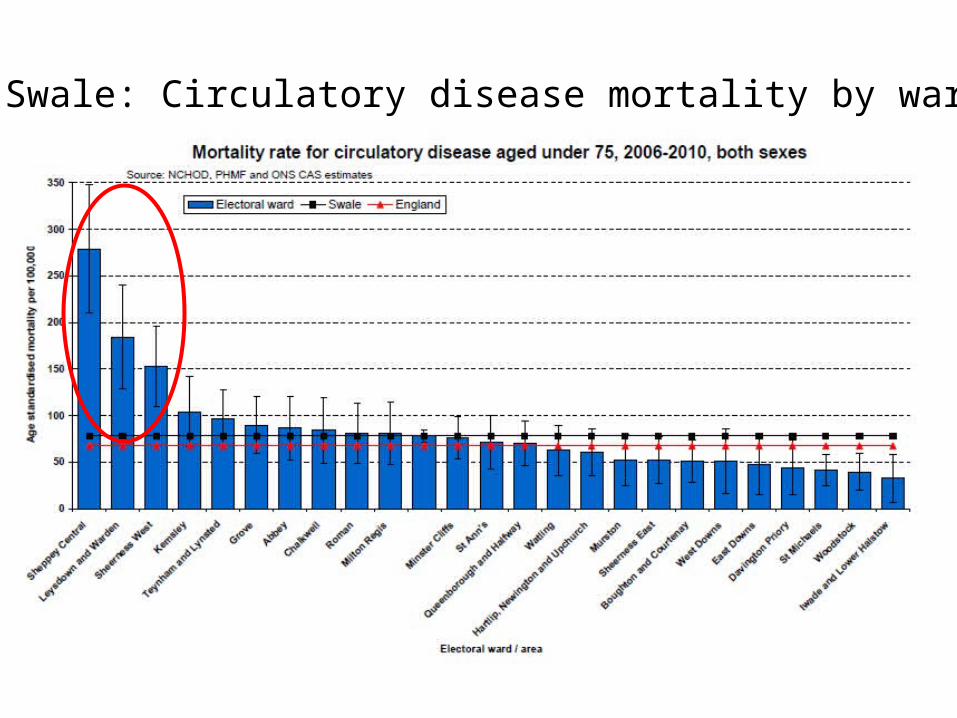
Swale: Circulatory disease mortality by ward

Swale: Causes of excess mortality, worst quintile compared to rest

(Dis-)Integrated Commissioning for Population Health

Primary Care Direct Action
HWB
JSNA
HWBS
Commissioning
Primary Care
Commissioned Service
Primary Care Contribution to Health Improvement
CCG contribution
NHS Commissioning Board

Commissioning Services to Achieve Best Population Outcomes
Population Focus Optimal Population
Outcome
13.Networks,leadership and coordination
1.KnownIntervention
Efficacy
6.KnownPopulation Needs 12. Balanced Service Portfolio
11.Adequate Service Volumes
Challenge to Providers
10. Supported self-management
5. Engaging the public
9. Responsive Services
4. Accessibility
7. Expressed Demand 2. Local Service Effectiveness
8. Equitable 8. Equitable ResourcingResourcing
3.Cost EffectivenessC Bentley
2007

Improving Male Life Expectancy in Birmingham

48
Identifying Primary Care performance to outcomes
QOF registered prevalence and CHD Mortality(<75) in Oldham (MSOAs)

49
10.2 m
19.9 m
2.6 m
17.1 m
High Risk Have LTC Aware of LTC
Eligible for treatment
Optimal treatment
Compliant with treatment
5.7m2.6m 2.3m
1.3m 1m
2.8m1.8m 1.8m
0.4m Not known
0.9m 0.48m 0.21m 0.1m 0.08m
2.9m0.9m 0.52m 0.26m 0.14m
CHF
COPD
10.2 m
19.9 m
High Risk Have LTC Aware of LTC
Eligible for treatment
Compliant with treatment
CHD
Diabetes
NOTE: Figures are for UK. Taken from Harrison W, Marshall T, Singh D & Tennant R “The effectiveness of healthcare systems in the UK – scoping study”; Department of Public Health & Epidemiology and HSMC University of Birmingham, July 2006.
Disease management provided according to evidence-based protocols e.g. NSFs or NICE
guidance

Quality of delivery
CHD 6 - % patients whose last BP reading <= 150/90 (measured in last 15 months)
0%
20%
40%
60%
80%
100%
Practice code
Target Met Target Missed Exception Coded

CHD 6 - % patients whose last BP reading <= 150/90 (measured in last 15 months)
0%
20%
40%
60%
80%
100%
Practice code
Target Met Target Missed Exception Coded
Wakefield

52
Identifying the untreated patients (GP practice)
CHD: Expected vs QOF Registered Prevalence (Percentage)
A quarter of patients with a history of CHD are estimated undiagnosed (untreated)
CHD 8 - % patients whose last measured cholesterol <= 5mmol/l (measured in last 15 months)
0%
20%
40%
60%
80%
100%
Practice code
Target Met Target Missed Exception Coded Undiagnosed based on Expected Prevalence

53
Identifying the untreated patients (GP practice)
WAKEFIELD PCT

ALW – ‘thousands’ missing dementia diagnosis
54