ppg - first quarter 2016 financial results/media/files/p/ppg-ir/... · q4'14 q1'15...
TRANSCRIPT

Information current as of April 21, 2016
Michael H. McGarry, President and Chief Executive Officer
Frank S. Sklarsky, Executive Vice President and Chief Financial Officer
Vincent J. Morales, Vice President Investor Relations and Treasurer
Scott A. Minder, Director Investor Relations
PPG - First Quarter 2016 Financial Results

The Private Securities Litigation Reform Act of 1995 provides a safe harbor for forward-looking statements made by
or on behalf of the Company. This presentation contains forward-looking statements that reflect the Company’s
current views with respect to future events and financial performance. You can identify forward-looking statements
by the fact that they do not relate strictly to current or historic facts. Forward-looking statements are identified by the
use of the words “aim,” “believe,” “expect,” “anticipate,” “intend,” “estimate,” “project,” “outlook,” “forecast” and other
expressions that indicate future events and trends. Any forward-looking statement speaks only as of the date on
which such statement is made, and the Company undertakes no obligation to update any forward looking statement,
whether as a result of new information, future events or otherwise. You are advised, however, to consult any further
disclosures we make on related subjects in our reports to the Securities and Exchange Commission. Also, note the
following cautionary statements.
Many factors could cause actual results to differ materially from the Company’s forward-looking statements. Such
factors include global economic conditions, increasing price and product competition by foreign and domestic
competitors, fluctuations in cost and availability of raw materials, the ability to maintain favorable supplier
relationships and arrangements, the timing of and the realization of anticipated cost savings from restructuring
initiatives, difficulties in integrating acquired businesses and achieving expected synergies therefrom, economic and
political conditions in international markets, the ability to penetrate existing, developing and emerging foreign and
domestic markets, foreign exchange rates and fluctuations in such rates, fluctuations in tax rates, the impact of
future legislation, the impact of environmental regulations, unexpected business disruptions and the unpredictability
of existing and possible future litigation, including litigation that could result if the proposed asbestos settlement does
not become effective. However, it is not possible to predict or identify all such factors. Consequently, while the list of
factors presented here and under Item 1A of PPG’s 2015 Form 10-K is considered representative, no such list
should be considered to be a complete statement of all potential risks and uncertainties. Unlisted factors may
present significant additional obstacles to the realization of forward-looking statements. Consequences of material
differences in the results compared with those anticipated in the forward-looking statements could include, among
other things, lower sales or earnings, business disruption, operational problems, financial loss, legal liability to third
parties, other factors set forth in Item 1A of PPG’s 2015 Form 10-K and similar risks, any of which could have a
material adverse effect on the Company’s consolidated financial condition, results of operations or liquidity. All of
this information speaks only as of April 21, 2016, and any distribution of this release after that date is not intended
and will not be construed as updating or confirming such information. PPG undertakes no obligation to update
any forward-looking statement, except as otherwise required by applicable law.
Forward Looking Statement
2

• Sales growth continues; 4 percent increase in local currencies
Aggregate sales volumes increased 1 percent year-over-year, led by 3 percent growth in EMEA
Acquisition-related sales contributed 3 percent from 6 acquisitions completed in 2015
Unfavorable foreign currency translation reduced sales by 4 percent, or approximately $140 million
• Record quarterly adjusted earnings per diluted share
First quarter record adjusted earnings per diluted share of $1.31; up 11 percent versus the prior year,
despite a $0.04 unfavorable foreign currency translation impact
Thirteenth consecutive quarter of double-digit percentage adjusted earnings per diluted share growth
Segment income improved 9 percent in local currencies due to sales volume growth, acquisition-
related income, and continued cost management
On pace to fully realize previously announced restructuring benefits
• Cash deployment continues
Cash and short-term investments of $1.0 billion at quarter-end
Operating working capital as a percent of sales improved by 90 basis points versus prior year
Cash deployment focused on earnings accretion
Share repurchases of $150 million; average diluted shares outstanding reduced by 2 percent YOY
Company remains on pace for earnings-accretive cash deployment in 2015 and 2016 (combined) of
$2.0 -to- $2.5 billion
$1.3 billion deployed period-to-date
First Quarter 2016 Financial Highlights
3

PPG First Quarter Net Sales
3,662 3,672+0.3% +1.0% -3.8% +2.8%
$3,250
$3,500
$3,750
1Q'15 Price Volume Currency Acq./Div. 1Q'16($ in millions)
4
4.7%
3.3%2.9%
3.5%
1.2% 1.1%
-0.7%
1.5%1.0%
-6%
-4%
-2%
0%
2%
4%
6%
1Q'14 2Q 3Q 4Q 1Q'15 2Q 3Q 4Q 1Q'16
PPG Y-O-Y Volume Trends (excl. price, currency and acquisition/divestiture impacts)
1Q’16: Continuation of modest global growth
1.37
1.13
1.10
1.05
1.10
1.15
1.20
1.25
1.30
1.35
1.40
1Q'14 2Q 3Q 4Q 1Q'15 2Q 3Q 4Q 1Q'16
Dollar/Euro Conversion Rate(Quarter rate = 3-month average)
Euro decline moderating versus prior quarters
-3%

1%
3%
0%
1%
3%
3%
-0%
2%
1%
2%
-4%
-1%
1%
2%
1%
1%
6%
1%
-1%
1%
-4% 0% 4% 8%
1Q'15 2Q'15 3Q'15 4Q'15 1Q'16
U.S. & Canada
Total CoatingsYear-over-year sales volumes were slightly higher than the prior
year; continued sequential improvement.
Volume results were uneven by business. Growth led by auto
refinish and packaging coatings. Regional architectural coatings
volumes improved modestly with mixed performance across
channels and softness in Canada. Lower aerospace volumes
due to uneven customer demand and inventory management.
Asia & Latin Am.
Europe, Middle
East and Africa
(EMEA)
Improving regional sales volume growth rate trend continued for
5th consecutive quarter.
Expanding growth footprint across businesses and countries led
by packaging and automotive OEM coatings. Improved
architectural coatings EMEA sales volumes across several
countries Y-O-Y and sequentially.
Net Sales Volume Trends – Coatings SegmentsPPG Coatings Y-O-Y Regional Volume Trends(excl. price, currency and acquisition/divestiture impacts)
U.S. & Canada:
Asia & Latin America (emerging regions):
Europe, Middle East & Africa:
1Q 2016 Commentary Y-O-Y (versus 1Q 2015):
Sales volume growth continued despite strong prior year growth
of 6 percent. Sales volumes increased in China, India, and
Australia, partially offset by declines in Brazil and Korea.
Business unit growth was led by packaging, refinish, and
protective & marine coatings. Automotive OEM coatings Y-O-Y
comparison against robust PPG-specific prior year double-digit
percentage Asian growth.
5
1Q’16
4Q’15
1Q’15
2Q’15
3Q’15

Q1 2015 Q1 2016
Growth Rate
> 2%
Between 2% & 0%
< 0%
Germany
France
Italy
Spain
UK
Germany
France
Italy
Spain
UK
Expansion of growth rates across Western Europe
PPG Western Europe Organic Growth Trends
6

* Adjusted EPS (from continuing operations) – see presentation appendix for reconciliation to reported EPS
PPG First Quarter Earnings Per Share
Adjusted Earnings Per Diluted Share*
0.69
0.99
1.18
1.31
$0.00
$0.50
$1.00
$1.50
1Q'13 1Q'14 1Q'15 1Q'16
Results up 11% versus record prior year
CAGR – 24% Reporting segment updates included on
succeeding slides. Aggregate items
embedded in segment reviews:
Income leverage from sales volume growth
Continued cost management
Acquisition-related income
Unfavorable foreign currency translation Y-O-Y (~$15MM pre-tax)
Higher corporate net interest cost (March
2015 debt issuance):
1Q 2016 net interest = $24MM
1Q 2015 net interest = $18MM
Higher effective income tax rate on adjusted
net income (mix of geographic earnings):
1Q 2016 = 25.0%
1Q 2015 = 24.4%
Average diluted shares outstanding down 2
percent vs. prior-year quarter
First Quarter Comments
7

First Quarter (Y-O-Y):
Continued automotive refinish coatings organic sales growth led by U.S. and China
Lower aerospace volumes due to reduced industry demand and customer inventory management
Increased volumes in architectural coatings EMEA due to broadening demand in Western Europe
Modest local currency sales growth in architectural coatings Americas & Asia Pacific:
Higher Comex, U.S. company-owned stores and national accounts offset by lower independent dealer and Canadian demand
New product launches/growth initiatives at U.S. national accounts (~$15MM planned expense)
Protective coatings sales volume growth offset by weak marine industry demand
Acquisition-related sales of ~$25MM
Unfavorable foreign currency translation on segment sales (~$85MM) and income (~$10MM)
Performance Coatings
Second Quarter 2016 Outlook:
Higher sequential sales due to normal seasonality
Continued growth Y-O-Y in automotive refinish and protective coatings, further weakness in marine
Modest improvement in aerospace demand; return to normal customer order patterns
Architectural coatings EMEA improving; economic recovery-related gains in certain countries
Consistent industry demand trends (seasonally adjusted) in architectural U.S. & Canada
No additional expense for product launches and other growth initiatives
Comex local currency sales growth expected to remain at double the Mexican GDP growth rate
Acquisition-related sales of $20 -to- $30MM
Unfavorable Y-O-Y foreign currency translation; slightly less than first quarter 2016 at current rates
$MM (USD) 1Q15 1Q16 Chg %
Net Sales 2,055 2,039 -16 -1%
Income 262 279 17 +6%
Margin % 12.7% 13.7% -- --
Select Net Sales Detail Total Volume Currency
1Q Y-O-Y Change -1% +1% -4%
8
New Products at U.S. National Accounts

3.5
4.0
4.5
5.0
5.5
6.0
6.5
7.0
N. America EMEA China
Q1'14 Q1'15 Q1'16 Q2'14 Q2'15 Q2'16
First Quarter (Y-O-Y):
Auto OEM sales volumes in line with moderating global industry growth rates; PPG Y-O-Y results tempered by double-digit percentage prior year growth in Asia
Industrial and specialty coatings and materials sales volumes grew modestly vs. prior year; sequential quarter improvement in EMEA and U.S.
Continued positive momentum in packaging coatings with mid-to-high single digit percentage (above market) growth in each major region
Acquisition-related sales of ~$85MM
Unfavorable foreign currency translation on segment sales (~$50MM) and income (~$5MM)
Second Quarter 2016 Outlook:
Modestly higher sequential sales due to normal seasonal patterns
Auto OEM growth supported by higher industry build growth sequentially
Modest general industrial demand growth continues; varies by geography and sub-sector
Continued growth in packaging coatings due to accelerating industry conversions to new can coatings technologies in all regions
Acquisition-related sales growth $35 -to- $45MM
Unfavorable Y-O-Y foreign currency translation
Industrial Coatings$MM (USD) 1Q15 1Q16 Chg %
Net Sales 1,340 1,372 32 +2%
Income 244 265 21 +9%
Margin % 18.2% 19.3% -- --
Select Net Sales Detail Total Volume Currency
1Q Y-O-Y Change +2% +1% -4%
9
Regional Auto Production Forecast (million units)
Source: IHS Global Insights

33 30
3732
38
28
0
10
20
30
40
50
Q4'14 Q1'15 Q2'15 Q3'15 Q4'15 Q1'16
First Quarter (Y-O-Y):
Improved flat glass pricing
Lower flat glass volumes driven by scheduled facility outage; solid end-market demand remains
Modestly lower fiber glass sales volumes; increases in Europe offset by lower U.S. demand; strong cost management focus
Scheduled flat glass facility repair-related expenses of $8MM
Lower equity earnings due to weaker Asian demand (consumer electronics)
Unfavorable foreign currency translation on segment sales (~$5MM) and minimal income impact
Second Quarter 2016 Outlook:
Flat glass facility ramping-up during the second quarter to full capability following repair:
Moderate impact on volumes
Residual ramp-up costs (~$4MM)
Flat glass price increase effective during quarter
Continuation of current fiber glass demand trends; cost focus remains
Lower Y-O-Y equity earnings continue
Unfavorable Y-O-Y foreign currency translation
Glass
Select Net Sales Detail Total Volume Currency
1Q Y-O-Y Change -2% -2% -1%
$MM (USD) 1Q15 1Q16 Chg %
Net Sales 267 261 -6 -2%
Income 30 28 -2 -7%
Margin % 11.2% 10.7% -- --
Glass Segment Income ($MM)
10
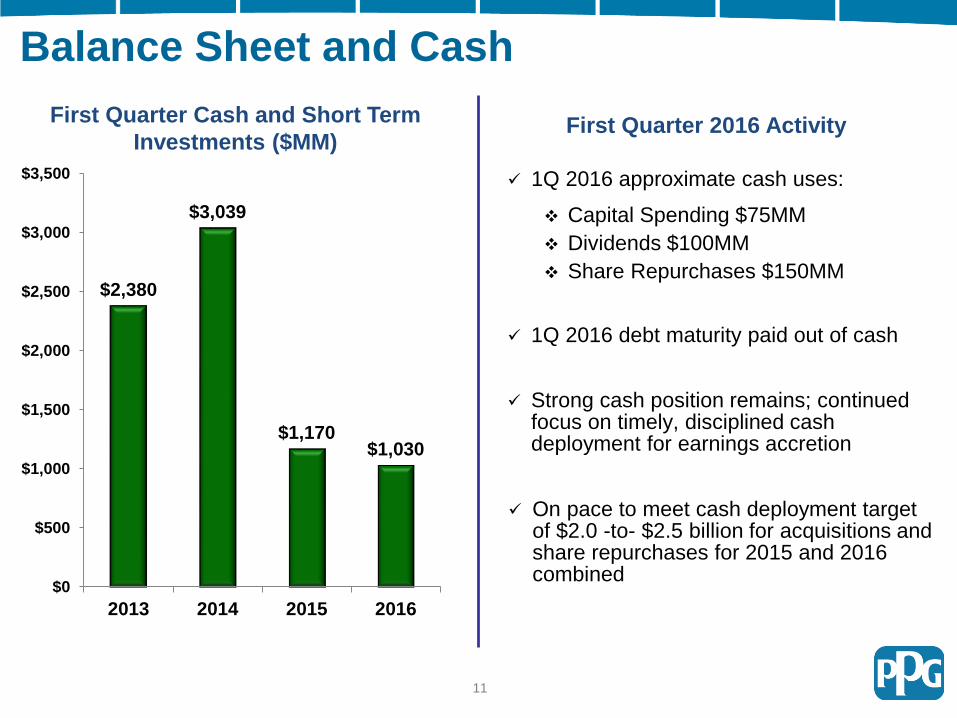
Balance Sheet and Cash
$2,380
$3,039
$1,170$1,030
$0
$500
$1,000
$1,500
$2,000
$2,500
$3,000
$3,500
2013 2014 2015 2016
First Quarter Cash and Short Term
Investments ($MM)
1Q 2016 approximate cash uses:
Capital Spending $75MM
Dividends $100MM
Share Repurchases $150MM
1Q 2016 debt maturity paid out of cash
Strong cash position remains; continued focus on timely, disciplined cash deployment for earnings accretion
On pace to meet cash deployment target of $2.0 -to- $2.5 billion for acquisitions and share repurchases for 2015 and 2016 combined
First Quarter 2016 Activity
11

Record first quarter financial performance
Record first quarter adjusted earnings per diluted share up 11 percent year-over-year; 13th consecutive
double-digit percentage increase
Sales in local currencies up 4 percent; acquisition-related sales added 3 percent and sales volumes
grew by 1 percent
Fifth consecutive quarter of broadening European sales volume growth
Cost management discipline, including restructuring actions, contributed to earnings growth
Strong results despite unfavorable foreign currency translation on reported segment sales ($140 million)
and income (~$15 million)
Shareholders and balance sheet flexibility remain a focus
Cash and short-term investments totaling ~$1.0 billion at quarter-end
Operating working capital focus remains; improved by 90 basis points versus prior year
Quarterly dividend increase of 11 percent per share; effective Q2 2016
Earnings accretive cash deployment continues
On pace to deliver cash deployment of $2.0 -to- $2.5 billion (2015 and 2016 combined)
Share repurchases of ~$150 million in the quarter
Cash deployment of $1.3 billion on share repurchases and acquisitions since start of 2015
First Quarter Summary
12

Thank you for your interest in PPG Industries, Inc.
Contact Information:
Investors:
Scott Minder - (412) 434-3466
Media:
Mark Silvey - (412) 434-3046
Additional Materials and Appendix

1st Quarter Reporting Period
Adjusted EPS Reconciliation
Amounts in Millions of USD except EPS
Continuing Operations Discontinued Operations Total PPG
Net Income EPS Net Income EPS Net Income EPS
Year 2016
Net Income Attributable to PPG as Reported $ 347 $ 1.29 $ -- $ -- $ 347 $ 1.29
Transaction-related costs 1 0.01 -- -- 1 0.01
Asset write-down 3 0.01 -- -- 3 0.01
Adjusted Net Income Attributable to PPG $ 351 $ 1.31 $ -- $ -- $ 351 $ 1.31
Year 2015
Net Income Attributable to PPG as Reported $ 321 $ 1.16 $ 1 $ 0.01 $ 322 $ 1.17
Transaction-related costs 6 0.02 -- -- 6 0.02
Adjusted Net Income Attributable to PPG $ 327 $ 1.18 $ 1 $ 0.01 $ 328 $ 1.19
Year 2014
Net Income Attributable to PPG as Reported $ 277 $ 0.98 $ 985 $ 3.50 $ 1,262 $ 4.48
Transaction-related costs 2 0.01 -- -- 2 0.01
Adjusted Net Income Attributable to PPG $ 279 $ 0.99 $ 985 $ 3.50 $ 1,264 $ 4.49
Year 2013
Net Income Attributable to PPG as Reported $ 191 $ 0.64 $ 2,219 $ 7.51 $ 2,410 $ 8.15
Legacy pension costs 13 0.04 -- -- 13 0.04
Environmental costs 8 0.03 8 0.03
Transaction-related costs 5 0.01 -- -- 5 0.01
U.S. tax law change enacted in 2013 (10) (0.03) -- -- (10) (0.03)
Adjusted Net Income Attributable to PPG $ 207 $ 0.69 $ 2,219 $ 7.51 $ 2,426 $ 8.20
Year 2012
Net Income/(Loss) Attributable to PPG as Reported $ (49) $ (0.16) $ 61 $ 0.20 $ 12 $ 0.04
Business restructuring 137 0.45 26 0.08 163 0.53
Environmental reserves 99 0.32 -- -- 99 0.32
Transaction-related costs 4 0.01 -- -- 4 0.01
Adjusted Net Income Attributable to PPG $ 191 $ 0.62 $ 87 $ 0.28 $ 278 $ 0.90