powertech engineering services - present...
TRANSCRIPT

TRANSIENT ANALYSIS STUDIES
Powertech Engineering Services
Page 2 of 16
Transient Analysis Studies
Summary
Electrical transient power system performance studies are completed for clients with Permanent or
Temporary Power Supplies to assess if running under various operational scenarios meets the
system Design Criteria and National/State Technical Rules Criteria. It is important to assess at least
the following electrical system operations for transient responses:
• Largest Motor Start Event
• Largest Switching Event
• Largest Load Rejection Event
• Variable Speed Drive Performance due to Switching Events
Transient surge voltage effects internal to the plant from lightning, switching and internal reflections
are reviewed separately in an Insulation Coordination Assessment.
Transient studies can be completed using either: ETAP, Digsilent Power Factory or SKM Power
Tools. There are two approaches to transient response testing using either:
• Full Network Modelling
• Stand-Alone Modelling
Full network modelling links the facility model with the network providers model which provides full
network response dynamic transient analysis because all cable and equipment responses are
included in the analysis. This approach requires strict model control in conjunction with the upstream
network provider so any changes must be tracked. This can add minor accuracy benefits over the
stand-alone method but becomes time consuming to manage and costly to implement.
Alternatively, the model can be confined within the facility electrical distribution system to the terminal
connection points at the Main Switchboard. The results of the transient analysis in this case will be
determined by the influence of the upstream minimum and maximum short circuit currents which
provide the input system impedances with respect to the upstream X/R ratio. This is all that is really
required to represent an upstream substation. These parameters are provided by the power supply
provider whether it be a local generation system or a network provider. This technique reduces
reliance on minor changes to the upstream model. It only relies on the upstream currents and X/R
ratio to provide a reasonably accurate transient response.
Maximum transient responses occur on a low impedance system with respect to a higher impedance
source. The mode of operation providing low system impedance in proportion to source impedance
is at maximum system load. Therefore, this is generally the only analysis mode required and reduces
costs by saving on unnecessary operational scenarios.
The transient analysis study demonstrates that the step voltage change on the buses remain within
acceptable limits. The studies also confirm that the system will operate in compliance with the
clauses as stated in Technical Rules for: step changes in voltage levels resulting from switching
operations, voltage stability and fault types to be studied.

Page 3 of 16
Transient Analysis Studies
Table of Contents
1.0 Transient Study Methodology ..................................................................................................... 4
1.1 Overview ...........................................................................................................................................4
1.2 Operation Mode ...............................................................................................................................4
1.3 Network or Generation Configuration ..............................................................................................4
1.4 Unbalanced Load Flow Analysis ........................................................................................................4
1.5 Short Circuit and Fault Studies ..........................................................................................................4
1.6 Transient Stability Simulation and Analysis ......................................................................................4
1.7 Largest Motor Start Event ................................................................................................................5
1.8 Largest Transformer Energisation Event...........................................................................................5
1.9 Largest Load Rejection Event ............................................................................................................5
1.10 Assessment of Infrequent Switching Operations on Existing Plant Variable Speed Drive
Performance. ................................................................................................................................................7
1.10.1 Assessment of VSD drive on Starting of DOL Drive. ..................................................................7
1.10.2 Assessment of VSD drive on Transformer Energisation Switching Event ..................................7
1.10.3 Assessment of VSD drive on Load Rejection Event. ..................................................................7
1.10.4 Performance of VSD Drive ........................................................................................................7
2.0 Results Expected from A Typical Transient Study ......................................................................... 8
2.1 Performance of Transient Event Results ...........................................................................................8
2.1.1 Motor Start Event .........................................................................................................................8
2.1.2 Transformer Energisation Switching Event. ................................................................................10
2.1.3 Largest Load Rejection Event ......................................................................................................11
2.1.4 Assessment of Infrequent Switching Operations on Variable Speed Drives. ..............................12
3.0 Final Notes ............................................................................................................................... 15

Page 4 of 16
Transient Analysis Studies
1.0 Transient Study Methodology
Power System Study software is used for the simulation of transient events. Using Electromagnetic
Transient Algorithms applied to the power system model dynamically, the transient responses of the
electrical power system can be analysed. The dynamic network model is used for electromagnetic
and electromechanical transients under balanced and unbalanced network conditions.
1.1 Overview
The following steps are followed when performing electromagnetic transient simulations:
• Selection of operation mode
• Selection of network configuration
• Simulation of unbalanced load flow and 3-phase maximum fault
• Simulation of initial conditions and transient event.
1.2 Operation Mode
The operating mode will produce transient response to switching operations of selected loading
scenarios.
1.3 Network or Generation Configuration
The transient simulation should be carried out for network or generation configurations in terms of
number of units and whether bus ties are opened or closed.
1.4 Unbalanced Load Flow Analysis
The electromagnetic transient evaluation of switching events uses plant running load. Transient
analysis requires an unbalanced load flow to provide a detailed representation of component
unsymmetrical characteristics.
1.5 Short Circuit and Fault Studies
Short circuit analysis is run under the chosen operating mode and network/generation configuration
to configure initial set-points for the transient analysis.
1.6 Transient Stability Simulation and Analysis
Transient stability simulation is completed to ensure the Design and Technical Rules acceptance
criteria requirements are met for the following events as a minimum:
• Largest Motor Start Event
• Largest Transformer
Energization Event
• Short Circuit Event
• Largest Load Rejection Event
• VSD Performance
• Transient Surge Voltage Effects

Page 5 of 16
Transient Analysis Studies
1.7 Largest Motor Start Event
The transient analysis of the largest motor start event is completed to determine the following
acceptance criteria are met:
• Power frequency voltage variation of the plant is in accordance with Electrical Design
Criteria.
• Power frequency voltage variation of plant at the point of connection meets Technical
Rules.
Acceptance criteria for power frequency voltage variation as per the Electrical Design Criteria and
the Technical Rules at the point of supply may show for example:
• Step changes in voltage levels resulting from switching operations shall not exceed the
limits given.
• The minimum steady state voltage on the transmission network will be 90% of nominal
voltage and the maximum steady state voltage will be 110 % of nominal voltage.
In addition, the Electrical Design Criteria may state that for the point of supply to the facilities require:
• Step change voltage limits during routine switching (e.g. capacitor switching,
transformer tap changing, motor starting) shall be +/-5%, and for infrequent switching
events (e.g. tripping of generators, loads and other faults) shall be +6% to -10%.
• To meet the acceptance criteria for maximum voltage drop during a motor starting
event as per the Technical Rules, requires that for a routine switching event (i.e. motor
starting) at less than the supply voltage, the step change voltage limits shall be within
+/- 5% (max) of the nominal voltage at the Point of Connection.
1.8 Largest Transformer Energisation Event
Energising an unloaded transformer via a long cable may cause excessive over-voltages on the
secondary side due to a resonant overvoltage phenomenon and therefore may cause under-voltage
at the transformer primary.
A transient analysis for transformer energisation event may be completed to determine the following
acceptance criteria are met:
• Power frequency voltage variation of the plant is in accordance with Electrical Design
Criteria.
• Power frequency voltage variation of plant at the point of connection meets Technical
Rules.
1.9 Largest Load Rejection Event
The transient analysis for load rejection is completed by selecting an appropriate and large plant
load and switching it off during normal operation. To determine the response, the following
acceptance criteria shall be met:
• Power frequency voltage variation of the plant is in accordance with Electrical Design
Criteria.

Page 6 of 16
Transient Analysis Studies
• Power frequency voltage variation of plant at the point of connection meets Technical
Rules.
A suitable acceptance criteria for temporary over voltage as per the Electrical Design Criteria and
Technical Rules would be:
• Temporary AC over-voltages should not exceed the time duration limits given in Figure
1.1.
• In addition, the Electrical Design Criteria may state that for the point of supply to the
facilities: “For infrequent switching events (e.g. tripping of generators, loads and other
faults) shall be +6% to -10%”.
For example, to meet the acceptance criteria for maximum temporary over voltage during tripping of
loads as per the Technical Rules may require that for a load rejection event (i.e. tripping of load) at
less than certain voltages, the highest acceptable temporary over voltage for duration of 0.2 seconds
shall be no more than 1.5 p.u. at the Point of Connection. The studies would be performed on the
basis that the load is switched and not tripped from an electrical fault.
Figure 1-1 Temporary Overvoltage Limit

Page 7 of 16
Transient Analysis Studies
1.10 Assessment of Infrequent Switching Operations on Existing Plant Variable
Speed Drive Performance.
The transient response is completed to determine the performance of the variable speed drive.
1.10.1 Assessment of VSD drive on Starting of DOL Drive.
A simulation is completed to demonstrate the performance of VSD drives during the switching
operation of the largest motor start.
1.10.2 Assessment of VSD drive on Transformer Energisation Switching Event
A simulation is completed to demonstrate the performance of a VSD drive during the switching
operation of a large transformer which is unloaded.
1.10.3 Assessment of VSD drive on Load Rejection Event.
A simulation is completed to demonstrate the performance of VSD drives during a large load
rejection by tripping major bus systems.
1.10.4 Performance of VSD Drive
The bus voltages at the terminal of the input rectifier and inverter output are monitored to evaluate
a change above the acceptable limits during a switching event.
VSD overvoltage at the inverter output can occur when a transient is applied to the input and the
motor cable exceeds a certain length. The longer the motor cable is, the higher the overvoltage that
occurs. This negative effect is amplified when using a shielded cable. However, the overvoltage is
limited to twice the DC bus voltage. A transient response is completed to determine the performance
of the variable speed drive.
A transient analysis is required to assess the largest routine and infrequent switching event which
transferred to the VSD input and therefore determine the performance response at the output of the
VSD. Generally, there are no specific requirements identified in Technical Rules or Design Criteria
(with respect to this test).
The acceptance criteria are therefore based on evaluation of bus voltages at the terminal of the
rectifier input and invertor output. It is therefore determined whether a step change on bus voltages
are above the acceptable limits during a switching event.

Page 8 of 16
Transient Analysis Studies
2.0 Results Expected from A Typical Transient Study
2.1 Performance of Transient Event Results
This section will describe typical results of a large facility with good outcomes with respect to
transient response. The following events are demonstrated:
• Largest Motor Start Event
• Largest Transformer
Energization Event
• Largest Load Rejection Event
• VSD Performance
• Transient Surge Voltage Effects
• Short Circuit Event
2.1.1 Motor Start Event
2.1.1.1 Dual Feeder Network Configuration
The outgoing feeder for the motor was simulated to switch on at 0.1s in a Dual Feeder Network
configuration. The instantaneous current p.u of the Motor is shown in below.
Figure 2-1 Motor Phase Current
Figure 2-1 shows the motor switch event at occurring at 0.1 sec. The switching event crosses at the
negative cycle of the sine wave and therefore a negative DC offset results. This creates a peak
current of 9.6 p.u. with a DC offset value of 4.4 p.u. The start current stabilises to a peak value of
5.1 p.u. and after 1.6 seconds the peak value is 1.0 p.u. where the motor is running at full speed.
This switching event was simulated to show the largest DC offset and worst case current transient.
This is important to ensure we capture the effect on the voltage response due to this current spike.

Page 9 of 16
Transient Analysis Studies
Figure 2-2 Motor Bus Terminal Voltage
Figure 2-2 represent the motor bus terminal voltage. The motor starts at 0.1 seconds where the
motor bus voltage is 0.765 p.u. for the transient switching period which runs for several cycles. Most
of the bus voltage during starting is 0.97 p.u. and returns to 1.07 p.u. once the motor is running at
full speed.
It can be seen on Figure 6-2 that the voltage response is stable due to the current spike. The voltage
response does dip below 0.85 p.u. for several cycles but recovers within 200ms. Motor stalling is not
established during this start sequence due to this narrow voltage dip.
Figure 2-3 33kV Switchboard Voltage

Page 10 of 16
Transient Analysis Studies
To meet the requirements of the Technical Rules, the voltage on the main switchboard during the
switching event was evaluated. As shown in Figure 2-3, the transient voltage response at the 33kV
main switchboard caused a voltage drop of 0.932 p.u. which then recovered to the normal
operational value of 0.948 p.u. which is well within the Technical Rule criteria.
2.1.1.2 Single Feeder Network Configuration
The outgoing feeder for a large motor was simulated to switch on at 0.1s in the Single Feeder
Network configuration. The results showed no discernible difference to the Dual Feeder
arrangement.
2.1.2 Transformer Energisation Switching Event.
This test examined the largest transformer with the longest cable in an unloaded condition.
The Transformer energisation transient analysis was conducted to identify what effect the expected
peak current value and decay time that would result for the remainder of the network.
It is important to understand that a large transformer is always switched on in an unloaded condition.
All motor and VSD loads are not connected in this initial state. When a transformer is switched on,
the individual loads will be started one by one as per the process start-up sequence.
The transformer energisation transient response is demonstrated for Dual and Single Network
Feeder configurations.
2.1.2.1 Dual Feeder Network Configuration - Transformer Energisation
Transformer energisation transient response for the Dual Feeder Network configuration was
reviewed by closing the transformer primary circuit breaker. Figure 2-4 below shows the energisation
switching event of a large transformer.
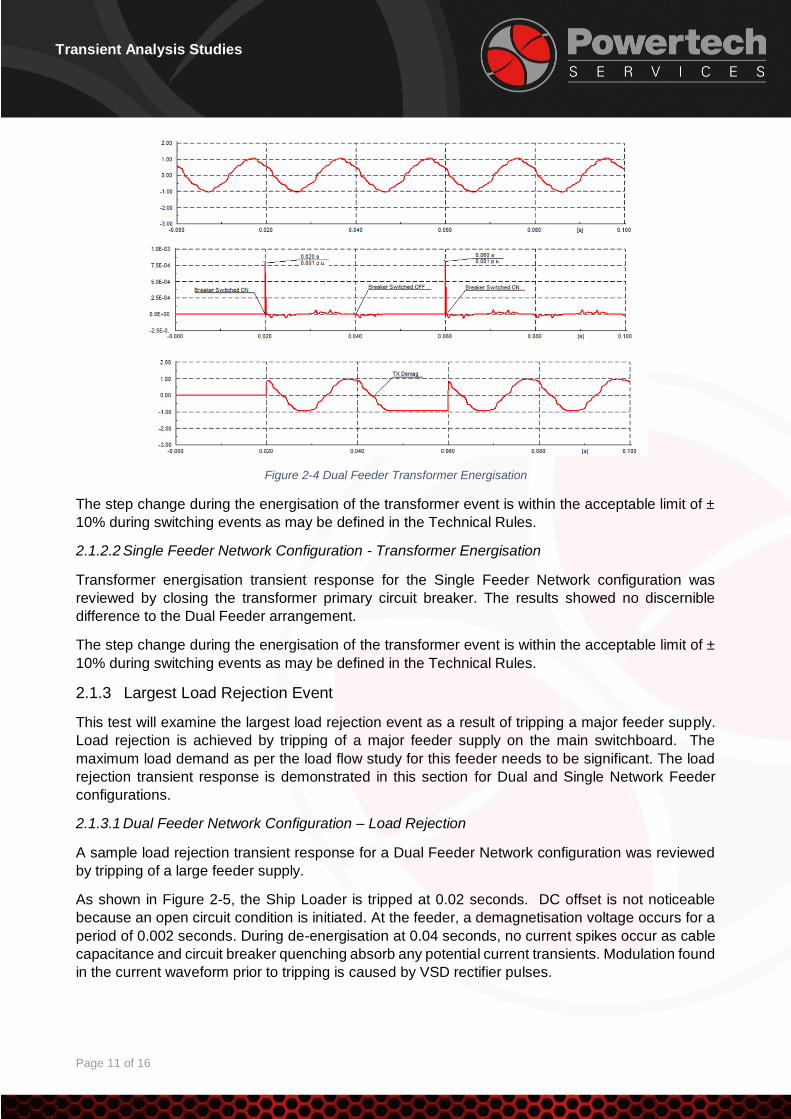
As shown in Figure 2-4, the transformer is energised at 0.02 seconds. This causes a sharp and
narrow inrush current of 0.001 p.u. at the point of energisation. The magnitude is small as the
transformer is unloaded and therefore magnetisation is minimal. DC offset is not noticeable because
the transformer secondary is open circuit.
The transformer is then de-energised at 0.04 seconds and at the transformer primary terminals,
demagnetisation voltage occurs for a period of 0.01 seconds. During de-energisation at 0.04
seconds, no current spikes occur as cable capacitance and circuit breaker quenching absorb any
potential current transients.
To meet the requirements of the Technical Rules, the voltage on the main switchboard during the
switching event is evaluated. As shown in Figure 2-4, the transient voltage response at the 33kV
main switchboard caused a voltage drop of 1.0 p.u. which then remained at the normal operational
value of 1.0 p.u. which is well within the Technical Rules.
Page 11 of 16
Transient Analysis Studies
Figure 2-4 Dual Feeder Transformer Energisation
The step change during the energisation of the transformer event is within the acceptable limit of ±
10% during switching events as may be defined in the Technical Rules.
2.1.2.2 Single Feeder Network Configuration - Transformer Energisation
Transformer energisation transient response for the Single Feeder Network configuration was
reviewed by closing the transformer primary circuit breaker. The results showed no discernible
difference to the Dual Feeder arrangement.
The step change during the energisation of the transformer event is within the acceptable limit of ±
10% during switching events as may be defined in the Technical Rules.
2.1.3 Largest Load Rejection Event
This test will examine the largest load rejection event as a result of tripping a major feeder supply.
Load rejection is achieved by tripping of a major feeder supply on the main switchboard. The
maximum load demand as per the load flow study for this feeder needs to be significant. The load
rejection transient response is demonstrated in this section for Dual and Single Network Feeder
configurations.
2.1.3.1 Dual Feeder Network Configuration – Load Rejection
A sample load rejection transient response for a Dual Feeder Network configuration was reviewed
by tripping of a large feeder supply.
As shown in Figure 2-5, the Ship Loader is tripped at 0.02 seconds. DC offset is not noticeable
because an open circuit condition is initiated. At the feeder, a demagnetisation voltage occurs for a
period of 0.002 seconds. During de-energisation at 0.04 seconds, no current spikes occur as cable
capacitance and circuit breaker quenching absorb any potential current transients. Modulation found
in the current waveform prior to tripping is caused by VSD rectifier pulses.

Page 12 of 16
Transient Analysis Studies
To meet the requirements of the Technical Rules, the voltage on the main switchboard during the
switching event is evaluated. As shown in Figure 2-5, the transient voltage response at the main
switchboard caused a voltage drop of 1.0 p.u. which then remained at the normal operational value
of 1.0 p.u. which is well within the Technical Rules criteria.
The voltage waveform for all phases on the buses at the point of connection remain within acceptable
limits during the switching event as defined in the voltage stability requirement in for Temporary Over
Voltages of Technical Rules. The results demonstrate that during a switching event, switching OFF
(tripping) of largest load on the system, the voltages at the system remain stable and are within
acceptable limits.
Figure 2-5 Dual Feeder Load Rejection
2.1.3.2 Single Feeder Network Configuration – Load Rejection
Load rejection transient response for the Single Feeder Network configuration was reviewed by
tripping the Ship Loader circuit breaker. The results show no discernible difference to the Dual
Feeder arrangement. The results demonstrate that during a switching event, switching OFF
(tripping) of largest load on the system, the voltages at the system remain stable and are within
acceptable limits.
2.1.4 Assessment of Infrequent Switching Operations on Variable Speed Drives.
The transient performance of a VSD drive was analysed against the routine tests described in the
previous sections. A drive was chosen that represented a large drive with a long output cable length
providing worst case dv/dt conditions and therefore transient effects on the input of the drive.
2.1.4.1 Assessment of VSD drive on Starting of Large DOL Drive.
The simulation was completed to demonstrate the performance of the VSD drive during the switching
operation of the largest motor start. The circuit breaker of the DOL motor was switched on.

Page 13 of 16
Transient Analysis Studies
2.1.4.2 Assessment of VSD drive on Transformer Energisation Switching Event
The simulation was completed to demonstrate the performance of the VSD drive during the switching
operation of the transformer. The breaker of transformer was switched on.
2.1.4.3 Assessment of VSD drive on Load Rejection Event.
The simulation was completed to demonstrate the performance of the VSD drive during a large load
rejection of by tripping of a large system load.
2.1.4.4 Performance of VSD Drive
The bus voltages at the input terminals of the rectifier are shown in Figure 2-6 and the output
terminals of the inverter are shown in Figure 2-7. were monitored to evaluate any change above the
acceptable limits during the switching event.
Figure 2-6 and Figure 2-7 are shown as a single response representing all the tests and not redrawn
6 times as no discernible difference in response occurred for the following tests:
• single network arrangement – starting of DOL
• dual network arrangement – starting of DOL
• single network arrangement – transformer energisation
• dual network arrangement – transformer energisation
• single network arrangement – load rejection
• dual network arrangement – load rejection
Figure 2-6 VSD Input Rectifier Waveform

Page 14 of 16
Transient Analysis Studies
Figure 2-7 VSD Inverter Output Waveform
The waveform includes the harmonic contribution with phase voltages and current remain stable
during the switching event. The details of Total Harmonic Distortion on each bus is provided in a
harmonic study. In this case the performance of the large VSD drive during switching events were
found to be satisfactory.
2.1.5 Short Circuit Event
This test examines the short circuit response as a result of fault occurring within the power system.
The following types of short circuit response are tested to determine the stability of the power system:
• A three -phase to earth fault cleared by protection system;
• A single phase to earth fault cleared by protection system;
• A single phase to earth fault cleared with auto reclosure onto a persistent fault.
2.1.5.1 Dual Feeder Network Configuration – Short Circuit Event
A sample short circuit transient response for a Dual Feeder Network configuration was analysed by
simulating a bolted three phase fault at the motor terminals of a 6.6kV 450kW D.O.L motor
As shown in Figure 2-8, a short circuit event is introduced at the motor terminal at 0.1 sec. The
feeder protection relay trips the breaker on an instantaneous set value which is shown in Figure 2-
8 by opening the breaker and clearing the fault at 0.2s.
The voltage on the 6.6kV Switchboard drops 0. 417p.u. for a duration of 90ms and then upon
clearance of the fault recovers back to 1.0p.u.

Page 15 of 16
Transient Analysis Studies
Figure 2-8 Bus Voltage Response for Short Circuit Event
3.0 Final Notes
Transient analysis is essential for any power system to ensure the bus voltages remain within their
design limits and that over or under voltage transients are not leading to equipment degradation.
Equipment degradation can lead to cable or other equipment failures. Uncontrolled transients can
also cause false tripping leading to unplanned outages.

ALL OFFICES
Email: [email protected]
WESTERN AUSTRALIA
Perth Head Office
Address: 6/8 Hasler Rd,
Osborne Park, 6017
Phone: +61 8 9244 4477
Fax: +61 8 9244 4478
NORTHERN TERRITORY
Darwin Office
Address: 4/16 Charlton Street,
Woolner, Northern Territory,
Australia 0820
QUEENSLAND
Eagle Farm
Address: 3-4/70 Fison Ave
West, Eagle Farm QLD 4009
Phone: +61 7 3268 1378
Fax: +61 7 3268 1374
Gladstone
Address: 4 Helen Street,
Gladstone QLD 4680
Phone: +61 7 4978 0047
Fax: +61 7 4978 0057
Chinchilla
Address: 3 Dwyer Court,
Chinchilla QLD 4413
SINGAPORE
Singapore
Address: Level 26, 460
Alexandra Rd, Singapore
119963
Phone: +65 6809 3214
PHILIPPINES
Cebu
Address: Unit 905 AppleOne
Tower, Mindanao Avenue cor.
Biliran Rd, Cebu Business Park,
Cebu City, Philippines 6000
Phone: +61 73 135 6029