powerpoint presentation · affiliate marketing all types of ads via automated marketing program...
TRANSCRIPT

57 14Categories deep dive to enable
opportunities for marketersDisciplines to explore digital trends
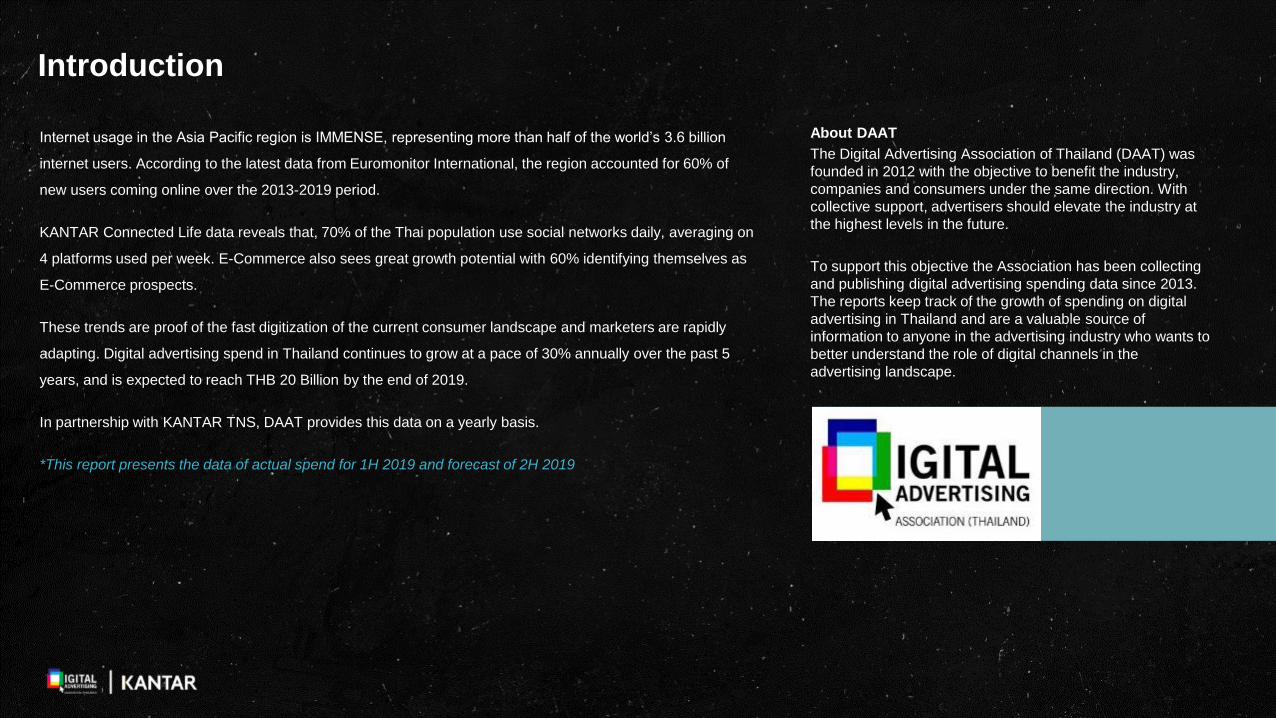
Introduction
Internet usage in the Asia Pacific region is IMMENSE, representing more than half of the world’s 3.6 billion
internet users. According to the latest data from Euromonitor International, the region accounted for 60% of
new users coming online over the 2013-2019 period.
KANTAR Connected Life data reveals that, 70% of the Thai population use social networks daily, averaging on
4 platforms used per week. E-Commerce also sees great growth potential with 60% identifying themselves as
E-Commerce prospects.
These trends are proof of the fast digitization of the current consumer landscape and marketers are rapidly
adapting. Digital advertising spend in Thailand continues to grow at a pace of 30% annually over the past 5
years, and is expected to reach THB 20 Billion by the end of 2019.
In partnership with KANTAR TNS, DAAT provides this data on a yearly basis.
*This report presents the data of actual spend for 1H 2019 and forecast of 2H 2019
About DAAT
The Digital Advertising Association of Thailand (DAAT) was
founded in 2012 with the objective to benefit the industry,
companies and consumers under the same direction. With
collective support, advertisers should elevate the industry at
the highest levels in the future.
To support this objective the Association has been collecting
and publishing digital advertising spending data since 2013.
The reports keep track of the growth of spending on digital
advertising in Thailand and are a valuable source of
information to anyone in the advertising industry who wants to
better understand the role of digital channels in the
advertising landscape.
Market research consultancy firm KANTAR INSIGHTS THAILAND has
collected and processed the data used in this report from 40 agencies via an
online survey. The data is aggregated to reflect total levels, and split by type
of digital advertising, platforms, and by industries. To maintain the
confidentiality of all client information, all data is collected via an anonymous
process and purely based on internal records of advertising spend.
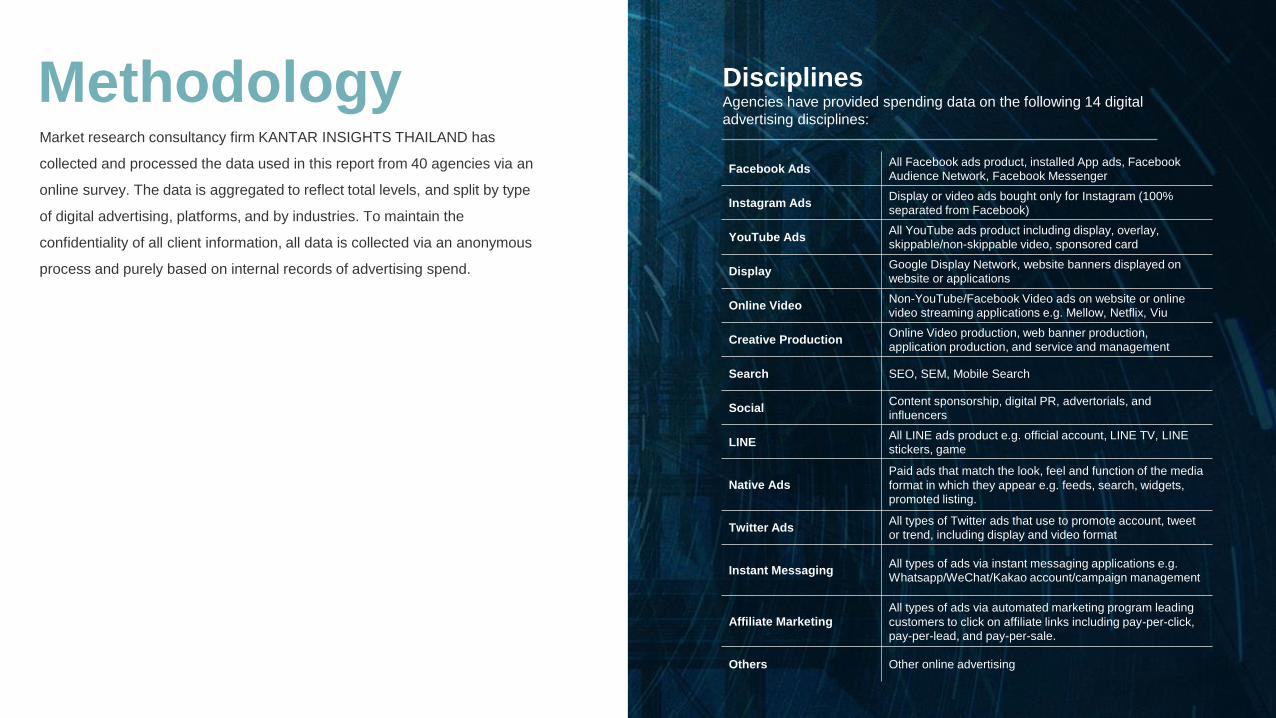
Disciplines Agencies have provided spending data on the following 14 digital
advertising disciplines:
Facebook AdsAll Facebook ads product, installed App ads, Facebook
Audience Network, Facebook Messenger
Instagram AdsDisplay or video ads bought only for Instagram (100%
separated from Facebook)
YouTube AdsAll YouTube ads product including display, overlay, skippable/non-skippable video, sponsored card
DisplayGoogle Display Network, website banners displayed on
website or applications
Online VideoNon-YouTube/Facebook Video ads on website or online
video streaming applications e.g. Mellow, Netflix, Viu
Creative ProductionOnline Video production, web banner production,
application production, and service and management
Search SEO, SEM, Mobile Search
SocialContent sponsorship, digital PR, advertorials, and
influencers
LINEAll LINE ads product e.g. official account, LINE TV, LINE
stickers, game
Native Ads
Paid ads that match the look, feel and function of the media
format in which they appear e.g. feeds, search, widgets,
promoted listing.
Twitter AdsAll types of Twitter ads that use to promote account, tweet
or trend, including display and video format
Instant MessagingAll types of ads via instant messaging applications e.g.
Whatsapp/WeChat/Kakao account/campaign management
Affiliate Marketing
All types of ads via automated marketing program leading
customers to click on affiliate links including pay-per-click,
pay-per-lead, and pay-per-sale.
Others Other online advertising
Methodology
Category Industry
Personal care
Cosmetics
Skin-care preparations
Personal Accessories
Toiletries
Hair Preparations
Oral Products
Household care
Household Cleaners
Household Equipment & Furnishings
Household Insecticides & Pesticides
Automotive
Motor Vehicle Accessories
Motor Vehicle Dealers & Rentals
Motor Vehicles
Motorcycles & Bicycles
Oil & Lubricants
Petrol
Tyre
HousingReal Estate
Furniture & Furnishings
Pharmaceuticals Pharmaceuticals
Pet products Pet Foods & Pet Products
Others
Photographic Products
Office/Business Equipment
Sundries
Transportation
Travel & Tours
Entertainment & Leisure
Multi Sections Advertising
Media & Marketing
CD/DVD (Musical & Film Products)
Agricultural Products
Building Material & Machinery
Government & Community Announcement
Websites and marketplace
House Ads
Entertainment & Leisure
Jewelry & Gold
Classified
Category Industry
Finance & banking
Banks
Insurance
Credit/Debit Cards
Finance Services
Technology & Electronic
Communications & Devices
Computers
Audio/Visual Electrical Products
Electrical Products (Non Audio/Visual)
Food & Beverage
Alcoholic Beverages
Non-Alcoholic Beverages
Seasoning Products
Snack Foods
Dairy Products & Dairy Substitute Prod.
Bakery & Chocolate/Wafers/Biscuits
Dietary Products
Vitamins & Supplementary Foods
Foodstuffs
Shops Food Outlets & Restaurants
Retail Shops & E-Retailing
Education Educational Institutions
ClothingClothing & Underwear
Footwear
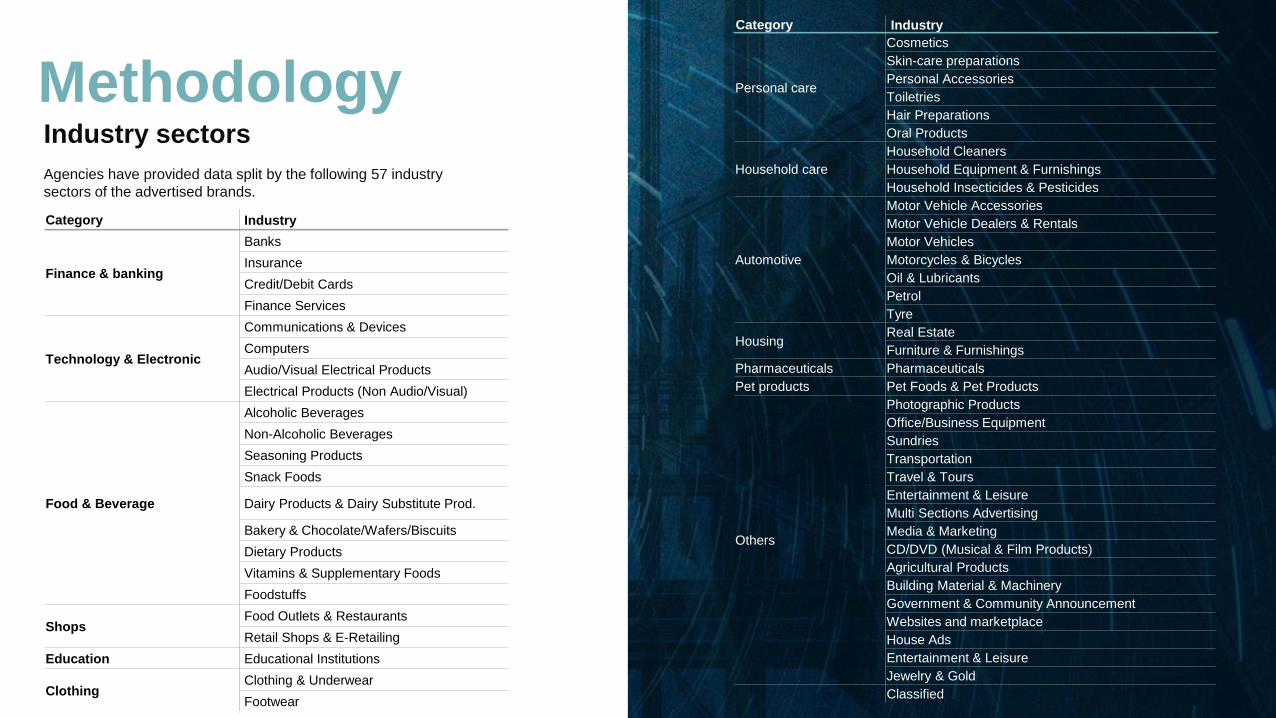
MethodologyIndustry sectors
Agencies have provided data split by the following 57 industry
sectors of the advertised brands.
Agencies
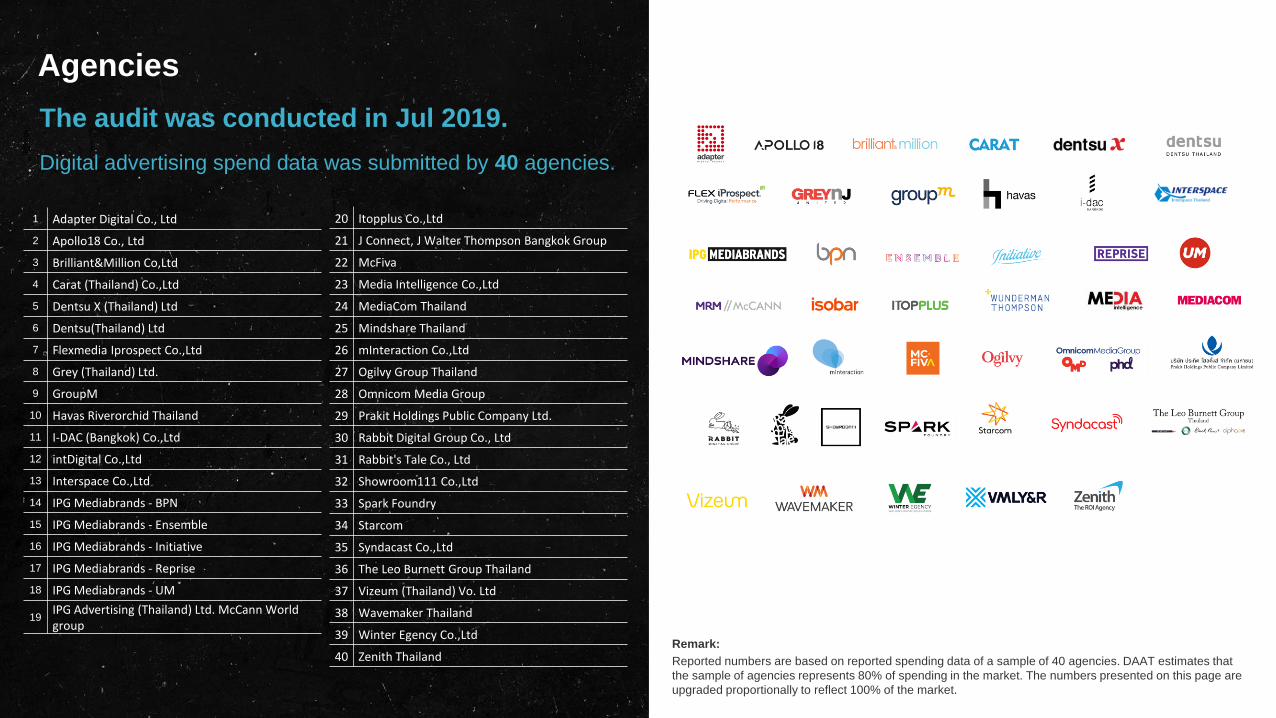
The audit was conducted in Jul 2019.
Digital advertising spend data was submitted by 40 agencies.
1 Adapter Digital Co., Ltd
2 Apollo18 Co., Ltd
3 Brilliant&Million Co,Ltd
4 Carat (Thailand) Co.,Ltd
5 Dentsu X (Thailand) Ltd
6 Dentsu(Thailand) Ltd
7 Flexmedia Iprospect Co.,Ltd
8 Grey (Thailand) Ltd.
9 GroupM
10 Havas Riverorchid Thailand
11 I-DAC (Bangkok) Co.,Ltd
12 intDigital Co.,Ltd
13 Interspace Co.,Ltd
14 IPG Mediabrands - BPN
15 IPG Mediabrands - Ensemble
16 IPG Mediabrands - Initiative
17 IPG Mediabrands - Reprise
18 IPG Mediabrands - UM
19IPG Advertising (Thailand) Ltd. McCann World group
Remark:
Reported numbers are based on reported spending data of a sample of 40 agencies. DAAT estimates that
the sample of agencies represents 80% of spending in the market. The numbers presented on this page are
upgraded proportionally to reflect 100% of the market.
20 Itopplus Co.,Ltd
21 J Connect, J Walter Thompson Bangkok Group
22 McFiva
23 Media Intelligence Co.,Ltd
24 MediaCom Thailand
25 Mindshare Thailand
26 mInteraction Co.,Ltd
27 Ogilvy Group Thailand
28 Omnicom Media Group
29 Prakit Holdings Public Company Ltd.
30 Rabbit Digital Group Co., Ltd
31 Rabbit's Tale Co., Ltd
32 Showroom111 Co.,Ltd
33 Spark Foundry
34 Starcom
35 Syndacast Co.,Ltd
36 The Leo Burnett Group Thailand
37 Vizeum (Thailand) Vo. Ltd
38 Wavemaker Thailand
39 Winter Egency Co.,Ltd
40 Zenith Thailand
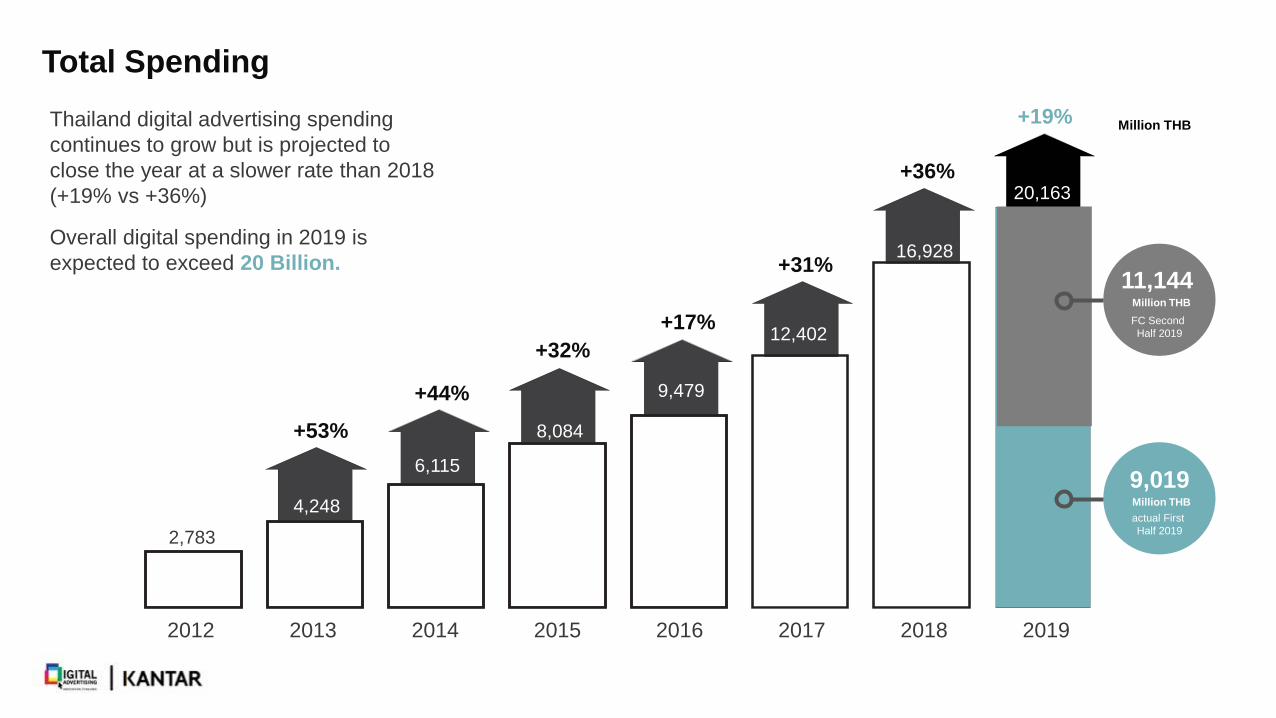
Total Spending
Thailand digital advertising spending
continues to grow but is projected to
close the year at a slower rate than 2018
(+19% vs +36%)
Overall digital spending in 2019 is
expected to exceed 20 Billion.
+53%
+44%
+32%
+17%
+31%
+36%
+19%
Total Spending
2012 2013 2014 2015 2016 2017 2018 2019
2,783
4,248
6,115
8,084
9,479
12,402
16,928
20,163
actual First
Half 2019
FC Second
Half 2019
11,144Million THB
9,019Million THB
Million THB
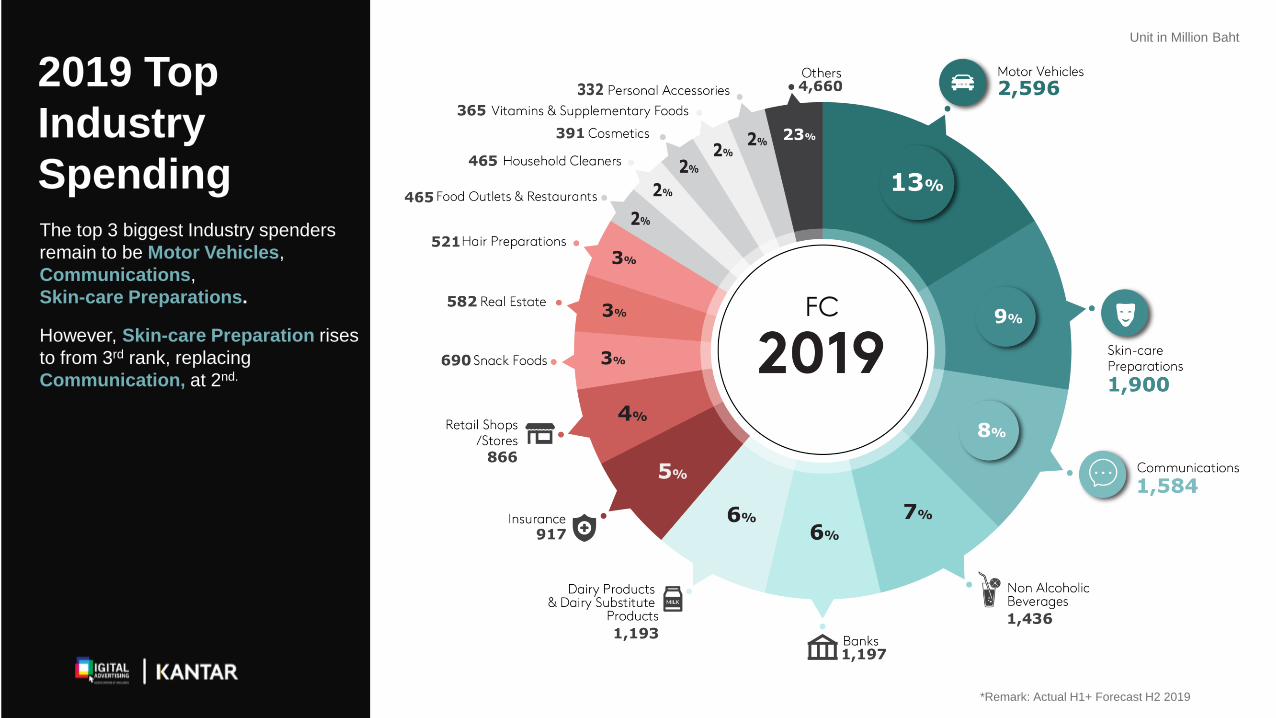
2019 Top
Industry
Spending
Unit in Million Baht
The top 3 biggest Industry spenders
remain to be Motor Vehicles,
Communications,
Skin-care Preparations.
However, Skin-care Preparation rises
to from 3rd rank, replacing
Communication, at 2nd.
*Remark: Actual H1+ Forecast H2 2019
FC

2019
Of all the disciplines, Facebook
receives the highest spending,
followed by YouTube, Creative,
& Display
Largest growth in spending
comes from Creative (#4#3)
and Display (#6 #4)
Search declines in rank from #3
#5
2019
Discipline
Spending
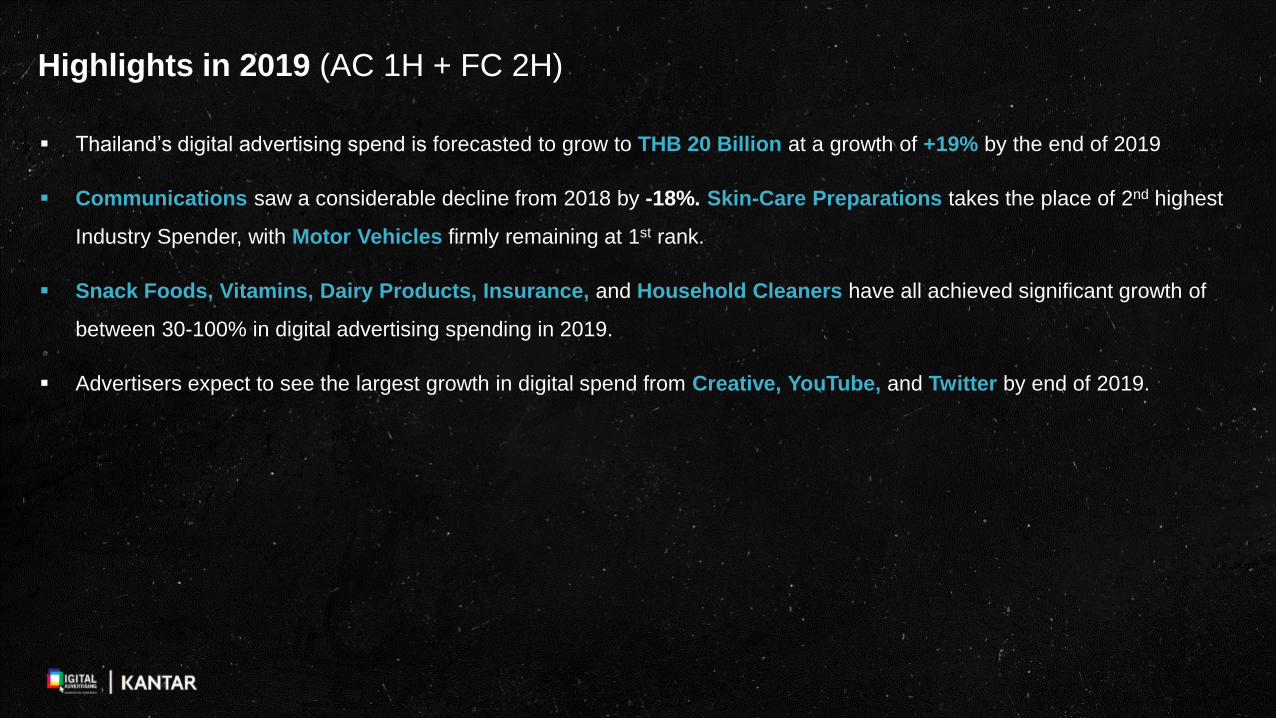
Highlights in 2019 (AC 1H + FC 2H)
▪ Thailand’s digital advertising spend is forecasted to grow to THB 20 Billion at a growth of +19% by the end of 2019
▪ Communications saw a considerable decline from 2018 by -18%. Skin-Care Preparations takes the place of 2nd highest
Industry Spender, with Motor Vehicles firmly remaining at 1st rank.
▪ Snack Foods, Vitamins, Dairy Products, Insurance, and Household Cleaners have all achieved significant growth of
between 30-100% in digital advertising spending in 2019.
▪ Advertisers expect to see the largest growth in digital spend from Creative, YouTube, and Twitter by end of 2019.
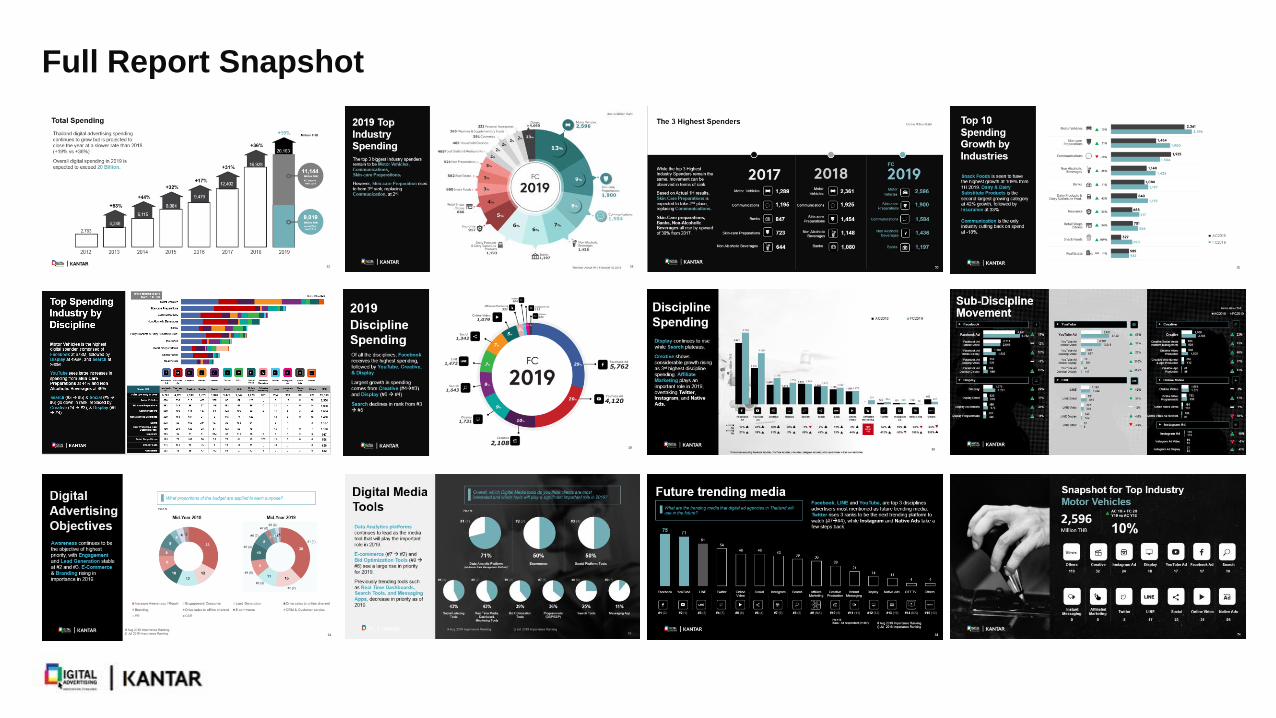
Total SpendingFull Report Snapshot
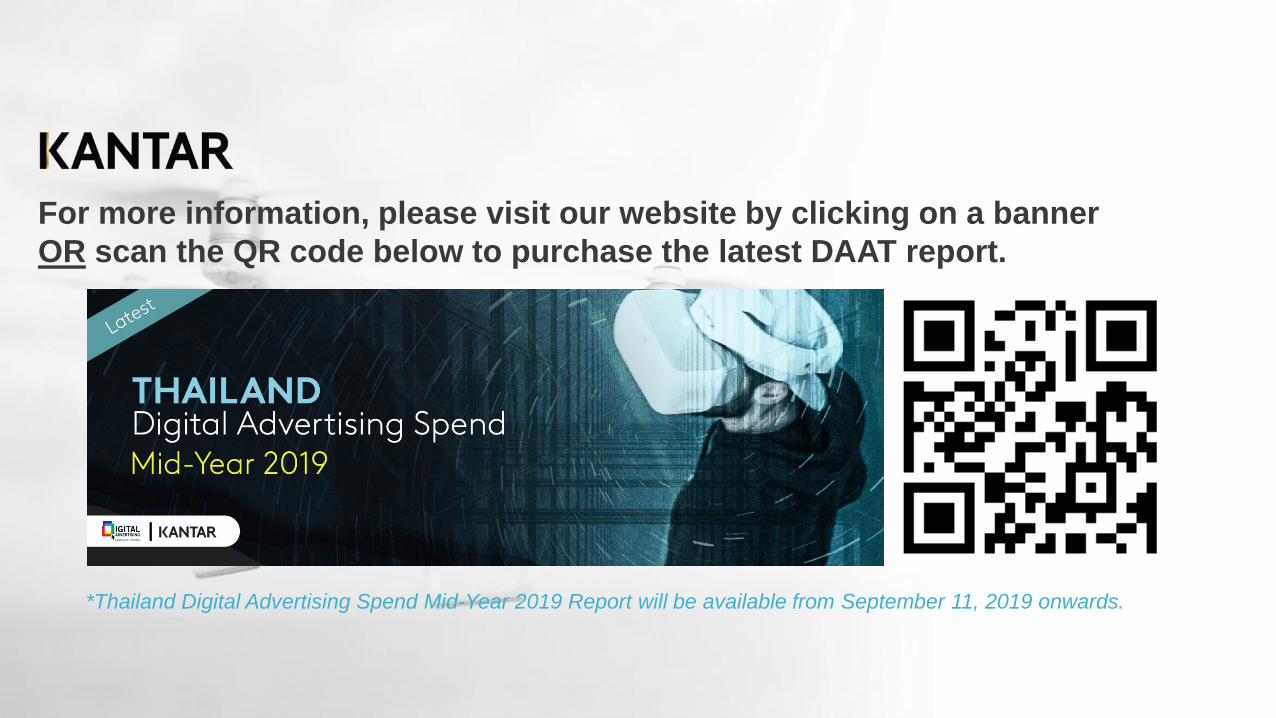
For more information, please visit our website by clicking on a banner
OR scan the QR code below to purchase the latest DAAT report.
*Thailand Digital Advertising Spend Mid-Year 2019 Report will be available from September 11, 2019 onwards.