powerpoint-präsentation · disclaimer this presentation contains statements concerning the future...
TRANSCRIPT

Investors‘ PresentationJuly 2018

Disclaimer
This presentation contains statements concerning the future performance of the Sartorius Group. These statements are based on assumptions and estimates. Although we are convinced that these forward-looking statements are realistic, we cannot guarantee that they will actually materialize. This is because our assumptions harbor risks and uncertainties that could lead to actual results diverging substantially from the expected ones. It is not planned to update our forward-looking statements.
Throughout this presentation, differences may be apparent as a result of rounding during addition.

Agenda
01 Overview and Strategy
Bioprocess Solutions Division02
Appendix0504 FY 2018 Guidance | Q1 2018 Results
03 Lab Products & Services Division

Sartorius at a glance
Based on FY 2017 figures; 1 Excluding extraordinary items 2 As of June 14, 2018; including SSB free float
€1.4bn 25.1% Sales revenue EBITDA1 margin
Bioprocess and laboratorytechnologies provider
International leading
Employees Market cap.2
~€10.7bn>7,500
~32%Americas
~43%EMEA
~25%Asia | Pacific
Well-balanced revenue base
Global sales and service network
Production sites in all regions
4
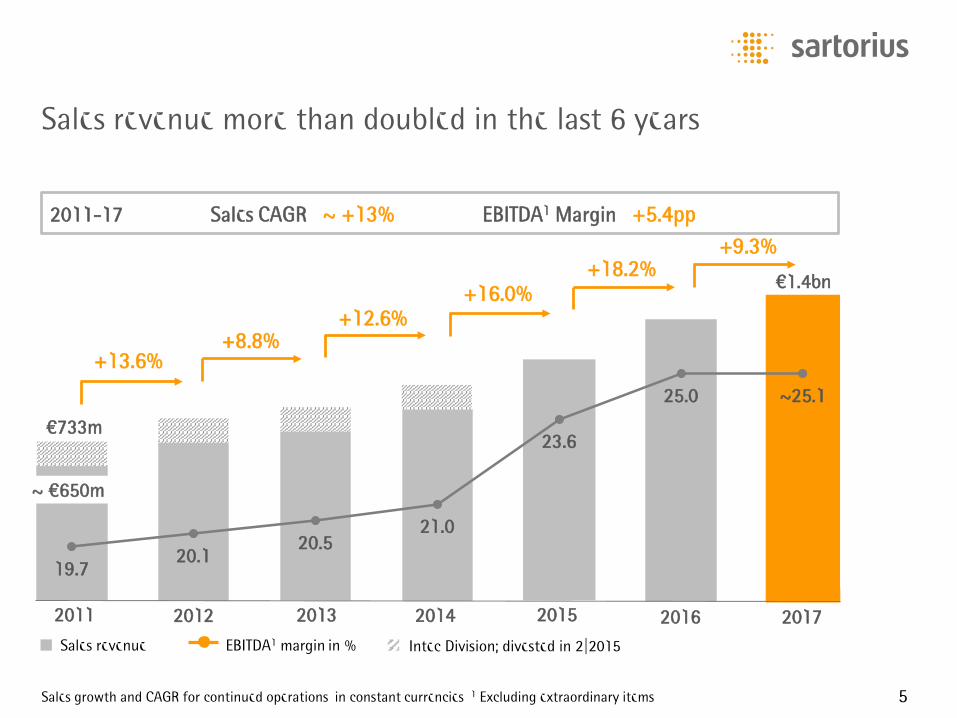
Sales revenue more than doubled in the last 6 years
19.720.1
20.521.0
23.6
25.0 ~25.1
18
19
20
21
22
23
24
25
26
27
28
0
0
0
0
0
0
0
0
+13.6%
Sales revenue EBITDA1 margin in % Intec Division; divested in 2|2015
2011 2015
+8.8%+12.6%
+16.0%
€733m
2012 2013 2014 2016
+18.2%
2011-17 Sales CAGR ~ +13% EBITDA1 Margin +5.4pp
~ €650m
2017
€1.4bn
5
+9.3%
Sales growth and CAGR for continued operations, in constant currencies 1 Excluding extraordinary items

Strategic focus on biopharma market
Molecule DevelopmentCell line and Process Development
Production Upstream & Downstream
Lab Products & Services Division
Bioprocess Solutions Division
Quality and Testing
~72%of Group Sales
~28%of Group Sales
6Based on FY 2017 figures

Market fundamentals remain very attractive
7
+6.5%CAGR
of worldwideprescription drugsales 2017-2022
9bnpeople by 2050
of which >2bn60yrs or older
Rise of biosimilars
>50%CAGR of
biosimilar sales2016-2021
Favorable R&D pipeline; strong advances in gene and cell therapy
~8%CAGR of biopharma market
2017-2025
>50%Share of biologicsin pharma R&D
pipeline
Favorable demographics Increasing healthcare spending
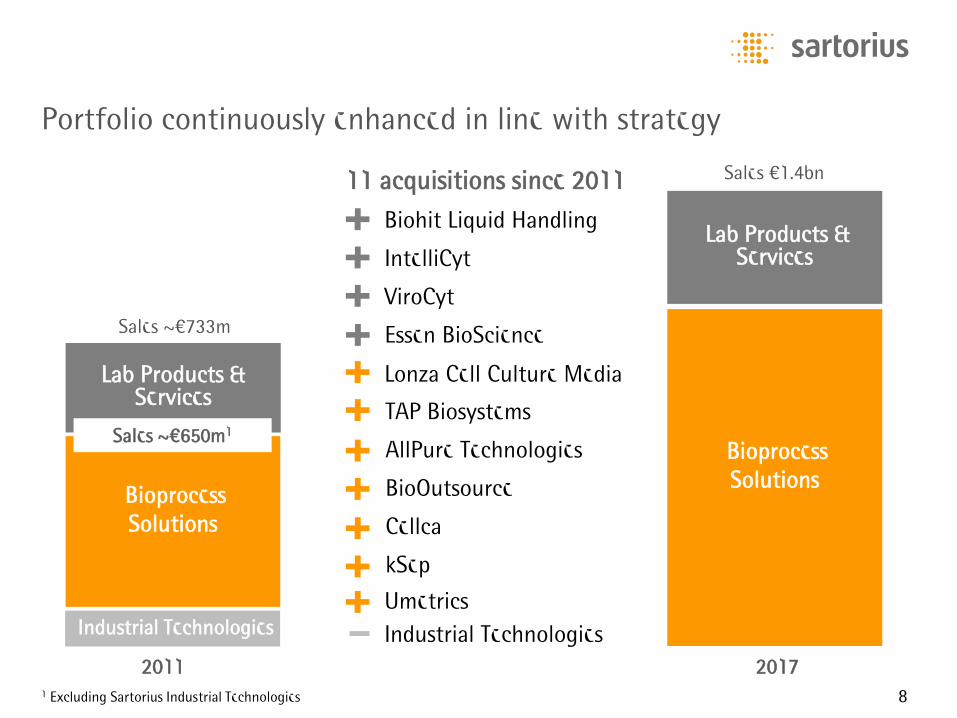
Portfolio continuously enhanced in line with strategy
Lab Products & Services
Bioprocess Solutions
Lab Products & Services
Bioprocess Solutions
Sales ~€733m
Sales €1.4bn
Industrial Technologies
Biohit Liquid Handling
TAP Biosystems
2011 2017
Lonza Cell Culture Media
Industrial Technologies
AllPure Technologies
BioOutsource
Cellca
IntelliCyt
ViroCyt
kSep
11 acquisitions since 2011
Essen BioScience
Sales ~€650m1
Umetrics
81 Excluding Sartorius Industrial Technologies
SingaporeKuala Lumpur
Bangalore
Hanoi
TokyoBeijing Seoul
Hong KongBangkok
Shanghai
Mississauga
Mexico CityYauco
Bohemia
New OxfordAlbuquerque
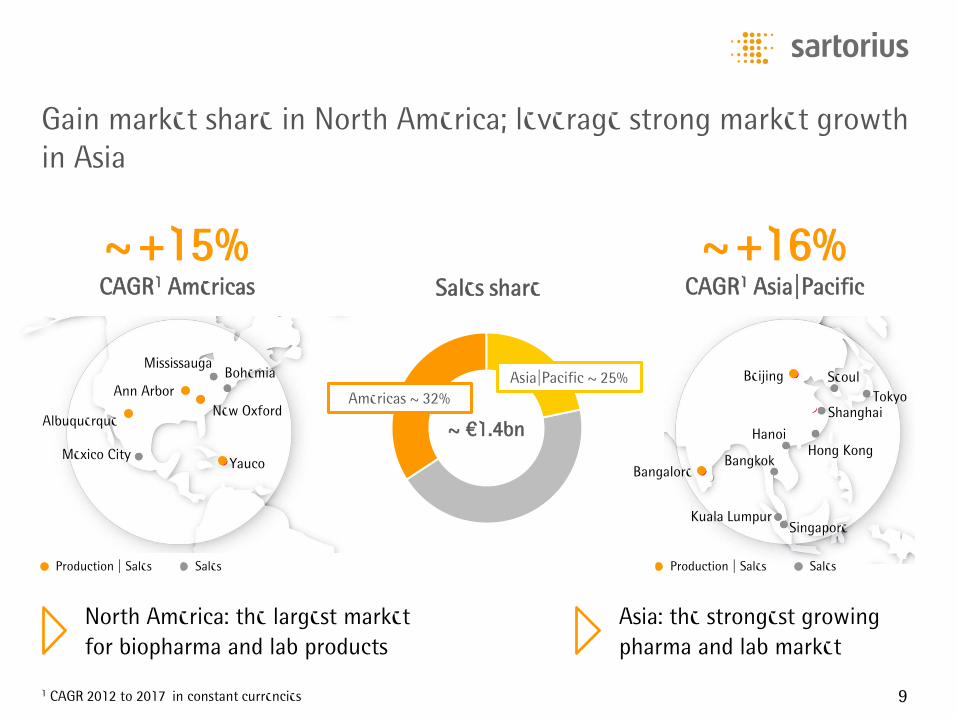
Gain market share in North America; leverage strong market growth in Asia
~+15%CAGR1 Americas
North America: the largest market for biopharma and lab products
~+16%CAGR1 Asia|Pacific
~ €1.4bn
Sales share
Asia: the strongest growing pharma and lab market
Americas ~ 32%Asia|Pacific ~ 25%
Production | Sales SalesProduction | Sales Sales
Ann Arbor
91 CAGR 2012 to 2017, in constant currencies

Infrastructure prepared for further organic growth
10
New ERP and extension ofglobal IT infrastructure
Yauco, Puerto RicoDoubling of fluid managementand filter capacities
Goettingen, GermanyExtension of headquarters
Capex ratio expected to decrease from its above-average levels in 2016-18 as of 2019
Aubagne, France Capacity extensionof bag production ~x% Expansion
Capex
Minor expansionCapex~3%
Capitalized R&D~2%Maintenance Capex
~3%
02468
101214
14.9
8.8 7.1
~15 11.7
9.110.1
Capex ratioin %
1 Incl. discontinued operation 2 Based on 2018 guidance
201620142013120121 2015 2018e22017
Capex composition
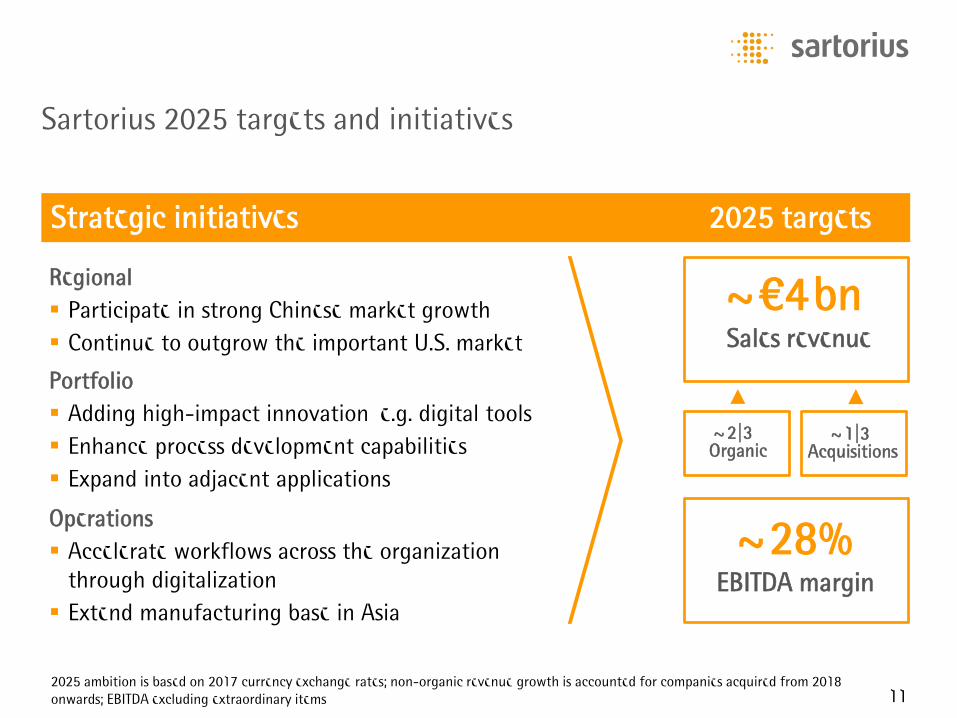
Sartorius 2025 targets and initiatives
~28% EBITDA margin
~ 2|3Organic
~ 1|3 Acquisitions
Portfolio Adding high-impact innovation, e.g. digital tools Enhance process development capabilities Expand into adjacent applications
Regional Participate in strong Chinese market growth Continue to outgrow the important U.S. market
Operations Accelerate workflows across the organization
through digitalization Extend manufacturing base in Asia
Strategic initiatives 2025 targets
~€4bn1
Sales revenue
2025 ambition is based on 2017 currency exchange rates; non-organic revenue growth is accounted for companies acquired from 2018 onwards; EBITDA excluding extraordinary items 11

Sartorius 2025 ambition per division
SSB | BPS
~€2.8bnSales revenue
~30% EBITDA margin
~€1.2bnSales revenue
~25% EBITDA margin
~28% EBITDA margin
Sartorius GroupLPS
~€4bn1
Sales revenue
12
Agenda
01 Overview and Strategy
Bioprocess Solutions Division02
Appendix0504 FY 2018 Guidance | Q1 2018 Results
03 Lab Products & Services Division

Solution Provider for Biomanufacturing
Highly regulated environment | validated processes
Broadest portfolio in the industry; ii~75% recurring revenues
Sales revenue €1.010mn
EBITDA1 margin 28.0%
Unique position in an attractive market
Figures based on FY 2017 results; 1 Excluding extraordinary items 14
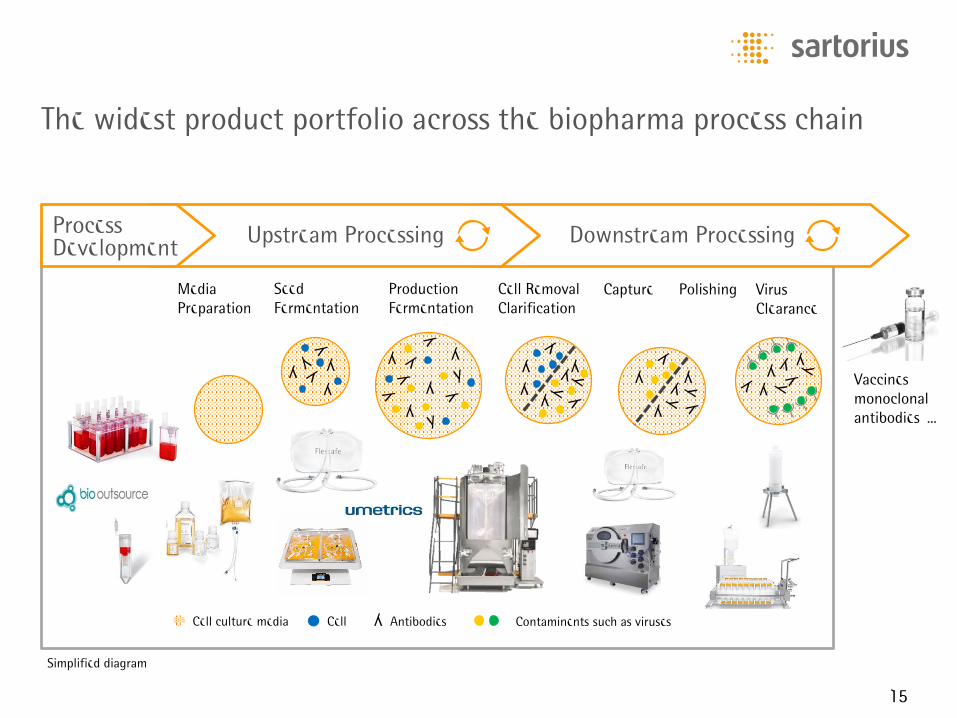
The widest product portfolio across the biopharma process chain
Cell culture media Cell
Media Preparation
Seed Fermentation
ProductionFermentation
Cell Removal | Clarification
ViralClearance
y y
y yy
y
y
yy
yy
y
y y
y
yy
y
y
Antibodies Contaminents such as viruses
Simplified diagram
y y
yy
Media Preparation
Seed Fermentation
ProductionFermentation
Cell Removal Clarification
Capture Polishing VirusClearance
Downstream Processing Upstream Processing ProcessDevelopment
Vaccines, monoclonalantibodies, ...
15

Leading market positions in key technology platforms
More than85 % of sales generated from a TOP 1-3 position
Strong double-digit market shares in most technology platforms
Filtration TOP 3 Fluid Management #1 Fermentation #1
16
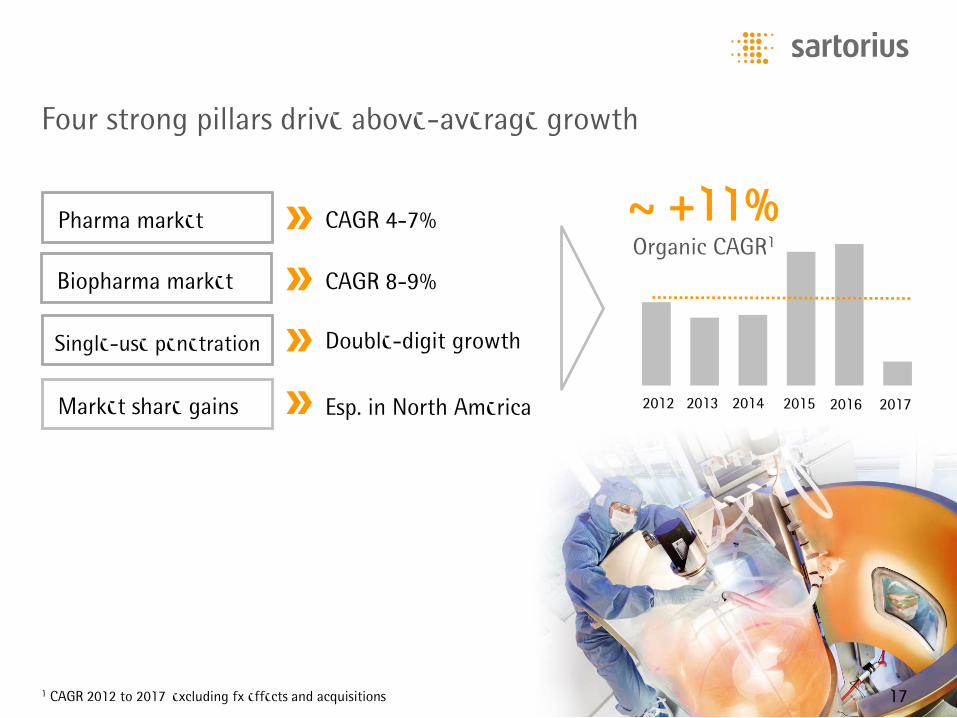
1 CAGR 2012 to 2017, excluding fx effects and acquisitions
Four strong pillars drive above-average growth
~ +11%Organic CAGR1
17
0
2012 2013 2014 2015 2016
Pharma market
Biopharma market
Single-use penetration
Market share gains
CAGR 4-7%
CAGR 8-9%
Double-digit growth
Esp. in North America 2017
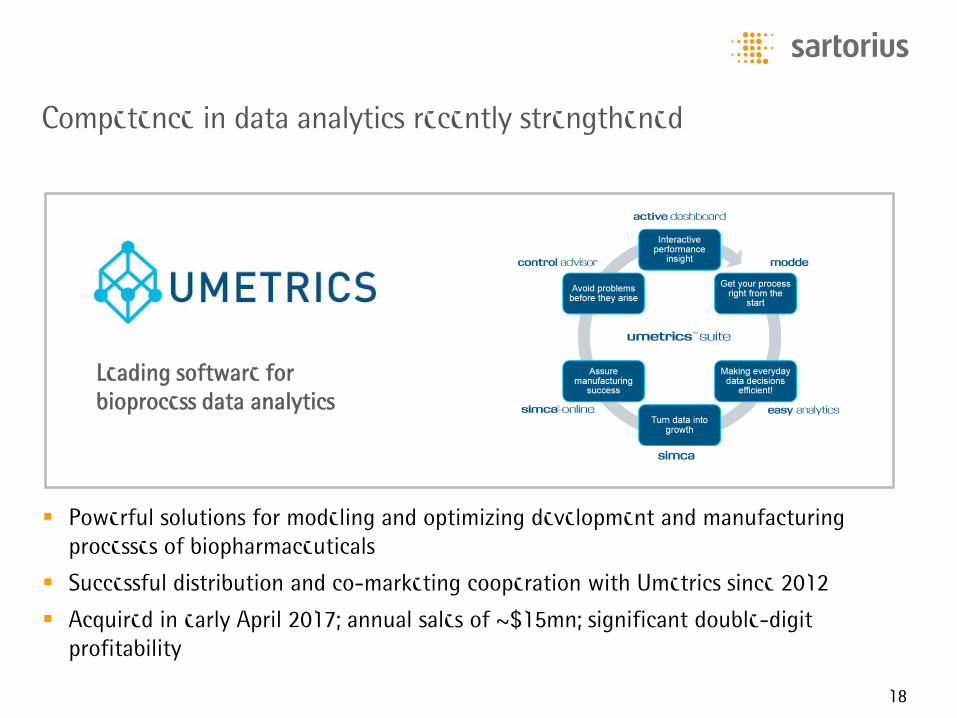
Competence in data analytics recently strengthened
Leading software for bioprocess data analytics
Powerful solutions for modeling and optimizing development and manufacturing processes of biopharmaceuticals
Successful distribution and co-marketing cooperation with Umetrics since 2012
Acquired in early April 2017; annual sales of ~$15mn; significant double-digit profitability
18

Agenda
01 Overview and Strategy
Bioprocess Solutions Division02
Appendix0504 FY 2018 Guidance | Q1 2018 Results
03 Lab Products & Services Division

Premium Lab Portfolio for R&D and QA
Expert in sample prep.; unique bioanalytics offering
Global sales & service infrastructure established
Sales revenue €394mn
EBITDA1 margin 18.0%
Sound laboratory business platform created since 2012
Figures based on FY 2017 results; 1 Excluding extraordinary items 20

Strong market position in key categories
Average global market share of > 10%
Significant growth potential, especially in U.S. and Asia
Lab Balances #2 Pipettes #4 Lab Filtration #3 Microb. Analysis #2(membrane based)
21

Innovative bioanalytics solutions added
Acquisition of US companies IntelliCyt (mid 2016) and Essen BioScience (early 2017)
Combination of unique technologies in the area of high throughput (IntelliCyt) and real-time quantitative analysis (Essen)
Unrivalled solutions which provide significant benefits to biopharma R&D workflows
Fully automated time-lapse-image capture in the incubator and over a longer period
Analyzes cell health, morphology, movement,...
Award-winning technology for rapid, high content, multiplexed analysis of cells and beads in suspension
22
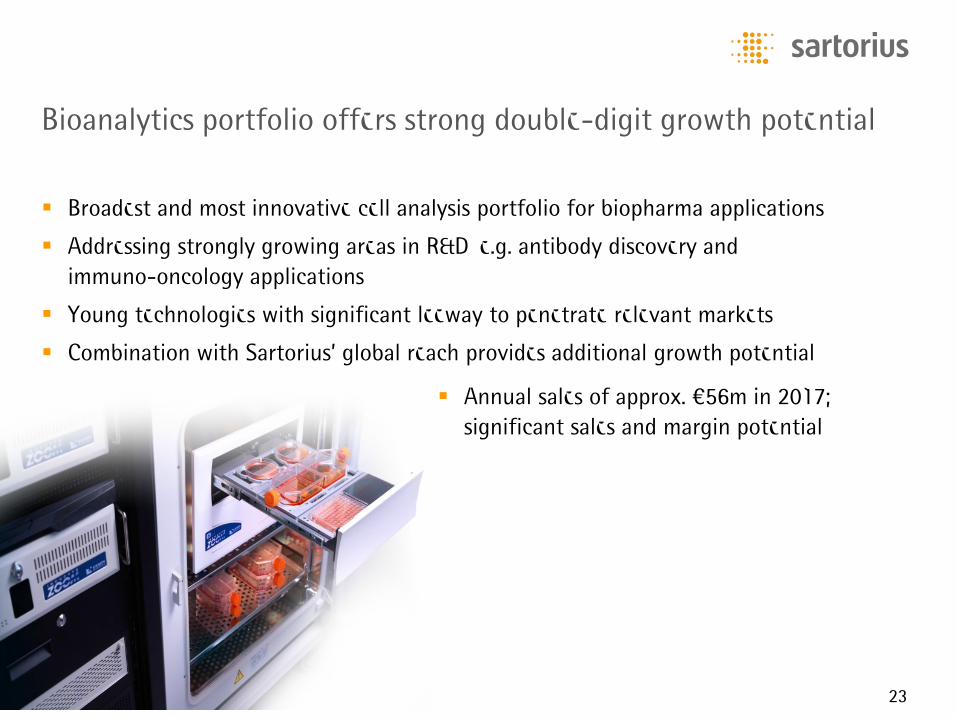
Bioanalytics portfolio offers strong double-digit growth potential
Broadest and most innovative cell analysis portfolio for biopharma applications
Addressing strongly growing areas in R&D, e.g. antibody discovery and immuno-oncology applications
Young technologies with significant leeway to penetrate relevant markets
Combination with Sartorius’ global reach provides additional growth potential
Annual sales of approx. €56m in 2017; significant sales and margin potential
23
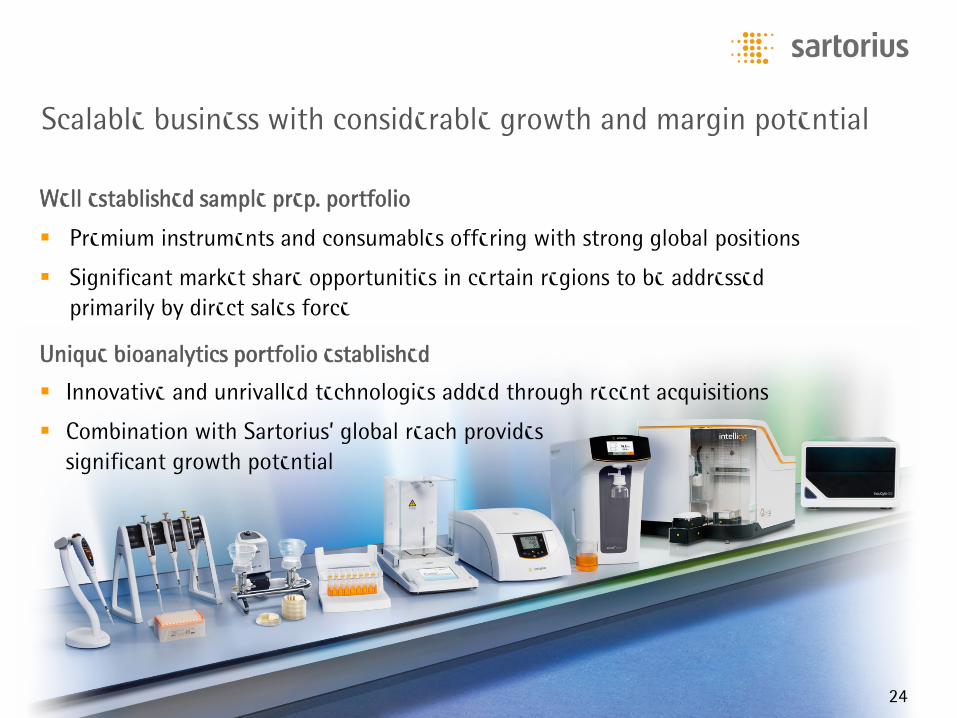
Scalable business with considerable growth and margin potential
Well established sample prep. portfolio
Premium instruments and consumables offering with strong global positions
Significant market share opportunities in certain regions to be addressed primarily by direct sales force
Unique bioanalytics portfolio established
Innovative and unrivalled technologies added through recent acquisitions
Combination with Sartorius’ global reach provides significant growth potential
24

Agenda
01 Overview and Strategy
Bioprocess Solutions Division02
Appendix0504 FY 2018 Guidance | Q1 2018 Results
03 Lab Products & Services Division

Outlook for 2018 confirmed
26
Growth guidance includes non-organic contribution by recent acquisitions: ~ 0.5pp for BPS and ~ 2.5pp for LPS, i.e. ~ 1.0pp for the Group
Capex ratio ~ 15% (FY 2017: 14.9%)
As a result from the US tax reform, SAG´s tax rate is expected to decrease from 2018 onwards by 2pp to around 27%
FY 2017 FY 2018 Guidance1
Sales revenuegrowth1
UnderlyingEBITDA margin
Sales revenuegrowth
UnderlyingEBITDA margin
Sartorius Group 9.3% 25.1% ~ 9% - 12% ~ +0.5pp
Bioprocess Solutions 4.9% 28.0% ~ 8% - 11% ~ +0.5pp
Lab Products & Services 22.0% 18.0% ~ 12% - 15% ~ +1.0pp
1 In constant currencies
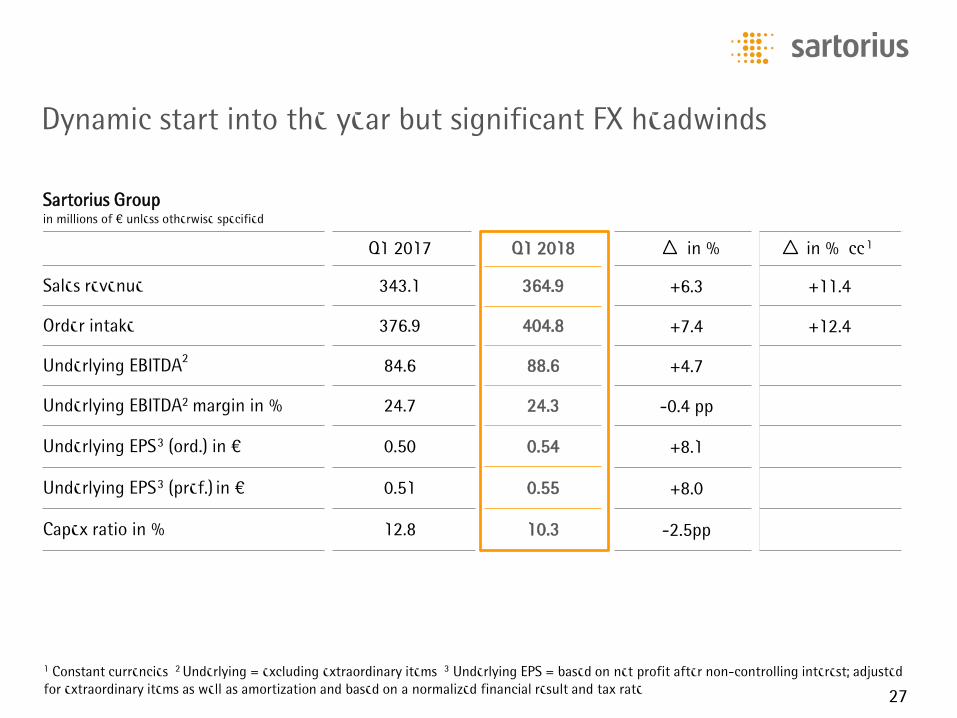
Dynamic start into the year but significant FX headwinds
1 Constant currencies 2 Underlying = excluding extraordinary items 3 Underlying EPS = based on net profit aamortization and based on a normalized financial result and tax rate
fter non-controlling interest; adjustedfor extraordinary items as well as 27
Sartorius Group in millions of € unless otherwise specified
Q1 2017 Q1 2018 in % in % cc1
Sales revenue 343.1 364.9 +6.3 +11.4
Order intake 376.9 404.8 +7.4 +12.4
Underlying EBITDA2 84.6 88.6 +4.7
Underlying EBITDA2 margin in % 24.7 24.3 -0.4 pp
Underlying EPS3 (ord.) in € 0.50 0.54 +8.1
Underlying EPS3 (pref.) in € 0.51 0.55 +8.0
Capex ratio in % 12.8 10.3 -2.5pp

151.2 159.3
80.089.0
111.9 116.6
Well balanced regional contributions to sales growth
Asia|Pacific ~ 24%
Americas ~ 32%
EMEA ~ 44%
~ €365m
Acc. to customers‘ location; growth in constant currencies
+18.2 %+13.8 % +6.3 %
Americas: BPS with good momentum; LPS growth fueled by Essen BioScience acquisition
EMEA: Performance equally driven by LPS and BPS; sound organic growth
Asia|Pacfic: Both divisions once again with strong double-digit growth rates
Q1 17
Americas€ in millions
EMEA€ in millions
Asia|Pacific€ in millions
Sales by Regionin %
Q1 17 Q1 18Q117Q1 18 Q1 18
28

68.4 70.3
Q1 17 Q1 18
BPS: Robust growth but FX headwinds
Order Intake € in millions
Sales Revenue€ in millions
Underlying EBITDA & Margin€ in millions
Solid development in both sales revenue and order intake
All product segments contribute to growth
Underlying EBITDA margin diluted by unfavorable FX trend
283.5 295.1
Q1 17 Q1 18
251.1 263.4
Q1 17 Q1 18
27.2% 26.7%
+9.1% cc+4.1%
+10.0% cc+4.9%
+2.9%
29

LPS: Double-digit growth in sales revenue and profit
Order Intake € in millions
Sales Revenue€ in millions
Underlying EBITDA & Margin€ in millions
Overproportionate increase in order intake mainly driven by Bioanalytics
Recent acquisition of Essen BioScience contributes ~11pp inorganic sales growth
Margin improved despite FX headwinds due to volume and product mix
93.4109.6
Q1 17 Q1 18
16.318.3
Q1 17 Q1 18
92.0101.4
Q1 17 Q1 18
17.7%18.0%
+22.7% cc+17.3%
+15.3% cc+10.3%
+12.6%
30

Cash flow influenced by higher earnings and lower taxes
1 net profit amortization and based on a normalized financial result and tax rate2 A 3 Net cash flow from investing activities and acquisitionsUnderlying net profit = adjusted for extraordinary items,
fter non-controlling interest 31
Increase in extraordinary items in line with expectations; mainly reflects integration costs of Essen BioScience
Net operating cash flow influenced by lower tax payment
Net investing cash flow in previous year primarily reflects the Essen acquisition
Sartorius Group € in millions
Q1 2017 Q1 2018 in %
Underlying EBITDA 84.6 88.6 +4.7
Extraordinary items -6.1 -7.2 -17.4
Financial result -3.7 -4.1 -12.2
Underlying net profit1,2 34.4 37.2 +8.0
Reported net profit2 26.6 26.6 +0.0
Net operating cash flow 22.9 38.9 +70.0
Net investing cash flow3 -332.5 -40.6 n.m.

Key financial indicators remain at robust levels
Net debt in millions of € (lhs)Net debt to underlying EBITDA (rhs)
Net Debt and Net Debt to Underlying EBITDAKey Financial Indicators
Sartorius Group Dec. 31, 2017 Mar. 31, 2018
Equity ratio in % 35.1 35.4
Net debt in millions of € 895.5 900.4
Net debt | underlying EBITDA 2.5 2.5
Q1-Q420152014
Q1-Q4 Q1-Q42016
Q1-Q42017
0
0.6
1.2
1.8
2.4
3
0
0.6
1.2
1.8
2.4
3.0
Q12018
0
200
400
600
800
1000
32

Agenda
01 Overview and Strategy
Bioprocess Solutions Division02
Appendix0504 FY 2018 Guidance | Q1 2018 Results
03 Lab Products & Services Division

Sartorius legal & operational structure
100%~ 74%
Other Sartorius Subsidiaries
Lab Products & Services DivisionBioprocess Solutions Division
Sartorius Group Operational Setup
~ 74% Sartorius AG ~ 26% Free float
Sartorius AGStock market listed in Germany
Sartorius Stedim Biotech S.A. Stock market listed in France
> 50% Administered by executor ~ 34% Bio-Rad Laboratories ~ 9% Treasury shares ~ 5% Family owned ~ 2% Free floatO
rdin
ary
shar
es ~ 91% Free float ~ 9% Treasury shares
Pref
eren
ce sh
ares
Sartorius Group Legal Setup
34

0
50
100
150
200
250
300
Key account business with limited dependence on individual accounts
More than half of 2017 BPS sales were generated with the Top 50 customers
No individual customer accounts for more than 5% of BPS sales revenue
No single drug accounts for more than 3% of BPS sales revenue
Limited dependence on individual accountsLong term business relationships with leading global (bio-)pharma companies
Sales to Top 50 customersin 2017, € in millions
Top 10 11 to 20 21 to 30 31 to 40 41 to 50
Cumulativeshare~25%
~40%~45% ~50% ~55%
Bioprocess Solutions
35

Leading positions in key technology platforms
Sartorius Merck | Millipore
Danaher | Pall
ThermoFisher
GE Top 3 Players
Filtration1. Merck | Millipore2. Danaher | Pall3. Sartorius
Fluid Management
1. Sartorius2. Thermo Fisher3. Merck | Millipore
Fermentation1. Sartorius2. Thermo Fisher3. GE
Purification1. GE2. Merck | Millipore3. Danaher | Pall
Cell Culture Media
1. Thermo Fisher2. Merck | Millipore3. GE
Pie charts indicate completeness of product offering
Bioprocess Solutions
36

Technology shift towards single use
Bioprocess Solutions
1 Own estimates
Past Present Future
10 – 20%
30 – 40%
70 – 80%
Single-use market penetration1Key benefits
+ Capex reduction over entire lifecycle
+ Lower water and energy consumption
+ Reduced risk of cross-contamination
+ Higher flexibility
37

Page 1
SingaporeKuala Lumpur
Bangalore
Hanoi
TokyoBeijing Seoul
Hong KongBangkok
Shanghai
Mexico CityYauco
Bohemia
São Paulo
Buenos AiresMelbourne
KajaaniHelsinki
St. PetersburgMoscow
GoettingenPoznan
Guxhagen
Lourdes
Milan
Florence
ViennaBudapest
Madrid
Vilvoorde
Epsom
StonehouseDublin
Sales Production | Production and Sales
Royston
Rotterdam
European home market; Americas and Asia gaining significance
Aubagne
Ann Arbor
Tagelswangen
Glasgow
Laupheim
M’ HamdiaAlbuquerque
Global Presence: > 30 sales and 20 manufacturing sites
~25%Share of SalesAsia | Pacific
~32%Share of Sales
Americas
~43%Share of Sales
EMEA
New Oxford
Malmö
38
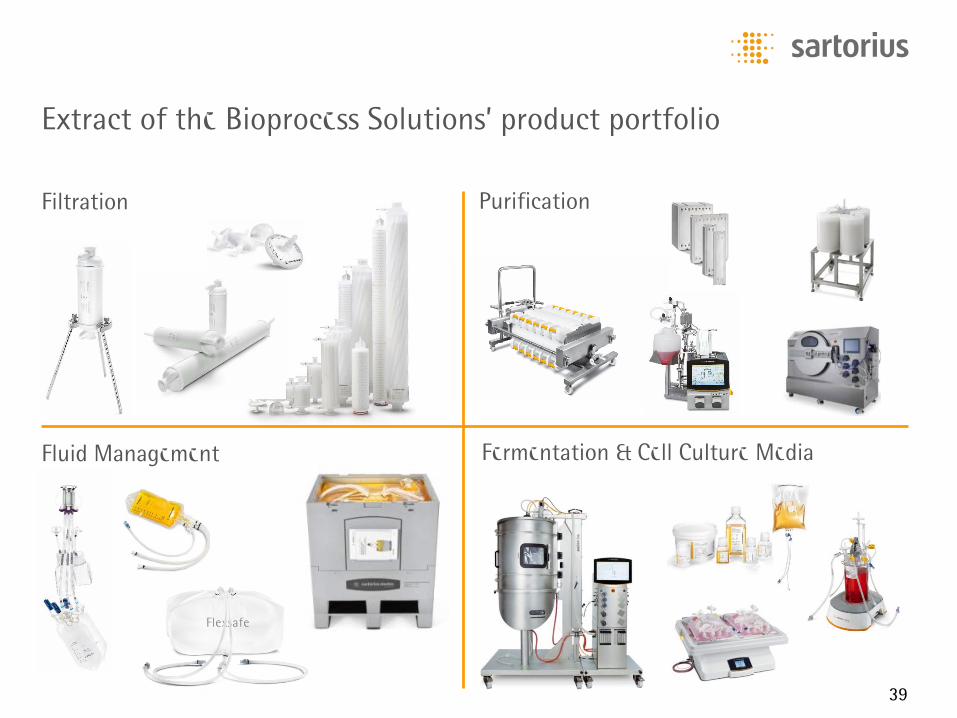
Fermentation & Cell Culture Media
Extract of the Bioprocess Solutions’ product portfolio
Filtration Purification
Fluid Management
39

Pipettes
Extract of the Lab Products & Services’ product portfolio
Filtration | Lab Filtration
Lab Balances | Lab Water Systems Bioanalytics
40

Recap 2020 targets and initiatives
1 Based on 2015 fx rates 2 Excluding extraordinary items
~€2bn1
Sales revenue
~ 3|4Organic
~ 1|4 Acquisitions
Portfolio Complementary extensions through alliances
and acquisitions Own product development
Regional Gain share in North America Leverage strong market growth in Asia
Infrastructure Expansion of production capacity Significant investments into IT infrastructure
Strategic initiatives 2020 targets
~26-27%2
EBITDA margin
41
Executive Board of Sartorius AG
Rainer Lehmann, CFOsince March 2017
Finance, IT, Business Processes
Joachim Kreuzburg, CEOsince 2003
Corporate Strategy, Legal & Compliance, Operations, Communications, Human Resources
Reinhard Vogtsince 2009
Marketing, Sales & Services
42
Petra Kirchhoff
Vice President Corporate Communications & IR
Phone: +49.551.308.1686E-mail: [email protected]
Sartorius Corporate Administration GmbHOtto-Brenner-Straße 2037079 Goettingen, Germanywww.sartorius.com
Financial calendar and contacts
Ben Orzelek
Director Investor Relations
Phone: +49.551.308.1668E-mail: [email protected]
July 24, 2018Publication of the Interim Financial Report 2018
August 28, 2018Commerzbank Sector Conf. Week | Frankfurt
September 04, 2018M.M. Warburg Roadshow | Edinburgh
September 05, 2018Metzler Roadshow | London
September 06, 2018Goldman Sachs European Medtech Conf. | London
September 12, 2018Commerzbank Roadshow | Chicago
September 13, 2018Morgan Stanley Global HC Conf. | New York
September 25, 2018Berenberg German Corporate Conf. | Munich
43