power system flexibility for the energy transition · power system that way electric vehicles...
TRANSCRIPT

POWER SYSTEM FLEXIBILITY FOR THE ENERGY TRANSITIONPART 1: OVERVIEW FOR POLICY MAKERS
November 2018
www.irena.org

Copyright© IRENA 2018
Unless otherwise stated, material in this publication may be freely used, shared, copied, reproduced, printed and/or
stored, provided that appropriate acknowledgement is given of IRENA as the source and copyright holder. Material in this
publication that is attributed to third parties may be subject to separate terms of use and restrictions, and appropriate
permissions from these third parties may need to be secured before any use of such material.
ISBN 978-92-9260-089-1
Citation: IRENA (2018), Power System Flexibility for the Energy Transition, Part 1: Overview for policy makers,
International Renewable Energy Agency, Abu Dhabi.
About IRENA
The International Renewable Energy Agency (IRENA) is an intergovernmental organisation that supports countries in their transition to a sustainable energy future and serves as the principal platform for international co-operation, a centre of excellence, and a repository of policy, technology, resource and financial knowledge on renewable energy. IRENA promotes the widespread adoption and sustainable use of all forms of renewable energy, including bioenergy, geothermal, hydropower, ocean, solar and wind energy, in the pursuit of sustainable development, energy access, energy security and low-carbon economic growth and prosperity.
Acknowledgements
This report benefited from the input of various experts, notably Debabrata Chattopadhyay (World Bank), Todd Levin (Argonne National Laboratory), Debra Lew (General Electric), Michael Milligan (consultant, ex-NREL), Simon Müller (IEA), Sakari Oksanen (consultant, ex-IRENA), Aidan Tuohy (EPRI) and Manuel Welsch (IAEA). Dolf Gielen and Asami Miketa (IRENA) also provided valuable input.
Contributing authors: Emanuele Taibi, Thomas Nikolakakis, Laura Gutierrez and Carlos Fernandez (IRENA) with Juha Kiviluoma, Tomi J. Lindroos and Simo Rissanen (VTT).
The report is available for download: www.irena.org/publications.
For further information or to provide feedback: [email protected]
Disclaimer
This publication and the material herein are provided “as is”. All reasonable precautions have been taken by IRENA to verify the reliability of the material in this publication. However, neither IRENA nor any of its officials, agents, data or other third-party content providers provides a warranty of any kind, either expressed or implied, and they accept no responsibility or liability for any consequence of use of the publication or material herein.
The information contained herein does not necessarily represent the views of the Members of IRENA. The mention of specific companies or certain projects or products does not imply that they are endorsed or recommended by IRENA in preference to others of a similar nature that are not mentioned. The designations employed and the presentation of material herein do not imply the expression of any opinion on the part of IRENA concerning the legal status of any region, country, territory, city or area or of its authorities, or concerning the delimitation of frontiers or boundaries.

3
CONTENTS
ABBREVIATIONS ���������������������������������������������������������������������������������������������������������������������������������� 5
GLOSSARY ����������������������������������������������������������������������������������������������������������������������������������������������6
EXECUTIVE SUMMARY �������������������������������������������������������������������������������������������������������������������������8
1 FLEXIBILITY IN THE ENERGY TRANSITION ��������������������������������������������������������������������������� 10
2 FLEXIBILITY IN POWER SYSTEMS ��������������������������������������������������������������������������������������������15
3 SOURCES OF FLEXIBILITY ��������������������������������������������������������������������������������������������������������24
3�1 Technical flexibility ���������������������������������������������������������������������������������������������������������������25
3�2 Operational flexibility ����������������������������������������������������������������������������������������������������������� 31
4 FLEXIBILITY IN THE PLANNING PROCESS ����������������������������������������������������������������������������35
5 CONCLUSIONS �������������������������������������������������������������������������������������������������������������������������������42
REFERENCES ����������������������������������������������������������������������������������������������������������������������������������������43
POWER SYSTEM FLEXIBIL ITY FOR THE ENERGY TRANSITION4
FIGURES
Figure 1: Share of electricity in total final energy consumption, REmap Case, 2015–2050 10
Figure 2: A 2-degree Celsius scenario for electricity generation, REmap Case, 2015–2050 1 1
Figure 3: Power system flexibility enablers in the energy sector 12
Figure 4: Seasonal variability of hourly electricity demand in ERCOT 16
Figure 5: Legacy categorisation of various types of conventional electricity generation units based on their generation characteristics 1 7
Figure 6: Impact of wind variability and uncertainty (forecast error) on net load 1 8
Figure 7: Flexibility issues in a system with high penetration of solar PV 2 1
Figure 8: Impacts of VRE at various time scales and relevant flexibility solutions 24
Figure 9: Technical options to increase system flexibility 25
Figure 10: Different time scales in which flexibility has to be analysed 33
Figure 11: Summary of operating reserves 33
Figure 12: Methodology for flexibility planning 36
Figure 13: The IRENA FlexTool in the planning process 41
TABLES
Table 1: Comparison of technical characteristics between coal-fired and gas-fired power generation technologies 26
BOXES
Box 1� Unlocking power system flexibility in China 32
Box 2� The Irish case 34
Box 3� Brief introduction to the IRENA FlexTool 41

PART 1: OVERVIEW FOR POLICY MAKERS 5
ABBREVIATIONS
CAES compressed air energy storage
CHP combined heat and power
CO2 carbon dioxide
CSP concentrated solar power
DC direct current
DS3 Delivering a Secure, Sustainable Electricity System
ENTSO-E European Network of Transmission System Operators
ERCOT Electric Reliability Council of Texas
EV electric vehicle
FACTS flexible alternating current transmission system
FCR frequency containment reserve
FFR fast frequency response
FRR frequency restoration reserve
GW gigawatt
IAEA International Atomic Energy Agency
IEA International Energy Agency
IRENA International Renewable Energy Agency
MW megawatt
NREL National Renewable Energy Laboratory (United States)
PJ petajoule
PV photovoltaic
REmap Renewable Energy Roadmap
SNSP system non-synchronous penetration
SONI System Operator for Northern Ireland
TSO transmission system operator
TWh terawatt-hour
VRE variable renewable energy
V2G vehicle-to-grid

POWER SYSTEM FLEXIBIL ITY FOR THE ENERGY TRANSITION6
GLOSSARY
Ancillary services Services necessary for the operation of an electric power system provided by the system operator and/or by power system users� System ancillary services may include the participation in frequency regulation, reactive power regulation, active power reservation, etc� (Source: Electropedia)
Capacity expansion planning
The process of identifying future investments in assets in the power sector, typically with a long planning horizon, 20–40 years or more� Frequently published as electricity sector masterplans� Common purposes include the least-cost evolution of the electricity generation mix, assessing economic and policy implications and their sensitivity to future uncertainties, and exploring alternative policy scenarios�
Cycling (re: thermal generators)
Changing the output of a power plant by starting up, shutting down, ramping up or ramping down�
Demand-side flexibility A power system’s ability to adjust electricity demand rapidly as requested to match electricity supply�
Dispatch simulation A mathematical process applied to simulate the dispatch of generators in a given power system over a period of a few hours up to one year� Transmission system operators (TSOs) may use such simulations for operational planning of dispatch (e� g�, a day or a week ahead), and power generators may use them for fuel budgeting and maintenance planning (e� g�, years ahead)� Policy and regulatory bodies also use them to inform policy and regulatory decisions made during the planning process�
Electrification The process of shifting from an energy source other than electricity to electricity� An example of electrification is shifting from biomass to electricity for cooking food�
Electric vehicle A vehicle that uses one or more electric motors or traction motors for propulsion rather than a conventional internal combustion engine�
Frequency (re: a power system)
The rotational frequency of synchronous generators within a power system that has to be maintained in a narrow interval around the nominal value to ensure reliable operations�
Heat pump A device that transfers heat energy from a source of heat to a heat sink� Heat pumps move thermal energy in the opposite direction of spontaneous heat transfer, by absorbing heat from a cold source and releasing it to a warmer sink�

PART 1: OVERVIEW FOR POLICY MAKERS 7
Geospatial planning An integral part of the transmission planning conducted by TSOs, regulators or the TSO-responsible unit within a utility� It refers to planning practices that define a long-term vision for developing transmission lines, primarily on economic grounds considering the trade-off between the potential benefit of locating renewable generation in areas with higher-quality resources, and the cost of transmission investment�
Inertia (inertial response)
A property of large synchronous generators, which contain large rotating masses, and which acts to overcome the immediate imbalance between power supply and demand for electric power systems, typically the electrical grid� (Source: Wikipedia)
Interruptible load An electrical load that comes from customers with interruptible service that can be disconnected when the system requires a rapid reduction in demand�
Power-to-heat The process of using surplus electric power from variable renewable energy (VRE) to produce heat that can be used as an energy carrier or a service, mainly in the industrial and residential sectors� The main technologies used for this purpose are heat pumps and electric resistors�
Reserves (re: system services)
Generating capacity, kept in reserve to compensate for all possible deviations in the power balance that may occur between normal conditions and those which actually occur, and thus to ensure a reliable and economic electricity supply� (Source: Electropedia)
Sector coupling The process of interconnecting the power sector with the broader energy sector (e� g�, heat, gas, mobility)� It includes charging of battery-electric vehicles and production of heat and hydrogen from electricity�
Technical network studies
Studies to assess a power system’s ability to 1) operate reliably under normal (steady-state) conditions and 2) recover effectively in the event of a contingency (dynamic conditions)�
Uncertainty (re: solar and wind power)
The inability to perfectly predict the future output of solar and wind power sources�
Variability (re: solar and wind power)
The fluctuating nature of solar and wind resources, which translates to possibly rapid changes in electricity generation�
Variable renewable energy
A renewable energy source that is characterised by variability and uncertainty, such as wind power and solar power� Less common VRE includes run-of-river hydropower and wave power�

POWER SYSTEM FLEXIBIL ITY FOR THE ENERGY TRANSITION8
EXECUTIVE SUMMARY
Flexibility has become a common by-word for the energy transition� While everyone agrees that we need more flexibility in future power systems, views vary widely on how to achieve this, particularly to improve grid integration and make maximum use of solar and wind potential�
To transform our energy system towards one dominated by renewable energy, flexibility has to be harnessed in all parts of the power system� Power system flexibility spans from more flexible generation to stronger transmission and distribution systems, more storage and more flexible demand� Production of heat and synthetic gas (e� g�, hydrogen) from renewable electricity is also key for energy system decarbonisation in the long term, and once in place it can be a significant additional source of flexibility for the power system�
The present report discusses flexibility in the context of the energy transition and proposes an approach in planning for flexibility in power systems expecting to achieve high VRE shares (VRE)� In addition to assessing a power system’s flexibility level by looking into traditional supply-side flexibility sources, the approach of the International Renewable Energy Agency (IRENA) incorporates at an equal level demand-side flexibility, grid reinforcements, storage and sector coupling as additional flexibility sources and potential game changers�
The idea is based on the fact that when coupled into a power grid, technologies at this interface effectively also become a component of the power system� That way electric vehicles (EVs), electric boilers, heat pumps and electrolysers for hydrogen production provide flexibility to the power system by 1) adjusting their demand profile based on price signals, and 2) making any integrated storage a source of energy storage for the power system, to decouple the timing of demand for final energy from electricity demand�
Flexibility has to be harnessed in all parts of the power system.
Power system flexibility involves varied methods of generation, combined with stronger transmission and distribution networks.
Heat and hydrogen production from renewables can also boost system flexibility and help with energy decarbonisation.
POWER SYSTEM FLEXIBIL ITY FOR THE ENERGY TRANSITION 8
Flexibility has become a common by-word for the energy transition. While everyone agrees that we need more flexibility in future power systems, views vary widely on how to achieve this, particularly to improve grid integration and make maximum use of solar and wind potential.
To transform our energy system towards one dominated by renewable energy, flexibility has to be harnessed in all parts of the power system. Power system flexibility spans from more flexible generation to stronger transmission and distribution systems, more storage and more flexible demand. Production of heat and synthetic gas (e. g., hydrogen) from renewable electricity is also key for energy system decarbonisation in the long term, and once in place it can be a significant additional source of flexibility for the power system.
Power system flexibility involves varied methods of generation, combined with stronger transmission and distribution networks
The present report discusses flexibility in the context of the energy transition and proposes an approach in planning for flexibility in power systems expecting to achieve high VRE shares (VRE).
In addition to assessing a power system’s flexibility level by looking into traditional supply-side flexibility sources, the approach of the International Renewable Energy Agency (IRENA) incorporates at an equal level demand-side flexibility, grid reinforcements, storage and sector coupling as additional flexibility sources and potential game changers.
Heat and hydrogen production from renewables can also boost system flexibility and help with energy decarbonisation
The idea is based on the fact that when coupled into a power grid, technologies at this interface effectively also become a component of the power system. That way electric vehicles (EVs), electric boilers, heat pumps and electrolysers for hydrogen production provide flexibility to the power system by 1) adjusting their demand profile based on price signals, and 2) making any integrated storage a source of energy storage for the power system, to decouple the timing of demand for final energy from electricity demand.
EXECUTIVE SUMMARY

PART 1: OVERVIEW FOR POLICY MAKERS 9
For example, in some jurisdictions with limited supply-side flexibility, electric water heaters have been used as a source of flexibility for many years� Today, significant attention is dedicated to EVs, as they can act as battery storage devices if regulations and technologies are aligned, and they can provide short-term storage and grid services� In the future, the electrification of heat and fuels can provide medium- and long-term storage for the power system, dealing with seasonal unbalances�
IRENA is working with its members to foresee possible flexibility shortages in their long-term renewable energy plans and to identify the least-cost mix of solutions to address
these� The resulting analysis may be useful to countries aiming to test more aggressive deployment scenarios and to explore untapped solar and wind potential� This report aims to inform policy makers on the options available to scale up power system flexibility� It comes as part of a package, along with a FlexTool methodology for technical experts as well as four country case studies on power system flexibility options based on application of the IRENA tool�
Report title Type of content Format Target audience
Power system flexibility for the energy transition, Part I: Overview for policy makers
Discussion on role of flexibility Brief report Policy makers
Power system flexibility for the energy transition, Part II: IRENA FlexTool methodology
Technical description of method behind the new IRENA FlexTool
Detailed report
Power system modellers, energy planners, power system operators, academia
FlexTool case studies on Colombia, Panama, Thailand, Uruguay
Summary of engagement and analysis
Brochure, communication- oriented
Policy makers, energy planners, general public
Studies on the IRENA FlexTool, both in principle and in practice
POWER SYSTEM FLEXIBIL ITY FOR THE ENERGY TRANSITION 8
Flexibility has become a common by-word for the energy transition. While everyone agrees that we need more flexibility in future power systems, views vary widely on how to achieve this, particularly to improve grid integration and make maximum use of solar and wind potential.
To transform our energy system towards one dominated by renewable energy, flexibility has to be harnessed in all parts of the power system. Power system flexibility spans from more flexible generation to stronger transmission and distribution systems, more storage and more flexible demand. Production of heat and synthetic gas (e. g., hydrogen) from renewable electricity is also key for energy system decarbonisation in the long term, and once in place it can be a significant additional source of flexibility for the power system.
Power system flexibility involves varied methods of generation, combined with stronger transmission and distribution networks
The present report discusses flexibility in the context of the energy transition and proposes an approach in planning for flexibility in power systems expecting to achieve high VRE shares (VRE).
In addition to assessing a power system’s flexibility level by looking into traditional supply-side flexibility sources, the approach of the International Renewable Energy Agency (IRENA) incorporates at an equal level demand-side flexibility, grid reinforcements, storage and sector coupling as additional flexibility sources and potential game changers.
Heat and hydrogen production from renewables can also boost system flexibility and help with energy decarbonisation
The idea is based on the fact that when coupled into a power grid, technologies at this interface effectively also become a component of the power system. That way electric vehicles (EVs), electric boilers, heat pumps and electrolysers for hydrogen production provide flexibility to the power system by 1) adjusting their demand profile based on price signals, and 2) making any integrated storage a source of energy storage for the power system, to decouple the timing of demand for final energy from electricity demand.
EXECUTIVE SUMMARY
PART 1: OVERVIEW FOR POLICY MAKERS 9
Report Title Type of content Format Target audience
Power system flexibility for the energy transition, Part I: Overview for policy makers
Discussion on role of flexibility
Brief report Policy makers
Power system flexibility for the energy transition, Part II: IRENA FlexTool methodology
Technical description of method behind the new IRENA FlexTool
Detailed report
Power system modellers, energy planners, power system operators, academia
FlexTool case studies on Colombia, Panama, Thailand, Uruguay
Summary of engagement and analysis
Brochure, communication-oriented
Policy makers, energy planners, general public
Studies on the IRENA FlexTool, both in principle and in practice
For example, in some jurisdictions with limited supply-side flexibility, electric water heaters have been used as a source of flexibility for many years. Today, significant attention is dedicated to EVs, as they can act as battery storage devices if regulations and technologies are aligned, and they can provide short-term storage and grid services. In the future, the electrification of heat and fuels can provide medium- and long-term storage for the power system, dealing with seasonal unbalances.
IRENA is working with its members to foresee possible flexibility shortages in their long-term renewable energy plans and to identify the least-cost mix of solutions to address these.
The resulting analysis may be useful to countries aiming to test more aggressive deployment scenarios and to explore untapped solar and wind potential. This report aims to inform policy makers on the options available to scale up power system flexibility. It comes as part of a package, along with a FlexTool methodology for technical experts as well as four country case studies on power system flexibility options based on application of the IRENA tool.
Flexibility has to be harnessed in all parts of the power system
POWER SYSTEM FLEXIBIL ITY FOR THE ENERGY TRANSITION10
1 FLEXIBILITY IN THE ENERGY TRANSITION
1 Under the REmap scenario, energy efficiency could stabilise global final energy consumption to nearly current levels�
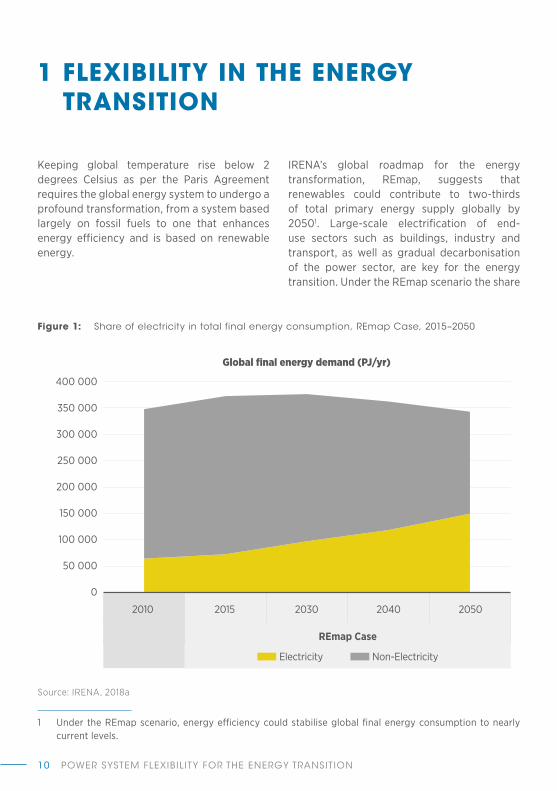
Keeping global temperature rise below 2 degrees Celsius as per the Paris Agreement requires the global energy system to undergo a profound transformation, from a system based largely on fossil fuels to one that enhances energy efficiency and is based on renewable energy�
IRENA’s global roadmap for the energy transformation, REmap, suggests that renewables could contribute to two-thirds of total primary energy supply globally by 20501� Large-scale electrification of end-use sectors such as buildings, industry and transport, as well as gradual decarbonisation of the power sector, are key for the energy transition� Under the REmap scenario the share
Global final energy demand (PJ/yr)
0
50 000
100 000
150 000
200 000
250 000
300 000
350 000
400 000
REmap Case
2010 2015 2030 2040 2050
Electricity Non-Electricity
Figure 1: Share of electricity in total final energy consumption, REmap Case, 2015–2050
Source: IRENA, 2018a

PART 1: OVERVIEW FOR POLICY MAKERS 11
15 %
85 %Renewables
Non-Renewables
76 %
24 %Renewables
Non-Renewables
0
10 000
20 000
30 000
40 000
50 000
20502015
Electricity generation (TWh/yr) Others (incl. marine and hybrid)
Geothermal
Wind
CSP
Solar PV
Bioenergy
Hydropower
Nuclear
Natural gas
Oil
Coal
REmapCase
2015–2050changes
39 %
23 %
10 %16 % 22 %
36 %
10 %4 %
12 %
<1 %3.5 %1 %3.5 %
4%
4 %
4 %
4 %
1 %
3 %
of electricity in total final energy consumption will increase from 20 % today to 40 % by 2050 (see Figure 1)� At the same time the share of renewable energy in the power sector would need to more than triple compared to current levels – where variable renewable energy (VRE) sources such as solar and wind will account for 60 % of total electricity produced (see Figure 2)� This means that many countries will need to gradually transform their power systems to solar and wind becoming the backbone of electricity supply (IRENA, 2018a)�
Transforming our energy system towards one dominated by renewable energy comes with some challenges, as high VRE shares increase system requirements for balancing supply and demand� To effectively manage large-scale VRE a number of flexibility sources need to be exploited and planned ahead of time� Flexibility has to be harnessed in all sectors of the energy system, from power generation to stronger transmission and distribution systems, storage (both electrical and thermal) and more flexible demand (demand-side management and sector coupling) (see Figure 3)�
Figure 2: A 2-degree Celsius scenario for electricity generation, REmap Case, 2015–2050
Note: Based on REmap analysis the share of renewables in the power sector would increase from 24 % in 2015 to
85 % by 2050. Around 60 % would be VRE.
Source: IRENA, 2018a

POWER SYSTEM FLEXIBIL ITY FOR THE ENERGY TRANSITION12
Figure 3: Power system flexibility enablers in the energy sector
H2Transmission
Distribution
PowerSystem
FlexibilitySector
coupling
Storage
Gas(e.g.,Hydrogen)
Heat
ElectricVehicles
Generation
Demand-SideManagement
Before solar and wind power became widely deployed worldwide, power systems were designed with flexibility attributes that would allow them to balance varying demand and deal with uncertainty related to unexpected losses of system elements� In conventional power systems (i� e�, systems with low or no VRE shares) supply-side assets traditionally have been used as the main source of flexibility� Thermal generators with advanced cycling capabilities (e� g�, open-cycle gas turbines), flexible renewables such as hydropower, and pumped hydro storage traditionally have been used to balance demand fluctuations and provide operational reserves�
Over the last five years the impact of solar and wind variability has begun to be felt in a number of power systems where aggressive VRE targets were in place� Even before this, studying the potential impacts of VRE integration on system operations had become a hot topic of research in institutions around the world (Denholm et al�, 2008; Holttinen et al�, 2007)� Multiple studies showed that additional sources of flexibility would be needed to effectively integrate high VRE shares�
Since then solutions of varying complexity, time scale, level of effectiveness and cost have been implemented successfully and have facilitated the integration of high shares of VRE in large interconnected systems (as in the case of Denmark), in gigawatt-scale isolated power systems (as in Ireland) and in small-island systems (such as King Island in Australia) (RTE,
Solar and wind power call for greater system flexibility

PART 1: OVERVIEW FOR POLICY MAKERS 13
2018; EirGrid and SONI, 2018; Kroposki, 2017)� Such solutions include geographic distribution of VRE generators, pooling of resources, restructuring markets to remunerate flexibility, enhancing grid infrastructure, deploying advanced battery technologies, developing demand-side management programmes and enhancing the cycling capabilities of thermal generators (Mills and Wiser, 2010; Denholm, 2015; Xiang, 2017; IEA, 2018; IRENA, 2017a)�
Many of the above solutions are investment free and can be used to unlock existing power sector flexibility as a first action to overcome flexibility issues� To further progress and achieve the goals of the energy transition, the full flexibility potential of the energy system should be unlocked, with demand flexibility and sector coupling becoming increasingly important�
In the case of electricity demand, the traditional approach for the last century has been that demand is inflexible, with good predictability and uncertainty limited to a few percentage points, covered by operational reserves provided by thermal or hydro generators2� Even though the role of demand-side management in the form of interruptible loads3 has been recognised as an effective and affordable mitigation measure, there is a much larger potential on the demand side – for instance, linking the power sector to heating and cooling even more strongly (today, cooling is mostly electrified, but heating is not)�
Electrifying heat through the use of resistive heating as well as heat pumps, also known as power-to-heat, could provide significant flexibility on the demand side if well managed
2 Failure of large power plants is the main source of uncertainty in conventional power systems�3 The value of demand-side management has been enhanced lately through aggregating diverse portfolios
of small and medium-sized customers to participate in the energy and ancillary services markets� This is becoming particularly relevant when such portfolios aggregate demand as well as storage assets such as behind-the-meter battery storage systems�
Also, it could make accessible – as a source of energy storage for a power system and an important source of flexibility on the demand side – significant amounts of thermal storage existing in district heating systems and all the way down to millions of residential electric water heaters� Other advantages of heat electrification could be reductions in total costs and in emissions, and an increase in power system reliability�
In addition, some parts of the energy sector cannot be reached directly with an electric cable and therefore require the use of fuels� This is the case for large segments of transport (except for battery-electric vehicles and electric trains), especially road freight, shipping and aviation� This is also the case for some of the industrial processes where the cable could get to the industrial facility, but a fuel is required for either process reasons (hydrogen for ammonia, polymers or refining) or because of the high temperature required in the process�
At very high shares of VRE, the production of carbon-free electrofuels such as hydrogen from renewable electricity could have a significant role in the context of decarbonisation of the energy sector, beyond electricity� For heat, the production of hydrogen can provide significant flexibility for the power system (depending on the type of electrolyser), as well as, most importantly, seasonal storage of renewable electricity by blending hydrogen into natural gas grids�
Planning for flexibility within a dynamic environment is a continuous process that is key to successfully transforming the power sector�

POWER SYSTEM FLEXIBIL ITY FOR THE ENERGY TRANSITION14
Achieving the goals of the energy transition requires many countries to achieve VRE shares greater than 60 %� Practical experience has shown that this is possible� Denmark and Ireland, for example, are front runners in wind energy integration, with wind power shares of 44 % (RTE, 2018) and 27 %, respectively, and maximum instantaneous penetration beyond 150 % and 60 % of demand, respectively (RTE, 2018; EirGrid and SONI, 2018)�
This did not happen overnight� The power systems of both countries have been going through a transformation process from which we can extract valuable lessons:
1) It makes much more economic sense to plan ahead for flexibility rather than exploring suboptimal investments after flexibility issues arise in a power system�
2) Substantial amounts of VRE can be integrated by unlocking existing flexibility rather than investing in new costly assets�
3) Project development time, in particular permitting and construction times, have to be accounted for in the selection of solutions4�
4) Planning for flexibility is based on sophisticated tools and methods that evolve over time to account for developments in the areas of policy, economy and technology/science�
4 On paper, transmission expansion can often be the least-cost option, but if expanding transmission takes many years, and significant VRE curtailment is taking place in the meanwhile, more costly solutions with short deployment time should be explored (e� g�, battery storage systems)�
The present report outlines an approach for assessing flexibility and uses a multi-step method� The first step is to assess inexpensive ways to unlock existing flexibility through improvements in operational practices and market restructuring� Subsequent steps focus on identifying future investments in generation, transmission and storage and exploring the full long-term flexibility potential of demand through implementation of demand-side management programmes and sector coupling�
The methodology suggests using one or more tools with specific computational capabilities such as geospatial planning, dispatch simulation and long-term asset optimisation� Such tools have capabilities to optimise system operations and investments at time scales that are representative of electricity markets�
Many countries need to boost their solar and wind use to 60 % or more for the world to achieve a sustainable energy future

PART 1: OVERVIEW FOR POLICY MAKERS 15
2 FLEXIBILITY IN POWER SYSTEMS
5 Additional core system operator tasks are: 1) maintain voltage levels within acceptable limits throughout the power system, 2) avoid overloading transmission lines and other system elements and 3) restart the system if it collapses due to a contingency that causes failing in one or more of the above�
6 Power systems are designed to operate under nearly constant frequency� Frequency deviations beyond acceptable limits and time periods can damage generators and electromechanical equipment and thus create a chain reaction of loss of load and/or generation that can lead to a blackout�
7 VRE sources are wind, solar photovoltaics (PV), run-of-river hydropower and concentrated solar power (CSP) without thermal storage� In this report the term VRE refers to the most common sources, solar PV and wind�
8 Electricity demand could also present, for example, weekend or inter-year variability�
One of the main tasks of a power system operator is to balance electricity supply and demand at all times5 (Kirby, 2007)� Balancing supply and demand at all times is crucial for a system’s reliable operation since even a small mismatch can disturb power system frequency and possibly affect the reliability of system operations6� Put simply, power system flexibility refers to a power system’s ability to respond to both expected and unexpected changes in demand and supply (Cochran et al�, 2014)�
As a more complete definition, which also touches on economics, “Power system flexibility is defined as the ability of a power system to reliably and cost-effectively manage the variability and uncertainty of demand and supply across all relevant timescales” (IEA, 2018)�
Traditionally, power systems did not have any VRE7 and therefore are designed to deal with non-VRE related variability and uncertainty� The main source of variability in conventional power systems is electricity demand, including both intra-day and seasonal variability8� The shape of electricity demand depends on a mix of climatic and socio-economic parameters such as local weather, season of the year, level of industrialisation, a country’s energy
intensity, social awareness and culture towards best energy uses, and gross domestic product (GDP) (see Figure 4)�
In addition, power system operators have defined and procured ancillary services to deal with uncertainty related to unexpected loss of a generator (or a load) and real-time imbalances due to demand forecast errors� To date, in most power systems the main source of uncertainty is the loss of one or more of the largest in-feeds (i� e�, generators or transmission lines)� Conventional power systems generally incorporate a least-cost mix of controllable generation assets with desirable techno-economic characteristics to balance varying demand at all times�
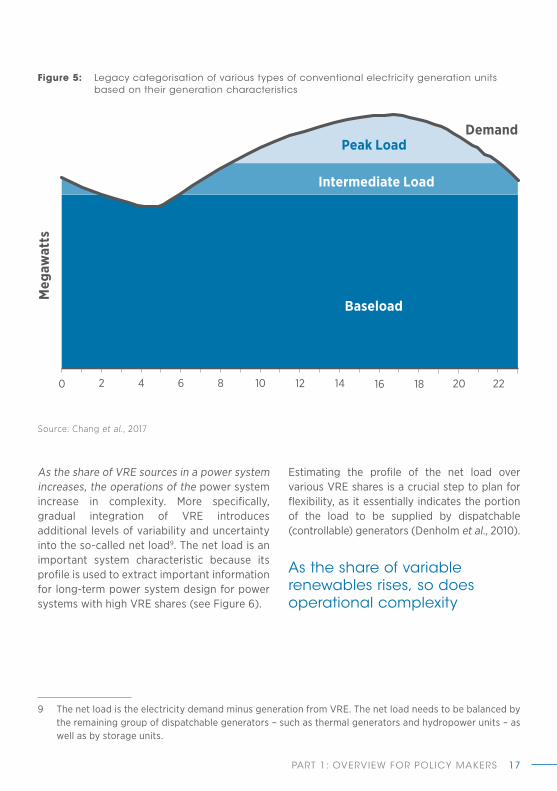
Baseload units have limited cycling capabilities but are able to generate large amounts of energy at relatively low operational costs� Typical baseload units include coal, biomass and nuclear power plants, mostly using steam turbines to generate electricity (and, in combined heat and power (CHP) plants, also heat)�
Traditional power systems were designed to deal with non-variable sources

POWER SYSTEM FLEXIBIL ITY FOR THE ENERGY TRANSITION16
Peaking generators usually have opposite techno-economic characteristics� They are designed for flexible operation with rapid start-up and fast ramping capabilities and low minimum operational level� Peaking units are usually gas turbines (open-cycle gas turbines) and internal combustion generators (internal combustion engines)� Modern combined-cycle gas turbines (which combine gas and steam turbines) and reservoir hydropower units are considered intermediate generators, as they can be used to provide either base or peak load (see Figure 5)�
Over the last decade the traditional structure of power systems has changed due to increasing shares of VRE in the electricity generation mix� VRE growth is driven by rapid cost reductions and by national policies that stem from multinational agreements such as the Paris Agreement to limit global temperature increase due to climate change� Increased levels of VRE deployment are leading to a transformation of the power sector, with VRE sources gradually becoming the new backbone of power systems�
Figure 4: Seasonal variability of hourly electricity demand in ERCOT
60 000
50 000
40 000
30 000
20 000
10 000
00 24
Summer maximum Winter Spring Maximum
48 72 96 120 1681440.0
Hour
Load
(Fr
acti
on o
f Ann
ual P
eak)
Load
(M
W)
0.1
0.2
0.3
0.4
0.5
0.6
0.7
0.8
0.9
1.0
Source: Source: Denholm and Hand, 2011
PART 1: OVERVIEW FOR POLICY MAKERS 17
As the share of VRE sources in a power system increases, the operations of the power system increase in complexity� More specifically, gradual integration of VRE introduces additional levels of variability and uncertainty into the so-called net load9� The net load is an important system characteristic because its profile is used to extract important information for long-term power system design for power systems with high VRE shares (see Figure 6)�
9 The net load is the electricity demand minus generation from VRE� The net load needs to be balanced by the remaining group of dispatchable generators – such as thermal generators and hydropower units – as well as by storage units�
Estimating the profile of the net load over various VRE shares is a crucial step to plan for flexibility, as it essentially indicates the portion of the load to be supplied by dispatchable (controllable) generators (Denholm et al�, 2010)�
Figure 5: Legacy categorisation of various types of conventional electricity generation units based on their generation characteristics
0 2 4 6 8 10 12 14 1816 20 22
Demand
Meg
awat
ts
Baseload
Intermediate Load
Peak Load
Source: Chang et al., 2017
As the share of variable renewables rises, so does operational complexity

POWER SYSTEM FLEXIBIL ITY FOR THE ENERGY TRANSITION18
At low VRE deployment levels, very little difference exists between the net load and the demand� As VRE integration increases, the shape of the net load changes until increasingly noticeable differences appear between the two� Three main characteristics of the net load profile that affect system flexibility are: 1) the rate of change of net load (or ramp rate), 2) the range between the maximum and minimum net load within a day (also called ramping range) and 3) the uncertainty related to forecast error (the combination of demand, solar and wind forecast errors)� Higher VRE penetration increases one or more of the above�
The direct impacts of a continuously changing net load on power systems operations has been studied extensively (Denholm et al�, 2010; GE Energy, 2010; Lew et al�, 2013; Clifford
and Clancy, 2011; EWIS, 2010; Holttinen et al�, 2016)� Large-scale VRE integration makes the process of balancing supply and demand more challenging due to the higher frequency of occurrence and magnitude of forecast errors on net load, and has been associated with increased requirements for cycling of thermal generation, overgeneration and fluctuating electricity prices (Denholm et al�, 2015)� A power system with flexibility gaps might experience VRE curtailment and, in extreme situations, loss of load, as detailed below (Rogers et al�, 2010; Bird et al�, 2014)�
When more electricity than is needed is being supplied due to technical constraints on the ability of thermal generators to further reduce their output a situation of overgeneration can trigger the need to disconnect (curtail)
Figure 6: Impact of wind variability and uncertainty (forecast error) on net load
20
40
60
80
100
120
140
160
180
000:00 01:00 02:00 03:00 04:00 05:00 06:00 07:00 08:00 09:00 10:00 11:00 12:00 13:00 14:00 15:00 16:00 17:00 18:00 19:00 20:00 21:00 22:00 23:00
MW
load residual load residual load forecast wind wind forecast

PART 1: OVERVIEW FOR POLICY MAKERS 19
generation from VRE to maintain frequency at its nominal value� (Denholm et al�, 2015) Figure 7 illustrates a typical hypothetical dispatch where one can observe the characteristic duck-shaped curve of the net load in power systems with high solar shares�
There are two periods with increased risk of overgeneration� The first is during early morning hours when thermal units get commissioned in partial loading mode, being standby to accommodate the forthcoming typical morning increase of demand10,11,12� The second period is during peak solar production, when online thermal units are pushed down to their minimum operating point to accommodate PV generation� Overgeneration also can be a side effect of wind generation during late night hours when wind production is at the highest level while demand is at its lowest�
The Electric Reliability Council of Texas (ERCOT), for example, experienced wind curtailment levels of 17 % in 2009 due mainly to transmission constraints (Bird et al�, 2014)� However, curtailment levels were reduced to less than 0�5 % in 2014 by restructuring the regulatory framework and encouraging transmission investments that contributed to reducing wind curtailment (Ye et al�, 2018)�
10 The early morning increase in demand is related to residential loads being activated when people wake up to start their day� The increase continues as commercial and industrial loads are activated later on�
11 Thermal units need time to warm up before getting online� Thus they are committed ahead of the expected increase in demand to ensure timely response�
12 The issue of overgeneration at various future levels of VRE has been analysed by the California Independent System Operator (CAISO)� See https://www�caiso�com/Documents/FlexibleResourcesHelpRenewables_FastFacts�pdf�
13 By creating additional demand when electricity buyers are willing to get paid to increase their demand�14 Power system inertia refers to the total instantaneous inertia from the spinning rotors of synchronous
generators� Such inertia helps generators resist changes in their rotational speed from system imbalances and gives system operators time to activate necessary controls to help the system recover safely�
15 Inertia is a property supplied by synchronous generators� It can be shared within two systems only if the interconnection is also synchronous� For example, Ireland cannot currently share inertia with the United Kingdom as the regional interconnections are in direct current (DC)�
In a market environment, energy oversupply causes a reduction in electricity prices, even reaching negative levels� Negative pricing is a market mechanism to restore balance in the system13; however, it is also a symptom of lack of flexibility in the power system�
Besides the economic implications of overgeneration, very high instantaneous VRE shares pose system reliability risks related to lack of so-called system inertia14� Inertia is a technical term referring to a system’s instantaneous ability to recover from instantaneous imbalances in supply and demand� It is closely related to the amount of conventional synchronous capacity that is online (spinning) at each moment, and it is inversely proportional to the speed at which frequency can change during a disturbance (rate of change of frequency): the lower the inertia, the faster the change in frequency, the more difficult it is to maintain reliable operations�
Every power system has pre-specified requirements for inertia that impose having some synchronous capacity that is dispatched at all times� In practical terms, achieving instantaneous VRE penetration levels of 100 % is very challenging unless a system is appropriately interconnected15 to get inertia

POWER SYSTEM FLEXIBIL ITY FOR THE ENERGY TRANSITION20
from a neighbouring country that is part of the same synchronous grid� In Denmark, for example, wind penetration exceeds 140 % at specific moments; however, the system gets inertia from mainland Europe (ENTSO-E) and the Nordic countries through synchronous interconnections (Zaman, 2018)�
Modern power electronics found in wind and solar PV generators, as well as battery energy storage systems and some DC transmission systems (voltage source converter high-voltage direct current, VSC-HVDC), have capabilities to simulate inertial response (also called synthetic inertia) that are constantly improving� Besides synchronous interconnections, upgrading grid codes to require power electronics-based technologies to provide some synthetic inertia, the use of synchronous energy storage16 and sector coupling are some ways to deal with the reduction of inertia caused by the displacement of synchronous generators due to VRE deployment�
When overgeneration or inertia shortage conditions appear, system operators often resort to VRE curtailment as a mitigation measure� VRE curtailment refers to a system operator reducing the output of VRE units to address flexibility issues, and it requires automatic access to plant operations� In wind turbines this can be done by turning the blades away from the wind� In solar PV technologies the output can be reduced through smart inverters or by simply disconnecting some of the inverters17�
16 VRE (a form of non-synchronous power) can be stored and released later using synchronous energy storage technologies� Pumped hydropower and compressed air energy storage (CAES) are two such technologies that can contribute to system inertia in addition to other beneficial system services (see section 3�1)�
17 VRE curtailment is more challenging for rooftop units as system operators usually do not have access to small systems�
18 Ramping is a term used to denote the rate of change of the net load or the rate of change of generation� 19 Data refer to average values for the last week of March for each year�
VRE curtailment reduces the capacity factor of solar and wind power and thus negatively affects both their economic attractiveness and system benefits from VRE (environmental benefits, cheaper electricity, fuel savings, etc�)� Unless flexibility gaps are addressed, curtailment rates increase with increased VRE penetration, until a point where any incremental VRE capacity becomes economically unattractive due to the high marginal curtailment (Bird et al�, 2014; Rogers et al�, 2010)�
Increase in net load ramping18 is another effect of large shares of VRE� Figure 7 illustrates rapid reduction of the net load as solar PV production increases before noon� As an example, in spring 2017 the California Independent System Operator, which has added more than 6 gigawatts (GW) of solar energy since 2013 (CAISO, 2017), experienced morning ramps around six times higher compared to 2012 (Greentech Media, 2017)19� Simulations highlight that when solar PV reaches 11 % of total electricity supply in California the system could experience ramps as high as approximately 7 GW per hour (Denholm et al�, 2015) or around three times as much as 2017 ramping levels�
In addition to increasing ramping rates, VRE increases ramping ranges, as discussed earlier� The main implication on the system is that the conventional (dispatchable) units need to cycle faster and more frequently according to the new ramping requirements� In addition the capacity of flexible generation (i� e�, the total

PART 1: OVERVIEW FOR POLICY MAKERS 21
capacity of online units providing intermediate and peak net load) needs to be sufficient to cover increased ramping range requirements�
VRE curtailment is a mitigation measure that is usually applied when a system cannot cope with down ramping requirements� Similarly, upward ramping challenges are experienced during late afternoon hours when solar PV production is reduced towards sunset� Lack of system flexibility during upward ramping might lead to loss of load� Loss of load together with VRE curtailment are indicators that are
20 Flexibility resources need to be managed by the system operator, which has two main ways to procure the services it needs for reliable and secure system operation: grid assets can be required to provide specific services, or, if they are owned by market participants, they can be incentivised to do so through markets for energy and ancillary services� If both fail, then the system operator may be forced to resort to VRE curtailment or load shedding� The failure may be due to insufficient requirements or incentives for the market participants, but it also may be caused by actual deficit in necessary assets, which would be the result of regulatory failure in providing long-term incentives for investment in the necessary assets (e� g�, in case of no capacity market and no scarcity pricing allowed)�
frequently used in VRE integration analysis to assess a system’s flexibility20�
A flexible system also needs to be capable of dealing with uncertainty� Regulation in power systems requires at each moment some amount of reserved capacity to be procured by the system operator to deal with uncertainty� Such reserved capacity is controlled by the system operator and traditionally has been used in conventional power systems for one of two purposes� The first is to help the system recover in case of a contingency (e� g�, loss of
Loss of load
400
600
800
1 000
1 200
1 400
1 600
1 800
01 3 5 7 9 11 13 15 17 19 21 23 25 27 29 31 33 35 37 39 41 43 45 47 49 51 53 55 57 59 61 63 65 67 69 71
Loss of load
WM
VRE Curtailment
Time (hour)
Curtailed PV Thermal Gen. Demand
Figure 7: Flexibility issues in a system with high penetration of solar PV

POWER SYSTEM FLEXIBIL ITY FOR THE ENERGY TRANSITION22
generation) through a fast-acting frequency containment reserve (FCR)21 and to restore the frequency to its nominal value following the contingency (through slower frequency restoration reserve, FRR)� The second is to compensate for demand forecast errors during normal operation (also called regulating reserve) (Ela et al�, 2011)�
As the share of VRE generation grows, VRE forecast errors (rather than demand forecast errors) become the main source of net load uncertainty and therefore the main driver of regulating reserve requirement� As the shares of VRE increase, operating reserve22 requirements need to be revised regularly to account for VRE uncertainly (Moeller & Poeller Engineering, 2017)23� There will be a point where any incremental VRE capacity will require additional regulation and/or contingency reserves� Significant operational flexibility measures to minimise the impact of VRE uncertainty include the use of modern forecast technologies (IRENA, 2016), frequent accounting of updated VRE forecasts into market operations and reducing the time step of day-ahead, intra-day and balancing markets (IRENA, 2017a)�
Solar and wind variability and uncertainty affect system operations across various time scales that vary from seconds (i� e�, due to the passage of a cloud over a PV farm) to months (i� e�, seasonal variability of VRE) (Mills et al�, 2009)� Consequently, system-wide impacts of solar and wind variability
21 Most power systems are designed so that, under normal conditions, the contingency reserve is always at least the capacity of the larger generator and/or plus a fraction of the peak load�
22 The definition of various types of reserves is different among different countries� Operating reserves in this report is assumed to be the sum of contingency and regulation reserves�
23 The process of estimation of regulation reserves requires statistical analysis of historical wind and solar resource data (both actual and forecasted) to estimate a range of probabilities that correspond to forecast errors with specific magnitudes� A system might experience forecast errors based on the level of VRE integration�
have a related temporal dependency; for example, very short-term variability affects a system’s ability for frequency regulation, while variability at time scales of 15 to 30 minutes affects load following and sizing of operational reserves� Seasonal variability, on the other hand, might affect medium-term hydro storage planning and a system’s long-term capacity planning�
System flexibility needs to respond at time scales relevant to the impacts of solar and wind variability and uncertainty� Milligan et al� (2015) describe the time range for flexibility as being from sub-seconds (inertia response as a first line of defence against system imbalances) to a few years (power system planning and investment horizon)� As electrification becomes increasingly relevant in the energy transition, planning for flexibility will need to account for the effects of variability, for example on EV charging/discharging decisions and seasonal storage in the form of hydrogen production (see Figure 8)�
Finally, the development of a well-planned transmission network is of ultimate importance to ensure that flexibility is not only available but also accessible� Even though the grid is not a source of flexibility per se, it can easily become an inhibitor, especially considering that areas with high wind resource potential are often located far from load centres� When planning for a flexible power system, geospatial planning techniques can help to highlight the trade-off between the cost of transmission

PART 1: OVERVIEW FOR POLICY MAKERS 23
and the productivity of renewable generation24 (IRENA, 2017b; Madrigal and Stoft, 2012)�
A power system can be considered flexible if it can cost-effectively, reliably and across all time scales:
1) Meet the peak loads and peak net loads, avoiding loss of load25�
2) Maintain the balance of supply and demand at all times, and ensure the availability of sufficient capability to ramp up and down, the availability of sufficient fast-starting capacity and the capability to operate during low net loads�
3) Have sufficient storage capacity (both electricity storage and, through sector coupling, renewable heat and gas) to balance periods of high VRE generation and periods of high demand but low VRE generation�
4) Incorporate capabilities to adjust demand to respond to periods of supply shortages or overgeneration�
24 The trade-off refers to the potential benefit of locating renewable generation in areas with higher-quality resources against the cost of transmission investment� For example, at times the cost of new transmission capacity may outweigh the benefit of a marginally higher-quality VRE resource� The trade-off is driven mainly by the fact that transmission is often less costly when compared with generation, and that renewable resources vary dramatically with location�
25 If the installed generation is lower than the peak demand, peak loads will not be met� In this case there is not a flexibility issue but a generation adequacy problem� A system is flexible if it can meet peak loads under the assumption that the generation mix is adequate�
26 Reserves are spare capacity that the dispatched units have to keep in order to compensate an imbalance between supply and demand� For instance, if there is a sudden increase in demand, generation should rapidly increase, and this is achieved with upward reserves� The reserves considered here control system frequency, which is a direct measure of the active power balance� Voltage is a local phenomenon and needs to be controlled by assets close by� Increasing the share of VRE, especially generation connected at low voltage levels, can cause voltage issues, but this also can be mitigated by VRE assets that can participate in voltage control�
5) Maintain capabilities to mitigate possible events that could de-stabilise the power system through maintaining an adequate supply of ancillary services at all times�26
6) Operate under a well-designed market where existing flexibility is not locked by market inefficiencies (see section 3�2)�
In that respect the report may complement recent efforts to define power system flexibility for power systems with high shares of VRE (Cochran et al�, 2014; IEA, 2018; IRENA, 2017b, box 4)�
With this broader viewpoint, and focusing on power systems with high shares of VRE, we can extend the previously given definition for system flexibility as follows:
“Flexibility is the capability of a power system to cope with the variability and uncertainty that VRE generation introduces into the system in different time scales, from the very short to the long term, avoiding curtailment of VRE and reliably supplying all the demanded energy to customers”�

POWER SYSTEM FLEXIBIL ITY FOR THE ENERGY TRANSITION24
3 SOURCES OF FLEXIBILITY
Planning for flexibility requires accounting for all possible sources� A detailed study needs to consider both technical and institutional aspects of flexibility, while final decisions should be based on least-cost principles� In this section the different types of flexibility are discussed in greater detail� The main goal of this section is to familiarise the reader with the main characteristics of flexibility sources to be considered for flexibility planning�
In this report technical flexibility sources are grouped into supply side, demand side and grid related� Each type of system flexibility can optimally perform within a healthy institutional environment that promotes flexible operation� Both technical and operational aspects of flexibility are discussed below�
Figure 8 shows the impacts that VRE has at different time scales and the relevant flexibility solutions to handle them�
Figure 8: Impacts of VRE at various time scales and relevant flexibility solutions
Source:based on World Bank, 2015
Time
SYSTEMOPERATIONS
VRE IMPACTS
DEMAND SIDE FLEXIBILITY
SOLUTIONSELECTRICITY STORAGE
Cost
OPERATIONAL FLEXIBILITY
SECTOR COUPLING
SUPPLY SIDE FLEXIBILITY
Increased cycling, increased challenges to dispatch inflexible units
Demand Response
Flywheels Batteries Pumped Hydro
Co-optimised hydro-thermal unit commitment
Pooling of resources
Intra-day markets
Improved VRE forecasting
Power-to-HeatPower-to-GasEVs
Retrofitting units, new flexible units
Synthetic inertia Down regulation by VRE
Geographic dispersion of VRE*
10 sec …. 1 min …. 10 min …. 30 min …. 1 hour …. 1 day ….
Regulation Balancing Unit Commitment
Frequency stability issues due to high Rate
of Change of Frequency
Increased needfor operating
reserves
days ….
Load following
Increased net load ramps
PART 1: OVERVIEW FOR POLICY MAKERS 25
3.1 TECHNICAL FLEXIBILITY
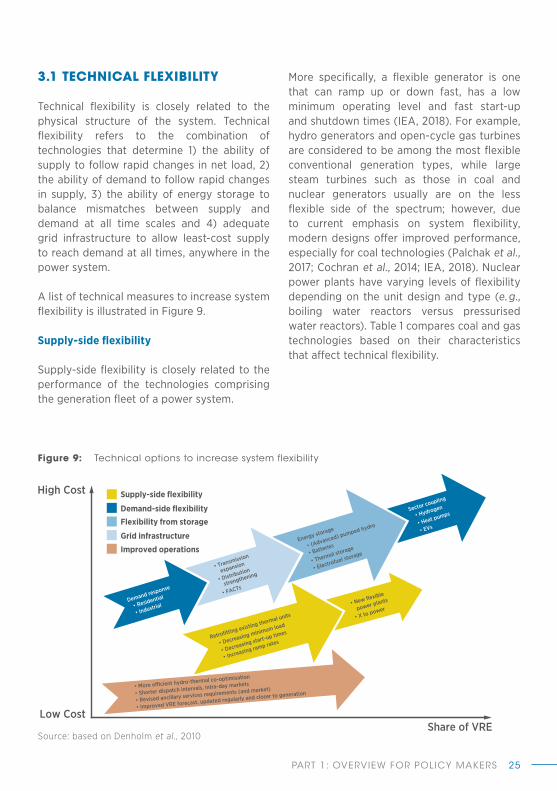
Technical flexibility is closely related to the physical structure of the system� Technical flexibility refers to the combination of technologies that determine 1) the ability of supply to follow rapid changes in net load, 2) the ability of demand to follow rapid changes in supply, 3) the ability of energy storage to balance mismatches between supply and demand at all time scales and 4) adequate grid infrastructure to allow least-cost supply to reach demand at all times, anywhere in the power system�
A list of technical measures to increase system flexibility is illustrated in Figure 9�
Supply-side flexibility
Supply-side flexibility is closely related to the performance of the technologies comprising the generation fleet of a power system�
More specifically, a flexible generator is one that can ramp up or down fast, has a low minimum operating level and fast start-up and shutdown times (IEA, 2018)� For example, hydro generators and open-cycle gas turbines are considered to be among the most flexible conventional generation types, while large steam turbines such as those in coal and nuclear generators usually are on the less flexible side of the spectrum; however, due to current emphasis on system flexibility, modern designs offer improved performance, especially for coal technologies (Palchak et al�, 2017; Cochran et al�, 2014; IEA, 2018)� Nuclear power plants have varying levels of flexibility depending on the unit design and type (e� g�, boiling water reactors versus pressurised water reactors)� Table 1 compares coal and gas technologies based on their characteristics that affect technical flexibility�
Figure 9: Technical options to increase system flexibility
Source: based on Denholm et al., 2010
Improved operations
• Transmission
expansion
• Distribution
strengthening
• FACTs
• More e�cient hydro-thermal co-optimisation
• Shorter dispatch intervals, intra-day markets
• Revised ancillary services requirements (and market)
• Improved VRE forecast, updated regularly and closer to generation
• New flexible
power plants
• X to power
Retrofitting existing thermal units
• Decreasing minimum load
• Decreasing start-up times
• Increasing ramp rates
Energy storage
• (Advanced) pumped hydro
• Batteries
• Thermal storage
• Electrofuel storage
Sector coupling
• Hydrogen
• Heat pumps
• EVs
Demand response
• Residential
• Industrial
Supply-side flexibility
Demand-side flexibility Flexibility from storage
Grid infrastructure
High Cost
Share of VRE Low Cost

POWER SYSTEM FLEXIBIL ITY FOR THE ENERGY TRANSITION26
Technologies previously considered as inflexible (e� g�, coal-fired units) and so-called base load have always been required to adjust their output as well as being shut down and
restarted to some extent� However, past needs and impacts have been minimal, and the uncertainty to be covered has been limited to load forecast errors and power plant outages�
Table 1: Comparison of technical characteristics between coal-fired and gas-fired power generation technologies
Property Open cycle gas turbines (OCGT)
Combined cycle gas turbines (CCGT)
Hard coal-fired power plant
Lignite-fired power plant
Most commonly used power plants
Minimum load (% PNom)
40–50 % 40–50 % 25–40 %a 50–60 %
Average ramp rate (% PNom per min)
8–12 % 2–4 % 1�5–40 % 1–2 %
Hot start-up time (min) or (h)
5–11 minb 60–90 min 2�5–3 h 4–6 h
Cold start-up time (min) or (h)
5–11 minc 3–4 h 5–10 h 8–10 h
State-of-the-art power plants
Minimum load (% PNom)
20–50 % 30–40 % (20 % with SCd)
25e–40 %f 35g–50 %
Average ramp rate (% PNom per min)
10–15 % 4–8 % 3–6 % 2–6h %
Hot start-up time (min) or (h)
5–10 mini 30–40 min 80 min–2�5 h 1�25j–4h
Cold start-up time (min) or (h)
5–10 mini 2–3 h 3–6 h 5k–8 h
a Source: (Heinzel, Meiser, Stamatelopoulos, & Buck, 2012)b Large heavy-duty gas turbines such as the Siemens SGT5–4000F typically have longer start-up times� A fast
start takes about 11 minutes and a normal start about 30 minutes�c The amount of fuel that can be burned at the maximum continuous rating of the appliance ultiplid by the net
calorific value of the fuel and expressed as megawatts thermal� The thermal input is specified by the manufacturr of a plant�
d SC (sequential combustion): Some state-of-the-art CCGT power plants are equipped with sequential combustion, which enables a very low load operation without exceding emission limits�
e See (then, 2016)f Minimum load: 25–30 % in "recirculation mode" and 35–40 % in "once-through mode"�g See Boxberg "unit R", with a minimum load of 35 %h See the "Belchatów II Uni 1" power plant in Poland or the Boxberg power plant in Germany, both with a ramp rate
of up to 6 % Pnom�i Large heavy-duty gas turbines such as the Siemens gas turbine SGT5-8000H typically have lonter start-up
times� A fast start takes about 11 minutes and a normal start about 30 minutes�j See the Boxcberg power plant "unit R" with start-up time (hot) of 75–85 minutes�k See the Boxberg power plant "unit R" with start-up time (cold) of 290–330 minutes�
Source: Agora Energiewende, 2017

PART 1: OVERVIEW FOR POLICY MAKERS 27
At the same time decarbonising the power sector requires, on the one hand, decreasing the share of thermal generation, and, on the other, increasing system flexibility� This means that less conventional capacity will have to supply greater flexibility more frequently and rapidly� However, technical innovations, regulatory and market reforms and the combined use of a variety of flexibility sources (such as energy storage and demand-side flexibility) reduce system reliance on thermal units as a source of flexibility�
The benefits of flexibility vary depending on the stakeholder involved� From a generator’s perspective flexibility is gradually becoming a vital revenue source in deregulated environments� As an example, a number of coal assets in Denmark became stranded after the country joined the Nordic market in the early 2000s� This is because in market settings generation needs to respond to price signals, and thus flexibility gets remunerated� Within this new reality there are cases where owners of old, inflexible generation assets invested in technical improvements in existing assets (e� g�, the 2 × 630 megawatt (MW) Neurath and the 700 MW Steag Voerde units in Germany (IEA, 2018)�
In regulated environments, retrofitting programmes also have been implemented to increase the flexibility of thermal generators (see Box 1)� Improving thermal flexibility as a short- to medium-term solution is becoming a hot topic in a number of countries� For example, thermal power plant flexibility is the core topic of the Advanced Power Plant Flexibility Campaign of the Clean Energy Ministerial, which is being led by China, Denmark and Germany (IEA, 2018)�
However, caution should be used before making decisions to retrofit coal units, as some systems may not experience a reduction in carbon dioxide (CO2) emissions, especially considering that retrofits usually extend the lifetime of units and might increase their running hours� Detailed production cost analysis can indicate the benefits and costs (technical, economic and environmental) of retrofits (see Section 4)�This is especially true in power systems where coal competes with natural gas�
In some cases carbon pricing mechanisms might be necessary to achieve climatic goals (Agora Energiewende, 2017)� In others, a new wave of affordable gas has been pushing coal out of the merit order (US DOE, 2017), de facto making investments in improving the flexibility of coal an additional stranded investment�
System-wide benefits and costs from increasing supply-side flexibility can be assessed using specific analytical tools discussed in Section 4�
At higher shares of VRE, situations may arise where the VRE is the most cost-effective source of flexibility� A limited amount of curtailment could be a cost-effective source of flexibility in the economic dispatch as well as providing down-regulation� In contrast, up-regulation – although technically demonstrated – is generally not cost effective, unless the VRE is already curtailed for other reasons such as over-supply situations, or remunerated for additional services provided when operating below full capacity�

POWER SYSTEM FLEXIBIL ITY FOR THE ENERGY TRANSITION28
Energy storage
Over the last decade there has been increased interest in electricity storage� Traditionally, most of this storage has been pumped hydro, and this is mostly still the case today� Due to a variety of parallel developments, interest in storage has expanded beyond pumped hydro� These developments include advancements in storage technology and reductions in storage costs (for lithium-ion batteries in particular), the development of energy markets and markets for ancillary services, challenges in building new transmission and distribution infrastructure, the enabling role that storage can play for solar and wind in the off-grid context, and the need for solutions to integrate the large amounts of VRE being deployed in large power systems�
Electricity storage systems have been used primarily to shift the timing of electricity supply by storing electricity when its value is the lowest and discharging when the value is the highest� The value of electricity in this type of application comes from preventing more expensive generators from running and from reductions in the overall generation cost27� When associated with VRE generation, storage can be used to facilitate high shares of VRE by mitigating the impacts of VRE on grid operations�
The impacts of VRE are characterised by a range of time scales that extend from seconds (for example, when a cloud passes over a PV plant) to years (implications on the lead time of new transmission lines to ease congestion)� Thus, to be effective towards a specific application a storage technology needs to have the appropriate technical characteristics,
27 Although this is partially offset by an increase in demand due to efficiency losses in the storage charging and discharging cycle�
28 Much of that pumped hydro was built during the 1960s-2000s� It was the only economically feasible option during that period�
namely response time, power capacity and energy capacity (Denholm et al�, 2010)� Besides technical suitability, factors such as roundtrip efficiency, capital expenditures and operating expenditures are also important in making investment decisions�
At the shortest time scale (seconds) certain storage technologies such as pumped hydro, synchronous flywheels and CAES can provide inertia as a first line of defence in case of sudden loss of generation and can reduce a system’s dependence on thermal generators to limit the rate of change of frequency� At a time scale of seconds to minutes storage has been used mainly for the provision of operational reserves (mainly batteries and pumped hydro)�
Technologies such as pumped hydro, CAES, long-duration batteries and thermal storage provide flexibility over longer time periods� In the short- to medium-term, batteries can potentially offer a wide range of services in addition to those offered by pumped hydro, such as providing multiple ancillary services at once, displacing fossil fuels for mobility when batteries are installed in EVs, enabling high shares of renewables in mini-grids and supporting self-consumption of rooftop solar power�
Besides the wide range of advantages of energy storage, the technical potential of many technologies is yet to be realised due to technology cost vis-à-vis monetisable revenues� Currently, pumped hydro dominates electricity storage (representing 96 % of global storage capacity in mid-2017) because of its favourable economics and technical attributes28 (long-term storage at competitive cost, established technology, high flexibility

PART 1: OVERVIEW FOR POLICY MAKERS 29
and source of synchronous inertia)� Modern pumped hydro also can provide system services in a very sophisticated and efficient way through variable speed pumping (Fulgencio et al�, 2017)� Batteries are expected to become an important storage technology for the energy transition – complementing pumped hydro thanks to an expected decline in costs – but due mostly to the operational benefits that batteries provide (IRENA, 2017c)�
At very high levels of VRE integration the need for seasonal storage will emerge� Where large pumped hydro is not available, storing hydrogen produced from renewable electricity can provide a renewable fuel to sectors that are otherwise difficult to decarbonise through electrification (IRENA, 2018c)� Such sectors include:
• Industry: hydrogen is widely used in severalindustry sectors (refineries, ammoniaproduction, bulk chemicals, etc�)�
• Buildings: hydrogen from renewable energycan be injected into existing natural gasgrids up to a certain share – reducing gasconsumption – or into dedicated hydrogengrids�
• Transport: fuel cell EVs provide a low-carbon mobility option when the hydrogenis produced from renewable energy sourcesand offer driving performance comparable to conventional vehicles� In addition, hydrogenfrom carbon-lean electricity and CO2 can beused to produce synthetic electrofuels thatcan run conventional engines (IEA, 2017a)�
The built-in storage capacity of downstream sectors (e� g�, gas infrastructure, hydrogen supply chain) can serve as a buffer to decouple seasonality of VRE and demand over long periods and allow for seasonal storage� The effectiveness of energy storage (measured in megawatt-hours of VRE curtailment reduced
per MW of storage deployed) on reducing VRE curtailment is very high, especially for storage technologies capable of discharging power for several hours� However, it is reduced as storage deployment increases, and at some point the incremental amount of avoided VRE per MW of incremental storage falls off rapidly (Denholm and Mai, 2018)� At very high VRE levels, completely eliminating curtailment using storage only as a mitigation measure might be economically impractical� Thus an optimal level of storage utilisation can be identified with the use of analytical tools (see Section 4)�
Demand-side flexibility
Demand response can be used along with energy storage to further reduce VRE curtailment� Demand response refers to specific types of demand-side management programmes where the demand pattern is shifted to better match electricity supply� Demand response is an effective method that provides an opportunity for consumers to play a role in the operation of the grid by adjusting their electricity consumption subject to price signals or long-term direct-control agreements�
Time-of-use rates fluctuate based on electricity market prices, in most cases providing incentives for reducing consumption during peak demand times� Reducing the need for conventional peak capacity is important especially at high VRE penetration when the marginal capacity value of solar and wind can drop significantly at high shares (Denholm, 2015)� Time-of-use pricing can support VRE by increasing demand during overgeneration and adjusting demand to reduce ramps in net load�
Direct control programmes provide the opportunity for power companies to cycle electrical equipment in residences and industry� Large, controllable industrial loads

POWER SYSTEM FLEXIBIL ITY FOR THE ENERGY TRANSITION30
are of significant value due to their enhanced contribution to managing demand� Another important operational benefit of direct control is the provision of operational reserves to reduce the impacts of VRE uncertainty on the system (Agora Energiewende, 2015)�
One of the challenges of demand response is structured co-ordination of loads of various size that are usually connected to low- and medium-voltage distribution grids to achieve expected response rates or capacity reduction goals� Many markets encourage the participation of aggregators for that purpose� Aggregators are companies that act as a participant in the electricity (and ancillary services) market by controlling assets belonging to electricity end-users and distributed energy resource owners on their behalf� Aggregators contract with individual demand sites (residential, commercial, industrial) and aggregate them to operate as a single demand-side response aggregator� Such aggregated pools often contain a mix of different types of demand, as well as storage and flexible generation, to maximise the ability of the aggregated pool to provide flexibility to the system and capture revenues from it�
As in the case of storage there is a practical limit on the maximum demand response capacity to be planned� Both the economic and technical effectiveness of demand response are maximum during the very early stages of demand response deployment and decrease as this capacity increases� Costs and benefits of demand response need to be compared with other flexible options to identify optimal deployment levels at the various stages of the energy transition� The value of demand response can be estimated within the context of a least-cost system-wide optimisation exercise, as detailed in Section 4�
Grid flexibility
Grid flexibility refers to the existence of a robust transmission network to balance supply and demand over larger balancing areas, as well as cross-border interconnections to enable the exchange of flexibility across national or other jurisdictional borders (if the market allows for it)� It also refers to the existence of advanced controls to enhance communication among system elements that enables, for example, automated control of generators, automatic activation of demand response or advanced power flow control (e� g�, a flexible alternating current transmission system, or FACTS)�
Grid flexibility acts like a bridge for supply- and demand-side flexibility a nd n ets o ut imbalances in real time� If grid flexibility is low, then it can become a limiting factor� For example, a system with high supply-side flexibility can experience difficulties in integrating high shares of VRE due to congestion issues� As a separate example, a system with high hydropower shares can have much of its hydro flexibility locked if there is not enough transmission capacity to connect areas with high VRE generation to areas with high pumped storage capacity�
Demand response requires the co-ordination of loads of varying sizes

PART 1: OVERVIEW FOR POLICY MAKERS 31
3.2 OPERATIONAL FLEXIBILITY
Operational flexibility refers to how the assets in the power system are operated� It is dependent, in addition to the constraints of each technology’s capabilities, on the regulatory and market environment that surrounds the physical system and drives system operations�
Like grids, market and regulatory frameworks can act as an inhibitor to existing flexibility� An example of a market acting as an inhibitor is the case of large countries that, from an operational perspective, are broken down into provinces operating in isolation, with limited to no exchange of energy based on centralised merit order dispatch or a market to regulate such exchange� In some cases, intra-border electricity exchanges between such provinces is limited due to a lack of efficient co-ordination, and as a result a portion of the system’s supply-side and grid-related flexibility is locked (Milligan et al�, 2015)�
Central dispatching and the creation of a market to schedule electricity exchanges based on price signals are good measures to address such flexibility issues� Maintaining different, cost-reflective wholesale electricity prices for different areas within a country (zonal pricing) or for the different nodes in the transmission network (nodal pricing) also helps to reflect possible transmission congestion issues and to take them into account when building the merit order, avoiding predictable redispatch and associated costs�
Box 1 describes some of the challenges associated with rapidly introducing large shares of VRE on technical and operational aspects of the power system, and the solutions being adopted to improve integration�
Market flexibility can exist in different time scales (see Figure 10), which should be considered by regulatory authorities�
In the long term the system has to ensure that enough operational flexibility is built so that it can operate properly with a significant level of VRE� To make this possible regulators might need to incentivise the investment by using, for example, capacity markets in which flexibility is incentivised, or by increasing the space and time granularity of wholesale markets, providing better long-term price signals to invest in flexible resources�
In the long to medium term the system has to balance the seasonal and inter-annual energy variability, which traditionally is achieved with hydro scheduling under uncertainty in systems with significant shares of hydropower�
In the medium to short term the commitment, and the economic dispatch, of generation units should be planned before real-time generation� In this time scale the design of day-ahead and intra-day markets will be relevant to enable the full flexibility potential of the system� Measures such as increasing time and space granularity (e� g�, lower settlement period or shift from zonal to nodal prices) or setting the market’s gate closure closer to real time are measures that increase market flexibility (IRENA, 2017a)�
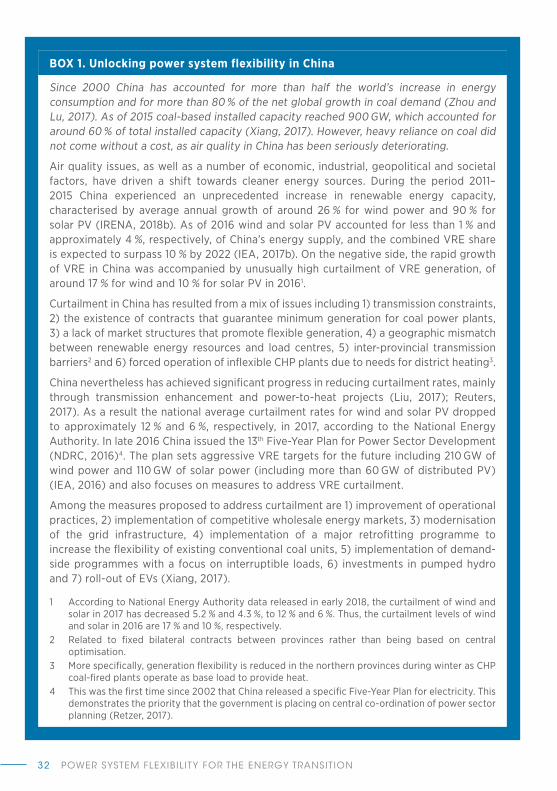
POWER SYSTEM FLEXIBIL ITY FOR THE ENERGY TRANSITION32
BOX 1. Unlocking power system flexibility in China
Since 2000 China has accounted for more than half the world’s increase in energy consumption and for more than 80 % of the net global growth in coal demand (Zhou and Lu, 2017)� As of 2015 coal-based installed capacity reached 900 GW, which accounted for around 60 % of total installed capacity (Xiang, 2017)� However, heavy reliance on coal did not come without a cost, as air quality in China has been seriously deteriorating�
Air quality issues, as well as a number of economic, industrial, geopolitical and societal factors, have driven a shift towards cleaner energy sources� During the period 2011–2015 China experienced an unprecedented increase in renewable energy capacity, characterised by average annual growth of around 26 % for wind power and 90 % for solar PV (IRENA, 2018b)� As of 2016 wind and solar PV accounted for less than 1 % and approximately 4 %, respectively, of China’s energy supply, and the combined VRE share is expected to surpass 10 % by 2022 (IEA, 2017b)� On the negative side, the rapid growth of VRE in China was accompanied by unusually high curtailment of VRE generation, of around 17 % for wind and 10 % for solar PV in 20161�
Curtailment in China has resulted from a mix of issues including 1) transmission constraints, 2) the existence of contracts that guarantee minimum generation for coal power plants, 3) a lack of market structures that promote flexible generation, 4) a geographic mismatch between renewable energy resources and load centres, 5) inter-provincial transmission barriers2 and 6) forced operation of inflexible CHP plants due to needs for district heating3�
China nevertheless has achieved significant progress in reducing curtailment rates, mainly through transmission enhancement and power-to-heat projects (Liu, 2017); Reuters, 2017)� As a result the national average curtailment rates for wind and solar PV dropped to approximately 12 % and 6 %, respectively, in 2017, according to the National Energy Authority� In late 2016 China issued the 13th Five-Year Plan for Power Sector Development (NDRC, 2016)4� The plan sets aggressive VRE targets for the future including 210 GW of wind power and 110 GW of solar power (including more than 60 GW of distributed PV) (IEA, 2016) and also focuses on measures to address VRE curtailment�
Among the measures proposed to address curtailment are 1) improvement of operational practices, 2) implementation of competitive wholesale energy markets, 3) modernisation of the grid infrastructure, 4) implementation of a major retrofitting programme to increase the flexibility of existing conventional coal units, 5) implementation of demand-side programmes with a focus on interruptible loads, 6) investments in pumped hydro and 7) roll-out of EVs (Xiang, 2017)�
1 According to National Energy Authority data released in early 2018, the curtailment of wind and solar in 2017 has decreased 5�2 % and 4�3 %, to 12 % and 6 %� Thus, the curtailment levels of wind and solar in 2016 are 17 % and 10 %, respectively�
2 Related to fixed bilateral contracts between provinces rather than being based on central optimisation�
3 More specifically, generation flexibility is reduced in the northern provinces during winter as CHP coal-fired plants operate as base load to provide heat�
4 This was the first time since 2002 that China released a specific Five-Year Plan for electricity� This demonstrates the priority that the government is placing on central co-ordination of power sector planning (Retzer, 2017)�

PART 1: OVERVIEW FOR POLICY MAKERS 33
Finally, in the short to very short term, ancillary services markets are required to procure grid services, including to compensate sudden imbalances between supply and demand� Here regulators need to define operating reserves in a way that flexible resources are incentivised to participate� The most innovative service – being used already by some systems, such as in the United Kingdom – is the fast frequency
response (FFR) that can be supplied by batteries and VRE if the proper power electronics are in place� The challenge for the system would be to define how much inertia can be replaced by FFR (Everoze, 2017)�
See Figure 11 for a summary of the operating reserves in power systems�
Figure 10: Different time scales in which flexibility has to be analysed
Now Seconds Minutes Hours Days Months Years
Investments
Hydro Scheduling under Uncertainty
4
Balancing seasonal/interannual energy availability
Day-ahead Balancing
3
Balancing variability in net load (load minus variable
generation)
Intra-day Balancing
Real Time Balancing
2Balancing forecast errors in load and
generation
Operating Reserves and Inertia
1
Balancing unpredictable fast
changes
Figure 11: Summary of operating reserves
Now Seconds Minutes Hours
Fast Frequency Response (FFR)
Frequency Containment
Reserves (FCR)Frequency Restoration Reserves (FRR)
Replacement Reserves (RR)
POWER SYSTEM FLEXIBIL ITY FOR THE ENERGY TRANSITION34
Operational decisions in the future will need to ensure that a balance between system needs, technical restrictions and profitability is achieved� The Irish case is a relevant example where a set of measures were taken to gradually enhance flexibility to facilitate the integration of high wind shares over time, implementing a series of studies to identify relevant measures (see Box 2)�
BOX 2. The Irish case
In 2010 Ireland committed in its National Renewable Energy Action Plan to supply 40 % of its electricity demand from renewables1, primarily wind (Republic of Ireland, 2010)� In this context EirGrid and the System Operator for Northern Ireland (SONI) conducted a suite of studies on the implications of managing high levels of VRE� One outcome was that the average level of synchronous inertia system would potentially fall 25 % in 2020 (EirGrid, 2011)� Based on reliability and stability requirements, the system at that moment could tolerate a non-synchronous penetration (SNSP2) limit of 50 % or less�
In 2011 EirGrid and SONI embarked on a multi-year programme, Delivering a Secure, Sustainable Electricity System (DS3), with a long-term goal of effectively managing technical challenges related to a potential increase of the SNSP limit from 50 % to 75 % by 2020� The studies indicated that secure operation of the Irish island power system beyond a 75 % SNSP limit was not possible given technology capabilities�
Within the DS3 programme there are 11 workstreams with collective goals to improve system performance, system policies and system tools� More specifically the workstreams focus on 1) improving the system’s capabilities to manage voltage and frequency regulation, unexpected events and inertia response, 2) developing grid codes to set standards relating to operation and use of system assets, 3) further developing demand-side management capabilities and 4) building relevant tools and using them to monitor and develop studies to facilitate the DS3 work programme (EirGrid and SONI, 2014)� Due to work undertaken by the transmission systems operators under the DS3 programme, the SNSP level has been gradually reassessed, and currently the All Island (AI) system operates at 65 % (EirGrid and SONI, 2018)�
1 The same target has been adopted by Northern Ireland�
2 System non-synchronous penetration (SNSP) is a metric referring to the instantaneous share of non-synchronous energy delivered� In the case of Ireland, the SNSP is equal to VRE production plus energy imports over demand plus exports�
Like grids, existing markets and regulatory frameworks can inhibit flexibility

PART 1: OVERVIEW FOR POLICY MAKERS 35
4 FLEXIBILITY IN THE PLANNING PROCESS
Gradually increasing the share of VRE in a power system creates challenges of varying complexity� During the early phase of VRE integration most systems can accommodate the new situation with existing resources or simply through improvements in operational processes� However, as VRE shares increase, sooner or later bridging flexibility gaps might become key for integrating additional VRE capacity� At very high shares of VRE, and after traditional flexibility sources have been fully exploited, VRE surpluses will emerge� At this point electrification becomes important to further decarbonise the energy sector through VRE (e� g�, EVs and power-to-heat), and hydrogen’s role may become key to bridge seasonal imbalances between supply and demand�
Planning early for flexibility is critical to avoid the need for costly urgent solutions once flexibility issues arise� A small and inflexible system, for example, might experience flexibility shortages at very low VRE shares, while a larger and more flexible system might experience this at a much later stage�
Although the size and level of modernisation of a power system are key flexibility attributes, the choice of future potential mitigation measures also can be affected by the prospects of future demand growth� For example, many large, modern systems suffer from overcapacity that was built to support past demand growth that has now stalled due to industrialisation reaching maturity and an emphasis on energy efficiency� Investment in new assets in an environment like this is more costly as system assets compete for revenue within a more challenging environment�
In a mature power system, on the other hand, many of the thermal power plants are likely to have already been depreciated, while newly built ones in power systems with growing demand might still have significant way to go before reaching break-even� IRENA addressed this topic in a dedicated working paper as part of the REmap analysis (IRENA, 2017d)� Planning for flexibility is easier within a greenfield environment, as flexibility can be embedded in market design and grid codes for new assets, rather than having to invest in costly retrofits in both thermal and renewable power plants�
Planning for flexibility is a complex multi-step process that needs to account for a variety of factors that together form a complex mathematical problem that can only be solved using appropriate tools� The process typically starts with assessment of current needs and extends into the future (see Figure 12)� Depending on the present status, integration measures might be necessary in the future or may already be a matter of urgency, which greatly changes the list of available options and associated costs� Assessment of current flexibility is key as it creates the foundations for a least-cost, long-term pathway for a flexible power system that is ready to incorporate significant shares of VRE�

POWER SYSTEM FLEXIBIL ITY FOR THE ENERGY TRANSITION36
More specifically, flexibility assessment of an existing system is conducted to 1) identify current flexibility gaps, 2) assess how much more VRE can be integrated without significantly changing the non-VRE component of the grid, 3) assess the time left until the existing flexibility is exhausted (relevant for lead time for new investments, based on capacity expansion plans) and 4) identify a least-cost set of solutions to unlock existing flexibility and, at a later stage, procure additional flexibility�
Production cost modelling (also called dispatch simulation) is a widely used approach to assess flexibility in a system with a given physical
29 Existing system or future system where decision of future assets has been completed�
structure29� A production cost model simulates a system’s performance for a whole year using time steps representative of real-world system operations (minutes to one hour)� As there is some complexity involved in representing the techno-economic characteristics of a power system, formulating a dispatch problem requires some level of expertise�
Software in this class of optimisation models uses established solvers to optimise the commitment and dispatch of generators for a given demand profile� Typical outcomes from such a study include the dispatch schedule, operational costs, electricity prices, VRE curtailment and loss of load� A typical approach
Figure 12: Methodology for flexibility planning
Step 1: Assess current fl exibility
1. Production cost modeling• Assess current levels of curtailment and
loss of load • Assess overgeneration incidents and
fl uctuation of prices• Assess cycling of units (start-up ramping
and min gen incidents)• Assess if operating reserves are adequate
2. Network studies• Assess if system can effi ciently regulate
frequency and voltages• Assess if system can recover from
unexpected events• Assess if system has suffi cient inertia• Assess if transmission elements get
overloaded
Step 2: Bridge gaps following least-cost approach
1. Unlock existing fl exibility• Regulatory, market changes • Dispatch units based on merit order• Train staff at generating units to
operate plants fl exibly• Pooling with neighbors• Adjust operating reserves based on new
needs
2. Implement DSM schemes
3. Invest in new assets• Transmission enhancements• Retrofi t existing units• Invest on new generation and/
or storage
Step 3: Assess future fl exibility
1. Optimize VRE sitting using geospatial optimization• Optimize VRE capacity mix • Estimate VRE production based
on location and policy goals• Estimate future net-load
2. Least-cost capacity expansion to identify future assets• Study the net-load to assess
needs for cycling• Optimize non-VRE capacity mix
based on future technologies• Identify additional fl exibility
assets (e� g storage, DSM) • Assess benefi ts of sector coupling
3. Repeat step 1• Assess operability of long-term
plan identifi ed on previous steps
If fl exibility gaps are
identifi ed go to step 2. Else,
directly to step 3

PART 1: OVERVIEW FOR POLICY MAKERS 37
used to assess flexibility using production cost modelling is to observe changes in the above outcomes at different VRE shares� For example, at higher VRE shares, the actual power dispatch is likely to change due to changes in the net load profile� Meanwhile, lower prices – due to lower marginal costs for VRE – or curtailment could also occur�
Observing the main outcomes from dispatch simulations, one can focus on identifying flexibility gaps in the system� For example, curtailment could be due to overgeneration, severe down-ramping or transmission congestion� A key advantage of a production cost model is high temporal and spatial granularity� The analyst can look into fine details and observe whether thermal units operate regularly at their minimum loading point (as in the case of overgeneration), whether the generation fleet cannot keep up with ramping requirements (as in the case of down-ramping) or whether transmission lines are frequently congested� Similarly, loss of load could indicate upward ramping issues or insufficient generation capacity�
After flexibility gaps have been identified mitigation measures can be simulated and assessed for their effectiveness, as well as compared based on their costs and benefits� One such measure, for example, could be improving operations� Below are a few examples where dispatch simulation can be used to explore the benefits of improved operations�
• Assessment of operational benefits from improved dispatch practices. There are real-world cases where the unit commitment of the hydropower portion only or even of the whole generation fleet in some
30 Assessing flexibility benefits from market restructuring requires the use of advanced models with capabilities to simulate energy markets�
regulated environments is decided based on empirical knowledge� Production cost modelling can be used to assess the benefits of co-optimising hydro and thermal unit commitment to exploit the full potential of hydro storage and advanced hydro cycling capabilities under uncertainty over future rainfall/inflows and VRE generation�
• Assessment of operational benefits from market restructuring and implementation of advanced VRE forecasting. Advanced forecasting techniques can be used to decrease VRE-related uncertainty in system operations� In addition, the development of intra-day markets is necessary to make best use of improved, closer-to-delivery forecasts� A combination of the above measures can decrease the need for operational reserves in the system and unlock market-related flexibility through more frequent dispatch scheduling30�
• Assessing system implications of joining a regional energy market. Sharing a pool of assets increases operational capabilities and enhances system flexibility� Production cost modelling can be used to identify such benefits� To obtain accurate results, all systems involved in the market have to be modelled simultaneously, which increases the data requirement for the analysis�
• Assess operational impacts from different EV integration strategies. The impact of electric vehicles depends on the level of EV deployment and on the charging strategy employed� Large-scale EV integration will change the shape of the load� In this type of analysis, a good understanding of EV charging patterns is needed prior to production cost analysis� When a pattern

POWER SYSTEM FLEXIBIL ITY FOR THE ENERGY TRANSITION38
is identified EVs can be accounted for as static loads or rather mobile battery storage systems, which will affect the operational characteristics of the power system (dispatch, costs, electricity prices, etc�)�
The impact on the system could be positive or negative depending on a number of factors� If, for example, a large share of EV owners charge their vehicles during the evening electricity demand peak, the peak would increase, affecting generation adequacy and ramping levels� Smart charging can be used to eliminate such issues� By establishing two-way communication between the vehicle owner and the grid, charging patterns can be manipulated to the benefit of the system�
In the case of vehicle-to-grid (V2G, i� e�, vehicles can also feed electricity from the battery back to the grid, if adequately compensated), production cost modelling can be used to optimise V2G charging/discharging considering both the needs of the vehicle owners and system requirements for flexibility� In that case EVs can be modelled as batteries with constraints on availability and state of charge� For example charging/discharging is optimised so that the system is allowed to access an EV’s battery as needed when it is parked (for example, at night or during working hours), but in a way that will not affect an owner’s need to have the EV sufficiently charged for its mobility requirement, as this is the main purpose of an EV�
Production cost modelling often needs to combined with network analysis to assess system reliability both under normal operations and contingencies� Network studies do not strictly focus on flexibility issues, but they are, however, complementary to dispatch simulations� For example, network analysis can be used to identify system constraints that can be used as inputs on dispatch analysis�
Such a system input, for example, could be a non-synchronous penetration limit (SNSP), as detailed in Box 2� Network analysis requires very detailed representation of the grid and excludes economic aspects� More on network analysis can be found in IRENA (2018d)�
After identifying a pathway to exploit existing flexibility, a long-term assessment needs to be conducted to complement the planning process� The main goal of long-term flexibility assessment is to prepare the system ahead of time for operation under VRE levels beyond what existing flexibility potential can handle� Usually such analysis is done with long-term capacity expansion software� Such models look further in time compared to production cost models (i� e�, a typical study period of 5 to 50 years) and thus account for future changes in demand, fuel costs, capital costs and lifetime of potential investments and decommissioning times of existing assets�
Unlike production cost models, which consider only a fixed group of system elements, long-term capacity expansion models also consider potential future investments at various parts of the grid (i� e�, generation, transmission, demand side, storage)� The main outcome of long-term analysis is the changes on the physical structure of the grid (both commissioning of new and decommissioning of old assets) over the period of study� While long-term capacity expansion models can co-optimise VRE and non-VRE assets, a detailed geospatial planning analysis can be done (depending on data availability) to optimise VRE expansion separately, and the result can then serve as a fixed parameter in long-term capacity expansion analysis�
Long-term capacity expansion models are capable of considering a variety of system assets that extend to all levels of physical infrastructure (generation, transmission, demand)� Such assets were discussed in detail

PART 1: OVERVIEW FOR POLICY MAKERS 39
in previous sections� In addition, long-term models do optimise dispatch, however at time scales much larger than those typical of power system operations31� For that reason the results of a long-term study often need to be verified with the use of a production cost model32� In practical terms the long-term capacity expansion process optimises investments that enhance system flexibility�
Production cost modelling as a subsequent step assesses the operational benefits of the proposed system� When combined together the two models produce a least-cost, long-term roadmap to achieve specific targets for VRE shares without violating system constraints (i� e�, maintain supply demand balance, provision of reserves)� The examples below show typical uses of long-term models for flexibility assessment�
• Identify optimal capacity mix for future load growth� This is the most widely used application of long-term capacity expansion models� In that case the goal is to decide among a set of generating technologies to satisfy future load growth subject to a number of constraints� Such constraints can represent electricity demand to be
31 Long-term capacity expansion models stretch much longer in time compared to production cost models (for example, 15 years versus 1 year)� Some level of granularity is then sacrificed, as computationally times would otherwise be very long for practical purposes�
32 Put more simply, the power system in a future year as identified by long-term capacity expansion analysis might not be able to handle impacts within time scales lower than what such software can simulate� For example, long-term capacity expansion software will not understand the operational benefits of batteries compared to pumped hydro for frequency regulation� The software will make a decision based mainly on lower capital expenditure and ignore the more advanced ramping capabilities of batteries over pumped hydro� For that reason the result of long-term analysis needs to be verified with a production cost model�
33 This depends on the time step of simulation� For example, a typical long-term capacity expansion model will not consider improved ramping rates, as they are irrelevant for the time scale of simulation� However, a reduction in minimum operating point will be considered�
met in each period, availability of fuels, VRE targets and requirements for reserve margin� Capacity expansion optimisation can be extended to also involve demand-side management, energy storage and high-level transmission decisions�
• Optimise investment decisions in a retrofit programme to increase thermal flexibility� Long-term analysis could be used to decide whether to retrofit a number of units over a period of time or to construct new units or a combination� The model compares factors such as the capital cost of the retrofit programme versus the cost of new units, their lifetimes and technical characteristics33� For example the cost to retrofit the units of an existing power plant is usually much lower compared to building a new one; on the other hand a potential extension in the lifetime of a retrofitted unit would not match the lifetime of a new unit� In addition the upgraded unit would still have inferior flexibility attributes compared to new designs� Production cost modeling could supplement the analysis by identifying any remaining flexibility gaps and giving a more accurate estimate of generation cost and emissions of CO2 and local pollutants�

POWER SYSTEM FLEXIBIL ITY FOR THE ENERGY TRANSITION40
• Assess long-term costs and benefitsof power-to-heat� For example, long-term capacity expansion analysis canbe used to optimise future decisions forelectrification of heat loads34� The modelwould compare the cost of burning fossilfuels in conventional boilers to investmentsin new heat pumps, considering the system-wide benefits from possible flexibilityenhancements, integration of further VREgeneration, emission reductions and powergeneration costs� The new investmentscould be attractive, especially if the heatpumps would operate during hours of lowelectricity prices, storing the heat for lateruse� Additional flexibility could be unlockedif the heat pumps reduce the need for heatfrom CHP plants, which are known to reducepower system flexibility when demand forheat forces co-generation of electricity,regardless of the electricity price� CHP plants possibly can be replaced on the dispatch bymore flexible electricity generators�
34 Such analysis requires the software to be capable of simulating, for example, heating loads in the case of electric boilers�
• Any combination of the above� A detailedcapacity expansion assessment canpotentially include a variety of choices suchas the ones discussed above and othersthat might be relevant for the system (i� e�,investment decisions on electrolysers forhydrogen production, decisions on demand-side management programmes, pumpedhydro versus batteries versus CAES, etc�)�
• Finally, the proposed plan as identifiedby long-term capacity expansion andproduction cost analysis needs to be verifiedby network analysis to ensure systemsecurity and reliability under a variety ofscenarios�
Demand-side management, storage and high-level transmission planning all help to optimise power system capacity expansion

PART 1: OVERVIEW FOR POLICY MAKERS 41
BOX 3. Brief introduction to the IRENA FlexTool
IRENA’s assessment of flexibility is carried out with the IRENA FlexTool� The FlexTool is a detailed but user-friendly tool that intends to analyse not only the traditional concept of flexibility (concerning, for example, flexible thermal and hydro generation with high ramping capability and very low start-up time), but also other innovative technologies that enrich the concept of flexibility, such as flexible demand, energy storage and sector coupling�
The FlexTool is capable, on the one hand, of analysing system operations using a time step that represents real-world challenges (an hour or less in the case of VRE variability) and, on the other hand, of carrying out long-term analyses and proposing possible flexibility solutions in a hypothetical future system with high penetration of VRE� The FlexTool, however, does not study the very short term (second/sub-second time scale) because this, although also relevant for power system flexibility, calls for another type of assessment�
The FlexTool is data driven� This means that the model structure is relatively general, and the input data have a large role in specifying what the model does� To perform a FlexTool simulation the required inputs are, in brief: demand, generation mix, hydrological data, VRE time series, interconnections and fuel costs� If the system being analysed is divided into different nodes, transmission data also are required – in addition to the mentioned data – divided by node� When provided these data, the tool runs for a relatively short period of time, depending on the size of the system analysed�
The FlexTool has been developed with the VTT Technical Research Centre of Finland Ltd, with the aim of assisting IRENA members in making a relatively quick assessment of potential flexibility gaps, as well as highlighting the most cost-effective mix of solutions� It has become the only publicly and freely available tool that performs capacity expansion and dispatch with a focus on power system flexibility�
In summary, the FlexTool looks at a one-year horizon and analyses system operations and capacity expansion with a focus on power system flexibility� Figure 13 shows where the FlexTool fits into the planning process in comparison with other existing modelling methodologies�
Figure 13: The IRENA FlexTool in the planning process
1 Second 1 Hour 1 Year
Time Horizon Analysed10 Years 50 Years
SystemOperation
Grid Studies (Power Factory1,
PSS/E2)
Dispatch Models (PLEXOS-ST3, SDDP4)
FlexTool Expansion
FlexTool Dispatch
Capacity Expansion Models(PLEXOS-LT3, Opt-Gen4)
Energy Planning Models (Message5, MARKAL/TIMES6)
OptimalCapacity Expansion
FlexTool in the planning process
1 Copyrighted by DIgSILENT GmbH2 Copyrighted by Siemens PTI3 Copyrighted by Drayton Analytics Pty Ltd, Australia and Energy Exemplar Pty Ltd, Australia4 Developed by PSR5 Developed by the International Atomic Energy Agency (IAEA)6 Developed by the International Energy Agency (IEA)

POWER SYSTEM FLEXIBIL ITY FOR THE ENERGY TRANSITION42
5 CONCLUSIONS
Flexibility of a power system is highly dependent on how the power system has developed over time based on resources and policies�
Certain generation technologies are inherently more flexible than others; however, older and less flexible technologies can be improved through retrofits (at a cost)�
Well-developed grid infrastructure allows the system to access existing flexibility, while constrained and congested grids are de facto a source of inflexibility�
Demand has a significant potential to contribute to the flexibility of the power system, from quickly responding to supply shortages, to following price signals to change the demand profile so that energy is consumed when it is cheaper to supply and when the grid does not face congestion�
Electricity storage has a key role to play in balancing demand and supply at all times, which is the essence of flexibility� Well-established pumped hydro can be made increasingly flexible through new technologies� Batteries are coming down in price and can provide very high value thanks to their rapid response and their ability to provide multiple services at once, in addition to energy (arbitrage)�
In the long term, coupling energy demand for heat, fuels and mobility by using power-to-heat (e� g�, heat pumps, resistors), power-to-gas (e� g�, hydrogen from renewable electricity) and power-to-mobility (e� g�, battery EVs) can provide significant flexibility to the
power system while helping to accelerate the decarbonisation of end-use sectors� Heat and fuels already today have significant energy storage capacity that can become accessible to the power sector to decouple, in time, demand from supply, once the link is made through the adoption of electric heating technologies and electrolysers� Battery EVs can provide significant flexibility when connected to the grid through smart charges, and are expected to represent the majority of battery deployment globally�
Beyond investments in technology, the single most effective source of flexibility is improved system operations� This makes it possible to reduce requirements for flexibility while unlocking existing flexibility already present in the system�
Historically flexibility was not a key concern while planning the evolution of the power system� Increased deployment of solar and wind requires that flexibility is taken into account already at the planning stage� This report provides recommendations on how to account for flexibility in the planning process and is complemented by a second part that describes how to assess and improve power system flexibility using least-cost optimisation models, in particular the IRENA FlexTool�
The IRENA FlexTool is a least-cost optimisation tool that performs power system dispatch and investments� It has been developed jointly with this report to perform flexibility assessment and is available as open-source software�
PART 1: OVERVIEW FOR POLICY MAKERS 43
REFERENCES
Agora Energiewende (2015), Report on the German power system� Version 1�2, Study commissioned by Agora Energiewende� Available at: http://www�agora-energiewende�org/fileadmin/downloads/publikationen/CountryProfiles/Agora_CP_Germany_web�pdf %5Cnhttps://www�epexspot�com/document/26145/EPEX SPOT_Trading Brochure�pdf�
Agora Energiewende (2017), Flexibility in thermal power plants with a focus on existing coal-fired power plants� Available at: https://www�agora-energiewende�de/fileadmin/Projekte/2017/Flexibility_in_thermal_plants/115_flexibility-report-WEB�pdf�
Bird, L. et al. (2014), Wind and Solar Energy Curtailment: Experience and Practices in the United States� US National Renewable Energy Laboratory, Golden, Colorado� Available at https://www�nrel�gov/docs/fy14osti/60983�pdf�
CAISO (2017), Fast Facts – Impacts of renewable energy on grid operations, California Independent System Operator, Folsom, California� Available at: https://www�caiso�com/documents/curtailmentfastfacts�pdf�
Chang, J. W. et al. (2017), Advancing Past “Baseload” to a Flexible Grid, Brattle Group, Cambridge, Massachusetts� Available at: http://www�brattle�com/system/publications/pdfs/000/005/456/original/Advancing_Past_Baseload_to_a_Flexible_Grid�pdf?1498246224�
Clifford, E. and Clancy, M. (2011), Impact of wind generation on wholesale electricity costs in 2011, Sustainable Energy Authority of Ireland and EirGrid, Dublin� Available at: https://www�seai�ie/resources/publications/Impact-of-Wind-Generation-on-Wholesale-Electricity-Costs-in-2011�pdf�
Cochran, J. et al. (2014), Flexibility in 21st Century Power Systems, US National Renewable Energy Laboratory, Golden, Colorado� doi: 10�2172/1130630�
Denholm, P� et al� (2010), The Role of Energy Storage with Renewable Electricity Generation, US National Renewable Energy Laboratory, Golden, Colorado� Available at: http://www�nrel�gov/docs/fy10osti/47187�pdf�
Denholm, P� (2015), “Greening the Grid: The Role of Storage and Demand Response”� Available at: https://www�nrel�gov/docs/fy15osti/63041�pdf %0Ahttp://greeningthegrid�org/resources/factsheets/the-role-of-storage-and-demand-response�
Denholm, P� et al� (2015), Overgeneration from Solar Energy in California� A Field Guide to the Duck Chart, US National Renewable Energy Laboratory, Golden, Colorado� doi: 10�2172/1226167�
Denholm, P� and Hand, M� (2011), “Grid flexibility and storage required to achieve very high penetration of variable renewable electricity”, Energy Policy, 39(3), pages 1817–1830�
Denholm, P� and Mai, T� (2018), “Timescales of energy storage needed for reducing renewable energy curtailment”, Renewable Energy� doi: 10�1016/j�renene�2018�06�079�
Denholm, P�, Margolis, R� and Milford, J� (2008), Production Cost Modeling for High Levels of Photovoltaics Penetration, US National Renewable Energy Laboratory, Golden, Colorado� doi: NREL/TP-581–42305�
EirGrid (2011), Ensuring a Secure, Reliable and Efficient Power System in a Changing Environment, EirGrid, Dublin�
EirGrid and SONI (2014), Delivering a Secure Electricity System (DS3) Sustainable Programme Overview – 2014� EirGrid and System Operator for Northern Ireland, Dublin and Belfast� Available at: http://www�eirgridgroup�com/site-files/library/EirGrid/DS3-Programme-Overview-2014�pdf�
EirGrid and SONI (2018), Annual Renewable Energy Constraint and Curtailment Report 2017� EirGrid and System Operator for Northern Ireland, Dublin and Belfast� Available at: http://www�soni�ltd�uk/media/documents/Operations/Annual Renewable Constraint and Curtailment Report 2014�pdf�

POWER SYSTEM FLEXIBIL ITY FOR THE ENERGY TRANSITION44
Ela, E., Milligan, M� and Kirby, B� (2011), Operating Reserves and Variable Generation, US National Renewable Energy Laboratory, Golden, Colorado� doi: 10�2172/1023095�
Everoze (2017), Batteries: Beyond the Spin – The dawning era of digital inertia on the Island of Ireland�
EWIS (2010), European Wind Integration Study (EWIS) – Towards a Successful Integration of Large Scale Wind Power into European Electricity Grids� European Wind Integration Study, Brussels� Available at: http://www�wind-integration�eu/downloads/library/EWIS_Final_Report�pdf�
Fulgencio, N., Moreira, C� and Silva, B� (2017), “Integration of variable speed hydro storage in automatic generation control systems”, Journal of Physics: Conference Series, 813(1)�
GE Energy (2010), Western Wind and Solar Integration Study� Prepared for US National Renewable Energy Laboratory, Golden, Colorado�
Greentech Media (2017), “EIA data reveals California’s real and growing duck curve”� Available at: https://www�greentechmedia�com/articles/read/eia-charts-californias-real-and-growing-duck-curve#gs�1mYxKK0�
Holttinen, H. et al. (2007), Design and operation of power systems with large amounts of wind power, English� Available at: https://www�vtt�fi/inf/pdf/workingpapers/2007/W82�pdf�
Holttinen, H� et al� (2016), Summary of experiences and studies for Wind Integration – IEA Wind Task 25, Proceedings of WIW2013� Available at: https://community�ieawind�org/HigherLogic/System/DownloadDocumentFile�ashx?DocumentFileKey=cafcf094-9df5-89a2-debd-f809b7953be1�
IEA (2016), Policy Highlight: China’s 13th Development Five Year Plan (2016–2020)� International Energy Agency, Paris� Available at: https://www�iea�org/media/topics/renewables/repolicyupdate/REDRenewablePolicyUpdateNo11FINAL20161117�pdf�
IEA (2017a), Electro fuels: Status and perspectives, International Energy Agency, Paris�
IEA (2017b), Renewable Energy Market Report, International Energy Agency, Paris�
IEA (2018), Status of Power System Transformation: Advanced Power Plant Flexibility, International Energy Agency, Paris� doi: 10�1787/9789264278820-en�
IRENA (2016), Scaling Up Variable Renewable Power: The Role of Grid Codes, International Renewable Energy Agency, Abu Dhabi� Available at: http://www�irena�org/documentdownloads/publications/irena_grid_codes_2016�pdf�
IRENA (2017a), Adapting Market Design to High Shares of Variable Renewable Energy� International Renewable Energy Agency, Abu Dhabi� Available at: http://www�irena�org/publications/2017/May/Adapting-Market-Design-to-High-Shares-of-Variable-Renewable-Energy�
IRENA (2017b), Planning for the Renewable Future� International Renewable Energy Agency, Abu Dhabi� Available at: http://www�irena�org/DocumentDownloads/Publications/IRENA_Planning_for_the_Renewable_Future_2017�pdf�
IRENA (2017c), Electricity Storage and Renewables: Costs and markets to 2030, International Renewable Energy Agency, Abu Dhabi� doi: ISBN 978-92-9260-038-9�
IRENA (2017d), Stranded Assets and Renewables: How the energy transition affects the value of energy reserves, buildings and capital stock� International Renewable Energy Agency, Abu Dhabi� Available at: http://www�irena�org/publications/2017/Jul/Stranded-Assets-and-Renewables�
IRENA (2018a), Global Energy Transformation� International Renewable Energy Agency, Abu Dhabi� Available at: http://www�irena�org/publications/2018/Apr/Global-Energy-Transition-A-Roadmap-to-2050IRENA (2018) Data and Statistics, Online�
IRENA (2018c), Hydrogen From Renewable Power Technology� Outlook for the Energy Transition� International Renewable Energy Agency, Abu Dhabi� Available at: http://www�irena�org/-/media/Files/IRENA/Agency/Publication/2018/Sep/IRENA_Hydrogen_from_renewable_power_2018�pdf�

PART 1: OVERVIEW FOR POLICY MAKERS 45
IRENA (2018d) Transforming Small-Island Power Systems: Technical Planning Studies for the Intergration of Variable Renewables, International Renewable Energy Agency, Abu Dhabi�
Kirby, B� (2007), Ancillary Services: Technical and Commercial Insights� Available at: http://www�consultkirby�com/files/Ancillary_Services_-_Technical_And_Commercial_Insights_EXT_�pdf�
Kroposki, B� (2017), “Integrating high levels of variable renewable energy into electric power systems”, Journal of Modern Power Systems and Clean Energy, 5(6), pages 831–837� Available at: https://link�springer�com/article/10�1007/s40565-017-0339-3�
Lew, D� et al� (2013), The Western Wind and Solar Integration Study Phase 2, US National Renewable Energy Laboratory, Golden, Colorado� Available at: https://www�nrel�gov/docs/fy13osti/55588�pdf�
Liu, Y. (2017), “Wind and solar curtailments drop almost 30 % in China’s Xinjiang Region”� Available at: https://www�renewableenergyworld�com/articles/2017/12/china-s-xinjiang-region-cuts-wind-and-solar-curtailment-rate-by-almost-30-percent�html�
Madrigal, M. and Stoft, S. (2012), Transmission Expansion for Renewable Energy Scale Up: Emerging Lessons and Recommendations� World Bank, Washington, D�C� doi: 10�1596/978-0-8213-9598-1�
Milligan, M. et al. (2015), Advancing System Flexibility for High Penetration Renewable Integration� US National Renewable Energy Laboratory, Golden, Colorado� doi: 10�2172/1225920�
Mills, A. et al. (2009), Understanding Variability and Uncertainty of Photovoltaics for Integration with the Electric Power System� Lawrence Berkeley National Laboratory, Berkeley, California� Available at: https://emp�lbl�gov/sites/all/files/lbnl-2855e�pdf�
Mills, A. and Wiser, R. (2010), Implications of Wide-Area Geographic Diversity for Short-Term Variability of Solar Power� Lawrence Berkeley National Laboratory, Berkeley, California� doi: LBNL-3884E�
Moeller & Poeller Engineering (2017), Assessing the Impact of Increasing Shares of Variable Generation on System Operations in South Africa� Available at: http://www�ee�co�za/wp-content/uploads/2017/09/GIZ_M_P_E_2017_Flexibility_Study_Report�pdf�
NDRC (2016), Power Development, 13th Five-Year Plan for 2016–2020, China National Development and Reform Commission, Beijing�
NREL (2011), Eastern Wind Integration and Transmission Study, US National Renewable Energy Laboratory, Golden, Colorado� doi: CP-550-46505�
Palchak, D� et al� (2017), Greening the Grid: Pathways to Integrate 175 Gigawatts of Renewable Energy into India’s Electric Grid, Vol� I – National Study, US National Renewable Energy Laboratory, Golden, Colorado� Available at: https://www�nrel�gov/docs/fy17osti/68530�pdf�
Republic of Ireland (2010), National Renewable Energy Action Plan, Dublin�
Retzer, S. (2017), “China’s 13th FYP for Power Sector Development (2016–2020)”� Available at: https://www�linkedin�com/pulse/chinas-13th-five-year-plan-fyp-power-sector-2016-2020-sandra-retzer/�
Reuters (2017), “China aims to stop renewable energy being wasted by 2020”� Available at: https://www�reuters�com/article/us-china-renewables-waste/china-aims-to-stop-renewable-energy-being-wasted-by-2020-idUSKBN1DD136�
Rogers, J., Fink, S. and Porter, K. (2010), Examples of Wind Energy Curtailment Practices, US National Renewable Energy Laboratory, Golden, Colorado� Available at: http://www�nrel�gov/docs/fy10osti/48737�pdf�
RTE (2018), “Denmark on track to have 50 % renewable energy by 2030”� Available at: https://www�rte�ie/ news/newslens/2018/0111/932573-denmark-wind-farm/�

POWER SYSTEM FLEXIBIL ITY FOR THE ENERGY TRANSITION46
US DOE (2017), “Staff Report to the Secretary on Electricity Markets and Reliability”, August, page 187� US Department of Energy, Washington, D�C� Available at: https://energy�gov/sites/prod/files/2017/08/f36/Staff Report on Electricity Markets and Reliability_0�pdf�
World Bank (2015), Integrating Variable Renewable Energy into Power System Operations, World Bank, Washington, D�C� Available at: file:///C:/Users/TNikolakakis/Dropbox (IRENA)/Flexibility_VRE/report/4review/reviews/external/track_changes_comments/IRENA Addressing Comments/References/World Bank Nikolakakis�pdf�
Xiang, L. (2017), “Presentation at GIVAR meeting ‘Thermal Power Flexibility in China’”�
Ye, Q., Jiaqi, L� and Mengye, Z� (2018), Wind Curtailment in China and Lessons from the United States� Brookings – Tsinghua Center for Public Policy, Beijing� Available at: https://www�brookings�edu/ wp-content/uploads/2018/03/wind-curtailment-in-china-and-lessons-from-the-united-states�pdf�
Zaman, A. (2018), 100 % Variable Renewable Energy Grid: Survey of Possibilities, University of Michigan, Ann Arbor, Michigan� Available at: https://deepblue�lib�umich�edu/bitstream/handle/2027�42/143152/Zaman_Ansha_Practicum�pdf?sequence=1&isAllowed=y�
Zhou, Y. and Lu, S. (2017), China’s Renewable Curtailment and Coal Assets Risk Map� Available at: https://data�bloomberglp�com/bnef/sites/14/2017/10/Chinas-Renewable-Curtailment-and-Coal-Assets-Risk-Map-FINAL_2�pdf (accessed 20 August 2017)�


www.irena.org© IRENA 2018