power for allpowermin.nic.in/sites/default/files/uploads/power_for_all_tamilnad... · joint...
TRANSCRIPT
Power for All Tamil Nadu

Joint Statement
Tamil Nadu is already a pioneer state in
implementing 24X7 Power to all sectors. The
state has already achieved 100% village
electrification level.
The state had witnessed peak surplus in financial
year 2016 and has continued to move with
adequate plans for the surplus power for
forthcoming years.
In addition, The State Government is also
providing free electricity of 100 units bi-monthly
to all category of domestic consumers.
Thus, the Government of Tamil Nadu is
continuously supporting the power sector
through subsidy schemes aimed at supporting
poor and marginal consumers and elimination of
regional disparities in the state.
The State has made significant progress in
expanding access and availability of electricity
over the past. This is complemented by the fact
that the state is one of the leading states in the
country in renewable capacity addition.
This roadmap is prepared with the efforts of
Ministry of Power, CEA and Tamil Nadu utilities
(TANGEDCO and TANTRANSCO). The targets
provided in this roadmap are developed by
dovetailing and utilizing the existing master plan
proposals of Tamil Nadu utilities for infrastructure
addition and capacity development in
Generation, Transmission, Distribution, Energy
Efficiency/DSM and Renewable Energy sectors
to achieve the objectives of the 24X7 Power For
All program for the period FY17 to FY19.
The State Government will put in place
appropriate State level governance those listed
in this document.
The Ministry of Power, Gol would support the
efforts of State on various issues to be dealt with
at the Central Government level including those
listed in this document.
The MoP, Gol shall also endeavor to support the
State in availing concessional financing
arrangements for power utilities in the State.
Though the state has already achieved the
objective of the program, the Central and State
Governments would meet regularly over the next
three years to review and monitor the progress
on the rollout plan for enhancing the infra
structure facilities and to maintain the
satisfaction levels of the consumers and improve
the quality of life of people through 24x7 power
supply.
Power for All – Tamil Nadu
Page | ii
Contents
List of Figures ..................................................................... iii
List of Tables ...................................................................... iv
List of Annexures ................................................................ vi
List of Abbreviations .......................................................... vii
1. Executive Summary .................................................... 1
2. Background................................................................. 3
3. Power Supply Scenario .............................................. 6
4. Generation Plan ........................................................ 11
5. Transmission Plan .................................................... 21
6. Distribution Plan ....................................................... 28
7. Renewable Energy Plan ........................................... 35
8. Energy Efficiency Plan .............................................. 38
9. Financial Position of Utility (TANGEDCO) ................ 40
10. Other Initiatives ......................................................... 53
11. Institutional Framework ............................................ 54
12. Rollout Plan .............................................................. 55
13. Annexures ................................................................. 56
Power for All – Tamil Nadu
Page | iii
List of Figures
Figure 1: State vs National Per Capita Income (Rs.) .......................................................................... 3
Figure 2: Monthly Demand and Supply (Peak- MW and Energy-MU, source: TANGEDCO)............. 6
Figure 3: Consumer and Sales Mix (FY16) ......................................................................................... 7
Figure 4: Projected Energy Sales in MU (FY 16 to FY19) .................................................................. 9
Figure 5: Rural and Urban Sales in MU .............................................................................................. 9
Figure 6: PFA Projected Energy Req. & Demand vs 18th EPS Projections ..................................... 10
Figure 7: Energy available from various sources (MU) ..................................................................... 16
Figure 8: Anticipated Energy Availability for Retails Sales (MU) for TANGEDCO ........................... 18
Figure 9: Anticipated Peak Availability Position of TANGEDCO (MW) ............................................. 18
Figure 10: Share of investments ....................................................................................................... 26
Figure 11: District wise Rural & Urban HH Electrification Levels – Tamil Nadu (2011 Census) ...... 29
Figure 12: AT&C Loss trend for FY10 to FY16 ................................................................................. 29
Figure 13: Proposed works under IT capacity addition plan for TANGEDCO .................................. 33
Figure 14: ABR Vs. ACS for TANGEDCO (Rs./kWh) ....................................................................... 40
Figure 15: Accumulated Losses in Rs. Cr. ........................................................................................ 41
Figure 16: Projected AT&C Loss trajectory (%) and energy input (MU) - TANGEDCO ................... 41
Power for All – Tamil Nadu
Page | iv
List of Tables
Table 1: About the state ...................................................................................................................... 4
Table 2: Tamil Nadu Power Sector at a glance .................................................................................. 5
Table 3: Peak Demand and Energy Availability FY11 to FY16 (Source: TANGEDCO) ..................... 7
Table 4: Per HH per day consumption (kWh) ..................................................................................... 8
Table 5: Energy Requirement and Peak Demand Projection - TANGEDCO ................................... 10
Table 6: Installed Capacity (MW) as on 31.03.2016 (Source: TANGEDCO).................................... 11
Table 7: Existing State Owned Plants ............................................................................................... 12
Table 8: Plant wise allocated capacity from CGS (April 2016) ......................................................... 13
Table 9: Plants under Construction (State) ....................................................................................... 14
Table 10: Capacity addition MW (State and Central Sources) ......................................................... 14
Table 11: R&M work of thermal power plants ................................................................................... 15
Table 12: R&M work of Hydro projects ............................................................................................. 15
Table 13: Energy Available for TANGEDCO (Including Wheeling and Aux consumption) MU ........ 17
Table 14: Investment Plan in (Rs. Cr.) .............................................................................................. 19
Table 15: R&M Plan Thermal (Rs.Cr.) ................................................................................................ 19
Table 16: Action points for Generation Plan ..................................................................................... 19
Table 17: Intra-state Transmission System, March 2016 ................................................................. 21
Table 18: Inter- state Transmission System (owned by PGCIL) ....................................................... 22
Table 19: Inter- state Network Connection TN to CGS & other States (400 kV and above) ............ 22
Table 20: Inter and intra state lines in Tamil Nadu (PGCIL) ............................................................. 23
Table 21: Proposed capacity additions in SS and Lines by TANTRANSCO .................................... 24
Table 22: Year-wise fund requirement for Ongoing & Planned Intrastate Transmission System (Rs. Crs.) ................................................................................................................................................... 26
Table 23: Action Points & Timelines ................................................................................................. 27
Table 24: Existing Distribution Network of TANGEDCO ................................................................... 28
Table 25: Proposed investments -IPDS ............................................................................................ 31
Table 26: Infrastructure addition program under various schemes for TANGEDCO ........................ 32
Table 27: Fund Requirement in Rs. Cr. under various schemes ...................................................... 32
Table 28: Investments for upgradation of ULDC ............................................................................... 33
Table 29: Distribution Infrastructure rollout plan for TANGEDCO .................................................... 33
Table 30: Action Points for Distribution Plans ................................................................................... 34
Table 31: RPO Targets for Tamil Nadu............................................................................................. 35
Table 32: Planned Capacity Addition in Renewables (2014-19) ...................................................... 35
Table 33: RE Installed Capacity ........................................................................................................ 36
Table 34: Existing Solar Capacity ..................................................................................................... 36
Table 35: Existing Wind Capacity ..................................................................................................... 37
Table 36: Renewable Power Addition ............................................................................................... 37
Power for All – Tamil Nadu
Page | v
Table 37: RE Action Plan .................................................................................................................. 37
Table 38: Action plan for Energy Efficiency Measures ..................................................................... 39
Table 39: FRP Particulars ................................................................................................................. 43
Table 40: Key Common Assumptions underlying financial analysis ................................................. 43
Table 41: Impact of Asset addition (Rs Cr.) ...................................................................................... 45
Table 42: Parameters for base case ................................................................................................. 45
Table 43: Impact on tariff due to PFA ............................................................................................... 45
Table 44: Profit and Loss Account (Rs.Cr.) for Base Case............................................................... 46
Table 45: Parameters for Scenario 1 (Tariff increase) ...................................................................... 47
Table 46: Profit and Loss Account Scenario 1 (Tariff Hike) (Rs. Cr.) ............................................... 47
Table 47: Parameters for Scenario 2 (Non-Availability of grants) ..................................................... 48
Table 48: Impact on tariff due to PFA – Scenario 2 .......................................................................... 48
Table 49: Profit and Loss Statement (Rs. Cr.) Scenario 2 ................................................................ 49
Table 50: Parameters for Scenario 3 (Under-achievement of T&D losses)...................................... 50
Table 51: Scenario 3: Impact on tariff ............................................................................................... 50
Table 52: Profit and Loss statement - Scenario 3 (Rs. Cr.) .............................................................. 50
Table 53: Training Centers and Institutes ......................................................................................... 53
Table 54: Institutional Arrangement for Monitoring ........................................................................... 54
Power for All – Tamil Nadu
Page | vi
List of Annexures
Annexure 1: List of Thermal Stations in the State- Total generation capacity .................................. 56
Annexure 2: R&M Plan ...................................................................................................................... 56
Annexure 3: List of Micro/Mini Hydro Project In The State ............................................................... 57
Annexure 4: List of Hydro Project In The State ................................................................................. 57
Annexure 5: EHV Substation with Transformation capacity ............................................................. 58
Annexure 6: Existing 400 KV capacity of TANTRANSCO as on 31.03.2016 ................................... 59
Annexure 7: Year on Year Infrastructure Building Plan .................................................................... 59
Annexure 8: Region Wise Infrastructure Building Plan ..................................................................... 60
Annexure 9: Establishment of 400 kV SS ......................................................................................... 60
Annexure 10: Establishment of 230 kV SS ....................................................................................... 60
Annexure 11: Establishment of 110 kV SS ....................................................................................... 61
Annexure 12: Establishment of 33 kV SS ......................................................................................... 61
Annexure 13: Upgradation of Sub Stations ....................................................................................... 61
Annexure 14: Enhancement of Power Transformers ........................................................................ 62
Annexure 15: Integrated Power Development Scheme (IPDS) ........................................................ 62
Annexure 16: DDUGJY Scheme ....................................................................................................... 64
Annexure 17: Existing Voltage Wise Capacity of TANTRANSCO Sub-Stations as on 31.03.2016 . 65
Annexure 18: SAIFI SAIDI values of R APDRP Towns (August 2016) ............................................ 68
Annexure 19: Projected Cash Flow (Base Case) ............................................................................. 70
Annexure 20: Projected Balance sheet (Base Case)........................................................................ 71
Annexure 21: Projected Cash Flow (Scenario 1) .............................................................................. 72
Annexure 22: Projected Balance sheet (Scenario 1) ........................................................................ 73
Annexure 23: Projected Cash Flow (Scenario 2) .............................................................................. 74
Annexure 24: Projected Balance Sheet (Scenario 2) ....................................................................... 75
Annexure 25: Projected Cash Flow (Scenario 3) .............................................................................. 76
Annexure 26: Projected Balance Sheet (Scenario 3) ....................................................................... 77
Annexure 27:Annual Training Program of Thermal Training Institute, North Chennai ..................... 78
Annexure 28: Annual Training program of Cable Jointing Training & Development Centre ............ 80
Annexure 29: Annual Training program of Technical Training and Development Centers .............. 80
Annexure 30: Annual Training program of Hydro Training Institute, Kuthiraikalmedu ...................... 81
Annexure 31: Annual Training program of Transmission and Distribution Training and Development Institute / Madurai .............................................................................................................................. 82
Annexure 32: Annual training program of Staff Training College / Chennai ..................................... 84
Annexure 33: Step down transformers in TANTRANSCO ................................................................ 85
Power for All – Tamil Nadu
Page | vii
List of Abbreviations
Abbreviation Full Form
ARR Aggregate Revenue Requirement
AT&C Aggregate Technical & Commercial
BOBRN Bogie Open Bottom Release
BPL Below Poverty Line
CAGR Compound Annual Growth Rate
CKM Circuit Kilometers
CoD Commercial Operation Date
DDG Decentralized Distributed Generation
DDUGJY Deendayal Upadhyaya Gram Jyoti Yojana
DPR Detailed Project Report
DSM Demand Side Management
DT/ DTR Distribution Transformer
EBIDTA Earnings Before Interest Depreciation Taxes and Amortization
ECBC Energy Conservation Building Code
EE Energy Efficiency
EPC Engineering, Procurement and Construction
EPS Electric Power Survey
ER Eastern Region
FY Financial Year
GoI Government of India
GSS Grid Substation
GWp Giga Watt Peak
HH Household
IPDS Integrated Power Development Scheme
IPP Independent Power Producer
ISTS Inter State Transmission System
JICA Japan International Cooperation Agency
LED Light-emitting Diode (LED in this context is for LED lighting)
LILO Loop In Loop Out
LT Low Tension
MNRE Ministry of New and Renewable Energy
MoC Ministry of Coal
MoEF Ministry of Environment & Forests, Government of India

Power for All – Tamil Nadu
Page | viii
Abbreviation Full Form
MoP Ministry of Power, Government of India
MU Million Unit of Electricity (in kWh)
MVA Mega Volt Ampere
MW Mega Watt
MWp Mega Watt Peak
NESCL NTPC Electric Supply Company Limited
NHPC National Hydroelectric Power Corporation
NTPC National Thermal Power Corporation
O&M Operation & Maintenance
PAT Profit After Taxes
PBT Profit Before Taxes
PFA Power For All
PFC Power Finance Corporation
PGCIL Power Grid Corporation Of India Limited
PLF Plant Load Factor
PMA Project Monitoring Agency
PPA Power Purchase Agreement
PPP Public–private Partnership
R&M Renovation & Modernization
RE Renewable Energy
REC Rural Electrification Corporation
RGGVY Rajiv Gandhi Grameen Vidyutikaran Yojana
ROW Right of Way
RPO Renewable Energy Purchase Obligation
SCADA Supervisory Control and Data Acquisition
SHR Station Heat Rate
SLDC State Load Dispatch Center
SPV Special Purpose Vehicle
S/s, SS Sub-station
TANGEDCO Tamil Nadu Generation and Distribution Corporation Limited
TANTRANSCO Tamil Nadu Transmission Corporation Limited
TNEB Tamil Nadu Electricity Board
TNERC Tamil Nadu Electricity Regulatory Commission
TNIPP Tamil Nadu Investment Promotion Programme
T&D Transmission & Distribution
TBCB Tariff Based Competitive Bidding
TPS Thermal Power Station
ULDC Unified Load Dispatch Centre
UMPP Ultra Mega Power Project
USTDA US Trade & Development Agency
VGF Viability Gap Funding
YoY Year on Year

Power for All – Tamil Nadu
Page | 1
1. Executive Summary
1.1. Introduction
24x7 Power for All is a Joint Initiative of
Government of India and State Government with an
objective to strengthen the power supply
infrastructure and make 24X7 reliable and quality
power available to all households, industry,
commercial businesses, public needs, agriculture
and any other electricity consuming entity. This
roadmap document aims to meet the above
objectives for the state of Tamil Nadu which is
already implementing 24X7 power supply to all
sector.
As per 2011 census, Tamil Nadu had higher
Household (HH) level electrification of 93.4% as
compared to national average of 67.2%.
There has been significant infrastructure addition in
all the areas of the power sector during the past few
years. As a result of the capacity additions made
towards meeting the demand, the peak deficit for
FY16 was zero and this trend is continuing in FY17.
1.2. Connecting the unconnected
The state has made significant advances in
extending distribution network to un-electrified
households in the last few decades. Due to these
efforts The State has achieved almost 100% village
and HH electrification level as on March 2016,
barring some remote households (5,787) which are
planned to be electrified using off grid solutions.
Growth in demand and 24X7 supply
The state has been maintaining almost 24 hours
power supply to all categories of consumers. The
average supply to agriculture sector is about 24
hours per day. Load shedding prior to 01.06.2014
has been totally withdrawn for all categories of
consumers and continuous power supply is being
extended to all areas of Tamil Nadu. Growth in
demand is expected to be 7%. TANGEDCO
envisages peak demand to touch 17,651 MW by
FY19.
1.3. Generation Plan
The state has an installed capacity of 24,433 MW
as on 31.03.2016. Tami Nadu has one state owned
generation company – TANGEDCO. In addition
there are various central and private generating
companies. By FY17 the installed capacity is
expected to increase by about 2,509 MW from
thermal sources including 165 MW from Co-
generation sources & another 5,100 MW from
Renewable energy sources (Wind, Solar and other
Sources). The expected capacity additions are in
line with the anticipated peak demand projections.
The projects under implementation are on track.
Bottlenecks and constraints of the available linkage
of coal for existing plants have also been addressed
to some extent.
During February 2016 Chandrabila coal block was
allotted to TANGEDCO for ETPS Expansion
project, Ennore SEZ project and Udangudi Stage I.
TANGEDCO has already signed MOU with MMTC for imported coal for following projects:
ETPS Expansion project (2 MTPA, date of signing :23.7.2012),
Ennore SEZ project (4.549 MTPA, date of signing : 26.06.2012),
NCTPP Stage III ( 2.51 MTPA, date of signing 25.05.2015),
Uppur Thermal power project (5.01 MTPA, date of signing: 25.05.2015) and
Udangudi Stage I (3.87 MTPA, date of signing: 19.11.2012).
It may be noted that, TANGEDCO is awaiting coal block allotment from indigenous sources for NCTPP Stage III and Uppur Thermal Power Plants. Expected CoD is beyond FY19 for these two plants.
1.4. Transmission plan
Power for All – Tamil Nadu
Page | 2
As on 31.03.2016, the existing intra state
transmission network comprises of 908 EHV grid
substations with 59,953 MVA capacity along with
30,331.6 ckm associated transmission lines.
Further, the transmission system owned by PGCIL
consists of 8,127 ckm of lines and 9,300 MVA of
transformation capacity. By FY19 the intra-state
transformation capacity is proposed to be
enhanced to 94,217 MVA (which includes
additional 8,640 MVA for Renewable Corridor) and
33,768 ckm of intra-state transmission lines.
The state transmission utility TANTRANSCO has
proposed investments for meeting its anticipated
demand as well as providing connectivity to the
upcoming renewable energy corridors. In this
endeavor, TANTRANSCO has outlined a total
capital expenditure layout of Rs. 20,309 Cr. These
projects are funded by various agencies like PFC,
REC, NABARD, TNIPP, JICA, etc. Further, some
projects for providing evacuation of Renewable
Energy projects are being executed under KfW
funding schemes.
1.5. Distribution plan
The state distribution utility TANGEDCO is in
advanced stages of completing the RGGVY
scheme. Further, the utility has already started
implementing R-APDRP schemes across the state.
In addition to these centrally sponsored schemes,
the utility is also adding network under ADB funded
schemes.
For meeting the network requirement of existing
consumers and extending the distribution network
to the newly constructed HHs, the utility has
proposed enhancement of network by means of
addition in HT network, LT network and additional
power and distribution transformers and various
other improvement works. This plan will increase
the number of DTs from 2,64,029 in FY16 to
320,681 in FY19, similarly the LT network will
increase from 6,09,544 kms in FY16 to 644,603
kms in FY19. These network additions are
proposed with an investment of Rs. 9,348 Cr.
1.6. Renewable energy and energy efficiency
The state has RE installed capacity of 9,687 MW
(Sep 2016). The RE installed capacity is mostly
contributed by wind (7,642 MW) followed by solar
(1,155.4 MW). The state has planned off-grid
renewable solutions to cater to the growth in
demand in far-flung areas with poor accessibility.
This includes 5,787 standalone solar solutions.
Future plans for renewable capacity addition
includes addition of 5,265 MW of renewable energy
through investments by private sector.
State’s energy efficiency plan is already in place. In
the past the utility had provided 8.75 lakh CFLs in
exchange of incandescent bulbs across the state
under various schemes, further schemes include
distribution of energy efficient pump sets.
Load survey for identification of energy saving
potential in various sectors (domestic, commercial,
industrial, agricultural, etc.) across the state is in
progress. Based on the report on load survey, a
DSM action plan will be formulated for maximizing
the use of energy efficient appliances under various
sector wise schemes. TANGEDCO will take up the
schemes for implementation, one by one, subject to
financial viability.
1.7. Financial turnaround
Considering TANGEDCO is able to achieve AT&C
loss reduction targets, a tariff hike of 5.52% will help
the utility to operationally turnaround by FY19.
The State Government is continuously extending
financial assistance to TANGEDCO over the past 5
years. Further, the quantum of subsidy was also
increased from Rs.2,071 Cr. during FY12 to
Rs.6,695 Cr in FY16. In order to compensate
differential cost of supply for the free supply to
agricultural consumers, the Government of Tamil
Nadu has revised the subsidy from Rs.250/HP/p.a.
to Rs.2,875/HP/p.a.
With respect to the restructuring of loans, the
Government of Tamil Nadu has already approved
FRP during FY13 and taken over Rs.6,353.49 Cr.
of loans of TANGEDCO and its interest liability.
Under the FRP, TANGEDCO has restructured
remaining Rs.5,951 Cr. of loan liability with banks
for a tenure of 10 years including 3 years
moratorium. TANGEDCO is also taking various
measures for swapping of high interest loans to low
interest loan for considerable savings in interest
cost.
The Government of Tamil Nadu is also converting
the Electricity Tax recovered by TANGEDCO from
the consumers about Rs.800 crores p.a. so as to
partially help in the financial management of
TANGEDCO.

Power for All – Tamil Nadu
Page | 3
2. Background
2.1. The State of Tamil Nadu
Tamil Nadu is situated in the southern peninsula of
Indian subcontinent and is surrounded on the north
by Andhra Pradesh and Karnataka, on the west by
Kerala, on the east by the Bay of Bengal and on the
south by the Indian Ocean. With a population of
over 7 Crore and an area of 130,058 sq.km, it is the
7th largest in terms of population and 11th largest
State in India in terms of area. The state contributes
nearly 8.4% to India’s GDP making it the 2nd largest
contributor, only after Maharashtra.
Urbanization in Tamil Nadu is highest in the country
with urban areas accounting for as high as 48.4%
of State’s population, as against national average
of 31.2%. In terms of households (HHs), Chennai is
the largest district with 11,06,567 HHs. The State
witnessed high HH level electrification in rural
areas, as per Census 2011 90.8% rural HHs have
access to electricity, which gradually increased to
an impressive 100%.
The State has as an area of 1.3 Lakh sq.km with a
gross crop area of around 63,000 sq km (63 Lakh
Ha). The state provides free electricity to
agricultural consumers to boost the primary sector
output of the state.
The State’s mineral reserves and major minerals
include limestone, bauxite, gypsum, lignite,
magnetite, and iron metal. The opencast lignite
mines at Neyveli, in the north-center part of the
state, are amongst the largest in India, and are
utilized to fuel power stations of Neyveli project that
contributes a significant part of the state's power.
Tamil Nadu has a strong presence of
manufacturers of engineering and auto
components, textiles, leather, sugar etc. The state’s
industrial policy (1992) laid the foundation for the
rapid growth of new industries that facilitated the
electronics and automobile industry revolution in
Tamil Nadu by attracting major projects from
industrial giants.
The software exports from the State during FY14
have been at USD 12.38 Bn with an impressive
growth rate of more than 18% over the last 3 years.
Source: MoSPI
-
10,000
20,000
30,000
40,000
50,000
60,000
70,000
FY05 FY06 FY07 FY08 FY09 FY10 FY11 FY12 FY13 FY14 FY15
Tamil Nadu India
Figure 1: State vs National Per Capita Income (Rs.)

Power for All – Tamil Nadu
Page | 4
Table 1: About the state
Parameter Information
Year of Creation Established on August 15,1947, Statehood conferred as Madras State on 26 Jan
1950, Re-organized in 1956, Renamed as Tamil Nadu in 1969
Population & Demographics
Total Population at 7,21,47,030 as per 2011 census
51.6% Rural, 48.4% Urban
Decadal population growth: 15.6%
Area 1,30,058 square kilometers (3.95 % of country)
Forest cover – 22,877 sq kms (2.95% of country)
Administrative Set-up
32 Districts
85 revenue divisions
15,979 Revenue Villages (as per census 2011)
Natural Resources
Vast Forest Resources with diverse range of Flora & Fauna
Rivers : Kaveri, Palar, Ponnaiyar, Bhavani, Vaigai
Other Resources: Lignite, Vermiculite, Titanium Magnetite, Dunite, Rutile, Garnet,
Molybdenum And Ilmenite
HHs
Urban 89,29,104 (96.1% Electrified)
Rural 95,63,899 (90.8% Electrified)
Total 1,84,93,003 HHs (93.4 % Electrified) (2011 census)
Presently, Aug 2016 100% electrified (approx.)
Backed with high industrial and commercial activity,
the State’s per capita electricity consumption of
1,280 kWh (FY16) ranks among the top ten states
in the country.
A significant part of Tamil Nadu's energy is
contributed by thermal stations. The hydroelectric
plants particularly along the Kaveri River and its
tributaries provide options of Hydro Energy. The
state is also a leader in wind-power and solar
generation. A brief overview of the power sector of
Tamil Nadu is discussed in the following sub-
section.
2.2. Tamil Nadu Power Sector At a Glance
Formed in 1957, Tamil Nadu Electricity Board was
constituted as a vertically integrated entity
responsible for power generation, transmission and
distribution. In line with the requirement of
Electricity Act 2003, the entity was restructured into
one holding and two subsidiary companies with
TNEB Ltd. as holding company. The subsidiary
TANTRANSCO Ltd. was created to undertake
transmission in the State, while the generation and
distribution was vested into TANGEDCO Ltd.
Notably, Tamil Nadu is one of the early achievers of
100% village electrification and has the largest wind
and solar power generation capacity across the
country. Over the past few years, the utility has
incurred significant capital expenditure to improve
access and reliability of supply in the State. With the
continued commitment of State Government and
enormous efforts of utilities, the state has overcome
obstacles in generation, transmission and
distribution. A brief snapshot of the state power
sector is discussed in Table 2. In compliance of the
Electricity Act, 2003, the state has restructured the
erstwhile Tamil Nadu Electricity Board (TNEB) with
effect from November 01, 2010 into three entities
TNEB Limited (holding company) and its
subsidiaries:
Tamil Nadu Generation and Distribution
Corporation Limited (TANGEDCO) which is
responsible for electricity generation and
distribution within the state.
Tamil Nadu Transmission Corporation Limited
(TANTRANSCO) which is responsible for
electricity transmission of the state
The State Regulator- Tamil Nadu Electricity
Regulatory Commission (TNERC) was established
and became operational from July 2, 1998. TNERC
carries out its function and roles in accordance with
applicable provisions of the Electricity Act, 2003.
Power for All – Tamil Nadu
Page | 5
Table 2: Tamil Nadu Power Sector at a glance
Aspect Key Highlights
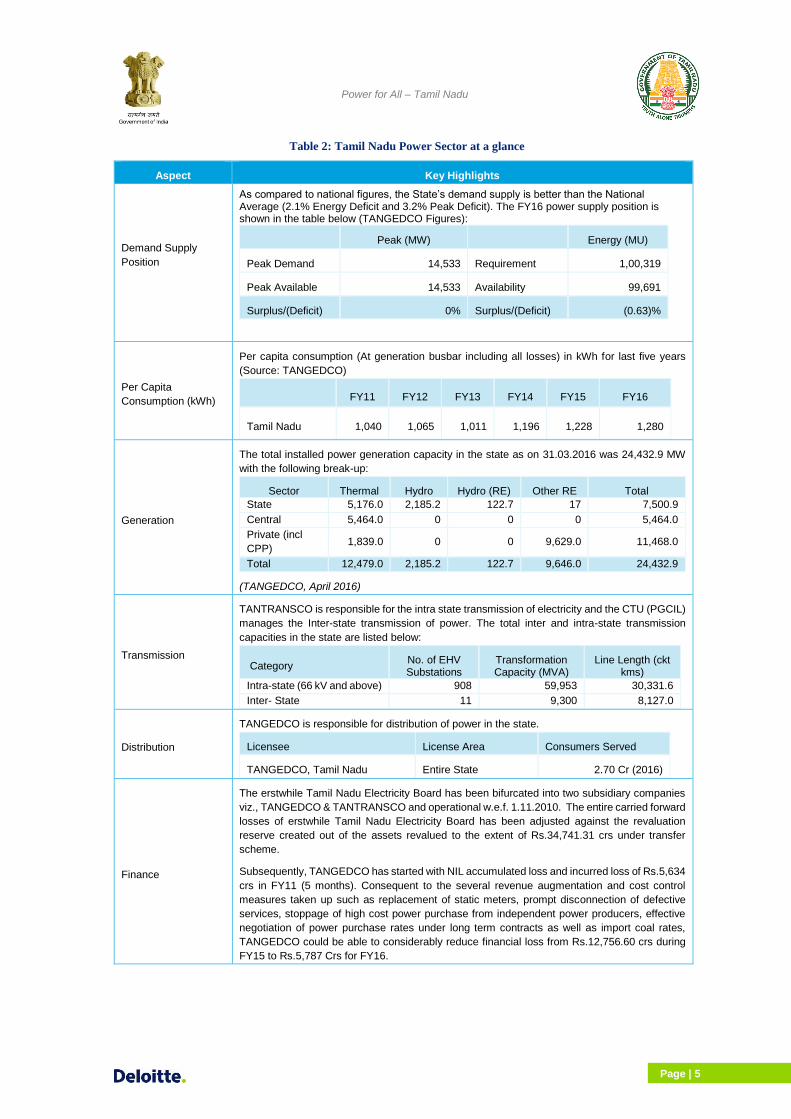
Demand Supply
Position
As compared to national figures, the State’s demand supply is better than the National Average (2.1% Energy Deficit and 3.2% Peak Deficit). The FY16 power supply position is shown in the table below (TANGEDCO Figures):
Peak (MW) Energy (MU)
Peak Demand 14,533 Requirement 1,00,319
Peak Available 14,533 Availability 99,691
Surplus/(Deficit) 0% Surplus/(Deficit) (0.63)%
Per Capita
Consumption (kWh)
Per capita consumption (At generation busbar including all losses) in kWh for last five years
(Source: TANGEDCO)
FY11 FY12 FY13 FY14 FY15 FY16
Tamil Nadu 1,040 1,065 1,011 1,196 1,228 1,280
Generation
The total installed power generation capacity in the state as on 31.03.2016 was 24,432.9 MW
with the following break-up:
Sector Thermal Hydro Hydro (RE) Other RE Total
State 5,176.0 2,185.2 122.7 17 7,500.9
Central 5,464.0 0 0 0 5,464.0
Private (incl
CPP) 1,839.0 0 0 9,629.0 11,468.0
Total 12,479.0 2,185.2 122.7 9,646.0 24,432.9
(TANGEDCO, April 2016)
Transmission
TANTRANSCO is responsible for the intra state transmission of electricity and the CTU (PGCIL)
manages the Inter-state transmission of power. The total inter and intra-state transmission
capacities in the state are listed below:
Category No. of EHV Substations
Transformation Capacity (MVA)
Line Length (ckt kms)
Intra-state (66 kV and above) 908 59,953 30,331.6
Inter- State 11 9,300 8,127.0
Distribution
TANGEDCO is responsible for distribution of power in the state.
Licensee License Area Consumers Served
TANGEDCO, Tamil Nadu Entire State 2.70 Cr (2016)
Finance
The erstwhile Tamil Nadu Electricity Board has been bifurcated into two subsidiary companies
viz., TANGEDCO & TANTRANSCO and operational w.e.f. 1.11.2010. The entire carried forward
losses of erstwhile Tamil Nadu Electricity Board has been adjusted against the revaluation
reserve created out of the assets revalued to the extent of Rs.34,741.31 crs under transfer
scheme.
Subsequently, TANGEDCO has started with NIL accumulated loss and incurred loss of Rs.5,634
crs in FY11 (5 months). Consequent to the several revenue augmentation and cost control
measures taken up such as replacement of static meters, prompt disconnection of defective
services, stoppage of high cost power purchase from independent power producers, effective
negotiation of power purchase rates under long term contracts as well as import coal rates,
TANGEDCO could be able to considerably reduce financial loss from Rs.12,756.60 crs during
FY15 to Rs.5,787 Crs for FY16.

Power for All – Tamil Nadu
Page | 6
3. Power Supply Scenario
3.1. Power Supply Position
Tamil Nadu is the 3rd largest consumer of electricity
accounting for nearly 9% of total energy
consumption in India (during FY16). Over the last 5
years, the State has benefitted by the significant
capacity additions and allocations, resulting in
decrease in peak deficit from 6.38% in FY11 to 0%
in FY16. The utility has undertaken several
measures with focus on reduction of T&D losses
and considerable capacity addition which have led
to the improvement in power supply. The peak
demand met in state has increased at a CAGR of
6.4% over the last five (5) years leading to steep
decline in the peak deficit (Nil in FY16). In terms of
energy requirement and availability, It may be noted
that, the Power Supply Position figures in this
document have been provided by TANGEDCO,
these figures vary from CEA figures due to non-
inclusion of state’s own generation injected at STU,
the energy requirement is derived by adjusting the
estimated energy lost due to scheduled outages
and the available energy.
Monthly data for peak and energy shows that during
April’15 to May15, deficit of the order of ~1% was
observed. However, from Jun’15 onwards there is
no shortage in peak and from Sep’15 onwards there
is no shortage of peak and energy. The seasonal
trend of peak and energy shortages for the period
of April’15 to March’16 is illustrated in Figure 2
TANGEDCO has been able to maintain 24 hours of
supply to both urban and rural areas since June
2014. In the current financial year, TANGEDCO has
so far been able to provide reliable supply to its
consumers. During the current year, TANGEDCO
has embarked on supplying 24 hours supply to all
rural and urban consumers. It can be said that
TANGEDCO has already achieved key objectives
of PFA program, i.e. to provide 24X7 electricity to
all its consumers. The other objective of ensuring
electricity access to all consumers has been
already achieved by the State as all HHs in the
State are already connected to the electricity
network.
Figure 2: Monthly Demand and Supply (Peak- MW and Energy-MU, source: TANGEDCO)

Power for All – Tamil Nadu
Page | 7
Table 3: Peak Demand and Energy Availability FY11 to FY16 (Source: TANGEDCO)
Particulars FY11 FY12 FY13 FY14 FY15 FY16
Peak demand and supply
Peak Demand (MW) 11,397 11,622 12,261 13,444 13,771 14,533
Peak Met (MW) 10,670 10,811 11,283 12,764 13,771 14,533
Surplus/ (Deficit) (%) (6.38%) (6.98%) (7.98%) (5.06%) 0.00% 0.00%
Energy requirement and availability
Energy Requirement (CEA) (MUs) 81,949 87,909 91,044 91,284 97,026 100,319
Energy Available (TANGEDCO) (MUs) 74,845 77,102 74,872 85,830 94,128 99,691
Energy Shortage (%) (8.67%) (12.29%) (17.76%) (5.97%) (2.99%) (0.63%)
The PFA program, thus focuses on maintaining
adequate generation capacity with commensurate
transmission capacity and strengthening of
distribution infrastructure to continue supply of
24X7 reliable electricity to all connected
consumers, including industrial and commercial
consumers.
3.2. Consumer and Sales Mix
TANGEDCO is the sole distribution licensee in
Tamil Nadu. At the end of FY16, it had a consumer
base of over 2.6 crores. Substantial quantum of
sales is contributed by subsidized consumer
categories including domestic (30%) and
agricultural supply (15%). This sales mix offers
limited advantage to the utility, as the share of
subsidizing industrial sales is about 35% in overall
retail sales during FY16
This must be seen in light of Tamil Nadu being a
highly industrialized State and a manufacturing hub
for numerous industries. The utility has encouraged
the utilization of open access and various industrial
consumers have shifted to sourcing power through
open access or setting up their own captive
generation units. In FY16 the share of open access
energy in Industrial and commercial sales was
about 29.29%.
Industrial consumers are about 2% of total
consumers, these consumers have the highest
contribution towards energy sales with total share
of 35% as can be seen in Figure 3 . There has been
significant addition in the consumer base across the
categories as inferred from the category wise
consumers and sales growth trend. In terms of
consumers, domestic consumers account for
highest share of 76%, contributing around 30% of
total energy sales.
TANGEDCO has high share of agricultural sales
(15%) contributed by 20 Lac unmetered agriculture
consumers out of total 32 Lacs unmetered
consumers in the State.
3.3. Methodology for Demand Projections
In line with the objective of PFA program, to provide
24X7 power to all HHs, the demand projection has
been calculated separately for rural and urban HHs.
whereas, for rest of the consumer categories a
Domestic , 23929, 30%
Commercial , 8860, 11%
Industrial , 28136, 35%
Agriculture, 11548, 15%
PWW&PLL, 2232, 3%
Others, …
Sales Mix in MUs (FY16)
Industrial , 598949,
2%
Commercial ,
2781596, 10%
Agriculture, 2064453,
8%
Domestic , 20130488,
76%
Others, 1090239,
4%
Consumer Mix (Nos.) FY16
Figure 3: Consumer and Sales Mix (FY16)

Power for All – Tamil Nadu
Page | 8
growth rate based on TANGEDCO’s estimation of
the expected growth along with a review/ validation
with the past trend has been considered. The
following steps detail out the approach adopted for
estimation of energy requirement for the State.
Estimation of Rural and Urban electrified and
un-electrified HHs
Based on the available census data for 2011,
extrapolated with past 10 years CAGR Estimation
of number of rural and urban HHs are done.
In addition to the level of electrification in rural areas
as per 2011 census data, the actual rural HHs
electrified since 2011 has been considered to arrive
at the present level of electrification. In case of
urban areas, the same level of access as in 2011
census (in percentage terms) has been assumed
on the estimated HH numbers to arrive at the
number of existing un-electrified HHs. Also actual
data of electrification is considered into the
calculation. It is noteworthy that the state has
already achieved 100% electrification of both urban
and rural households. Therefore, there is no
additional energy demand from the electrification of
un-electrified HHs in the State.
Estimation of Energy Requirement from HHs
The energy requirement from domestic category
consumers (HHs) has been estimated using the
end use method under the following categories:
a) Latent demand from existing HHs on
account of increase in specific consumption
(kWh/HH/day) for each of the electrified HH
due to life style advancements and natural
growth;
b) Additional energy requirement due to
construction of new urban and rural HHs;
Latent demand growth from already electrified HHs
has been estimated based on expected increase in
consumption levels in accordance with the
objectives of the PFA program. Accordingly it is
expected that the daily HH consumption in urban
areas will increase from 4.54 kWh in FY16 to 5.10
kWh by FY19. Similarly, daily rural HH consumption
will increase from 1.97 kWh in FY16 to 2.22 kWh by
FY19 as illustrated in Table 4.
Table 4: Per HH per day consumption (kWh)
Particulars FY16 FY17 FY18 FY19
Urban 4.54 4.72 4.91 5.10
Rural 1.97 2.05 2.13 2.22
Since HHs in the state are 100% electrified, no
additional energy requirement will be realized due
to electrification of un-electrified HHs.
However, TANGEDCO has identified 115 nos. un-
electrified remote habitation with a total of 5,787
households. The electrification of these HHs by
conventional mode is not feasible. These
households are proposed to be electrified though
off-grid solutions as they are located in
remote/forest areas. Accordingly, demand arising
out of these HHs is not considered in the overall
demand estimation.
In order to estimate the energy requirement for
newly constructed HHs, the expected number of
newly constructed HHs has been estimated to be
300,000 HHs each per year for both Rural and
Urban areas.
Estimation of Energy Requirement from Other
Consumer Categories
The energy requirement projections from other
consumer categories have been done factoring the
expected natural growth considering the past trend
and current consumption in accordance with the
PFA Roadmap.
The projected demand for different consumer
categories is discussed in the following sub-section.

Power for All – Tamil Nadu
Page | 9
3.4. Demand Projections – TANGEDCO
Based on above steps, the total energy sales for
TANGEDCO is expected to increase by about 7.9%
CAGR from 79,464 MUs in FY16 to 99,753 MUs in
FY19, as presented above in Figure 4. Even with
the expected addition of new HHs and increase in
specific consumption, the percentage share of
energy sales to domestic consumers is expected to
remain stable at nearly 30-40%.
Increase in total energy sales is also attributable to
other than domestic sales, which is expected to
grow at a CAGR of 7% during the period. It can also
be observed from Figure 4, that in line with the sales
to domestic category, the share of energy sales to
other than domestic category consumers is
expected to remain in the range of 60-70%.
TANGEDCO had wheeling sales of about 10,835
MU in FY16. While estimating the future sales from
other than domestic category the wheeling energy
is projected to be 24.3% (FY16 share) of other than
domestic sales. Consequently, the wheeling sales
is expected to increase from current level of 10,835
MUs FY16 to 13,273 MUs in FY19. Accordingly, the
peak required for the wheeling sales have been
projected to increase from 2,007 MW to 2,458 MW
(based on FY16’s estimated peak required for
wheeling sales) for the period FY17 to FY19.
The share of energy requirement from both urban
and rural HHs is projected to grow significantly in
the future. The share of rural HH sales in the sales
to domestic consumers which is about 30% in FY15
is expected to remain almost same in FY19 as can
be seen in Figure 5.
In order to estimate the energy input requirement at
the state periphery, distribution losses and intra-
state transmission losses have been considered.
The energy consumption estimated above
translates into energy requirement at state
periphery, as can be seen in Table 5. It may be
noted that export to Puducherry (about 187 MU) is
included in sales.
The energy requirement at the State periphery (for
retail sales) is likely to increase from 85,926 MU in
FY16 to nearly 1,04,214 MU in FY19. Peak demand
for power has been derived using the actual load
factor for FY16. Accordingly, Peak Demand for
retail sales is expected to grow by about 17% from
FY 16 FY 17 FY 18 FY 19
Sales: New HH 741 1,541 2,406
Sales due to electrification of UE HH - - - -
Sales: Existing HH 23,929 25,604 27,396 29,314
Sales to Other than DomesticCategory plus wheeling
55,535 59,422 63,582 68,033
Total Sales including Wheeling 79,464 85,768 92,520 99,753
Total Retail Sales 68,629 74,174 80,115 86,479
-
20,000
40,000
60,000
80,000
100,000
120,000
Figure 4: Projected Energy Sales in MU (FY 16 to FY19)
Figure 5: Rural and Urban Sales in MU
0
5,000
10,000
15,000
20,000
25,000
30,000
35,000
40,000
FY16 FY17 FY18 FY19
Rural Domestic Sales Urban Domestic Sales

Power for All – Tamil Nadu
Page | 10
12,526 MW in FY16 to 15,192 MW in FY19. The
peak demand due to wheeling consumption is
estimated by using the corresponding wheeling
demand using FY16 values, Total peak of the state
including wheeling energy is expected to increase
from 14,533 MW in FY16 to 17,651 MW in FY19.
Projected energy requirement including wheeling
sales in MU (1,17,487 MU) terms is expected to fall
short of the 18th EPS estimates (1,37,815 MU).
Similarly, the projected peak demand in MW is
expected to fall short of the 18th EPS estimates.
The difference in the peak demand projections is
due to the load factor used in the 18th EPS (65% in
FY16) vis-à-vis the actual load factor witnessed
(78.3 % in FY16).The projected energy requirement
and the peak demand projections up to the period
FY19 are expected to remain much lower than the
18th EPS projections. A comparison of the projected
figures under the PFA Roadmap vis-à-vis the 18th
EPS is shown in Figure 6.
Table 5: Energy Requirement and Peak Demand Projection - TANGEDCO
Particulars Units FY16 FY17 FY18 FY19
Retail Energy sales (Incl. Puducherry) MU 68,629 74,174 80,115 86,479
AT&C losses (excluding Transmission loss) % 17.52% 16.09% 15.24% 14.41%
Collection Efficiency % 99.02% 99.02% 99.02% 99.02%
Distribution losses % 16.71% 15.26% 14.40% 13.56%
Intra-state Transmission Loss % 4.11% 4.00% 4.00% 4.00%
Energy Input Requirement for retail sales MU 85,926 91,179 97,492 104,214
Load Factor % 78.31% 78.31% 78.31% 78.31%
Peak Demand -Retail Sales MW 12,526 13,292 14,212 15,192
Peak Demand Including Wheeling Sales MW 14,533 15,439 16,510 17,651
Figure 6: PFA Projected Energy Req. & Demand vs 18th EPS Projections
FY 16 FY 17 FY 18 FY 19
Peak Demand PFA (MW) 14,533 15,439 16,510 17,651
Peak Demand EPS (MW) 19,489 20,816 22,375 24,057
Energy Reqd. PFA inc Wheeling(MU)
100,319 102,772 109,896 117,487
Energy Reqd. EPS (MU) 111,648 119,251 128,177 137,815
-
20,000
40,000
60,000
80,000
100,000
120,000
140,000
160,000
0
5,000
10,000
15,000
20,000
25,000
30,000
Energ
y R
eqd. (M
U)
Peak D
em
and (
MW
)

Power for All – Tamil Nadu
Page | 11
4. Generation Plan
4.1. Generation Sector in Tamil Nadu
Tamil Nadu Generation and Distribution
Corporation (TANGEDCO) Limited, a company
owned by the Government of Tamil Nadu, is
entrusted with the goal to carry on the business of
power generation and distribution in the state. The
state draws power from its generating stations,
private producers including renewable energy
generators and has allocation from Central
Generating Stations. The details of existing
installed state owned generating capacity and PLF
for FY16 is provided in Table 7.
The total installed capacity in the state, (including
own generating stations, IPPs and central
allocation) is 24,433 MW. Table 6 shows the sector
wise break-up of the installed capacity. The share
of thermal stations in the installed capacity stands
at 51%. The State sources contribute to 31% of
installed capacity (51% excluding RE Sources),
whereas the private sector comprising of mostly RE
sources contributes 39% of the installed capacity.
Break-up of the installed capacity by ownership and
source is provided in Table 6.
During the period FY16 to FY19 the peak demand
(including wheeling demand) and energy
requirement (including wheeling sales) is expected
to increase from 14,533 MW and 1,00,319 MU in
FY16 to 17,651 MW and 1,17,487 MU in FY19. In
order to meet this increase in demand, the state
needs to plan for either development of its own
generation capacity or tie up with central generating
stations/ IPPs. This chapter describes the
readiness of the state for meeting the projected
power demand scenario and highlights the future
plans and forward in view of the gaps and issues
identified therein.
Tamil Nadu’s power demand is mostly met by
TANGEDCO and Private Players in the state (78%
of the total installed capacity). The State’s own
generation sources (TANGEDCO) contribute to
more than 31% of the total installed capacity in the
state.
Table 7 contains details of the plants owned by
TANGEDCO. The capacity includes approx. 5,176
MW of thermal sources including 516 MW from gas
based stations. TANGEDCO’s hydel generation
sources contribute 2,308 MW of capacity including
123 MW of small hydro plants (SHPs).These SHPs
are discussed in the renewable energy plan chapter
of this document.
4.2. Generation Plan
The generation plan for the state envisages the
proposed capacity additions by the state along with
the allocated share of upcoming central and IPP
generating stations. The generation capacity
addition and power procurement plans have been
aligned with the energy requirement and power
demand assessed in the earlier sections of this
report.
Inter-State/ Central Sector Projects
The state is expecting capacity additions of about
2,509 MW from thermal sources including co-
generation plants and Central sector’s plants such
as NTPC, NLC and NPCIL. The details of these
plants are shown in Table 10. Further, the existing
allocation from Central sector plants are provided in
Table 8.
Table 6: Installed Capacity (MW) as on 31.03.2016 (Source: TANGEDCO)
Share Sector Thermal Hydro Hydro (RE)
Other RE Total
State 5,176 2,185 123 17 7,501
Central 5,464 0 0 0 5,464
IPP+CPP 1,839 0 0 9,629 11,468
Total 12,479 2,185 123 9,646 24,433
State31%
Centre22%
Private
47%
State Centre Private

Power for All – Tamil Nadu
Page | 12
In addition to the above, the state draws power from
the unallocated shares of central stations. As on
April 2016, 469 MW of unallocated share of central
stations was available to Tamil Nadu
Intra-State/ State Sector Projects
TANGEDCO is undertaking construction of
following four Thermal Power Projects,
660 MW ETPS Expansion project,
1,320 MW Ennore SEZ project,
800 NCTPP Stage III and
1,600 MW Uppur Thermal power project
ETPS Expansion project is expected to achieve
COD by FY19. Ennore SEZ plant is expected by
FY20 (May 2019). Work in respect of NCTPP Stage
III and Uppur Thermal power projects are under
progress and are expected to achieve COD by
2019-20.
In addition to the above, Kundah HEP (500 MW) is
also being developed by TANGEDCO. As EPC
contract for Kundah HEP is yet to be awarded, the
name does not find a place in the above list and the
planned COD for this project is 2020-21. Brief
status update on these projects is as mentioned
hereunder:
1X660 MW ETPS Expansion Project: Imported
coal MOU is already signed between MMTC & TANGEDCO for 2.0 MTPA. Civil, Electrical and Mechanical works of the project are under progress. This project is expected to be commissioned in Jan 2018.
Table 7: Existing State Owned Plants
Name of Plant Fuel Installed
Capacity (MW) PLF
(FY16) Remarks
Ennore Thermal Power Station
Thermal 340
(2x60+2X110) 14.81%
Unit V capacity 110 MW has been excluded from the installed capacity of 450 MW and all parameters for station are calculated for 340MW. The Board of TANGEDCO has approved to keep the unit V under shut down condition till de-commissioning of the station.
Mettur Thermal Power Station I
Thermal 840
(4X210) 81.01% R&M works proposed up to 2018-19
North Chennai Thermal Power Station – Station I
Thermal 630
(3X210) 80.39% R&M works proposed up to 2018-19
Tuticorin Thermal Power Station
Thermal 1,050
(5X210) 76.80% R&M works proposed up to 2018-19
Mettur Thermal Power Station II
Thermal 600
(1X600) 74.49% Commissioned during 2013-14
North Chennai TPS - Station II
Thermal 1,200
(2X600) 61.65% Commissioned during 2014-15
Hydro Plants Existing
Hydro 2,185.2 - Details provided in the annexure
Hydro Plants Existing (RE)
Hydro 122.7 - Details provided in the annexure
Basin Bridge Gas Turbine Power Station-BBGTPS
Naptha 120
(4X30) 1.52%
Only during emergencies the units at BBGTPS are being operated to maintain grid stability as real power generation at BBGTPS is not allowed by Hon’ble TNERC under Merit Order Dispatch due to higher fuel cost. However, Units are being operated under Synchronous condenser mode to improve the voltage profile of the grid.
Kuttalam Gas Turbine Power Station-KGTPS
Natural Gas
101 63.54% Inadequate gas supply (70-75% on an average)
Thirumakottai Gas Turbine Power Station-T(K)GTPS
Natural Gas
107.88 42.12% Inadequate gas supply (55 to 60% on an average)
Valuthur Phase-II Gas Turbine Power Station-VGTPS-II
Natural Gas
92.2 Unit is working with 85% gas supply on an average with effect from 11.10.16 after rectification of major breakdown from 23.1.15 to 26.9.16.

Power for All – Tamil Nadu
Page | 13
It may be noted that Chandrabila coal block
(indigenous coal) was allotted in February 2016 for
TANGEDCO’s ETPS Expansion project, Ennore
SEZ project and Udangudi Stage I projects.
Projects having CoD beyond FY19
2X660 MW Ennore SEZ Supercritical Power
Plant: EPC cum debt finance contract has been
issued. MoU signed with MMTC by TANGEDCO on
25.06.2012 for 4.549 MTPA 100% import coal.
Chandrabila coal block (indigenous coal) was
allotted in February 2016 for TANGEDCO’s ETPS
Expansion project, Ennore SEZ project and
Udangudi Stage I projects. The EPC contractor M/s
BHEL has to arrange funds through lender
M/s.PFC as this is an EPC cum debt finance
project.
It may be noted that a court case was ongoing with
regard to this project due to which the works were
stalled. However, on 18.10.16, The Honorable
Supreme Court gave its judgement in favor of
TANGEDCO stating that the contract with BHEL
(EPC contractor) is in order. Work on the project
site has resumed on 19.10.16. The expected COD
for this plant is May 2019.
1,600 MW Uppur Thermal power project: EPC
contract for BTG package and allied civil works
have been issued to M/s BHEL. Civil work is under
progress. MoU with MSTC Ltd for 100% imported
coal linkage (5.01 MTPA) for Uppur Thermal power
project has been signed. Coal block allotment for
this plant is yet to be received for indigenous coal.
Techno-commercial bid for BOP was opened on
19.9.16 and is under evaluation. Notice Inviting
Tender (NIT) for sea water intake and outfall system
opened on 26.10.16 and under evaluation.
Expected COD for this plant is FY20.
1X800 MW North Chennai Thermal Power Plant-
Stage III: LOA for BTG package and allied civil
works has been issued to BHEL. With regard to
fuel, MoU with MSTC Ltd for 100% imported coal
linkage (2.51 MTPA) has been signed. It may be
noted that Coal block allotment for indigenous coal
is yet to be received. Civil works are under
progress. LOI was issued on 28.10.16 for BOP
package to M/S BGRESL and work has
commenced. The expected COD for this plant is by
FY20.
2X660 MW Udangudi Project (Stage I): The EPC
contract for the project is yet to be awarded.
TANGEDCO has signed MOU with MMTC for 4.5
MMTPA for supply of imported coal. The plant is
expected to be available by FY21.
4X125 MW Kundah Pumped Storage Hydro
Electric Plant: The plant is expected to be
operational by FY21. TANGEDCO has availed loan
for this plant from REC.
The financing details and the funding options for the
above plants are provided in Table 14.
Generation Plan of IPPs
TANGEDCO has sources from various private
generating stations, this include generators,
Pillaiperumalnallur GTPP, Madurai Power
Corporation, TAQA Neyveli Power Company,
LANCO Tanjore Power Company, Pioneer power
limited.
Total of 3,830 MW from LTOA (Long term open
access) and MTOA (Medium term open access) are
available from various privately owned thermal
power plants.
Table 8: Plant wise allocated capacity from CGS (April 2016)
Name of Plant Plant type Installed Capacity (MW) Allocated Capacity (MW)
Ramagundam St. I,II and III Thermal 2,600 663
Talcher St. II Thermal 2,000 490
Simhadri STPS St.II U#1,2 Thermal 1,000 223
Valuthur-Phase-I Gas Turbine Power Station-VGTPS-I
Natural Gas
95 86.42% Unit is working with 85% gas supply on an average.
Total 7,484

Power for All – Tamil Nadu
Page | 14
Name of Plant Plant type Installed Capacity (MW) Allocated Capacity (MW)
NLC TPS-I Thermal 600 475
NLC TPS-II St. I Thermal 630 190
NLC TPS-II St. II Thermal 840 284
NLC TPS-I Exp. Thermal 420 228
NLC TPS-II Exp. U#1,2 Thermal 500 271
Vallur STPS U# 1, 2 & 3 Thermal 1,500 1,067
NTPL Tuticorin U# 1,2 Thermal 1,000 415
Madras APS Nuclear 440 331
Kaiga APS U# 1 & 2 Nuclear 440 228
Kudankulam NPP U# 1 Nuclear 1,000 563
ER plants Thermal 35
12,970 5,463
Table 9: Plants under Construction (State)
Name of Plant Proposed Capacity (MW)
Remarks
ETPS Expansion Project 660
LOI for Construction was issued on 30.5.14. Expected COD is during 2018-19. Funding through PFC (80%) and TANGEDCO (20%) Imported coal MoU signed between MMTC & TANGEDCO (2.0 MTPA) Chandrabila coal block allotment given to TANGEDCO for ETPS Expansion project, Ennore SEZ project and Udangudi Stage I)
Ennore Sez Supercritical Thermal Power Project
1,320
Judgment has been received on 18.10.16 from Supreme court in favour of TANGEDCO stating that the contract placed on M/s BHEL is in order. Work has resumed on 19.10.16. and M/s BHEL will arrange funds through lender M/s.PFC as this is an EPC cum debt finance project.
Kundah Pumped Storage Hydro Electric Project
500
The tenders for EPC Packages I & II were opened on 10.11.2016.and are currently under evaluation. Tender for E&M works EPC Package III is proposed to be floated by 02/2017. Funding is arranged from REC. Administrative approval for Phase II and Phase III was accorded by the Board of TANGEDCO. This is to be taken up after 6 months from floating Tenders for Package III of Phase I. This Project is programmed to be commissioned in 2020-21.
Uppur Thermal power project
1,600
EPC contract for BTG package and allied civil works issued to M/s BHEL. Civil work under progress. Techno-commercial bid for BOP opened on 19.9.16 and under evaluation. Notice Inviting Tender for sea water intake and outfall system opened on 26.10.16 and under evaluation. Funding to be arranged from PFC. Expected COD 2019.-20
NCTPP Stage III 800
LOA for BTG package and allied civil works has been issued to BHEL. Civil work under progress. LOI for BOP was issued on 28.10.16 to M/s BGRESL and works have commenced. Funding arranged from REC. Expected COD 2019-20..
Table 10: Capacity addition MW (State and Central Sources)
Project Capacity
Installation/Share EXP COD
Kudankulam APS (Unit 2 -1000MW) 562 FY 17
Kudgi STPP Units-I (2x800MW) 100 FY17
Cogeneration Power Projects 165 FY17
PFBR Kalpakkam (1x500MW) 167 FY18
Neyveli New TPP at Neyveli (2x500 MW) 327 FY18
Kudgi STPP Unit II &III (2x800 MW) 201 FY18
ETPS Supercritical Expansion Project 660 FY19
Neyveli New TPP at Neyveli Unit-II 2x500 MW) 327 FY19
Total 2,509
Power for All – Tamil Nadu
Page | 15
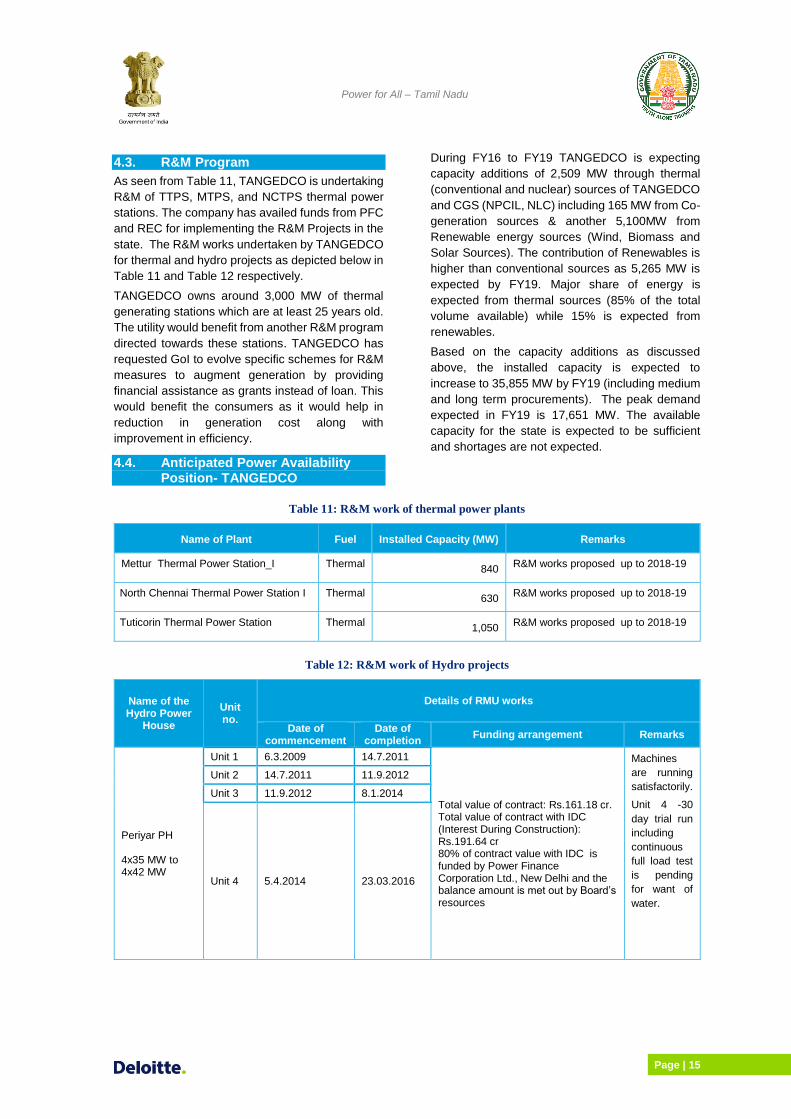
4.3. R&M Program
As seen from Table 11, TANGEDCO is undertaking
R&M of TTPS, MTPS, and NCTPS thermal power
stations. The company has availed funds from PFC
and REC for implementing the R&M Projects in the
state. The R&M works undertaken by TANGEDCO
for thermal and hydro projects as depicted below in
Table 11 and Table 12 respectively.
TANGEDCO owns around 3,000 MW of thermal
generating stations which are at least 25 years old.
The utility would benefit from another R&M program
directed towards these stations. TANGEDCO has
requested GoI to evolve specific schemes for R&M
measures to augment generation by providing
financial assistance as grants instead of loan. This
would benefit the consumers as it would help in
reduction in generation cost along with
improvement in efficiency.
4.4. Anticipated Power Availability Position- TANGEDCO
During FY16 to FY19 TANGEDCO is expecting
capacity additions of 2,509 MW through thermal
(conventional and nuclear) sources of TANGEDCO
and CGS (NPCIL, NLC) including 165 MW from Co-
generation sources & another 5,100MW from
Renewable energy sources (Wind, Biomass and
Solar Sources). The contribution of Renewables is
higher than conventional sources as 5,265 MW is
expected by FY19. Major share of energy is
expected from thermal sources (85% of the total
volume available) while 15% is expected from
renewables.
Based on the capacity additions as discussed
above, the installed capacity is expected to
increase to 35,855 MW by FY19 (including medium
and long term procurements). The peak demand
expected in FY19 is 17,651 MW. The available
capacity for the state is expected to be sufficient
and shortages are not expected.
Table 11: R&M work of thermal power plants
Name of Plant Fuel Installed Capacity (MW) Remarks
Mettur Thermal Power Station_I Thermal 840
R&M works proposed up to 2018-19
North Chennai Thermal Power Station I Thermal 630
R&M works proposed up to 2018-19
Tuticorin Thermal Power Station Thermal 1,050
R&M works proposed up to 2018-19
Table 12: R&M work of Hydro projects
Name of the Hydro Power
House
Unit no.
Details of RMU works
Date of commencement
Date of completion
Funding arrangement Remarks
Periyar PH 4x35 MW to 4x42 MW
Unit 1 6.3.2009 14.7.2011
Total value of contract: Rs.161.18 cr. Total value of contract with IDC (Interest During Construction): Rs.191.64 cr 80% of contract value with IDC is funded by Power Finance Corporation Ltd., New Delhi and the balance amount is met out by Board’s resources
Machines
are running
satisfactorily.
Unit 4 -30
day trial run
including
continuous
full load test
is pending
for want of
water.
Unit 2 14.7.2011 11.9.2012
Unit 3 11.9.2012 8.1.2014
Unit 4 5.4.2014 23.03.2016

Power for All – Tamil Nadu
Page | 16
Name of the Hydro Power
House
Unit no.
Details of RMU works
Date of commencement
Date of completion
Funding arrangement Remarks
Sholayar PH I 2x35 MW to 2x42 MW
Unit 1 and 2
RMU works contract has been awarded to M/s.Andritz Hydro Pvt. Ltd.(AHPL) during May 2015 Machine has been handed over to AHPL for carrying out reverse engineering works on 23 Dec 2015. The works have been completed in April2016.
Total value of contract: Rs.90.45 cr. Total value of contract with IDC: Rs.110.94 cr. 80% of contract value with IDC is to be availed from Power Finance Corporation Ltd., New Delhi and the balance amount is to be met out by Board’s resources
While estimating the energy available, existing PLF
of thermal units of TANGEDCO and CGS were
used. TANGEDCO’s own hydro plants are
projected at actual PLF. For new Central and
Private Thermal Generating Stations average PLF
of 85% is used. Hydro stations are projected at 50%
PLF whereas the RE (Solar and Wind) units are
projected at 7% PLF.
TANGEDCO’s own thermal units have been
projected as per the estimates provided by
TANGEDCO.
Figure 7: Energy available from various sources
(MU)
Further, plants which have high power purchase
cost have not been considered. For estimating the
peak available, NEP norms were used.
Auxiliary energy consumption of all state thermal
and hydro stations including pumping energy for
Kadamparai Pumped Storage Plant is estimated at
8.4% (FY16 value).
It can be seen that the due to addition of plants in
the state the renewable energy share is expected
to remain at the level of 15-16% during FY17 to
FY19.
4.5. Key Issues
Coal Allocations and Availability.
As per the terms of the FSAs the linkages from
indigenous coal fields are to the order of 19.55
MMTPA for FY2015-16. Against this linkage,
TANGEDCO has received about 15.50 MMTPA in
FY2015-16. This shortage between linkage and
actual availability is due to multiple reasons.
TANGEDCO has requested The Ministry of Coal
and Ministry of Railways to arrange for suitable
solution to resolve the issues in supply and
transportation of full quantum of indigenous coal as
per FSA.
TANGEDCO is allocated BOBRN (Bogie Open
Bottom Release) type wagons for transporting coal
from Talcher mines to Paradip Port. Allocation of
wagons by Railways is not sufficient to cater to the
requirements of TANGEDCO resulting in less
realization of coal against the linkage quantity.
TANGEDCO has periodically taken up the short
supply of rakes issue with top officials of East Coast
Railways (ECoR)/Bhubaneswar. As per daily
programme, ECoR has to allot approx. 10 BOBRN
rakes/day from Talcher coal fields.
Further, TANGEDCO has also been allocated
approximately 2 BOXN rakes for supply of coal to
MTPS II (FSA 2012) from Talcher mines. This type
of wagon is suitable for unloading via wagon tippler,
however due to various reasons the wagons are
unloaded manually which causes delays and
ultimately lesser realization of coal against the
linkage quantity. Since the landed cost of coal
received from Talcher is cheaper than the landed
cost of coal received from ECL/Haldia and MCL/IB
Valley, TANGEDCO requested CIL to supply the full
linkage quantity from Talcher sidings. TANGEDCO
received only 105.24 Lakh Tonnes (LT) of coal
99,691 110,072 116,557
126,184
-
50,000
100,000
150,000
FY16 FY17 FY18 FY19
Nuclear Thermal
Hydro Hydro(RE)
RE(Others) Total

Power for All – Tamil Nadu
Page | 17
against the linkage of 152.24 LT form Talcher
sidings for the FY2015-16, with realization of 69%
only.
Further, for FY17 (upto Oct 2016), TANGEDCO has
received only 43.35 LT of coal against the linkage
of 87.28 from Talcher Sidings. This is about 50% of
the total linkage.
Table 13: Energy Available for TANGEDCO (Including Wheeling and Aux consumption) MU
Nuclear Thermal Hydro Hydro (RE) Other RE Total
FY16
Central 4,999 24,158 - - 37 29,194
Private - 20,957 - - 14,831 35,788
State - 30,069 4,174 459 7 34,709
Total 4,999 75,184 4,174 459 14,875 99,691
Aux 2,871
Wheeling and losses 10,899
Net Available 85,926
FY17
Central 5,233 32,826 - - 37 38,097
Private - 16,666 - - 16,851 33,517
State 0 33,043 4,950 459 7 38,458
Total 5,233 82,535 4,950 459 16,895 110,072
Aux 2,770
Wheeling 11,593
Net Available for retail sales 95,709
FY18
Central 5,233 37,096 - - 37 42,367
Private - 16,666 - - 18,851 35,517
State - 33,260 4,950 457 7 38,674
Total 5,233 87,022 4,950 457 18,895 116,557
Aux 2,788
Wheeling 12,405
Net Available for retail sales 1,01,364
FY19
Central 5,233 41,157 - - 37 46,427
Private - 16,666 - - 20,416 37,082
State - 37,260 4,950 457 7 42,674
Total 5,233 95,082 4,950 457 20,460 126,184
Aux 3,794
Wheeling 13,273
Net Available for retail sales 1,09,787

Power for All – Tamil Nadu
Page | 18
Figure 8: Anticipated Energy Availability for Retails Sales (MU) for TANGEDCO
Figure 9: Anticipated Peak Availability Position of TANGEDCO (MW)
4.6. Fund Requirement
The State Generation Company TANGEDCO has
tied up funds for new and R&M projects in the state.
Since the upcoming projects are executed by PPP
mode, the majority of funds are arranged by the
EPC contractor. Brief on investment plans in the
state in the near future is tabulated in Table 14 &
Table 15 below. Financial tie up of State’s
Generation utility for R&M of old plants as well as
for new Projects is in the form of loan assistance for
capital and R&M works for Thermal stations availed
from PFC/REC.
FY 16 FY 17 FY 18 FY 19
Requirement for Retail Sales 85,926 91,179 97,492 1,04,214
Available 85,926 95,709 1,01,364 1,09,787
Surplus/(Deficit) (0) 4,530 3,873 5,573
-20,000
0
20,000
40,000
60,000
80,000
1,00,000
1,20,000
FY 16 FY 17 FY 18 FY 19
Peak Demand inc Wheeling 14,533 15,439 16,510 17,651
Peak Met 14,533 15,439 16,510 17,651
Surplus/(Deficit) - - - -
0
2,000
4,000
6,000
8,000
10,000
12,000
14,000
16,000
18,000
20,000

Power for All – Tamil Nadu
Page | 19
Table 14: Investment Plan in (Rs. Cr.)
Project FY16 FY17 FY18 FY19 Beyond
FY19 Total
Funding
Agency
ETPS Expansion Project (1x660
MW- Super –Critical) 500 1,200 1,200 700 321 3,921 PFC
Ennore SEZ Thermal Power
Projects (2x660 MW) 441 2,303 5,292 1,764 0 9,800
EPC cum
Debit
Finance
Contract
NCTPS Stage-III (1x800 MW) 0.25 800 1607.71 1607.71 1343.6 5359.27
REC
Uppur Thermal Power Project
(2x800 MW) 7.75 89.74 3133.57 4178.10 3133.57 10542.73 PFC
Kundah Pumped Storage HEP 140 315 375 600 315 1,745 REC
Total 1,089 4,708 11,608 8,850 5,113 31,368
Table 15: R&M Plan Thermal (Rs.Cr.)
Sl. Description Amount in Rs. Cr.
I. Tuticorin Thermal Power Station
1 2015-16 23.76
2 2016-17 111.62
3 2017-18 176.32
4 2018-19 87.56
Total 399.26
II. Mettur Thermal Power Station –I
1 2015-16 62.39
2 2016-17 106.84
3 2017-18 98.13
4 2018-19 78.77
Total 346.13
II. North Chennai Thermal Power Station –I
1 2015-16 2.48
2 2016-17 1.87
3 2017-18 20.95
4 2018-19 21.61
Total 46.91
Grand Total for 3 Plants 792.3
4.7. Action Plan & Support Required
As discussed in the previous sections, TANGEDCO would need funding support for the generation plan as well as the R&M plan. In addition, some issues
like water cess and allocation of wagons by Indian Railways may need Central Government’s interventions. A summary of these action points and support requirements for generation plan are covered in Table 16 below:
Table 16: Action points for Generation Plan
Agency Action Plan
TANGEDCO Funding arrangements for R&M of older plants (which are being arranged through REC/PFC loans)
CEA Review R&M program of TANGEDCO and develop appropriate scheme for carrying out these
works.
Railways Address the allocation of wagons for TANGEDCO at the Paradeep port
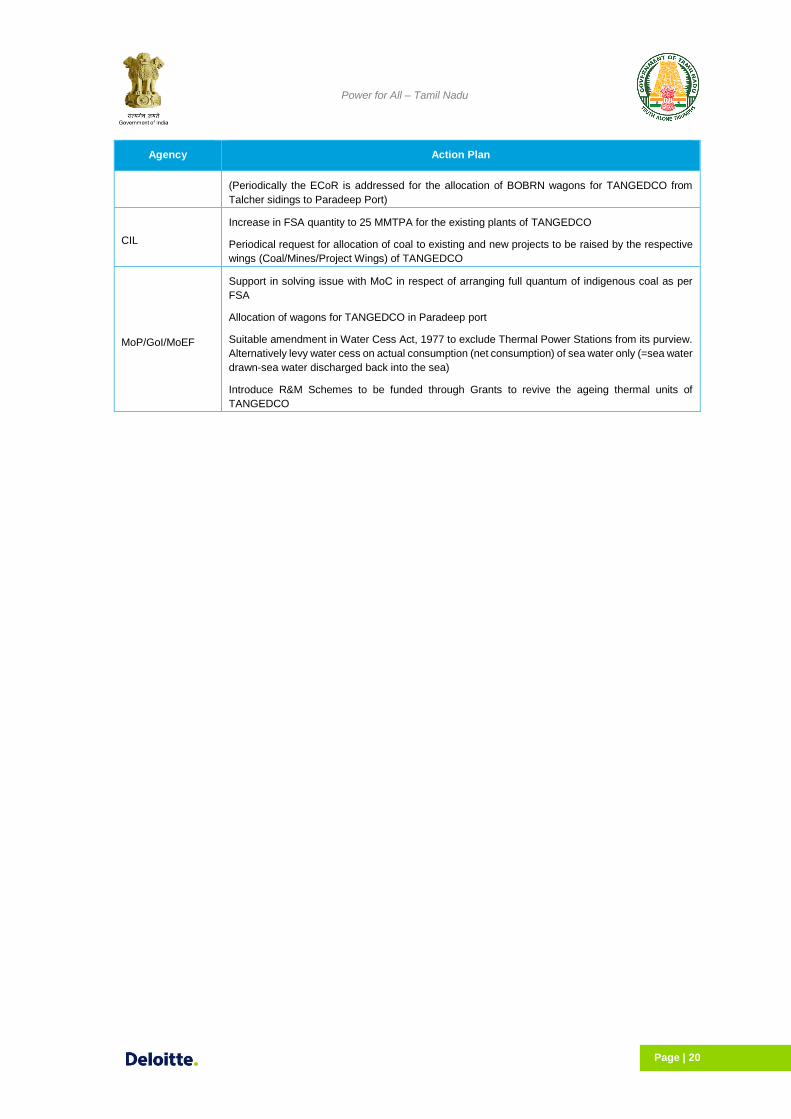
Power for All – Tamil Nadu
Page | 20
Agency Action Plan
(Periodically the ECoR is addressed for the allocation of BOBRN wagons for TANGEDCO from
Talcher sidings to Paradeep Port)
CIL
Increase in FSA quantity to 25 MMTPA for the existing plants of TANGEDCO
Periodical request for allocation of coal to existing and new projects to be raised by the respective
wings (Coal/Mines/Project Wings) of TANGEDCO
MoP/GoI/MoEF
Support in solving issue with MoC in respect of arranging full quantum of indigenous coal as per
FSA
Allocation of wagons for TANGEDCO in Paradeep port
Suitable amendment in Water Cess Act, 1977 to exclude Thermal Power Stations from its purview.
Alternatively levy water cess on actual consumption (net consumption) of sea water only (=sea water
drawn-sea water discharged back into the sea)
Introduce R&M Schemes to be funded through Grants to revive the ageing thermal units of
TANGEDCO

Power for All – Tamil Nadu
Page | 21
5. Transmission Plan
5.1. Transmission capacity requirement
The planning and development of intra-state
transmission system in the state is undertaken by
Tamil Nadu Transmission Corporation
(TANTRANSCO). A well planned and strong
transmission system will ensure not only optimal
utilization of transmission capacities but also of
generation facilities and would further facilitate
achieving ultimate objective of cost effective
delivery of reliable power to end consumers.
The requirement of electricity in energy and peak
demand (Including wheeling energy) for the State is
expected to increase from the present level of
1,00,319 MU and 14,533 MW in FY16 to 1,17,487
MU and 17,651 MW in FY19.
The state’s generation plan as detailed in previous
Chapter of this report outlines the upcoming
projects in the state in addition to the allocation from
central stations and other licensees. A total of 7,609
MW is expected to be added to the existing system
by FY19 for meeting the peak demand requirement
of 17,651 MW. The existing transmission system is
adequate for evacuation and transmission of power
and the transmission plan proposed in this chapter
aims at ensuring adequacy of transmission
infrastructure for evacuation of such power from the
inter-state boundary and proposed generating
plants within the State to the end consumers
located across various geographies of the State.
5.2. Existing Transmission System
Intra-State Transmission System
The intra-state system is maintained and operated
by TANTRANSCO, which is a subsidiary of TNEB
Limited. The company was formed when the
erstwhile Tamil Nadu Electricity Board was
restructured in Nov, 2010 into corporate entities.
As on 31.03.2016, TANTRANSCO operates and
maintains a transmission network of 30,331.6 ckm
of Extra High Voltage Transmission lines along with
908 sub-stations (400/230/110/66 kV) having total
transformation capacity of 59,953 MVA, spread
over the entire stretch of the State of Tamil Nadu.
The existing transformation capacity and line length
(400kV, 230 kV, 110 kV, 66 kV) of TANTRANSCO
network is summarized in Table 17.
The availability of TANTRANSCO’s transmission
system is at par with other leading state
transmission utilities in the country. However, the
existing capacity of intra-state transmission system
is enhanced year by year for meeting the demand
in the State.
Inter-State Transmission System
The interstate transmission system is operated and
maintained by PGCIL. The present inter-state
network consists of 8,127 ckm of lines and 9,300
MVA Substations.
Table 17: Intra-state Transmission System, March 2016
Voltage level Ckt km lines No of SS MVA
400 kV 2,700.53 6 6,010
230 kV 9,084.61 89 20,140
110 kV 17,463.49 807 33,750
66 kV 1,082.96 6 53.75
Total 30,331.6 908 59,953.75
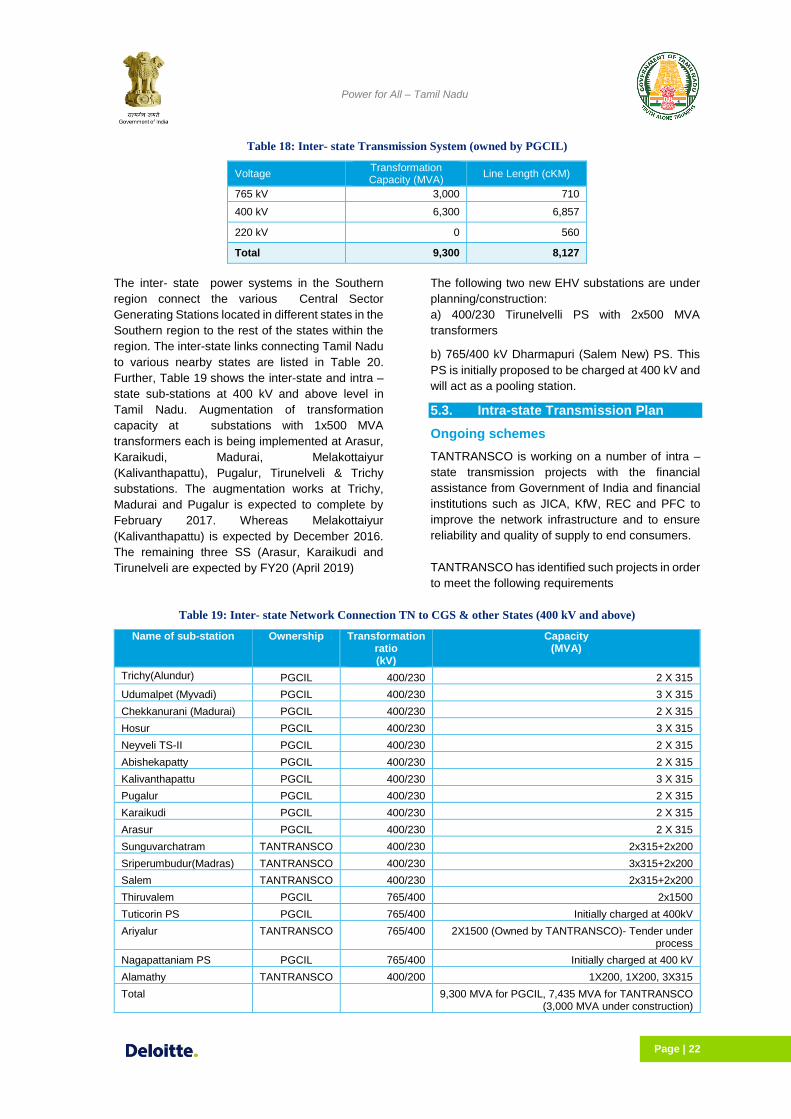
Power for All – Tamil Nadu
Page | 22
Table 18: Inter- state Transmission System (owned by PGCIL)
Voltage Transformation Capacity (MVA)
Line Length (cKM)
765 kV 3,000 710
400 kV 6,300 6,857
220 kV 0 560
Total 9,300 8,127
The inter- state power systems in the Southern
region connect the various Central Sector
Generating Stations located in different states in the
Southern region to the rest of the states within the
region. The inter-state links connecting Tamil Nadu
to various nearby states are listed in Table 20.
Further, Table 19 shows the inter-state and intra –
state sub-stations at 400 kV and above level in
Tamil Nadu. Augmentation of transformation
capacity at substations with 1x500 MVA
transformers each is being implemented at Arasur,
Karaikudi, Madurai, Melakottaiyur
(Kalivanthapattu), Pugalur, Tirunelveli & Trichy
substations. The augmentation works at Trichy,
Madurai and Pugalur is expected to complete by
February 2017. Whereas Melakottaiyur
(Kalivanthapattu) is expected by December 2016.
The remaining three SS (Arasur, Karaikudi and
Tirunelveli are expected by FY20 (April 2019)
The following two new EHV substations are under
planning/construction:
a) 400/230 Tirunelvelli PS with 2x500 MVA
transformers
b) 765/400 kV Dharmapuri (Salem New) PS. This
PS is initially proposed to be charged at 400 kV and
will act as a pooling station.
5.3. Intra-state Transmission Plan
Ongoing schemes
TANTRANSCO is working on a number of intra –
state transmission projects with the financial
assistance from Government of India and financial
institutions such as JICA, KfW, REC and PFC to
improve the network infrastructure and to ensure
reliability and quality of supply to end consumers.
TANTRANSCO has identified such projects in order
to meet the following requirements
Table 19: Inter- state Network Connection TN to CGS & other States (400 kV and above)
Name of sub-station Ownership Transformation ratio (kV)
Capacity (MVA)
Trichy(Alundur) PGCIL 400/230 2 X 315
Udumalpet (Myvadi) PGCIL 400/230 3 X 315
Chekkanurani (Madurai) PGCIL 400/230 2 X 315
Hosur PGCIL 400/230 3 X 315
Neyveli TS-II PGCIL 400/230 2 X 315
Abishekapatty PGCIL 400/230 2 X 315
Kalivanthapattu PGCIL 400/230 3 X 315
Pugalur PGCIL 400/230 2 X 315
Karaikudi PGCIL 400/230 2 X 315
Arasur PGCIL 400/230 2 X 315
Sunguvarchatram TANTRANSCO 400/230 2x315+2x200
Sriperumbudur(Madras) TANTRANSCO 400/230 3x315+2x200
Salem TANTRANSCO 400/230 2x315+2x200
Thiruvalem PGCIL 765/400 2x1500
Tuticorin PS PGCIL 765/400 Initially charged at 400kV
Ariyalur TANTRANSCO 765/400 2X1500 (Owned by TANTRANSCO)- Tender under process
Nagapattaniam PS PGCIL 765/400 Initially charged at 400 kV
Alamathy TANTRANSCO 400/200 1X200, 1X200, 3X315
Total 9,300 MVA for PGCIL, 7,435 MVA for TANTRANSCO (3,000 MVA under construction)

Power for All – Tamil Nadu
Page | 23
Table 20: Inter and intra state lines in Tamil Nadu (PGCIL)
Name of transmission line Ckt kms Voltage (kV) Inter/intra
Kurnool - Thiruvalem 765kV D/c line 710 765 Inter
SubTotal 710
Almathy - Vallur 400kV D/c line 72 400 Intra
Vallur - Kalivandapattu 400kV D/c line 267 400 Intra
Hosur - Salem 400kV D/c line 250 400 Intra
Tiruvelam – Sriperumbudur 400kV S/c line 85 400 Intra
Madurai – Thirunelveli 400kV D/c line 324 400 Intra
Neyveli TS-I Exp – Nagapattinam 400kV S/c line 57 400 Intra
Nagapattinam – Trichy 400kV D/c line 320 400 Intra
Neyveli TS-II - Neyveli TS-I Exp 400kV S/c line 14 400 Intra
Neyveli TS-II – Nagapattinam PS 400kV S/c line 50 400 Intra
Neyveli – Puducherry 400kV S/c line 68 400 Intra
Puducherry - Sunguvarchatram 400kV S/c line 136 400
Sunguvarchatram - Madras 400kV S/c line 18 400 Intra
Neyveli – Salem 400kV D/c line 354 400 Intra
Salem – Udumalpet 400kV D/c line 289 400 Intra
Trichy – Madurai 400kV S/c line 130 400 Intra
Trichy – Karaikudi 400kV S/c line 98 400 Intra
Karaikudi – Madurai 400kV S/c line 130 400 Intra
Udumalpet – Madurai 400kV S/c line 127 400 Intra
Pugalur - Madurai 400kV D/c line 248 400 Intra
Neyveli TS II - Pugalur 400kV D/c line 398 400 Intra
Udumalpet - Thirunelveli 400kV D/c line 530 400 Intra
Udumalpet - Arasur 400kV D/c line 130 400 Intra
Thirunelveli – Kudankulam 400kV D/c line 144 400 Intra
Thirunelveli – Kudankulam 400kV D/c line 160 400 Intra
Tuticorin - Coastal Energen 400kV quad S/c line 36 400 Intra
Tuticorin PS - Madurai 400kV quad D/c line 190 400 Intra
Coastal Energen - Tuticorin PS 400kV quad S/c line 36 400 Intra
Tuticorin - Tuticorin PS 400kV quad S/c line 62 400 Intra
Tiruvalem - Kalivandapattu 400kV quad D/c line 228 400 Intra
Nellore – Tiruvellum 400kV quad D/c line 346 400 Inter
Tiruvelam - Chitoor 400kV quad D/c line 42 400 Inter
Nellore – Sriperumbudur 400kV D/c line 378 400 Inter
Chittoor – Sriperumbudur(Chennai) 400kV line 95 400 Inter
Bangalore(Somanhalli) – Hosur 400kV S/c line 80 400 Inter
Kolar – Tiruvelam 400kV S/c line 153 400 Inter
Kolar – Hosur 400kV D/c line 138 400 Inter
Thirunelveli – Thiruvananthpuram 400kV D/c line 320 400 Inter
Udumalpet - Pallakad 400kV D/c line 190 400 Inter
Thirunelveli - Edamon 400kV D/c line (Charged at 220 kV)
164 400 Inter
SubTotal 6,857
Kalpakkam - Sirucheri 220kV D/c line 72 220 Intra
Kalpakkam - Arni 220kV D/c line 212 220 Intra
Kalpakkam – Kanchipuram 220kV D/c line 160 220 Intra
Neyveli – Bahoor 220kV S/c line 53 220 Intra
Neyveli - Villianur / Pondy 220kV S/c line 63 220 Intra
Udumalpet –Idukki 133 220 Intra

Power for All – Tamil Nadu
Page | 24
Name of transmission line Ckt kms Voltage (kV) Inter/intra
Sub-Total 693
Kuzhithurai-Parasala 110Kv 4.75 110 inter
Grand Total 8,371.75
a) Meeting demand for power arising from
existing and future end-consumers in various
load centers/ pockets in the state;
b) Providing connectivity for evacuation of power
from various upcoming intra and inter-state
power plants and for onward delivery of such
power to load centers/ drawl points;
c) Improving the availability and reliability of the
intra-state transmission systems in the State;
and
d) Improving availability of intra-state
transmission systems to integrate existing and
upcoming renewable energy sources in the
state.
The plan covers system for intra-state transmission
network strengthening as well as evacuation of
power from State owned generating stations. The
summarized list of ongoing, approved and
proposed capacity additions at various voltage
levels is summarized in Table 21.
The substation and line wise details of ongoing,
approved and proposed intra-state transmission
systems have been provided in the annexures (8-
11).
Out of the 136 proposed substations, the ongoing
schemes for 50 sub-stations and 2,516 kms of
transmission lines were scheduled to be completed
by FY17. While about 86 Substations are scheduled
to be completed in the period FY18 to FY19. This
includes two substations of 765 kV with total
transformation capacity 7,500 MVA is expected to
be available by FY19. Apart from the above, under
Renewable Energy category 8 Nos. of substations
of 8,640 MVA capacity are expected to be available
by FY19. About 7,205 ckt km of lines are expected
to be added to the system by FY19. This investment
plan is rolling in nature and is subject to change on
account of variations in load flows through the
transmission network elements that may result from
deviations in load growth projection vis-a-vis actual
load growth.
TANTRANSCO is focusing on efficient operation
and maintenance practices to provide stable and
quality power with maximum transmission system
availability and minimum transmission system
losses.
5.4. Inter-state Transmission System Plan
Ongoing schemes
PGCIL is executing the following inter-state /inter-
regional transmission projects with an objective to
ease the transmission constraints faced in transfer
of power.
Salem (Dharmapuri) – Madhugiri 765 kV 2xS/C lines (To Be Charged Initially at 400 kV)
Salem (Dharmapuri) – Somanhalli 400kV Quad D/c line
LILO of Kurnool – Thiruvalam 765kV D/c line at Cuddapah
Raigarh – Pugalur ±800kV 6000 MW HVDC Bipole link
Table 21: Proposed capacity additions in SS and Lines by TANTRANSCO
Parameter FY 17 FY 18 FY 19 Total
Substations (Numbers)
765 kV 2 2
400 kV 10 1 2 13
230 kV 16 11 18 45
110 kV 30 30 73 133
Total 56 42 95 193
A. Lines ( Ckt kms)
765 kV 320 320
400 kV 800 800

Power for All – Tamil Nadu
Page | 25
Parameter FY 17 FY 18 FY 19 Total
230 kV 470 500 400 1,370
110 kV 600 630 800 2,030
Total 1,070 1,130 2,320 4,520
For Renewable Energy (Substations- Included in the total numbers above)
400 kV 6 1 0 7
230 kV 1 0 0 1
Total 7 1 0 8
B. For Renewable Energy (Lines in Circuit Km)
400 kV 1,315.5 532 0 1,847.5
230 kV 130 710 0 840
110 kV 0 0 0 0
Total 1,445.5 1,242 0 2,687.5
Total A+B 2,515.5 2,372 2,320 7,205
Transformation capacity (MVA)
765/400 kV 0 0 7,500 7,500
400/230 kV 3,465 945 3,150 7,560
400/110 kV 1,200 0 1,400 2,600
230/110 kV 2,600 1,800 1,200 5,600
230/33 kV 100 800 200 1100
110/33 kV and 110/33 kV 461 436 420 1317
Total 7,826 3,981 13,870 25,677
FOR renewable Energy
Transformation capacity (MVA)
400/230 kV 2,890 630 3,520
400/110 kV 3,000 400 3,400
230/110 kV 1,720 0 1,720
Total 7,610 1,030 8,640
* Subject to the approval of TNERC for the year 2018-19
Other Projects under implementation
Transmission lines planned/under implementation
by PGCIL are as follows:
1) Salem pooling station – Madhugiri pooling station 765 kV S/c initially charged at 400 kV
2) Tuticorin Pooling station – Salem Pooling station 765 kV D/c line initially charged at 400 kV.
3) Salem pooling station – Salem 400 kV D/c (quad) line.
4) Salem New – Somanahalli 400kV Quad D/c line.
5) Installation of STACOM of +200/-200 MVAR with MSC of 2x125 MVAR Reactor & 1x125 MVAR Capacitor at Udumalpet and Trichy substations of POWERGRID
6) Extension of Kudankulam APP – Tirunelveli 400kV Quad D/c line to Tuticorin Pooling Station.
7) Establishment of Pugalur HVDC Stn ±800kV with 6000 MW HVDC terminal.
8) ± 800 kV Raigarh (HVDC Stn) – Pugalur (HVDC Stn) HVDC Bipole link with 6000 MW capacity.
9) Pugalur HVDC Station – Pugalur (Existing) 400kV (quad) D/c line.
10) Pugalur HVDC Station – Arasur 400kV (quad) D/c line.
11) Pugalur HVDC Station – Thiruvalam 400kV (quad) D/c line.
12) Pugalur HVDC Station – Edayarpalayam 400kV (quad) D/c line.
13) Edayarpalayam – Udumalpet 400kV (quad) D/c line.
14) NLC-Karaikal 230kV D/c line (through LILO of the 230kV Neyveli- Bahour S/c line at Karaikal)
15) LILO of existing Neyveli TS-II – Pondycherry 400 kV S/c at NNTPS generation switchyard.
16) NNTPS switchyard – Ariyalur (Villupuram) 400 kV D/c line.
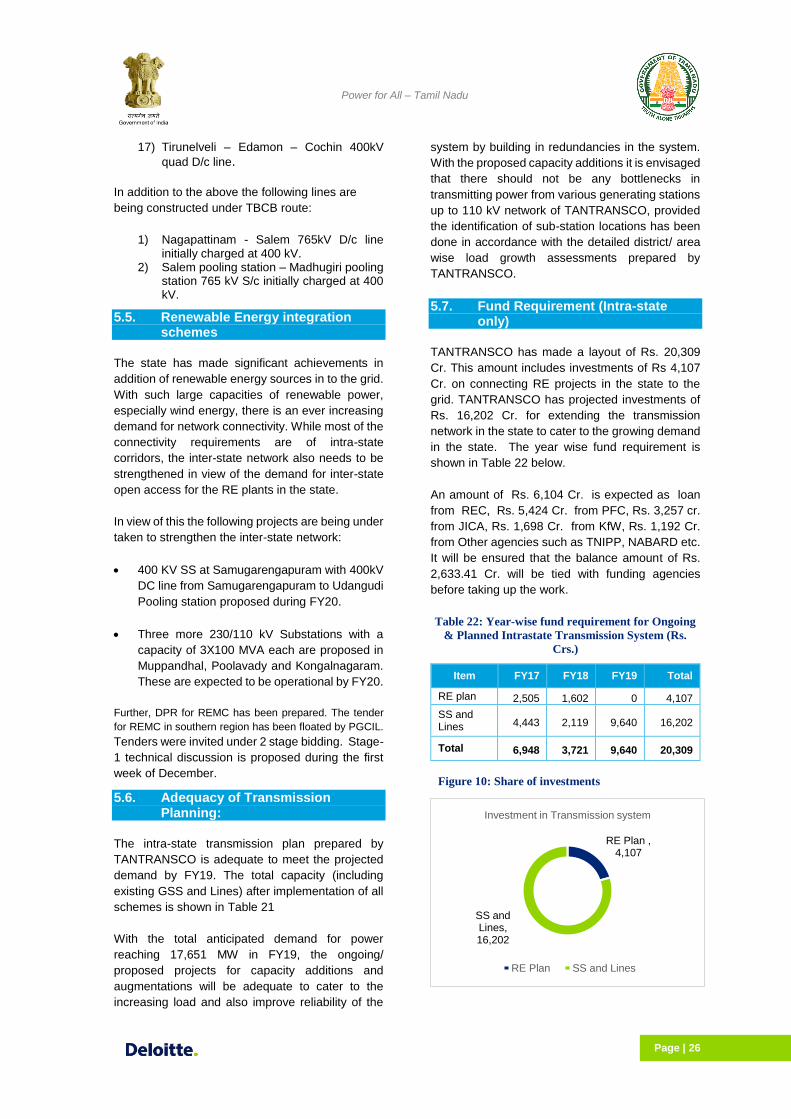
Power for All – Tamil Nadu
Page | 26
17) Tirunelveli – Edamon – Cochin 400kV
quad D/c line.
In addition to the above the following lines are
being constructed under TBCB route:
1) Nagapattinam - Salem 765kV D/c line initially charged at 400 kV.
2) Salem pooling station – Madhugiri pooling station 765 kV S/c initially charged at 400 kV.
5.5. Renewable Energy integration schemes
The state has made significant achievements in
addition of renewable energy sources in to the grid.
With such large capacities of renewable power,
especially wind energy, there is an ever increasing
demand for network connectivity. While most of the
connectivity requirements are of intra-state
corridors, the inter-state network also needs to be
strengthened in view of the demand for inter-state
open access for the RE plants in the state.
In view of this the following projects are being under
taken to strengthen the inter-state network:
400 KV SS at Samugarengapuram with 400kV
DC line from Samugarengapuram to Udangudi
Pooling station proposed during FY20.
Three more 230/110 kV Substations with a
capacity of 3X100 MVA each are proposed in
Muppandhal, Poolavady and Kongalnagaram.
These are expected to be operational by FY20.
Further, DPR for REMC has been prepared. The tender
for REMC in southern region has been floated by PGCIL.
Tenders were invited under 2 stage bidding. Stage-
1 technical discussion is proposed during the first
week of December.
5.6. Adequacy of Transmission Planning:
The intra-state transmission plan prepared by
TANTRANSCO is adequate to meet the projected
demand by FY19. The total capacity (including
existing GSS and Lines) after implementation of all
schemes is shown in Table 21
With the total anticipated demand for power
reaching 17,651 MW in FY19, the ongoing/
proposed projects for capacity additions and
augmentations will be adequate to cater to the
increasing load and also improve reliability of the
system by building in redundancies in the system.
With the proposed capacity additions it is envisaged
that there should not be any bottlenecks in
transmitting power from various generating stations
up to 110 kV network of TANTRANSCO, provided
the identification of sub-station locations has been
done in accordance with the detailed district/ area
wise load growth assessments prepared by
TANTRANSCO.
5.7. Fund Requirement (Intra-state only)
TANTRANSCO has made a layout of Rs. 20,309
Cr. This amount includes investments of Rs 4,107
Cr. on connecting RE projects in the state to the
grid. TANTRANSCO has projected investments of
Rs. 16,202 Cr. for extending the transmission
network in the state to cater to the growing demand
in the state. The year wise fund requirement is
shown in Table 22 below.
An amount of Rs. 6,104 Cr. is expected as loan
from REC, Rs. 5,424 Cr. from PFC, Rs. 3,257 cr.
from JICA, Rs. 1,698 Cr. from KfW, Rs. 1,192 Cr.
from Other agencies such as TNIPP, NABARD etc.
It will be ensured that the balance amount of Rs.
2,633.41 Cr. will be tied with funding agencies
before taking up the work.
Table 22: Year-wise fund requirement for Ongoing
& Planned Intrastate Transmission System (Rs.
Crs.)
Item FY17 FY18 FY19 Total
RE plan 2,505 1,602 0 4,107
SS and Lines 4,443 2,119 9,640 16,202
Total 6,948 3,721 9,640 20,309
RE Plan , 4,107
SS and Lines, 16,202
Investment in Transmission system
RE Plan SS and Lines
Figure 10: Share of investments

Power for All – Tamil Nadu
Page | 27
5.8. Action Plan & Support Required
In line with the proposed transmission plan, the
action points shown in Table 23 have been
identified for respective stakeholders to be able to
make suitable arrangements for making adequate
power transmission systems available for the State
in accordance with the requirements of the PFA
Roadmap:
Table 23: Action Points & Timelines
Stakeholder Action Points
TANTRANSCO
Project monitoring and execution of the network addition plan.
Ensure timely setting up of REMC. (Tenders are expected to be opened during Feb 2017)
Government of India
For schemes which are taken up under international funding viz., JICA and KfW, taxes and duties are not eligible for reimbursement. The taxes and duties for schemes funded by JICA and KfW works out to approx. Rs. 1,000 crores and this may be considered for financial support from Govt.
PGCIL Ensure completion of the inter-state projects as per the timeline proposed in this roadmap
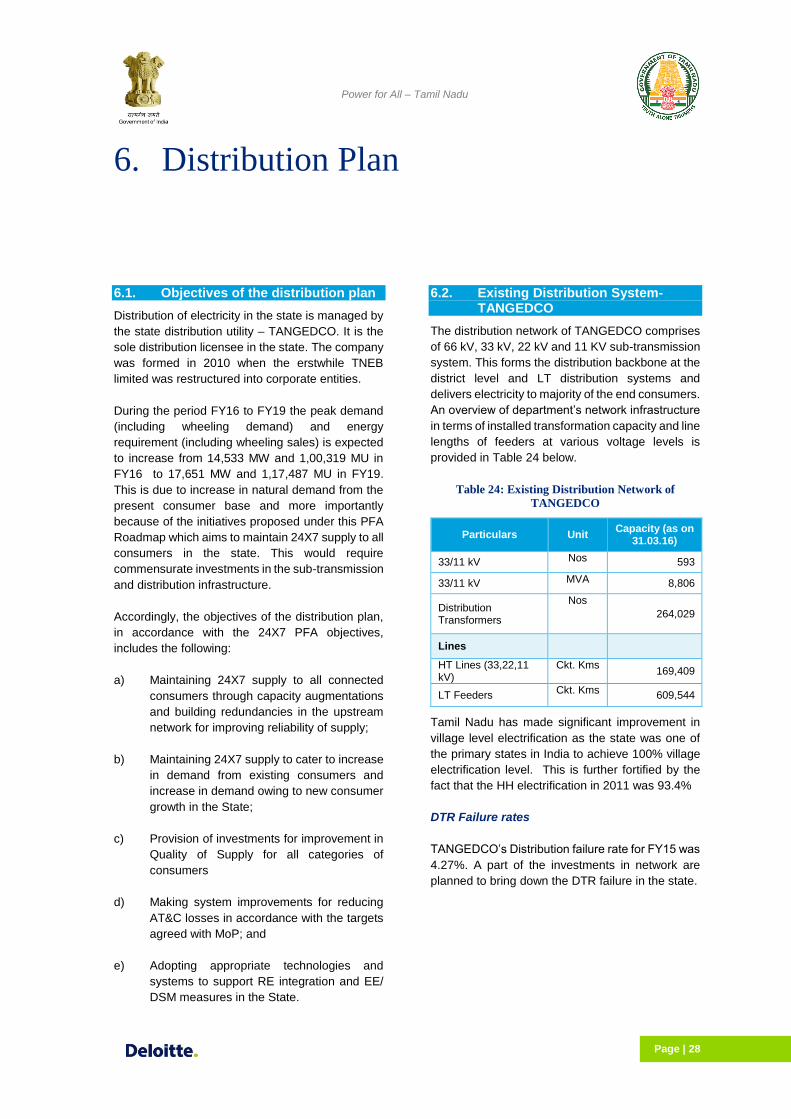
Power for All – Tamil Nadu
Page | 28
6. Distribution Plan
6.1. Objectives of the distribution plan
Distribution of electricity in the state is managed by
the state distribution utility – TANGEDCO. It is the
sole distribution licensee in the state. The company
was formed in 2010 when the erstwhile TNEB
limited was restructured into corporate entities.
During the period FY16 to FY19 the peak demand
(including wheeling demand) and energy
requirement (including wheeling sales) is expected
to increase from 14,533 MW and 1,00,319 MU in
FY16 to 17,651 MW and 1,17,487 MU in FY19.
This is due to increase in natural demand from the
present consumer base and more importantly
because of the initiatives proposed under this PFA
Roadmap which aims to maintain 24X7 supply to all
consumers in the state. This would require
commensurate investments in the sub-transmission
and distribution infrastructure.
Accordingly, the objectives of the distribution plan,
in accordance with the 24X7 PFA objectives,
includes the following:
a) Maintaining 24X7 supply to all connected
consumers through capacity augmentations
and building redundancies in the upstream
network for improving reliability of supply;
b) Maintaining 24X7 supply to cater to increase
in demand from existing consumers and
increase in demand owing to new consumer
growth in the State;
c) Provision of investments for improvement in
Quality of Supply for all categories of
consumers
d) Making system improvements for reducing
AT&C losses in accordance with the targets
agreed with MoP; and
e) Adopting appropriate technologies and
systems to support RE integration and EE/
DSM measures in the State.
6.2. Existing Distribution System- TANGEDCO
The distribution network of TANGEDCO comprises
of 66 kV, 33 kV, 22 kV and 11 KV sub-transmission
system. This forms the distribution backbone at the
district level and LT distribution systems and
delivers electricity to majority of the end consumers.
An overview of department’s network infrastructure
in terms of installed transformation capacity and line
lengths of feeders at various voltage levels is
provided in Table 24 below.
Table 24: Existing Distribution Network of
TANGEDCO
Particulars Unit Capacity (as on
31.03.16)
33/11 kV Nos 593
33/11 kV MVA 8,806
Distribution Transformers
Nos
264,029
Lines
HT Lines (33,22,11 kV)
Ckt. Kms 169,409
LT Feeders Ckt. Kms
609,544
Tamil Nadu has made significant improvement in
village level electrification as the state was one of
the primary states in India to achieve 100% village
electrification level. This is further fortified by the
fact that the HH electrification in 2011 was 93.4%
DTR Failure rates
TANGEDCO’s Distribution failure rate for FY15 was
4.27%. A part of the investments in network are
planned to bring down the DTR failure in the state.

Power for All – Tamil Nadu
Page | 29
Figure 11: District wise Rural & Urban HH Electrification Levels – Tamil Nadu (2011 Census)
Metering
TANGEDCO has 31.97 Lakhs unmetered
consumers as on March 2016. This corresponds to
12% of the total consumers of 2.70 Crores. All of
the 31.97 lakhs consumers belong to only two
categories
Agriculture and Govt.seed farm etc.
Huts in Village panchayats, TAHDCO etc.
TANGEDCO is preparing a metering plan at DTs
associated with unmetered consumers to estimate
the sales to these consumers.
TANGEDCO is aiming for introduction of modern
metering technology for all its consumers. A
quantum of consumers have been included under
DDUGJY and IPDS for replacement of meters.
TANGEDCO seeks GoI support for meeting the
financial requirements for upgrading/replacing
meters for the remaining consumers.
SAIFI SAIDI
TANGEDCO is monitoring SAIFI and SAIDI values
of the R APDRP towns in the state. As per the latest
(Aug 2016) report covering 63 towns and 273
feeders, SAIDI is 2:20 hrs/month (Rank 1 in India
as per URJA app) and SAIFI is 3.47. It may be
noted that the systems of monitoring are still being
updated and the values may not represent the
actual status in the towns. Town wise SAIFI and
SAIDI values are provided in Annexure 19.
AT&C Loss
AT&C loss including ~4% Transmission Loss for the
state during FY10 to FY16 suggests that losses had
increased in FY11 to 24.95% from 21.53 % in FY10,
however due to AT&C loss reduction measures
taken up by the utility the present AT&C loss in
FY16 is 20.91%. (Losses are aggregate of
distribution and transmission system in the state)
Figure 12: AT&C Loss trend for FY10 to FY16
TANGEDCO further is taking full efforts to reduce
the AT&C Loss to a target level of below 15% by
FY19 through distribution strengthening works
under the R-APDRP Scheme (Part B) and by
ensuring formation of enforcement squads to curb
theft of energy. Action is also being planned to be
undertaken on any information received about theft
of energy followed by conducting surprise checks,
raids, etc. on consumer premises.
The activities to be undertaken are detailed in the
following figure.
0.0%
20.0%
40.0%
60.0%
80.0%
100.0%
120.0%
-
200,000
400,000
600,000
800,000
1,000,000
1,200,000C
henna
i
Ka
ncheepura
m
Coim
bato
re
Th
iruvallu
r
Ve
llore
Sa
lem
Tirunelv
eli
Vilu
ppura
m
Ma
dura
i
Tiruchirappa
lli
Tiruppur
Ero
de
Cuddalo
re
Th
anja
vur
Tiruvannam
ala
i
Din
dig
ul
Viru
dhunagar
Ka
nniy
akum
ari
Nam
akkal
Th
ooth
ukkud
i
Krishnagiri
Nagapa
ttin
am
Pu
dukkott
ai
Dharm
apuri
Siv
aganga
Th
eni
Ram
anath
apura
m
Th
iruvaru
r
Ka
rur
Th
e N
ilgiris
Ariyalu
r
Pe
ram
ba
lur
Rural Urban Rural Elec % Urban Elec %
21.53%24.95% 24.22%
21.08%23.16%23.68%
20.91%
5.00%
10.00%
15.00%
20.00%
25.00%
30.00%
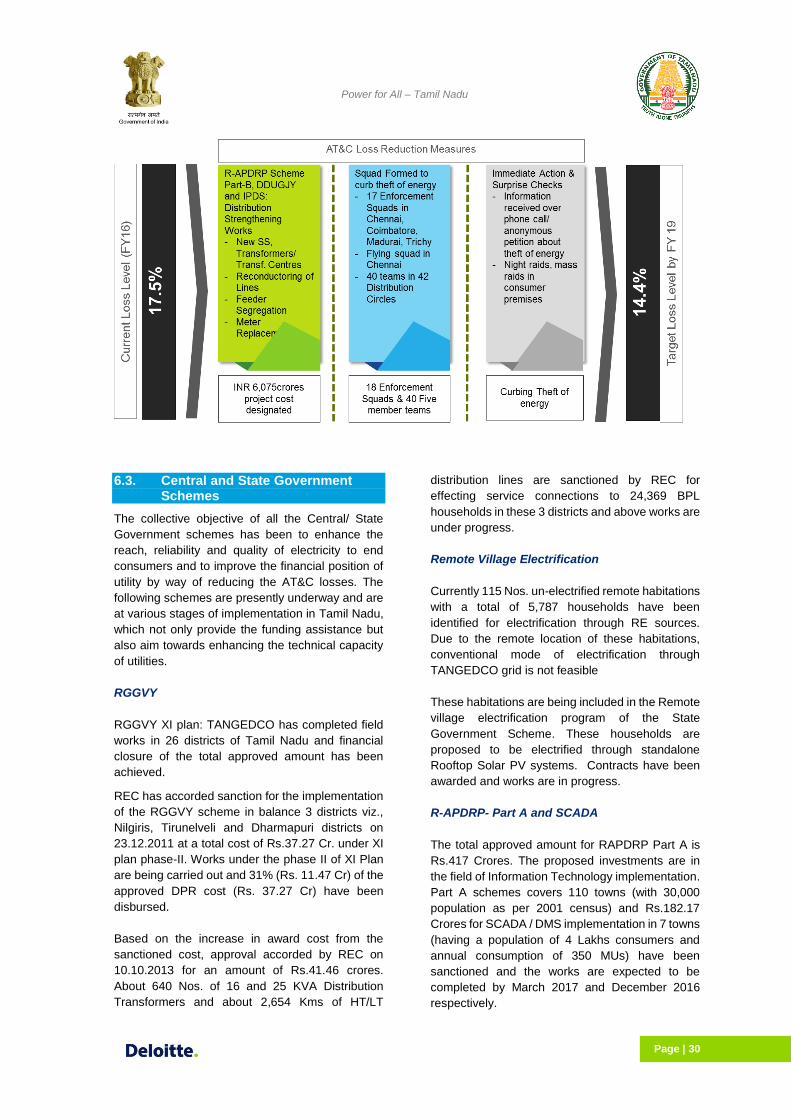
Power for All – Tamil Nadu
Page | 30
6.3. Central and State Government Schemes
The collective objective of all the Central/ State
Government schemes has been to enhance the
reach, reliability and quality of electricity to end
consumers and to improve the financial position of
utility by way of reducing the AT&C losses. The
following schemes are presently underway and are
at various stages of implementation in Tamil Nadu,
which not only provide the funding assistance but
also aim towards enhancing the technical capacity
of utilities.
RGGVY
RGGVY XI plan: TANGEDCO has completed field
works in 26 districts of Tamil Nadu and financial
closure of the total approved amount has been
achieved.
REC has accorded sanction for the implementation
of the RGGVY scheme in balance 3 districts viz.,
Nilgiris, Tirunelveli and Dharmapuri districts on
23.12.2011 at a total cost of Rs.37.27 Cr. under XI
plan phase-II. Works under the phase II of XI Plan
are being carried out and 31% (Rs. 11.47 Cr) of the
approved DPR cost (Rs. 37.27 Cr) have been
disbursed.
Based on the increase in award cost from the
sanctioned cost, approval accorded by REC on
10.10.2013 for an amount of Rs.41.46 crores.
About 640 Nos. of 16 and 25 KVA Distribution
Transformers and about 2,654 Kms of HT/LT
distribution lines are sanctioned by REC for
effecting service connections to 24,369 BPL
households in these 3 districts and above works are
under progress.
Remote Village Electrification
Currently 115 Nos. un-electrified remote habitations
with a total of 5,787 households have been
identified for electrification through RE sources.
Due to the remote location of these habitations,
conventional mode of electrification through
TANGEDCO grid is not feasible
These habitations are being included in the Remote
village electrification program of the State
Government Scheme. These households are
proposed to be electrified through standalone
Rooftop Solar PV systems. Contracts have been
awarded and works are in progress.
R-APDRP- Part A and SCADA
The total approved amount for RAPDRP Part A is
Rs.417 Crores. The proposed investments are in
the field of Information Technology implementation.
Part A schemes covers 110 towns (with 30,000
population as per 2001 census) and Rs.182.17
Crores for SCADA / DMS implementation in 7 towns
(having a population of 4 Lakhs consumers and
annual consumption of 350 MUs) have been
sanctioned and the works are expected to be
completed by March 2017 and December 2016
respectively.

Power for All – Tamil Nadu
Page | 31
Under R APDRP Part A, AMR compatible meters
have been installed in 50,163 Distribution
Transformers, 2,193 Feeders and 2,990 HT
consumers.
GIS Survey has been completed for Consumer
Indexing of 85.89 Lakhs consumers and Assets
Mapping.
SCADA/DMS, Control Centre equipment have
been commissioned in all the 7 towns viz. Chennai,
Madurai, Salem, Tiruppur, Tirunelveli, Trichy &
Coimbatore. Installation & commissioning of
SCADA field equipment and DMS is likely to be
completed by December 2017.
As per the data from R-APDRP website, about
Rs.562 Cr . have been disbursed; TANGEDCO has
sent utilization certificate for an amount of
Rs.218.61 Crores for Part-A (IT) and awaiting for
second tranche of Rs. 125/-crores.
RAPDRP-Part B
RAPDRP Part-B schemes have been sanctioned in
88 towns, which have population above 30,000 as
per Census 2001 and having AT&C losses of more
than 15%. The total value of proposed investments
are Rs. 2,841.21 Crores. The proposed
investments includes the following works are a
measure to bring down losses and improve
reliability of the network:
(i) Establishment of new substations and
Augmentation of existing substations,
(ii) Extension of new HT/LT distribution feeders /
feeder bifurcation / conductor augmentation
works for improving voltage profile,
(iii) HVDS implementation to improve HT:LT ratio,
(iv) Replacement of existing Electromechanical
consumer energy meters with tamper proof
Static meters to reduce losses,
(v) Provision of Automatic Power Factor
Correction panels to improve power factor in
distribution,
(vi) Extension of Aerially Bunched Cables in theft
prone area and densely populated area and
(vii) Provision of wedge connectors in distribution
network to reduce contact resistance.
Further projects worth Rs. 754.13 Crores (under R-
APDRP) proposed to be implemented by
TANGEDCO in 15 towns have been cancelled as
the towns were having AT&C losses of less than
15%.
Integrated Power Development Scheme (IPDS)
TANGEDCO
Under Integrated Power Development Scheme
(IPDS) 37 Nos. Detailed Project Reports (DPRs) for
strengthening of sub transmission and distribution
system works including metering and rooftop solar
panels, covering 522 towns across 37 Nos. EDCs
for a total value Rs.1,561.31 crores has been
sanctioned by MoP/GoI and formal sanction has
been obtained on 07.03.2016. The works are to be
completed by 06.09.2018. For successful
completion of the scheme works within 60% of
project cost i.e Rs.936.8Cr. will be provided by
MoP/GoI as grant.
Table 25: Proposed investments -IPDS
Proposed Works Planned Amount
(Rs. Cr.)
33/11 kV SS (New and capacity Enhancement)
158
HT Feeders and Bay (New and Bifurcation)
484
LT Feeders and Bay (New and Bifurcation)
194
Distribution Transformers 12
HVDS 328
Others 385
Total 1,561
Deen Dayal Upadhyaya Gram Jyoti Yojana-
TANGEDCO
Under the DDUGJY scheme, TANGEDCO has
proposed various network extension, strengthening
and augmentation works in order to develop a
robust sub-transmission and distribution
infrastructure, including provision for providing
access to APL & BPL consumers. The project
covers 27 districts of Tamil Nadu having a total
layout of Rs. 919.52 Cr. The abstract of the
proposed plan is provided in the Annexure 16.
The main objectives of the investments under the
DDUGJY scheme is to strengthen the existing
network in rural areas and improve reliability of
system while improving the quality of supply
Further as a part of feeder segregation plan under
DDUGJY, TANGEDCO proposes to take a pilot
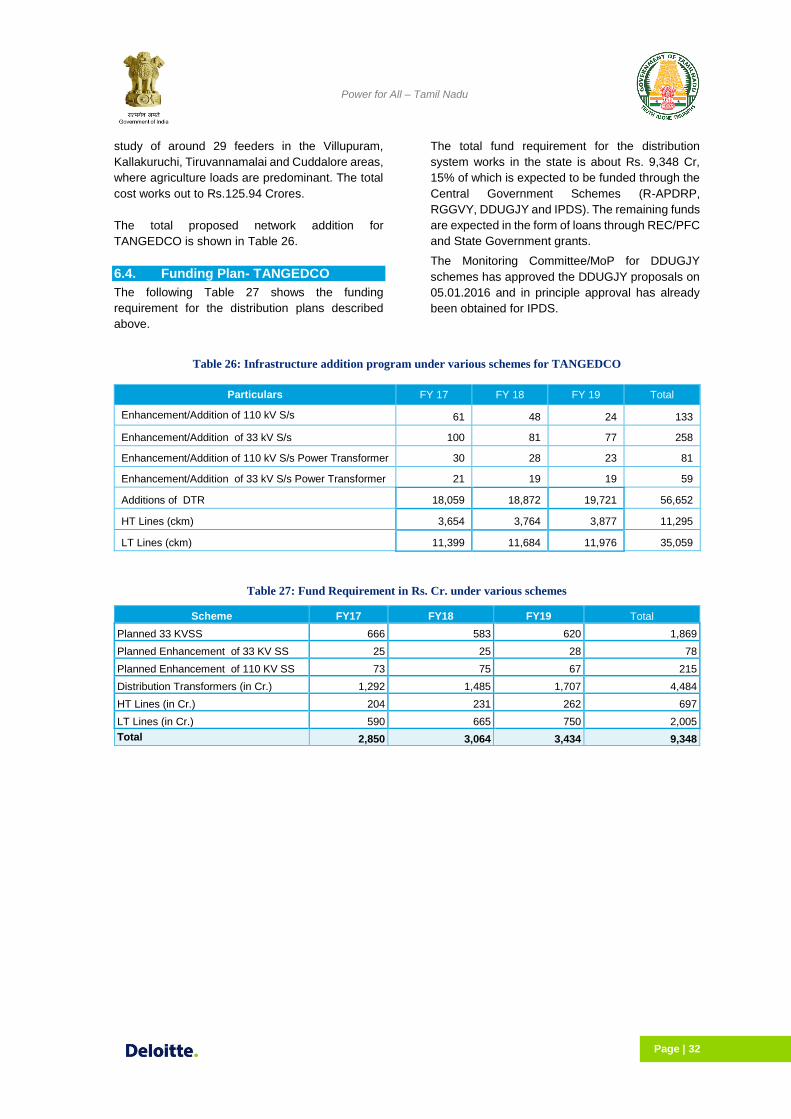
Power for All – Tamil Nadu
Page | 32
study of around 29 feeders in the Villupuram,
Kallakuruchi, Tiruvannamalai and Cuddalore areas,
where agriculture loads are predominant. The total
cost works out to Rs.125.94 Crores.
The total proposed network addition for
TANGEDCO is shown in Table 26.
6.4. Funding Plan- TANGEDCO
The following Table 27 shows the funding
requirement for the distribution plans described
above.
The total fund requirement for the distribution
system works in the state is about Rs. 9,348 Cr,
15% of which is expected to be funded through the
Central Government Schemes (R-APDRP,
RGGVY, DDUGJY and IPDS). The remaining funds
are expected in the form of loans through REC/PFC
and State Government grants.
The Monitoring Committee/MoP for DDUGJY
schemes has approved the DDUGJY proposals on
05.01.2016 and in principle approval has already
been obtained for IPDS.
Table 26: Infrastructure addition program under various schemes for TANGEDCO
Table 27: Fund Requirement in Rs. Cr. under various schemes
Scheme FY17 FY18 FY19 Total
Planned 33 KVSS 666 583 620 1,869
Planned Enhancement of 33 KV SS 25 25 28 78
Planned Enhancement of 110 KV SS 73 75 67 215
Distribution Transformers (in Cr.) 1,292 1,485 1,707 4,484
HT Lines (in Cr.) 204 231 262 697
LT Lines (in Cr.) 590 665 750 2,005
Total 2,850 3,064 3,434 9,348
Particulars FY 17 FY 18 FY 19 Total
Enhancement/Addition of 110 kV S/s 61 48 24 133
Enhancement/Addition of 33 kV S/s 100 81 77 258
Enhancement/Addition of 110 kV S/s Power Transformer 30 28 23 81
Enhancement/Addition of 33 kV S/s Power Transformer 21 19 19 59
Additions of DTR 18,059 18,872 19,721 56,652
HT Lines (ckm) 3,654 3,764 3,877 11,295
LT Lines (ckm) 11,399 11,684 11,976 35,059

Power for All – Tamil Nadu
Page | 33
6.5. Other initiatives
IT Initiatives
The IT initiatives proposed by TANGEDCO are
mostly covered under the R-APDRP Part A
schemes. TANGEDCO has proposed construction
of a Data Centre (DC) at Chennai and Disaster
Recovery Centre (DRC) at Madurai. Data Centre
(DC) has been commissioned at Chennai. DRC
Works are under progress in Madurai. Around 100
towns have been made “Go-Live” and are
connected to DC over MPLS-VPN.
Further various upgradation works for expanding
the VPN/LAN/WAN facility are being planned.
Software modules for billing, meter data acquisition,
and various other commercial processes are being
proposed. A brief snapshot of the IT initiatives are
shown in Figure 13
Technology up gradation and modernization
schemes
TANGEDCO proposed various works for
upgradation of ULDC and communication network
amounting to Rs. 87.87 Cr these works will be
carried out in the period FY16 to FY19. Works
related to establishment of fibre optic network worth
Rs 30 Cr already been completed. The following
table shows the total layout of the proposed works.
Table 28: Investments for upgradation of ULDC
Description Value
ULDC Revamping under progress 19.07
Automatic meter reading infrastrucure MODEM & data concentrators
13.05
Establishing of fibre network 55.75
Total 87.87
6.6. Rollout Plan
Table 29 shows the infrastructure roll-out plan for
TANGEDCO.
Figure 13: Proposed works under IT capacity addition plan for TANGEDCO
Table 29: Distribution Infrastructure rollout plan for TANGEDCO
Additions
Item (units) Capacity at the end of
FY16 FY17 FY18 FY19 Total
DTS (Nos) 2,64,029 18,059 18,872 19,721 3,20,681
HT Line (ckt kms) 1,69,409 3,654 3,764 3,877 1,80,704
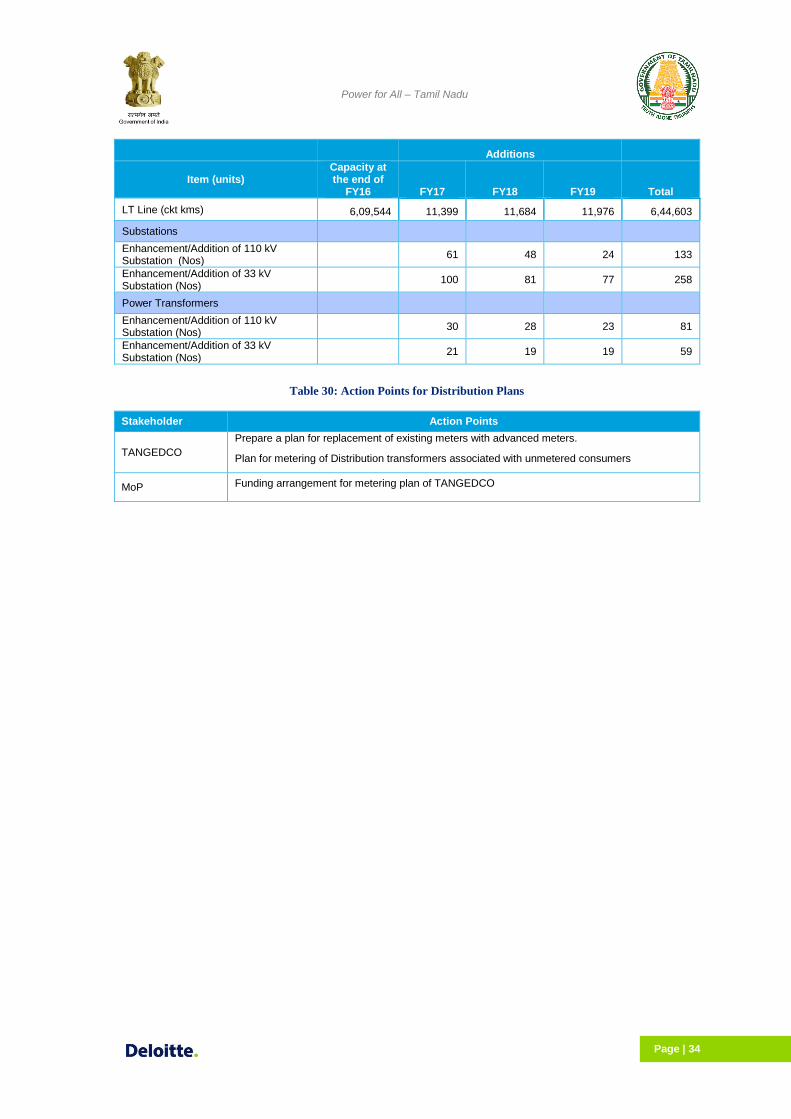
Power for All – Tamil Nadu
Page | 34
Additions
Item (units) Capacity at the end of
FY16 FY17 FY18 FY19 Total
LT Line (ckt kms) 6,09,544 11,399 11,684 11,976 6,44,603
Substations
Enhancement/Addition of 110 kV Substation (Nos)
61 48 24 133
Enhancement/Addition of 33 kV Substation (Nos)
100 81 77 258
Power Transformers
Enhancement/Addition of 110 kV Substation (Nos)
30 28 23 81
Enhancement/Addition of 33 kV Substation (Nos)
21 19 19 59
Table 30: Action Points for Distribution Plans
Stakeholder Action Points
TANGEDCO
Prepare a plan for replacement of existing meters with advanced meters.
Plan for metering of Distribution transformers associated with unmetered consumers
MoP Funding arrangement for metering plan of TANGEDCO
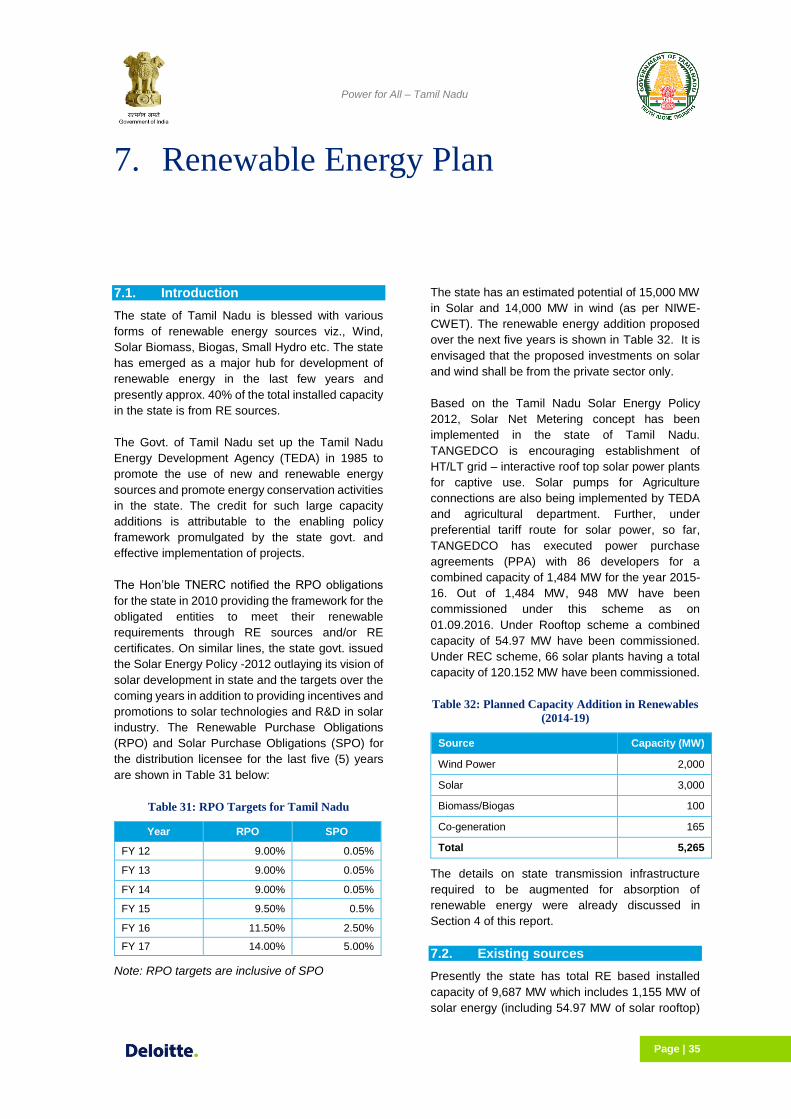
Power for All – Tamil Nadu
Page | 35
7. Renewable Energy Plan
7.1. Introduction
The state of Tamil Nadu is blessed with various
forms of renewable energy sources viz., Wind,
Solar Biomass, Biogas, Small Hydro etc. The state
has emerged as a major hub for development of
renewable energy in the last few years and
presently approx. 40% of the total installed capacity
in the state is from RE sources.
The Govt. of Tamil Nadu set up the Tamil Nadu
Energy Development Agency (TEDA) in 1985 to
promote the use of new and renewable energy
sources and promote energy conservation activities
in the state. The credit for such large capacity
additions is attributable to the enabling policy
framework promulgated by the state govt. and
effective implementation of projects.
The Hon’ble TNERC notified the RPO obligations
for the state in 2010 providing the framework for the
obligated entities to meet their renewable
requirements through RE sources and/or RE
certificates. On similar lines, the state govt. issued
the Solar Energy Policy -2012 outlaying its vision of
solar development in state and the targets over the
coming years in addition to providing incentives and
promotions to solar technologies and R&D in solar
industry. The Renewable Purchase Obligations
(RPO) and Solar Purchase Obligations (SPO) for
the distribution licensee for the last five (5) years
are shown in Table 31 below:
Table 31: RPO Targets for Tamil Nadu
Year RPO SPO
FY 12 9.00% 0.05%
FY 13 9.00% 0.05%
FY 14 9.00% 0.05%
FY 15 9.50% 0.5%
FY 16 11.50% 2.50%
FY 17 14.00% 5.00%
Note: RPO targets are inclusive of SPO
The state has an estimated potential of 15,000 MW
in Solar and 14,000 MW in wind (as per NIWE-
CWET). The renewable energy addition proposed
over the next five years is shown in Table 32. It is
envisaged that the proposed investments on solar
and wind shall be from the private sector only.
Based on the Tamil Nadu Solar Energy Policy
2012, Solar Net Metering concept has been
implemented in the state of Tamil Nadu.
TANGEDCO is encouraging establishment of
HT/LT grid – interactive roof top solar power plants
for captive use. Solar pumps for Agriculture
connections are also being implemented by TEDA
and agricultural department. Further, under
preferential tariff route for solar power, so far,
TANGEDCO has executed power purchase
agreements (PPA) with 86 developers for a
combined capacity of 1,484 MW for the year 2015-
16. Out of 1,484 MW, 948 MW have been
commissioned under this scheme as on
01.09.2016. Under Rooftop scheme a combined
capacity of 54.97 MW have been commissioned.
Under REC scheme, 66 solar plants having a total
capacity of 120.152 MW have been commissioned.
Table 32: Planned Capacity Addition in Renewables
(2014-19)
Source Capacity (MW)
Wind Power 2,000
Solar 3,000
Biomass/Biogas 100
Co-generation 165
Total 5,265
The details on state transmission infrastructure
required to be augmented for absorption of
renewable energy were already discussed in
Section 4 of this report.
7.2. Existing sources
Presently the state has total RE based installed
capacity of 9,687 MW which includes 1,155 MW of
solar energy (including 54.97 MW of solar rooftop)

Power for All – Tamil Nadu
Page | 36
based projects and 7,642 MW of wind based
capacity. The details of total RE based installed
capacity (as on 01 Sep 2016) are provided in Table
33 below.
Table 33: RE Installed Capacity
Plant Name Capacity (MW)
Solar 1,155.38
Wind 7,642
Bagassse based co-generation plant
659.40
Biomass 230.00
Total 9,686.78
The state has some ambitious schemes for
promotion of RE based energy sources viz. CM’s
Solar Powered Green House Scheme, CM’s Solar
Rooftop Capital Incentive Scheme, Wind Solar
Hybrid System and small hydro/micro hydel
projects. Under the state’s REC scheme, 66 Solar
Plants having total capacity of 120.152 MW have
been commissioned so far. Under the state
preferential tariff scheme, solar PV projects are
allowed to be set up at a tariff of Rs. 7.01 (without
AD) and Rs. 6.28/kWh (with AD) during the control
period. Similarly solar thermal projects shall attract
a tariff of Rs. 11.03/kWh (without AD) and
Rs.9.88/kWh (with AD). Details of the existing Solar
and wind capacity in the state is provided in Table
34 and Table 35 below respectively. It is observed
that the entire solar capacity in the various districts
is privately owned.
Table 34: Existing Solar Capacity
Sl. Name of District Installed Capacity (MW) Private/ State Owned
1 Sivagangai 11.55 Private
2 Nagapattinam 1.0 Private
3 Madurai 1.0 Private
4 Thoothukudi 28.0 Private
5 Coimbatore 7.0 Private
6 Tirupur 37.26 Private
7 Erode 1.0 Private
8 Virudhunagar 199.4 Private
9 Dindigul 59.6 Private
10 Tirunelveli 9.36 Private
11 Gobi 3.0 Private
12 Trichy 166.0 Private
13 Vellore 5.0 Private
14 Karur 151.49 Private
15 Krishnagiri 0.75 Private
16 Ramnad 348.0 Private
17 Perambalur 10.0 Private
18 Cuddalore 10.0 Private
19 Tiruvannamalai 30.0 Private
20 Pudukottai 20.0 Private
21 Kaniyakumari 1.0 Private
Total 1100.412
In addition to the above of there is 55 MW of Roof Top Solar PV.

Power for All – Tamil Nadu
Page | 37
Table 35: Existing Wind Capacity
Sl. Name of the Project Capacity MW
1 Tirunelveli District 3,700
2 Tuticorin District 245.970
3 Kanyakumari District 118.815
4 Ramnad District 2.150
5 Coimbatore District 355.250
6 Tirupur District 2,264.980
7 Dindigul District 420
8 Theni District 534.700
9 Chennai 0.225
Total 7,642.09
7.3. Capacity Additions – RE Plan
Table 36 below depicts the capacity addition plans
in the renewable energy categories for the years
FY17 to FY19. As per the projected figures, 5,265
MW is expected to be added through RE Sources.
7.4. Funding requirement
It is observed that most of the RE capacity additions
shall be done by private entities. Based on the
information available from the state, the proposed
investments on solar and wind sectors shall be from
private sector only. Fund requirement details for
development of intrastate transmission
infrastructure for evacuation of upcoming
renewable energy sources is discussed in Section
3 of this report.
7.5. RE plan-Issues
The state is not facing major issues related to
renewable energy projects. This is seen form the
recent developments in installed capacity of RE
projects. Most of the projects are being funded
through private participation so there is limited
financial involvement from state owned agencies. It
may also be noted that the regulatory provisions for
promotion of Renewable projects are in place and
no major policy related intervention is identified.
Table 36: Renewable Power Addition
Year Wind (MW) Solar PV/Solar Thermal (MW)
Bio Mass (MW) Bagasse based Co.Gen (MW)
Total (MW)
FY 17 500 1,000 - 165 1,665
FY18 750 1,000 50 - 1,800
FY 19 750 1,000 50 - 1,800
Total 2,000 3,000 100 165 5,265
Table 37: RE Action Plan
Stakeholder Action Points
TANGEDCO/TEDA Promotion of Solar PV under net metering scheme
TANTRANSCO/SLDC Operationalization of REMC
Power for All – Tamil Nadu
Page | 38
8. Energy Efficiency Plan
8.1. Energy Efficiency Plan
As per the provisions of the Energy Conservation Act
2001, the State Designated Agency (SDA) i.e the
Tamil Nadu Electrical Inspectorate (TNEI) has been
nominated by the Bureau of Energy Efficiency (BEE)
in consultation with the state govt. to carry out
schemes on energy conservation and other allied
activities in the state of Tamil Nadu. The role of SDA
is to create general awareness among masses on
benefits of energy conservation measures and to
institutionalize the energy efficiency project
implementation in domestic, commercial and
industrial segments.
TANGEDCO, being the state’s utility, is engaged in
various energy conservation activities and
awareness programs for ensuring energy efficiency
in all segments.
The Energy Department vide orders in 2008 and
2010 have mandated implementation of energy
conservation measures in all govt. buildings and
offices including local bodies and public sector
undertakings and have banned the usage of
incandescent bulbs. Further during 2012, the
Government has ordered usage of LED lamps in
locations such as path ways, entrances, corridors,
rest rooms etc. and Electrical equipment and
appliances with minimum 3 star rating label to be
procured and installed in the Government offices and
buildings.
Energy Conservation day is celebrated on December
14th of every year and Energy Conservation week
from December 14th to December 20th in order to
create awareness to the public on the importance of
Energy Conservation.
The following schemes were taken up by
TANGEDCO as a part of its initiative for energy
efficiency measures.
a) Distribution of about 8.75 lakh nos. CFLs to
hut services in exchange of Incandescent
bulbs (ICBs) across the state.
b) Distribution of 149 nos. of Energy Efficient
Pump Sets (EEPS rated 4 star & above) to
willing agricultural consumers in replacement
of existing inefficient old pump sets.
c) Have mandated the use of EEPS (4 star &
above) for new agricultural service connection.
8.2. Energy Efficiency Action plan
TANGEDCO has been selected under BEE's
Capacity building of DISCOMs program to establish
the energy saving potential in various sectors by
conducting load research across the state. The
selection of consultant for conducting the load
research has been completed. The Load Survey in
all consumer categories including domestic,
commercial, industrial, educational institutions etc
have been completed. The draft report of this load
survey is under preparation by the appointed
consultant.
Based on the report on load survey, a DSM action
plan will be formulated for maximizing the use of
energy efficient appliances under various sector wise
schemes. TANGEDCO will take up the schemes for
implementation, one by one, subject to financial
viability.
Distribution of 1 crore LEDs comprising of 2 LEDs
per household at a subsidized rate of Rs.10/- per
LED to all metered domestic services (consuming
less than 500 units bimonthly) in five cities viz.
Chennai, Coimbatore Madurai, Trichy and Tirunelveli
is under consideration. Based on the outcome, this
scheme will be extended to other parts of the state.
Under EESL’s UJALA program, institutional
distribution of LED lights have been done by EESL.
In this program 61,018 LEDs have been distributed
to Railways in Tamil Nadu. LED distribution for all the
HHs in the state would be carried out after finalization
of the load research and approval of The State
Government.
The state government has undertaken a scheme to
replace all the street lights under municipal
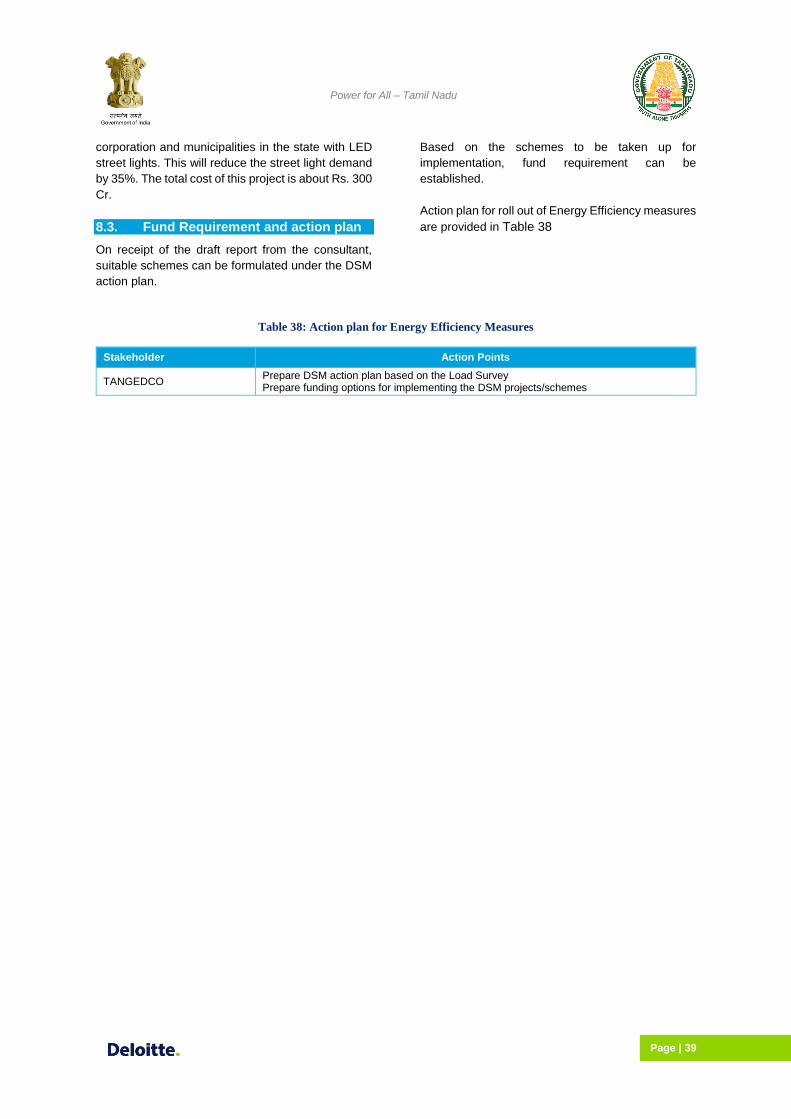
Power for All – Tamil Nadu
Page | 39
corporation and municipalities in the state with LED
street lights. This will reduce the street light demand
by 35%. The total cost of this project is about Rs. 300
Cr.
8.3. Fund Requirement and action plan
On receipt of the draft report from the consultant,
suitable schemes can be formulated under the DSM
action plan.
Based on the schemes to be taken up for
implementation, fund requirement can be
established.
Action plan for roll out of Energy Efficiency measures
are provided in Table 38
Table 38: Action plan for Energy Efficiency Measures
Stakeholder Action Points
TANGEDCO Prepare DSM action plan based on the Load Survey Prepare funding options for implementing the DSM projects/schemes
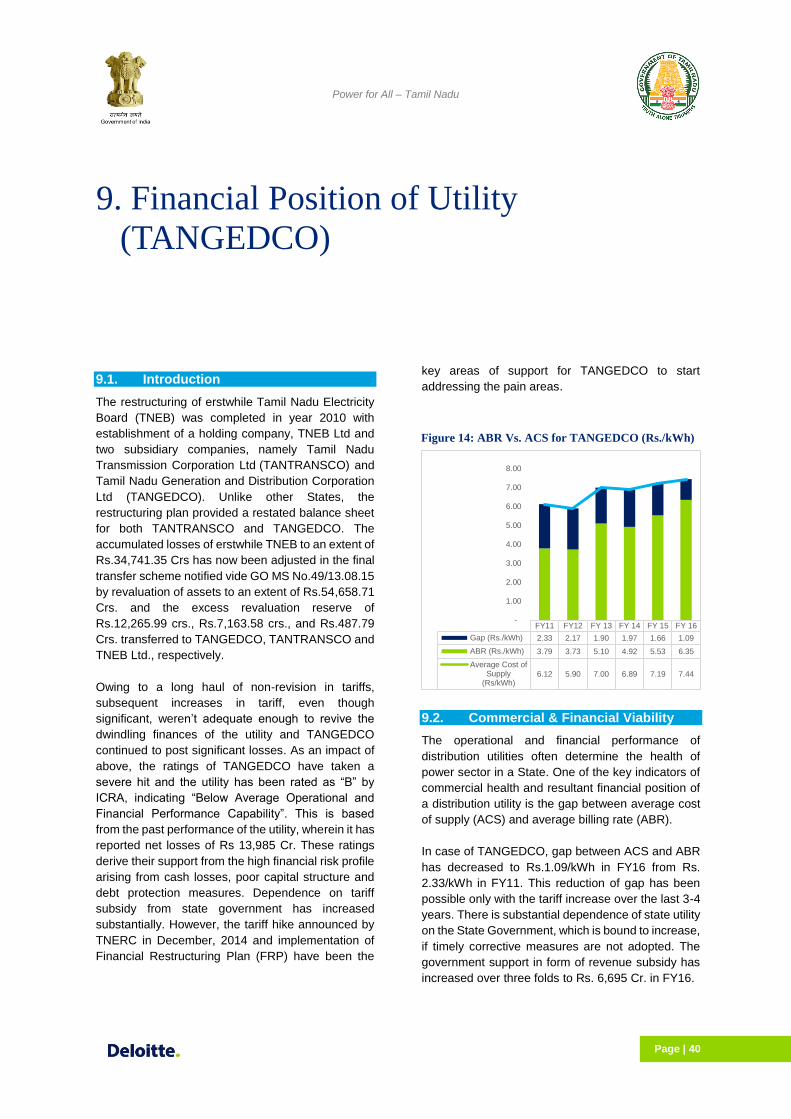
Power for All – Tamil Nadu
Page | 40
9. Financial Position of Utility
(TANGEDCO)
9.1. Introduction
The restructuring of erstwhile Tamil Nadu Electricity
Board (TNEB) was completed in year 2010 with
establishment of a holding company, TNEB Ltd and
two subsidiary companies, namely Tamil Nadu
Transmission Corporation Ltd (TANTRANSCO) and
Tamil Nadu Generation and Distribution Corporation
Ltd (TANGEDCO). Unlike other States, the
restructuring plan provided a restated balance sheet
for both TANTRANSCO and TANGEDCO. The
accumulated losses of erstwhile TNEB to an extent of
Rs.34,741.35 Crs has now been adjusted in the final
transfer scheme notified vide GO MS No.49/13.08.15
by revaluation of assets to an extent of Rs.54,658.71
Crs. and the excess revaluation reserve of
Rs.12,265.99 crs., Rs.7,163.58 crs., and Rs.487.79
Crs. transferred to TANGEDCO, TANTRANSCO and
TNEB Ltd., respectively.
Owing to a long haul of non-revision in tariffs,
subsequent increases in tariff, even though
significant, weren’t adequate enough to revive the
dwindling finances of the utility and TANGEDCO
continued to post significant losses. As an impact of
above, the ratings of TANGEDCO have taken a
severe hit and the utility has been rated as “B” by
ICRA, indicating “Below Average Operational and
Financial Performance Capability”. This is based
from the past performance of the utility, wherein it has
reported net losses of Rs 13,985 Cr. These ratings
derive their support from the high financial risk profile
arising from cash losses, poor capital structure and
debt protection measures. Dependence on tariff
subsidy from state government has increased
substantially. However, the tariff hike announced by
TNERC in December, 2014 and implementation of
Financial Restructuring Plan (FRP) have been the
key areas of support for TANGEDCO to start
addressing the pain areas.
9.2. Commercial & Financial Viability
The operational and financial performance of
distribution utilities often determine the health of
power sector in a State. One of the key indicators of
commercial health and resultant financial position of
a distribution utility is the gap between average cost
of supply (ACS) and average billing rate (ABR).
In case of TANGEDCO, gap between ACS and ABR
has decreased to Rs.1.09/kWh in FY16 from Rs.
2.33/kWh in FY11. This reduction of gap has been
possible only with the tariff increase over the last 3-4
years. There is substantial dependence of state utility
on the State Government, which is bound to increase,
if timely corrective measures are not adopted. The
government support in form of revenue subsidy has
increased over three folds to Rs. 6,695 Cr. in FY16.
FY11 FY12 FY 13 FY 14 FY 15 FY 16
Gap (Rs./kWh) 2.33 2.17 1.90 1.97 1.66 1.09
ABR (Rs./kWh) 3.79 3.73 5.10 4.92 5.53 6.35
Average Cost ofSupply
(Rs/kWh)6.12 5.90 7.00 6.89 7.19 7.44
-
1.00
2.00
3.00
4.00
5.00
6.00
7.00
8.00
Figure 14: ABR Vs. ACS for TANGEDCO (Rs./kWh)
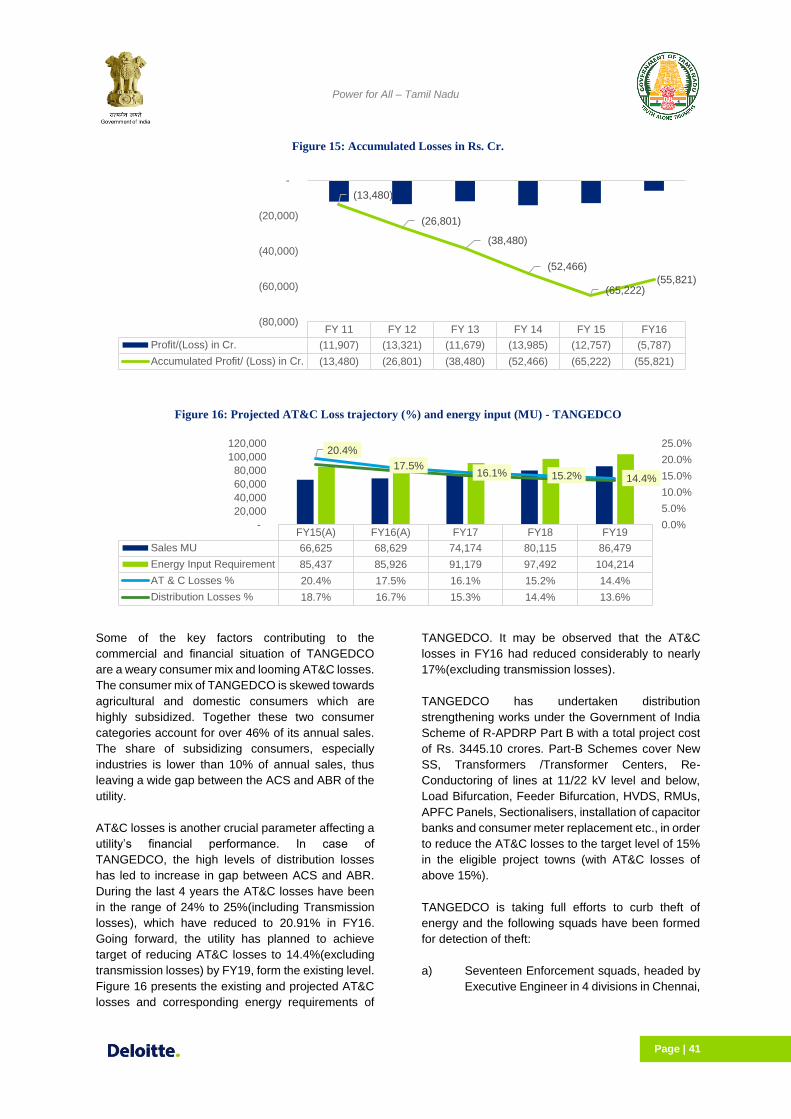
Power for All – Tamil Nadu
Page | 41
Figure 15: Accumulated Losses in Rs. Cr.
Figure 16: Projected AT&C Loss trajectory (%) and energy input (MU) - TANGEDCO
Some of the key factors contributing to the
commercial and financial situation of TANGEDCO
are a weary consumer mix and looming AT&C losses.
The consumer mix of TANGEDCO is skewed towards
agricultural and domestic consumers which are
highly subsidized. Together these two consumer
categories account for over 46% of its annual sales.
The share of subsidizing consumers, especially
industries is lower than 10% of annual sales, thus
leaving a wide gap between the ACS and ABR of the
utility.
AT&C losses is another crucial parameter affecting a
utility’s financial performance. In case of
TANGEDCO, the high levels of distribution losses
has led to increase in gap between ACS and ABR.
During the last 4 years the AT&C losses have been
in the range of 24% to 25%(including Transmission
losses), which have reduced to 20.91% in FY16.
Going forward, the utility has planned to achieve
target of reducing AT&C losses to 14.4%(excluding
transmission losses) by FY19, form the existing level.
Figure 16 presents the existing and projected AT&C
losses and corresponding energy requirements of
TANGEDCO. It may be observed that the AT&C
losses in FY16 had reduced considerably to nearly
17%(excluding transmission losses).
TANGEDCO has undertaken distribution
strengthening works under the Government of India
Scheme of R-APDRP Part B with a total project cost
of Rs. 3445.10 crores. Part-B Schemes cover New
SS, Transformers /Transformer Centers, Re-
Conductoring of lines at 11/22 kV level and below,
Load Bifurcation, Feeder Bifurcation, HVDS, RMUs,
APFC Panels, Sectionalisers, installation of capacitor
banks and consumer meter replacement etc., in order
to reduce the AT&C losses to the target level of 15%
in the eligible project towns (with AT&C losses of
above 15%).
TANGEDCO is taking full efforts to curb theft of
energy and the following squads have been formed
for detection of theft:
a) Seventeen Enforcement squads, headed by
Executive Engineer in 4 divisions in Chennai,
FY 11 FY 12 FY 13 FY 14 FY 15 FY16
Profit/(Loss) in Cr. (11,907) (13,321) (11,679) (13,985) (12,757) (5,787)
Accumulated Profit/ (Loss) in Cr. (13,480) (26,801) (38,480) (52,466) (65,222) (55,821)
(13,480)
(26,801)
(38,480)
(52,466)
(65,222)(55,821)
(80,000)
(60,000)
(40,000)
(20,000)
-
FY15(A) FY16(A) FY17 FY18 FY19
Sales MU 66,625 68,629 74,174 80,115 86,479
Energy Input Requirement 85,437 85,926 91,179 97,492 104,214
AT & C Losses % 20.4% 17.5% 16.1% 15.2% 14.4%
Distribution Losses % 18.7% 16.7% 15.3% 14.4% 13.6%
20.4%
17.5%16.1% 15.2% 14.4%
0.0%
5.0%
10.0%
15.0%
20.0%
25.0%
-
20,000
40,000
60,000
80,000
100,000
120,000

Power for All – Tamil Nadu
Page | 42
Coimbatore, Madurai and Trichy are
functioning throughout the State.
b) A flying squad is functioning in Chennai
under the control of Enforcement Wing.
c) Forty (40) teams comprising Ex-Serviceman
(5 members per team) are also functioning
along with the existing 18 Enforcement
squads in all the 42 distribution circles.
d) Immediate action is being taken on
information received over phone call (or)
anonymous petitions about theft of energy.
e) Further surprise check, night raids and mass
raids are also conducted in the consumer
premises to curb theft of energy.
With widening of gap between ACS and ABR,
increased AT&C losses and non-revision of tariffs,
the financial position of TANGEDCO has worsened
over the years. The reported financial losses of
TANGEDCO have been growing consistently during
the last few years from Rs. 5,634 Cr. In FY11 to Rs.
12,757 Cr. in FY15. TANGEDCO commenced its
operation without any accumulated losses, as the
entire accumulated losses had been wiped out
through the re-valuation results created in the
process of final transfer scheme. However, in FY15,
the accumulated losses have multiplied from Rs
18,955 Cr in FY12 to Rs. 55,821 Cr in FY16. The YoY
profits recorded and rising accumulated losses of
TANGEDCO are presented in Figure 15.
In addition, during the past few years, TANGEDCO
has committed significant capital expenditure for its
network expansion. In the past five (5) years, a total
of Rs. 9,425 Cr. has been undertaken as capital
expenditure investments. In order to fund its
investment requirements and to a large extent the
losses as well, the utility has resorted to significant
market borrowings. The long term debt of
TANGEDCO has increased from Rs.19,412 Cr. in
FY11 to Rs.67,194 Cr. in FY15. On account of higher
reliance on long term as well as short term funds to
meet capital and revenue account deficits, there has
been a sharp rise in interest burden, resulting in
weakening of debt service indicators.
Considering the precarious financial position, with
surmounting losses, heavy dependence on debt to
fund the operations and significant burden on the
state government for subsidy, the utility has already
gone for a Financial Restructuring Plan (FRP) in
2012. The details of FRP are discussed below.
9.3. Financial Restructuring Plan
Owing to degrading financial health of the state
distribution companies, the Government of India
constituted an expert committee to suggest a strategy
for financial Restructuring Plan (FRP) of utilities. The
guidelines were framed stipulating takeover of 50%
of short term liabilities (STL) as of March 31st 2012
by the State Governments and balance 50% of short
term liabilities to be rescheduled by lenders and
serviced by the DISCOMS.
In line with above, TANGEDCO prepared a FRP with
an objective to improve its financial sustainability,
which was finalized and approved by the state
government in December 2012. The key aspects of
FRP were as below.
As per the FRP, the GoTN has issued special
securities of Rs.1,000 crores during 2014-15 and
Rs.1,000 crores during 2015-16 and also
redeemed to the Banks.
The remaining FRP to the extent of Rs.4,353.49
crs. is expected to be taken over before the end
of FY2017-18. During the current financial year
2016-17, the GoTN has provided a sum of
Rs.2,000 crs. for this purpose.
As per FRP, 25% of the loss taken over by GoTN
has to be contributed as Grant from GOI and the
same was not so far released from GOI.
Similarly the cash loss funding from certain
banks was not yet sanctioned and released to
TANGEDCO to the extent of Rs.160.37 crs.
Since the banks are committed to fund the
projected loss for the years 2012-13’ 2013-14
and 2014-15 under FRP, the delay by the banks
is not agreeable. Further the banks are not
extending any loan to TANGEDCO from 2015-
16 onwards, due to the restructuring process
implemented under FRP.
Under FRP, the commercial banks will not
extend any further short term loan to
TANGEDCO to meet operational commitments
caused by gap in ABR and ACS from FY16
onwards. Though there is a provision to fund the
losses beyond projections by the state
Government. However, the Government of Tamil
Nadu could not accommodate the loan
assistance in view of the Fiscal Responsibility
and Budget Management (FRBM) restrictions.
TANGEDCO has submitted a proposal seeking
the following relaxations and modifications in
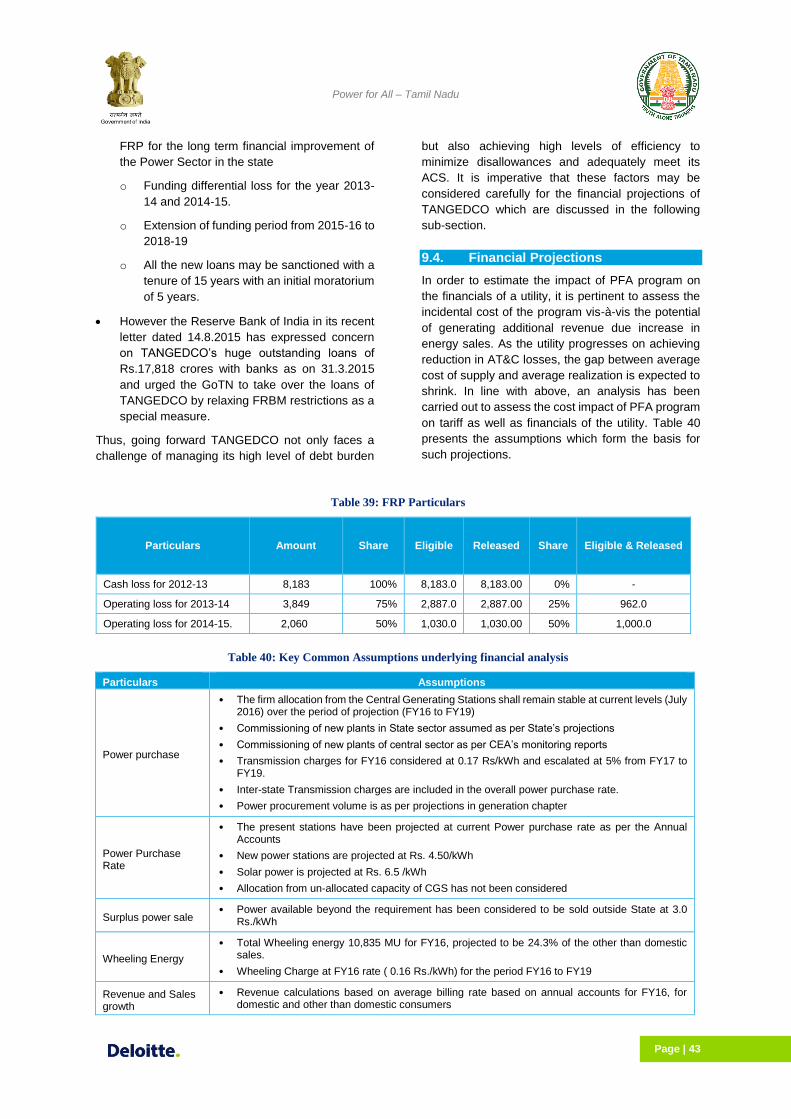
Power for All – Tamil Nadu
Page | 43
FRP for the long term financial improvement of
the Power Sector in the state
o Funding differential loss for the year 2013-
14 and 2014-15.
o Extension of funding period from 2015-16 to
2018-19
o All the new loans may be sanctioned with a
tenure of 15 years with an initial moratorium
of 5 years.
However the Reserve Bank of India in its recent
letter dated 14.8.2015 has expressed concern
on TANGEDCO’s huge outstanding loans of
Rs.17,818 crores with banks as on 31.3.2015
and urged the GoTN to take over the loans of
TANGEDCO by relaxing FRBM restrictions as a
special measure.
Thus, going forward TANGEDCO not only faces a
challenge of managing its high level of debt burden
but also achieving high levels of efficiency to
minimize disallowances and adequately meet its
ACS. It is imperative that these factors may be
considered carefully for the financial projections of
TANGEDCO which are discussed in the following
sub-section.
9.4. Financial Projections
In order to estimate the impact of PFA program on
the financials of a utility, it is pertinent to assess the
incidental cost of the program vis-à-vis the potential
of generating additional revenue due increase in
energy sales. As the utility progresses on achieving
reduction in AT&C losses, the gap between average
cost of supply and average realization is expected to
shrink. In line with above, an analysis has been
carried out to assess the cost impact of PFA program
on tariff as well as financials of the utility. Table 40
presents the assumptions which form the basis for
such projections.
Table 39: FRP Particulars
Particulars Amount Share Eligible Released Share Eligible & Released
Cash loss for 2012-13 8,183 100% 8,183.0 8,183.00 0% -
Operating loss for 2013-14 3,849 75% 2,887.0 2,887.00 25% 962.0
Operating loss for 2014-15. 2,060 50% 1,030.0 1,030.00 50% 1,000.0
Table 40: Key Common Assumptions underlying financial analysis
Particulars Assumptions
Power purchase
• The firm allocation from the Central Generating Stations shall remain stable at current levels (July 2016) over the period of projection (FY16 to FY19)
• Commissioning of new plants in State sector assumed as per State’s projections
• Commissioning of new plants of central sector as per CEA’s monitoring reports
• Transmission charges for FY16 considered at 0.17 Rs/kWh and escalated at 5% from FY17 to FY19.
• Inter-state Transmission charges are included in the overall power purchase rate.
• Power procurement volume is as per projections in generation chapter
Power Purchase Rate
• The present stations have been projected at current Power purchase rate as per the Annual Accounts
• New power stations are projected at Rs. 4.50/kWh
• Solar power is projected at Rs. 6.5 /kWh
• Allocation from un-allocated capacity of CGS has not been considered
Surplus power sale • Power available beyond the requirement has been considered to be sold outside State at 3.0
Rs./kWh
Wheeling Energy
• Total Wheeling energy 10,835 MU for FY16, projected to be 24.3% of the other than domestic sales.
• Wheeling Charge at FY16 rate ( 0.16 Rs./kWh) for the period FY16 to FY19
Revenue and Sales growth
• Revenue calculations based on average billing rate based on annual accounts for FY16, for domestic and other than domestic consumers
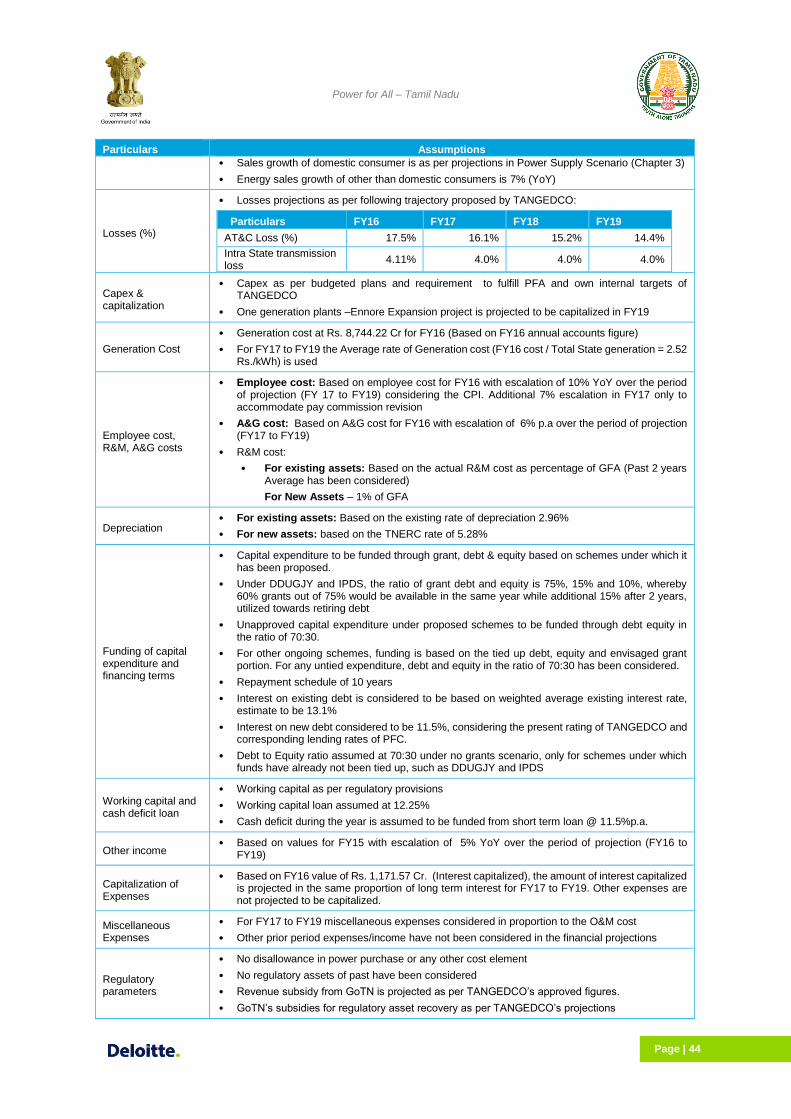
Power for All – Tamil Nadu
Page | 44
Particulars Assumptions
• Sales growth of domestic consumer is as per projections in Power Supply Scenario (Chapter 3)
• Energy sales growth of other than domestic consumers is 7% (YoY)
Losses (%)
• Losses projections as per following trajectory proposed by TANGEDCO:
Particulars FY16 FY17 FY18 FY19
AT&C Loss (%) 17.5% 16.1% 15.2% 14.4%
Intra State transmission loss
4.11% 4.0% 4.0% 4.0%
Capex & capitalization
• Capex as per budgeted plans and requirement to fulfill PFA and own internal targets of TANGEDCO
• One generation plants –Ennore Expansion project is projected to be capitalized in FY19
Generation Cost
• Generation cost at Rs. 8,744.22 Cr for FY16 (Based on FY16 annual accounts figure)
• For FY17 to FY19 the Average rate of Generation cost (FY16 cost / Total State generation = 2.52 Rs./kWh) is used
Employee cost, R&M, A&G costs
• Employee cost: Based on employee cost for FY16 with escalation of 10% YoY over the period of projection (FY 17 to FY19) considering the CPI. Additional 7% escalation in FY17 only to accommodate pay commission revision
• A&G cost: Based on A&G cost for FY16 with escalation of 6% p.a over the period of projection (FY17 to FY19)
• R&M cost:
• For existing assets: Based on the actual R&M cost as percentage of GFA (Past 2 years Average has been considered)
For New Assets – 1% of GFA
Depreciation • For existing assets: Based on the existing rate of depreciation 2.96%
• For new assets: based on the TNERC rate of 5.28%
Funding of capital expenditure and financing terms
• Capital expenditure to be funded through grant, debt & equity based on schemes under which it has been proposed.
• Under DDUGJY and IPDS, the ratio of grant debt and equity is 75%, 15% and 10%, whereby 60% grants out of 75% would be available in the same year while additional 15% after 2 years, utilized towards retiring debt
• Unapproved capital expenditure under proposed schemes to be funded through debt equity in the ratio of 70:30.
• For other ongoing schemes, funding is based on the tied up debt, equity and envisaged grant portion. For any untied expenditure, debt and equity in the ratio of 70:30 has been considered.
• Repayment schedule of 10 years
• Interest on existing debt is considered to be based on weighted average existing interest rate, estimate to be 13.1%
• Interest on new debt considered to be 11.5%, considering the present rating of TANGEDCO and corresponding lending rates of PFC.
• Debt to Equity ratio assumed at 70:30 under no grants scenario, only for schemes under which funds have already not been tied up, such as DDUGJY and IPDS
Working capital and cash deficit loan
• Working capital as per regulatory provisions
• Working capital loan assumed at 12.25%
• Cash deficit during the year is assumed to be funded from short term loan @ 11.5%p.a.
Other income • Based on values for FY15 with escalation of 5% YoY over the period of projection (FY16 to
FY19)
Capitalization of Expenses
• Based on FY16 value of Rs. 1,171.57 Cr. (Interest capitalized), the amount of interest capitalized is projected in the same proportion of long term interest for FY17 to FY19. Other expenses are not projected to be capitalized.
Miscellaneous Expenses
• For FY17 to FY19 miscellaneous expenses considered in proportion to the O&M cost
• Other prior period expenses/income have not been considered in the financial projections
Regulatory parameters
• No disallowance in power purchase or any other cost element
• No regulatory assets of past have been considered
• Revenue subsidy from GoTN is projected as per TANGEDCO’s approved figures.
• GoTN’s subsidies for regulatory asset recovery as per TANGEDCO’s projections

Power for All – Tamil Nadu
Page | 45
Table 41: Impact of Asset addition (Rs Cr.)
Particulars FY 17 FY 18 FY 19
Capital expenditure 2,850 3,064 16,834
Grants 1,132 744 1,439
Debt 1,554 1,976 10,345
Equity 163.7 344.3 5050.2
Incidental cost of capital expenditure
Depreciation on additional assets 45.14 168.92 688.06
Interest on debt – corresponding to PFA capex 80.43 254.16 862.53
Return on equity - corresponding to PFA capex 25.38 53.37 782.78
Total capex related Cost 150.95 476.45 2,333.37
Table 42: Parameters for base case
Particulars Units FY16 FY 17 FY 18 FY 19
Energy related parameters
Retail Sales MUs 68,629 74,174 80,115 86,479
T&D losses %age 16.7% 15.3% 14.4% 13.6%
AT&C Losses %age 17.52% 16.09% 15.24% 14.41%
Power purchase cost (inc transmission charges)
Rs./kWh 6.15 6.04 6.06 6.10
Energy Required MUs 85,926 91,179 97,492 104,214
Energy Available MUs 85,926 95,709 101,364 109,787
Surplus/Shortage MUs 4,530 3,873 5,573
Revenue & expenditure parameters
Tariff Increase %age 0.0% 0.0% 0.0% 0.0%
Collection efficiency %age 99.0% 99.0% 99.0% 99.0%
Average billing rate - Domestic (w/o Subsidy)
Rs./kWh 2.82 2.82 2.82 2.82
Average billing rate - Other than domestic (weighted avg.)
Rs./kWh 7.74 7.74 7.74 7.74
Employee cost escalation %age 10.00% 17.00% 10.00% 10.00%
A&G cost escalation %age 6.00% 6.00% 6.00% 6.00%
The impact of PFA program on the Tariff structure
prevalent in the state is reflected in Table 43 as
below. This impact is due to per kWh gap of incidental
cost of providing additional power and revenue
generated due to increase in energy sales. The
impact on tariff due to PFA capital expenditure is
expected to remain in the range of Rs. 0.29/kWh in
FY17 to Rs.0.53/kWh in FY19.
The key reason behind the marginal increase in tariff
impact is the reduction in overall average realization
as the share of domestic category sales increases,
but the constituents of ACS, other than power
purchase cost continue to increase. The additional
cost on account of capital expenditure accounts for a
considerable increase in ACS.
Therefore, in the base case, the financial statements
of TANGEDCO have been prepared considering that
the per unit power purchase cost and tariff shall
remain at the present levels, while the impact of other
incidental cost is accounted.
As can be seen in the P&L statement, the financial
losses of Rs. 5,787 Cr. in FY16 are likely to increase
to Rs.10,312 Cr.in FY19.
Table 43: Impact on tariff due to PFA
Particulars Derivation FY 17 FY 18 FY 19
Additional recovery due to incremental energy sales (Rs. Cr.)
A 3,115 3,335 3,571

Power for All – Tamil Nadu
Page | 46
Particulars Derivation FY 17 FY 18 FY 19
Incremental power purchase cost (inc. transmission charges and incremental transmission cost due to PFA program (Rs. Cr.)
B 3,621 3,228 3,866
Add: Cost related to capital expenditure (interest, depreciation and equity return, Rs. Cr.)
B1 151 476 1,264
Add: Incremental O&M cost & Working capital cost
1,511 2,218 3,019
Gap of additional cost and additional recovery C=(B+B1-A) 2,168 2,588 4,577
Energy sales (MU) D 74,174 80,115 86,479
Cumulative Impact on tariff (Rs./kWh) 0.29 0.32 0.53
Table 44: Profit and Loss Account (Rs.Cr.) for Base Case
Particulars FY16 (A) FY17 FY18 FY19
Revenue
Revenue from Sale of Power within State 41,516 44,631 47,967 51,538
Revenue Subsidy from GoTN 6,695 8,485 9,244 10,073
Revenue from Sale of Surplus Power - 1,359 1,162 1,672
Subsidies and grants 1,000 2,000 2,363 -
Others 495 519 545 572
Total revenue 49,705 56,994 61,281 63,855
Expenditure
Power Purchase cost 31,618 34,294 37,468 40,326
Generation Cost 8,744 9,689 9,743 10,751
O&M Cost 6,777 7,766 8,473 9,274
Employee cost 5,614 6,568 7,225 7,948
A&G expenses 426 451 478 507
R&M expenses 738 747 770 819
EBIDTA 2,566 5,246 5,596 3,504
Depreciation 1,626 1,653 1,716 1,880
Interest and finance charges 9,993 11,151 11,829 12,884
Interest on Working Capital 418 1,002 1,052 1,071
Interest on Cash deficit Loan - 663 2,107 3,880
Interest – Long Term 9,575 9,486 8,670 7,933
Miscellaneous 17 19 21 23
PBT (7,231) (6,417) (6,909) (10,312)
Prior Period Charges 1,444 - - -
Capitalised Expenses 1,840 1,161 1,061 971
Provision for Tax - - - -
PAT (5,787) (6,417) (6,909) (10,312)
9.5. Scenario Analysis
Any change in tariff or under achievement of AT&C
losses considered for the base case or non-
availability of funding in form of grants will translate
into additional impact on the financial position of the
utility. The impact of existing accumulated losses of
TANGEDCO or the impact of purchase and sale of
surplus power available to TANGEDCO also need
to be evaluated. Therefore, analysis under following
scenarios have been carried out:
1. Increase in tariff to ensure that utility becomes viable by FY19
2. Non-Availability of grants under the schemes where DPRs are not finalized (available only to the extent approved as per DPR) to fund the capital expenditure.
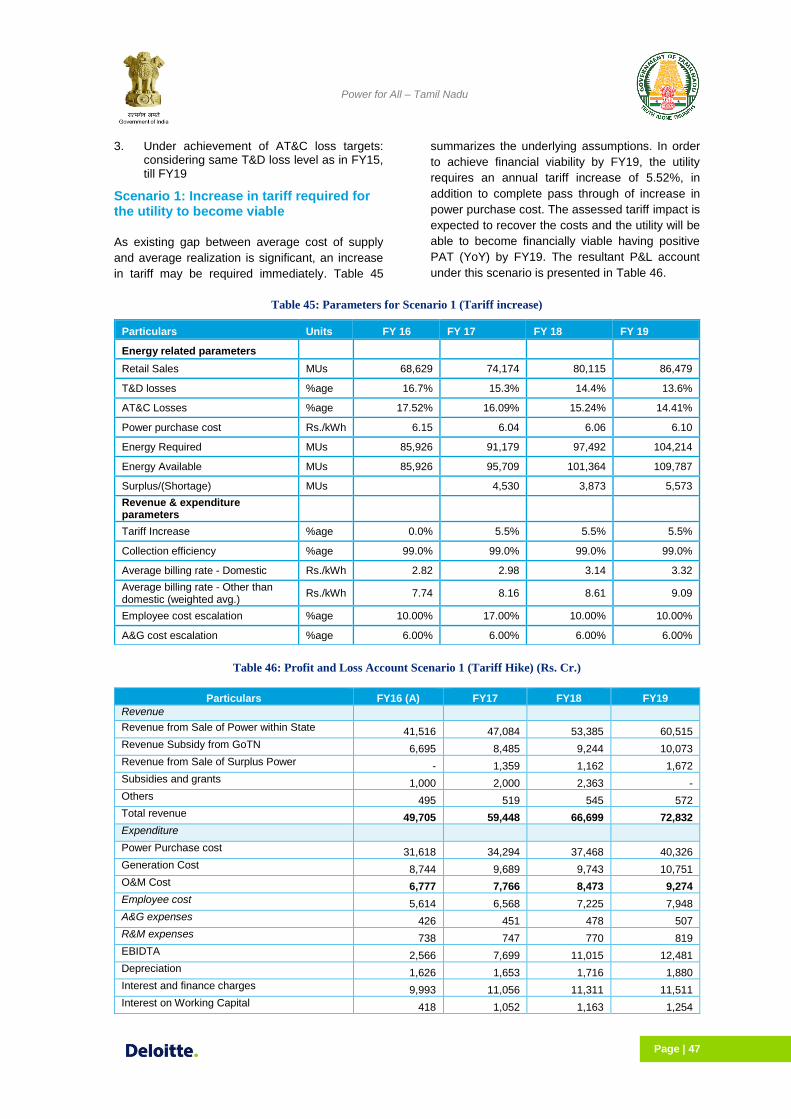
Power for All – Tamil Nadu
Page | 47
3. Under achievement of AT&C loss targets: considering same T&D loss level as in FY15, till FY19
Scenario 1: Increase in tariff required for the utility to become viable
As existing gap between average cost of supply
and average realization is significant, an increase
in tariff may be required immediately. Table 45
summarizes the underlying assumptions. In order
to achieve financial viability by FY19, the utility
requires an annual tariff increase of 5.52%, in
addition to complete pass through of increase in
power purchase cost. The assessed tariff impact is
expected to recover the costs and the utility will be
able to become financially viable having positive
PAT (YoY) by FY19. The resultant P&L account
under this scenario is presented in Table 46.
Table 45: Parameters for Scenario 1 (Tariff increase)
Particulars Units FY 16 FY 17 FY 18 FY 19
Energy related parameters
Retail Sales MUs 68,629 74,174 80,115 86,479
T&D losses %age 16.7% 15.3% 14.4% 13.6%
AT&C Losses %age 17.52% 16.09% 15.24% 14.41%
Power purchase cost Rs./kWh 6.15 6.04 6.06 6.10
Energy Required MUs 85,926 91,179 97,492 104,214
Energy Available MUs 85,926 95,709 101,364 109,787
Surplus/(Shortage) MUs 4,530 3,873 5,573
Revenue & expenditure parameters
Tariff Increase %age 0.0% 5.5% 5.5% 5.5%
Collection efficiency %age 99.0% 99.0% 99.0% 99.0%
Average billing rate - Domestic Rs./kWh 2.82 2.98 3.14 3.32
Average billing rate - Other than domestic (weighted avg.)
Rs./kWh 7.74 8.16 8.61 9.09
Employee cost escalation %age 10.00% 17.00% 10.00% 10.00%
A&G cost escalation %age 6.00% 6.00% 6.00% 6.00%
Table 46: Profit and Loss Account Scenario 1 (Tariff Hike) (Rs. Cr.)
Particulars FY16 (A) FY17 FY18 FY19
Revenue
Revenue from Sale of Power within State 41,516 47,084 53,385 60,515
Revenue Subsidy from GoTN 6,695 8,485 9,244 10,073
Revenue from Sale of Surplus Power - 1,359 1,162 1,672
Subsidies and grants 1,000 2,000 2,363 -
Others 495 519 545 572
Total revenue 49,705 59,448 66,699 72,832
Expenditure
Power Purchase cost 31,618 34,294 37,468 40,326
Generation Cost 8,744 9,689 9,743 10,751
O&M Cost 6,777 7,766 8,473 9,274
Employee cost 5,614 6,568 7,225 7,948
A&G expenses 426 451 478 507
R&M expenses 738 747 770 819
EBIDTA 2,566 7,699 11,015 12,481
Depreciation 1,626 1,653 1,716 1,880
Interest and finance charges 9,993 11,056 11,311 11,511
Interest on Working Capital 418 1,052 1,163 1,254

Power for All – Tamil Nadu
Page | 48
Particulars FY16 (A) FY17 FY18 FY19
Interest on Cash deficit Loan - 517 1,479 2,324
Interest – Long Term 9,575 9,486 8,670 7,933
Miscellaneous 17 19 21 23
PBT (7,231) (3,868) (972) 38
Prior Period Charges 1,444 - - -
Capitalised Expenses 1,840 1,161 1,061 971
Provision for Tax - - - 13
PAT (5,787) (3,868) (972) 25
The projected cash flow statement till FY19 and
projected balance sheet is provide in Annexure 21
& 22. It can be observed from the cash flow
statement that with 5.52% tariff increase,
TANGEDCO is expected to post positive YoY cash-
flows by FY19.
Scenario 2: Non-Availability of grants (funding of capital expenditure through grants under various government schemes)
The dependence of utility on funding of the
proposed investments through various State and
Central Government schemes can be assessed by
the impact on utility’s finances under a scenario
where grant funding is not available. For the
ongoing schemes where the funds have already
been committed by the State or Central
Government, the grants are considered to be as
envisaged in the respective schemes. Table 47 on
the following page summarizes the key parameters
underlying the analysis and the impact on tariff has
been detailed in Table 48. As can be seen in Table
48, the impact on tariff is expected to increase due
to non-availability of grants to fund the capital
expenditure. The tariff impact for in such scenario
is estimated to range between Rs.0.30/kWh to
Rs.0.54/kWh. Table 49 presents the projected profit
and loss statement of TANGEDCO under this
scenario.
Table 47: Parameters for Scenario 2 (Non-Availability of grants)
Particulars Units FY 16 FY 17 FY 18 FY 19
Energy related parameters
Sales MUs 68,629 74,174 80,115 86,479
T&D losses %age 16.7% 15.3% 14.4% 13.6%
AT&C Losses %age 17.52% 16.09% 15.24% 14.41%
Power purchase cost Rs./kWh 6.15 6.04 6.06 6.10
Energy Required MUs 85,926 91,179 97,492 104,214
Energy Available MUs 85,926 95,709 101,364 109,787
Surplus/(Shortage) MUs 4,530 3,873 5,573
Revenue & expenditure parameters
Tariff Increase %age 0.0% 0.0% 0.0% 0.0%
Collection efficiency %age 99.0% 99.0% 99.0% 99.0%
Average billing rate - Domestic Rs./kWh 2.82 2.82 2.82 2.82
Average billing rate - Other than domestic (weighted avg.)
Rs./kWh 7.74 7.74 7.74 7.74
Employee cost escalation %age 10.00% 17.00% 10.00% 10.00%
A&G cost escalation %age 6.00% 6.00% 6.00% 6.00%
Table 48: Impact on tariff due to PFA – Scenario 2
Particulars Derivation FY 17 FY 18 FY 19
Additional recovery due to incremental energy sales (Rs. Cr.)
A 3,115 3,335 3,571

Power for All – Tamil Nadu
Page | 45
Particulars Derivation FY 17 FY 18 FY 19
Incremental power purchase cost (inc. transmission charges and incremental transmission cost due to PFA program (Rs. Cr.)
B 3,621 3,228 3,866
Add: Cost related to capital expenditure (interest, depreciation and equity return, Rs. Cr.)
B1 215 589 1,365
Add: Incremental O&M cost & Working capital cost
B2 1,511 2,218 3,019
Gap of additional cost and additional recovery C=(B+B1+B2 -A)
2,232 2,700 4,678
Energy sales (MU) D 74,174 80,115 86,479
Cumulative Impact on tariff (Rs./kWh) 0.30 0.34 0.54
Table 49: Profit and Loss Statement (Rs. Cr.) Scenario 2
Profit & Loss Statement FY16(A) FY17 FY18 FY19
Revenue
Revenue from Sale of Power within State 41,516 44,631 47,967 51,538
Revenue Subsidy from GoTN 6,695 8,485 9,244 10,073
Revenue from Sale of Surplus Power - 1,359 1,162 1,672
Subsidies and grants 1,000 2,000 2,363 -
Others 495 519 545 572
Total revenue 49,705 56,994 61,281 63,855
Expenditure
Power Purchase cost 31,618 34,294 37,468 40,326
Generation Cost 8,744 9,689 9,743 10,751
O&M Cost 6,777 7,766 8,473 9,274
Employee cost 5,614 6,568 7,225 7,948
A&G Expenses 426 451 478 507
R&M Expenses 738 747 770 819
EBIDTA 2,566 5,246 5,596 3,504
Depreciation 1,626 1,665 1,782 1,965
Interest and finance charges 9,993 11,181 11,922 13,029
Interest on working capital 418 1,002 1,052 1,071
Interest on cash deficit loan - 667 2,127 3,924
Interest - Long term 9,575 9,512 8,744 8,034
Miscellaneous 17 19 21 23
PBT (7,231) (6,456) (7,059) (10,529)
Prior Period Charges 1,444 - - -
Capitalised Expenses 1,840 1,164 1,070 983
Provision for tax - - - -
PAT (5,787) (6,456) (7,059) (10,529)
As can be seen above, the annual financial losses
of TANGEDCO are expected to increase to nearly
Rs. 10,529 Cr. in FY19 as against Rs. 10,312 Cr.
under the base case.
Further, as the utility’s cost of funding declines due
to availability of grants, the required tariff increase
to achieve the financial viability is likely to increase
to 5.63% p.a. as against 5.52% tariff increase
required in base case.
The projected cash flow statement till FY19 is
provided in Annexure 23 & 24.
Scenario 3: Under achievement of AT&C loss reduction trajectory

Power for All – Tamil Nadu
Page | 50
Base case analysis, scenario 1 and scenario 2
assumes the achievement of AT&C loss trajectory
by the utility. However, in case the utility misses
T&D loss reduction and is higher by 1% every year,
the impact on financial position is going to be
significant. Table 50 summarizes the key
parameters underlying the analysis in scenario 3.
There is an impact on tariff and is expected to be in
the range of Rs. 0.29/kWh to Rs.0.53/kWh. Due to
additional cost and under-achievement of T&D loss
trajectory there is an adverse impact on the
financials of the utility, as presented in Table 51. As
can be seen in Table 52 the annual financial losses
of utility are expected to increase to nearly Rs.
10,809 Cr. in FY19 vis-à-vis Rs. 10,312 Cr. in FY19
under base case, this indicates that TANGEDCO
needs to focus on AT&C loss trajectory.
It may also be important to note that in this scenario,
the funds available as grants under centrally
sponsored schemes (IPDS, DDUGJY) are
restricted to 60% of project value.
The required tariff increase to achieve the financial
viability by FY19 is higher at 5.78% as compared to
5.52% in base case.
Table 50: Parameters for Scenario 3 (Under-achievement of T&D losses)
Particulars Units FY 16 FY 17 FY 18 FY 19
Energy related parameters
Sales MUs 68,629 74,174 80,115 86,479
T&D losses %age 16.7% 16.3% 15.4% 14.6%
AT&C Losses %age 17.52% 17.09% 16.24% 15.41%
Power purchase cost (inc. transmission charges)
Rs./kWh 6.15 6.04 6.06 6.10
Energy Required MUs 85,926 92,278 98,656 105,446
Energy Available MUs 85,926 95,709 101,364 109,787
Surplus/(Shortage) MUs 3,431 2,709 4,341
Revenue & expenditure parameters
Tariff Increase %age 0.0% 0.0% 0.0% 0.0%
Collection efficiency %age 99.0% 99.0% 99.0% 99.0%
Average billing rate - Domestic Rs./kWh 2.82 2.82 2.82 2.82
Average billing rate - Other than domestic (weighted avg.)
Rs./kWh 7.74 7.74 7.74 7.74
Employee cost escalation %age 10.00% 17.00% 10.00% 10.00%
A&G cost escalation %age 6.00% 6.00% 6.00% 6.00%
Table 51: Scenario 3: Impact on tariff
Particulars Derivation FY 17 FY 18 FY 19
Additional recovery due to incremental energy sales (Rs. Cr.)
A 3,115 3,335 3,571
Incremental power purchase cost (inc. transmission charges and incremental transmission cost due to PFA program (Rs. Cr.)
B 3,621 3,228 3,866
Add: Cost related to capital expenditure (interest, depreciation and equity return, Rs. Cr.)
B1 151 476 1,274
Add: Incremental O&M cost & Working capital cost B2 1,511 2,218 3,019
Gap of additional cost and additional recovery C=(B+B1+ B2
-A) 2,168 2,588 4,587
Energy sales (MU) D 74,174 80,115 86,479
Cumulative Impact on tariff (Rs./kWh) 0.29 0.32 0.53
Table 52: Profit and Loss statement - Scenario 3 (Rs. Cr.)
Profit and Loss Statement FY16 (A) FY17 FY18 FY19
Revenue
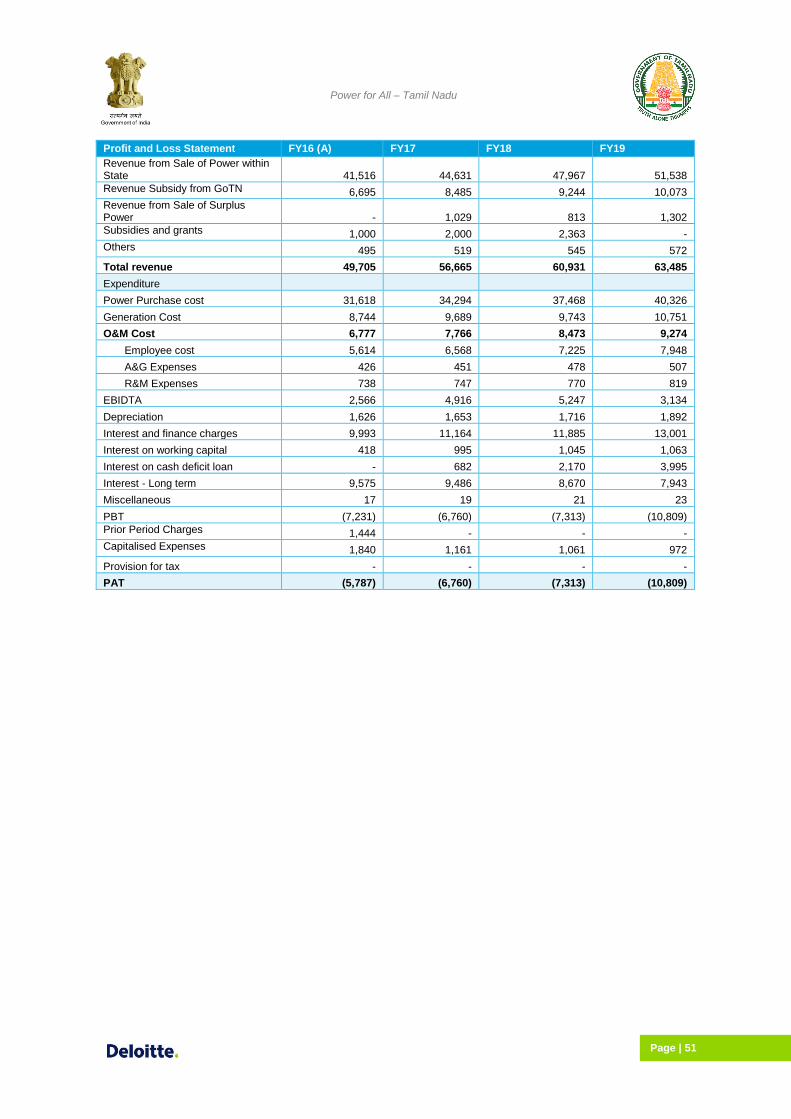
Power for All – Tamil Nadu
Page | 51
Profit and Loss Statement FY16 (A) FY17 FY18 FY19
Revenue from Sale of Power within State 41,516 44,631 47,967 51,538
Revenue Subsidy from GoTN 6,695 8,485 9,244 10,073
Revenue from Sale of Surplus Power - 1,029 813 1,302
Subsidies and grants 1,000 2,000 2,363 -
Others 495 519 545 572
Total revenue 49,705 56,665 60,931 63,485
Expenditure
Power Purchase cost 31,618 34,294 37,468 40,326
Generation Cost 8,744 9,689 9,743 10,751
O&M Cost 6,777 7,766 8,473 9,274
Employee cost 5,614 6,568 7,225 7,948
A&G Expenses 426 451 478 507
R&M Expenses 738 747 770 819
EBIDTA 2,566 4,916 5,247 3,134
Depreciation 1,626 1,653 1,716 1,892
Interest and finance charges 9,993 11,164 11,885 13,001
Interest on working capital 418 995 1,045 1,063
Interest on cash deficit loan - 682 2,170 3,995
Interest - Long term 9,575 9,486 8,670 7,943
Miscellaneous 17 19 21 23
PBT (7,231) (6,760) (7,313) (10,809)
Prior Period Charges 1,444 - - -
Capitalised Expenses 1,840 1,161 1,061 972
Provision for tax - - - -
PAT (5,787) (6,760) (7,313) (10,809)

Power for All – Tamil Nadu
Page | 52
Action Points for improvement in financial positions of TANGEDECO
TANGEDCO’s cost structure needs to be revamped in order to achieve financial independence and improvement in profitability margins. This may be achieved by reducing the input costs and increasing the revenue. The following action points describe the areas in which TANGEDCO may need to work:
1. Reduction in input costs: The input costs for the utility are effected by the following items: a. Own generation cost: One of the main components is the cost of coal. A part of
TANGEDCO’s coal requirement is met through imported coal. This puts additional pressure on TANGEDCO as they have to bear additional cost to ensure that power is available from its own stations. Further, non-availability of cheaper power in the market also adds to the woes of the utility. To reduce dependence on imported coal, for receipt of full linkage quantity from the Coal Companies against the available FSAs and increase of FSA quantum to 100% of the requirement for its existing and upcoming plants, TANGEDCO may highlight these issues regularly with appropriate authority such as MoC/Railways/Paradip Port.
b. Financing and Interest Cost: In FY15 TANGEDCO’s interest cost was about Rs.8,000 Cr.
This amount is attributable to long term and short loans taken by the utility to meet its financing requirements. In view of the huge interest burden of TANGEDCO, measures to decrease interest cost through availing refinances at reasonable rate of interest are being explored. The Tamil Nadu Power Finance Corporation (TNPFC) being one of the Government of Tamil Nadu owned utility extending loan assistance at cheaper rate of interest. Government of Tamil Nadu has advised various state owned public sector undertaking to divert their unutilised funds and matured deposits to invest in TNPFC for further funding to TANGEDCO, so that the power utility will save huge interest charges, besides managing the cash flow. Similarly, among the various loans with TNPFC, higher rate of interest bearing loans were pre-closed and further steps are also being taken up to prepay loans in the descending order of rate of interest. The utility may undertake an exercise of refinancing all or part of its debt. The utility may pursue authorities to seek reduction in interest amount of loans by PFC and REC. Further, the utility may also explore ways to increase the repayment period of loans. This may be instrumental in reducing the interest cost borne by the utility.
c. Reducing Power Purchase Cost: TANGEDCO has allocations from various central
generating stations and private stations besides operating its own station in order to meet the requirement of the state. The utility may be able to bring down its power purchase costs by efficiently managing the sources. TANGEDCO has already taken steps to replace the costlier sources of power by cheaper sources especially in case of private generating stations. Further, the utility buys power from some CGS with very high variable costs. The utility may explore means to replace such stations with medium or short term power from the open market in order to reduce the overall power purchase costs.
d. Availability of Hydro Stations: The current constraints in the inter-regional transfers have
restricted the utility’s ability to draw cheaper hydro power from surplus states. Once the inter-regional capacity is adequate, the utility may explore means for replacing the costly generation sources (own/private/central) with cheaper power available elsewhere in the country.
2. Increasing revenue: The gap between average billing rates is one of the major concern.
TANGEDCO may consider the following options for improving its revenue stream: a) Increase in targeted Subsidy: Currently, the subsidy declared by the government is at a
fixed rate. This amount is not sufficient to recover the cost of supply especially for the Agricultural consumers. TANGEDCO and GoTN may work towards providing subsidy at the cost of supply. This will help the utility to manage the cross subsidy requirement and help in rationalising the tariff structure for the state.
b) Increase in tariff: The scenarios in this chapter provide evidence that the utility may need
sustained tariff hikes across every consumer category. The utility may seek tariff hikes from the regulator based on its current deficit. Further, actions towards restructuring the tariff slabs will help in higher average tariff for the utility.
AT&C Loss reduction: The utility must ensure adherence to the AT&C loss reduction trajectory
proposed in this roadmap. Reduction in AT&C losses will help the utility to manage its financial gaps and further increase its revenue.

Power for All – Tamil Nadu
Page | 53
10. Other Initiatives
10.1. Capacity Building
For the training needs of the employees Tamil Nadu
power sector has 4 training institute which cater to
hydro, thermal, transmission and distribution,
management and safety training needs to its
employees. Ten Centers were established to cater
the needs of Staff in Distribution Areas.
One Cable Jointing Training and development
Centre has also been created to impart both the
officers & work force of TANGEDCO &
TANTRANSCO (formerly TNEB) in the field of UG
Power Cables & Jointing Techniques and in both
theory and practical.
Various initiatives taken by TANGEDCO are as
below:-
On Approval of Chairman cum Managing
Director of TANGEDCO, Annual training
programmes are being conducted to all the
officers / staff of
TANGEDCO/TANTRANSCO regularly
throughout the year to enhance / upgrade
their technical skills / functional skills /
management skills.
Memorandum of Agreement had been
signed between Tamil Nadu Generation
and Distribution Corporation (TANGEDCO)
and Central Institute for Rural
Electrification, a training institution under
Rural Electrification Corporation (REC).
Government of India has been financially
supporting TANGEDCO through Central
Institute for Rural Electrification (CIRE),
Hyderabad to conduct training to the of C &
D (class III & IV) employees of
TANGEDCO.
Transmission and Distribution Training &
Development Institute / Madurai of Tamil
Nadu Generation and Distribution
Corporation (TANGEDCO) is empanelled
as a Partner Training Institute (PTI) by
Government of India. Ministry of Power,
Government of India through Power
Finance Corporation Ltd., New Delhi has
been financially supporting TANGEDCO to
conduct training programmes under R-
APDRP (part-C) for level C & D (class III &
IV) employees.
Table 53: Training Centers and Institutes
Training Institute Training Centres
Staff Training College /
Chennai.
Cable Jointing and
training centre ,
Chennai
Thermal Training Institute &
Research Centre / North
Chennai.
Technical Training
and Development
Centre (TTDC)
,Korattur
Hydro Training Institute &
Research Centre /
Kuthiraikalmedu
TTDC ,Mettur Dam
Transmission &
Distribution,Training &
Development Institute and
Research Centre / Madurai
TTDC ,Pasumalai
TTDC,Thanjavur
TTDC,,Thiruvanna
malai
TTDC,,Tirunelveli
TTDC,Trichy
TTDC,Vellore
TTDC,Virudhunagar
TTDC,Coimbatore

Power for All – Tamil Nadu
Page | 54
11. Institutional Framework
A strong monitoring framework is essential to ensure the success of “Power for All” scheme. The following
structure shown in following table is being proposed to undertake regular monitoring of the progress of all
initiatives being undertaken in this Roadmap.
Table 54: Institutional Arrangement for Monitoring
Sl. Institutional arrangement
Responsibilities Monitoring frequency
1 Government of India (GOI) Committee
It is proposed that this committee will review the overall progress of the scheme and provide necessary support to ensure a coordinated response from Central Government – where necessary. This committee may be constituted with the following members – PFC, REC, CEA, SECI, EESL, BEE, Ministry of Coal, MNRE, MoPNG and Ministry of Power.
Quarterly
2 State Government Level Committee
It is proposed that a State level committee headed by the Secretary (Power) will be formed to review the progress of the scheme. This Committee will monitor the progress of the works undertaken as a part of the scheme and issue directions to enable faster execution.
Quarterly
3 Department Level Committee
It is proposed that a department level committee headed by Nodal Officer will be formed which shall undertake steps required to ensure the projects are progressing as per the action plan.
Monthly
4 Circle Level Committee
It is proposed to constitute a circle level committee headed by CE to take action that is necessary to ensure the projects are completed in a timely manner.
Monthly
5 Project Monitoring Unit (PMU)
A PMU shall be set up for monitoring the progress of works being undertaken under this scheme. The PMU will operate under Secretary (Power) and shall be operated by an independent agency.
Weekly

Power for All – Tamil Nadu
Page | 55
12. Rollout Plan
Particular
Unit Existing ending
Year wise addition Total
Additions till
Total
FY 16 FY 17 FY 18 FY 19 FY 19 Till FY19
G E N E R A T I O N
State Sector MW 7,501 0 0 660 660 8,161
Central Sector Allocations MW 5,464 662 695 327 1,684 7,148
Private Sector MW 11,468 1,665 1,800 1,800 5,265 16,733
Total IC including Allocation MW 24,416 2,327 2,495 2,787 7,609 32,042
Peak Demand MW 14,533 15,439 16,510 17,651
T R A N S M I S S I O N
Grid Substations (Nos) No.
765 kV No. 0 2 2 2
400 kV No. 6 10 1 2 11 17
230 kV No. 89 16 11 18 33 122
110 kV No. 807 30 30 73 90 897
902 56 42 95 136 1038
Intra-State Lines addition
765 kV Ckm 320 320 320
400 KV cKm 2,700 800 800 3,500
230 KV cKm 9,085 470 500 400 1,370 10,455
110 KV cKm 17,463 600 630 800 2,030 19,493
Total cKM 29,248 1,070 1,130 2,320 4,520 33,768
Intra-State Capacity Addition
765 KV MVA 0 0 0 7,500 7,500 7,500
400 KV MVA 6,010 4,665 945 4,550 10,160 16,170
230 KV MVA 20,140 2,741 2,616 1,400 6,757 26,897
110 KV MVA 33,750 420 420 420 1,260 35,010
Total MVA 59,900 7,826 3,981 13,870 25,677 85,577
Capacity for RE/Green Corridor
400/230 kV MVA 2,890 630 3,520
400/110 kV MVA 3,000 400 3,400
230/110 kV MVA 1,720 0 1,720
Total MVA 7,610 1,030 8,640
D I S T R I B U T I O N
DTS Nos 2,64,029 18,059 18,872 19,721 56,652 3,20,681
DTs Capacity MVA 35,750 4,515 4,718 4,930 14,163 49,913
HT Line cKm 169,409 3,654 3,764 3,877 11,295 1,80,704
LT Line cKm 609,544 11,399 11,684 11,976 35,059 6,44,603

Power for All – Tamil Nadu
Page | 56
13. Annexures
Annexure 1: List of Thermal Stations in the State- Total generation capacity
Sl. Name of power house Installed Capacity
(MW) Year of Commissioning PLF (2015-16)
1. Ennore TPS 2 X 60 MW 2 X 110 MW
I: 1970
14.81% II: 1971
III: 1972
IV: 1973
2. Tuticorin TPS 5 X 210 MW
I: 1979
76.80%
II: 1980
III: 1982
IV: 1992
IV: 1991
3. Mettur TPS –I 4 X 210 MW
I: 1987
81.01% II: 1987
III: 1989
IV: 1990
4. Mettur TPS –II 1 X 600 MW 2013-14 74.49%
5. North Chennai TPS-I 3 X 210 MW
I: 1994
80.39% II: 1995
III: 1996
6. North Chennai TPS-II 2 X 600 MW 2014-15 61.65%
Annexure 2: R&M Plan
I. Tuticorin Thermal Power Station
S.No Year Amount Rs. in Lakhs
1 2016-17 11,161.50
2 2017-18 17,632.0
3 2018-19 8,756.0
II. Mettur Thermal Power Station -I
S.No Year Amount Rs. in Lakhs
1 2016-17 10,684.16
2 2017-18 9,812.74
3 2018-19 7,876.98
II. North Chennai Thermal Power Station -I
S.No Year Amount Rs. in Lakhs
1 2016-17 187
2 2017-18 2,095
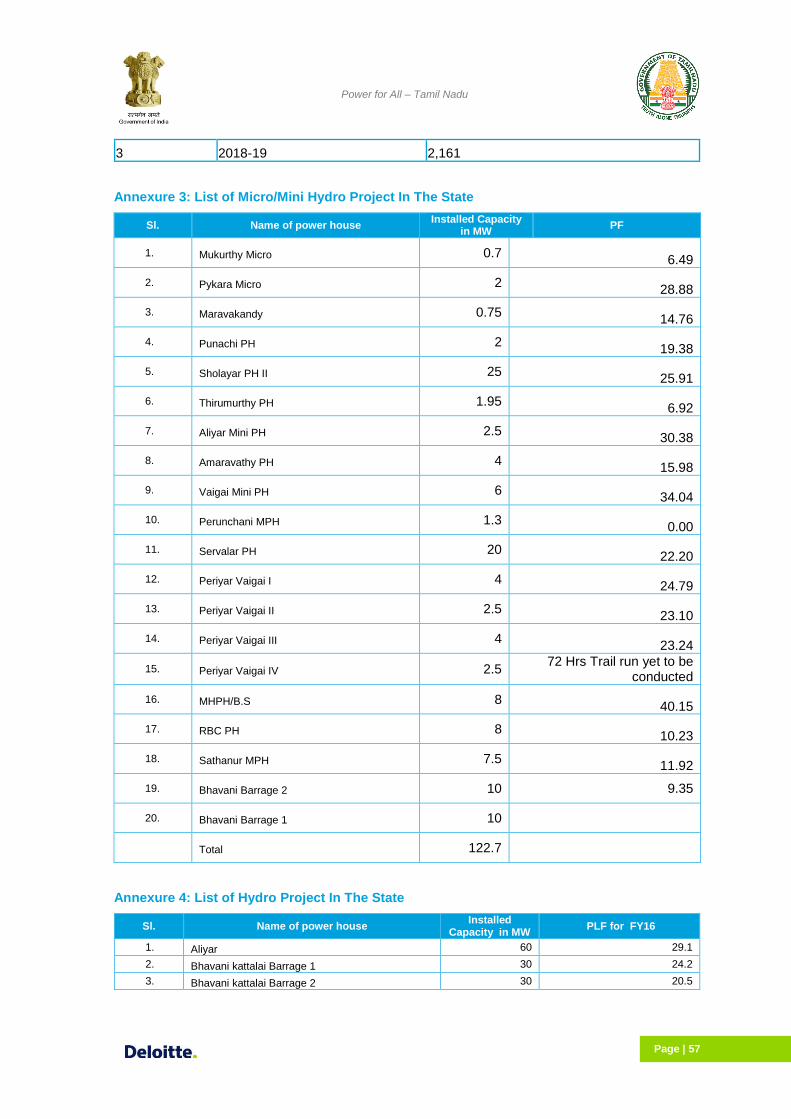
Power for All – Tamil Nadu
Page | 57
3 2018-19 2,161
Annexure 3: List of Micro/Mini Hydro Project In The State
Sl. Name of power house Installed Capacity
in MW PF
1. Mukurthy Micro 0.7 6.49
2. Pykara Micro 2 28.88
3. Maravakandy 0.75 14.76
4. Punachi PH 2 19.38
5. Sholayar PH II 25 25.91
6. Thirumurthy PH 1.95 6.92
7. Aliyar Mini PH 2.5 30.38
8. Amaravathy PH 4 15.98
9. Vaigai Mini PH 6 34.04
10. Perunchani MPH 1.3 0.00
11. Servalar PH 20 22.20
12. Periyar Vaigai I 4 24.79
13. Periyar Vaigai II 2.5 23.10
14. Periyar Vaigai III 4 23.24
15. Periyar Vaigai IV 2.5 72 Hrs Trail run yet to be
conducted
16. MHPH/B.S 8 40.15
17. RBC PH 8 10.23
18. Sathanur MPH 7.5 11.92
19. Bhavani Barrage 2 10 9.35
20. Bhavani Barrage 1 10
Total 122.7
Annexure 4: List of Hydro Project In The State
Sl. Name of power house Installed
Capacity in MW PLF for FY16
1. Aliyar 60 29.1
2. Bhavani kattalai Barrage 1 30 24.2
3. Bhavani kattalai Barrage 2 30 20.5

Power for All – Tamil Nadu
Page | 58
Sl. Name of power house Installed
Capacity in MW PLF for FY16
4. Bhavani kattalai Barrage 3 30 18.1
5. Kadamprai (PSS) 400 11.8
6. Kodayar-I 60 36.57
7. Kodayar II 40 24.43
8. Kundah I 60 44.56
9. Kundah II 175 40.97
10. Kundah III 180 23.34
11. Kundah IV 100 13.35
12. Kundah V 40 10.42
13. Kundah VI (Parson's valley) 30 9.78
14. Lower Mettur I 30 15
15. Lower Mettur II 30 23
16. Lower Mettur III 30 24
17. Lower Mettur IV 30 20
18. Mettur Dam PH 50 17
19. Mettur Tunnel 200 14
20. Moyar 36 36
21. Papanasam 32 41
22. Periyar 168 45
23. Pykara 59.2 10
24. Pykara Ultimate (PUSHEP) 150 21.08
25. Sarkarpathy 30 30.04
26. Sholayar 70 33.77
27. Suriliyar 35 30.09
Total 2185.2
Annexure 5: EHV Substation with Transformation capacity
Sl. Substation Voltage Level No. of
Transformers
Total Transformation Capacity (MVA)
[Existing]
Additional
Transformation Capacity (MVA) (Year of
Commissioning)
1 Arasur 400/230 kV 2X315 630 500 (FY20)
2 Hosur 400/230 kV 3X315 945 -
3 Karaikudi 400/230 kV 2X315 630 500 (FY20)
4 Madurai 400/230 kV 2X315 630 500 (FY17)
5 Madras 400/230 kV 3x315+2x200 = 1,345 MVA (ICTs owned by state)
6 Malekottaiyur 400/230 kV 2X315 630 500 (FY17)
7 Pugalur 400/230 kV 2X315 630 500 (FY17)
8 Salem 400/230 kV 2x315+2x200 = 1,030 MVA (ICTs owned by state)
9 Tirunelveli 400/230 kV 2X315 630 500 (FY20)
10 Trichy 400/230 kV 2X315 630 500
11 Udumalpet 400/230 kV 3X315 945 -
12 Thiruvalem 765/400 kV 2x1500 3,000 -

Power for All – Tamil Nadu
Page | 59
Sl. Substation Voltage Level No. of
Transformers
Total Transformation Capacity (MVA)
[Existing]
Additional
Transformation Capacity (MVA) (Year of
Commissioning)
13 Tuticorin PS 765/400 kV
14 Nagapattinam PS 765/400 kV
Total 9,300* 3,500*
*ICTs owned by POWERGRID
Annexure 6: Existing 400 KV capacity of TANTRANSCO as on 31.03.2016
Sl. Name Of The
SS
Volt Ratio In
KV
Existing Capacity In
MVA
EDS Regio
n Owned by
1 Sriperumbudur 400 /230-110 1345 (3X315+2x200) CGL CNI/S TANTRANSC
O
2 Alamathy 400 /230-110 1145 (3x315+1x200) CNI/W CNI/N TANTRANSC
O
3 K.R.Thoppur 400 /230-110 1030 (2X315+2x200) SLM ERD TANTRANSC
O
4 Sunguvarchatra
m 400 /230-110 1030 (2x315+2x200) CGL CNI/S
TANTRANSC
O
5 Kayathar 400/ 230-110 830 (2X315+1x200)) TIN TIN TANTRANSC
O
6 Thiruvalam 400 /230 630 (2x315) VLR VLR TANTRANSC
O
Total 6,010
Annexure 7: Year on Year Infrastructure Building Plan
Sl. Description Phasing year
TOTAL 2016-17 2017-18 2018-19
1. Establishment of 400 kV SS 10 1 2 13
2. Establishment of 230 kV SS 16 11 18 45
3. Establishment of 110 kV SS 30 30 73 133
4. Establishment of 33 kV SS 100 81 77 258
TOTAL Sub Stations 181 156 112 449
5. Upgradation/Conversion 19 3 3 25
6. Introduction of Voltage Ratio 17 8 14 39
7. Enhancement of Power Transformers 51 47 42 140
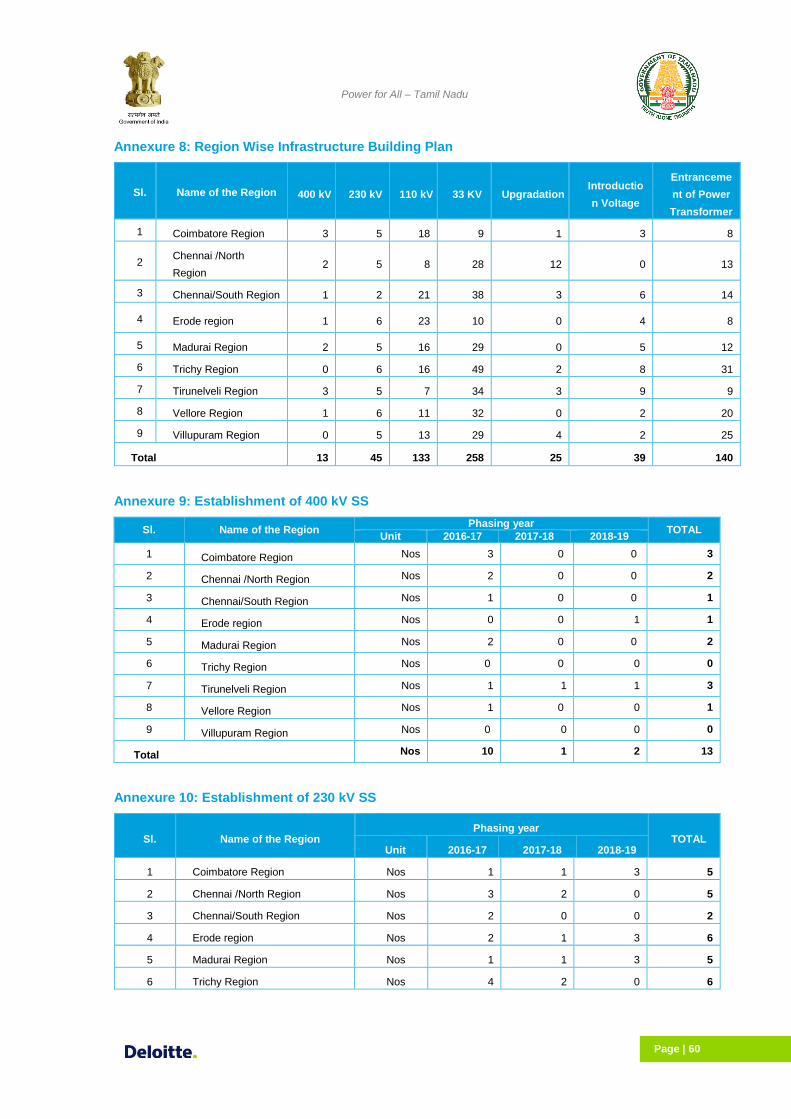
Power for All – Tamil Nadu
Page | 60
Annexure 8: Region Wise Infrastructure Building Plan
Sl. Name of the Region 400 kV 230 kV 110 kV 33 KV Upgradation Introductio
n Voltage
Entranceme
nt of Power
Transformer
1 Coimbatore Region 3 5 18 9 1 3 8
2 Chennai /North
Region 2 5 8 28 12 0 13
3 Chennai/South Region 1 2 21 38 3 6 14
4 Erode region 1 6 23 10 0 4 8
5 Madurai Region 2 5 16 29 0 5 12
6 Trichy Region 0 6 16 49 2 8 31
7 Tirunelveli Region 3 5 7 34 3 9 9
8 Vellore Region 1 6 11 32 0 2 20
9 Villupuram Region 0 5 13 29 4 2 25
Total 13 45 133 258 25 39 140
Annexure 9: Establishment of 400 kV SS
Sl. Name of the Region Phasing year
TOTAL Unit 2016-17 2017-18 2018-19
1 Coimbatore Region Nos 3 0 0 3
2 Chennai /North Region Nos 2 0 0 2
3 Chennai/South Region Nos 1 0 0 1
4 Erode region Nos 0 0 1 1
5 Madurai Region Nos 2 0 0 2
6 Trichy Region Nos 0 0 0 0
7 Tirunelveli Region Nos 1 1 1 3
8 Vellore Region Nos 1 0 0 1
9 Villupuram Region Nos 0 0 0 0
Total Nos 10 1 2 13
Annexure 10: Establishment of 230 kV SS
Sl. Name of the Region Phasing year
TOTAL Unit 2016-17 2017-18 2018-19
1 Coimbatore Region Nos 1 1 3 5
2 Chennai /North Region Nos 3 2 0 5
3 Chennai/South Region Nos 2 0 0 2
4 Erode region Nos 2 1 3 6
5 Madurai Region Nos 1 1 3 5
6 Trichy Region Nos 4 2 0 6

Power for All – Tamil Nadu
Page | 61
Sl. Name of the Region Phasing year
TOTAL Unit 2016-17 2017-18 2018-19
7 Tirunelveli Region Nos 2 0 3 5
8 Vellore Region Nos 0 2 4 6
9 Villupuram Region Nos 1 2 2 5
Total 16 11 18 45
Annexure 11: Establishment of 110 kV SS
Sl. Name of the Region Phasing year
TOTAL Unit 2016-17 2017-18 2018-19
1 Coimbatore Region Nos 6 4 8 18
2 Chennai /North Region Nos 1 1 6 8
3 Chennai/South Region Nos 0 6 15 21
4 Erode region Nos 5 5 13 23
5 Madurai Region Nos 4 1 11 16
6 Trichy Region Nos 4 4 8 16
7 Tirunelveli Region Nos 3 1 3 7
8 Vellore Region Nos 4 7 0 11
9 Villupuram Region Nos 3 1 9 13
Total Nos 30 30 73 133
Annexure 12: Establishment of 33 kV SS
Sl. Name of the Circle Phasing year
TOTAL Units 2016-17 2017-18 2018-19
1 Coimbatore Region Nos 2 4 3 9
2 Chennai /North Region Nos 13 6 9 28
3 Chennai/South Region Nos 12 15 11 38
4 Erode region Nos 4 2 4 10
5 Madurai Region Nos 15 5 9 29
6 Trichy Region Nos 17 15 17 49
7 Tirunelveli Region Nos 13 13 8 34
8 Vellore Region Nos 11 13 8 32
9 Villupuram Region Nos 13 8 8 29
Total Nos 100 81 77 258
Annexure 13: Upgradation of Sub Stations

Power for All – Tamil Nadu
Page | 62
Sl. Name of the Circle Phasing year
TOTAL Units 2016-17 2017-18 2018-19
1 Coimbatore Region Nos 1 0 0 1
2 Chennai /North Region Nos 10 1 1 12
3 Chennai/South Region Nos 1 1 1 3
4 Erode region Nos 0 0 0 0
5 Madurai Region Nos 0 0 0 0
6 Trichy Region Nos 2 0 0 2
7 Tirunelveli Region Nos 2 1 0 3
8 Vellore Region Nos 0 0 0 0
9 Villupuram Region Nos 3 0 1 4
Total Nos 19 3 3 25
Annexure 14: Enhancement of Power Transformers
Sl. Name of the Circle Phasing year
TOTAL Units 2016-17 2017-18 2018-19
1 Coimbatore Region Nos 0 6 2 8
2 Chennai /North Region Nos 4 4 5 13
3 Chennai/South Region Nos 1 10 3 14
4 Erode region Nos 3 2 3 8
5 Madurai Region Nos 4 2 6 12
6 Trichy Region Nos 14 9 8 31
7 Tirunelveli Region Nos 5 1 3 9
8 Vellore Region Nos 7 6 7 20
9 Villupuram Region Nos 13 7 5 25
Total 51 47 42 140
Annexure 15: Integrated Power Development Scheme (IPDS)
SUMMARY Project Cost for 37 EDCs (Volume II a sheet of DPRs)
Sl. Particular Unit Quantity Project Cost
Rs. In Lac
A. 33/11 KV S/S : New Nos. 55 12,035.59
B. 33/11 KV S/S : Additional Transformer Nos. 18 2,276.47
C. 33/11 KV S/S : Transformer capacity
enhancement Nos. 18 1,432.59
D. Renovation & Modernization of 33/11 kV SS Nos. 1 29.89
E. New 33 KV new feeders/Bifurcation of
feeders: Kms 461.275 3,689.95
F. 33 KV feeders Reconductoring/Augmentation Kms 0.5 26.09

Power for All – Tamil Nadu
Page | 63
SUMMARY Project Cost for 37 EDCs (Volume II a sheet of DPRs)
Sl. Particular Unit Quantity Project Cost
Rs. In Lac
G. 33 kV Line Bay Extension at EHV station Nos. 5 138.58
H. 22/11 kV Line : New Feeder/ Feeder
Bifurcation Kms 3,839.851 27,329.16
I. 11 kV Line : Augmentation/Reconductoring Kms 25.96 407.07
J. Arial Bunched Cable Kms 249.482 2,295.97
K. UG Cable Kms 518.2717 13,620.09
L. 22/11 KV Bay Extension Kms 61 934.06
M. Installation of Distribution Transformer Nos. 392 1,209.79
N. LT Line : New Feeder/ Feeder Bifurcation Kms 2,149.173 10,479.78
O. LT Line : Augmentation/Reconductoring Kms 2,701.801 8,934.66
P. Capacitor Bank Nos. 78 1,987.65
Q. HVDS Nos. 14,833 32,756.63
R. Metering Nos. 2,315,114 34,515.90
S. Provisioning of solar panel Nos. 1,972 1,380.40
T. Others (Provision for new street light switch
point, DPs, Railway Crossing etc.,) Lot 650.88
GRAND TOTAL 156,131.27

Power for All – Tamil Nadu
Page | 64
Annexure 16: DDUGJY Scheme
S No Description Amount in crores
1 System Strengthening
a) Creation of new substation 617.18
b) Augmentation of capacity of transformers
c) Renovation and modernization
2 Replacement of energy meter to static meter 119.66
3 Feeder Segregation 125.94
4 Rural Electrification
a) APL Households 56.74
b) BPL Households
Total 919.52

Power for All – Tamil Nadu
Page | 65
Annexure 17: Existing Voltage Wise Capacity of TANTRANSCO Sub-Stations as on 31.03.2016
Sl. Name of the Circle
400/230 KV 400/110 KV 230/110 KV 230/33 KV 110/33 KV 110/22 KV 110/11 kV 66/11 kV
No.
of
SS
MVA
No.
of
SS
MVA
No.
of
SS
MVA
No.
of
SS
MVA
No.
of
SS
MVA No. of
SS MVA
Nof
SSo
MVA
1 COIMBATORE EDC/METRO 0 0 0 0 1 200 0 0 1 48 1 32 8 496 - -
2 COIMBATORE EDC/NORTH 0 0 0 0 2 500 0 0 2 101 15 601 3 104 - -
3 COIMBATORE EDC/SOUTH 0 0 0 0 2 700 2 400 6 341 8 344 4 104 - -
4 NILGIRIS EDC 0 0 0 0 1 150 0 0 1 30 2 35 4 60 4 31.25
5 UDUMALPET EDC 0 0 0 0 2 500 0 0 0 0 18 618 - - - -
6 TIRUPPUR EDC 0 0 0 0 3 800 0 0 9 514 2 48 17 518 - -
7 CHENNAI EDC/CENTRAL 0 0 0 0 3 700 1 200 8 750 0 0 3 64 - -
8 CHENNAI EDC/NORTH 1 315 1 200 5 1080 0 0 16 846 0 0 15 378 - -
9 CHENNAI EDC/WEST 1 945 1 200 5 1200 0 0 5 520 3 500 0 0 8 274
10 CHENGALPATTU 2 1575 2 800 7 1450 0 0 4 816 0 0 13 230 - -
11 CHENNAI EDC/SOUTH I 0 0 0 0 2 500 0 0 5 537 0 0 3 100 - -
12 CHENNAI EDC/SOUTH II 0 0 0 0 4 1080 0 0 13 1186 0 0 0 0 - -
13 KANCHIPURAM EDC 0 0 0 0 0 0 0 0 12 619 0 0 1 20 - -
14 ERODE - - - - 2 500 0 0 4 230 9 332 6 130 - -
15 GOBI - - - - 2 500 0 0 5 188 6 186 11 242 - -
16 METTUR 2 1260 1 400 2 400 0 0 2 82 13 517 3 84 - -
17 NAMAKKAL - - - - 2 400 0 0 0 0 16 602 3 68 - -
18 SALEM - - - - 3 600 0 0 0 0 20 894 0 0 - -
19 DINDIGUL EDC 0 0 0 0 2 500 0 0 5 164 24 684 9 164 - -

Power for All – Tamil Nadu
Page | 66
Sl. Name of the Circle
400/230 KV 400/110 KV 230/110 KV 230/33 KV 110/33 KV 110/22 KV 110/11 kV 66/11 kV
No.
of
SS
MVA
No.
of
SS
MVA
No.
of
SS
MVA
No.
of
SS
MVA
No.
of
SS
MVA No. of
SS MVA
Nof
SSo
MVA
20 MADURAI EDC 0 0 0 0 1 200 0 0 6 105 0 0 16 401.5 - -
21 MADURAI METRO 0 0 0 0 1 200 0 0 13 524 0 0 5 76 - -
22 RAMNAD EDC - - - - 2 430 0 0 6 171 1 10 5 60 - -
23 SIVAGANGAI EDC - - - - 1 150 0 0 1 16 13 250 7 100 - -
24 THENI EDC 0 0 0 0 1 300 0 0 1 41 16 473 0 0 - -
25 KARUR EDC 0 0 0 0 1 300 1 200 4 188 0 0 12 244 - -
26 NAGAPATTINAM EDC 0 0 0 0 1 200 0 0 9 360 0 0 3 56 - -
27 THIRUVARUR EDC - - - - 1 300 - - 4 190 - - 5 108 - -
28 PUDUKOTTAI EDC 0 0 0 0 1 200 0 0 9 342 5 123 5 80 - -
29 PERAMBALUR EDC - - - - 2 300 0 0 3 140 7 144 2 30 - -
30 TRICHY EDC/METRO - - - - 3 650 0 0 11 516 5 147 13 240 - -
31 THANJAVUR EDC - - - - 2 400 0 0 11 581 2 40 13 288 - -
32 KANYAKUMARI EDC - - - - 1 300 0 0 1 64 0 0 13 284 - -
33 TIRUNELVELI EDC 1 630 1 200 1 300 5 850 16 997 0 0 25 432 - -
34 TUTICORIN EDC - - - - 1 200 1 226 11 455.5 4 134 3 46 3 12.5
35 VIRUDHUNAGAR EDC - - - - 2 380 0 0 8 386 0 0 18 432 - -
36 DHARMAPURI EDC - - - - 1 300 0 0 5 236 0 0 3 86 - -
37 KRISHNAGIRI EDC - - - - 2 500 0 0 1 90 0 0 0 0 - -
38 THIRUPPATHUR EDC - - - - 2 350 0 0 7 332 0 0 6 126 - -
39 VELLORE EDC 1 630 0 0 2 600 0 0 - -

Power for All – Tamil Nadu
Page | 67
Sl. Name of the Circle
400/230 KV 400/110 KV 230/110 KV 230/33 KV 110/33 KV 110/22 KV 110/11 kV 66/11 kV
No.
of
SS
MVA
No.
of
SS
MVA
No.
of
SS
MVA
No.
of
SS
MVA
No.
of
SS
MVA No. of
SS MVA
Nof
SSo
MVA
40 CUDDALORE EDC - - - - 1 200 0 0 10 452 1 48 10 266 8 146
41 T.V.MALAI EDC - - - - 2 440 0 0 14 651 2 26 3 50 - -
42 KALLAKURICHI EDC 1 100 0 0 1 42 15 370 1 20 - -
43 VILLUPURAM EDC - - - - 1 200 0 0 6 230 10 308 0 0 0 0

Power for All – Tamil Nadu
Page | 68
Annexure 18: SAIFI SAIDI values of R APDRP Towns (August 2016)
S.
No. Name of Town Nos. of Feeder Covered Number of Consumers Town
SAIDI Town SAIFI
1 Coonoor 4 23443 11:04 8.7
2 Gudallur (Coimbatore)
2 14515 0 0
3 Palladam 5 9409 0 0
4 Vickramasingapuram 2 13023 0 0
5 Aruppukottai 2 23621 01:10 0.91
6 Rajapalayam 8 49880 0 0
7 Sattur 2 12682 0 0
8 Virudhunagar 4 31287 0 0
9 Attur 3 16382 0 0
10 Bhavani 5 41019 01:25 1.22
11 Gobichettipalayam 4 21604 04:06 6.71
12 Kadayanallur 2 28951 0 0
13 Tirunelveli 29 178093 00:01 0.29
14 Ambur 6 34394 00:22 0.3
15 Arni 4 21453 02:18 3.49
16 Aranthaangi 2 17497 08:33 2.53
17 Arcot 11 49214 03:28 7.52
18 Chengalpattu 6 27546 01:14 4.03
19 Chidambaram 4 29047 03:04 6.43
20 Chinnamanur 1 15529 00:13 1
21 Cuddalore 5 64788 00:33 1.89
22 Dharmapuri 3 17571 0 0
23 Edappady 3 8249 08:33 6.97
24 Erode 11 96360 02:17 1.84
25 Gudaloore (Madurai) 2 11421 0 0
26 Gudiyatham 6 35732 03:46 3.97
27 Jeyankondam 2 8501 07:39 8.52
28 Kallakkurichi 4 23927 0 0
29 Kambam 1 22901 10:28 12
30 Karur 15 66079 02:13 3.31
31 Kodaikanal 1 11500 0 0
32 Krishnagiri 1 10816 0 0
33 Mallasamudram 4 7598 01:17 4.63
34 Maraimalainagar 11 34461 00:01 0.32

Power for All – Tamil Nadu
Page | 69
S. No.
Name of Town Nos. of Feeder Covered Number of Consumers Town SAIDI
Town SAIFI
35 Melvisharam 2 9975 05:59 10.38
36 Mettupalayam 3 21943 7 7.42
37 Mettur 3 16664 00:11 0.99
38 Namakkal 2 29769 00:13 2
39 Nellikuppam 4 12545 00:02 0.04
40 Palani 1 26349 0 0
41 Panruti 4 21481 02:02 2
42 Perambalur 2 24949 0 0
43 Periyakulam 1 14484 01:05 5
44 Periyasemur 4 18201 03:28 12.48
45 Pernampattu 2 12657 18:29 12
46 Pollachi 8 48522 02:33 5.31
47 Pudukottai 2 53642 01:05 1.59
48 Rasipuram 1 20662 06:05 18
49 Sathyamangalam 4 16064 10:35 10.69
50 Sivagangai 2 19479 0 0
51 Sivagasi 1 11436 00:11 21
52 Thanjavur 5 28830 01:12 6.52
53 Theniallinagaram 5 36440 00:02 1.01
54 Thuraiyur 1 15671 0 0
55 Tiruchengode 5 39836 02:32 14.45
56 Tirupathur 2 22069 03:20 9.82
57 Tiruttani 2 18632 00:26 10.26
58 Tiruvannamalai 11 50713 00:02 0.9
59 Tiruvettipuram 2 17126 00:05 3.43
60 Vaniyambadi 6 32251 03:05 1.88
61 Vellakoil 8 18015 01:36 4.58
62 Villupuram 4 23932 08:12 12.57
63 Virudhachalam 1 2 02:32 7

Power for All – Tamil Nadu
Page | 70
Annexure 19: Projected Cash Flow (Base Case)
The projected Balance Sheet & Cash Flow till FY19 under base case is presented below –
Cash flow statement FY 16 FY 17 FY 18 FY 19
Cash from Operations
Revenue 49,300.19 56,557.05 60,810.46 63,349.91
Operating Costs (47,155.97) (50,607.23) (54,644.54) (59,403.16)
Miscellaneous expenses
Increase in Short Term Capital requirements (1,059.97) (1,279.21) (408.00) (153.96)
Tax - - - -
Net Cash from Operations 1,084.25 4,670.62 5,757.92 3,792.78
Cash from Investment Activities
Capex - (2,850.00) (3,064.00) (7,034.00)
Net Cash from Investment Activities - (2,850.00) (3,064.00) (7,034.00)
Cash from Financing Activities
Equity Investments - 163.73 344.33 2,110.20
Debt Drawn 17,999.50 1,554.21 1,975.61 3,485.28
Loan Repayment (9,335.25) (7,741.30) (7,938.86) (8,287.39)
Increase in working capital loan 1,059.97 1,279.21 408.00 153.96
Payment of past current liabilities - - - -
Grants 3,069.44 1,132.06 744.06 1,438.52
Interest on cash deficit loan - (662.60) (2,107.30) (3,879.81)
Interest on Loans (9,575.25) (9,486.08) (8,669.74) (7,933.04)
Interest on Working Capital Loan (418.14) (1,001.95) (1,051.93) (1,070.79)
Net Cash from Financing Activities 2,800.27 (14,762.72) (16,295.83) (13,983.07)
Net Cash Balances
Cash BF 897.57 1,418.69 (11,523.41) (25,125.33)
Cash Flow during the year 3,884.52 (12,942.10) (13,601.92) (17,224.29)
Cash 1,418.69 (11,523.41) (25,125.33) (42,349.61)

Power for All – Tamil Nadu
Page | 71
Annexure 20: Projected Balance sheet (Base Case)
Balance Sheet statement (Rs. Cr.) FY 16 FY 17 FY 18 FY 19
Assets
Current Assets
Cash @ Bank 1,418.69 0.00 0.00 0.00
Short term loan and advances 496.59 496.59 496.59 496.59
Other Current Assets -615 -615 -615 -615
Stocks – Stores 2,579 3,259 3,276 3,306
Receivables 40,546 50,483 51,667 52,601
Total Current Assets 44,426 53,624 54,826 55,790
Non-current Assets
Gross Fixed Assets 68,060 69,770 72,748 79,634
Less: Accumulated Depreciation -8,983 -10,636 -12,352 -14,232
Other current assets 1,856 1,856 1,856 1,856
Loans and Advances 55,820.83 62,237.65 69,146.21 79,458.32
Capital Works in Progress 8,321 9,461 9,546 9,694
Net Fixed Assets 125,074 132,687 140,944 156,410
Total Assets 169,500 186,312 195,770 212,200
Liabilities
Long Term Debt 75,859 69,672 63,708 58,906
Long Term Liabilities 0 0 0 0
Working Capital Loan/ Short term borrowings
5,395 12,070 12,478 12,632
Cash deficit loan - 11,523.41 25,125.33 42,349.61
Trade payables 8,719 12,224 12,548 12,852
Short term provisions 0 0 0 0
Current Liabilities 48,908 48,908 48,908 48,908
Total 138,881 154,397 162,767 175,648
Equity
Share Capital 20,001 20,165 20,509 22,620
Grants 5,118 6,250 6,994 8,433
Consumer Contributions
Capital Liabilities
Retained Earnings 2,386 5,499 5,499 5,499
Total 30,619 31,914 33,003 36,551
Total Liabilities 169,500 186,312 195,770 212,200

Power for All – Tamil Nadu
Page | 72
Annexure 21: Projected Cash Flow (Scenario 1)
Cash flow statement FY 16 FY 17 FY 18 FY 19
Cash from Operations
Revenue 49,300.19 58,986.28 66,176.23 72,238.79
Operating Costs (47,155.97) (50,607.23) (54,644.54) (59,403.16)
Miscellaneous expenses
Increase in Short Term Capital Requirements (1,059.97) (1,688.09) (902.27) (746.96)
Tax - - - (12.82)
Net Cash from Operations 1,084.25 6,690.97 10,629.42 12,075.85
Cash from Investment Activities
Capex - (2,850.00) (3,064.00) (7,034.00)
Net Cash from Investment Activities - (2,850.00) (3,064.00) (7,034.00)
Cash from Financing Activities
Equity Investments - 163.73 344.33 2,110.20
Debt Drawn 17,999.50 1,554.21 1,975.61 3,485.28
Loan Repayment (9,335.25) (7,741.30) (7,938.86) (8,287.39)
Increase in working capital loan 1,059.97 1,688.09 902.27 746.96
Payment of past current liabilities - - - -
Grants 3,069.44 1,132.06 744.06 1,438.52
Interest on cash deficit loan - (517.45) (1,478.69) (2,323.57)
Interest on Loans (9,575.25) (9,486.08) (8,669.74) (7,933.04)
Interest on Working Capital Loan (418.14) (1,052.04) (1,162.57) (1,254.07)
Net Cash from Financing Activities 2,800.27 (14,258.78) (15,283.59) (12,017.11)
Net Cash Balances
Cash BF 897.57 1,418.69 (8,999.12) (16,717.29)
Cash Flow during the year 3,884.52 (10,417.81) (7,718.17) (6,975.26)
Cash 1,418.69 (8,999.12) (16,717.29) (23,692.55)

Power for All – Tamil Nadu
Page | 73
Annexure 22: Projected Balance sheet (Scenario 1)
Balance Sheet statement (Rs. Cr.) FY 16 FY 17 FY 18 FY 19
Assets
Current Assets
Cash @ Bank 1,418.69 0.00 0.00 (0.00)
Short term loan and advances 496.59 496.59 496.59 496.59
Other Current Assets -615 -615 -615 -615
Stocks – Stores 2,579 3,259 3,276 3,306
Receivables 40,546 50,916 52,648 54,263
Total Current Assets 44,426 54,057 55,806 57,451
Non-current Assets
Gross Fixed Assets 68,060 69,770 72,748 79,634
Less: Accumulated Depreciation -8,983 -10,636 -12,352 -14,232
Other current assets 1,856 1,856 1,856 1,856
Loans and Advances 55,820.83 59,689.32 60,661.03 60,636.13
Capital Works in Progress 8,321 9,461 9,546 9,694
Net Fixed Assets 125,074 130,139 132,459 137,588
Total Assets 169,500 184,196 188,265 195,039
Liabilities
Long Term Debt 75,859 69,672 63,708 58,906
Long Term Liabilities 0 0 0 0
Working Capital Loan/ Short term borrowings 5,395 12,479 13,381 14,128
Cash deficit loan - 8,999.12 16,717.29 23,692.55
Trade payables 8,719 12,224 12,548 12,852
Short term provisions 0 0 0 0
Current Liabilities 48,908 48,908 48,908 48,908
Total 138,881 152,282 155,262 158,487
Equity
Share Capital 20,001 20,165 20,509 22,620
Grants 5,118 6,250 6,994 8,433
Consumer Contributions
Capital Liabilities
Retained Earnings 2,386 5,499 5,499 5,499
Total 30,619 31,914 33,003 36,551
Total Liabilities 169,500 184,196 188,265 195,039

Power for All – Tamil Nadu
Page | 74
Annexure 23: Projected Cash Flow (Scenario 2)
Cash flow statement FY 16 FY 17 FY 18 FY 19
Cash from Operations
Revenue 49,300.19 56,557.05 60,810.46 63,349.91
Operating Costs (47,155.97) (50,604.09) (54,635.47) (59,390.82)
Miscellaneous expenses
Increase in Short Term Capital Requirements (1,059.97) (1,279.21) (408.00) (153.96)
Tax - - - -
Net Cash from Operations 1,084.25 4,673.76 5,766.99 3,805.13
Cash from Investment Activities
Capex - (2,850.00) (3,064.00) (7,034.00)
Net Cash from Investment Activities - (2,850.00) (3,064.00) (7,034.00)
Cash from Financing Activities
Equity Investments - 411.75 592.35 2,110.20
Debt Drawn 17,999.50 2,050.25 2,471.65 3,671.30
Loan Repayment (9,335.25) (7,790.91) (8,038.07) (8,405.20)
Increase in working capital loan 1,059.97 1,279.21 408.00 153.96
Payment of past current liabilities - - - -
Grants 3,069.44 388.00 - 1,252.50
Interest on cash deficit loan - (667.00) (2,126.66) (3,924.15)
Interest on Loans (9,575.25) (9,511.75) (8,743.90) (8,033.94)
Interest on Working Capital Loan (418.14) (1,001.95) (1,051.93) (1,070.79)
Net Cash from Financing Activities 2,800.27 (14,842.39) (16,488.56) (14,246.11)
Net Cash Balances
Cash BF 897.57 1,418.69 (11,599.94) (25,385.52)
Cash Flow during the year 3,884.52 (13,018.63) (13,785.57) (17,474.99)
Cash 1,418.69 (11,599.94) (25,385.52) (42,860.50)

Power for All – Tamil Nadu
Page | 75
Annexure 24: Projected Balance Sheet (Scenario 2)
Balance Sheet statement (Rs. Cr.) FY 16 FY 17 FY 18 FY 19
Assets
Current Assets
Cash @ Bank 1,418.69 (0.00) (0.00) (0.00)
Short term loan and advances 496.59 496.59 496.59 496.59
Other Current Assets -615 -615 -615 -615
Stocks – Stores 2,579 3,259 3,276 3,306
Receivables 40,546 50,483 51,667 52,601
Total Current Assets 44,426 53,624 54,826 55,790
Non-current Assets
Gross Fixed Assets 68,060 69,770 72,748 79,634
Less: Accumulated Depreciation -8,983 -10,648 -12,430 -14,395
Other current assets 1,856 1,856 1,856 1,856
Loans and Advances 55,820.83 62,276.37 69,335.71 79,865.00
Capital Works in Progress 8,321 9,461 9,546 9,694
Net Fixed Assets 125,074 132,714 141,056 156,654
Total Assets 169,500 186,339 195,882 212,444
Liabilities
Long Term Debt 75,859 70,118 64,552 59,818
Long Term Liabilities 0 0 0 0
Working Capital Loan/ Short term borrowings
5,395 12,070 12,478 12,632
Cash deficit loan - 11,599.94 25,385.52 42,860.50
Trade payables 8,719 12,224 12,548 12,852
Short term provisions 0 0 0 0
Current Liabilities 48,908 48,908 48,908 48,908
Total 138,881 154,920 163,871 177,071
Equity
Share Capital 20,001 20,413 21,006 23,116
Grants 5,118 5,506 5,506 6,758
Consumer Contributions
Capital Liabilities
Retained Earnings 2,386 5,499 5,499 5,499
Total 30,619 31,418 32,011 35,373
Total Liabilities 169,500 186,339 195,882 212,444

Power for All – Tamil Nadu
Page | 76
Annexure 25: Projected Cash Flow (Scenario 3)
Cash flow statement FY 16 FY 17 FY 18 FY 19
Cash from Operations
Revenue 49,300.19 56,227.13 60,461.29 62,980.32
Operating Costs (47,155.97) (50,607.23) (54,644.54) (59,401.98)
Miscellaneous expenses
Increase in Short Term capital requirements (1,059.97) (1,224.22) (404.79) (150.56)
Tax - - - -
Net Cash from Operations 1,084.25 4,395.68 5,411.95 3,427.78
Cash from Investment Activities
Capex - (2,850.00) (3,064.00) (7,034.00)
Net Cash from Investment Activities - (2,850.00) (3,064.00) (7,034.00)
Cash from Financing Activities
Equity Investments - 163.73 344.33 2,110.20
Debt Drawn 17,999.50 1,554.21 1,975.61 3,671.30
Loan Repayment (9,335.25) (7,741.30) (7,938.86) (8,305.99)
Increase in working capital loan 1,059.97 1,224.22 404.79 150.56
Payment of past current liabilities - - - -
Grants 3,069.44 1,132.06 744.06 1,252.50
Interest on cash deficit loan - (682.31) (2,170.01) (3,994.77)
Interest on Loans (9,575.25) (9,486.08) (8,669.74) (7,942.67)
Interest on Working Capital Loan (418.14) (995.21) (1,044.80) (1,063.25)
Net Cash from Financing Activities 2,800.27 (14,830.68) (16,354.62) (14,122.12)
Net Cash Balances
Cash BF 897.57 1,418.69 (11,866.31) (25,872.99)
Cash Flow during the year 3,884.52 (13,285.00) (14,006.67) (17,728.34)
Cash 1,418.69 (11,866.31) (25,872.99) (43,601.33)

Power for All – Tamil Nadu
Page | 77
Annexure 26: Projected Balance Sheet (Scenario 3)
Balance Sheet statement (Rs. Cr.) FY 16 FY 17 FY 18 FY 19
Assets
Current Assets
Cash @ Bank 1,418.69 (0.00) (0.00) (0.00)
Short term loan and advances 496.59 496.59 496.59 496.59
Other Current Assets -615 -615 -615 -615
Stocks – Stores 2,579 3,259 3,276 3,306
Receivables 40,546 50,428 51,609 52,540
Total Current Assets 44,426 53,569 54,768 55,728
Non-current Assets
Gross Fixed Assets 68,060 69,770 72,748 79,634
Less: Accumulated Depreciation -8,983 -10,636 -12,352 -14,244
Other current assets 1,856 1,856 1,856 1,856
Loans and Advances 55,820.83 62,580.56 69,893.87 80,702.78
Capital Works in Progress 8,321 9,461 9,546 9,694
Net Fixed Assets 125,074 133,030 141,692 157,643
Total Assets 169,500 186,600 196,460 213,371
Liabilities
Long Term Debt 75,859 69,672 63,708 59,074
Long Term Liabilities 0 0 0 0
Working Capital Loan/ Short term borrowings
5,395 12,015 12,420 12,570
Cash deficit loan - 11,866.31 25,872.99 43,601.33
Trade payables 8,719 12,224 12,548 12,852
Short term provisions 0 0 0 0
Current Liabilities 48,908 48,908 48,908 48,908
Total 138,881 154,685 163,457 177,006
Equity
Share Capital 20,001 20,165 20,509 22,620
Grants 5,118 6,250 6,994 8,247
Consumer Contributions
Capital Liabilities
Retained Earnings 2,386 5,499 5,499 5,499
Total 30,619 31,914 33,003 36,365
Total Liabilities 169,500 186,600 196,460 213,371

Power for All – Tamil Nadu
Page | 78
Annexure 27:Annual Training Program of Thermal Training Institute, North Chennai
Sl. Name of the Training Programme Level of Participants Mandays
1 Protection and Advances in Control and
Instrumentation in Thermal Power Plant
EE/AEE/AE/JE/JE.II
(Elecl) 40
2 O&M of HT/LT Switch Gears, Transformers and
Motors
EE/AEE/AE/JE/JE.II
(Elecl) 40
3 Generator & Auxiliaries Including Excitation
System & AVR and Recent Trends
EE/AEE/AE/JE/JE.II
(Elecl) 40
4 Power System Studies, Grid Management,
Black Start Procedures
EE/AEE/AE/JE/JE.II
(Elecl) 40
5 VFD and Energy Efficient Motors
EE/AEE/AE/JE/JE.II
(Elecl) 20
6 SCADA, DCS, DAS and PLC in Power Plant
EE/AEE/AE/JE/JE.II
(Eled/Mech) 40
7 Vibration Monitoring and Analysis, Balancing
and Alignment techniques
EE/AEE/AE/JE/JE.II
(Elecl/Mech) 40
8 Contact Programme with Manufacturers of ESP,
Fans & Air Preheaters for 210/600 MW Power
Plant
EE/AEE/AE/JE/JE.II
(Elecl/Mech) 40
9 Welding & NDT EE/AEE/AE/JE/JE.II
(Elecl/Mech) 40
10 O&M of Boilers 210/600MW Auxiliaries and
Optimization
EE/AEE/AE/JE/JE.II
(Elecl/Mech) 40
11 Case Studies on Boiler tube failures Analysis
Recent Trends in Boiler Tube Techonogy FSSS
EE/AEE/AE/JE/JE.II
(Elecl/Mech) 40
12 O&M of Fuel Handling and Ash disposal
/Retrieval, Milling, Balance of Plant, Equipment,
schemes
EE/AEE/AE/JE/JE.II
(Elecl/Mech) 40
13 Workshop on Operational Emergencies in
Thermal Power Plants/Causes and Remedies
EE/AEE/AE/JE/JE.II
(Elecl/Mech) 80
14 Workshop on Operational Emergencies in Gas
Turbine/ Causes and Remedies
EE/AEE/AE/JE/JE.II
(Eled/Mech) 40
15 Power Plant Chemistry and Recent Trends EE/AEE/AE/JE/JE.II (Elecl /
Mech), Chemist 40
16 Environment Management in Thermal Power
Plant and intro to ISO 14001-2015
EE/AEE/AE/JE/JE.II (Elect/
Mech/ Civil) 40
17 Workshop on Startup, Sychronisation and
Shutdown procedures in 210 /600MW Power
Plant
EE/AEE/AE/JE/JE.II
(Elecl/Mech) 80
18 Energy Management, Energy Audit and Safety
Audit in Power Plant
EE/AEE/AE/JE/JE.II (Elecl/
Mech/ Civil) 40
19 Testing, O&M and Condition Monitoring of TPS
Equipments and Station batteries
EE/AEE/AE/JE/JE.II (Elecl/
Mech) 40
20 Protective Relaying and Applications in TPS and
Recent Trends
EE/AEE/AE/JE/JE.II
(Elecl) 40
21 Workshop on Steam Turbine and its Auxiliaries,
Governing System with Case Studies
EE/AEE/AE/JE/JE.II
(Eled/Mech) 40
22 Workshop in O&M of GTPP Equipments EE/AEE/AE/JE/JE.II 40

Power for All – Tamil Nadu
Page | 79
Sl. Name of the Training Programme Level of Participants Mandays
(Elecl/Mech)
23 Performance Optimization of GTPS
EE/AEE/AE/JE/JE.II (Elecl/
Mech/ Civil) 40
24 Industial Safety, Health, Hygiene and Disaster
Management in GTPS
EE/AEE/AE/JE/JE.II (Elecl/
Mech/ Civil) 40
25 Contact Programme with Manufacturers of
GTPS
EE/AEE/AE/JE/JE.II
(Elecl/Mech) 40
26 Administrative Regulations, Legal aspects &
Court Craft Thermal Engrs/Officers/ Staff 120
27 Tender Regulations, Procurement Procedures &
Contract Management
Thermal Engrs/ Officers/
Staff 40
28 Industrial Relation, Labour Laws, RTI &
Factories Act.
Thermal Engrs/ Officers/
Staff 40
29 Certified Course on First Aid Thermal Engrs/ Officers/
Staff 40
30 Onsite training programme on Disaster
Management & Mitigation
Thermal Engrs/ Officers/
Staff 120
31 Fire Prevention, Safety, Health and Hygiene &
Disaster Management
Thermal Engrs/ Officers/
Staff 120
32 Testing, O&M of Electrical Equipments TA/RWE 40
33 O&M of Boiler, Turbine and Generator &
Auxiliaries
TA/RWE 40
34 O&M of Pumps & Valves TA/RWE 40
35 On site Scheme tracing in TPS TA/RWE 80
36 Fire Prevention, Safety and First Aid TA/RWE 40
37 Seminar for Thermal Power Station (Topics on
Field Requirements)
TPS & GTPS Engineers/Staff 180
Note: 57 Batches / 1,260 trainees / 1,960 Man-days

Power for All – Tamil Nadu
Page | 80
Annexure 28: Annual Training program of Cable Jointing Training & Development Centre
Sl. Name of the Training Programme Level of
Participants
No. of
Days
1 Low Voltage (LV) Heat Shrinkable (PVC/ XLPE) Power Cable
Jointing - Hands on Practical Training
RWE Staff 04
2 11 KV High Voltage (HV) Heat Shrinkable XLPE Power Cable
Jointing & Termination - Hands on Practical Training
RWE Staff 05
3 33 KV High Voltage (HV) Heat Shrinkable XLPE Power Cable
Jointing & Termination - Hands on Practical Training
RWE Staff 05
4 11 KV High Voltage (HV) Tapex XLPE Power Cable Jointing &
Push on End termination - Hands on Practical Training
RWE Staff 05
5 Workshop about Power Cables & Jointing Techniques with
Practical Demonstration
AEE/AE/JE 03
6 On-site Awareness Training Programme about Power Cables &
Jointing Techniques at Generating Stations
AEE/AE/JE 01
7 Effective Power Distribution in Chennai Metros RWE Staff 02
Note: Total: 36 Batches / 504 trainees / 1776 Man-days
Annexure 29: Annual Training program of Technical Training and Development Centers
Sl. Name of the Training Programme Level of
Participants
Training
Man-days
1 Hands on Training programme on "Standard erection Practices in
Distribution Network" (including 1 day on site practical)
RWE Staff 150
2
Hands of Training programme on "Onsite Repairing Techniques on
Distribution Transformer (with one-day hands-on training at Spl.Mtce
)
RWE Staff 100
3 Training Programme on" Maintenance of Distribution Network for
Revenue Maximisation" (Including One day onsite)
RWE Staff 150
4 Training programme on "Condition Monitoring of Sub- Station" JE II Gr and SS
Staff
100
5 Training programme on " Disaster, Emergency planning and Safety
Aspects"
RWE staff 200
6 Training Programme on "Loss reduction Through R- APDRP, IPDS
and DDGVY Funding Schemes"
RWE Staff 150
7 Training programme on "Effective Estimation Skills in Section office" CA/CI 100
8 Training programme on "Revenue Maximization in LT Billing and
Collection"
Assessment
Staff
150
9 Training programme on " Distribution Earthing Practices & achieving
Zero outages"
RWE staff 150
10 Training programme on "Effective Monitoring of LT Billing and
Auditing"
RB staff 100
11 Training Programme on planning for "post retirement life" RWE/
Provincial 150
12 Training programme on"Communication & Customer Relations" RWE/
Provincial 150

Power for All – Tamil Nadu
Page | 81
Sl. Name of the Training Programme Level of
Participants
Training
Man-days
13
Training programme on "Balancing Role" Class III&IV
Women
employees
100
14 Training Programme on "Enhancing IT Skills" ( with Hands On
training)
RWE/
Provincial 150
15 Workshop on Energy Conservation without funding Public /
Students
250
16 Training programme on " Distribution Earthing Practices & achieving
Zero outages"
RWE staff 150
Note: 37 Batches / 925 Trainees / 1900 Man-days
Annexure 30: Annual Training program of Hydro Training Institute, Kuthiraikalmedu
Programme Type Name of the Training Programme Level of Participants
REGULAR TRAINING
PROGRAMME (RTP)
Right to information Act and Electricity Act Engineers
Operating Principle of various types of Governor &
Pressure Oil system in Hydro Stations.
Engineers
Operation and maintenance of Batteries and switch
yard equipments.
Engineers / RWE
Working principle and Operation & Maintenance of
Generator.
Engineers / RWE
Prevention of accident and electrical hazards in hydro
power houses & safety
Fire Fighting Equipments & Fire Quenching
Technique, Rescue Operation and First Aid.
Engrs & RWE Staff
Capacity building in Disaster Management. Engrs & RWE Staff
Principle of Operation of Turbine, its maintenance,
Trouble shooting & case studies.
Engrs & RWE Staff
Prestressed concrete Technologies, Maintenance in
Substations
Engrs/RWE
Staff
Maintenance of Power Houses, Roads and
approaches, Asset management
Engrs/RWE
Staff
Upkeeping of Dams, Trashrack cleaning works, Do's
and Don'ts in operation of Gates
Engrs/RWE
Staff
Recent trends in Energy conservation Techniques
and safety in Electrical equipments.
RWE
SS Equipments ,Earthing practices and
measurement.
RWE
Enhancing Financial skills,Uniform Commercial
Accounting
System(UCA),Survey reporting
Engineers/
accts/store
staffs
ON-SITE TRAINING
PROGRAMME (OTP)
Seminar with manufacturers of Batteries and relays Engineers
Seminar with Manufacturers on Alignment, Balancing
and Vibration Analysis in Preventive/ Predictive
Maintenance,
Engineers
Emerging trends in Non- Destructive Testing
Techniques at Testing Laboratories.
Engineers

Power for All – Tamil Nadu
Page | 82
Programme Type Name of the Training Programme Level of Participants
RLA, R&M and Up-rating of Hydro Stations. Engineers
Issues and Challenges faced by Hydro areas. Engineers
Training on Computer Aided Design Engineers
Seminar on Latest construction techniques with
Promoters/ Applicators
Engineers
Recent trends in application of Chemicals, Coatings,
Workshop with applicators
Engineers
Maintenance of power transformers through seminar
with manufacturers.
Engineers / RWE
Seminar with Manufacturers on Pumps & Compressor
used in Hydro stations, its maintenance, performance
assessment and trouble shooting.
Engrs & RWE Staff
Seminar with Manufacturers on Operation &
Maintenance of Lifting Machineries like Hoists,
Cranes, Steel ropes and the statutory requirement.
Engrs & RWE Staff
Types of Gates & Valves, Manufacturers view on its
maintenance & operation and problems encountered.'
Engrs & RWE Staff
Computer applications in office. Adm/Accts/
Stores/RWE
Manufacturers outlook on Use & Handling of Bearing,
Mechanical Seals & Lubrication and its Operation &
Maintenance.
Engrs & RWE Staff
Seminar with manufacturers on Mechanical
Auxiliaries of Hydro Stations.
Engrs & RWE Staff
Dam safety, upkeeping of Dams, Workshop on DRIP
works @ site
Engineers/
RWE
Switchgears & breakers - SF6 gas leakage detection,
arresting and Techniques
Engineers / RWE
MANAGEMENT
TRAINING
PROGRAMME(MTP)
Positive attitude and motivation Engineers / AO / SO /
A.Ad.O & RWE
Disciplinary proceedings and court crafts. Engineers / Adm / Store
staff
Stress management for women employees. Engrs/Adm/ Accts/ Store
Note: 38 Batches / 760 tainees /480 Man-days
Annexure 31: Annual Training program of Transmission and Distribution Training and Development Institute / Madurai
Type of Programme Name of the Training
Programme
Level of Participants
Need Based Training
Programmes
Workshop on "Operation and
Maintenance of GRID Sub-Station
and Lines" (one day on site demo)
AEE/AE/JE I gr.of TANTRANSCO
Workshop on " Hot line
Techniques" (one day on site
Demo)
AEE/AE/JE I gr.of TANTRANSCO
Workshop on "Failure Analysis of
Power/ Auto Transformer"
AEE/AE/JE I gr.of TANTRANSCO/
TANGEDCO

Power for All – Tamil Nadu
Page | 83
(including Repair bay Visit for
Demo)
Workshop on "Failure Analysis of
Battery, Relay and Control Circuit
" (tie up with manufacturer)
AEE/AE/JE I gr.of TANTRANSCO/
TANGEDCO
Workshop on "Operation and
Maintenance of Breakers, PT, CT
and Isolators" (tie up with
manufacturer)
AEE/AE/JE I gr.of TANTRANSCO/
TANGEDCO
Workshop on "MRT Activites" (tie
up with Realy/ meter
manufacturer)
AEE/AE/JE I gr.of MRT TANGEDCO
Workshop on "Special
Maintenance Activities" (tie up with
Breaker/ Transformer
manufacturer)
AEE/AE/JE I gr.of Spl mtce
TANGEDCO
Reorienation Training for Assistant
Engineers
Recurited / Internally selected AEs of
2014.
Workshop on "Techno commercial
Aspects in HT Metering and Billing
"
AEE/JE I gr. of TANGEDCO
Workshop on "Techno commercial
Aspects in HT Metering and Billing
"
AO/AAO/Accts
staffs
Workshop on " Latest Meters and
Metering arrangement in
Distribution" (Interaction with
Meter manufacturer)
AEE/JE I gr. ofTANGEDCO
Workshop on "Theft of Energy and
Assesment and procedures"
AEE/AE/JE I gr. of TANGEDCO
Workshop on "Distribution
Planning"
AEE/AE/JE I gr. of TANGEDCO
Workshop on "Distribution Section
Management"
AEE/AE/JE I gr. OfTANGEDCO
Workshop on "Building
Maintenance & Asset
Management"
AEE/AE/Civil
Workshop on "Enhancing Driving
Skills"
Drivers of TANGEDCO/
Training of Trainers "Distribution
Planning"
HRD Wing
On site Programmes Workshop on "Techno commercial
Aspects in LT Metering and Billing
" (Regional level)
AEE/AE/JE I gr. of TANGEDCO
Workshop on "Implementation of
IPDS and DDUGJY Schemes"
(Regional level)
AEE/AE/JE I gr. ofTANGEDCO
Workshop on " Latest Amendment
in Electricity Act 2003, CEA
AEE/AE/JE I gr. of TANGEDCO
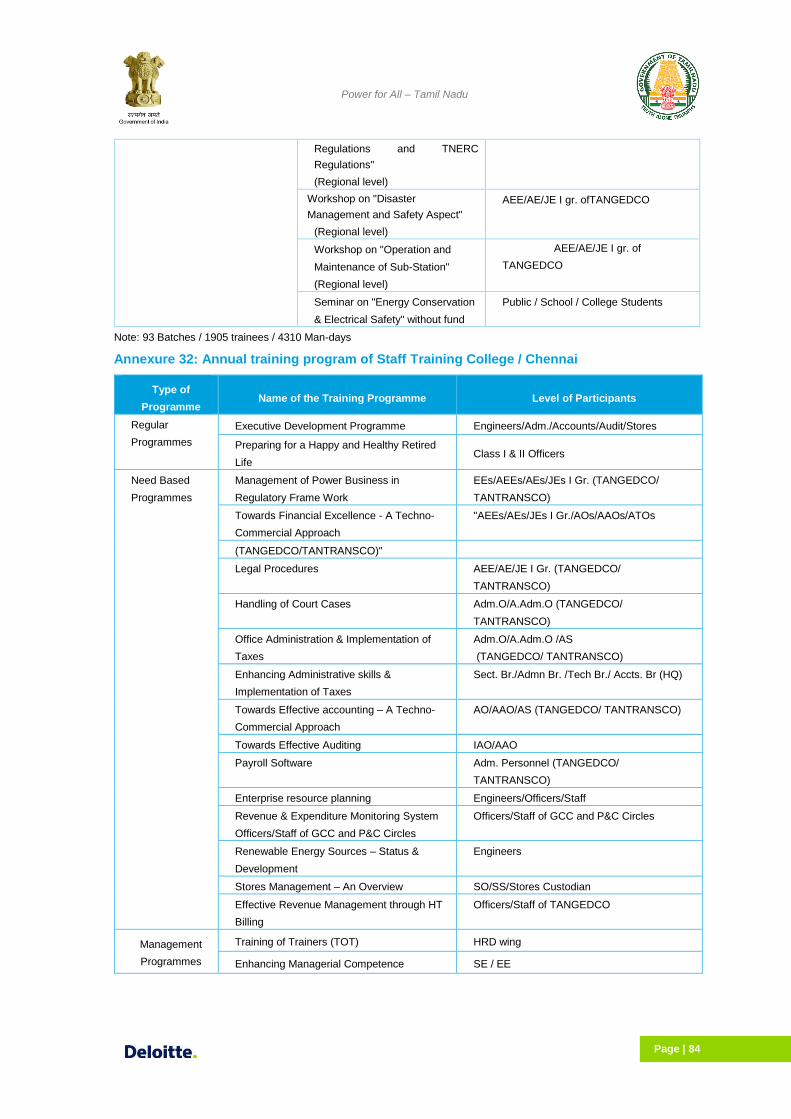
Power for All – Tamil Nadu
Page | 84
Regulations and TNERC
Regulations"
(Regional level)
Workshop on "Disaster
Management and Safety Aspect"
(Regional level)
AEE/AE/JE I gr. ofTANGEDCO
Workshop on "Operation and
Maintenance of Sub-Station"
(Regional level)
AEE/AE/JE I gr. of
TANGEDCO
Seminar on "Energy Conservation
& Electrical Safety" without fund
Public / School / College Students
Note: 93 Batches / 1905 trainees / 4310 Man-days
Annexure 32: Annual training program of Staff Training College / Chennai
Type of
Programme Name of the Training Programme Level of Participants
Regular
Programmes
Executive Development Programme Engineers/Adm./Accounts/Audit/Stores
Preparing for a Happy and Healthy Retired
Life Class I & II Officers
Need Based
Programmes
Management of Power Business in
Regulatory Frame Work
EEs/AEEs/AEs/JEs I Gr. (TANGEDCO/
TANTRANSCO)
Towards Financial Excellence - A Techno-
Commercial Approach
"AEEs/AEs/JEs I Gr./AOs/AAOs/ATOs
(TANGEDCO/TANTRANSCO)"
Legal Procedures AEE/AE/JE I Gr. (TANGEDCO/
TANTRANSCO)
Handling of Court Cases Adm.O/A.Adm.O (TANGEDCO/
TANTRANSCO)
Office Administration & Implementation of
Taxes
Adm.O/A.Adm.O /AS
(TANGEDCO/ TANTRANSCO)
Enhancing Administrative skills &
Implementation of Taxes
Sect. Br./Admn Br. /Tech Br./ Accts. Br (HQ)
Towards Effective accounting – A Techno-
Commercial Approach
AO/AAO/AS (TANGEDCO/ TANTRANSCO)
Towards Effective Auditing IAO/AAO
Payroll Software Adm. Personnel (TANGEDCO/
TANTRANSCO)
Enterprise resource planning Engineers/Officers/Staff
Revenue & Expenditure Monitoring System
Officers/Staff of GCC and P&C Circles
Officers/Staff of GCC and P&C Circles
Renewable Energy Sources – Status &
Development
Engineers
Stores Management – An Overview SO/SS/Stores Custodian
Effective Revenue Management through HT
Billing
Officers/Staff of TANGEDCO
Management
Programmes
Training of Trainers (TOT) HRD wing
Enhancing Managerial Competence SE / EE

Power for All – Tamil Nadu
Page | 85
Type of
Programme Name of the Training Programme Level of Participants
Enhancing Managerial Competence EE / AEE /AE / JE I Gr.(Distn.-MRT/ Gen.-
MRT/C&I/EM)
Enhancing Managerial Competence AEE/AE /JE I Gr
Enhancing Managerial Competence AAO/ AS/ Asst. (Accts)
Enhancing Managerial Competence A.Adm.O/ Adm. Sup./ Asst. (Adm)
Enhancing Managerial Competence FC/DFC/Acct.O/Sr.DCIAO/DCIAO
US/DS/SPO/PO/APO/Sr.Adm.O/Adm.O
Towards Customer Ecstasy AEE/AE /JE I Gr (Distribution)
Group Dynamics and Team Building Class III, Adm of HQ
Training programme on "Balancing Role" Class I & II Women Employees
On site
Programmes
CGRF Programme CGRF Members
RTI & DP – Case studies Engineers/Adm.Personnel.
Seminar on Health/General Awareness Officers/Staff of Headquarters
Note :90 batches/2870 Trainees/5050 Mandays
Annexure 33: Step down transformers in TANTRANSCO
Sl. Voltage
Class
(KV)
Number of Sub stations
Total number of
units
Different Ratios in
use
Different Capacities
in use
Number in
Each
Capacities
Aggergate
Capacity
(MVA)
1 400 6 22 400/230 315 14 4410
400/110 200 8 1600
2 230 89 219 230/110 100 179 17900
80 3 240
50 12 600
33.33 3 99.99
230/33 100 4 400
50 18 900
3 110 807 2057 110/66 25 1 25
12 2 24
110/33 50 71 3550
25 168 4200
16 242 3872
10 61 610
7.5 1 7.5
110/22 25 120 3000
16 239 3824
10 142 1420
5 7 35
4 2 8
3 1 3
110/11 25 10 250

Power for All – Tamil Nadu
Page | 86
Sl. Voltage
Class
(KV)
Number of Sub stations
Total number of
units
Different Ratios in
use
Different Capacities
in use
Number in
Each
Capacities
Aggergate
Capacity
(MVA)
16 514 8224
10 465 4650
7.5 1 7.5
5 3 15
4 6 24
1 1 1
4 66 6 12 66/11 10 1 10
7.5 1 7.5
5 5 25
3 1 3
2.5 1 2.5
2 2 4
1.75 1 1.75
5 33 593 998 33/11 16 200 3200
8 591 4728
5 144 720
3.15 0 0
3 39 117
2 12 24
1.6 3 4.8
1.5 7 10.5
1.25 1 1.25
1 1 1
Total -- 1501 3308 -- -- 3308 68760.29