il&fs tamil nadu power company limited · il&fs tamil nadu power company limited september,...
TRANSCRIPT

IL&FS TAMIL NADU POWER COMPANY LIMITED
September, 2018
Technical Note on Use of Blended Coal
ITPCL’s 1200 MW THERMAL POWER PLANT AND CAPTIVE
DESALINATION PLANT AT CUDDALORE, TAMIL NADU
C1181305 RP001, Rev.0
L&T Infrastructure Engineering Limited
Table of Contents

L&T Infrastructure Engineering Ltd.
Client: IL&FS Tamil Nadu Power Company Limited [ITPCL]
Project: EC Amendment (Use of Blended Coal) for ITPCL Thermal Power Plant at Cuddalore district, TN
Project No.:
C1181305
Title: Technical Note on Use of Blended Coal for ITPCL’s TPP
Document No.:
RP001 Rev.:
0 This document is the property of L&T Infrastructure Engineering Ltd. and must not be passed on to any person or body not authorised by us to receive it nor be copied or otherwise made use of either in full or in part by such person or body without our prior permission in writing.
File path: l:\ports\2018\c1181305 - itpcl ec amend-blended coal\working\reports\second draft 28.08.2018\technical note 21.09.2019\001-r0-brt-technical note on use of blended coal for itpcl’s tpp -29.09.2018.docx
Notes:
1.
Revision Details:
0 21.09.2018 First Submission
ALJ ATK SNV GNT VHR MRU
BRT SAP
CVS
Rev. Date Details Init. Sign. Init. Sign. Init. Sign.
Prepared Checked Approved

EC Amendment (Use of Blended Coal) for ITPCL Thermal Power Plant at Cuddalore district, TN C1181305 Technical Note on Use of Blended Coal for ITPCL’s TPP RP001 rev. 0
Table of Contents Page 1
TABLE OF CONTENTS
1 Introduction .....................................................................................................................................1
Project Background ...................................................................................................................1 1.1 Details of Project Proponent .....................................................................................................2 1.2 Project Site ................................................................................................................................2 1.3 Salient Features of ITPCL Project ............................................................................................2 1.4 Project Status/ Environmental/CRZ Clearances Obtained .......................................................3 1.5
1.5.1 Facilities developed at ITPCL Site ..................................................................................4 Present Proposal (Use of Blended Coal) for ITPCL’s TPP .......................................................4 1.6
2 Need for Use of Blended Coal as an Alternative to 100% Imported Coal Use .........................4
Present Permission and Usage ................................................................................................4 2.1 Availability of Indigenous Coal ..................................................................................................5 2.2 Details of NLC India Limited and its Users ...............................................................................5 2.3
2.3.1 MINE - I Including Expansion .........................................................................................5 2.3.2 MINE - II Including Expansion ........................................................................................5 2.3.3 MINE-IA ..........................................................................................................................6 2.3.4 BARSINGSAR MINE ......................................................................................................6
Proposed Use of Blended Coal.................................................................................................6 2.4 Use of Both Imported Coal as well as Blended Coal ................................................................7 2.5
3 Technical Details of Indigenous Coal, Imported Coal and Blended Coal .................................7
Indigenous Coal ........................................................................................................................7 3.13.1.1 Source and Availability ...................................................................................................7 3.1.2 Fuel Analysis (Characteristics) .......................................................................................7
Imported Coal............................................................................................................................8 3.23.2.1 Fuel Analysis (Characteristics) .......................................................................................8 3.2.2 Approval and Permission ................................................................................................8
Blended Coal.............................................................................................................................8 3.33.3.1 Fuel Requirements & Characteristics after Blending ......................................................8
Blending Methods .....................................................................................................................8 3.4
4 Indigenous Coal Transportation Mode Alternatives ...................................................................9
Indigenous Coal Transport through Road Network – Traffic Study ..........................................9 4.14.1.1 Alternative Routes Considered for Study .......................................................................9 4.1.2 Advantages and Disadvantages of Alternative Routes Studied .................................. 10 4.1.3 Best Suited Route ........................................................................................................ 11
Indigenous Coal Transport through Rail ................................................................................ 11 4.24.2.1 NLC Mines - Railway Connectivity .............................................................................. 11 4.2.2 ITPCL’s Railway Siding for HFO/LDO and Imported Coal Transportation .................. 12 4.2.3 Bottlenecks for Transport of coal Using Railway line .................................................. 13
Indigenous Coal Transport through Rail cum Road Network ................................................ 13 4.3 Selection of Preferred Mode of Transport for Indigenous Coal ............................................. 13 4.4
5 Baseline Environment (Enroute) ................................................................................................ 14
Study Area & Study Period .................................................................................................... 14 5.1 Meteorological Conditions ...................................................................................................... 14 5.2 Baseline Environment Status ................................................................................................. 14 5.3
5.3.1 Ambient Air Quality ...................................................................................................... 15 5.3.2 Noise Levels ................................................................................................................ 16 5.3.3 Surface Water Quality .................................................................................................. 17 5.3.4 Groundwater Quality .................................................................................................... 18 5.3.5 Soil Quality ................................................................................................................... 19 5.3.6 Terrestrial Ecology ....................................................................................................... 20 5.3.7 Socio-Economic Conditions ......................................................................................... 20
Half-Yearly Compliance Report ............................................................................................. 22 5.4
6 Anticipated Environmental and Social Impacts and Mitigation Measures ............................ 23
EC Amendment (Use of Blended Coal) for ITPCL Thermal Power Plant at Cuddalore district, TN C1181305 Technical Note on Use of Blended Coal for ITPCL’s TPP RP001 rev. 0
Table of Contents Page 2
Land Environment .................................................................................................................. 23 6.16.1.1 Due to Use of Blended Coal ........................................................................................ 23 6.1.2 Due to Indigenous Coal Transportation ....................................................................... 23
Air Environment ..................................................................................................................... 24 6.26.2.1 Due to Use of Blended Coal ........................................................................................ 24 6.2.2 Due to Indigenous Coal Transportation, Unloading and Storage ................................ 25 6.2.3 Air Quality Modelling Study ......................................................................................... 26
Noise Environment ................................................................................................................. 27 6.36.3.1 Due to Use of Blended Coal ........................................................................................ 27 6.3.2 Due to Indigenous Coal Transportation, Unloading and Storage ................................ 27
Water Environment ................................................................................................................ 27 6.46.4.1 Due to Use of Blended Coal ........................................................................................ 27 6.4.2 Due to Indigenous Coal Transportation, Unloading and Storage ................................ 28
Terrestrial Ecology ................................................................................................................. 28 6.56.5.1 Due to Use of Blended Coal ........................................................................................ 28 6.5.2 Due to Indigenous Coal Transportation, Unloading and Storage ................................ 28
Marine Environment ............................................................................................................... 29 6.66.6.1 Due to Use of Blended Coal ........................................................................................ 29 6.6.2 Due to Indigenous Coal Transportation, Unloading and Storage ................................ 30
Solid Waste Management ...................................................................................................... 30 6.76.7.1 Due to Use of Blended Coal ........................................................................................ 30 6.7.2 Due to Indigenous Coal Transportation, Unloading and Storage ................................ 30
Traffic and Transportation ...................................................................................................... 30 6.86.8.1 Traffic Additions due to Indigenous Coal Transport .................................................... 30 6.8.2 Traffic deductions due to Reduced Imported Coal Transport...................................... 31
Socio-economic Environment ................................................................................................ 32 6.96.9.1 Due to Use of Blended Coal ........................................................................................ 32 6.9.2 Due to Indigenous Coal Transportation, Unloading and Storage ................................ 32 Corporate Social Responsibility ............................................................................................. 32 6.10 Corporate Environment Responsibility (CER) ....................................................................... 32 6.11
7 Environmental Monitoring Programme ..................................................................................... 32
8 Summary and Conclusions ........................................................................................................ 34
8.1.1 Comparison of Parameters for use of Imported and Blended Coal ............................ 34
LIST OF FIGURES Figure 4-1: Map Showing Road Network Options Available from Neyveli to ITPCL ............................. 10 Figure 4-2: Railway Network Near NLC India Limited Mines Areas ..................................................... 11 Figure 4-3: Existing Railway Siding at ITPCL from Puduchattiram Railway Station ............................. 12 Figure 5-1: Baseline Environment Monitoring Locations along Preferred Route .................................. 15 Figure 1: Location Map Figure 2: Integrated Layout Showing TPP, Captive Desalination Plant and Captive Port
LIST OF TABLES Table 1-1: Salient Features of the ITPCL Project ....................................................................................2 Table 1-2: Environmental Clearances Obtained ......................................................................................3 Table 3-1: Indigenous Coal Characteristics .............................................................................................7 Table 3-2: Indigenous Coal Characteristics as analysed by MSK Lab ....................................................7 Table 3-3: Imported Coal Characteristics .................................................................................................8 Table 3-4: Blended Coal Characteristics ..................................................................................................8 Table 3-5: Blending Methods – Advantages and Disadvantages ............................................................8 Table 4-1: MCM – Alternative Routes ................................................................................................... 10 Table 5-1: Climatological Data of Parangipettai .................................................................................... 14 Table 5-2: AAQ Monitoring Locations along Preferred Coal Transportation Route .............................. 15 Table 5-3: AAQ Monitoring Locations along alternative Coal Transportation Route ............................ 15 Table 5-4: Ambient Air Quality along Preferred and Alternative Route................................................. 16

EC Amendment (Use of Blended Coal) for ITPCL Thermal Power Plant at Cuddalore district, TN C1181305 Technical Note on Use of Blended Coal for ITPCL’s TPP RP001 rev. 0
Table of Contents Page 3
Table 5-5: Noise Quality Monitoring Locations along Preferred Coal Transportation Route ................ 16 Table 5-6: Noise Quality Monitoring Locations along Preferred Coal Transportation Route ................ 17 Table 5-7: Surface Water Quality Monitoring Locations along Preferred Coal Transportation Route .. 17 Table 5-8: Groundwater Monitoring Locations along Preferred Coal Transportation Route ................ 18 Table 5-9: Soil Monitoring Locations along Preferred Coal Transportation Route ............................... 19 Table 5-10: Settlements and its Population along Preferred Route ...................................................... 21 Table 5-11: Settlements and its Population along Alternate Route ...................................................... 21 Table 6-1: Comparison between Emissions due to Blended Coal and 100 % Imported Coal .............. 24 Table 7-1: Additional Environmental Monitoring Programme ............................................................... 33
LIST OF APPENDICES Appendix A: Environmental/ CRZ Clearances, Corrigendum, Amendments, Validity Extension etc., Appendix B: Fuel Analysis (Indigenous Coal) Appendix C: Traffic Study Appendix D: Surface Water Quality Appendix E: Ground Water Quality Appendix F: Soil Quality Appendix G Air Quality Model Study Appendix H: CSR Activities

EC Amendment (Use of Blended Coal) for ITPCL Thermal Power Plant at Cuddalore district, TN C1181305 Technical Note on Use of Blended Coal for ITPCL’s TPP RP001 rev. 0
1 Introduction Page 1
1 Introduction
Project Background 1.1
IL&FS Tamil Nadu Power Company Limited (ITPCL) is developing a project comprising of 3180 MW (2X600 and 3X660 MW) Thermal Power Plant, 40 MLD captive desalination plant and 15 MTPA of captive port. The project is located along the coastal region of Kottatai, Ariyagoshti and Villiyannalur villages in Parangipettai block of Cuddalore district, Tamil Nadu.
The project was accorded Environmental Clearance and CRZ Clearance under the provisions of EIA Notification, 2006 and CRZ Notification, 1991 (as amended) vide Ministry of Environment, Forests and Climate Change (MoEF&CC) Letters No. J 13012/34/2008-IA.II (T) dated May 31, 2010 and F.No.11-43/2010-IA.III dated October 29, 2010, respectively for the development of 3600 MW (2X600 MW and 3X800 MW), 30 MLD Desalination Plant and 15 MTPA Captive Port. In addition, Corrigendum to Environmental Clearance of (2X600 MW and 3X800 MW) coal based TPP were obtained from MoEF&CC on August 14, 2012.
During the Process of Implementation, certain changes in project parameters such as (i) Change in configuration (3600 MW (2X600 MW and 3X800 MW) to 3180 MW (2X600 and 3X 660 MW)), (ii) Flexibility in S% on Coal upto 0.8% and (iii) Change in Ash Pond Location were found required. Accordingly ITPCL has applied for amendment to EC for the above aspects and Expert Appraisal Committee, Thermal (EAC (T)), MoEF has appraised the project during its meeting on November 19, 2013 and recommended for amendment to EC. MoEF&CC has issued the amendment vide letter no. J-13012/34/2008 – IA. II(T) dated February 04, 2014.
ITPCL has applied for amendment to EC for transport of coal from the nearby existing port (Karaikal Port) through rail up to Puduchattiram station and through the private railway siding (in the same line proposed for HFO/LDO transport) upto TPP’s coal stockyard. MoEF&CC has issued the amendment vide letter F.No. J-13012/34/2008 – IA. II (T) dated March 27, 2015.
Consent to Operate (CTO) was issued for Unit 1 (600 MW) by TNPCB in consent orders no: 19177 (A) and no. 23140 (W) dated July 14, 2015 and is being renewed periodically. Combined Consent to Operate (CTO) was issued for Unit 1 and 2 (1200 MW) by TNPCB in consent orders no: 160424778221(A) and no. 160414778221(W) dated April 15, 2016 and is being renewed periodically. Unit 1 commissioned on 29.09.2015 and Unit 2 was commissioned on 30.04.2016. Environmental Clearance Validity Extension for the remaining 3X660 MW units was granted by MoEF&CC vide its letter No. J-13012/34/2008 – IA. II (T) dated February 26, 2018.
Environmental and CRZ Clearance Validity Extension for the Captive Port and other facilities were granted by MoEF&CC vide its letter No. F.No.11-43/2010-IA.III dated February 27/ March 05, 2018. Consent to Establish (CTE) was issued for Port by TNPCB August 16, 2015 is extended till October 28, 2020 vide consent order no. 1803212364515 (A) and no. 1803112364515 dated May 02, 2018.
At present, availability of domestic coal has increased considerably in the country and Coal is being offered to IPP’s through special forward E-auction for regulated sector (Power Sector)/ Spot E-auction/linkages etc. Sale of RAW LIGNITE through e-Auction is being carried out by NLC India Limited through M/s. MSTC Limited (formerly known as Metal Scrap Trade Corporation Limited), Chennai.

EC Amendment (Use of Blended Coal) for ITPCL Thermal Power Plant at Cuddalore district, TN C1181305 Technical Note on Use of Blended Coal for ITPCL’s TPP RP001 rev. 0
1 Introduction Page 2
Based on the analysis carried out by ITPCL, use of Indigenous Coal for Blending is found to be Technically, Economically Feasible & Environmentally appropriate at existing 1200 MW. Therefore, ITPCL would like to seek amendment to EC from EAC (T), MoEF&CC for the use of Indigenous Coal along with Imported Coal with a blend ratio of 25:75 in addition to use of 100% imported Coal.
In this regard ITPCL appointed NABET accredited consultant L&T Infrastructure Engineering Limited (L&TIEL) for providing necessary technical assistance for obtaining amendment to Environmental Clearance from MoEF&CC.
Accordingly this report was prepared by addressing the Technical aspects of use of Indigenous coal partly along with imported coal and alternative options of indigenous coal transport and preferred transport through road, existing environment description, environmental and Social impacts due to use of blended coal and during indigenous coal transport, Environmental monitoring and Management Plan.
Details of Project Proponent 1.2
The contact details of the authorized person at ITPCL are provided below:
Mr. M.S. Srinivasan, IAS(R), Chairman IL&FS Tamil Nadu Power Company Limited 4th Floor, KPR Tower, Old No. 21, New No. 2 1st Street, Subba Rao Avenue, College Road, Chennai - 600 006 Tamil Nadu, India Phone: +91 44 46745550 Fax: +91 44 46745551 E-mail: [email protected]
Project Site 1.3
The project site is located on the coastal side of Kottatai, Ariyagoshti, and Villiyannalur revenue villages in Parangipettai block of Cuddalore district, Tamil Nadu. The location map showing the project site is given as Figure 1. The NLC India mines are located at about 25.0 km (aerial distance) west from the ITPCL TPP site.
Salient Features of ITPCL Project 1.4
IL&FS Tamil Nadu Power Company Limited (ITPCL) is in the process of setting up a thermal power plant in Cuddalore District, Tamil Nadu. The ultimate capacity of the power plant will be about 3180 MW (2×600 MW sub-critical technology and 3×660 MW super critical technology). The salient features of the ITPCL Project are provided in Table 1-1.
Table 1-1: Salient Features of the ITPCL Project S.No Item Description
Thermal Power Plant
1 Capacity 3180 MW
2 Configuration 2×600 MW using Sub-critical Technology and 3×660 MW using Super Critical Technology
3 Technology Sub-critical and Super Critical Technology
4 Fuel Imported Coal
5 Fuel Requirement 13.40 MTPA
6 Sulphur Content Up to 0.8%
7 Stack 2×275 m

EC Amendment (Use of Blended Coal) for ITPCL Thermal Power Plant at Cuddalore district, TN C1181305 Technical Note on Use of Blended Coal for ITPCL’s TPP RP001 rev. 0
1 Introduction Page 3
S.No Item Description
8 Railway Siding
From Puduchattiram to TPP
For the Transport of HFO/LDO (as per EIA)
For Transport of Imported Coal from Karaikal Port (as per
amendment)
Captive Port
1 Capacity 15 MMTPA
2 Type All Weather Port
3 No of Berths Two (mechanised)
4 Length of Breakwaters North:2,100 m; South: 1,150 m
Captive Desalination Plant
1 Capacity 40 MLD
2 Technology Reverse Osmosis
General
1 Intake/ Outfall System Intake: between breakwaters; outfall: 1500 m from shore
2 Land 1128 Acres
3 Water Requirement/ Discharge
Total seawater required: 33,000 m3/hr. The total quantity of return cooling water discharge from the proposed power plant and reject brine from the proposed desalination plant is around 24,062 m3/hr.
4 Source Raw water from Sea, Potable Water from Desalination Plant
5 Environmental Aspects
Installation of FGDs
Low NOx Burners
ESP to minimize the PM emissions
Super Critical technology for 3 units to minimize the coal
consumption and GHG emissions.
Stack height of 275 m to get better dispersion .
Dust suppression system to minimize the fugitive dust emission.
Wind Screen around Coal Stockyard
Fire Protection system
The integrated layout showing all the project features is given as Figure 2.
Unit 1 (600 MW) was commissioned on 29.09.2015 and Unit 2 (600 MW) was commissioned on 30.04.2016.
Project Status/ Environmental/CRZ Clearances Obtained 1.5
Details of the Environmental/ CRZ clearances obtained are provided in Table 1-2. Table 1-2: Environmental Clearances Obtained
STATUTORY CLEARANCE ISSUING AUTHORITY STATUS REFERENCE
Environmental Clearance - May 31, 2010 EAC (T), MoEF Accorded
Appendix A
Environmental /CRZ Clearance – October 29, 2010
EAC (CRZ), MoEF Accorded
EC Corrigendum – August 14, 2012 EAC (T), MoEF Accorded
EC Amendment for Relocation of Ash Pond/Change in S%/Change in Configuration – February 04, 2014
EAC (T), MoEF Accorded
EC Amendment for Imported Coal Transport through Rail Route – March 27, 2015
EAC (T), MoEF Accorded
Environmental Clearance Validity Extension - February 26, 2018
EAC (T), MoEF&CC Accorded
Environmental/ CRZ Clearance Validity Extension - February 27/ March 05, 2018
EAC (Infra-2), MoEF&CC Accorded

EC Amendment (Use of Blended Coal) for ITPCL Thermal Power Plant at Cuddalore district, TN C1181305 Technical Note on Use of Blended Coal for ITPCL’s TPP RP001 rev. 0
2 Need for Use of Blended Coal as an Alternative to 100% Imported Coal Use Page 4
Also, as part of environmental initiatives and to comply with the EC conditions, ITPCL had framed Environmental Management Plan (EMP), and started Environmental Monitoring through reputed agencies. ITPCL has also developed in house Environment Management Cell to implement the EMP.
1.5.1 Facilities developed at ITPCL Site
The major components along with its associated facilities developed so far at site are as follows:
1.5.1.1 Thermal Power Plant
Capacity: 2×600 MW using Sub-critical Technology Stack: 1 No. of 275 m Height Railway Siding: From Puduchattiram station to TPP for transport of Coal/HFO/LDO Area:961 Acres
1.5.1.2 Captive Desalination Plant
Capacity: 10 MLD Technology: Reverse Osmosis
1.5.1.3 Others
Intake System: About 700m long to draw about 276840 KLD of Seawater for the entire 3180 MW capacity till desilting basin and Pump House for 1200 MW
Outfall System: > 1500 m from Shore to discharge about 204936 KLD of return cooling and reject brine
Present Proposal (Use of Blended Coal) for ITPCL’s TPP 1.6
Considering the availability of Indigenous Coal (Lignite) at Neyveli (NLC India Limited mines) which is located about 25 km West (aerial distance), ITPCL proposes to use the Indigenous Coal along with Imported Coal (blend ratio of 25:75) in the existing 2X600 MW units in order to derisk the company from coal supply /availability risk in Operation with Insignificant or minimal additional environmental/social impacts.
Accordingly ITPCL has proposed the use of blended coal in addition to use of 100% Imported coal at their existing 2X600 MW units, Indigenous Coal transport by Road as an interim arrangement and seeks amendment to EC from EAC (T) MoEF&CC. When NLC develops the railway siding (which is under consideration) the transportation of indigenous coal will be shifted from road to rail. The details are presented in the subsequent sections of this report.
2 Need for Use of Blended Coal as an Alternative to 100% Imported Coal Use
Present Permission and Usage 2.1
MOEF&CC granted Environmental clearance to ITPCL’s 3180 MW Thermal Power Plant with the use of Imported coal of 13.4 MMTPA. As mentioned earlier, Out of 3180 MW, Only 1200 MW is commissioned and currently consuming about a maximum of 5.0 MMTPA of Imported coal. The imported coal is being sourced from Indonesia and transported through ships upto Karaikal Port and thereafter by Rail rakes upto ITPCL TPP.

EC Amendment (Use of Blended Coal) for ITPCL Thermal Power Plant at Cuddalore district, TN C1181305 Technical Note on Use of Blended Coal for ITPCL’s TPP RP001 rev. 0
2 Need for Use of Blended Coal as an Alternative to 100% Imported Coal Use Page 5
Availability of Indigenous Coal 2.2
NLC India Limited (formerly Neyveli Lignite Corporation Limited) ('Navratna' - A Government of India Enterprise) at present has four open cast lignite mines namely Mine I, Mine II, Mine IA and Barsingsar Mine (three at Neyveli in the State of Tamil Nadu and one at Barsingsar in the State of Rajasthan) with a total installed capacity of 30.60 MTPA. The lignite mined out is used as fuel to the linked Pit head power stations. Also raw lignite is being sold to cement companies and small scale industries to use it as fuel in their production activities.
Besides, Bithnok lignite mines (2.25 MTPA), Hadla lignite mines (1.9 MTPA), Barsingsar Expansion (0.40 MTPA) and Expansion of Mine-IA (4.0 MTPA) are also under implementation. In addition to the above, a proposal is underway to set up Mine-III of 11.50 MTPA and South of Vellar cum Palayankottai Mine projects of 11.50 MTPA as the fuel linkages to the Second Expansion Project of TPS-II (phase 1 & 2). With all the above Projects, the lignite mining capacity of NLC at the end of the year 2025 would increase to 62.15 MTPA.
NLC India mines at Neyveli are located at about 25.0 km from the ITPCL TPP.
Sale of raw lignite through e-Auction is being carried out by NLC India Limited through M/s. MSTC Limited (formerly known as Metal Scrap Trade Corporation Limited), Chennai on “as-is-where-is and no complaint basis only” from Mine-IA. It also mentions that the loading and transportation of Raw Lignite has to be arranged by the buyer at their own cost.
At present, availability of domestic coal has increased considerably in the country and Coal is being offered to IPP’s through special forward E-auction for regulated sector (Power Sector)/ Spot E-auction/linkages etc.
Details of NLC India Limited and its Users 2.3
The main activity of NLC India is Mining (Coal & Lignite) and Power Generation (Thermal and Renewable Energy). NLC India at present has four open cast lignite mines namely Mine I, Mine II, Mine IA and Barsingsar Mine. The capacities of the mines are given below.
Mine I : 10.5 MTPA (Neyveli, Tamil Nadu) Mine I A : 3.0 MTPA (Neyveli, Tamil Nadu) Mine II : 15.0 MTPA (Neyveli, Tamil Nadu) Barsingsar Mine: 2.1 MTPA (Barsingsar, Rajastan)
2.3.1 MINE - I Including Expansion
The lignite seam was first exposed in August 1961 and regular mining of lignite commenced in May 1962. German excavation technology in open cast mining, using Bucket Wheel Excavators, Conveyors and Spreaders were used for the first time in the country in Neyveli Mine-I. The capacity of this mine was 6.5 MT which met the fuel requirement of TS-I. The capacity was increased to 10.5MT of lignite per annum from March 2003 under Mine-I expansion scheme and at present meets the fuel requirement for generating power from TPS-I (600 MW) and TPS-I Expansion (420 MW).
2.3.2 MINE - II Including Expansion
In February, 1978 Government of India sanctioned the Second Lignite Mine of capacity 4.7 MT of lignite per annum and in February’ 83, Government of India sanctioned the expansion of Second Mine capacity from 4.7 Million Tonnes to 10.5 Million Tonnes. Unlike Mine-I, Mine-II had to face problems in the excavation of sticky clayey soil during initial stage. The method
EC Amendment (Use of Blended Coal) for ITPCL Thermal Power Plant at Cuddalore district, TN C1181305 Technical Note on Use of Blended Coal for ITPCL’s TPP RP001 rev. 0
2 Need for Use of Blended Coal as an Alternative to 100% Imported Coal Use Page 6
of mining and equipment used are similar to that of Mine-I. The seam is the same as of Mine-I and is contiguous to it. The lignite seam in Mine-II was first exposed in September 1984 and the excavation of lignite commenced in March, 1985. GOI sanctioned the expansion of Mine-II from 10.5 MTPA to 15.0 MTPA of lignite in October 2004 with a cost of Rs. 2295.93 crore. Mine-II Expansion project was completed on 12th March 2010. The lignite excavated from Mine-II meets the fuel requirements of Thermal Power Station-II (1470 MW) and Thermal Power Station–II Expansion (500 MW) under implementation.
2.3.3 MINE-IA
Government of India sanctioned the project Mine-I A of 3 million tonnes of lignite per annum at a sanctioned cost of Rs. 1032.81 crores in February' 98. This project is mainly to meet the lignite requirement of M/s ST-CMS for their power plant and also to utilize the balance
lignite to the best commercial advantage of NLC. The project was completed on 30th March 2003 within time and cost schedule.
2.3.3.1 Expansion of Mine 1A
In order to meet the additional requirement of lignite arising out of implementation of 1000 MW Neyveli New Thermal Power Project at Neyveli, expansion of Mine-IA is being implemented, which would result in raising the Mine IA capacity by 4 MTPA. Acquisition of required land has been taken up with Government. Ministry of Coal has accorded approval for mining expansion plan of Mine 1A. Works are under Progress.
2.3.4 BARSINGSAR MINE
GOI sanctioned implementation of Barsingsar mine with a capacity of 2.1 MTPA of lignite per annum at an estimated cost of Rs. 254.60 crore in December 2004. Both overburden and lignite production has been outsourced. Lignite excavation commenced on 23rd November 2009 and production attained the rated capacity on 31st January 2010. The lignite from this mine is being supplied to Barsingsar TPP (2x125 MW).
Proposed Use of Blended Coal 2.4
The following factors are considered while finalizing the use of Indigenous coal (Lignite) with Imported Coal in the existing ITPCL 1200 MW TPP.
Technically, Economically Feasible & Environmentally appropriate Adequate Lignite Availability at Neyveli through E-Auction and encourage use of Lignite
which is expressed by NLCIL vide its letter dated April 04, 2018 Nearness to ITPCL TPP (~25.0 Km) Lesser transportation distance, Cost and related emissions Due to volatility in the availability of imported coal at reasonable price, foreign exchange
fluctuations, frequent changes in sovereign laws of coal producing countries and shipping & transportation bottlenecks, the availability of coal for power plants at reasonable cost is looking difficult.
In line with GoI Policy to reduce the dependence on imported coal and promote usage of indigenous coal. Reduction of import would also improve the balance of trade for the country.
Considering the above beneficial aspects, use of Imported Coal/Indigenous coal along with Imported Coal is proposed for the 2X600 MW units. The blend ratio will be 25 (Indian):75 (Imported) by maintaining the blend calorific value of minimum of 4200 Kcal/kg.

EC Amendment (Use of Blended Coal) for ITPCL Thermal Power Plant at Cuddalore district, TN C1181305 Technical Note on Use of Blended Coal for ITPCL’s TPP RP001 rev. 0
3 Technical Details of Indigenous Coal, Imported Coal and Blended Coal Page 7
Use of Both Imported Coal as well as Blended Coal 2.5
The current proposal (use of Imported/ Blended Coal) is for First Existing Two (02) Units (2x600 MW) units only out of approved 3180 MW. Based on the availability of Indigenous coal in future, further amendment for the remaining Three Units (3X660 MW) will be sought once units are operational.
It is pertinent to mention that during the inadequate supply of indigenous coal, the existing 1200 MW TPP will be continued to operate by using imported coal as its present conditions.
3 Technical Details of Indigenous Coal, Imported Coal and Blended Coal
Indigenous Coal 3.1
3.1.1 Source and Availability
It is proposed to source indigenous coal from NLC mines, located at about 25.0 km from the ITPCL TPP. Indigenous coal is proposed to be sourced through e-Auction. The recent sale tender floated by NLC India Limited vide E- Auction No:EARL-03 dated 09.05.2018 and EARL-05 dated 23.05.2018 shows availability of about 5,00,000 Tones.
However, ITPCL is in discussion with NLC India Limited for “Sale of Lignite other than by e-auction” and hope this will be recognised by them and suitable agreement will be entered. Adequate Lignite Availability at Neyveli and encourage use of Lignite was expressed by NLCIL vide its letter dated April 04, 2018.
3.1.2 Fuel Analysis (Characteristics)
The average coal characteristics of Raw lignite as given in tenders floated by NLC India Limited is given in Table 3-1. Table 3-1: Indigenous Coal Characteristics
S.No Constituents Average value
1. Moisture 51 %
2. Ash 7.5 %
3. Volatile Matter 23.5 %
4. Fixed Carbon 19.75 %
5. Sulphur 0.85%
6. Calorific value 2715 Kcal/kg
In addition, ITPCL also verified the Lignite Characteristics by selective sampling and the results are given below and provided as Appendix B.
Table 3-2: Indigenous Coal Characteristics as analysed by MSK Lab
S.No Constituents Value
1. Moisture 49.56 %
2. Ash 5.11 %
3. Volatile Matter 24.86 %
4. Fixed Carbon 20.47 %
5. Sulphur 0.76%
6. Calorific value 2997 KCal/Kg

EC Amendment (Use of Blended Coal) for ITPCL Thermal Power Plant at Cuddalore district, TN C1181305 Technical Note on Use of Blended Coal for ITPCL’s TPP RP001 rev. 0
3 Technical Details of Indigenous Coal, Imported Coal and Blended Coal Page 8
Imported Coal 3.2
3.2.1 Fuel Analysis (Characteristics)
The analysis of imported coal is given below.
Table 3-3: Imported Coal Characteristics S.No Description Range for Design and Performance Curves
1 Proximate Analysis
1.1 Total Moisture (%) 26 - 35
1.2 Volatile Matter (%) 32 - 41
1.3 Ash (%) 0.25 - 6
1.4 Fixed Carbon (%) 27 - 32.75
1.5 Gross Calorific Value (Kcal/Kg) 4000 - 5000
1.6 Sulphur (%) 0.13 - 0.4
3.2.2 Approval and Permission
Apart from using the coal with above specifications mentioned in Section 3.2.1, permission has been accorded vide letter No: J-13012/34/2008 – IA. II(T) dated February 04, 2014 to use up to 0.8% Sulphur in coal consequent to implementation of FGD in the Plant.
Blended Coal 3.3
3.3.1 Fuel Requirements & Characteristics after Blending
The following are the expected characteristics of the coal after blending in the ratio of 25:75 Indigenous Coal and Imported Coal respectively.
Table 3-4: Blended Coal Characteristics
S.No Constituents
Quality Range Remarks
Indigenous Coal
(25%)
Imported Coal
(75%) Blended Coal
1. Moisture (%) 49.56 26-35; Average
30.5
35. 265 No Significant
Change wrt
Imported Coal
2. Ash (%) <6 6 6 No Change wrt
Imported Coal 3. Coal Requirement TPH (Each
600 MW)
83.9 251.8 335.8
4. Sulphur (%) <0.8 0.8 0.8
5. Calorific value (Kcal/Kg) 2460 to 2997 4200-4600 4200
Blending Methods 3.4
The main methods for coal blending used on-site at coal-fired power plants are summarised in below Table 3-5.
Table 3-5: Blending Methods – Advantages and Disadvantages
Method Description Location of
Blending Advantage Disadvantage Remarks
Beds/Stockpiles Stacking of two or more coals in Layers
at coal stockyard Only one system is required Relatively inexpensive
All coal must be stacked before blending Not Possible to change the blending ratio
Sufficient Coal Stacking area is available at ITPCL.
Blending on Two types of coal At common Blending ratio All coal must be Sufficient Coal

EC Amendment (Use of Blended Coal) for ITPCL Thermal Power Plant at Cuddalore district, TN C1181305 Technical Note on Use of Blended Coal for ITPCL’s TPP RP001 rev. 0
4 Indigenous Coal Transportation Mode Alternatives Page 9
Method Description Location of
Blending Advantage Disadvantage Remarks
moving Belt are stacked in two yards and gathered by separate stacker/ reclaiming
transfer point homogenisation at transfer point
can be changed at any time
stacked first Stacking area & Conveyors are already available at ITPCL
Blending on moving Belt (First Coal reclaimed and Second coal from track hopper)
First Coal is reclaimed from the coal yard and second coal is fed from the track hopper/wagon
At common transfer point homogenisation at transfer point
Blending ratio can be changed at any time. Only One Coal needs to be stacked. Other can come in as delivered.
Lower blending accuracy
Sufficient Coal Stacking area, Track Hopper system and Conveyors are already available at ITPCL
ITPCL will be able to carry out all the above described blending methods.
4 Indigenous Coal Transportation Mode Alternatives
Indigenous Coal Transport through Road Network – Traffic Study 4.1
NLC India Limited, Neyveli mines are well connected to ITPCL’s TPP site by road network. The traffic study includes details of alternative road network available, normal traffic and Road conditions, normal traffic projections, generated traffic, total traffic, Level of Service (LoS), abutting land use & habitations suitability for the Indigenous Coal Transportation etc., are provided in the Appendix C and summary of the same is discussed below.
4.1.1 Alternative Routes Considered for Study
Among the available road network, two significant (02) options are studied to check the feasibility to transport the indigenous coal to ITPCL Plant Site from Neyveli mines.
Option1: Mandarakuppam/Neyveli – Vadalur – Kurinjipadi - Kullanchavadi - Alapakkam - Villiyanallur - Plant Site (About 44.2 Km)
Option2: Mandarakuppam/Neyveli – Vadalur – Maruai – Pinnalur – Seithiyathope – Bhuvanagiri – B. Muttalur - Villiyanallur - Plant Site (About 51.2 Km)
Map Showing Road route Option 1 and 2 are given below.

EC Amendment (Use of Blended Coal) for ITPCL Thermal Power Plant at Cuddalore district, TN C1181305 Technical Note on Use of Blended Coal for ITPCL’s TPP RP001 rev. 0
4 Indigenous Coal Transportation Mode Alternatives Page 10
Figure 4-1: Map Showing Road Network Options Available from Neyveli to ITPCL
4.1.2 Advantages and Disadvantages of Alternative Routes Studied
The Multi-Criteria-Matrix of selection process is adopted to find out the best suited route for transporting indigenous coal from NLCIL Neyveli mines to ITPCL Site based on the Traffic studies findings and other factors.
Table 4-1: MCM – Alternative Routes S.No Parameters Units Route 1 Route 2
1. Distance from NLCIL Mines to ITPCL Plant Site
Km 44.2 51.2
2. Road Conditions - Good with less Bends/Curves Moderate with more Bends/Curves comparatively
3. Fuel Consumption by Trucks - Less More
4. Emissions from Trucks - Less More
5. Level of Service of Existing Road for present/Normal Traffic
V/C Ratio B,B,B,A,C (Good-Very Good- Excellent)
B,B,B,B,C (Good-Very Good)
6. Level of Service of Existing Road for Projected Normal Traffic and ITPCL Generated Traffic
V/C Ratio B,B,B,B,C (Good-Very Good) C,C,C,C,C (Good)
7. Enroute Habitations Nos 27 including 2 Town Panchayats
27 including 3 Town Panchayats
8. Land Use - The Land use abutting the route 1 is mining area, agricultural land, plantations, and waste land, built up area (Urban and Rural), dry tanks with few stream crossings
The Land use abutting the route 1 is mining area, agricultural land, plantations, and waste land, built up area (Urban and Rural), dry tanks with few stream crossings
EC Amendment (Use of Blended Coal) for ITPCL Thermal Power Plant at Cuddalore district, TN C1181305 Technical Note on Use of Blended Coal for ITPCL’s TPP RP001 rev. 0
4 Indigenous Coal Transportation Mode Alternatives Page 11
4.1.3 Best Suited Route
Considering the above discussed advantages and disadvantages of Route 1 and Route 2, Route 1 (NLCIL (Mandarakuppam/Neyveli) – Vadalur – Kurinjipadai bypass – Kullanchavadi – Alapakkam – Villiyanallur – ITPCL Site) is found suitable in all aspects (such as less distance, less emissions, good road conditions, good level of services, less enroute population) and hence is preferred for indigenous coal transport from NLCIL mines to ITPCL Site. This route is more or less same route which railway line is laid.
Indigenous Coal Transport through Rail 4.2
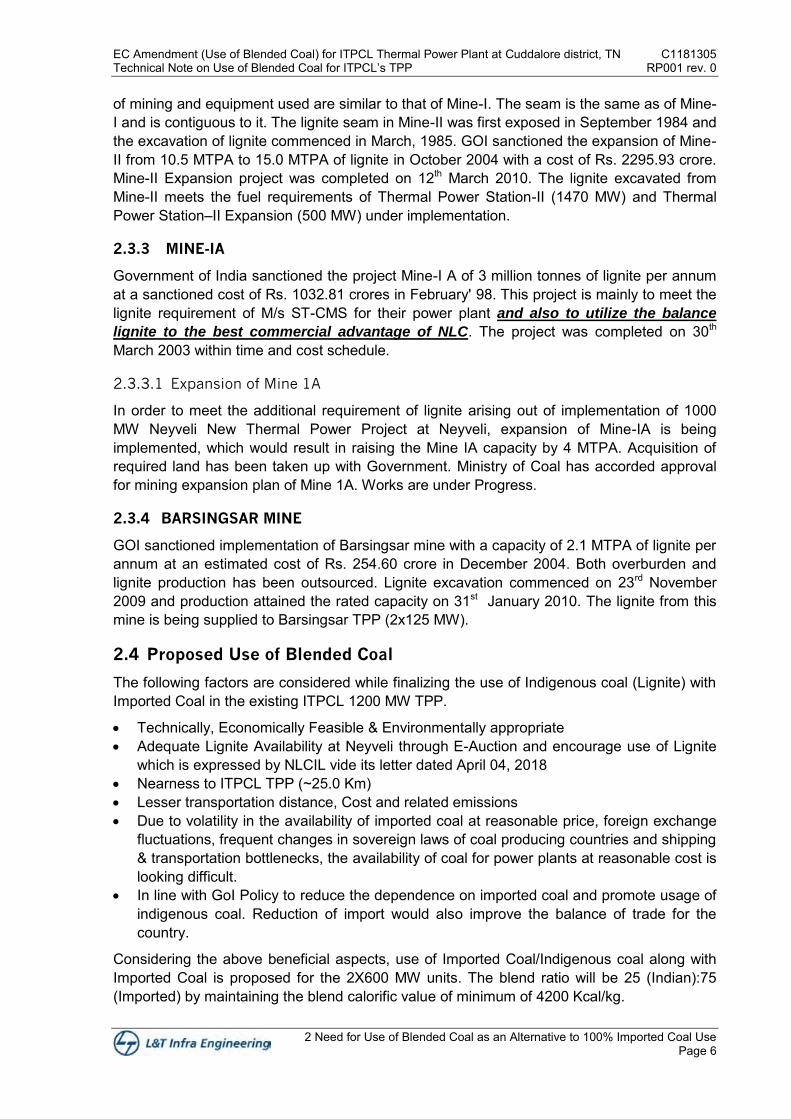
4.2.1 NLC Mines - Railway Connectivity
Virudachalam – Cuddalore Southern Railway line at Neyveli is passing near NLC Mines. Only ST-CMS Power Plant is having private siding which is located at about 3.25 km NW of NLC, Neyveli mines. Other than this no railway siding is available for transport of coal to the users through rail mode.
It is pursued with NLC and Southern Railways to augment an additional railways siding in coal mine/Neyveli. Also the company has signed MoU with a Logistics provider to explore the possibilities of utilising its existing resource or develop a new railways siding in Neyveli.
The map showing rail way network near the mine area is given below.
Figure 4-2: Railway Network Near NLC India Limited Mines Areas

EC Amendment (Use of Blended Coal) for ITPCL Thermal Power Plant at Cuddalore district, TN C1181305 Technical Note on Use of Blended Coal for ITPCL’s TPP RP001 rev. 0
4 Indigenous Coal Transportation Mode Alternatives Page 12
4.2.2 ITPCL’s Railway Siding for HFO/LDO and Imported Coal Transportation
Currently, Imported Coal is being transported from Karaikal Port through an existing railway private siding/line (~5.3 km) from the Puduchattram railway station to project site. This railway siding will serve as a second line of supply even after the Port is commissioned.
The Southern Railway main line from Karaikal Port to Puduchattiram passing through Nagor – Nagapattinam – Thiruvarur – Peralam - Mayiladuthurai – Sirkhazhi – Chidambaram and Puduchattiram. The total rail line including the rail siding from Puduchattiram railway station to ITPCL TPP from Karaikal Port is 128 km.
Figure 4-3: Existing Railway Siding at ITPCL from Puduchattiram Railway Station

EC Amendment (Use of Blended Coal) for ITPCL Thermal Power Plant at Cuddalore district, TN C1181305 Technical Note on Use of Blended Coal for ITPCL’s TPP RP001 rev. 0
4 Indigenous Coal Transportation Mode Alternatives Page 13
4.2.3 Bottlenecks for Transport of coal Using Railway line
Though ITPCL is currently transporting imported coal through Rail line from Karaikal Port, the transport of Indigenous Coal from NLC India mines at Neyveli is not preferred (time being) as a quick option considering the following factors.
No Separate rail siding from Mines are existing Getting approvals and constructing a new railway siding in NLC mine area by NLCIL will
be time consuming The other aspects analysed are At mine site high loading rates into rail wagons cannot be achieved due to moisture in
lignite. As a result additional rakes would be required. Due to moisture in lignite, the lignite wagons cannot be fully emptied by wagon unloading
equipment viz. wagon tippler, track hopper / bottom discharge wagon etc.
Indigenous Coal Transport through Rail cum Road Network 4.3
In this alternative, transport of coal from NLCIL Mines to the areas/ railway stations (Neyveli/Vadalur/Kurinjipadi) abutting/on the existing Virudachalam- Cuddalore SR line is considered by road and from those areas/ Railway Stations to ITPCL TPP by rail. This proposal requires a stock yard development, Wagon loading system additional siding development, land acquisition, R&R etc., which also attracts additional pollution issues due to multiple handling and resultant dust emissions. This option is not feasible because this is densely populated area and people will not permit due to environmental issues. Hence, this option has been ruled out.
Selection of Preferred Mode of Transport for Indigenous Coal 4.4
In general coal transport through road network is not preferable in most of the cases due to its difficulty in traffic.
However, considering the following factors, Indigenous Coal transport from NLCIL Mines at Neyveli to ITPCL TPP site through existing road route is proposed as an interim option till NLCIL develops separate sidings.
NLCIL Mines are located at about ~ 25.0 km (Aerial Distance) No separate rail siding is available at NLCIL. Laying a separate siding will attract high capital investment and is a time consuming
process. . Preferred existing road route for Indigenous coal transport will be able to accommodate
the ITPCL generated traffic. Considering the Traffic growth pattern, these roads will be able to maintain the same level of service till the year 2025 without any strengthening/ widening requirements.
Less number of enroute habitations in the preferred existing road route and mostly free flow traffic conditions.
Planned for only 25% blending with indigenous coal and expected generated traffic (truck movements) are not more than Seven (07) per Hour maximum.
Once NLCIL develops Rail sidings, then the indigenous coal of 1.25 MMTPA can be transported through Rail from Neyveli to Plant site. The distance to be travelled from Neyveli to Plant site by train/rake is estimated to be about 60 km which is shorter than the current imported coal transport from Karaikal Port (128 km). Development of railway line /sidings is under consideration of NLC in the long run.

EC Amendment (Use of Blended Coal) for ITPCL Thermal Power Plant at Cuddalore district, TN C1181305 Technical Note on Use of Blended Coal for ITPCL’s TPP RP001 rev. 0
5 Baseline Environment (Enroute) Page 14
5 Baseline Environment (Enroute)
Study Area & Study Period 5.1
The area abutting the preferred indigenous coal transport route by road (Neyvei-Vadalur-Kurinjipadi-Kullanchavadi-Alapakkam-Villiyanallur-ITPCL site) is considered for analysing the baseline environmental conditions. Ambient Air Quality, Noise Quality, Soil Quality, Water Quality (Both Surface and Groundwater) monitoring was carried out during the period May 2018 – July 2018.
Meteorological Conditions 5.2
The climatological table for Parangipettai IMD Station Latitude 110 30’ N and Longitude 790 46’ E, published by the Indian Meteorological Department (IMD), based on daily observations at 08:30 and 17:30 hr IST for a 30 year period (1971-2000), forms the basis for the following sections on the meteorological conditions at the site. The monthly variations of the relevant meteorological parameters are given in Table 5-1 below.
Table 5-1: Climatological Data of Parangipettai
Month
Temperature (OC) Rainfall (mm) Relative
Humidity (%) Mean Wind
Speed (Kmph)
Predominant Wind Direction (From)
Daily Max.
Daily Min
Total Number of
days 0830 1730 08:30* 17:30*
Jan 28.8 20.8 31.8 1.7 82 72 6.1 NW, N, NE NE, N, NW
Feb 29.9 21.2 45.7 1.5 83 71 6.0 NW, N, NE NE, SE, N
Mar 32.0 22.9 24.6 0.6 81 71 7.2 NW, SW, S SE, NE, S
Apr 34.3 25.1 12.9 0.6 76 70 9.2 S, SW, SE SE, S, SW
May 37.0 26.0 30.3 1.4 70 68 9.6 SW, S, W SE, S, SW
Jun 37.4 26.0 53.5 3.3 67 58 9.5 SW, W, NW SE, SW, S
Jul 35.9 25.3 72.9 4.5 72 60 8.6 SW, W, NW SE, SW, S
Aug 35.3 24.8 93.4 5.3 75 62 7.9 SW, W, S SE, SW, S
Sep 34.0 24.5 132.9 5.9 80 68 6.9 SW, S, W SE, SW,S
Oct 32.2 24.0 251.0 9.1 85 74 5.2 SW, W, NW SE, S, NE
Nov 29.8 22.7 369.9 11.0 86 78 5.4 NW, NE, SW NE, N, SE
Dec 28.8 21.6 308.1 7.9 86 75 7.0 NW, NE, N NE, N, NW
Source: IMD Climatological Sheet Published by IMD (1971-2000)
Baseline Environment Status 5.3
The baseline environment status along the preferred road route was monitored for Ambient Air Quality, Noise Quality, Surface and ground Water and Soil Quality. The location of Monitoring and Sampling is provided in the Figure 5-1.
EC Amendment (Use of Blended Coal) for ITPCL Thermal Power Plant at Cuddalore district, TN C1181305 Technical Note on Use of Blended Coal for ITPCL’s TPP RP001 rev. 0
5 Baseline Environment (Enroute) Page 15
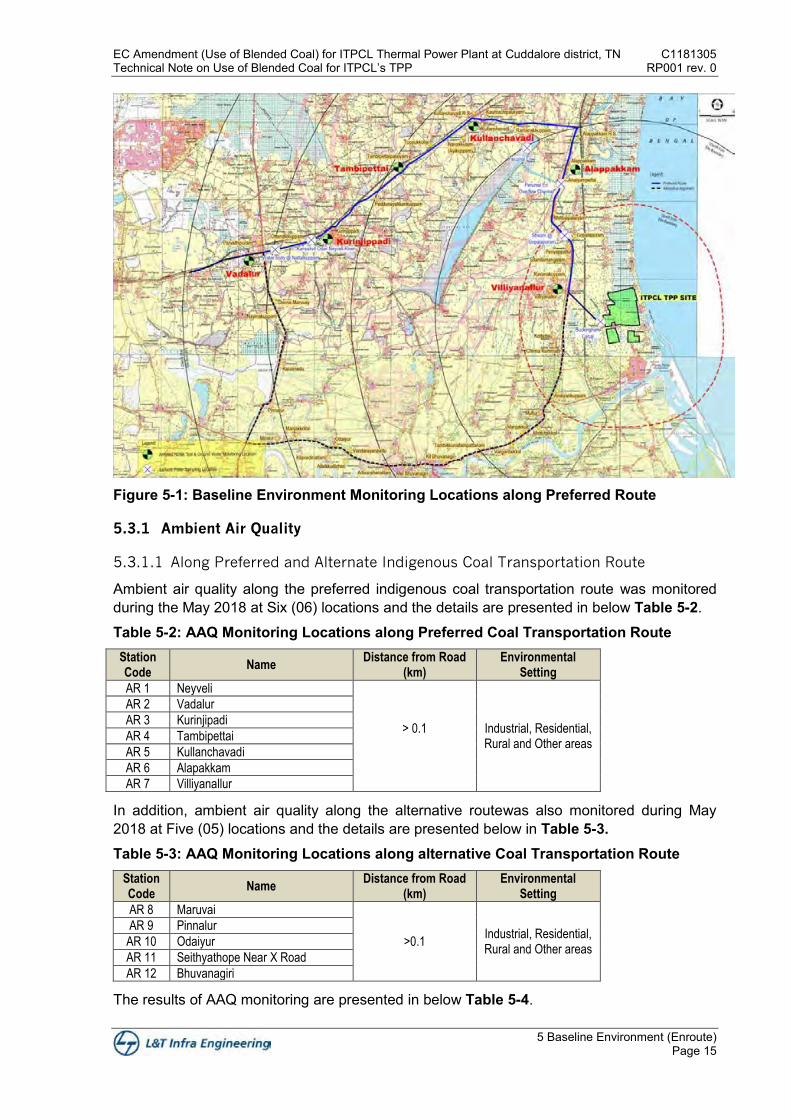
Figure 5-1: Baseline Environment Monitoring Locations along Preferred Route
5.3.1 Ambient Air Quality
5.3.1.1 Along Preferred and Alternate Indigenous Coal Transportation Route
Ambient air quality along the preferred indigenous coal transportation route was monitored during the May 2018 at Six (06) locations and the details are presented in below Table 5-2.
Table 5-2: AAQ Monitoring Locations along Preferred Coal Transportation Route Station Code
Name Distance from Road
(km) Environmental
Setting
AR 1 Neyveli
> 0.1
Industrial, Residential, Rural and Other areas
AR 2 Vadalur
AR 3 Kurinjipadi
AR 4 Tambipettai
AR 5 Kullanchavadi
AR 6 Alapakkam
AR 7 Villiyanallur
In addition, ambient air quality along the alternative routewas also monitored during May 2018 at Five (05) locations and the details are presented below in Table 5-3. Table 5-3: AAQ Monitoring Locations along alternative Coal Transportation Route
Station Code
Name Distance from Road
(km) Environmental
Setting
AR 8 Maruvai
>0.1 Industrial, Residential, Rural and Other areas
AR 9 Pinnalur
AR 10 Odaiyur
AR 11 Seithyathope Near X Road
AR 12 Bhuvanagiri
The results of AAQ monitoring are presented in below Table 5-4.

EC Amendment (Use of Blended Coal) for ITPCL Thermal Power Plant at Cuddalore district, TN C1181305 Technical Note on Use of Blended Coal for ITPCL’s TPP RP001 rev. 0
5 Baseline Environment (Enroute) Page 16
Table 5-4: Ambient Air Quality along Preferred and Alternative Route
Preferred Route
AAQ Location
Code
Parameters
PM10 (µg/m3)
PM2.5 (µg/m3) SO2 (µg/m3) NO2
(µg/m3) Ozone (O3)
(µg/m3) Carbon Monoxide
(CO) (mg/m3)
AR1 70.6 26.2 15.5 17.0 8.8 0.33
AR2 64.8 22.5 11.2 13.0 7.1 0.28
AR3 66.8 24.0 12.6 14.1 7.4 0.30
AR4 61.0 20.8 10.5 14.1 6.9 0.27
AR5 57.4 18.0 9.2 11.3 6.0 0.25
AR6 60.4 20.8 10.1 13.7 7.2 0.25
AR7 62.4 21.3 11.6 15.2 7.5 0.27
Alternative Route
AR8 58.6 19.7 9.9 12.8 7.0 0.26
AR9 55.7 18.0 8.8 10.9 6.5 0.24
AR10 56.4 19.9 8.5 10.2 6.3 0.24
AR 11 55.2 18.3 8.0 10.4 6.2 0.25
AR12 63.7 21.5 10.8 12.9 7.0 0.27
Observations:
Maximum concentrations of Sulphur Dioxide (SO2), Nitrogen Dioxide (NO2), Particulate Matter (PM2.5), Particulate Matter (PM10), Carbon Monoxide (CO) and Ozone (O3) are well within the National Ambient Air Quality Standards for Residential areas at all monitoring locations during the study. Lead (Pb) is found to be Below Detectable Limit (BDL) and other parameters such as Ammonia (NH3), Benzene (C6H6), Benzo (a) Pyrene (BaP) – Particulate phase only, Arsenic (As) and Nickel (Ni) were not detected at all the monitoring locations.
5.3.2 Noise Levels
5.3.2.1 Along Preferred Indigenous Coal Transportation Route
Ambient Noise quality along the preferred indigenous coal transportation route was monitored during the May 2018 at Six (06) locations and the details are presented below in Table 5-5. Table 5-5: Noise Quality Monitoring Locations along Preferred Coal Transportation Route Station Code
Name Distance from
Road (km) Environmental Setting
AR 1 Vadalur
>0.1 Commercial Area (Monitored
along the Preferred Road Alignment)
AR 2 Kurinjipadi
AR 3 Tambipettai
AR 4 Kullanchavadi
AR 5 Alapakkam
AR 6 Villiyanallur
The results of Noise Quality monitoring are presented below in Table 5-6.

EC Amendment (Use of Blended Coal) for ITPCL Thermal Power Plant at Cuddalore district, TN C1181305 Technical Note on Use of Blended Coal for ITPCL’s TPP RP001 rev. 0
5 Baseline Environment (Enroute) Page 17
Table 5-6: Noise Quality Monitoring Locations along Preferred Coal Transportation Route
Station Code
Name Leq Day dB(A) Leq Night dB(A) Ambient Noise
Standard Leq Day / Leq Night dB(A)
AR 1 Vadalur 56.8 53.2
65/55
AR 2 Kurinjipadi 56.2 52.3
AR 3 Tambipettai 54.3 49.9
AR 4 Kullanchavadi 57.9 53.6
AR 5 Alapakkam 58.4 53.5
AR 6 Villiyanallur 56.1 52.3
Observations:
It is observed that the day equivalent and night equivalent noise levels at all locations are within prescribed CPCB standards
5.3.3 Surface Water Quality
5.3.3.1 Along Preferred Indigenous Coal Transportation Route
Surface water quality along the preferred indigenous coal transportation route was monitored during the May 2018 at Six (06) locations and the details are presented below in Table 5-7.
Table 5-7: Surface Water Quality Monitoring Locations along Preferred Coal Transportation Route
Station Code
Name
SW 1 Water body Near Nattalkuppam
SW 2 Perumal Eri Near Palliodai
SW 3 Stream (Uppanar) Near Gopalapuram (Tidal Influenced)
SW 4 Kanyakvil Odai/ Neyveli River Near Andikuppam
SW 5 Perumal Eri Overflow Channel Near Anaiyampettai
SW 6 Buckingham Canal Near ITPCL Site (Tidal Influenced)
The results of Surface water Quality monitoring are presented below
The analytical results of surface water parameters are presented in Appendix D.
pH ranged between 7.91 and 8.35 Electrical Conductivity (EC) varied between 393 µS/cm and 10180 µS/cm Total dissolved solids ranged between 245 mg/l and 6922 mg/l Total solids ranged between 428 mg/l and 8213 mg/l Total alkalinity (as CaCO3) varied between 68.5 mg/l and 585 mg/l Total hardness (as CaCO3) ranged between 100.6 mg/l and 854.6 mg/l Calcium (as Ca) ranged between 26.4 mg/l and 152.2 mg/l Magnesium (as Mg) ranged between 8.4 mg/l and 151.9 mg/l Chlorides (as Cl-) ranged between 56.1 mg/l and 3071.4 mg/l Sulphates (as SO4) ranged between 41.6 mg/l and 261.8 mg/l Nitrates (as NO3) ranged between 0.7 mg/l and 30.4 mg/l Sodium (as Na) ranged between 39.5 mg/l to 1924.8 mg/l Potassium (as K) ranged between 0.35 mg/l and 41.2 mg/l Iron (Fe) reported between 0.034 mg/l and 0.26 mg/l Aluminium (Al) reported between 0.22 mg/l and 1.2 mg/l Lead (Pb) reported between <0.01 and 0.02 mg/l DO ranged between 4.8 mg/l and 5.9 mg/l

EC Amendment (Use of Blended Coal) for ITPCL Thermal Power Plant at Cuddalore district, TN C1181305 Technical Note on Use of Blended Coal for ITPCL’s TPP RP001 rev. 0
5 Baseline Environment (Enroute) Page 18
BOD reported as < 3 mg/l Residual free chlorine reported as <0.2 mg/l Anionic Detergents, Cadmium, Arsenic, Copper, Lead and Manganese are reported
<0.001 E.coli forms ranged from 196 MPN/100ml to 437 MPN/100ml Total Coli forms ranged from 270 MPN/100ml to 590 MPN/100ml Faecal Coli forms ranged from 74 MPN/100ml to 153 MPN/100ml
It is inferred that all the parameters for surface water sample are within the limits as per ISI-IS2296-1982 Class C (Drinking water source with conventional treatment followed by disinfection) Standards for use based Classification of Surface Water except Total Dissolved Solids at Water body @ Nattalkuppam and Buckingham canal, Chlorides and Fluoride at Buckingham canal are exceeding the permissible limits which are tidal influenced water bodies.
5.3.4 Groundwater Quality
5.3.4.1 Along Preferred Indigenous Coal Transportation Route
Groundwater quality along the preferred indigenous coal transportation route was monitored during the May 2018 at Six (06) locations and the details are presented below in Table 5-8.
Table 5-8: Groundwater Monitoring Locations along Preferred Coal Transportation Route
Station Code
Name
GWR 1 Vadalur
GWR 2 Villiyanallur
GWR 3 Kurinjipadi
GWR 4 Tambipettai
GWR 5 Alapakkam
GWR 6 Kullanchavadi
The analytical results of groundwater parameters are presented in Appendix E.
The summary of results of Groundwater Quality monitoring are presented below
pH ranged between 7.12 and 8.43 Electrical Conductivity (EC) varied between 556 µS/cm and 1264 µS/cm Total dissolved solids ranged between 352 mg/l and 795 mg/l Total solids ranged between 436 mg/l and 895 mg/l Total alkalinity (CaCO3) varied between 83.8 mg/l and 225 mg/l Total hardness (CaCO3) ranged between 154.9 mg/l and 323.5 mg/l Calcium (as Ca) ranged between 38.2 mg/l and 81.3 mg/l Magnesium (Mg) ranged between 10.5 mg/l and 32.5 mg/l Manganese (Mn) ranged between 0.29 mg/l and 1.35 mg/l Aluminium (Al) ranged between 0.18 mg/l and 0.86 mg/l Chlorides (as Cl-) ranged between 82.1 mg/l and 211.2 mg/l Fluorides as (F-) ranged between 0.4 mg/l to 1.1 mg/l Sulphates (as SO4) ranged between 48.6 mg/l and 130.2 mg/l Nitrates (as NO3) ranged between 9.6 mg/l and 31.1 mg/l Sodium (as Na) ranged between 54.8 mg/l and 144.5 mg/l Potassium (as K) ranged between 2.39 mg/l and 11.3 mg/l Zinc (Zn) ranged between 0.013 mg/l and 6.9 mg/l

EC Amendment (Use of Blended Coal) for ITPCL Thermal Power Plant at Cuddalore district, TN C1181305 Technical Note on Use of Blended Coal for ITPCL’s TPP RP001 rev. 0
5 Baseline Environment (Enroute) Page 19
Iron (Fe) ranged between 0.043 mg/l and 0.14 mg/l Boron (B) ranged between 0.32 mg/l and 0.42 mg/l Residual free chlorine ranged below 0.2 mg/l Total Nitrogen, Total phosphorus, Phenolic compounds, Mineral Oil, Cadmium (Cd),
Chromium (Cr+6), Arsenic (As), Copper (Cu), Pesticides, Cyanides (CN), Mercury (Hg), Anionic Detergents, Lead (Pb), Selenium (Se), Nickel (Ni), Molybdenum (Mo), Barium (Ba), Ammonia (Total Ammonia- N), Silver (Ag), Sulphide (H2S), Polynuclear Aromatic Hydrocarbons (PAH), Alpha Emitters and Beta Emitters are observed to be well below the detectable limits and E. Coli and Faecal Coliforms were not detected at all locations
It is inferred that groundwater samples are within the permissible limits specified for drinking water quality standards as per IS: 10500 (2012) except Manganese at Alapakkam and Aluminium at Vadalur, Villiyanallur, Kurinjipadi, Tambipettai and Alapakkam where concentrations are exceeding the permissible limits.
5.3.5 Soil Quality
5.3.5.1 Along Preferred Indigenous Coal Transportation Route
Soil quality along the preferred indigenous coal transportation route was monitored during the May 2018 at Six (06) locations and the details are presented below in Table 5-9.
Table 5-9: Soil Monitoring Locations along Preferred Coal Transportation Route Station Code Name Distance from Road
SR 1 Vadalur
>0.1
SR 2 Kurinjipadi
SR 3 Tambipettai
SR 4 Kullanchavadi
SR 5 Alapakkam
SR 6 Villiyanallur
The analytical results of surface water parameters are presented in Appendix F
The summary of results of Soil Quality monitoring are presented below
Soil texture ranges between Sandy Clay Loam, Sandy Loam and Sandy Clay pH of soils ranged between 5.35 and 7.52 showing moderate acidic to moderate alkaline
Electrical Conductivity varied between 101 µs/cm and 413 µs/cm Porosity varied between 43.1 % to 49 % Water Holding Capacity varied between 15 % to 28.0 % Infiltration Rate ranged between 0.19 cm/h and 4.72 cm/h Bulk density varied between 1.0 gm/cc and 1.1 gm/cc Nitrogen varied between 13.1 kg/ha to 40.5 which shows very less sufficient levels in
soil quality Potassium (K) varied between 278.8 kg/ha and 485.3 kg/ha which shows average to
more than sufficient in soil quality Phosphates as PO4
-2 varied between 41.6 kg/ha and 93.9 kg/ha which shows very less sufficient levels in soil quality
Zinc (Zn) varied between 21.3 mg/kg and 83.9 mg/kg Iron (Fe) varied between 0.43% and 2.50%. Manganese (Mn) varied between 41.9 mg/kg and 257 mg/kg Chromium (Cr) varied between 38.2 mg/kg and 117 mg/kg Nickel (Ni) varied between 19.1 mg/kg and 35.1 mg/kg

EC Amendment (Use of Blended Coal) for ITPCL Thermal Power Plant at Cuddalore district, TN C1181305 Technical Note on Use of Blended Coal for ITPCL’s TPP RP001 rev. 0
5 Baseline Environment (Enroute) Page 20
5.3.6 Terrestrial Ecology
Based on the studies carried out earlier for the project, basically, the vegetation of the area falling within 25.0 km from ITPCL site could be classified under three categories viz., (i) the coastal sands and beach; (ii) the Mangroves and (iii) the Inland vegetation.
The coastal sands beyond high tide level have been brought under plantations of Casuarina equisetifolia. The natural vegetation is mostly represented by the sand binders such as the Ipomoea pes-tigridis (Ipomoea biloba), Spinifex littoreus, Pandanus fascicularis, Prosopis juliflora, Tamarix alba, etc. The coastal sands further beyond the HTL are colonized by isolated populations of palatable and nonpalatable weeds and grasses.
The inland vegetation is represented by crops, weeds, roadside vegetation and vegetation of the wastelands. There are no endangered plants present in the study area. Paddy, Sugarcane, Groundnut, Millets, Pulses, etc. are the major crops grown in the district. Apart from the above crops, Horticultural crops like Cashew, Banana, Tapioca, Guava, Jack fruit, Mango, etc. are grown in various parts of the district.
Other than the Pichavaram mangrove forests there are no ecologically sensitive areas in the project area. A total number of 12 true mangrove species are present in the Pichavaram mangrove wetland. Avicennia marina alone constitutes 74% of the tree population and it is distributed everywhere except the banks of tidal canals and creeks followed by Rhizophora spp. (V.Selvam at al. 2010).
None of the animal species belong to either rare or endangered or endemic or threatened (REET) category is observed within 25.0 km from ITPCL Site. There are no biosphere reserves or sanctuaries or national parks or other protected areas within the 25 km radius of the project site.
The Land use abutting the preferred Indigenous coal transportation route is mining area, agricultural land, plantations, and waste land, built up area (Urban and Rural), dry tanks with few stream crossings. Margosa (neem), Banyan, Palmyra, coconut, Tamarind, Mango, Cashew and Jackfruit are the common trees found . Since there are no dense forests in the district wild animals are very rare.
5.3.7 Socio-Economic Conditions
5.3.7.1 In Preferred Route & Alternate Route
The preferred alignment is passing mostly through Kurinjipadi and Cuddalore taluks. The alternate alignment is also passing mostly through the Kurinjipadi and Chidambaram taluks. The study areas have been quantified to understand the most coherent alignment in between the preferred route and alternate route for the transportation of Indigenous Coal from Neyveli to site. The study includes town panchayats, revenue villages and small habitations abutting the routes. The data for the villages abutting the two desired route have been sourced from Census of India 2011 as well as for the population data India Water (https://indiawater.gov.in). The settlements and its population along the preferred route are given in Table 5-10. The settlements and its population along the Alternate route are given in Table 5-11.

EC Amendment (Use of Blended Coal) for ITPCL Thermal Power Plant at Cuddalore district, TN C1181305 Technical Note on Use of Blended Coal for ITPCL’s TPP RP001 rev. 0
5 Baseline Environment (Enroute) Page 21
Table 5-10: Settlements and its Population along Preferred Route
Village Name Total
Households Total
Population SC
Population ST
Population Gen
Population
Kuravankuppam 642 3,206 922 0 2284
Seplanatham Bus Stop 112 454 0 0 454
Periyakuritchi 245 1072 192 0 880
Old Neyveli 432 2078 238 12 1828
Melpappanpattu 82 352 352 0 0
Keelpathi 54 200 25 0 175
Pravathipuram/Vadalur (T.P) 9736 39514 5652 590 33272
Ottandikuppam/ Onnankuppam 70 350 120 0 230
Andikuppam 56 230 0 0 230
Tambipettai 454 2215 1322 18 875
Tambipettaipalaiyam 337 1655 488 0 1167
Toppukkollai 233 1145 10 72 1063
Kaumachipalaiyam 288 1468 780 0 688
Kullanchavadi 284 1384 0 0 1384
Alappakkam 675 3068 2646 0 422
Anaiyampettai 65 326 0 0 326
Mettuppalaiyam 73 360 0 0 360
Gopalapuram/ G. Colony 192 998 402 0 596
Vadakku Seppalanattam 154 767 0 0 767
Vinankeni 158 797 344 0 453
Kurinjipadi (T.P) 6757 27471 4206 183 23082
Peddunayakkankuppam 500 2461 460 0 2001
Navakkulam (Ayikuppam) 307 1384 885 0 499
Ramanathakuppam/Ramanakuppam 140 641 361 0 280
Periyappattu 421 2188 437 4 1747
Silambimangalam 430 2172 675 0 1497
Ravanakuppam 93 516 206 0 310
Villiyanallur 545 2752 944 0 1808
Puduchattiram 130 668 0 0 668
Total 23665 101,892 21667 879 79346
Table 5-11: Settlements and its Population along Alternate Route
Village Name Total
Households Total
Population SC
Population ST
Population Gen
Population
Kuravankuppam 642 3,206 922 0 2284
Seplanatham Bus Stop 112 454 0 0 454
Periyakuritchi 245 1072 192 0 880
Old Neyveli 432 2078 238 12 1828
Melpappanpattu 82 352 352 0 0
Keelpathi 54 200 25 0 175
Pravathipuram/Vadalur (T.P) 9736 39514 5652 590 33272
Chinna Maruvay 434 2159 694 0 1465
Karaimedu 291 1071 456 0 615

EC Amendment (Use of Blended Coal) for ITPCL Thermal Power Plant at Cuddalore district, TN C1181305 Technical Note on Use of Blended Coal for ITPCL’s TPP RP001 rev. 0
5 Baseline Environment (Enroute) Page 22
Village Name Total
Households Total
Population SC
Population ST
Population Gen
Population
Pinnalur 140 575 0 1 574
Miralur 604 2335 1578 6 751
Manjakkollai 622 3349 886 19 2444
Odaiyur 74 277 0 0 277
Vandarayanpattu 174 710 320 0 390
Bhuvanagiri (TP)/Kela/Mela/ Adivarahanattam
5400 21956 5030 103 16823
Manjakkuli 1536 8109 1504 0 6605
Mutlur 637 3126 603 28 2495
Chinna Kummatti 255 1272 483 0 789
Kottattai 172 895 317 0 578
Puduchattriram 130 668 0 0 668
Vadakku Seppalanattam 154 767 0 0 767
Vinankeni 158 797 344 0 453
Nayinakuppam 185 932 5 0 927
Kilavadinattam 209 1129 849 0 280
Allaikkudicheri 389 1598 1046 0 552
Tambikkunallampattanam 105 540 0 0 540
Vargantaikkal/ Bharaikhan taikkal 74 380 0 0 380
Anaiyankuppam 98 520 0 0 520
Villiyanallur 545 2752 944 0 1808
Sethiathoppu (TP) 2269 8824 1393 106 7325
Total 25958 111,617 23833 865 86919
The preferred alignment population is 101892 which include 27 villages and two town panchayats respectively. The total households in the area are 23665. General population is 79346, ST population is 879 and the SC population is 21667. The alternate alignment population is 111617 which are abutting 27 villages and three town panchayats. The households in the alignment are 25958. General population is 86919, ST population is 865 and the SC population is 23833 respectively. The habitations in the preferred alignment are less which covers the route.
Population of preferred alignment is less than alternate route which makes it less impact on the settlements.
Half-Yearly Compliance Report 5.4
The Half- Yearly Compliance reports for the period between September 2017 and March 2018 already submitted to MoEF&CC (RO), CPCB and TNPCB vide ITPCL Letter No. ITPCL-S/GEN/18-19/2874 dated May 05, 2018.

EC Amendment (Use of Blended Coal) for ITPCL Thermal Power Plant at Cuddalore district, TN C1181305 Technical Note on Use of Blended Coal for ITPCL’s TPP RP001 rev. 0
6 Anticipated Environmental and Social Impacts and Mitigation Measures Page 23
6 Anticipated Environmental and Social Impacts and Mitigation Measures
In this chapter, likely impacts of the proposed activities (i.e. use of indigenous coal for blending in the existing ITPCL’s 1200 MW TPP and transport of the Indigenous coal (interim arrangement) from NLC India Limited by road) on environmental attributes have been identified, assessed and presented. To mitigate likely impacts suitable measures if required have been recommended which need to be incorporated as a part of planning process.
Land Environment 6.1
6.1.1 Due to Use of Blended Coal
The imported coal requirement for each 600 MW existing unit is around 336 TPH considering the GCV of lowest in band of imported Coal (i.e. 4200 Kcal/Kg). Considering the blend ratio of (Indigenous) 25: (Imported) 75 as well as blend calorific value of 4200 Kcal/Kg, the blended coal requirement is estimated to be the same as imported coal. Hence there will not be any additional coal requirement
As there is no additional coal requirement for use of blended coal scenario, the part of the existing stockyard will be earmarked for the storage of indigenous coal. Hence no additional land requirement arises.
Similarly, for 1200 MW the ash generation (considering 6% of ash in coal) while using imported coal alone will be about 2.99 Lakh TPA @85PF (Fly Ash: 2.39 Lakh TPA Bottom Ash: 0.6 Lakh TPA). As there is no change in Ash % as well as coal requirements with respect to imported coal and Blended coal, no additional ash generation is estimated.
It is pertinent to mention that ITPCL is ensuring 100% Fly ash utilization and in addition utilization of bottom ash is tied up. The ash pond area available for 3180 MW is about 107 Acres to take care of lack of bottom ash utilization scenarios.
Hence, there is no impact due to the use of blended coal on land environment. Well established Dust suppression measures are available for the existing coal stockyard as well as at Ash pond which will be continued to control the fugitive dusts.
6.1.2 Due to Indigenous Coal Transportation
Indigenous coal transportation from Neyveli to ITPCL Plant site is proposed through existing preferred road network (Mandarakuppam/Neyveli- Vadalur- Kurinjipadi- kullanchavadi – alapakkam petrol bunk - Villiyanallur then plant). This land use abutting this existing road network is cropland/plantations/barren/habitations/water Bodies/Streams etc.,
It is estimated that about 1.25 MMTPA of Indigenous coal for 1200 MW will need to be transported considering the blend ratio of 25 (Indigenous):75 (Imported). The number of trucks requirement to transport this quantity will be around 6-7 trucks per hour. Trucks transporting coal will have impact on enroute land environment if not adequately managed due to fugitive dust generation, accidental spill if any.
6.1.2.1 Mitigation Measures
Trucks will be covered with tarpaulin or any other effective measure/device completely Trucks shall ensure that are not over loaded as well as there is no spillage during
transportation Drivers should be sensitized with respect to need to drive carefully.

EC Amendment (Use of Blended Coal) for ITPCL Thermal Power Plant at Cuddalore district, TN C1181305 Technical Note on Use of Blended Coal for ITPCL’s TPP RP001 rev. 0
6 Anticipated Environmental and Social Impacts and Mitigation Measures Page 24
Speed is one of the main causes for accidents. So, speed of the trucks have to be controlled especially when they are passing through villages by providing speed breakers, sign boards and other appropriate speed control techniques
Containment, cleaning of the spills at the accidental site shall be as quick as possible. Recovered coal materials shall be sent to ITPCL TPP site for better management.
Air Environment 6.2
6.2.1 Due to Use of Blended Coal
The details emission committed with respect to 1200 MW (Imported Coal) during the EIA study for which Environmental Clearances is granted are given below.
SO2 – 196 g/s (for each 600 MW) NO2 – 340.7 g/s (for each 600 MW) PM – 45.5 g/s (for each 600 MW)
In addition, during the Rapid Cumulative Impact Assessment Study (RCEIA) study, Flue gas Desulphurization (FGD) Unit was suggested by MoEF&CC to bring down the overall SO2 emissions. Accordingly, FGD unit was considered by ITPCL and applied for EC amendment to have flexibility in S% in imported coal up to 0.8% and granted by MoEF&CC. The SO2 Emissions was estimated at about 181 g/s considering the FGD for Maximum of 0.8% Sulphur in coal.
It is pertinent to mention that No Other major industries have come up within 25.0 km radius which was proposed and considered during RCEIA study such as Cuddalore Power Company Limited (2X660 MW), Nagarjuna Oil Corporation Limited (6.5 MTPA), SRM Energy Limited (3x660 MW).
Later the New TPP Emission standards released by MoEF&CC, GoI during December 07, 2015, all existing TPPs should meet the stipulated standards by adopting suitable pollution control measures. Accordingly, for ITPCL 2X600 MW units the following emissions are supposed to be met (TPPs installed upto December 2016).
SO2 @ 200mg/Nm3 NO2 @ 300mg/Nm3 PM @ 50mg/Nm3
Accordingly the revised emissions from ITPCL 2X600 MW are estimated and provided below in Table 6-1 . Table 6-1: Comparison between Emissions due to Blended Coal and 100 % Imported Coal
S. No
Unit (MW)
Flue Gas Flow Rate NM3/Hr
Emissions - Imported Coal (Lowest in Band Coal Scenario-4200 Kcal/kg) / Blended Coal
SO2 @ 200 mg/Nm3 NO2 @ 300 mg/Nm3 PM @ 50 mg/Nm3
1 600 25,63,167 142.4 213.6 35.6
2 600 25,63,167 142.4 213.6 35.6
284.8 427.2 71.2
The emission due to the use of blended coal will remain same as for imported coal use as there is no additional coal requirement, no change in coal parameters, no change in calorific value.

EC Amendment (Use of Blended Coal) for ITPCL Thermal Power Plant at Cuddalore district, TN C1181305 Technical Note on Use of Blended Coal for ITPCL’s TPP RP001 rev. 0
6 Anticipated Environmental and Social Impacts and Mitigation Measures Page 25
The following observations are made for impact on air environment due to the use of Blended Coal.
There is no Increase in SO2, NO2 and PM emissions due to use of Blended Coal which is equivalent to use of 100% Imported Worst Coal (4200 Kcal/Kg).
The stack monitoring results of the existing units (2x600 MW) using imported coal reveals that all the emissions are well within stipulated standards. i.e., SO2 emissions are observed between 169 to 187.4 mg/Nm3 which is less than 200 mg/Nm3, NO2 emissions are observed between 158.4 to 230 mg/Nm3 which is less than 300 mg/Nm3 and PM emissions are observed between 18.9 to 29.7 mg/Nm3 which is less than 50 mg/Nm3.
ITPCL is committed to adhere the standards by MoEF&CC, GoI during December 07, 2015 applicable for both Blended Coal and 100% imported Coal Scenarios.
No Exceedance in the Ambient Air Quality is observed in the locations that are being monitored by ITPCL as part of Existing EMP.
Hence no additional impact due to use of blended coal on Air Environment is envisaged..
6.2.1.1 Mitigation Measures
Continuous Stack monitoring as well as Ambient Air Quality Monitoring being followed by ITPCL shall be continued.
6.2.1.2 Pollution Control Measures Available
The following are the pollution control measures available at ITPCL.
For Particulate Matter: ESP For SO2: FGD (Wet) Lime stone based For NO2: Low Nox Burners For Fugitive Emissions: Wind Barrier, Covered Conveyor, Covered Transfer Points,
Water Sprinklers, Silos, Track Hopper fitted with Dust Suppression etc.,
6.2.2 Due to Indigenous Coal Transportation, Unloading and Storage
The indigenous coal is proposed to be sourced from NLC India Limited mines located at Neyveli and the Environment Management at the Mines will be taken care by NLC.
Transportation of Indigenous coal (Lignite) results in use of public infrastructure such as roads. The NLC Neyveli mines can be accessed through existing/developed road network (Preferred option) consisting of NH- 532 (Mandarakuppam//Neyveli-Vadalur- Kullanchavadi), Major Road (Kullanchavadi- Alapakkam), NH45 A (Alapakkam to Villiyanallur) and Village Road (Villiyanallur to Puduchatiram Road).
During Coal transportation, there is a possibility of impact on air quality along the route due to exhaust emissions, fugitive dust suspension and traffic congestion. As the truck is proposed to be covered, the fugitive dust emission is not envisaged during transportation. The windblown dust during the coal movement could impact the road users and also habitations enroute.
The ambient air quality monitoring was carried out in enroute habitations as well as plant site. The baseline concentrations of Particulate Matter PM, SO2, NO2 and others are within the limits of NAAQS stipulated by MoEF&CC/CPCB. With the present background concentrations of air quality parameters, it is expected that there will only be a mild build-up of air pollutants.
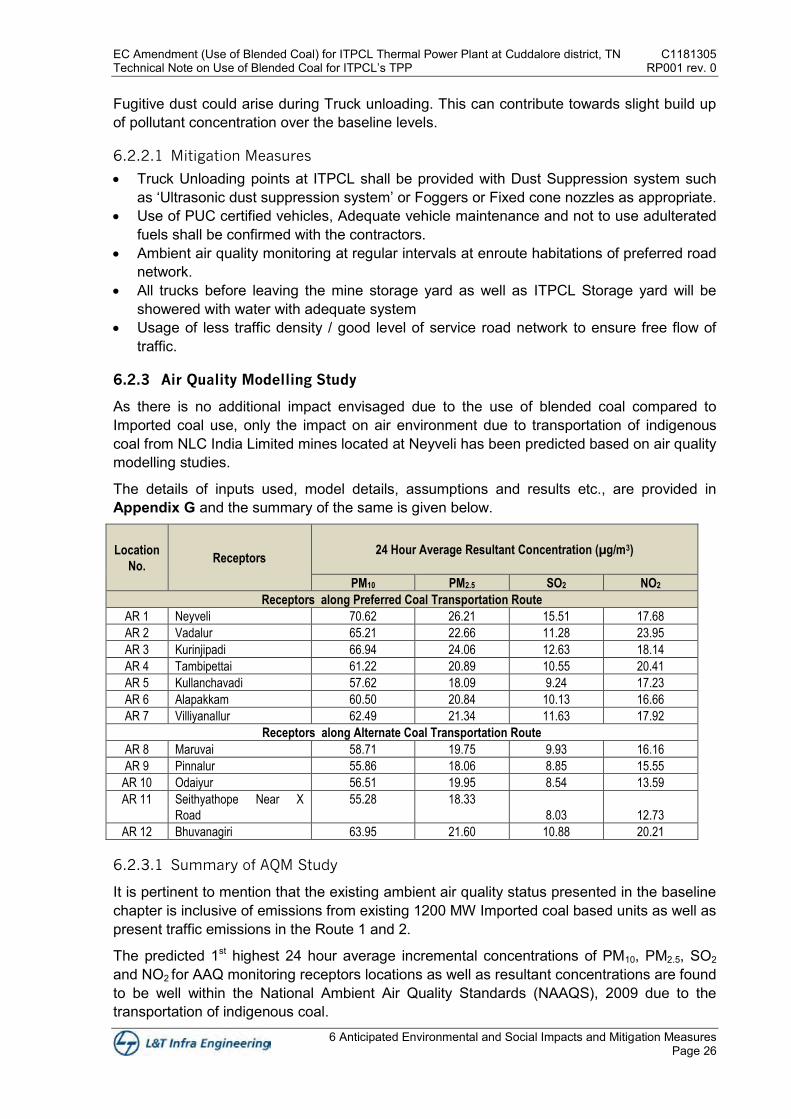
EC Amendment (Use of Blended Coal) for ITPCL Thermal Power Plant at Cuddalore district, TN C1181305 Technical Note on Use of Blended Coal for ITPCL’s TPP RP001 rev. 0
6 Anticipated Environmental and Social Impacts and Mitigation Measures Page 26
Fugitive dust could arise during Truck unloading. This can contribute towards slight build up of pollutant concentration over the baseline levels.
6.2.2.1 Mitigation Measures
Truck Unloading points at ITPCL shall be provided with Dust Suppression system such as ‘Ultrasonic dust suppression system’ or Foggers or Fixed cone nozzles as appropriate.
Use of PUC certified vehicles, Adequate vehicle maintenance and not to use adulterated fuels shall be confirmed with the contractors.
Ambient air quality monitoring at regular intervals at enroute habitations of preferred road network.
All trucks before leaving the mine storage yard as well as ITPCL Storage yard will be showered with water with adequate system
Usage of less traffic density / good level of service road network to ensure free flow of traffic.
6.2.3 Air Quality Modelling Study
As there is no additional impact envisaged due to the use of blended coal compared to Imported coal use, only the impact on air environment due to transportation of indigenous coal from NLC India Limited mines located at Neyveli has been predicted based on air quality modelling studies.
The details of inputs used, model details, assumptions and results etc., are provided in Appendix G and the summary of the same is given below.
Location
No. Receptors
24 Hour Average Resultant Concentration (µg/m3)
PM10 PM2.5 SO2 NO2
Receptors along Preferred Coal Transportation Route
AR 1 Neyveli 70.62 26.21 15.51 17.68
AR 2 Vadalur 65.21 22.66 11.28 23.95
AR 3 Kurinjipadi 66.94 24.06 12.63 18.14
AR 4 Tambipettai 61.22 20.89 10.55 20.41
AR 5 Kullanchavadi 57.62 18.09 9.24 17.23
AR 6 Alapakkam 60.50 20.84 10.13 16.66
AR 7 Villiyanallur 62.49 21.34 11.63 17.92
Receptors along Alternate Coal Transportation Route
AR 8 Maruvai 58.71 19.75 9.93 16.16
AR 9 Pinnalur 55.86 18.06 8.85 15.55
AR 10 Odaiyur 56.51 19.95 8.54 13.59
AR 11 Seithyathope Near X
Road
55.28 18.33
8.03 12.73
AR 12 Bhuvanagiri 63.95 21.60 10.88 20.21
6.2.3.1 Summary of AQM Study
It is pertinent to mention that the existing ambient air quality status presented in the baseline chapter is inclusive of emissions from existing 1200 MW Imported coal based units as well as present traffic emissions in the Route 1 and 2.
The predicted 1st highest 24 hour average incremental concentrations of PM10, PM2.5, SO2 and NO2 for AAQ monitoring receptors locations as well as resultant concentrations are found to be well within the National Ambient Air Quality Standards (NAAQS), 2009 due to the transportation of indigenous coal.
EC Amendment (Use of Blended Coal) for ITPCL Thermal Power Plant at Cuddalore district, TN C1181305 Technical Note on Use of Blended Coal for ITPCL’s TPP RP001 rev. 0
6 Anticipated Environmental and Social Impacts and Mitigation Measures Page 27
Noise Environment 6.3
6.3.1 Due to Use of Blended Coal
There will not be any additional noise generation than the normal operation is envisaged due to the use of blended coal. Hence the additional noise generation is not envisaged.
6.3.1.1 Measures
Use of appropriate Personal Protecting Equipment (PPE) including ear plugs, muffs etc., by the Workers exposed to excessive noise level at ITPCL Plant site will be continued.
Existing Ambient Noise Quality Monitoring in and around the Plant Site shall be continued.
Periodic maintenance of the equipment that is being used will be continued.
6.3.2 Due to Indigenous Coal Transportation, Unloading and Storage
Indigenous coal transportations through trucks will generate the noise and may affect the enroute habitations and during Unloading at ITPCL premises. Number of additional truck movement for ITPCL’s indigenous coal transport is estimated about 6-7 numbers per hour only over and above existing traffic on these roads. The preferred existing road network has less number of habitations and the people in this road stretch are habituated to traffic movements. The impact due to increased noise level will be on nearby settlements which will be in the order of less significant.
6.3.2.1 Mitigation Measures
Use of Bye pass road (Near Kurinjipadi) Drivers shall be sensitized to follow traffic rules especially restrictions on horn at sensitive
locations like schools along the road etc., All haul roads (for truck transport and other vehicles) within the boundary will be
maintained properly to avoid excessive noise levels from Engine acceleration and deceleration.
Additional Ambient Noise Quality Monitoring along enroute habitations shall be carried out
Water Environment 6.4
6.4.1 Due to Use of Blended Coal
The desalinated water requirement for the 1200 MW Imported coal based units is about 10 MLD against approved 40 MLD for entire 3180 MW and Sea water requirement (For both Cooling and desalination Plant) is about 11535 m3/hr for 1200 MW against approved 33,000 m3/hr for entire 3180 MW. The discharges (Reject brine and Return cooling water) through marine outfall are about 8539 m3/hr for 1200 MW against approved 24,062 m3/hr for Entire 3180 MW.
For the proposed use of blended coal at 1200 MW TPP, there will not be any additional requirement of Seawater, Desalinated water and also no additional discharges. Also no additional generation of wastewater also envisaged.
Hence, Impact on the Water environment due to use of blended coal is insignificant.

EC Amendment (Use of Blended Coal) for ITPCL Thermal Power Plant at Cuddalore district, TN C1181305 Technical Note on Use of Blended Coal for ITPCL’s TPP RP001 rev. 0
6 Anticipated Environmental and Social Impacts and Mitigation Measures Page 28
6.4.2 Due to Indigenous Coal Transportation, Unloading and Storage
During the Indigenous coal transportation, truck accidents, although the probability is very less, can result in spillage of coal from the Trucks, which may pollute nearby water bodies, which will have chain of reaction with seepage into connecting water bodies. The preferred or selected road network for Indigenous coal transportation is crossing streams such as kanyakovil odai/Neyveli river near Rajkuppam, Uppanar River near Gopalapuram, Buckingham Canal near Plant site, Perumal lake Flood Channel near Anaiyampettai and Tank near Vadalur.
If the storm water runoff from Truck Unloading area at Plant Site if any, directed to nearby water bodies, it will deteriorate the water quality.
6.4.2.1 Mitigation Measures
Truck washing in the enroute water bodies shall be strictly prohibited and awareness to drivers shall be imparted.
Frequent check of conditions of Truck deputed for coal transport Checking of Trucks and closing of any gaps or openings to prevent coal discharges Covering of Trucks using tarpaulin covers will reduce windblown dust deposition into
water bodies Accidental spills if any cleaning will be attempted and containment and recovery will be
faster.
Terrestrial Ecology 6.5
6.5.1 Due to Use of Blended Coal
There is no additional emission due to use of blended coal and hence no significant impact due to use of Blended coal on the ecology environment in and around the ITPCL TPP.
6.5.1.1 Measures
ITPCL shall ensure proper functioning of pollution abatement measures such as ESP, FGD, Low NOX, Dust Suppression System at Coal Stockyard, Wind Barrier etc.,
ITPCL shall ensure that new Emission Standards are met.
6.5.2 Due to Indigenous Coal Transportation, Unloading and Storage
This land use abutting the preferred indigenous coal transportation (existing) road network is cropland/plantations/barren/habitations/water Bodies/Streams etc., There is no ecological sensitive area present in the preferred indigenous coal transportation route.
Trucks transporting coal will have impact on abutting enroute ecology if not adequately managed due to fugitive dust generation, accidental spill if any. Movement of Coal trucks may cause some disturbance to the fauna due to noise. As trucks will be using for the coal transport exhaust emissions and coal dust from the trucks may be respired by the fauna and ingested by herbivorous species since the coal dust may coat the surface of vegetation. Coal dust coating the leaf surfaces of vegetation results in blockage stomata (leaf pores responsible for gaseous exchange and water vapour exchange) and reduced photosynthetic performance.

EC Amendment (Use of Blended Coal) for ITPCL Thermal Power Plant at Cuddalore district, TN C1181305 Technical Note on Use of Blended Coal for ITPCL’s TPP RP001 rev. 0
6 Anticipated Environmental and Social Impacts and Mitigation Measures Page 29
The internal roads are well paved and truck unloading area at the stockyard is having adequate Dust Suppression (Water Sprinklers) and containment systems (Wind Barrier). In addition green belt is being developed which ensures impact on Flora and Fauna abutting plant site is insignificant.
6.5.2.1 Mitigation Measures
Trucks will be covered with tarpaulin, not over loaded, no spillage, Speed restrictions to avoid accidents etc.,
Use of PUC Certified Trucks for coal transportation As the existing routes are proposed to be used, the Flora and Fauna abutting this route
are already acclimatised to this traffic changes.
Marine Environment 6.6
6.6.1 Due to Use of Blended Coal
The Sea water requirement (For both Cooling and desalination Plant) is about 11535 m3/hr for 1200 MW against approved 33,000 m3/hr for entire 3180 MW. The discharges (Reject brine and Return cooling water) through marine outfall are about 8539 m3/hr for 1200 MW against approved 24,062 m3/hr for Entire 3180 MW.
For the proposed use of blended coal at 1200 MW TPP, there will not be any additional requirement of Seawater, Desalinated water and also no additional discharges.
Hence, Impact on the marine environment due to use of blended coal is insignificant.
6.6.1.1 Measures Available
The intake structure is constructed to receive the water from the sea and outfall structure is constructed to discharge the return cooling water and reject brine. The locations of intake and outfall structures have been selected based on modelling results. The outfall is located in such a way that the resultant temperature of sea water will be less than the stipulated norms of MoEF/CPCB apart from the economic considerations of the proposed project.
The seawater is drawn through submarine pipelines to an intake sump located at shore. A desilting basin is provided upstream of the sump to remove sand and silt. A dedicated stop log gate, bar screen, travelling water screen are provided at each pump sump. The screens are provided to avoid large scale debris, etc. Stop log gates are provided for isolation. To prevent the blocking of openings of travelling water screens by debris of sea water, screen wash pumps, tapping the water from the intake pump discharge header and re-circulating the same on the screen for back washing to make the system efficient has been provided. The trash screens are provided with automatic trash raking system. The sizing of intake, screen and pumping unit have built-in margins to ensure the ability to pass the required flow except in an extreme case of large scale fouling of the screen mesh. The submergence of the pump, the sump dimensions and wall clearances are designed in accordance with standards prescribed by the hydraulic institute. Low tide level and hydraulic losses in the intake system and the screens have also been taken into consideration.
The outfall is more than 1500 meters distance into the sea. The cooling water blowdown from the power plant is discharged to sea. The reject brine from desalination plant is pumped into to the cooling water blowdown. The cooling water blowdown together with the brine reject is pumped to outfall system through submarine pipelines.

EC Amendment (Use of Blended Coal) for ITPCL Thermal Power Plant at Cuddalore district, TN C1181305 Technical Note on Use of Blended Coal for ITPCL’s TPP RP001 rev. 0
6 Anticipated Environmental and Social Impacts and Mitigation Measures Page 30
6.6.2 Due to Indigenous Coal Transportation, Unloading and Storage
As the preferred route for indigenous coal transportation well away from the sea coast no direct impact on the marine environment is envisaged. However accidental spill if any in the water bodies connected to sea (Buckingham canal) may reach marine environment. Necessary measures are proposed in the Section 6.4.2.1 to take care of such accidental spills.
During unloading at Stockyard, storage at ITPCL Site sufficient measures such as Dust suppression, Wind Barrier, Green belt are available which will ensure the containment of coal dust within TPP premises and rendered insignificant impact on Marine environment.
Solid Waste Management 6.7
6.7.1 Due to Use of Blended Coal
No other additional solid waste generation is envisaged due to use of blended coal.
6.7.2 Due to Indigenous Coal Transportation, Unloading and Storage
As the coal will be transported through covered trucks, and washing of tyres before leaving stockyard, no spills are envisaged during normal operations within the ITPCL site. However, accidental spills if any, it will be attempted to recover and then recovered material will be sent back to stockyard.
Municipal Solid waste (MSW) generation of about 84 Kg/day (168 Trucks per day X 2 Persons per truck X 0.25 kg per person) is expected as the truck drivers and cleaners are expected to use Plant User facility in the Truck parking Area. Mostly the MSW will be biodegradable and fraction of recyclables. Currently ITPCL is managing all bio degradable waste within plant boundary through vermicomposting and recyclable through local vendors. The same will be followed for this additional MSW generation at Truck Parking Facility and hence no significant impact.
6.7.2.1 Mitigation Measures
Efficient Entry/Exit clearance procedure shall ensure minimising queuing of Trucks and using truck parking area and there by reduction in MSW generation.
Provision of Truck Parking area with adequate User Facility. Provision of MSW Collection Bins at the truck parking area.
Traffic and Transportation 6.8
6.8.1 Traffic Additions due to Indigenous Coal Transport
Due to the proposed use of blended coal, the Indigenous coal requirement is estimated at 1.25 MMTPA, will need to be transported from NLC India Limited mines located at Neyveli. The number of trucks requirement to transport this quantity will be around 6-7 trucks per hour. Two alternate route have been assessed and based on their merits and demerits as discussed in Section 4.1.2, the Route Mandarakuppam//Neyveli (NH 532) – Vadalur (NH 532) – Kurinjipadi (NH 532) – Kullanchavadi (NH 532) – Alapakkam – Villiyanallur – Plant Site is selected.
The existing traffic density is less and having Level of Service greater than C (Good, Very Good and Excellent) in the route proposed to be used for Indigenous coal Transportation.

EC Amendment (Use of Blended Coal) for ITPCL Thermal Power Plant at Cuddalore district, TN C1181305 Technical Note on Use of Blended Coal for ITPCL’s TPP RP001 rev. 0
6 Anticipated Environmental and Social Impacts and Mitigation Measures Page 31
The generated traffic due to ITPCL Indigenous coal Transportation will be about 31.5 PCUs/ Hr assuming 6-7 Trucks Per Hour with 4.5 as PCU Factor for Multi-Axle Vehicle.
Based on the Traffic studies and projections till the year 2025 covering both Normal and Generated Traffic, the following are observed.
Road Name Road Stretch Total PCUs and
PCUs/Hr (V)
IRC Standards
Capacity (C) PCUs/hr
V/C
(Level of Service)
NH-532/ Vadalur
Junction
Vadalur – Neyveli
Total
21342 / 889.25
2400 for 4 lane
undivided 0.37 (B – Very Good)
Kurinjipadi Kurinjipadi –
Vadalur Total
13198/ 549.90
1500 for 2 lane two
way 0.37 (B – Very Good)
Kullanchavadi Kullanchavadi –
Kurinjipadi Total
14053 / 585.55
1500 for 2 lane two
way 0.39 (B – Very Good)
Alapakkam (NH
45 – A)
Kullanchavadi –
Alapakkam Total
7514 / 313.10
1500 for 2 lane two
way 0.21 (B – Very Good)
Villiyanalur Villiyanallur –
Alapakkam Total
21545 / 897.72
1500 for 2 lane two
way 0.60 (C – Good)
Considering the Traffic growth pattern, these roads will be able to maintain the same level of service till the year 2025 without any strengthening/ widening requirements. This will meet the Interim requirement of ITPCL Coal transportation by road.
As the existing roads are able to accommodate the truck traffic to be generated by ITPCL, the impact on existing roads is insignificant.
However, considering more two wheelers are observed in the vehicle composition of preferred routes, the necessary road safety measures should be strictly followed by the Coal Carrying Truck Drivers to avoid accidents if any.
6.8.1.1 Mitigation Measures
The chances of accidents would be reduced by ensuring the following Traffic control measures including speed limits to be enforced strictly Minimising truck movements during Peak Hours Training/Awareness to drivers on Road Safety, typical Accident Prone Areas, Speed Limit
restrictions, Do and Don’ts while driving etc., Use of Bye Pass road near Kurinjipadi Drivers should be sensitized with respect to need to drive carefully while passing through
the villages. Activities to implement proper precautionary measures such as honking, lighting etc.,
wherever required.
6.8.2 Traffic deductions due to Reduced Imported Coal Transport
Currently the Imported Coal is being transported from Karaikal Port to ITPCL site by rail which is about 5 rakes per day to meet the 1200 MW coal requirements. In current proposal, about 25% of Indigenous coal is proposed to be blended with imported coal and used, and hence imported coal requirement will be less than that currently being used. Hence accordingly the number of trains visiting the ITPCL will also be less (approximately 4 trains only). The impacts will also be minimised.
Also Once NLCIL develops Rail sidings then the indigenous coal of 1.25 MMTPA can be transported through Rail from Neyveli to Plant site. The distance to be travelled from Neyveli to Plant site by train/rake is estimated to be about 60 km which is shorter than the current imported coal transport from Karaikal Port (128 km).
EC Amendment (Use of Blended Coal) for ITPCL Thermal Power Plant at Cuddalore district, TN C1181305 Technical Note on Use of Blended Coal for ITPCL’s TPP RP001 rev. 0
7 Environmental Monitoring Programme Page 32
Socio-economic Environment 6.9
6.9.1 Due to Use of Blended Coal
Based on the points discussed above it can be observed that there is no significant additional impact on the social environment than predicted during the EIA. Following points are observed with respect to social environment due to the use of blended coal for 1200 MW.
No Additional land requirement and hence no land acquisition and No R&R No additional emissions except the emissions from trucks during transportation of
indigenous coal. This will be offset by reduction in emission from diesel engine of railway rakes and emissions from ocean going vessels.
No additional water requirement and discharges in the marine environment.
6.9.2 Due to Indigenous Coal Transportation, Unloading and Storage
Due to indigenous coal transportation (6-7 Trucks per Hour), the likely impacts envisaged are on the enroute habitations are mild build-up of air pollutants due to exhaust emissions, coal dust, coal spills, increase in noise, traffic congestion, etc.,
The degree of air pollution is likely to be on a lower scale with improvement in road surface & with better maintenance
The truck plying will ensure increase in road as well as social safety. The control measures to be adopted are that employment will be given to the contractor who will deploy trained personnel for the work. The verification of the employed personnel will be conducted to ensure the terms of safety and security.
Additional Jobs will be generated as the indigenous coal is proposed to be transported through trucks. The project is expected to increase employment in tertiary sector with increase in direct and indirect employment in the region. The local eateries, repair shops, provisional stores, budget guest houses etc business is likely to increase.
6.9.2.1 Mitigation Measures
Public awareness programmes to be launched for the enroute habitations in the preferred alignment.
Corporate Social Responsibility 6.10
The CSR activities IL&FS Group has been involved in are given in Appendix H.
Corporate Environment Responsibility (CER) 6.11
No additional investment involvement for this proposal of use of blended coal and hence this proposal shall be classified under amendment with no additional investment and hence doesn’t warrant fund allocation Under Corporate Environment Responsibility (CER).
7 Environmental Monitoring Programme
Environmental monitoring programme is an important component during environmental management of the project. Regular monitoring of environmental parameters is of immense importance to assess the status of environment during project operation. With the knowledge of baseline conditions, the monitoring programme will serve as an indicator for any deterioration in environmental conditions due to operation of the project and enables the

EC Amendment (Use of Blended Coal) for ITPCL Thermal Power Plant at Cuddalore district, TN C1181305 Technical Note on Use of Blended Coal for ITPCL’s TPP RP001 rev. 0
7 Environmental Monitoring Programme Page 33
project proponent to take up suitable steps of mitigation in time to safeguard the environment.
As a part of compliance monitoring, the environmental attributes such as Ambient Air, Ambient Noise & Source Noise, Water Quality, Stack Emissions (CEMS) and Marine Environment, Discharges (STP Outlet, CMB Outlet, ETP Outlet) and Ash pond effluent etc., are being monitored by ITPCL which shall be continued to take care of the Blended Coal use requirements also.
However, considering the additional project activity such as indigenous coal transportation through preferred route from NLCIL coal mines to ITPCL site, the following additional environmental monitoring programme is proposed.
Table 7-1: Additional Environmental Monitoring Programme
Environmental Attributes
Parameters to be monitored
No. of Sampling Locations Frequency of
Monitoring
Ambient Air Quality
As per NAAQS, CPCB 2009.
Kurinjipadi
Tambipettai
Kullanchavadi
Alapakkam
Villiyanallur
Once in a quarter of the year
Water Quality Physical, Chemical and Biological
Groundwater (06)
Vadalur
Kurinjipadi
Tambipettai
Kullanchavadi
Alapakkam
Villiyanallur
Surface water (06)
Water body Near Nattalkuppam
Kanyakvil Odai/ Neyveli River Near Andikuppam
Perumal Eri Near Palliodai
Perumal Eri Overflow Channel Near Anaiyampettai
Stream (Uppanar) Near Gopalapuram
Buckingham Canal Near ITPCL Site
Half yearly Once
Ambient Noise Quality
Day and night noise levels
Vadalur
Kurinjipadi
Tambipettai
Kullanchavadi
Alapakkam
Villiyanallur
Half yearly Once
Soil Quality Physical & Chemical Parameters
Vadalur
Kurinjipadi
Tambipettai
Kullanchavadi
Alapakkam
Villiyanallur
Once in the Year
Truck Movements No. of Vehicles At Plant Entry/Exit Gate Daily log

EC Amendment (Use of Blended Coal) for ITPCL Thermal Power Plant at Cuddalore district, TN C1181305 Technical Note on Use of Blended Coal for ITPCL’s TPP RP001 rev. 0
8 Summary and Conclusions Page 34
8 Summary and Conclusions
Considering the availability of Indigenous Coal (Lignite) at Neyveli NLC India Limited mines which is located about 25 km West (aerial distance), ITPCL proposes to use the Indigenous Coal along with Imported Coal (blend ratio of 25:75) in the existing 2X600 MW units in order to derisk the company from coal supply /availability risk in Operation with Insignificant or minimal additional environmental/social impacts
Accordingly ITPCL has proposed the use of blended coal in addition to use of 100% Imported at their existing 2X600 MW and Indigenous Coal transport by Road as an interim arrangement and seeks amendment to EC from EAC (T) MoEF&CC. The impacts related to Use of Blended Coal and Indigenous Coal Transportation by road was analysed and summarised below.
8.1.1 Comparison of Parameters for use of Imported and Blended Coal
S.No Parameters Units For Imported Coal
alone For Blended Coal Remarks
1. Coal Requirement TPH (Each 600 MW)
336 335.8 No Change
2. Sulphur % 0.8 with FGD 0.8 with FGD No Change
3. Ash % 6 6 No Change
4. Calorific Value (GCV) Kcal/Kg 4200-4600 Average: 4200 Meets Imported Coal Lower in band GCV
5. Station Heat Rate Kcal/Kwh 2350 2350
6. Ash Generation Lakh TPA 299967.43 299967.43 No Change-
7. Fly Ash Lakh TPA 2.399 2.399 No Change -
8. Bottom Ash Lakh TPA 0.599 0.599 No Change -
9. Ash Pond Area Acres 107 For 3180 MW 107 No Change -
10. Coal Storage Requirements
Duration 30 days For Entire 3180 MW
Remain Same No Change
11. Lime Requirement for FGD
Tones/Day (Each 600 MW)
15 15 No Change
12. Gypsum generation from FGD
Tones/Day (Each 600 MW)
20 20 No Change
13. CW Requirements (Intake)
M3/Hr 11535 for 1200 MW 33,000 for Entire 3180 MW
Remain Same No Change
14. Discharges / Outfall m3/hr 8539 for 1200 MW 24062 for Entire 3180 MW
Remain Same No Change
15. Freshwater Requirement MLD 10 for 1200 MW 40 for Entire 3180MW
Remain Same No Change
16. Furnace/Boiler Specifications/ Modifications if any
- Tangential Fired Water Tube Furnace
Remain Same As the plant is already designed for worst coal.
17. Pollution Control Measures Provided/Considered
- ESP, FGD, Low NOX Burners
ESP, FGD, Low NOX Burners
No Change
18. Emissions PM SO2 NOx
mg/Nm3 <50 <200 <300
<50 <200 <300
No Change
19. Traffic Additions/Reductions
Nos 5 trains per day 6-7 Truck Per Hours and 4 trains per day
-
20. Total Plant Area Acres 1181 1181 No Change in Area
EC Amendment (Use of Blended Coal) for ITPCL Thermal Power Plant at Cuddalore district, TN C1181305 Technical Note on Use of Blended Coal for ITPCL’s TPP RP001 rev. 0
8 Summary and Conclusions Page 35
Keeping in view of the above, the Environmental & Social aspects of proposed use of blended coal and transportation of indigenous coal by road is given below:
No change in Plant configuration, output, equipment, technical parameterts etc., as the plant is already designed for worst coal of 4200 Kcal/kg GCV which will accommodate the blended coal use requirement also.
No Additional Land is required. No Additional emissions due to the use of blended coal except emissions from trucks due
to the intermittent transportation indigenous coal by road. This will be offset by reduction in emission from diesel engine of railway rakes and emissions from ocean going vessels. The predicted resultant concentrations at all receptors are well within the NAAQS.
No additional water requirements No Additional Discharges are envisaged. Existing pollution control measures are adequate Though the number of trucks required to transport the indigenous coal is low, there will
be minimal impact on the enroute habitation and surrounding environment. However, prudent selection of Route (Preferred) after analysing the abutting land use, population, water bodies, stream crossings, lesser travel distance, less and free flow traffic route, good level of service etc., render the impacts minimal.
In addition, the trucks are proposed to be covered with tarpaulin and hence fugitive emissions are not envisaged.
Considering the below beneficial aspects, use of Blended coal (Imported Coal/Indigenous coal) along with Imported Coal at ITPCL 1200 MW units may be considered by Statutory authority.
Technically, Economically Feasible & Environmentally appropriate Adequate Lignite Availability at Neyveli through E-Auction Nearness to ITPCL TPP ( ~25.0 Km) Lesser transportation distance, Cost and related emissions Due to volatility in the availability of imported coal at reasonable price, foreign exchange
fluctuations, frequent changes in sovereign laws of coal producing countries and shipping & transportation bottlenecks, the availability of coal for power plants at reasonable cost is looking difficult.
In line with GoI Policy to reduce the dependence on imported coal and promote usage of indigenous coal. Reduction of import would also improve the balance of trade for the country.
Encourage indigenous coal production

Figures

SANGALANKUPPAM
TOPPIRUPPU
PALVATTUNNAN
PUVALAI
KOTTATTAI
PERIYAKUMMATT
TACHACHAKHADU
AYIPURAM PORTONOVO
ANJAKKARANCHATTRAM
CHINNUR
VELINGARAYAMPETTAI
PUDUCHCHATTRAM STATIONSILAMBIMANGALAM
SIRUPALAIYAR
TIRTTANAGAR
SAMIYARPETTAI
PARIYAPATTU
NH 45
A
1.510.50
SCALE IN KM
SOUT
HERN
RAI
LWAY
VALIIYANALLUR
MULLUR
VELLARU RIVER
C.MANAMBADY
VATHIYAPALLI
THAIKKAL LIKKAI
PORTO NOVO
BAY OF BENGAL
PROJECT LOCATION
STATION
NH 45 A
SH 70
OTHER ROAD
RAILWAY LINE
MARINE CONTOUR
WATER BODY
PICHAVARAMMANGROVES
LEGEND:
BUCK
INGH
AM C
ANAL
NH 45ATO NAGAPATTINAM
NH 45A
TO PONDICHERRY
SH 70
TO VRIDDHACHALAM
11°31'35"N&79°45'10"E
ANDAMAN ANDNICOBAR ISLANDS
TAMILNADUKERALA
KARNATAKA
ANDHRA PRADESH
ORISSACHATTIS
GARH
MADHYA PRADESH
MAHARASHTRA
GUJARAT JHARKHAND
WEST
RAJASTHANUTTAR PRADESH
BIHAR
ASSAM
UTTARANCHALHARYANA
PUNJAB
HIMACHAL PRADESH
JAMMU & KASHMIR
BENGAL
B A Y O F B E N G A LA R A B I A N
LAKSHADWEEP
SIKKIM
MEGHALAYA
MANIPUR
MIZORAM
TRIPURA
NAGALAND
ARUNACHALPRADESH
SRILANKA
S E A
10°N
20°N
30°N
70°E 80°E 90°E
10°N
20°N
30°N
70°E 80°E 90°E
DELHI
GOA
0km 500km
K E Y M A P - I N D I A
0km 125 km
K E Y M A P - T A M I L N A D U
PROJECT LOCATION
Figure 1: Location Map
L:\Ports\2018\C1181305 - ITPCL EC AMEND-BLENDED COAL\Working\Drawings\RP001-Technical Note\FIG1-LOCATION MAP.dwg, Layout A3P

E 365000M
E 366000M
E 367000M
N 1272000M
N 1273000M
N 1274000M
N 1275000M
BAY OF BENGAL
T
I
D
A
L
F
L
A
T
N 1276000M
E 364000M
E 363000M
E 362000M
VELINGRAYANPETTAI
PUDDUKUPPAM
THOPILRUPPU
CHINNURUR
CO
AL J
ET
TY
6
0
0
M
D
IA
T
U
R
N
IN
G
C
IR
C
L
E
IN
C
O
M
IN
G
/ O
U
T
G
O
IN
G
T
R
A
N
S
M
IS
S
IO
N
C
O
R
R
ID
O
R
KARIKUPPAM PUTHUPETTAI
PANJAKUPPAM
A
P
P
R
O
A
C
H
C
H
A
N
N
E
L
AP
PR
OA
CH
TR
ES
TLE
S
O
U
T
H
E
R
N
P
O
R
T
L
IM
IT
O
F
G
E
M
N
O
R
T
H
E
R
N
L
IM
IT
O
F
IL
&
F
S
C
A
P
T
IV
E
P
O
R
T
S
O
U
T
H
E
R
N
L
I
M
I
T
O
F
I
L
&
F
S
C
A
P
T
I
V
E
P
O
R
T
A
B
C
D
E
F
G
H
O
UT
FA
LL P
IPE
KARIKUPPAML
M
E 368000M
K
N
N 1274604.840
N 1275369.502
N 1275636.596
N 1274669.481
N 1274892.724
N 1273448.624
N 1273336.237
N 1273995.418
E 362902.578
E 362991.425
E 364374.347
E 363346.547
E 364607.685
E 364829.410
E 362790.317
E 362630.893
N 1273184.893E 362830.592
N 1273261.122E 363374.892
N 1272441.350E 363618.479
N 1272333.715E 362988.195
N 1272411.880E 364121.465
N 1273091.856E 364121.465
N 1273091.856E 364496.339
N 1272775.992E 364496.339
N 1272775.992E 364795.520
N 1272411.880E 364795.520
O
P
T
Q
R
S
RAILWAY SIDING ASH POND
PROPOSED
CAPTIVE PORT
PUDUCHCHATRAM R.S
Figure 2: Integrated Layout Showing TPP, Captive Desalination Plant and Captive Port
L:\Ports\2018\C1181305 - ITPCL EC AMEND-BLENDED COAL\Working\Drawings\RP001-Technical Note\FIG2 - TPP WITH NEW RAIL LINK.dwg, FD003

Appendices
Appendix A: Environmental/ CRZ Clearances, Corrigendum, Amendments, Validity Extension etc.


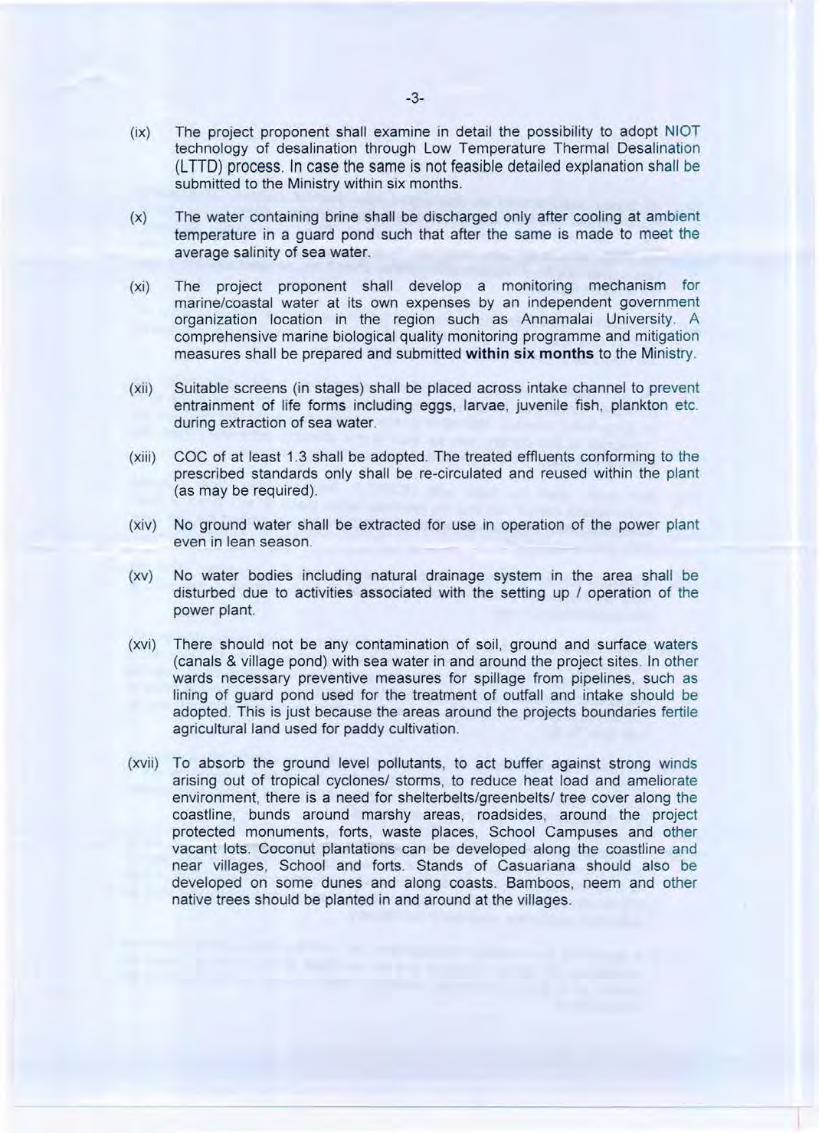


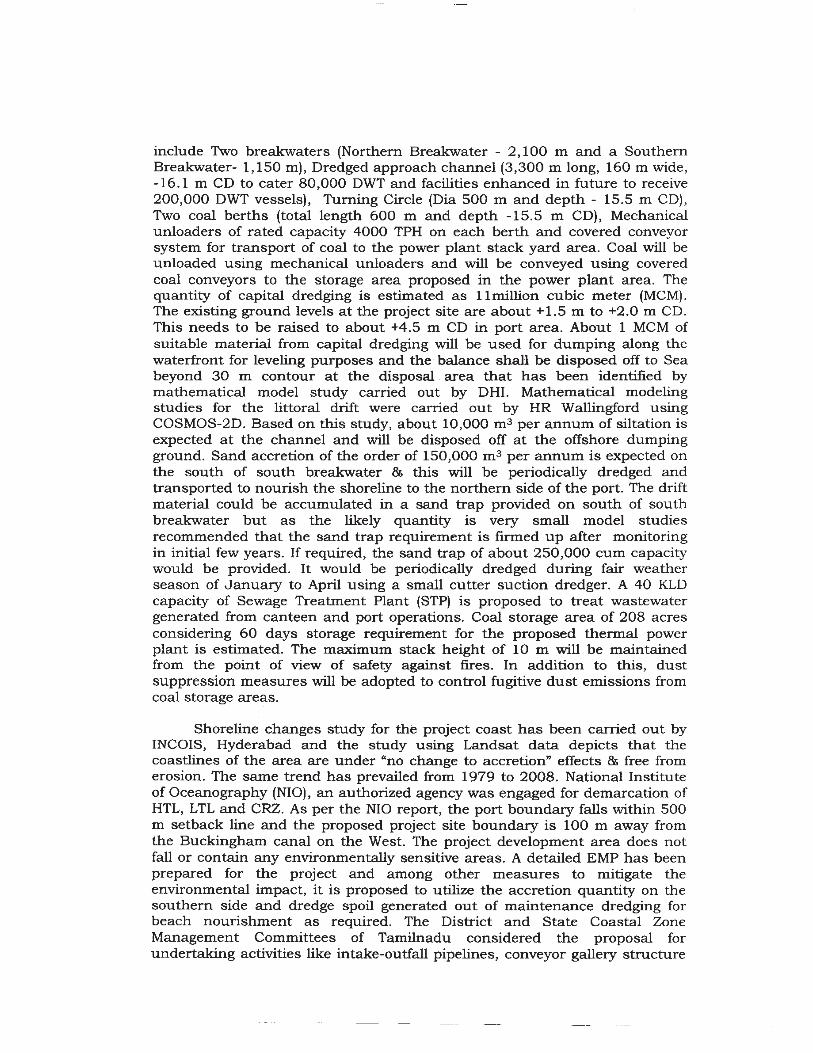


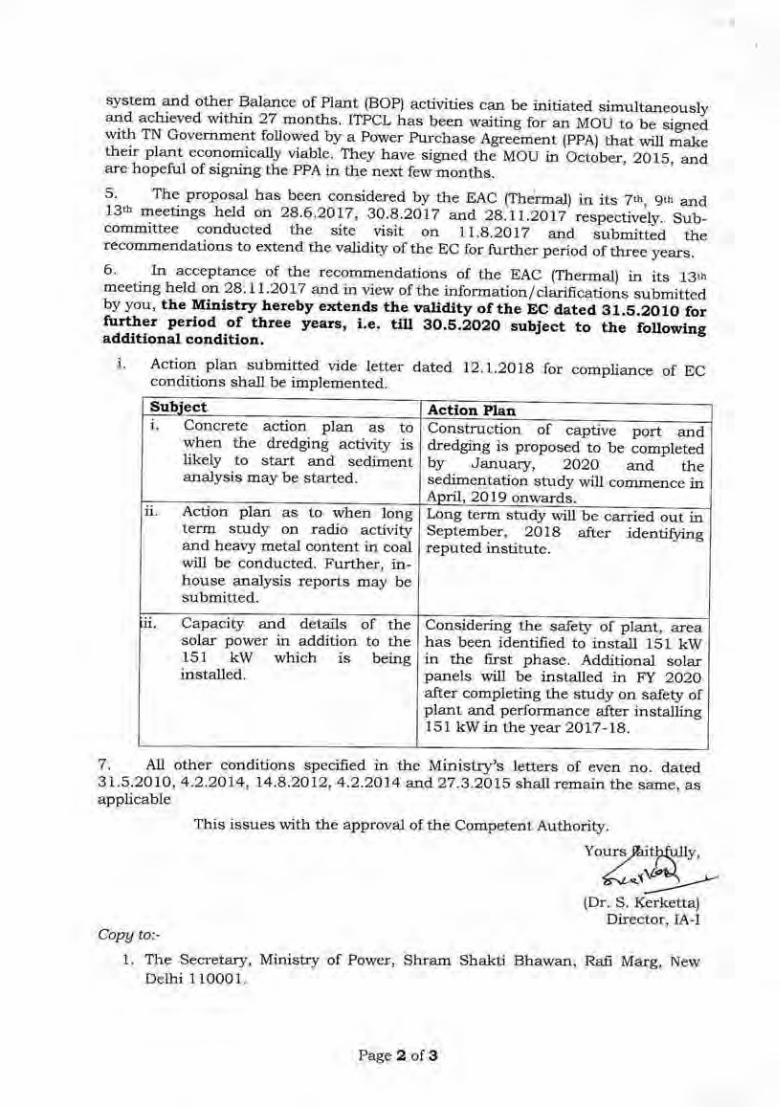


F.No.11-43/2010-1A.111 Government of India
Ministry of Environment, Forest and Climate Change (IA-Ill Section)
Indira Paryavaran Bhawan, Jor Bagh Road, New Delhi - 3
Date: 27th February, 2018 To, Vt-
17) The Chairman M/s Infrastructure Leasing & Financial Services (IL&FS) Ltd, Tamil Nadu Power Company Limited, 4th Floor, KPR Tower, Old No. 21, New No. 2, 1st Street, Subba Rao Avenue College Road, Chennai - 600 006
Email: ms.srinivasanilfsindia.com
Subject: Environmental and CRZ Clearance for Captive Port and Desalination Plant at Kottatti, Bhuvanagiri Taluka, Cuddalore District, Tamil Nadu by M/s Infrastructure Leasing & Financial Services (IL&FS) Ltd -Extension of validity of Environmental and CRZ Clearance - reg.
Sir,
This has reference to your online proposal No. IA/TN/MIS/67122/2010 dated 1st August, 2017 submitted to this Ministry for extension of validity of Environmental and CRZ Clearance granted vide letter No. 11-43/2010-IA.III dated 29th October, 2010 for 'Captive Port and Desalination Plant at Kottatti, Bhuvanagiri Taluka, Cuddalore District, Tamil Nadu in favour of M/s Infrastructure Leasing & Financial Services (IL&FS) Ltd, in terms of the provisions of the Environment Impact Assessment (EIA) Notification, 2006 under the Environment (Protection) Act, 1986 and CRZ Notification, 2011.
2. The proposal for grant of extension of validity of Environmental and CRZ Clearance to the above referred project was considered by the Expert Appraisal Committee (Infra-2) in its 24th meeting held on 30-31 October, 2017.
3. The EAC in its 24th meeting held on 30-31 October, 2017 has recommended the project for grant of extension of the validity of EC&CRZ clearance issued vide letter dated 29th October, 2010 for a period of three years. As per recommendations of the EAC, the Ministry of Environment, Forest and Climate Change hereby extend the validity of Environmental and CRZ Clearance up to 28th October, 2020.
4. The extension of validity is being granted for the original proposals for which Environmental and CRZ Clearance was granted earlier. The project proponents will not make any changes in the project nature, structure or configuration and limit themselves to activities for which the Environmental and CRZ Clearance has been given earlier.
Proposal No. IA/TN/MIS/67122/2010 Page 1 of 2

5. All other conditions stipulated in the Environmental and CRZ Clearance granted vide letter No. 11-43/2010-1A.111 dated 29t October, 2010, shall remain
unchanged.
6. This issues with the approval of the Competent Authority.
(Kushal Vashist) Director
Copy to:
1. The Secretary, Department of Environment and Forests, First Floor, Panagal Building, Saidpet, Chennai — 600 015, Tamil Nadu.
2. The Chairman, CPCB, Parivesh Bhawan, CBD-cum-Office Complex, East Arjun Nagar, Delhi — 32.
3. The Additional Principal Chief Conservator of Forests, Ministry of Environment, Forest and Climate Change, Regional Office (SEZ), 1st and Ilnd Floor, Handloom Export Promotion Council, 34, Cathedral Garden Road, Nungambakkam, Chennai - 34.
4. The Chairman, Tamil Nadu Pollution Control Board, 76, Mount Salai, Guindy, Chennai- 600 032, Tamil Nadu.
5. Guard File.
6. Monitoring Cell, MoEF&CC.
(Kush& Vashist) Director
Proposal No. IA/TN/MIS/67122/2010 Page 2 of 2

Appendix B: Fuel Analysis (Indigenous Coal)

EC Amendment (Use of Blended Coal) for ITPCL Thermal Power Plant at Cuddalore district, TN C1181305 Technical Note on Use of Blended Coal for ITPCL’s TPP RP001 rev. 0
Appendix B Fuel Analysis (Indigenous Coal) Page 1
Appendix B Fuel Analysis (Indigenous Coal)
Appendix C: Traffic Study

EC Amendment (Use of Blended Coal) for ITPCL Thermal Power Plant at Cuddalore district, TN C1181305 Technical Note on Use of Blended Coal for ITPCL’s TPP RP001 rev. 0
Appendix C Traffic Study Page 1
Appendix C Traffic Study
Indigenous Coal Transport through Road Network – Traffic Study C.1
NLC India Limited, Neyveli mines are well connected to ITPCL’s TPP site by road network. The details of road network available, existing traffic and Road conditions and suitability for the Indigenous Coal Transportation etc., are discussed below.
C.1.1 Alternative Routes Considered for Study
Among the available road network, two significant (02) options are studied to check the feasibility to transport the indigenous coal to ITPCL Plant Site from Neyveli mines.
Option1: Mandarakuppam/Neyveli – Vadalur – Kurinjipadi - Kullanchavadi - Alapakkam - Villiyanallur - Plant Site (About 44.2 Km)
Option2: Mandarakuppam/Neyveli – Vadalur – Maruai – Pinnalur – Seithiyathope – Bhuvanagiri – B. Muttalur - Villiyanallur - Plant Site (About 51.2 Km)
Map Showing Road route Option 1 and 2 are given below.

EC Amendment (Use of Blended Coal) for ITPCL Thermal Power Plant at Cuddalore district, TN C1181305 Technical Note on Use of Blended Coal for ITPCL’s TPP RP001 rev. 0
Appendix C Traffic Study Page 2
Figure C-1: Map Showing Road Network Options Available from Neyveli to ITPCL
C.1.2 Land Use of the Alternative Routes Considered for Study
The land use around the alternate routes were studied by using land use and land cover map sourced from Bhuvan (1:10000 Scale) based on 2015 Satellite imageries.
Option 1: The Land use abutting the route 1 is mining area, agricultural land, plantations, and waste land, built up area (Urban and Rural), dry tanks with few stream crossings.
Option 2: The Land use abutting the route 2 is mining area, more of agricultural land, plantations, and less waste land, built up area (Urban and Rural), wet tanks, more number of irrigation Channels, Vellar river with few stream crossings.

EC Amendment (Use of Blended Coal) for ITPCL Thermal Power Plant at Cuddalore district, TN C1181305 Technical Note on Use of Blended Coal for ITPCL’s TPP RP001 rev. 0
Appendix C Traffic Study Page 3
Figure C-2: Land Use abutting the Alternative Routes
C.1.3 Habitations abutting the Alternative Routes Considered for Study
The following are the habitations abutting the alternative routes considered for the study.
Table C-1: Habitations abutting the Alternative Routes Preferred Route from NLCIL to ITPCL Site– Habitations abutting
S.No LHS RHS
1. Periyakuritchi Old Neyveli
2. Kuravankuppam Melpappanpattu
3. Pravathipuram/Vadalur Keelpathi

EC Amendment (Use of Blended Coal) for ITPCL Thermal Power Plant at Cuddalore district, TN C1181305 Technical Note on Use of Blended Coal for ITPCL’s TPP RP001 rev. 0
Appendix C Traffic Study Page 4
Preferred Route from NLCIL to ITPCL Site– Habitations abutting
S.No LHS RHS
4. Ottandikuppam Seplanatham Bus Stop
5. Andikuppam Vadakku Seppalanattam
6. Tambipettai Vinankeni
7. Tambipettaipalaiyam Vadalur
8. Toppukkollai Kurinjipadi
9. Kaumachipalaiyam Peddunayakkankuppam
10. Alappakkam Navakkulam (Ayikuppam)
11. Anaiyampettai Kullanchavadi
12. Mettuppalaiyam Ramanakkuppam
13. Gopalapuram Periyappattu
14. Puduchattriram Silambimangalam
15. Ravanakuppam
16. Villiyanallur
Alternate Route from NLCIL to ITPCL Site– Habitations abutting
1. Periyakuritchi Old Neyveli
2. Kuravankuppam Melpappanpattu
3. Pravathipuram/Vadalur Keelpathi
4. Chinna Maruvay Seplanatham Bus Stop
5. Karaimedu Vadakku Seppalanattam
6. Pinnalur Vinankeni
7. Miralur Vadalur
8. Manjakkollai Nayinakuppam
9. Odaiyur Sethiathoppu
10. Vandarayanpattu Kilavadinattam
11. Kil Bhuvanagiri Allaikkudicheri
12. Manjakkuli Mel Bhuvanagiri
13. Mutlur Tambikkunallampattanam
14. Chinna Kummatti Vargantaikkal/ Bharaikhan taikkal
15. Kottattai Anaiyankuppam
16. Villiyanallur
17. Puduchattriram
The map showing the abutting enroute habitations in alternative routes are given Figure C-3.

EC Amendment (Use of Blended Coal) for ITPCL Thermal Power Plant at Cuddalore district, TN C1181305 Technical Note on Use of Blended Coal for ITPCL’s TPP RP001 rev. 0
Appendix C Traffic Study Page 5
Figure C-3: Map Showing Habitations abutting Alternative Routes
C.1.4 Findings of Traffic Study for Option 1 Route
Traffic studies were conducted for the selected option 1 route at major junctions to understand the present Average Daily Traffic Volumes, vehicles composition, road conditions, level of Services etc.,.Traffic Volumes are measured at major junction in the option 1 route namely NH-532/ Vadalur, Kurinjipadi, Kullanchavadi, Alapakkam and Villiyanalur. Classified Volume Count Survey was carried out May 2018 manually and counts were recorded. Each vehicle type is converted into equivalent Passenger Car Unit (PCU) based on the IRC recommended factors.
The survey locations are shown in the below Figure C-4.

EC Amendment (Use of Blended Coal) for ITPCL Thermal Power Plant at Cuddalore district, TN C1181305 Technical Note on Use of Blended Coal for ITPCL’s TPP RP001 rev. 0
Appendix C Traffic Study Page 6
Figure C-4: CVC survey Locations on Option1 Route
Based on the surveys, the Average Daily Traffic (ADT) along Option 1 Route is arrived. The seasonal correction factor of 1.0 is considered to convert Average Daily Traffic (ADT) to Annual Average Daily Traffic (AADT) and the same is presented in below Table C-2. Table C-2: Annual Average Daily Traffic (AADT) for Option 1 Route
Road Name Road Stretch Conditions
Current
Lane width
(m)
Per day
2W 3W 4W 6W 10W 12W PCUS
NH-532/
Vadalur
Junction
Towards
Vadalur
Good ~ 30 4409 200 1886 656 142 96 6972.5
Towards
Neyveli 4395 215 1982 782 157 89 7478.5
Vadalur –
Neyveli Total
8804 415 3868 1438 299 185 14451
Kurinjipadi Towards
Kurinjipadi
Good ~ 7 4360 79 874 283 2 13 4027
Towards
Vadalur 5098 71 870 318 0 64 4636
Kurinjipadi –
Vadalur Total
9458 150 1744 601 2 77 8663
Kullanchavadi
Towards
Kullanchavadi
Good ~ 10 3825 144 1038 406 87 20 4633.5
Towards
Kurinjipadi 3829 109 1048 412 63 47 4637.5
Kullanchavadi
– Kurinjipadi
Total
7654 253 2086 818 150 67 9271
Alapakkam
(NH 45 – A)
Towards
Alapakkam
Good ~ 7 2788 16 540 19 74 68 2433
Towards
Kullanchavadi 2416 19 523 21 58 68 2191
CVC Survey Locations

EC Amendment (Use of Blended Coal) for ITPCL Thermal Power Plant at Cuddalore district, TN C1181305 Technical Note on Use of Blended Coal for ITPCL’s TPP RP001 rev. 0
Appendix C Traffic Study Page 7
Road Name Road Stretch Conditions
Current
Lane width
(m)
Per day
2W 3W 4W 6W 10W 12W PCUS
Kullanchavadi
– Alapakkam
Total
5204 35 1063 40 132 136 4624
Villiyanalur Towards
Villiyanallur
Good ~ 8 3607 188 3338 654 109 83 7867.5
Towards
Alapakkam 3268 174 2985 441 102 102 6728
Villiyanallur –
Alapakkam -
Total
6875 362 6323 1095 211 185 14595.5
Summary of Traffic study of Option 1 Route is given in below Table C-3
Table C-3: Summary of Traffic Study Findings for Option 1 Route
Road Name Road Stretch Total PCUs
and PCUs/Hr (V)
Vehicles Composition IRC Standards Capacity (C)
PCUs/hr
V/C (Level of Service)
NH-532/ Vadalur Junction
Towards Vadalur
6972.5/ 290.52
2W - 60%; 4W - 26%, 6W/10W/12W - 12%.
2400 for 4 lane undivided
0.12
Towards Neyveli
7478.5/ 311.6 2W - 58%; 4W - 26%, 6W/10W/12W - 13%.
0.13
Vadalur – Neyveli Total
14451 / 602.12
- 0.25 (B – very Good)
Kurinjipadi
Towards Kurinjipadi
4027 / 167.79 2W - 78%; 4W – 16%, 6W/10W/12W - 5%.
1500 for 2 lane two way
0.11
Towards Vadalur
4636 / 193.17 2W - 79%; 4W – 14%, 6W/10W/12W - 6%.
0.13
Kurinjipadi – Vadalur Total
8663 / 360.96 0.24 (B – very Good)
Kullanchavadi
Towards Kullanchavadi
4633.5/ 193 2W - 69%; 4W – 19%, 6W/10W/12W - 9%.
1500 for 2 lane two way
0.128
Towards Kurinjipadi
4637.5/ 193.23
2W - 70%; 4W – 19%, 6W/10W/12W - 9%.
0.128
Kullanchavadi – Kurinjipadi Total
9271/ 386.3 0.257 (B – very Good)
Alapakkam (NH 45 – A)
Towards Alapakkam
2433 / 101.37 2W - 80%; 4W – 15%, 6W/10W/12W - 5%.
1500 for 2 lane two way
0.067
Towards Kullanchavadi
2191 / 91.3 2W - 78%; 4W – 17%, 6W/10W/12W - 5%.
0.060
Kullanchavadi – Alapakkam Total
4624 / 192.67 0.127 (A – Excellent)
Villiyanalur Towards Villiyanallur
7867.5/ 327.81
2W - 45%; 4W – 42%, 6W/10W/12W - 11%.
1500 for 2 lane two way
0.218
Towards Alapakkam
6728/ 280.33 2W - 46%; 4W – 42%, 6W/10W/12W - 8%.
0.186
Villiyanallur – Alapakkam Total
14595.5/ 608.14
0.405 (C –Good)
The level of Service is ranked from A to F, Where, A is freeway condition and F is Failure condition.

EC Amendment (Use of Blended Coal) for ITPCL Thermal Power Plant at Cuddalore district, TN C1181305 Technical Note on Use of Blended Coal for ITPCL’s TPP RP001 rev. 0
Appendix C Traffic Study Page 8
C.1.5 Findings of Traffic Study for Option 2 Route
Traffic studies were conducted for the selected option 2 route at major junctions to understand the present Average Daily Traffic Volumes, vehicles composition, road conditions, level of Services etc.,.Traffic Volumes are measured at major junction in the option 2 route namely Vadalur, Maruvai, Pinnalur, Seithiyathope, Bhuvanagiri and Villiyanalur. Classified Volume Count Survey was carried out May 2018 manually and counts were recorded. Each vehicle type is converted into equivalent Passenger Car Unit (PCU) based on the IRC recommended factors.
The survey locations are shown in the below Figure C-5.
Figure C-5: CVC survey Locations on Option 2 Route
Based on the surveys, the Average Daily Traffic (ADT) along the Option 2 Route is arrived. The seasonal correction factor of 1.0 is considered to convert Average Daily Traffic (ADT) to Annual Average Daily Traffic (AADT) and the same is presented in Table C-4. Table C-4: Annual Average Daily Traffic (ADT) for Option 2 Route
Road Name Road
Stretch Conditions
Current Lane width
(m)
Per day
2W 3W 4W 6W 10W 12W PCUS
Vadalur
Towards Maruvai
Good ~ 14 3331 16 2658 988 92 81 7822.5
Towards Vadalur
2737 12 1765 854 96 59 6172.5
Maruvai – Vadalur Total
6068 28 4423 1842 188 140 13995
Maruvai Towards Pinnalur
Good ~ 6 2799 1 2492 628 72 68 6196.5
CVC Survey Locations
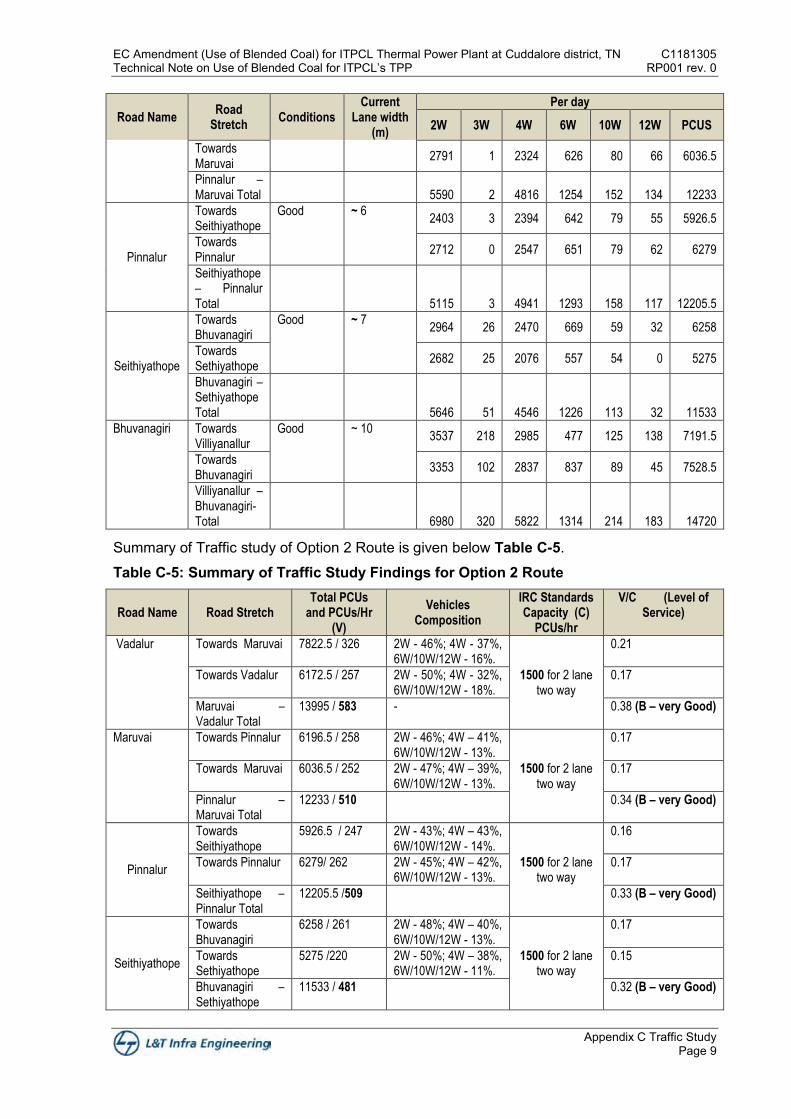
EC Amendment (Use of Blended Coal) for ITPCL Thermal Power Plant at Cuddalore district, TN C1181305 Technical Note on Use of Blended Coal for ITPCL’s TPP RP001 rev. 0
Appendix C Traffic Study Page 9
Road Name Road
Stretch Conditions
Current Lane width
(m)
Per day
2W 3W 4W 6W 10W 12W PCUS
Towards Maruvai
2791 1 2324 626 80 66 6036.5
Pinnalur – Maruvai Total
5590 2 4816 1254 152 134 12233
Pinnalur
Towards Seithiyathope
Good ~ 6 2403 3 2394 642 79 55 5926.5
Towards Pinnalur
2712 0 2547 651 79 62 6279
Seithiyathope – Pinnalur Total
5115 3 4941 1293 158 117 12205.5
Seithiyathope
Towards Bhuvanagiri
Good ~ 7 2964 26 2470 669 59 32 6258
Towards Sethiyathope
2682 25 2076 557 54 0 5275
Bhuvanagiri – Sethiyathope Total
5646 51 4546 1226 113 32 11533
Bhuvanagiri Towards Villiyanallur
Good ~ 10 3537 218 2985 477 125 138 7191.5
Towards Bhuvanagiri
3353 102 2837 837 89 45 7528.5
Villiyanallur – Bhuvanagiri- Total
6980 320 5822 1314 214 183 14720
Summary of Traffic study of Option 2 Route is given below Table C-5.
Table C-5: Summary of Traffic Study Findings for Option 2 Route
Road Name Road Stretch Total PCUs
and PCUs/Hr (V)
Vehicles Composition
IRC Standards Capacity (C)
PCUs/hr
V/C (Level of Service)
Vadalur
Towards Maruvai 7822.5 / 326 2W - 46%; 4W - 37%, 6W/10W/12W - 16%.
1500 for 2 lane two way
0.21
Towards Vadalur 6172.5 / 257 2W - 50%; 4W - 32%, 6W/10W/12W - 18%.
0.17
Maruvai – Vadalur Total
13995 / 583 - 0.38 (B – very Good)
Maruvai Towards Pinnalur 6196.5 / 258 2W - 46%; 4W – 41%, 6W/10W/12W - 13%.
1500 for 2 lane two way
0.17
Towards Maruvai 6036.5 / 252 2W - 47%; 4W – 39%, 6W/10W/12W - 13%.
0.17
Pinnalur – Maruvai Total
12233 / 510 0.34 (B – very Good)
Pinnalur
Towards Seithiyathope
5926.5 / 247 2W - 43%; 4W – 43%, 6W/10W/12W - 14%.
1500 for 2 lane two way
0.16
Towards Pinnalur 6279/ 262 2W - 45%; 4W – 42%, 6W/10W/12W - 13%.
0.17
Seithiyathope – Pinnalur Total
12205.5 /509 0.33 (B – very Good)
Seithiyathope
Towards Bhuvanagiri
6258 / 261 2W - 48%; 4W – 40%, 6W/10W/12W - 13%.
1500 for 2 lane two way
0.17
Towards Sethiyathope
5275 /220 2W - 50%; 4W – 38%, 6W/10W/12W - 11%.
0.15
Bhuvanagiri – Sethiyathope
11533 / 481 0.32 (B – very Good)

EC Amendment (Use of Blended Coal) for ITPCL Thermal Power Plant at Cuddalore district, TN C1181305 Technical Note on Use of Blended Coal for ITPCL’s TPP RP001 rev. 0
Appendix C Traffic Study Page 10
Road Name Road Stretch Total PCUs
and PCUs/Hr (V)
Vehicles Composition
IRC Standards Capacity (C)
PCUs/hr
V/C (Level of Service)
Total
Bhuvanagiri Towards Villiyanallur
7191.5 / 299.6 2W - 47%; 4W – 40%, 6W/10W/12W - 10%.
1500 for 2 lane two way
0.20
Towards Bhuvanagiri
7528.5 / 314 2W - 46%; 4W – 39%, 6W/10W/12W - 14%.
0.20
Villiyanallur – Bhuvanagiri- Total
14720.5 / 613.6 0.40 (C –Good)
The level of Service is ranked from A to F, Where, A is freeway condition and F is Failure condition.
C.1.6 Generated Traffic Due to proposed use of Indigenous Coal at ITPCL TPP
It is estimated at about 1.5 MMTPA of Indigenous coal for 1200 MW will need to be transported considering the Maximum blend ratio of 25 (Indigenous):75 (Imported). The number of trucks requirement to transport this quantity will be around 7 trucks per hour.
C.1.7 Traffic Forecast and Carrying Capacity of Selected Options Route
As the no rail siding at NLC India Limited mines to connect existing ITPCL rail network, the interim arrangement (for the maximum period of 7 years) of using existing road is proposed. Accordingly the traffic projections till 2025 are carried out to check the adequacy of existing road network for the transport of indigenous coal from NLC India Limited mines to ITPCL TPP Site.
The projections traffic projections till 2025 have been worked out by considering 5 % increase per year in Normal Annual Average Daily Traffic Volumes.
C.1.8 Total Traffic and Adequacy of Road Network
The traffic projection for the normal traffic for Options Route 1 taking into considering the guidelines of IRC are estimated and provided in Table C-6.
Table C-6: Traffic Projections for Normal Traffic on Option Route -1
Road Name Road Stretch Per day for 2025
2W 3W 4W 6W 10W 12W PCUS
NH-532/ Vadalur
Junction
Towards Vadalur 6204 281 2654 923 200 135 9811
Towards Neyveli 6184 303 2789 1100 221 125 10523
Vadalur – Neyveli Total 12388 584 5443 2023 421 260 20334
Kurinjipadi Towards Kurinjipadi 6135 111 1230 398 3 18 5666
Towards Vadalur 7173 100 1224 447 0 90 6523
Kurinjipadi – Vadalur Total 13308 211 2454 846 3 108 12190
Kullanchavadi
Towards Kullanchavadi 5382 203 1461 571 122 28 6520
Towards Kurinjipadi 5388 153 1475 580 89 66 6525
Kullanchavadi – Kurinjipadi
Total 10770 356 2935 1151 211 94 13045
Alapakkam (NH
45 – A)
Towards Alapakkam 3923 23 760 27 104 96 3423
Towards Kullanchavadi 3400 27 736 30 82 96 3083
Kullanchavadi – Alapakkam
Total 7323 49 1496 56 186 191 6506
Villiyanalur Towards Villiyanallur 5075 265 4697 920 153 117 11070
Towards Alapakkam 4598 245 4200 621 144 144 9467
Villiyanallur – Alapakkam - 9674 509 8897 1541 297 260 20537

EC Amendment (Use of Blended Coal) for ITPCL Thermal Power Plant at Cuddalore district, TN C1181305 Technical Note on Use of Blended Coal for ITPCL’s TPP RP001 rev. 0
Appendix C Traffic Study Page 11
Road Name Road Stretch Per day for 2025
2W 3W 4W 6W 10W 12W PCUS
Total
The total traffic projections for the normal and generated traffic are provided in Table C-7.
Table C-7: Total Traffic Projections for Normal + Generated Traffic for Option Route 1
Road Name Road Stretch Per day for 2025
2W 3W 4W 6W 10W 12W PCUS
NH-532/
Vadalur
Junction
Vadalur – Neyveli Total 12388 584 5443 2135 533 372 21342
Kurinjipadi Kurinjipadi – Vadalur Total 13308 211 2454 958 115 220 13198
Kullanchavadi Kullanchavadi – Kurinjipadi Total 10770 356 2935 1263 323 206 14053
Alapakkam
(NH 45 – A) Kullanchavadi – Alapakkam Total 7323 49 1496 168 298 303 7514
Villiyanalur Villiyanallur – Alapakkam - Total 9674 509 8897 1653 409 372 21545
The conditions of the roads in Option Route 1 based on the total traffic projections are provided in Table C-8. Table C-8: Summary of Road Condition of Option Route 1 based on Total Traffic Projections
Road Name Road Stretch Total PCUs and
PCUs/Hr (V)
IRC Standards
Capacity (C)
PCUs/hr
V/C
(Level of Service)
NH-532/ Vadalur
Junction
Vadalur – Neyveli
Total
21342 / 889.25
2400 for 4 lane
undivided 0.37 (B – Very Good)
Kurinjipadi Kurinjipadi –
Vadalur Total
13198/ 549.90
1500 for 2 lane two
way 0.37 (B – Very Good)
Kullanchavadi Kullanchavadi –
Kurinjipadi Total
14053 / 585.55
1500 for 2 lane two
way 0.39 (B – Very Good)
Alapakkam (NH
45 – A)
Kullanchavadi –
Alapakkam Total
7514 / 313.10
1500 for 2 lane two
way 0.21 (B – Very Good)
Villiyanalur Villiyanallur –
Alapakkam Total
21545 / 897.72
1500 for 2 lane two
way 0.60 (C – Good)
The traffic projection for the normal traffic for Options Route 2 taking into considering the guidelines of IRC are estimated and provided in Table C-9.
Table C-9: Traffic Projections for Normal Traffic on Option Route -2
Road Name Road Stretch Per day for 2025
2W 3W 4W 6W 10W 12W PCUS
Vadalur
Towards Maruvai 4687 23 3740 1390 129 114 11007
Towards Vadalur 3851 17 2484 1202 135 83 8685
Maruvai – Vadalur Total 8538 39 6224 2592 265 197 19692
Maruvai
Towards Pinnalur 3938 1 3506 884 101 96 8719
Towards Maruvai 3927 1 3270 881 113 93 8494
Pinnalur – Maruvai Total 7866 3 6777 1765 214 189 17213
Pinnalur
Towards Seithiyathope 3381 4 3369 903 111 77 8339
Towards Pinnalur 3816 0 3584 916 111 87 8835
Seithiyathope – Pinnalur
Total 7197 4 6952 1819 222 165 17174
Seithiyathope
Towards Bhuvanagiri 4171 37 3476 941 83 45 8806
Towards Sethiyathope 3774 35 2921 784 76 0 7422
Bhuvanagiri – 7944 72 6397 1725 159 45 16228

EC Amendment (Use of Blended Coal) for ITPCL Thermal Power Plant at Cuddalore district, TN C1181305 Technical Note on Use of Blended Coal for ITPCL’s TPP RP001 rev. 0
Appendix C Traffic Study Page 12
Road Name Road Stretch Per day for 2025
2W 3W 4W 6W 10W 12W PCUS
Sethiyathope Total
Bhuvanagiri
Towards Villiyanallur 4977 307 4200 671 176 194 10119
Towards Bhuvanagiri 4718 144 3992 1178 125 63 10593
Villiyanallur –
Bhuvanagiri- Total 9695 450 8192 1849 301 257 20713
The total traffic projections for the normal and generated traffic are provided in Table C-10.
Table C-10: Total Traffic Projections for Normal + Generated Traffic for Option Route 2
Road Name Road Stretch Per day for 2025
2W 3W 4W 6W 10W 12W PCUS
Vadalur Maruvai – Vadalur Total 8538 39 6224 2704 377 309 20700
Maruvai Pinnalur – Maruvai Total 7866 3 6777 1877 326 301 18221
Pinnalur Seithiyathope – Pinnalur Total 7197 4 6952 1931 334 277 18182
Seithiyathope Bhuvanagiri – Sethiyathope
Total 7944 72 6397 1837 271 157 17236
Bhuvanagiri Villiyanallur – Bhuvanagiri- Total 9695 450 8192 1961 413 369 21721
The conditions of the roads in Option Route 2 based on the traffic projections are provided in Table C-11.
Table C-11: Summary of Road Condition of Option Route 2 based on Total Traffic Projections
Road Name Road Stretch Total PCUs and
PCUs/Hr (V)
IRC Standards Capacity (C)
PCUs/hr
V/C (Level of Service)
Vadalur
Maruvai – Vadalur Total
20700/ 862.52
1500 for 2 lane two way
0.58 (C – Good)
Maruvai Pinnalur – Maruvai Total
18221/ 759.21
1500 for 2 lane two way
0.51 (C – Good)
Pinnalur Seithiyathope – Pinnalur Total
18182/757.60
1500 for 2 lane two way
0.51 (C – Good)
Seithiyathope Bhuvanagiri – Sethiyathope Total
17236/ 718.17
1500 for 2 lane two way
0.48 (C – Good)
Bhuvanagiri Villiyanallur – Bhuvanagiri- Total
17236/ 905.02
1500 for 2 lane two way
0.60 (C – Good)
C.1.9 Advantages and Disadvantages of Alternative Routes Studied
The Multi-Criteria-Matrix of selection process is adopted to find out the best suited route for transporting indigenous coal from NLCIL Neyveli mines to ITPCL Site based on the Traffic studies findings and other factors.
Table C-12: MCM – Alternative Routes S.No Parameters Units Route 1 Route 2
1. Distance from NLCIL Mines to ITPCL Plant Site
Km 44.2 51.2
2. Road Conditions - Good with less Bends/Curves Moderate with more Bends/Curves comparatively
3. Fuel Consumption by Trucks - Less More
4. Emissions from Trucks - Less More
5. Level of Service of Existing Road for present/Normal Traffic
V/C Ratio B,B,B,A,C (Good-Very Good- Excellent)
B,B,B,B,C (Good-Very Good)
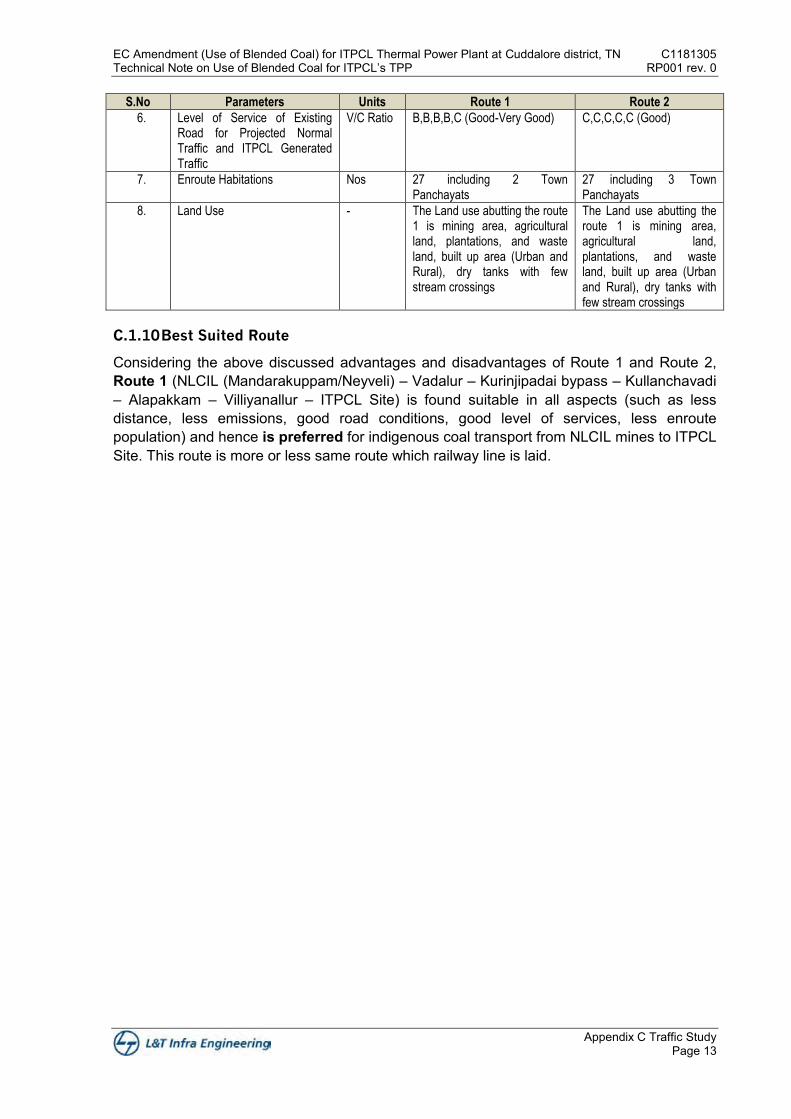
EC Amendment (Use of Blended Coal) for ITPCL Thermal Power Plant at Cuddalore district, TN C1181305 Technical Note on Use of Blended Coal for ITPCL’s TPP RP001 rev. 0
Appendix C Traffic Study Page 13
S.No Parameters Units Route 1 Route 2
6. Level of Service of Existing Road for Projected Normal Traffic and ITPCL Generated Traffic
V/C Ratio B,B,B,B,C (Good-Very Good) C,C,C,C,C (Good)
7. Enroute Habitations Nos 27 including 2 Town Panchayats
27 including 3 Town Panchayats
8. Land Use - The Land use abutting the route 1 is mining area, agricultural land, plantations, and waste land, built up area (Urban and Rural), dry tanks with few stream crossings
The Land use abutting the route 1 is mining area, agricultural land, plantations, and waste land, built up area (Urban and Rural), dry tanks with few stream crossings
C.1.10 Best Suited Route
Considering the above discussed advantages and disadvantages of Route 1 and Route 2, Route 1 (NLCIL (Mandarakuppam/Neyveli) – Vadalur – Kurinjipadai bypass – Kullanchavadi – Alapakkam – Villiyanallur – ITPCL Site) is found suitable in all aspects (such as less distance, less emissions, good road conditions, good level of services, less enroute population) and hence is preferred for indigenous coal transport from NLCIL mines to ITPCL Site. This route is more or less same route which railway line is laid.

Appendix D: Surface Water Quality

EC Amendment (Use of Blended Coal) for ITPCL Thermal Power Plant at Cuddalore district, TN C1181305 Technical Note on Use of Blended Coal for ITPCL’s TPP RP001 rev. 0
Appendix D Surface Water Quality Page 1
Appendix D Surface Water Quality
Sl. No
Test Parameters Unit of
Measurement
SW1 SW2 SW3 SW4 SW5 SW6
IS2296-1982
Standard Class - C
1 pH - 8.11 7.91 7.94 8.35 8.03 8.01 6.5-8.5
2 Colour Hazen 1 2 1 3 2 7 300
3 Taste - Agreea
ble Agreea
ble Agreea
ble Agreea
ble Agreea
ble Agreea
ble --
4 Odour - Agreea
ble Agreea
ble Agreea
ble Agreea
ble Agreea
ble Agreea
ble --
5 Conductivity μs/cm 852 1017 2630 393 993 10180 --
6 Turbidity NTU 2 2 3 1 2 4 --
7 Total Dissolved Solids mg/l 535 615 1590 245 632 6922 1500
8 Total Hardness as CaCO3 mg/l 217.1 200.1 646.3 100.6 223 854.6 --
9 Total Alkalinity mg/l 135 75 315.2 68.5 215 585 --
10 Calcium as Ca+2 mg/l 62.4 44.8 152.2 26.4 48.9 91.8 --
11 Magnesium as mg+2 mg/l 14.8 21.4 64.6 8.4 24.5 151.9 --
12 Residual Chlorine mg/l <0.2 <0.2 <0.2 <0.2 <0.2 <0.2 --
13 Boron as B mg/l 0.57 0.53 0.56 0.47 0.44 1.99
14 Chlorides as Cl- mg/l 129.8 198.7 509.5 56.1 118.5 3071.4 600
15 Sulphate as SO4 mg/l 101.4 142.5 261.8 41.6 84.3 158.5 400
16 Fluoride as F- mg/l 0.6 0.9 1 1.2 0.3 1.6 1.5
17 Nitrates as NO3 mg/l 0.7 1.9 2.2 2.3 30.4 2.3 50
18 Sodium as Na+ mg/l 89.3 141.5 299.7 39.5 125.4 1924.8 --
19 Potassium as K+ mg/l 12.1 0.4 12.3 7.3 0.35 41.2 --
20 Phenolic Compounds mg/l <0.001 <0.001 <0.001 <0.001 <0.001 <0.001 0.005
21 Cyanides mg/l <0.02 <0.02 <0.02 <0.02 <0.02 <0.02 0.05
22 Anionic Detergents mg/l <0.01 <0.01 <0.01 <0.01 <0.01 <0.01 1
23 Mineral Oil mg/l <0.01 <0.01 <0.01 <0.01 <0.01 <0.01 0.1
24 Cadmium as Cd mg/l <0.01 <0.01 <0.01 <0.01 <0.01 <0.01 0.01
25 Total Arsenic as As mg/l <0.01 <0.01 <0.01 <0.01 <0.01 <0.01 0.2
26 Copper as Cu mg/l <0.01 <0.01 <0.01 <0.01 <0.01 <0.01 1.5
27 Lead as Pb mg/l <0.01 <0.01 <0.01 <0.01 <0.01 0.02 0.1
28 Manganese as Mn mg/l <0.01 <0.01 <0.01 <0.01 <0.01 <0.01 --
29 Iron as Fe mg/l 0.084 0.044 0.063 0.14 0.034 0.26 50
30 Total Chromium as Cr mg/l <0.05 <0.05 <0.05 <0.05 <0.05 <0.05 0.05
31 Selenium as Se mg/l <0.01 <0.01 <0.01 <0.01 <0.01 <0.01 0.05
32 Zinc as Zn mg/l <0.01 <0.01 <0.01 <0.01 <0.01 <0.01 15
33 Aluminium as Al mg/l 0.57 0.36 1.2 0.22 0.34 <0.01 --

C1181305 EC Amendment (Use of Blended Coal) for ITPCL Thermal Power Plant at Cuddalore district, TN RP001 rev. 0 Technical Note on Use of Blended Coal for ITPCL’s TPP
Appendix D Surface Water Quality Page 2
Sl. No
Test Parameters Unit of
Measurement
SW1 SW2 SW3 SW4 SW5 SW6
IS2296-1982
Standard Class - C
34 Mercury as Hg mg/l <0.001 <0.001 <0.001 <0.001 <0.001 <0.001 --
35 Pesticides ----- Absent Absent Absent Absent Absent Absent
36 E. Coli MPN/100
ml 291 196 255 333 437 365
37 Total Coliforms MPN/100
ml 390 270 340 460 590 490 5000
38 Fecal Coliforms MPN/100
ml 99 74 85 127 153 125 --
39 Nickel as Ni mg/l <0.01 <0.01 <0.01 <0.01 <0.01 <0.01 --
40 Molybdenum as Mo mg/l <0.01 <0.01 <0.01 <0.01 <0.01 <0.01
41 Salinity ppt 0.23 0.36 0.92 0.1 0.21 5.55
42 Barium as Ba mg/l <0.01 <0.01 <0.01 <0.01 <0.01 <0.01
43 Ammonia (as Total Ammonia- N)
mg/l <0.1 <0.1 <0.1 <0.1 <0.1 <0.1
44 Temperature- ºC ºC 25 25 25 25 25 25 --
45 Total Solids mg/l 748 971 2103 428 840 8213 --
46 Silver as Ag mg/l <0.01 <0.01 <0.01 <0.01 <0.01 <0.01
47 Sulphide as H2S mg/l <0.001 <0.001 <0.001 <0.001 <0.001 <0.001
48 Total Nitrogen mg/l <0.01 <0.01 <0.01 <0.01 <0.01 <0.01 --
49 Total Phosphorous mg/l <0.01 <0.01 <0.01 <0.01 <0.01 <0.01 --
50 Biochemical Oxygen Demand mg/l <3 <3 <3 <3 <3 <3 3
51 Chemical Oxygen Demand mg/l <5 <5 <5 <5 <5 <5 --
52 Dissolved Oxygen mg/l 5.4 5.6 5.1 5.8 5.9 4.8 4
53 Polynuclear aromatic hydrocarbons (as PAH)
mg/l BDL BDL BDL BDL BDL BDL
54 Alpha Emitters µc/l BDL BDL BDL BDL BDL BDL 10(-9)
55 Beta Emitters µc/l BDL BDL BDL BDL BDL BDL 10(-8)
Station Code
Name
SW 1 Water body Near Nattalkuppam
SW 2 Perumal Eri Near Palliodai
SW 3 Stream (Uppanar) Near Gopalapuram (Tidal Influenced)
SW 4 Kanyakvil Odai/ Neyveli River Near Andikuppam
SW 5 Perumal Eri Overflow Channel Near Anaiyampettai
SW 6 Buckingham Canal Near ITPCL Site (Tidal Influenced)

Appendix E: Ground Water Quality

EC Amendment (Use of Blended Coal) for ITPCL Thermal Power Plant at Cuddalore district, TN C1181305 Technical Note on Use of Blended Coal for ITPCL’s TPP RP001 rev. 0
Appendix E Ground Water Quality Page 1
Appendix E Ground Water Quality
Sl. No
Test Parameters Unit GW 1 GW 2 GW 3 GW 4 GW 5 GW 6
IS: 10500 (2012)
Desirable Limits
IS: 10500
(2012) Permissible
Limits
1 pH - 7.12 7.91 7.86 8.27 8.21 8.43 6.5 – 8.5 NO Relaxation.
2 Colour Hazen 1 2 1 2 2 1 5 15
3 Taste - Agreeable
Agreeable
Agreeable
Agreeable
Agreeable
Agreeable
Agreeable Agreeable
4 Odour - Agreeable
Agreeable
Agreeable
Agreeable
Agreeable
Agreeable
Agreeable Agreeable
5 Conductivity μs/cm 556 1097 938 1129 1264 986 -- --
6 Turbidity NTU 2 3 2 3 3 2 1 5
7 Total Dissolved Solids
mg/l 352 695 587 710 795 635 500 2000
8 Total Hardness As CaCO3
mg/l 154.9 262.7 309.9 323.5 322.7 172.5 200 600
9 Total Alkalinity mg/l 83.8 175.3 190 210 225 159 200 600
10 Calcium as Ca+2 mg/l 44.7 64.6 72.1 81.3 75.6 38.2 75 200
11 Magnesium as mg+2
mg/l 10.5 24.6 31.5 29.2 32.5 18.7 30 100
12 Residual Chlorine mg/l <0.2 <0.2 <0.2 <0.2 <0.2 <0.2 0.2 min 1
13 Boron as B mg/l 0.36 0.35 0.42 0.38 0.38 0.32 0.5 1
14 Chlorides as Cl- mg/l 82.1 161.4 133.5 188.3 211.2 136.7 250 1000
15 Sulphate as SO4 mg/l 48.6 130.2 68.6 74.6 94.5 110.9 200 400
16 Fluoride as F- mg/l 0.4 0.5 1.1 0.8 0.9 0.7 1 1.5
17 Nitrates as NO3 mg/l 31.1 11.2 20.5 9.6 11.1 28.3 45 NO Relaxation
18 Sodium as Na+ mg/l 54.8 125.8 71.6 107.5 136.4 144.5 -- --
19 Potassium as K+ mg/l 2.39 10.34 3.45 5.08 11.3 4.6 -- --
20 Phenolic Compounds
mg/l <0.00
1 <0.00
1 <0.00
1 <0.00
1 <0.00
1 <0.00
1 0.001 0.002
21 Cyanides mg/l <0.02 <0.02 <0.02 <0.02 <0.02 <0.02 0.05 NO Relaxation
22 Anionic Detergents
mg/l <0.2 <0.2 <0.2 <0.2 <0.2 <0.2 0.2 1
23 Mineral Oil mg/l <0.01 <0.01 <0.01 <0.01 <0.01 <0.01 0.5 NO Relaxation
24 Cadmium as Cd mg/l <0.00
3 <0.00
3 <0.00
3 <0.00
3 <0.00
3 <0.00
3 0.003 NO Relaxation
25 Total Arsenic as As
mg/l <0.01 <0.01 <0.01 <0.01 <0.01 <0.01 0.01 0.05
26 Copper as Cu mg/l <0.01 <0.01 <0.01 <0.01 <0.01 <0.01 0.05 1.5
27 Lead as Pb mg/l <0.01 <0.01 <0.01 <0.01 <0.01 <0.01 0.01 NO Relaxation

C1181305 EC Amendment (Use of Blended Coal) for ITPCL Thermal Power Plant at Cuddalore district, TN RP001 rev. 0 Technical Note on Use of Blended Coal for ITPCL’s TPP
Appendix E Ground Water Quality Page 2
Sl. No
Test Parameters Unit GW 1 GW 2 GW 3 GW 4 GW 5 GW 6
IS: 10500 (2012)
Desirable Limits
IS: 10500
(2012) Permissible
Limits
28 Manganese as Mn mg/l <0.01 0.29 <0.01 <0.01 1.35 <0.01 0.1 0.3
29 Iron as Fe mg/l 0.056 0.043 0.052 0.07 0.14 0.063 0.3 NO Relaxation
30 Total Chromium as Cr
mg/l <0.05 <0.05 <0.05 <0.05 <0.05 <0.05 0.05 NO Relaxation
31 Selenium as Se mg/l <0.01 <0.01 <0.01 <0.01 <0.01 <0.01 0.01 NO Relaxation
32 Zinc as Zn mg/l <0.01 <0.01 <0.01 <0.01 6.9 0.013 5 15
33 Aluminium as Al mg/l 0.46 0.54 0.86 0.82 0.77 0.18 0.03 0.2
34 Mercury as Hg mg/l <0.00
1 <0.00
1 <0.00
1 <0.00
1 <0.00
1 <0.00
1 0.001 NO Relaxation
35 Pesticides µg/l Abse
nt Absen
t Absen
t Absen
t Absen
t Absen
t
Depend on Type of
Persticide NO Relaxation
36 E. Coli MPN/100ml
Absent
Absent
Absent
Absent
Absent
Absent
Shall Not be Detected in any 100 ml
37 Total Coliforms MPN/100ml
<2 <2 <2 <2 <2 <2 -- --
38 Fecal Coliforms MPN/100ml
Absent
Absent
Absent
Absent
Absent
Absent
-- --
39 Nickel as Ni mg/l <0.01 <0.01 <0.01 <0.01 <0.01 <0.01 0.02 NO Relaxation
40 Molybdenum as Mo
mg/l <0.01 <0.01 <0.01 <0.01 <0.01 <0.01 0.07 NO Relaxation
41 Salinity ppt 0.15 0.29 0.24 0.34 0.38 0.25 -- --
42 Barium as Ba mg/l <0.01 <0.01 <0.01 <0.01 <0.01 <0.01 0.7 NO Relaxation
43 Ammonia (as Total Ammonia- N)
mg/l <0.1 <0.1 <0.1 <0.1 <0.1 <0.1 0.5 NO Relaxation
44 Temperature- ºC 25 25 25 25 25 25 -- --
45 Total Solids mg/l 436 895 712 829 887 746 -- --
46 Silver as Ag mg/l <0.01 <0.01 <0.01 <0.01 <0.01 <0.01 0.1 NO Relaxation
47 Sulphide as H2S mg/l <0.00
1 <0.00
1 <0.00
1 <0.00
1 <0.00
1 <0.00
1 0.05 NO Relaxation
48 Total Nitrogen mg/l <0.01 <0.01 <0.01 <0.01 <0.01 <0.01 -- --
49 Total Phosphorous
mg/l <0.01 <0.01 <0.01 <0.01 <0.01 <0.01 -- --
50 Biochemical Oxygen Demand
mg/l <3 <3 <3 <3 <3 <3 -- --
51 Chemical Oxygen Demand
mg/l <5 <5 <5 <5 <5 <5 -- --
52 Dissolved Oxygen mg/l 5 5 5 5 5 5 -- --
53
Polynuclear aromatic hydrocarbons (as PAH)
mg/l BDL BDL BDL BDL BDL BDL 0.0001 NO Relaxation
54 Alpha Emitters Bq/l BDL BDL BDL BDL BDL BDL 0.1 NO Relaxation
55 Beta Emitters Bq/l BDL BDL BDL BDL BDL BDL 1 NO Relaxation

EC Amendment (Use of Blended Coal) for ITPCL Thermal Power Plant at Cuddalore district, TN C1181305 Technical Note on Use of Blended Coal for ITPCL’s TPP RP001 rev. 0
Appendix E Ground Water Quality Page 3
Station Code
Name
GWR 1 Vadalur
GWR 2 Villiyanallur
GWR 3 Kurinjipadi
GWR 4 Tambipettai
GWR 5 Alapakkam
GWR 6 Kullanchavadi

Appendix F: Soil Quality

EC Amendment (Use of Blended Coal) for ITPCL Thermal Power Plant at Cuddalore district, TN C1181305 Technical Note on Use of Blended Coal for ITPCL’s TPP RP001 rev. 0
Appendix F Soil Quality Page 1
Appendix F Soil Quality
S.No. Parameters Units S1 -
Vadalur S2 -
Villiyanallur
S3 - Kurinjipp
adi
S4 - Tambipetta
i
S5 - Alappakka
m
S6 – Kullanchava
di
1 Texture -
Sandy Clay Loam
Sandy Loam Sandy Clay
Sandy Clay Loam
Sandy Clay Loam
Sandy Clay Loam
2 Particle size Distributions
Sand % 51 46 48 49 52 54
Silt % 11 36 13 19 12 16
Clay % 38 18 39 32 36 30
3 Color - Brownish Brownish Grey Grey Brownish Brownish
4 Soil Type -- SCL SL SC SCL SCL SCL
5 pH (10% Slurry) - 5.35 6.3 6.79 7.52 5.73 6.36
6 Conductivity μs/cm 315 413 251 152 288 101
7 Cation exchange Capacity
meq/100gr
24.6 13.2 11.4 17.2 15 12.6
8 Bulk density gram/cc 1.1 1 1.1 1 1.1 1
9 Porosity % v/v 48 49.6 43.1 48.2 48.8 49
10 Permeability Cm/sec 3.2 3.8 0.15 3.1 3.4 3.7
11 Water holding capacity
% 28 15 25 18 17 22
12 Sodium Absorption Ratio
SAR 0.69 0.75 0.46 0.18 0.27 0.44
13 Infiltration capacity cm/hour 3.58 4.72 0.19 3.45 3.63 3.89
14 Nitrogen as N Kg/hac 29 13.1 40.5 31.5 37.7 28.6
15 Phosphorus as P Kg/hac 72.2 54.7 93.9 43.9 62 41.6
16 Potassium as K Kg/hac 485.3 321 515.5 278.8 438.2 338.9
17 Zinc as Zn mg/kg 83.9 21.5 21.3 28.2 60.3 29.6
Alkali Metals
18 Sodium as Na mg/kg 804 325 244 162 283 262
19 Potassium as K mg/kg 552 280 347 234 537 371
20 Calcium as Ca mg/kg 4995 1632 1613 1588 2018 1802
21 Magnesium as Mg mg/kg 764 471 384 375 615 363
22 Chromium as Cr mg/kg 70.7 38.2 50.7 117 56.7 76.9
23 Copper as Cu mg/kg 41 9.1 27.7 19.1 13 13.7
24 Iron as Fe % 1.73 0.43 1.55 2.50 1.67 1.30
25 Manganese as Mn mg/kg 257 56.6 242 41.9 85.3 174.6
26 Lead as Pb mg/kg 29.9 8.6 8.5 11.12 5.52 10.79
27 Nickel as Ni mg/kg 31.7 20.7 35.1 19.2 19.1 21.38
28 Barium as Ba mg/kg 82.7 24 52.9 39.5 37.6 43.5
29 Bismuth as BI mg/kg 14.1 <0.1 7.8 <0.1 <0.1 <0.1
30 Cadmium as Cd mg/kg 10.1 1.5 0.6 <0.1 <0.1 <0.1
31 Cobalt as Co mg/kg 14.5 3.5 10.7 2.7 3.15 6.4

C1181305 EC Amendment (Use of Blended Coal) for ITPCL Thermal Power Plant at Cuddalore district, TN RP001 rev. 0 Technical Note on Use of Blended Coal for ITPCL’s TPP
Appendix F Soil Quality Page 2
Other parameters like Mercury, Selenium, Silver, Arsenic are found to be <0.1 mg/kg and Chloroform, Nitrobenzene, Trichlorophenol, Vinyl chloride, Pentachlorophenol etc. are Below the Limit of Quantitation.

Appendix G: Air Quality Model Study
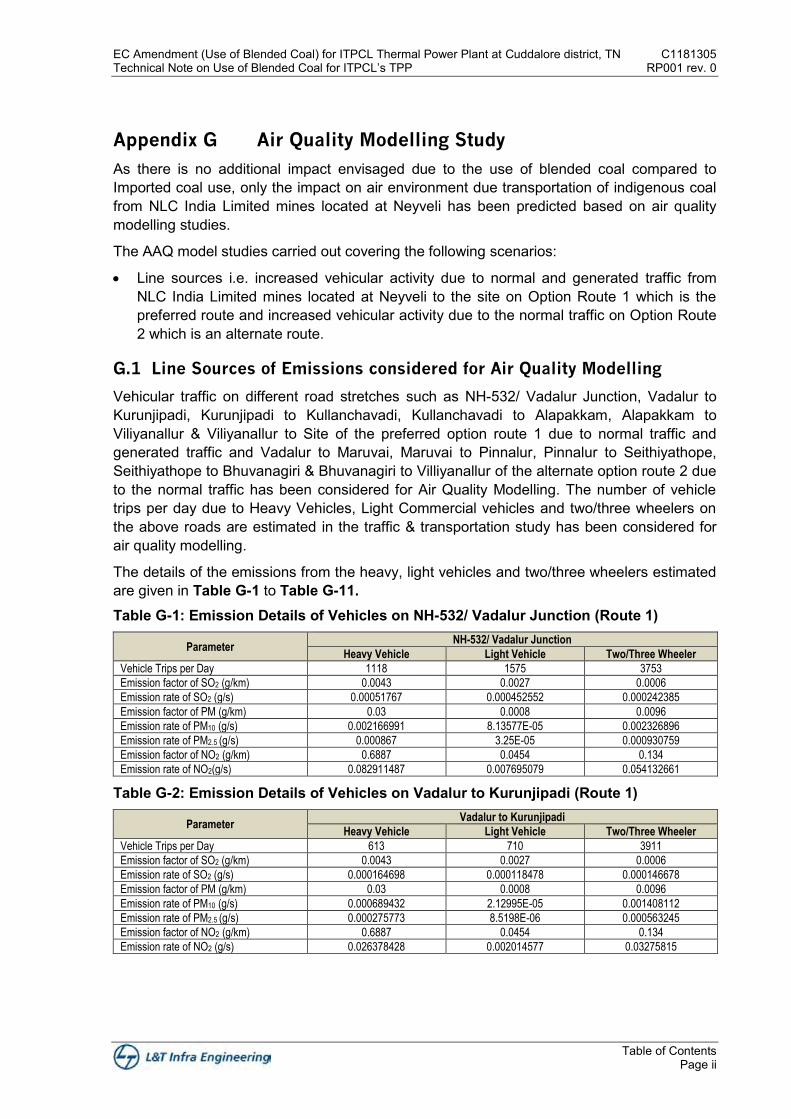
EC Amendment (Use of Blended Coal) for ITPCL Thermal Power Plant at Cuddalore district, TN C1181305 Technical Note on Use of Blended Coal for ITPCL’s TPP RP001 rev. 0
Table of Contents Page ii
Appendix G Air Quality Modelling Study
As there is no additional impact envisaged due to the use of blended coal compared to Imported coal use, only the impact on air environment due transportation of indigenous coal from NLC India Limited mines located at Neyveli has been predicted based on air quality modelling studies.
The AAQ model studies carried out covering the following scenarios:
Line sources i.e. increased vehicular activity due to normal and generated traffic from NLC India Limited mines located at Neyveli to the site on Option Route 1 which is the preferred route and increased vehicular activity due to the normal traffic on Option Route 2 which is an alternate route.
Line Sources of Emissions considered for Air Quality Modelling G.1
Vehicular traffic on different road stretches such as NH-532/ Vadalur Junction, Vadalur to Kurunjipadi, Kurunjipadi to Kullanchavadi, Kullanchavadi to Alapakkam, Alapakkam to Viliyanallur & Viliyanallur to Site of the preferred option route 1 due to normal traffic and generated traffic and Vadalur to Maruvai, Maruvai to Pinnalur, Pinnalur to Seithiyathope, Seithiyathope to Bhuvanagiri & Bhuvanagiri to Villiyanallur of the alternate option route 2 due to the normal traffic has been considered for Air Quality Modelling. The number of vehicle trips per day due to Heavy Vehicles, Light Commercial vehicles and two/three wheelers on the above roads are estimated in the traffic & transportation study has been considered for air quality modelling.
The details of the emissions from the heavy, light vehicles and two/three wheelers estimated are given in Table G-1 to Table G-11. Table G-1: Emission Details of Vehicles on NH-532/ Vadalur Junction (Route 1)
Parameter NH-532/ Vadalur Junction
Heavy Vehicle Light Vehicle Two/Three Wheeler
Vehicle Trips per Day 1118 1575 3753
Emission factor of SO2 (g/km) 0.0043 0.0027 0.0006
Emission rate of SO2 (g/s) 0.00051767 0.000452552 0.000242385
Emission factor of PM (g/km) 0.03 0.0008 0.0096
Emission rate of PM10 (g/s) 0.002166991 8.13577E-05 0.002326896
Emission rate of PM2.5 (g/s) 0.000867 3.25E-05 0.000930759
Emission factor of NO2 (g/km) 0.6887 0.0454 0.134
Emission rate of NO2(g/s) 0.082911487 0.007695079 0.054132661
Table G-2: Emission Details of Vehicles on Vadalur to Kurunjipadi (Route 1)
Parameter Vadalur to Kurunjipadi
Heavy Vehicle Light Vehicle Two/Three Wheeler
Vehicle Trips per Day 613 710 3911
Emission factor of SO2 (g/km) 0.0043 0.0027 0.0006
Emission rate of SO2 (g/s) 0.000164698 0.000118478 0.000146678
Emission factor of PM (g/km) 0.03 0.0008 0.0096
Emission rate of PM10 (g/s) 0.000689432 2.12995E-05 0.001408112
Emission rate of PM2.5 (g/s) 0.000275773 8.5198E-06 0.000563245
Emission factor of NO2 (g/km) 0.6887 0.0454 0.134
Emission rate of NO2 (g/s) 0.026378428 0.002014577 0.03275815

EC Amendment (Use of Blended Coal) for ITPCL Thermal Power Plant at Cuddalore district, TN C1181305 Technical Note on Use of Blended Coal for ITPCL’s TPP RP001 rev. 0
Appendix G Air Quality Modelling Study Page 3
Table G-3: Emission Details of Vehicles on Kurunjipadi to Kullanchavadi (Route 1)
Parameter Kurunjipadi to Kullanchavadi
Heavy Vehicle Light Vehicle Two/Three Wheeler
Vehicle Trips per Day 757 849 3219
Emission factor of SO2 (g/km) 0.0043 0.0027 0.0006
Emission rate of SO2 (g/s) 0.000365614 0.000254557 0.000216832
Emission factor of PM (g/km) 0.03 0.0008 0.0096
Emission rate of PM10 (g/s) 0.001530476 4.57631E-05 0.002081583
Emission rate of PM2.5 (g/s) 0.00061219 1.83052E-05 0.000832633
Emission factor of NO2 (g/km) 0.6887 0.0454 0.134
Emission rate of NO2 (g/s) 0.058557711 0.004328423 0.04842572
Table G-4: Emission Details of Vehicles on Kullanchavadi to Alapakkam (Route 1)
Parameter Kullanchavadi to Alapakkam
Heavy Vehicle Light Vehicle Two/Three Wheeler
Vehicle Trips per Day 461 433 2133
Emission factor of SO2 (g/km) 0.0043 0.0027 0.0006
Emission rate of SO2 (g/s) 0.000144664 8.42506E-05 9.331E-05
Emission factor of PM (g/km) 0.03 0.0008 0.0096
Emission rate of PM10 (g/s) 0.00060557 1.51462E-05 0.000895776
Emission rate of PM2.5 (g/s) 0.000242228 6.05847E-06 0.00035831
Emission factor of NO2 (g/km) 0.6887 0.0454 0.134
Emission rate of NO2 (g/s) 0.023169794 0.001432575 0.020839225
Table G-5: Emission Details of Vehicles on Alapakkam to Viliyanallur (Route 1)
Parameter Alapakkam to Viliyanallur
Heavy Vehicle Light Vehicle Two/Three Wheeler
Vehicle Trips per Day 943 2574 2946
Emission factor of SO2 (g/km) 0.0043 0.0027 0.0006
Emission rate of SO2 (g/s) 0.000497469 0.000843195 0.000216872
Emission factor of PM (g/km) 0.03 0.0008 0.0096
Emission rate of PM10 (g/s) 0.002082429 0.000151586 0.002081971
Emission rate of PM2.5 (g/s) 0.000832972 6.06343E-05 0.000832789
Emission factor of NO2 (g/km) 0.6887 0.0454 0.134
Emission rate of NO2 (g/s) 0.079676048 0.014337476 0.048434748
Table G-6: Emission Details of Vehicles on Viliyanallur to Site (Route 1)
Parameter Viliyanallur to Site
Heavy Vehicle Light Vehicle Two/Three Wheeler
Vehicle Trips per Day 366 129 147
Emission factor of SO2 (g/km) 0.0043 0.0027 0.0006
Emission rate of SO2 (g/s) 5.28747E-05 1.15343E-05 2.96665E-06
Emission factor of PM (g/km) 0.03 0.0008 0.0096
Emission rate of PM10 (g/s) 0.000221336 2.07358E-06 2.84798E-05
Emission rate of PM2.5 (g/s) 8.85344E-05 8.29431E-07 1.13919E-05
Emission factor of NO2 (g/km) 0.6887 0.0454 0.134
Emission rate of NO2 (g/s) 0.008468563 0.000196126 0.000662551
Table G-7: Emission Details of Vehicles on Vadalur to Maruvai (Route 2)
Parameter Vadalur to Maruvai
Heavy Vehicle Light Vehicle Two/Three Wheeler
Vehicle Trips per Day 883 1801 2482
Emission factor of SO2 (g/km) 0.0043 0.0027 0.0006
Emission rate of SO2 (g/s) 0.000105518 0.000133545 4.13614E-05
Emission factor of PM (g/km) 0.03 0.0008 0.0096
Emission rate of PM10 (g/s) 0.000441704 2.40081E-05 0.000397069
Emission rate of PM2.5 (g/s) 0.000177 9.60E-06 0.000158828
Emission factor of NO2 (g/km) 0.6887 0.0454 0.134
Emission rate of NO2 (g/s) 0.016900084 0.002270763 0.00923738

EC Amendment (Use of Blended Coal) for ITPCL Thermal Power Plant at Cuddalore district, TN C1181305 Technical Note on Use of Blended Coal for ITPCL’s TPP RP001 rev. 0
Appendix G Air Quality Modelling Study Page 4
Table G-8: Emission Details of Vehicles on Maruvai to Pinnalur (Route 2)
Parameter Maruvai to Pinnalur
Heavy Vehicle Light Vehicle Two/Three Wheeler
Vehicle Trips per Day 627 1961 2277
Emission factor of SO2 (g/km) 0.0043 0.0027 0.0006
Emission rate of SO2 (g/s) 0.000227772 0.000442291 0.000115406
Emission factor of PM (g/km) 0.03 0.0008 0.0096
Emission rate of PM10 (g/s) 0.000953463 7.9513E-05 0.001107899
Emission rate of PM2.5 (g/s) 0.000381385 3.18052E-05 0.00044316
Emission factor of NO2 (g/km) 0.6887 0.0454 0.134
Emission rate of NO2 (g/s) 0.036480558 0.007520609 0.025774048
Table G-9: Emission Details of Vehicles on Pinnalur to Seithiyathope (Route 2)
Parameter Pinnalur to Seithiyathope
Heavy Vehicle Light Vehicle Two/Three Wheeler
Vehicle Trips per Day 638 2011 2084
Emission factor of SO2 (g/km) 0.0043 0.0027 0.0006
Emission rate of SO2 (g/s) 7.94223E-05 0.000155401 3.61726E-05
Emission factor of PM (g/km) 0.03 0.0008 0.0096
Emission rate of PM10 (g/s) 0.000332465 2.79373E-05 0.000347257
Emission rate of PM2.5 (g/s) 0.000132986 1.11749E-05 0.000138903
Emission factor of NO2 (g/km) 0.6887 0.0454 0.134
Emission rate of NO2 (g/s) 0.012720494 0.0026424 0.00807854
Table G-10: Emission Details of Vehicles on Seithiyathope to Bhuvanagiri (Route 2)
Parameter Seithiyathope to Bhuvanagiri
Heavy Vehicle Light Vehicle Two/Three Wheeler
Vehicle Trips per Day 558 1851 2319
Emission factor of SO2 (g/km) 0.0043 0.0027 0.0006
Emission rate of SO2 (g/s) 0.000263887 0.000543316 0.000153006
Emission factor of PM (g/km) 0.03 0.0008 0.0096
Emission rate of PM10 (g/s) 0.001104642 9.76747E-05 0.001468859
Emission rate of PM2.5 (g/s) 0.000441857 3.90699E-05 0.000587544
Emission factor of NO2 (g/km) 0.6887 0.0454 0.134
Emission rate of NO2(g/s) 0.042264813 0.009238399 0.034171373
Table G-11: Emission Details of Vehicles on Bhuvanagiri to Villiyanallur (Route 2)
Parameter Bhuvanagiri to Villiyanallur
Heavy Vehicle Light Vehicle Two/Three Wheeler
Vehicle Trips per Day 697 2370 2935
Emission factor of SO2 (g/km) 0.0043 0.0027 0.0006
Emission rate of SO2 (g/s) 0.000596259 0.001259795 0.000350593
Emission factor of PM (g/km) 0.03 0.0008 0.0096
Emission rate of PM10 (g/s) 0.002495967 0.00022648 0.003365689
Emission rate of PM2.5 (g/s) 0.000998387 9.0592E-05 0.001346276
Emission factor of NO2 (g/km) 0.6887 0.0454 0.134
Emission rate of NO2 (g/s) 0.095498456 0.021421225 0.078299019
As these emissions are assumed as continuous in nature and this line source is
considered as a string of volume source for Air Quality modelling for prediction of
impacts.
AERMOD Model G.2
AERMOD is a ‘near-field, steady-state’ Gaussian model. It uses boundary-layer similarity theory to define turbulence and dispersion coefficients as a continuum, rather than as a discrete set of stability classes. Variation of turbulence with height allows a better treatment of dispersion from different release heights. AERMOD requires Surface as well as Upper Air data as meteorological input.
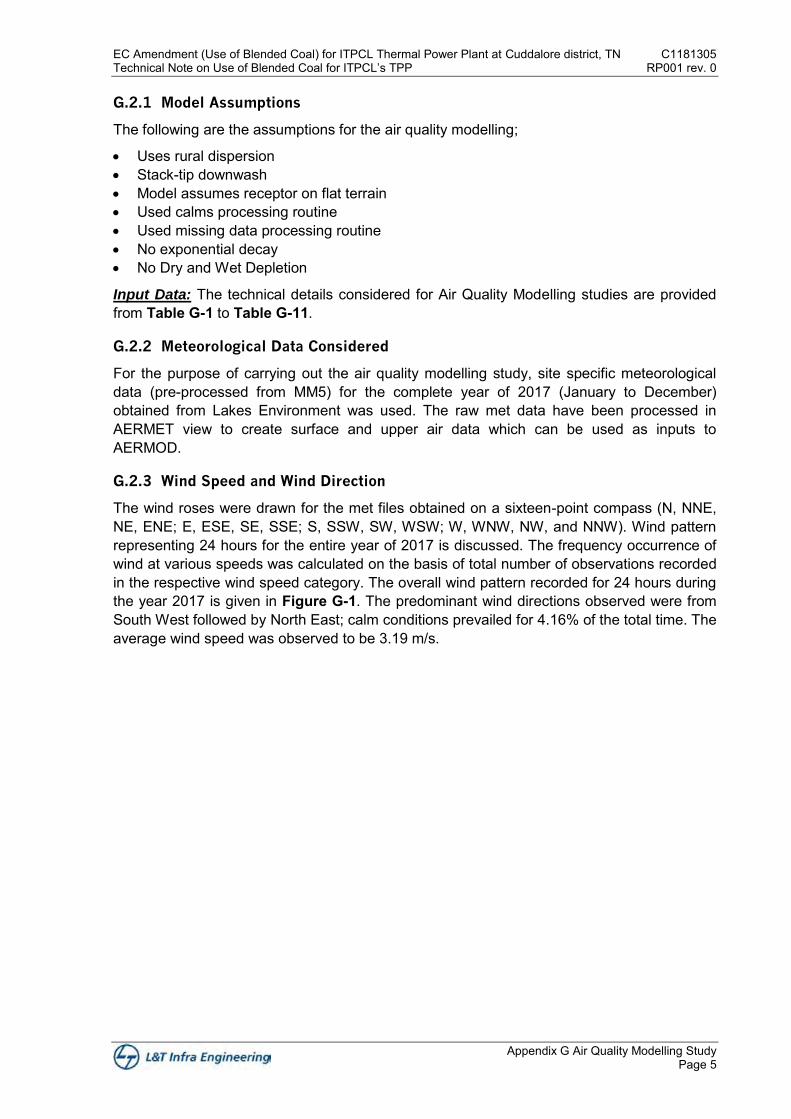
EC Amendment (Use of Blended Coal) for ITPCL Thermal Power Plant at Cuddalore district, TN C1181305 Technical Note on Use of Blended Coal for ITPCL’s TPP RP001 rev. 0
Appendix G Air Quality Modelling Study Page 5
G.2.1 Model Assumptions
The following are the assumptions for the air quality modelling;
Uses rural dispersion Stack-tip downwash Model assumes receptor on flat terrain Used calms processing routine Used missing data processing routine No exponential decay No Dry and Wet Depletion
Input Data: The technical details considered for Air Quality Modelling studies are provided from Table G-1 to Table G-11.
G.2.2 Meteorological Data Considered
For the purpose of carrying out the air quality modelling study, site specific meteorological data (pre-processed from MM5) for the complete year of 2017 (January to December) obtained from Lakes Environment was used. The raw met data have been processed in AERMET view to create surface and upper air data which can be used as inputs to AERMOD.
G.2.3 Wind Speed and Wind Direction
The wind roses were drawn for the met files obtained on a sixteen-point compass (N, NNE, NE, ENE; E, ESE, SE, SSE; S, SSW, SW, WSW; W, WNW, NW, and NNW). Wind pattern representing 24 hours for the entire year of 2017 is discussed. The frequency occurrence of wind at various speeds was calculated on the basis of total number of observations recorded in the respective wind speed category. The overall wind pattern recorded for 24 hours during the year 2017 is given in Figure G-1. The predominant wind directions observed were from South West followed by North East; calm conditions prevailed for 4.16% of the total time. The average wind speed was observed to be 3.19 m/s.

EC Amendment (Use of Blended Coal) for ITPCL Thermal Power Plant at Cuddalore district, TN C1181305 Technical Note on Use of Blended Coal for ITPCL’s TPP RP001 rev. 0
Appendix G Air Quality Modelling Study Page 6
Figure G-1: Annual Wind Rose Diagram (January – December 2017)
G.2.4 Receptor Locations
The details of the receptors which are monitored for the baseline data on preferred coal transportation route & alternative route and monitored as a part of the compliance report are provided in Table G-12.
Table G-12: Receptor Details
Station Code
Name Distance
from Road (km)
Environmental Setting
AAQ Monitoring Locations along Preferred Coal Transportation Route
> 0.1
Industrial, Residential, Rural and Other areas Industrial, Residential, Rural and Other areas
AR 1 Neyveli
AR 2 Vadalur
AR 3 Kurinjipadi
AR 4 Tambipettai
AR 5 Kullanchavadi
AR 6 Alapakkam
AR 7 Villiyanallur
AAQ Monitoring Locations along Alternate Coal Transportation Route
AR 8 Maruvai
AR 9 Pinnalur
AR 10 Odaiyur
AR 11 Seithyathope Near X Road
AR 12 Bhuvanagiri

EC Amendment (Use of Blended Coal) for ITPCL Thermal Power Plant at Cuddalore district, TN C1181305 Technical Note on Use of Blended Coal for ITPCL’s TPP RP001 rev. 0
Appendix G Air Quality Modelling Study Page 7
G.2.5 Model Results
The 1st highest 24 hour average incremental for PM10, PM2.5, SO2 and NO2 for AAQ monitoring locations are given in Table G-13 to Table G-16 .
Table G-13: 1st 24-hour Average Average Incremental Concentration of PM10
Location No.
Receptors
1st 24 Hour Average Incremental Concentration
(µg/m3)
Baseline Concentration
(µg/m3)
Resultant Concentration
(µg/m3)
NAAQ Standards
(µg/m3)
1st 24 Hour 24 Hour
PM10
AR1 Neyveli 0.022 70.6 70.62
100
AR2 Vadalur 0.406 64.8 65.21
AR3 Kurinjipadi 0.145 66.8 66.94
AR4 Tambipettai 0.224 61.0 61.22
AR5 Kullanchavadi 0.217 57.4 57.62
AR6 Alapakkam 0.100 60.4 60.50
AR7 Villiyanallur 0.088 62.4 62.49
AR8 Maruvai 0.113 58.6 58.71
AR9 Pinnalur 0.159 55.7 55.86
AR10 Odaiyur 0.113 56.4 56.51
AR11 Seithyathope Near X Road
0.076 55.2 55.28
AR12 Bhuvanagiri 0.246 63.7 63.95
Table G-14: 1st 24-hour Average Average Incremental Concentration of PM2.5
Location No.
Receptors
1st 24 Hour Average Incremental Concentration
(µg/m3)
Baseline Concentration
(µg/m3)
Resultant Concentration
(µg/m3)
NAAQ Standards
(µg/m3)
1st 24 Hour 24 Hour
PM2.5
AR1 Neyveli 0.009 26.2 26.21
60
AR2 Vadalur 0.163 22.5 22.66
AR3 Kurinjipadi 0.058 24.0 24.06
AR4 Tambipettai 0.089 20.8 20.89
AR5 Kullanchavadi 0.087 18.0 18.09
AR6 Alapakkam 0.040 20.8 20.84
AR7 Villiyanallur 0.035 21.3 21.34
AR8 Maruvai 0.045 19.7 19.75
AR9 Pinnalur 0.064 18.0 18.06
AR10 Odaiyur 0.045 19.9 19.95
AR11 Seithyathope Near X Road
0.031 18.3 18.33
AR12 Bhuvanagiri 0.098 21.5 21.60
Table G-15: 1st 24-hour Average Average Incremental Concentration of SO2
Location No.
Receptors
1st 24 Hour Average Incremental Concentration
(µg/m3)
Baseline Concentration
(µg/m3)
Resultant Concentration
(µg/m3)
NAAQ Standards
(µg/m3)
1st 24 Hour 24 Hour
SO2
AR1 Neyveli 0.006 15.5 15.51
80
AR2 Vadalur 0.082 11.2 11.28
AR3 Kurinjipadi 0.029 12.6 12.63
AR4 Tambipettai 0.047 10.5 10.55
AR5 Kullanchavadi 0.041 9.2 9.24
AR6 Alapakkam 0.031 10.1 10.13
AR7 Villiyanallur 0.030 11.6 11.63

EC Amendment (Use of Blended Coal) for ITPCL Thermal Power Plant at Cuddalore district, TN C1181305 Technical Note on Use of Blended Coal for ITPCL’s TPP RP001 rev. 0
Appendix G Air Quality Modelling Study Page 8
Location No.
Receptors
1st 24 Hour Average Incremental Concentration
(µg/m3)
Baseline Concentration
(µg/m3)
Resultant Concentration
(µg/m3)
NAAQ Standards
(µg/m3)
1st 24 Hour 24 Hour
SO2
AR8 Maruvai 0.035 9.9 9.93
AR9 Pinnalur 0.051 8.8 8.85
AR10 Odaiyur 0.038 8.5 8.54
AR11 Seithyathope Near X Road
0.026 8.0 8.03
AR12 Bhuvanagiri 0.083 10.8 10.88
Table G-16: 1st 24-hour Average Average Incremental Concentration of NO2
Location No.
Receptors
1st 24 Hour Average Incremental Concentration
(µg/m3)
Baseline Concentration
(µg/m3)
Resultant Concentration
(µg/m3)
NAAQ Standards
(µg/m3)
1st 24 Hour 24 Hour
NO2
AR1 Neyveli 0.682 17.0 17.68
80
AR2 Vadalur 10.951 13.0 23.95
AR3 Kurinjipadi 4.035 14.1 18.14
AR4 Tambipettai 6.306 14.1 20.41
AR5 Kullanchavadi 5.932 11.3 17.23
AR6 Alapakkam 2.957 13.7 16.66
AR7 Villiyanallur 2.716 15.2 17.92
AR8 Maruvai 3.358 12.8 16.16
AR9 Pinnalur 4.653 10.9 15.55
AR10 Odaiyur 3.391 10.2 13.59
AR11 Seithyathope Near X Road
2.334 10.4 12.73
AR12 Bhuvanagiri 7.309 12.9 20.21
G.2.6 Isopleths
The Isopleths for 1st incremental 24-hour Average Concentration of all the parameters are given in Figure G-2 to Figure G-5.

EC Amendment (Use of Blended Coal) for ITPCL Thermal Power Plant at Cuddalore district, TN C1181305 Technical Note on Use of Blended Coal for ITPCL’s TPP RP001 rev. 0
Appendix G Air Quality Modelling Study Page 9
Figure G-2: Isopleth for 1st 24-Hr Average Incremental Concentration of PM10
Figure G-3: Isopleth for 1st 24-Hr Average Incremental Concentration of PM2.5
Allapakkam
Bhuvanagiri
Udaiyur
Seithiyathope
Pinnalur
VilliyanallurMaruvai
VadalurKurinjipadi
Neyveli
Thambipettai
Kullanchavadi
Allapakkam
Bhuvanagiri
Udaiyur
Seithiyathope
Pinnalur
VilliyanallurMaruvai
VadalurKurinjipadi
Neyveli
Thambipettai
Kullanchavadi

EC Amendment (Use of Blended Coal) for ITPCL Thermal Power Plant at Cuddalore district, TN C1181305 Technical Note on Use of Blended Coal for ITPCL’s TPP RP001 rev. 0
Appendix G Air Quality Modelling Study Page 10
Figure G-4: Isopleth for 1st 24-Hr Average Incremental Concentration of SO2
Figure G-5: Isopleth for 1st 24-Hr Average Incremental Concentration of NO2
Allapakkam
Bhuvanagiri
Udaiyur
Seithiyathope
Pinnalur
VilliyanallurMaruvai
Vadalur Kurinjipadi
Neyveli
Thambipettai
Kullanchavadi
Allapakkam
Bhuvanagiri
Udaiyur
Seithiyathope
Pinnalur
VilliyanallurMaruvai
Vadalur Kurinjipadi
Neyveli
Thambipettai
Kullanchavadi
EC Amendment (Use of Blended Coal) for ITPCL Thermal Power Plant at Cuddalore district, TN C1181305 Technical Note on Use of Blended Coal for ITPCL’s TPP RP001 rev. 0
Appendix G Air Quality Modelling Study Page 11
G.2.7 Observations at Receptors
It is pertinent to mention that the existing ambient air quality status presented in the baseline chapter is inclusive of emissions from existing 1200 MW Imported coal based units as well as present traffic emissions in the Route 1 and 2.
The predicted 1st highest 24 hour average average incremental concentrations of PM10, PM2.5, SO2 and NO2 for AAQ monitoring receptors locations as well as resultant concentrations are found to be well within the National Ambient Air Quality Standards (NAAQS), 2009 due to the transportation of indigenous coal.

Appendix H: CSR Activities
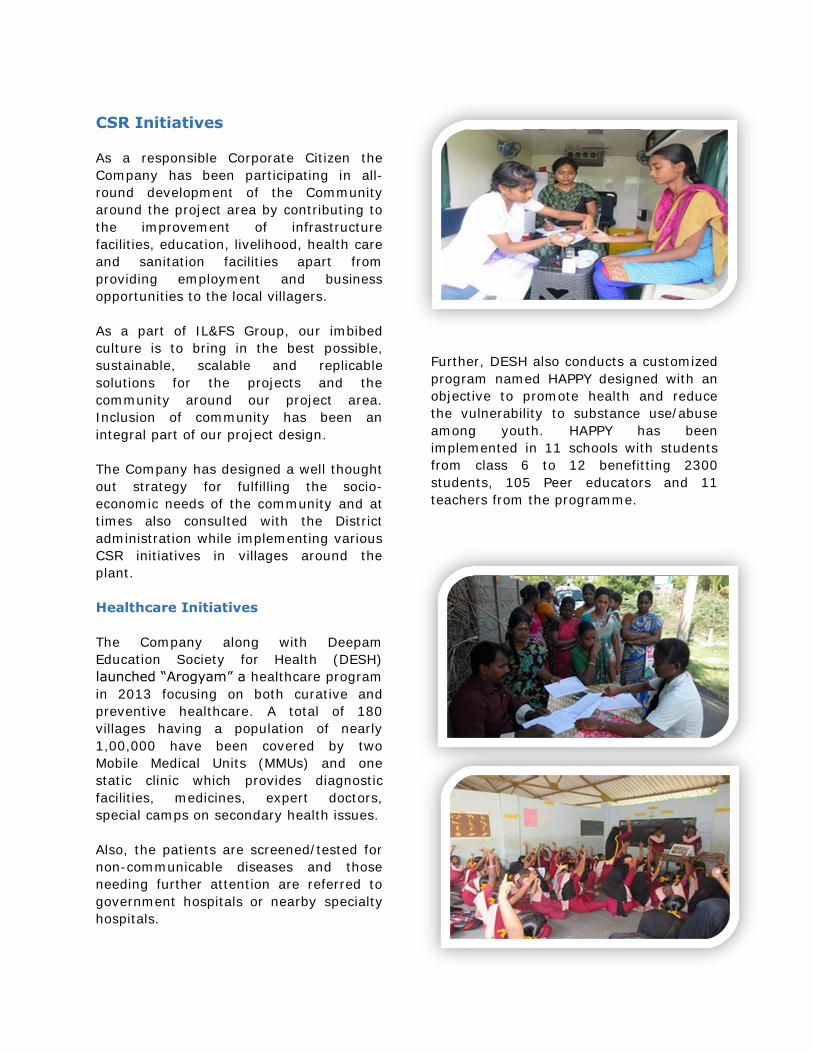
CSR Initiatives
As a responsible Corporate Citizen the
Company has been participating in all-
round development of the Community
around the project area by contributing to
the improvement of infrastructure
facilities, education, livelihood, health care
and sanitation facilities apart from
providing employment and business
opportunities to the local villagers.
As a part of IL&FS Group, our imbibed
culture is to bring in the best possible,
sustainable, scalable and replicable
solutions for the projects and the
community around our project area.
Inclusion of community has been an
integral part of our project design.
The Company has designed a well thought
out strategy for fulfilling the socio-
economic needs of the community and at
times also consulted with the District
administration while implementing various
CSR initiatives in villages around the
plant.
Healthcare Initiatives
The Company along with Deepam
Education Society for Health (DESH)
launched “Arogyam” a healthcare program
in 2013 focusing on both curative and
preventive healthcare. A total of 180
villages having a population of nearly
1,00,000 have been covered by two
Mobile Medical Units (MMUs) and one
static clinic which provides diagnostic
facilities, medicines, expert doctors,
special camps on secondary health issues.
Also, the patients are screened/tested for
non-communicable diseases and those
needing further attention are referred to
government hospitals or nearby specialty
hospitals.
Further, DESH also conducts a customized
program named HAPPY designed with an
objective to promote health and reduce
the vulnerability to substance use/abuse
among youth. HAPPY has been
implemented in 11 schools with students
from class 6 to 12 benefitting 2300
students, 105 Peer educators and 11
teachers from the programme.

Education
The Company has provided physical
infrastructure and basic amenities to
schools around project area. Apart from
this, the Company has donated computers
and K-Yans projectors for computer based
visual learning in surrounding schools. A
Vocational Education programme by the
name ‘Introduction to Basic Technology’
has been introduced in 3 schools
benefitting 540 children of class 8th, 9th &
10th. The program focus is mainly on
‘Learning while doing’ principle.
Livelihood
The Company has constructed a safe
landing facility for boats of fishermen in
the nearby villages. For this purpose, the
Company has dredged the creek and
constructed a trainer wall and floating
berth besides improvement of
infrastructure of the fishing boat landing
jetty. Further, the Company has been
undertaking regular maintenance of the
facility including dredging of the creek.
An in depth water resource assessment
study was commissioned with the help of
National Agro Foundation covering an area
of 5600 Ha spread across 4 micro
watersheds of Villiyanallur, Kothatai,
Ariyakoshti and Agaram covering about
10,000 families. The study highlighted
that a) the population is majorly
dependent on rain-fed agriculture for
livelihood; b) there is an increased risk of
salinity ingress in the ground water which
is a major source of drinking and irrigation
purpose.
In order to address the same, a long-term
action plan has been launched to improve
the water quality and quantity, catchment
with a ridge to valley approach in line with
the Watershed Development guidelines
and activities have already been
commenced in Villiyanallur watershed. The
Company has also approached NABARD to
garner the fund support for this large
program. The intervention will lead to
improved quality and quantity of water
and improved agriculture productivity
through diverse cropping and increased
crop cycles.

Infrastructure
ITPCL has extensively catered to the infrastructure needs of the local community
and supported for Construction and Refurbishment of Schools, community halls,
library, De-siltation of ponds and drains, Roads and construction of toilets for
2000+ households.

L&T INFRASTRUCTURE ENGINEERING LIMITED
6-3-1192/1/1, 5th Floor, Block No.3,
White House, Kundan Bagh, Begumpet, Hyderabad – 500 016
Ph: 91 -040 – 40354444 ; Fax: 91-040-40354430