power & energy logger model pel 105 - aemc instruments · thank you for purchasing a power...
TRANSCRIPT

Power & Energy LoggerModel PEL 105
www.aemc.com
ENGLISH
User Manual

Copyright © Chauvin Arnoux®, Inc. d.b.a. AEMC® Instruments. All rights reserved.
No part of this documentation may be reproduced in any form or by any means (including electronic storage and retrieval or translation into any other language) without prior agreement and written consent from Chauvin Arnoux®, Inc., as governed by United States and International copyright laws.
Chauvin Arnoux®, Inc. d.b.a. AEMC® Instruments15 Faraday Drive • Dover, NH 03820 USATel: (800) 945-2362 or (603) 749-6434 • Fax: (603) 742-2346
This documentation is provided “as is,” without warranty of any kind, express, implied, or otherwise. Chauvin Arnoux®, Inc. has made every reasonable effort to ensure that this documentation is accurate; but does not warrant the accuracy or completeness of the text, graphics, or other information con-tained in this documentation. Chauvin Arnoux®, Inc. shall not be liable for any damages, special, indirect, incidental, or inconsequential; including (but not limited to) physical, emotional or monetary damages due to lost revenues or lost profits that may result from the use of this documentation, whether or not the user of the documentation has been advised of the possibility of such damages.
Chauvin Arnoux®, Inc, AEMC®, DataView®, AmpFlex®, and MiniFlex® are registered trademarks of AEMC® Instruments.

Thank you for purchasing a Power Energy Logger Model PEL 105.For best results from your instrument and for your safety, read the enclosed operating instructions carefully and comply with the precautions for use. These products must be only used by qualified and trained users.
WARNING, risk of DANGER! The operator must refer to these instructions whenever this danger symbol appears.
Ethernet socket (RJ45).
Useful information or hint to read. Main power supply input.
Equipment is protected by double insulation. Ground/Earth.
USB socket.
SD Card.
The product has been declared recyclable after analysis of its life cycle in accordance with the ISO14040 standard.
The CE marking guarantees conformity with European directives and with regulations covering EMC.
The trash can with a line through it means that in the European Union, the product must undergo selective disposal for the recycling of electric and electronic material, in compliance with Directive WEEE 2002/96/EC.
Definition of Measurement Categories (CAT) CAT II Measurement category II corresponds to measurements taken on circuits directly connected to low-voltage installations.
Example: power supply to domestic electrical appliances and portable tools.
CAT III Measurement category III corresponds to measurements on building installations.Example: distribution panel, circuit-breakers, machines or fixed industrial devices.
CAT IV Measurement category IV corresponds to measurements taken at the source of low-voltage installations.Example: power feeders, counters and protection devices.
PrEcautions for usEThese warnings are provided to ensure the safety of personnel. Please read and comply with these precautions.
This instrument complies with safety standard IEC 61010-2-030, the leads comply with IEC 61010-031 for voltages of 1000Vin measurement category III or 600V in measurement category IV, and the current sensors comply with IEC 61010-2-032.
Carefully read and understand all required precautions when using this instrument. Failure to comply with these safetyinstructions can create a risk of electric shock, fire, and explosion; resulting in destruction of the instrument, injury to the user,and damage to the facility. If the instrument is used other than as specified in this manual, the protection provided by theinstrument may be impaired.
Do not use the instrument in an explosive atmosphere or in the presence of flammable gas or smoke.
Do not use the instrument on electrical networks with a rated voltage or category higher than those listed for the instrument.
Respect the maximum rated voltages and currents between terminals and in relation to ground/earth.
Do not use the instrument if it seems to be damaged, incomplete, or poorly closed.
Before each use, check the condition of the insulation of the leads, the instrument, and all accessories. Any insulation thatappears damaged (even partially) must be taken out of service for repair or disposal.
Use leads and accessories for voltage according to IEC 61010-031 and measurement categories at least equal to those ofthe instrument. An accessory with a lower category reduces the category of the combined instrument/accessory combinationto that of the accessory.
Respect the environmental conditions of use listed in this manual.
Do not modify the instrument or replace components using substitute parts. Repairs and adjustments must be performed byAEMC Instruments.
Use personal protection equipment when conditions require it.
Keep hands and fingers away from unused terminals.

2 Power & Energy Logger Model PEL 105
tabLE of contEnts
Precautions for use ........................................................................................................... iii
1. introDuction ..............................................................................................................61.1 Receiving Your Shipment ........................................................................................................................................6
1.2 Ordering Information ...............................................................................................................................................6
1.2.1 Accessories ..................................................................................................................................................7
1.2.2 Replacement Parts.......................................................................................................................................7
2. fEaturEs .......................................................................................................................82.1 Description ..............................................................................................................................................................8
2.2 Front Panel ..............................................................................................................................................................9
2.3 Input Terminals ......................................................................................................................................................10
2.4 Button Functions ...................................................................................................................................................11
2.5 LCD Screens .........................................................................................................................................................12
2.6 LED Status Indicators ...........................................................................................................................................13
2.7 Installing the SD Card ...........................................................................................................................................14
3. sEt uP & confiGuration ..........................................................................................153.1 Powering the Instrument .......................................................................................................................................15
3.1.1 Phase Voltage Power .................................................................................................................................15
3.2 Charging the Battery .............................................................................................................................................16
3.3 Turning the Instrument ON/OFF ............................................................................................................................16
3.3.1 Turning the Instrument ON .........................................................................................................................16
3.3.2 Turning the Instrument OFF .......................................................................................................................16
3.4 Bluetooth Enabling and Disabling .........................................................................................................................17
3.5 Wi-Fi Enabling and Disabling ................................................................................................................................17
3.6 Configuring the PEL 105 .......................................................................................................................................17
3.6.1 Configuration Mode ...................................................................................................................................18
3.6.2 Selecting the Hookup ................................................................................................................................19
3.6.3 Selecting Nominal Current and Voltage .....................................................................................................20
3.6.4 Setting the Aggregation Period for a Recording ........................................................................................22
3.7 Viewing Instrument Information .............................................................................................................................22
4. oPEration ...................................................................................................................234.1 Hooking Up to the Distribution System .................................................................................................................23
4.1.1 Single-Phase 2-Wire (1P-2W) ....................................................................................................................24
4.1.2 Single-Phase 3-Wire (1P-3W) ....................................................................................................................25
4.1.3 3-Phase 3-Wire ∆ (2 current probes) (3P-3W∆2) .......................................................................................25
4.1.4 3-Phase 3-Wire ∆ (3 current probes) (3P-3W∆3) .......................................................................................25
4.1.5 3-Phase 3-Wire Open ∆ (2 current probes) (3P-3WO2) .............................................................................26
4.1.6 3-Phase 3-Wire Open ∆ (3 current probes) (3P-3WO3) .............................................................................26
4.1.7 3-Phase 3-Wire Y (2 current probes) (3P-3WY2) .......................................................................................26
Power & Energy Logger Model PEL 105 3
4.1.8 3-Phase 3-Wire Y (3 current probes) (3P-3WY3) .......................................................................................27
4.1.9 3-Phase 3-Wire ∆ Balanced (1 current probe) (3P3W∆b) ..........................................................................27
4.1.10 3-Phase 4-Wire Y (3P-4WY) ....................................................................................................................27
4.1.11 3-Phase 4-Wire Y Balanced (3P-4WYb) ..................................................................................................28
4.1.12 3-Phase 4-Wire Y 2½ Element (3P-4WY2) ...............................................................................................28
4.1.13 3-Phase 4-Wire ∆ (3P-4W∆) .....................................................................................................................28
4.1.14 3-Phase 4-Wire Open ∆ (3P-4WO)...........................................................................................................29
4.1.15 DC 2-Wire (dC-2W) ..................................................................................................................................29
4.1.16 DC 3-Wire (dC-3W) ..................................................................................................................................29
4.1.17 DC 4-Wire (dC-4W) ..................................................................................................................................30
4.2 Viewing Data .........................................................................................................................................................30
4.2.1 Measurement Mode ...................................................................................................................................31
4.2.1.1 1-Phase 2-Wire (1P-2W) ....................................................................................................................31
4.2.1.2 1-Phase 3-Wire (1P-3W) ....................................................................................................................32
4.2.1.3 3-Phase 3-Wire Unbalanced ..............................................................................................................33
4.2.1.4 3-Phase 3-Wire ∆ Balanced (3P-3W∆b) .............................................................................................35
4.2.1.5 3-Phase 4-Wire Unbalanced ..............................................................................................................36
4.2.1.6 3-Phase 4-Wire Y Balanced (3P-4WYb) ............................................................................................38
4.2.1.7 DC 2-Wire (dC-2W) ............................................................................................................................39
4.2.1.8 DC 3-Wire (dC-3W) ............................................................................................................................40
4.2.1.9 DC 4-Wire (dC-4W) ............................................................................................................................41
4.2.2 Energy Mode ..............................................................................................................................................42
4.2.2.1 AC Energy Screens ............................................................................................................................42
4.2.2.2 DC Energy Screens ............................................................................................................................45
4.2.3 Harmonics Mode........................................................................................................................................46
4.2.3.1 1-Phase 2-Wire (1P-2W) ....................................................................................................................46
4.2.3.2 1-Phase 3-Wire (1P-3W) ....................................................................................................................46
4.2.3.3 3-Phase 3-Wire Unbalanced ..............................................................................................................47
4.2.3.4 3-Phase 3-Wire ∆ Balanced (3P-3W∆b) .............................................................................................48
4.2.3.5 3-Phase 4-Wire Unbalanced ..............................................................................................................48
4.2.3.6 3-Phase 4-Wire Balanced (3P-4WYb) ................................................................................................49
4.2.4 Maximum Mode .........................................................................................................................................50
4.2.4.1 1-Phase 2-Wire (1P-2W) ....................................................................................................................50
4.2.4.2 1-Phase 3-Wire (1P-3W) ....................................................................................................................51
4.2.4.3 3-Phase 3-Wire ..................................................................................................................................52
4.2.4.4 3-Phase 4-Wire .................................................................................................................................53
5. rEcorDinG Data ........................................................................................................555.1 Recording Session Overview ................................................................................................................................55
5.2 Starting and Stopping a Recording .......................................................................................................................56
6. DataViEW® & PEL controL PanEL .............................................................................576.1 Installing DataView ................................................................................................................................................58
6.2 The PEL Control Panel ..........................................................................................................................................61
6.3 Connecting to the Computer .................................................................................................................................61
6.3.1 USB ............................................................................................................................................................62
6.3.2 Bluetooth ....................................................................................................................................................62
4 Power & Energy Logger Model PEL 105
6.3.3 Wi-Fi Direct Connection .............................................................................................................................63
6.3.4 Point-to-Point Ethernet Cable ....................................................................................................................63
6.3.5 Ethernet Network via LAN or Wi-Fi ............................................................................................................63
6.3.6 Network via IRD Server ..............................................................................................................................64
6.4 Setting Date and Time ...........................................................................................................................................64
7. sPEcifications ..........................................................................................................657.1 Reference Conditions ............................................................................................................................................65
7.2 Electrical Specifications ........................................................................................................................................65
7.2.1 Voltage Inputs ............................................................................................................................................65
7.2.2 Current Inputs ............................................................................................................................................65
7.2.3 Measurement Ranges ................................................................................................................................66
7.2.3.1 Measurement Specifications at 50/60Hz ..........................................................................................66
7.2.3.2 Measurement Specifications at 400Hz .............................................................................................67
7.2.3.3 Measurement Specifications for DC .................................................................................................68
7.2.3.4 Temperature .......................................................................................................................................69
7.2.3.5 Common Mode Rejection ..................................................................................................................69
7.2.4 Current Probe Specifications .....................................................................................................................69
7.2.4.1 Current Probes with 1V Output ..........................................................................................................69
7.2.4.2 AmpFlex®/MiniFlex® ...........................................................................................................................70
7.3 Communication .....................................................................................................................................................70
7.4 Power Consumption ..............................................................................................................................................71
7.5 Physical .................................................................................................................................................................71
7.6 Environmental ........................................................................................................................................................72
7.7 Electrical Safety .....................................................................................................................................................72
7.8 Electromagnetic Compatibility ..............................................................................................................................72
7.9 Memory Card ........................................................................................................................................................72
7.10 Current Probes and Sensors ...............................................................................................................................72
7.10.1 AmpFlex® Model A196-24-BK .................................................................................................................73
7.10.2 MiniFlex® Model MA193 ...........................................................................................................................73
7.10.3 Model J93 ................................................................................................................................................74
7.10.4 Model MR193-BK ....................................................................................................................................74
7.10.5 Model MN93-BK ......................................................................................................................................75
7.10.6 Model SR193-BK .....................................................................................................................................75
7.10.7 Model MN193-BK ....................................................................................................................................76
7.10.8 Model SL261 ............................................................................................................................................76
7.11 Voltage Test Leads ..............................................................................................................................................77
8. MaintEnancE & troubLEsHootinG ........................................................................788.1 Maintenance ..........................................................................................................................................................78
8.1.1 Erasing and Upgrading Memory ................................................................................................................78
8.1.2 Upgrading Firmware ..................................................................................................................................78
8.1.3 Battery Maintenance ..................................................................................................................................80
8.1.4 Cleaning the Instrument .............................................................................................................................80
8.2 Troubleshooting .....................................................................................................................................................80
8.2.1 Instrument Does Not Turn ON....................................................................................................................80

Power & Energy Logger Model PEL 105 5
8.2.2 Instrument Turns ON but Does Not Function ............................................................................................81
8.2.3 Cannot Configure the Instrument ...............................................................................................................81
8.2.4 Recording Sessions Do Not Start ..............................................................................................................81
8.2.5 Recording Sessions End Prematurely ........................................................................................................81
8.2.6 Cannot Connect to a Computer .................................................................................................................81
8.2.7 Cannot Turn OFF the Instrument ...............................................................................................................82
aPPEnDiX a: tHEorY of oPEration .............................................................................83A.1 Sampling ...............................................................................................................................................................83
A.1.1 Locking the Sampling Frequency ..............................................................................................................84
A.1.2 AC/DC ........................................................................................................................................................84
A.1.3 Neutral Current Measurement ...................................................................................................................84
A.1.4 “200ms” Quantities ....................................................................................................................................84
A.1.5 “1s” Quantities (one second) ....................................................................................................................84
A.1.6 Aggregation ...............................................................................................................................................84
A.1.7 Minimum and Maximum ...........................................................................................................................84
A.1.8 Energy Calculations ..................................................................................................................................85
A.2 Phase Sequence ...................................................................................................................................................85
A.2.1 Current Phase Sequence ..........................................................................................................................85
A.2.2 Voltage Phase Sequence ..........................................................................................................................86
A.2.3 Current vs Voltage Phase Sequence ........................................................................................................87
aPPEnDiX b: MEasurEMEnt QuantitiEs .....................................................................88
aPPEnDiX c: PoLE MountinG ........................................................................................96
GLossarY ........................................................................................................................98
repair and calibration ....................................................................................................100
technical and sales assistance ......................................................................................100
Limited Warranty ............................................................................................................101
Warranty repairs ............................................................................................................101
6 Power & Energy Logger Model PEL 105
1. introDuction
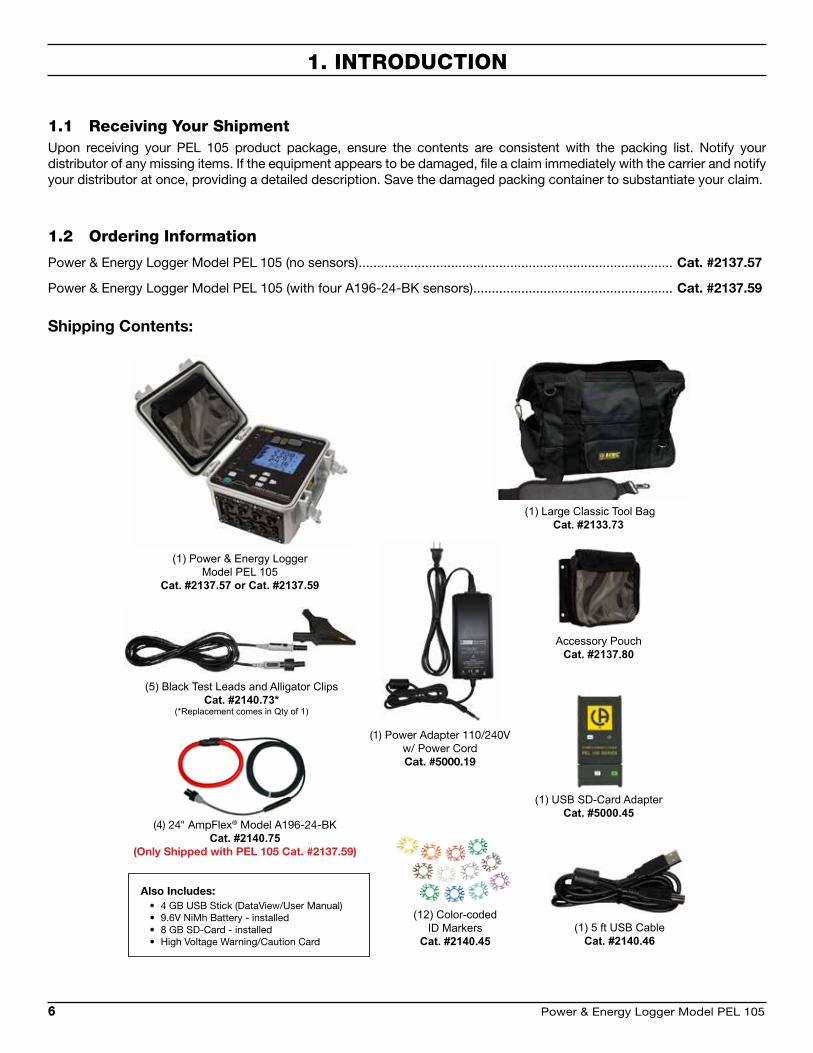
1.1 receiving Your shipmentUpon receiving your PEL 105 product package, ensure the contents are consistent with the packing list. Notify your distributor of any missing items. If the equipment appears to be damaged, file a claim immediately with the carrier and notify your distributor at once, providing a detailed description. Save the damaged packing container to substantiate your claim.
1.2 ordering information
Power & Energy Logger Model PEL 105 (no sensors) ..................................................................................... Cat. #2137.57
Power & Energy Logger Model PEL 105 (with four A196-24-BK sensors) ...................................................... Cat. #2137.59
Shipping Contents:
(1) Power & Energy Logger Model PEL 105
Cat. #2137.57 or Cat. #2137.59
(1) Large Classic Tool BagCat. #2133.73
(5) Black Test Leads and Alligator ClipsCat. #2140.73*
(*Replacement comes in Qty of 1)
(12) Color-coded ID Markers
Cat. #2140.45(1) 5 ft USB Cable
Cat. #2140.46
(4) 24" AmpFlex® Model A196-24-BKCat. #2140.75
(Only Shipped with PEL 105 Cat. #2137.59)
(1) USB SD-Card AdapterCat. #5000.45
Accessory PouchCat. #2137.80
(1) Power Adapter 110/240V w/ Power CordCat. #5000.19
Also Includes:• 4 GB USB Stick (DataView/User Manual)• 9.6V NiMh Battery - installed• 8 GB SD-Card - installed• High Voltage Warning/Caution Card

Power & Energy Logger Model PEL 105 7
1.2.1 accessories
USB cable, A/B 10 ft (3m) ................................................................................................................................Cat. #2136.80
Pole Mounting Kit .............................................................................................................................................Cat. #2137.82
AC/DC Current Probe Model J93 .....................................................................................................................Cat. #2140.49
AC/DC Current Probe Model MR193-BK .........................................................................................................Cat. #2140.28
AC Current Probe Model MN93-BK .................................................................................................................Cat. #2140.32
AC Current Probe Model SR193-BK ................................................................................................................Cat. #2140.33
AmpFlex® Sensor 36” Model 193-36-BK ........................................................................................................Cat. #2140.35
AC Current Probe Model MN193-BK ...............................................................................................................Cat. #2140.36
MiniFlex® Current Sensor 10” Model MA193-10-BK .......................................................................................Cat. #2140.48
AC/DC Current Probe Model SL261* ...............................................................................................................Cat. #1201.51
*BNC Adapter for Current Probe Model SL261..........................................................................................Cat. #2140.40
1.2.2 replacement Parts
Large Classic Tool Bag .....................................................................................................................................Cat. #2133.73
Accessory Pouch .............................................................................................................................................Cat. #2137.80
Set of 12 Color-coded Input ID Markers ..........................................................................................................Cat. #2140.45
USB Cable A/B, 5 ft (1.5m) ...............................................................................................................................Cat. #2140.46
Lead – One 10 ft (3m) Black Lead (Waterproof cap) Rated 1000V CAT IV & One Black Alligator Clip Rated 1000V CAT IV, 15A, UL .................................................................................Cat. #2140.73
AmpFlex® Sensor Model A196-24-BK (Waterproof) .........................................................................................Cat. #2140.75
Adapter – Replacement Power Adapter 110V/230V with US Power Cord ......................................................Cat. #5000.19
USB SD-card Adapter ......................................................................................................................................Cat. #5000.45
DataView® Software and Instrument Firmware UpdatesAvailable at www.aemc.com
PEL Android App Available on the Google Play Store at https://play.google.com/store/apps/details?id=com.aemc.pel&hl=en
MiniFlex® Current Sensor 14” Model MA193-14-BK .......................................................................................Cat. #2140.50

8 Power & Energy Logger Model PEL 105
2. fEaturEs
2.1 Description
The Power & Energy Logger Model PEL 105 provides all the necessary functions and features for recording power/energy data for most 50Hz, 60Hz, 400Hz, and DC distribution systems worldwide. The instrument is designed for full outdoor or indoor use, resistant to both water (IP67) and sunlight (UL746C f1).
The instrument measures phase-to-phase (U12, U23, U31), phase-to-neutral (V1, V2, V3) and neutral-to-ground/earth (VNE) voltage up to 1000V in measurement Category IV, with pollution degree 4 (IEC 61010-1 Ed3). The instrument also measures phase (I1, I2, I3) and neutral (IN) current, using a variety of external current probes/sensors.
A total of 17 types of electrical hookups are supported, including single-phase, split-phase, 3-phase 3-wire, 3-phase 4-wire, open, and DC 2-, 3- and 4-wire.
This measurement data is then used to calculate:
Energy (VAh, Wh (source and load), and varh (4 quadrants)
Power Factor (PF), Cos ϕ, and Tan ϕ
Crest Factor
Total Harmonic Distortion (THD) for voltages and currents
Harmonics from the fundamental signal up to the 50th order for 50/60Hz voltages and currents
Frequency measurements
RMS and DC measurements @ 128 samples/cycle (each phase simultaneously)
The instrument can be connected to a computer running DataView data analysis software via Wi-Fi, Bluetooth©, network, USB, or point-to-point Ethernet cable. The DataView PEL Control Panel on the computer can view real-time data, start and stop a recording session, download previously recorded sessions stored on the instrument for further analysis and report generation, and set configuration variables.
Other features include:
Measurements are sampled every 200ms and 1s, and can be aggregated from 200ms to 1 hour and stored in a removable SD card or SDHC card (up to 32GB). This provides high data resolution and detail, especially for detecting short-term electrical phenomena. For 50 and 60Hz systems, 200ms aggregation is calculated every 10 or 12 cycles, respectively. For 400Hz systems, aggregation is performed every 80 cycles.
Aggregated harmonics represent the minimum and maximum values of aggregated quantities for a given duration. These values can be displayed on the LCD front panel display, or on the computer via the DataView PEL Control Panel
The instrument can be powered from line voltage terminals or an AC/DC power adapter.
Power (VA, W, and var)

Power & Energy Logger Model PEL 105 9
2.2 front Panel
The instrument front panel interface includes LED status indicators, screens that appear on the LCD, and buttons to navigate these screens, select options, and enter data.
MODEL PEL 105
16
15
17
18
4
3
2
1
5
6
7
8
91011
12
13
14
Figure 1
1. USB Port 10. Bluetooth LED
2. Ethernet Port 11. Recording LED
3. Power Input 12. Control Button
4. External Power LED 13. Power Button
5. Battery LED 14. Input Terminals
6. Phase Sequence LED 15. SD Card Slot
7. Overload LED 16. LCD Screen
8. SD Card LED 17. Directional Buttons (Up, Down, Left, Right)
9. Wi-Fi LED 18. Enter button

10 Power & Energy Logger Model PEL 105
2.3 input terminals
The instrument provides four current and five voltage input terminals for connecting to the electrical network under test. These terminals are threaded to provide IP67 water-tight connections.
The instrument ships with five female “banana” voltage terminals that can be screwed onto the threaded voltage terminals.
VN V3 V2 V1 VE/GND
IN I3 I2 I11
2
3
Figure 2
1. Holes for color-coding clips (see below)
2. Current terminals
3. Voltage terminals
The number and configuration of probes and voltage leads depend on the hookup type. To help organize these connections, 12 sets of color-coded rings and inserts are supplied with your instrument. Use these ID markers to identify the leads and terminals.
Detach the appropriate inserts and place them in the holes provided over the terminals (larger inserts for current terminals, smaller inserts for voltage terminals).
Clip the rings of the same color to the ends of the lead you will connect to the terminal.
Figure 3

Power & Energy Logger Model PEL 105 11
2.4 button functions
BUTTON DESCRIPTION
Power
- Turns the instrument ON or OFF when running on battery power. The instrument cannot be turned OFF via the Power button while it is running on external AC or line input power.
- Glows green when the instrument is running on power supplied by the line voltage terminal input (see § 3.3.1).
- When not glowing, indicates the line power feature is enabled but the instrument is running on external AC or battery power.
- Blinks red when the line power is disabled.
Control (Start/Stop)
- Starts or stops a data recording session.
- Enables or disables Bluetooth.
- Enables or disables Wi-Fi.
- When pressed and held down simultaneously with the Power button for 2 seconds, enables/disables the line power feature.
Enter
- In Configuration mode, selects a parameter for editing. This initiates the edit mode (the selected parameter blinks). Pressing this button again saves the modification.
- In Measurement mode, displays additional information for some measurement screens.
- In Energy mode, displays partial energy data.
- In all other modes, this button is inactive.
Left and Right
- Changes modes. Note that this functionality is “circular” – pressing the Right button while in Configuration mode navigates to the top-level Measurement screen; pressing the Left button while in Measurement mode goes to the top-level Configuration screen.
- In edit mode, these buttons select editable parameters.
Up and Down
- When editing parameters in Configuration mode, these buttons cycle through the available options for the selected setting.
- In all other modes, these buttons navigate through the individual screens.
NOTE: In this manual, the symbol indicates when you need to press a button to perform a task.
For example, represents “press the Control button.

12 Power & Energy Logger Model PEL 105
2.5 LcD screens
1
2 4
3
Figure 4
1. Status icons.
2. Bargraphs. These indicate the percentage (0% to 100%) of full range or full load as defined through the DataView PEL Control Panel.
3. Mode icons that control the data and information displayed (see the table below).
4. Units of measure.
The Status & Mode icons on the top and bottom of the display indicate the following information:
ICON DESCRIPTION
Indicates (1) the phase sequence may be incorrect, or (2) there is a missing phase. This icon only appears in Measurement mode.
Indicates measurement data is available for recording. The absence of this icon may indicate an internal issue with the instrument.
Indicates the current power quadrant.
Real-time Measurement Mode: Displays the measurement values for voltage, current, power, fre-quency, power factor, and tangent angle.
Power and Energy Mode: Displays the energy values for reactive energy, apparent energy, and kilowatt hour.
Harmonics Mode: Displays harmonics for current and voltage.
Max Mode: Displays the maximum values for the measurement and energy values.
Information Mode: Displays electrical hookup and other instrument-related information (these screens are read-only).
Configuration Mode: Displays screens containing user-selectable configuration settings and options.
NOTE: As a screen saver feature, when the instrument is ON and there is no activity on the user interface for approximately three minutes, the LCD automatically enters Backlight Standby mode. In this mode, measurements and recordings stay active but the LCD backlight turns OFF. To restore the backlight, press any navigation button.

Power & Energy Logger Model PEL 105 13
2.6 LED status indicators
On the left side of the front panel is a vertical row of LEDs (see Figure 1) which provide the following information:
LED STATUS
External Power (Green)
ON: Instrument is currently running on external AC power.
OFF: Instrument is running on battery or phase power.
Battery (Yellow/Red)
ON: - Steady yellow: Battery is actively charging. - Blinking yellow (once per second): Battery is recovering from a full discharge. - Blinking red (twice per second): Battery is low and there is no external AC power connected.
OFF: Battery is fully charged.
Phase Sequence (Red)
ON: Blinks once per second to indicate one of the following: - The phase difference between current phases is greater than 30° relative to the expected differ-ence (120° for three-phase and 180° for two-phase).
- The phase difference between the voltage phases is greater than 10° relative to the expected difference.
- The phase difference between the current phase and voltage phase for each phase is greater than 60°.
OFF: Phase rotation order is correct.
Overload (Red)
ON: At least one input is overloaded, or current inputs are mismatched.
OFF: No input overload.
SD-Card (Red/Green/Orange)
ON: - Steady red: SD card is locked, unrecognized, or not present. - Blinking red: SD card is initializing. - Blinking orange: SD card is full. - Steady green: SD card is present, recognized, and unlocked. - Blinking green: SD card will be full before the end of the in-progress or pending recording.
Wi-Fi (Green)
ON: - Steady: Wi-Fi is enabled but not currently transmitting - Blinking: Wi-Fi is enabled and transmitting.
OFF: Wi-Fi is disabled.
Bluetooth (Blue)
ON: - Steady: Bluetooth is enabled but not currently transmitting. - Blinking: Bluetooth is enabled and transmitting.
OFF: Bluetooth is disabled.
RECRecording (Green)
ON: - Blinks twice every 5 seconds when recording. - Blinks once every 5 seconds when not recording.
In addition, the Power button (described in § 2.4) glows green when the instrument is running on phase voltage power, and blinks red once per second when phase voltage power is disabled. (See also § 3.1.1.)
14 Power & Energy Logger Model PEL 105
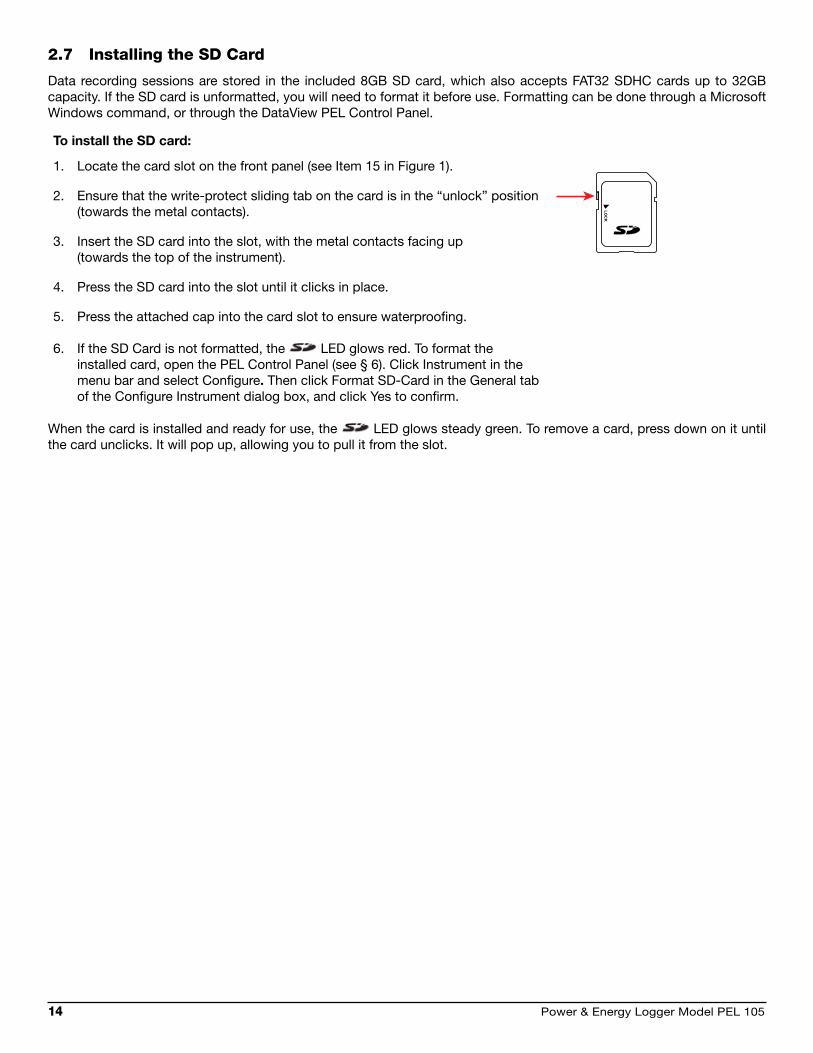
2.7 installing the sD card
Data recording sessions are stored in the included 8GB SD card, which also accepts FAT32 SDHC cards up to 32GB capacity. If the SD card is unformatted, you will need to format it before use. Formatting can be done through a Microsoft Windows command, or through the DataView PEL Control Panel.
To install the SD card:
LOC
K
1. Locate the card slot on the front panel (see Item 15 in Figure 1).
2. Ensure that the write-protect sliding tab on the card is in the “unlock” position (towards the metal contacts).
3. Insert the SD card into the slot, with the metal contacts facing up (towards the top of the instrument).
4. Press the SD card into the slot until it clicks in place.
5. Press the attached cap into the card slot to ensure waterproofing.
6. If the SD Card is not formatted, the LED glows red. To format the installed card, open the PEL Control Panel (see § 6). Click Instrument in the menu bar and select Configure. Then click Format SD-Card in the General tab of the Configure Instrument dialog box, and click Yes to confirm.
When the card is installed and ready for use, the LED glows steady green. To remove a card, press down on it until the card unclicks. It will pop up, allowing you to pull it from the slot.

Power & Energy Logger Model PEL 105 15
3. sEt uP & confiGuration
Before using the instrument for the first time, ensure the battery is fully charged (see § 3.2) and that the instrument is ready for operation. You must also configure the instrument for the hookup type appropriate for the electrical distribution system under test.
NOTE: Before changing any setup or configuration setting, ensure that no recording is active or pending on the instrument.
3.1 Powering the instrument
The instrument can operate on three different sources of power:
External power provided by plugging into an AC outlet with the AC adapter. When you connect the instrument to an AC outlet, it automatically turns ON. The instrument will always run on external AC power when plugged in, even if phase power and/or battery power are also available.
Phase power provided through line voltage at the terminals. If AC wall power is disconnected, the instrument runs on phase voltage power if it is available and enabled.
Battery backup power. If neither external AC power nor phase voltage is available, the instrument runs on battery power.
3.1.1 Phase Voltage Power
Powering the instrument through phase voltage power requires no special preparation or equipment; simply connect two voltage leads to an AC power line, connect the leads to the instrument using any available voltage terminals (see § 3), and unplug the external AC adapter if connected. By default, the instrument will immediately begin drawing phase power from the line.
The Power button glows green when the instrument is running on phase power. In this situation, the instrument cannot be turned OFF via the button.
Note that you cannot power the instrument from a DC network. Also note that if the AC adapter is plugged in, the instru-ment will use this source instead of phase power.
You can disable the phase power feature by pressing and simultaneously for two seconds. When you do this, blinks red once every two seconds, indicating the instrument cannot run on phase power. Pressing and simulta-neously for two seconds re-enables this feature. You can also disable and enable this feature through the DataView PEL Control Panel (see § 6).

16 Power & Energy Logger Model PEL 105
3.2 charging the battery
The PEL 105 is equipped with a NiMH battery, which provides power in the event of a disruption in the phase power or external AC power. Before the first use, start by fully charging the battery.
120V ± 10%, 60Hz230V ± 10%, 50Hz
Figure 5
Connect the supplied power cord to the instrument and AC power. The device will automatically turn ON.
The LED lights; it will go out only when the battery is fully charged.
A low battery charging takes approximately 5 hours.
Fully charging the battery may take up to 5 hours if the battery is at or near complete discharge. If after 5 hours the LED does not turn OFF, operate the instrument on battery power until the battery runs low, and then repeat the charging procedure.
In normal operation, a fully charged battery will provide power for up to one hour before requiring another charging session (although this period may be shorter if the instru-ment is actively using Bluetooth or Wi-Fi to communicate). The LED glows red when the battery is low and in need of charging.
3.3 turning the instrument on/off
3.3.1 turning the instrument on
On AC power or phase voltage power, the instrument automatically turns ON when you connect it.
On battery power, you must press for two seconds to turn ON the instrument.
3.3.2 turning the instrument off
The procedure for turning OFF the instrument depends upon the power source. First check to see whether or not a record-ing is scheduled or in progress (the LED blinks twice every five seconds when a recording is active). If so, either stop the recording, or wait until it is finished. Then do one of the following:
AC power (indicated when the LED is lit): Unplug the AC power adapter, and then press for two seconds. When all LEDs light up simultaneously, release .
Phase voltage power (indicated when glows green): Disconnect the voltage terminal leads from the instrument, then press for two seconds and release it when all LEDs light up simultaneously.
Battery power: Press for two seconds and release it when all LEDs light up simultaneously.
In addition, the instrument includes a feature that automatically turns it OFF after a period of inactivity when running on battery power. This period, which is defined through the PEL Control Panel, can be set to 3, 10, or 15 minutes. It can also be disabled.

Power & Energy Logger Model PEL 105 17
3.4 bluetooth Enabling and Disabling
To communicate via a Bluetooth connection, check the Bluetooth LED on the instrument. If this is OFF, Bluetooth is disabled. To enable Bluetooth:
1. Press and hold down . After a few moments the Recording LED lights up; continue to press the button
until the LED lights up.
2. Release ; when you do the LED lights and remains lit, indicating Bluetooth is now enabled.
3. To disable Bluetooth, press until the LED lights up; then release the button. The LED will turn OFF.
In addition to enabling and disabling Bluetooth, the PEL Control Panel allows you to change the instrument’s Bluetooth name, enable Bluetooth password-protection, and select whether or not the instrument is visible to other Bluetooth devices.
3.5 Wi-fi Enabling and Disabling
The procedure for enabling Wi-Fi is similar to the process for enabling Bluetooth:
1. Check the Wi-Fi LED. If this is OFF, press and hold down until the LED lights up.
2. To disable Wi-Fi, press until the LED lights up; then release the button.
You can also enable and disable Wi-Fi through the PEL Control Panel. In addition, you can change the SSID (Service Set Identifier) name, and define a Wi-Fi password via the PEL Control Panel. (Note that the default Wi-Fi password is printed on a label placed inside the instrument’s cover.)
3.6 configuring the PEL 105
Before you can use the instrument for the first time, you must set a number of configuration variables. Full setup and con-figuration is performed through a computer running the DataView PEL Control Panel (see § 6). This includes setting the instrument’s time and date (§ 6.4).
In addition, a subset of configuration settings can be performed directly on the instrument via its LCD interface, including:
Select the hookup for the electrical distribution system under test
Set voltage and current ratios appropriate for the connected probes or sensors
Set the aggregation period for a recording session
Review instrument settings, such as date and time
Before you can perform any configuration on the instrument, the Control button must be enabled. This button is
enabled and disabled through the PEL Control Panel. When this button is disabled, Configuration mode displays the word LOCK, and no configuration screens are available. (Note that LOCK also appears if the PEL Control Panel is actively configuring the instrument.) If is disabled, enable it as follows:
1. Open the PEL Control Panel.
2. Ensure that the instrument is connected by checking its status in the PEL Network frame. If not, reconnect it by highlighting the instrument, selecting Instrument in the menu bar, and clicking Reconnect Instrument.
3. Select the instrument, and click Instrument in the menu bar.
4. Select Configure. This displays the Configure Instrument dialog box.
5. De-select the checkbox “Lock out the Control button on the instrument front panel.”
6. Click OK to save the change.
Consult the PEL Control Panel Help system for assistance in completing the preceding steps.
18 Power & Energy Logger Model PEL 105
3.6.1 configuration Mode
Configuration mode enables you to change several settings, including:
Hookup type
Primary and secondary nominal voltage
Primary nominal current
Primary nominal neutral current
Aggregation period
To enter Configuration mode, press either or until the Configuration icon is highlighted. Note that there are several situations that prevent you from making changes in Configuration mode:
The instrument is currently being configured by the PEL Control Panel.
Local configuration is locked (disabled) through an option in the PEL Control Panel. This prevents configuration even when the instrument is disconnected from the Control Panel.
A recording session is in progress.
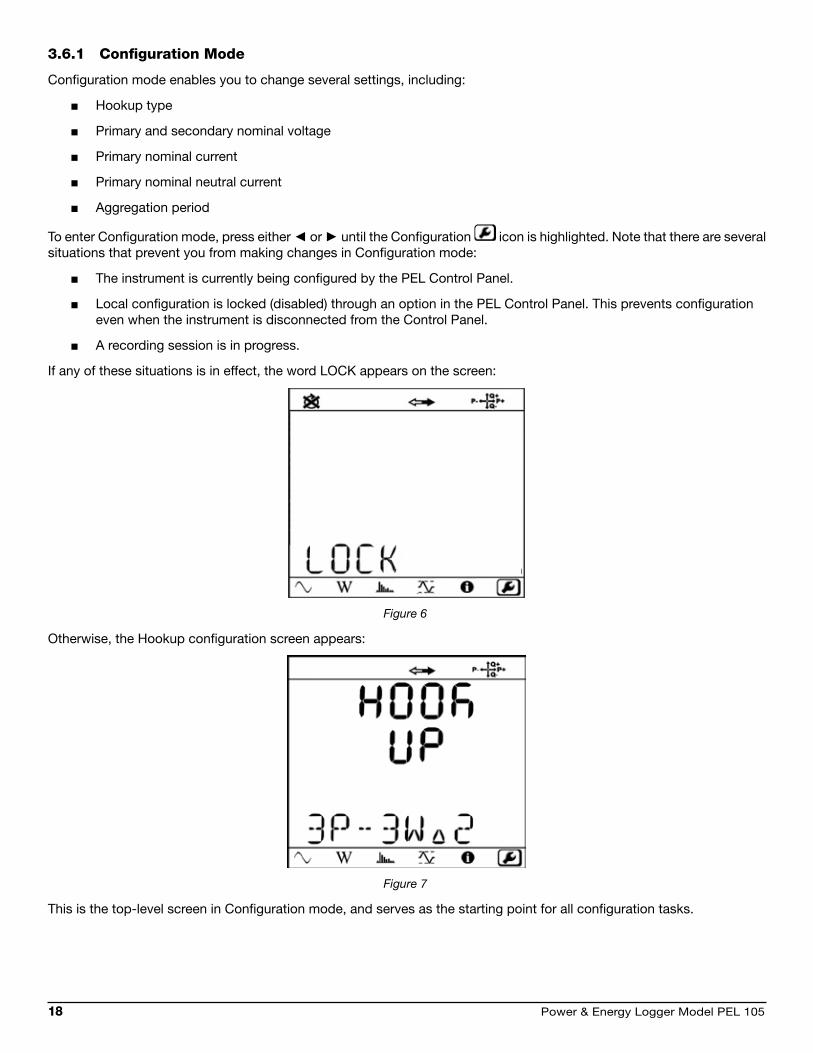
If any of these situations is in effect, the word LOCK appears on the screen:
Figure 6
Otherwise, the Hookup configuration screen appears:
Figure 7
This is the top-level screen in Configuration mode, and serves as the starting point for all configuration tasks.

Power & Energy Logger Model PEL 105 19
3.6.2 selecting the Hookup
The Hookup configuration screen lets you select the type of hookup for the electrical distribution system under measure-ment. This must be the same physical hookup as the probes/sensors (see § 4).
To select the hookup:
1. Press Enter . The displayed hookup type blinks, indicating you are now in edit mode.
2. Press or to navigate through the available hookup types.
For example, in the following table:
displays the preceding (next higher) hookup.
displays the following (next lower) hookup.
Options are:
OPTION HOOKUP TYPE TO CHANGE, PRESS:
dC-4W DC 4-wire
dC-3W DC 3-wire
dC-2W DC 2-wire
3P-4WO 3-phase 4-wire Open ∆
3P-3WO3 3-phase 3-wire Open ∆ (3 current probes)
3P-3WO2 3-phase 3-wire Open ∆ (2 current probes)
3P-3WY3 3-phase 3-wire Y (3 current probes)
3P-3WY2 3-phase 3-wire Y (2 current probes).
3P-4W∆ 3-phase 4-wire ∆
3P-4WY2 3-phase 4-wire Y 2½
3P-4WYb 3-phase 4-wire Y balanced (fixed, voltage measurement)
3P-4WY 3-phase 4-wire Y
3P-3W∆b 3-phase 3-wire ∆ balanced

20 Power & Energy Logger Model PEL 105
3P-3W∆3 3-phase 3-wire ∆ (3 current probes)
3P-3W∆2 3-phase 3-wire ∆ (2 current probes)
1P-3W 1-phase 3-wire (split phase)
1P-2W 1-phase 2-wire
Note that this list is not cyclical; pressing while 1P-2W is displayed (or pressing while dC-4W is displayed) has no effect.
When the desired hookup type appears, press to save it. The hookup type stops blinking, indicating you have exited edit mode.
3.6.3 selecting nominal current and Voltage
Configuration mode lets you set a voltage ratio for the transformer being measured (if necessary). This involves setting a primary nominal voltage and secondary nominal voltage for the transformer. To do this, display the Hookup configuration screen and proceed as follows:
1. Press to display the Primary Nominal Voltage (PT PRIM) configuration screen.
Figure 8
2. Press . The first digit of the primary nominal voltage value blinks. (Note that although this value is displayed on two separate lines, it is a single number.)
3. Press or to navigate through the displayed digits.
4. When the desired digit is selected, press or to change its value. The primary nominal voltage can range from 50 volts to 650000 volts.
5. Press when the displayed voltage is correct.
6. Press to display the Secondary Nominal Voltage (PT SEC) configuration screen. This functions similarly to the Primary Nominal Voltage screen. Allowable secondary nominal voltage values range from 50 to 1000V.

Power & Energy Logger Model PEL 105 21
Figure 9
7. If a probe or sensor is connected, and the type of probe/sensor supports setting a transformer ratio, you can configure the primary nominal current appropriate for the probe. To do this, press at the Secondary Nominal Voltage configuration screen. This displays the Primary Nominal Current (CT PRIM) configuration screen.
Figure 10
The primary nominal current depends on the type of probe/sensor or adapter: - AmpFlex/MiniFlex: 100, 400, 2000, or 10000A - MN93: automatic 200A - MN193 5A range: 5 to 25000A - MN193 100A range: automatic 100A - S93: automatic 3500A - SL261: 10 or 1000A - SR193 and MR193: automatic 1000A - 5A Adapter Box: 5 to 25000A - BNC Adapter: 1 to 25000A
8. Press and use the directional buttons to select the appropriate value.
9. Press to save your changes.
10. If a probe or sensor is connected to the instrument’s neutral input terminal, pressing at the Primary Nominal Current configuration screen displays the Primary Neutral Current screen. This screen functions similarly to the Primary Nominal Current screen. Allowable values are: - AmpFlex/MiniFlex: 100, 400, 2000, or 10000A - BNC Adapter: 1 to 25000A
22 Power & Energy Logger Model PEL 105
3.6.4 setting the aggregation Period for a recording
When recording data (see § 5), the instrument performs measurement aggregation. This involves determining the average value for a measured parameter over a user-specified time interval. This interval is called the aggregation period, and can be set in Configuration mode. To do this:
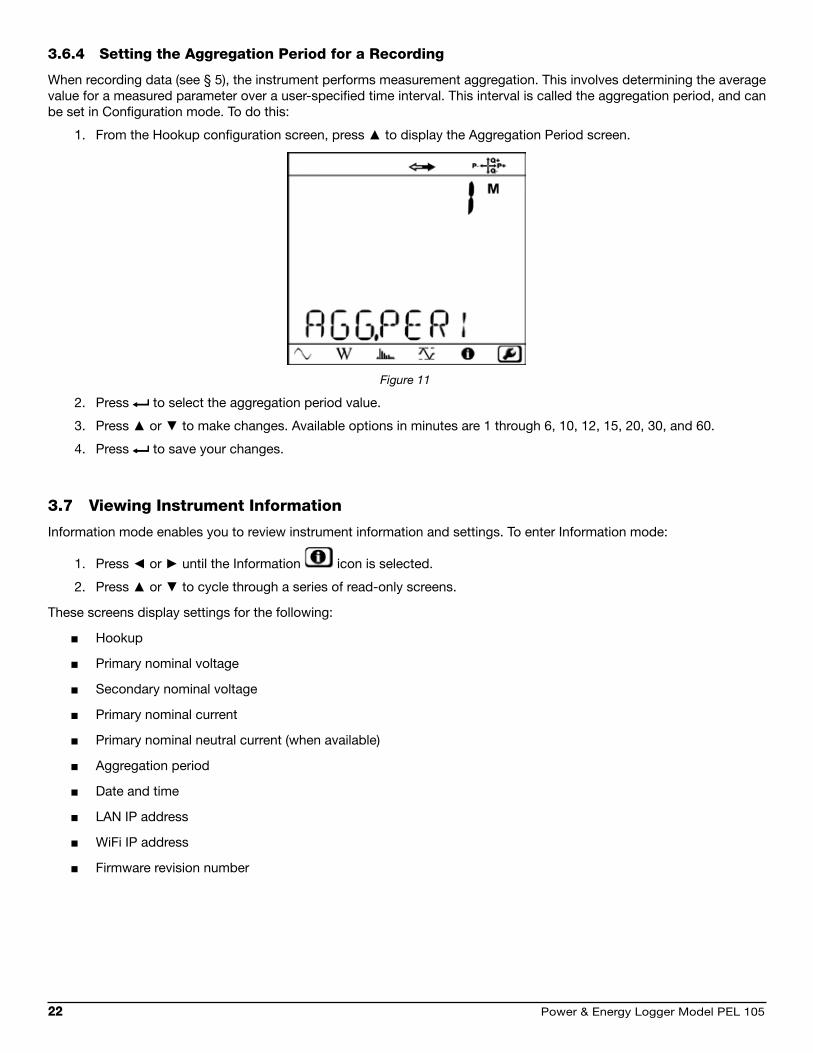
1. From the Hookup configuration screen, press to display the Aggregation Period screen.
Figure 11
2. Press to select the aggregation period value.
3. Press or to make changes. Available options in minutes are 1 through 6, 10, 12, 15, 20, 30, and 60.
4. Press to save your changes.
3.7 Viewing instrument information
Information mode enables you to review instrument information and settings. To enter Information mode:
1. Press or until the Information icon is selected.
2. Press or to cycle through a series of read-only screens.
These screens display settings for the following:
Hookup
Primary nominal voltage
Secondary nominal voltage
Primary nominal current
Primary nominal neutral current (when available)
Aggregation period
Date and time
LAN IP address
WiFi IP address
Firmware revision number

Power & Energy Logger Model PEL 105 23
4. oPEration
4.1 Hooking up to the Distribution system
The Model PEL 105 works with a variety of current probes and sensors. Choosing which type to use depends on the cur-rent to be measured and the diameter of the electrical cables. Each probe and sensor comes with its own documentation, which you should consult before connecting to the instrument.
The instrument may be supplied with four water-tight AmpFlex® Model A196-24-BK current probes. This 24” flexible probe measures the current in a cable without opening the circuit. The probe also comes in a 36” length (A193-36-BK). Their performance specifications are otherwise identical; although the A193-36-BK is not water-tight.
To connect the probe to the electrical network under measurement, do the following:
1. Connect the probe lead onto the appropriate current terminal. Which terminal to use depends on the hookup type, as explained later in this section. Note: When using AmpFlex A196-24-BK probe, be sure to screw the lead onto the threaded terminal to ensure water-tight (IP67) operation.
2. Open the probe by pressing the release levers on the side of the coupling and pulling out the end.
3. Wrap the probe around the electrical cable to be measured.
4. Close the probe by inserting the end back into the coupling.
This is the basic connection procedure for flexible loop probes. Clamp-on probes require a similar connection process.
The following table provides measurement specifications for supported probes and sensors. For detailed probe/sensor specifications, see § 7.9.
Model Nominal Range Measurement Range
Flexible Current Probe AmpFlex® Model A196-24-BK (waterproof – IP67)
100/400/2000/10000AAC 200mA to 12000AAC
Flexible Current Probe AmpFlex® Model 193-36-BK
100/400/2000/10000AAC 200mA to 12000AAC
Flexible Current Probe MiniFlex® MA193 100/400/2000/10000AAC 200mA to 3000AAC
AC/DC Current Probe J933500AAC
5000ADC
50 to 3500AAC
50 to 5000ADC
Clamp-On AC/DC Current Probe Model MR193-BK
1000AAC, 1400ADC max1 to 1000AAC, 1 to 1300A peak AC+DC
Clamp-On AC Current Probe Model MN93-BK 200AAC for F ≤1kHz0.5 to 240AAC max (I >200A not permanent)
Clamp-On AC Current Probe Model SR193-BK 1000AAC for F ≤1 kHz1 to 1200AAC max (I >1000A not continuously)
Clamp-On Current Probe Model MN193-36-BK 5A and 100AAC5A: 0.005 to 6AAC max100A: 0.2 to 120AAC max
AC/DC Current Probe Model SL261 (requires a BNC Adapter, catalog #2140.40, for use with the PEL 105)
10A and 100AAC/DC100mV/A: 50mA to 10A peak10mV/A: 0.5 to 100A peak
The PEL 105 supports 17 hookup types. For each, the following sections provide:
A connection diagram. This includes a depiction of the instrument’s current terminals I1, I2, I3, and IN (neutral); and voltage terminals V1, V2, V3, VN, and VE/GND (ground/earth). The diagram also includes an illustration of how the current probes and voltage leads are connected to electrical lines, neutral, and ground.
An icon showing the direction towards the load.
Instructions for how to connect the probes and leads.

24 Power & Energy Logger Model PEL 105
In each diagram, the top row of terminals connect current probes/sensors, the bottom row connect voltage test leads. The labels identify the input terminals functions. For example, I1 connects a current probe/sensor to line 1; I2 connects to line 2, and so on.
The following instructions assume you will use the neutral current terminal and the ground/earth voltage terminal. Use of these terminals is not strictly required; however they provide a higher level of accuracy when used.
For all hookups, ensure that the arrow on the probe is directed towards the load (for example, see Figure 13). This provides proper phase angle for power measurements and other phase-sensitive measurements.
Figure 12
NOTE: When connecting to the electrical network, be sure to observe all safety precautions as stated in the docu-mentation that accompanies the probes and sensors.
4.1.1 single-Phase 2-Wire (1P-2W)
Connect:
VN test lead to neutral (N).
VE/GND test lead to ground (optional, normally not used in this hookup).
V1 test lead to L1.
IN probe to neutral (optional, normally not used in this hookup).
I1 probe to L1.
VN V3 V2 V1 VE/GND
IN I3 I2 I1
L1N
Source Load
Figure 13

Power & Energy Logger Model PEL 105 25
4.1.2 single-Phase 3-Wire (1P-3W)
Split phase from a center tap transformer.
Connect:
VN test lead to neutral (N).
VE/GND test lead to ground (optional, normally not used inthis hookup).
V1 test lead to L1.
V2 test lead to L2.
IN probe to neutral (optional, normally not used in thishookup).
I1 probe to L1.
I2 probe to L2.VN V3
Source Load
V2 V1 VE/GND
IN I3 I2 I1
L1NL2
L2 L1N
Figure 14
4.1.3 3-Phase 3-Wire ∆ (2 current probes) (3P-3W∆2)
Connect:
VE/GND test lead to ground.
V1 test lead to L1.
V2 test lead to L2.
V3 test lead to L3.
I1 probe to L1.
I3 probe to L3.
VN V3
Source Load
V2 V1 VE/GND
IN I3 I2 I1
L1L2L3
L2 L1
L3
Figure 15
4.1.4 3-Phase 3-Wire ∆ (3 current probes) (3P-3W∆3)
Connect:
VE/GND test lead to ground.
V1 test lead to L1.
V2 test lead to L2.
V3 test lead to L3.
I1 probe to L1.
I2 probe to L2.
I3 probe to L3.VN V3
Source Load
V2 V1 VE/GND
IN I3 I2 I1
L1L2L3
L2 L1
L3
Figure 16

26 Power & Energy Logger Model PEL 105
4.1.5 3-Phase 3-Wire open ∆ (2 current probes) (3P-3Wo2)
Connect:
VE/GND test lead to ground.
V1 test lead to L1.
V2 test lead to L2.
V3 test lead to L3.
I1 probe to L1.
I3 probe to L3.
VN V3
Source Load
V2 V1 VE/GND
IN I3 I2 I1
L1L2L3
L2 L1
L3
Figure 17
4.1.6 3-Phase 3-Wire open ∆ (3 current probes) (3P-3Wo3)
Connect:
VE/GND test lead to ground.
V1 test lead to L1.
V2 test lead to L2.
V3 test lead to L3.
I1 probe to L1.
I2 probe to L2.
I3 probe to L3.VN V3
Source Load
V2 V1 VE/GND
IN I3 I2 I1
L1L2L3
L2 L1
L3
Figure 18
4.1.7 3-Phase 3-Wire Y (2 current probes) (3P-3WY2)
Connect:
VE/GND test lead to ground.
V1 test lead to L1.
V2 test lead to L2.
V3 test lead to L3.
I1 probe to L1.
I3 probe to L3.
VN V3
Source Load
V2 V1 VE/GND
IN I3 I2 I1
L1L2L3
L2
L3
L1
N
Figure 19

Power & Energy Logger Model PEL 105 27
4.1.8 3-Phase 3-Wire Y (3 current probes) (3P-3WY3)
Connect:
VE/GND test lead to ground.
V1 test lead to L1.
V2 test lead to L2.
V3 test lead to L3.
I1 probe to L1.
I2 probe to L2.
I3 probe to L3.VN V3
Source Load
V2 V1 VE/GND
IN I3 I2 I1
L1L2L3
L2
L3
L1
N
Figure 20
4.1.9 3-Phase 3-Wire ∆ balanced (1 current probe) (3P3W∆b)
Connect:
VE/GND test lead to ground.
V1 test lead to L1.
V2 test lead to L2.
I3 probe to L3.
VN V3
Source Load
V2 V1 VE/GND
IN I3 I2 I1
L1L2L3
L2 L1
L3
Figure 21
4.1.10 3-Phase 4-Wire Y (3P-4WY)
Connect:
VE/GND test lead to ground.
VN test lead to neutral (N).
V1 test lead to L1.
V2 test lead to L2.
V3 test lead to L3.
IN probe to neutral.
I1 probe to L1.
I2 probe to L2.
I3 probe to L3.
VN V3
Source Load
V2 V1 VE/GND
IN I3 I2 I1
L1L2L3N
L2
L3
L1
N
Figure 22

28 Power & Energy Logger Model PEL 105
4.1.11 3-Phase 4-Wire Y balanced (3P-4WYb)
Connect:
VE/GND test lead to ground.
VN test lead to neutral (N).
V1 test lead to L1.
IN probe to neutral.
I1 probe to L1.
VN V3
Source Load
V2 V1 VE/GND
IN I3 I2 I1
L1L2L3N
L2
L3
L1
N
Figure 23
4.1.12 3-Phase 4-Wire Y 2½ Element (3P-4WY2)
Connect:
VE/GND test lead to ground.
VN test lead to neutral (N).
V1 test lead to L1.
V3 test lead to L3.
IN probe to neutral.
I1 probe to L1.
I2 probe to L2.
I3 probe to L3.VN V3
Source Load
V2 V1 VE/GND
IN I3 I2 I1
L1L2L3N
L2
L3
L1
N
Figure 24
4.1.13 3-Phase 4-Wire ∆ (3P-4W∆)
Connect:
VE/GND test lead to ground.
VN test lead to neutral (N).
V1 test lead to L1.
V2 test lead to L2.
V3 test lead to L3.
IN probe to neutral.
I1 probe to L1.
I2 probe to L2.
I3 probe to L3.
VN V3
Source Load
V2 V1 VE/GND
IN I3 I2 I1
L1L2L3N
L1
L2
L3N
Figure 25
Power & Energy Logger Model PEL 105 29
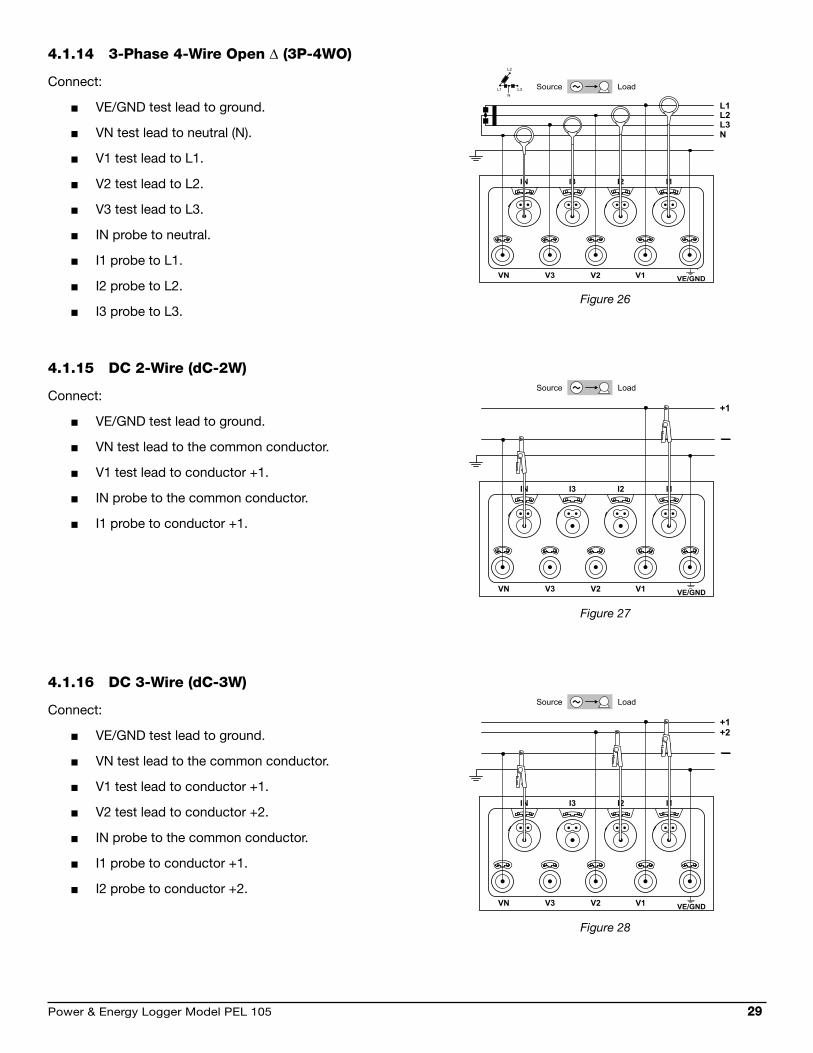
4.1.14 3-Phase 4-Wire open ∆ (3P-4Wo)
Connect:
VE/GND test lead to ground.
VN test lead to neutral (N).
V1 test lead to L1.
V2 test lead to L2.
V3 test lead to L3.
IN probe to neutral.
I1 probe to L1.
I2 probe to L2.
I3 probe to L3.
VN V3
Source Load
V2 V1 VE/GND
IN I3 I2 I1
L1L2L3N
L1
L2
L3N
Figure 26
4.1.15 Dc 2-Wire (dc-2W)
Connect:
VE/GND test lead to ground.
VN test lead to the common conductor.
V1 test lead to conductor +1.
IN probe to the common conductor.
I1 probe to conductor +1.
VN V3
Source Load
V2 V1 VE/GND
IN I3 I2 I1
+1
Figure 27
4.1.16 Dc 3-Wire (dc-3W)
Connect:
VE/GND test lead to ground.
VN test lead to the common conductor.
V1 test lead to conductor +1.
V2 test lead to conductor +2.
IN probe to the common conductor.
I1 probe to conductor +1.
I2 probe to conductor +2.VN V3
Source Load
V2 V1 VE/GND
IN I3 I2 I1
+1+2
Figure 28

30 Power & Energy Logger Model PEL 105
4.1.17 Dc 4-Wire (dc-4W)
Connect:
VE/GND test lead to ground.
VN test lead to the common conductor.
V1 test lead to conductor +1.
V2 test lead to conductor +2.
V3 test lead to conductor +3.
IN probe to the common conductor.
I1 probe to conductor +1.
I2 probe to conductor +2.
I3 probe to conductor +3.
VN V3
Source Load
V2 V1 VE/GND
IN I3 I2 I1
+1+2+3
Figure 29
4.2 Viewing Data
The PEL 105 provides four data viewing modes:
Measurement mode displays real-time data currently being measured by the probes/sensors. This includesvoltage, current, power, frequency, power factor, and tangent angle.
Energy mode displays energy use, including reactive energy, apparent energy, and kilowatt hour.
Harmonics mode displays harmonics for currents and voltages.
Maximum mode displays the maximum values for measurement and energy values.
Press or to navigate to the desired mode. When a mode is selected, a box appears around its icon at the bottom of the display screen (Figure 5). Each mode provides a set of screens for viewing data. Press or to navigate through these screens. Some of these screens include additional information which you can view by pressing . For example, several Measurement mode screens display phase angle information when you press . Pressing or while viewing an additional information screen returns to the previous screen.
The sequence of screens, and the information each one shows, is dependent on the electrical hookup setting.
The following tables list the screens available in Measurement, Energy, Harmonics, and Maximum modes. For each screen, the following information is displayed:
Image of the screen.
Title of screen, summarizing the information it displays.
Button to push to view the screen, shown to the left of the screen shot.
A list of the variables displayed on the screen, shown to the right of the screen image. These variables aredefined in the Glossary.
Power & Energy Logger Model PEL 105 31
4.2.1 Measurement Mode
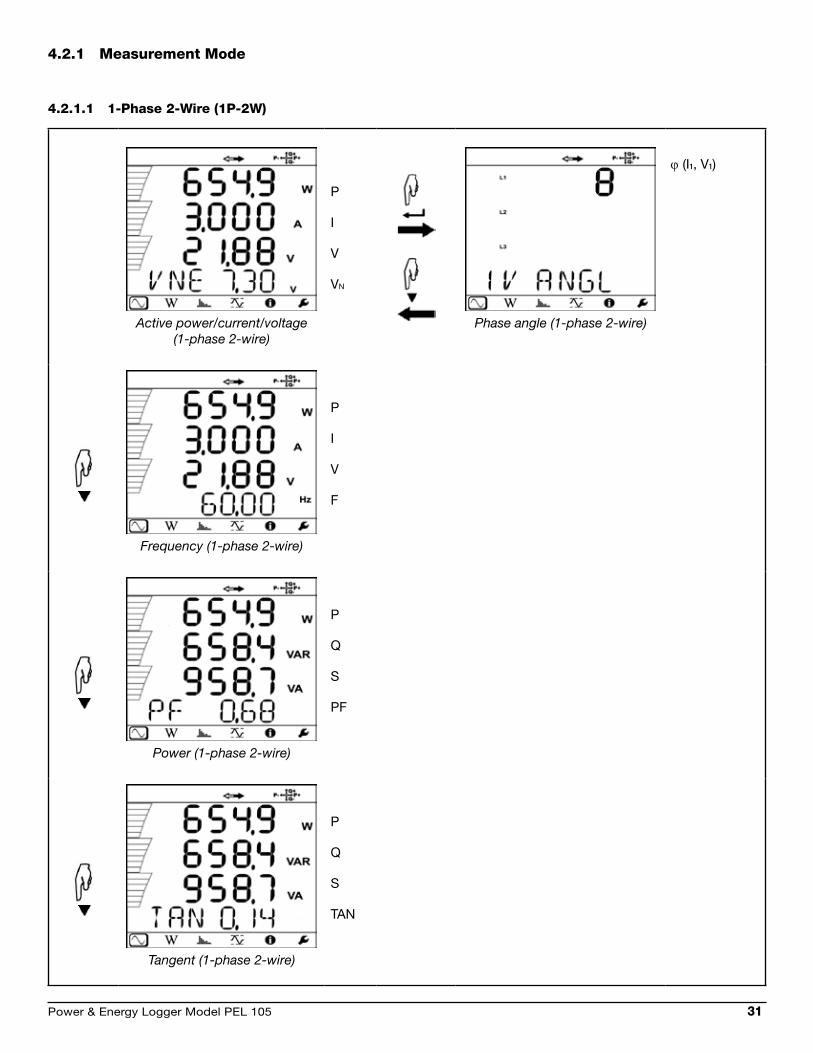
4.2.1.1 1-Phase 2-Wire (1P-2W)
Active power/current/voltage(1-phase 2-wire)
P
I
V
VN
Phase angle (1-phase 2-wire)
ϕ (I1, V1)
Frequency (1-phase 2-wire)
P
I
V
F
Power (1-phase 2-wire)
P
Q
S
PF
Tangent (1-phase 2-wire)
P
Q
S
TAN
32 Power & Energy Logger Model PEL 105
To view 1-phase 2-wire measurement data, do the following:
1. Turn ON the instrument, and enter Configuration mode by pressing either or until the Configuration icon is highlighted (see § 3.6.1). The Hookup screen will be displayed.
2. Press to enter edit mode, then press or to navigate to the hookup type 1P-2W. Press to save the configuration.
3. Hook up the probes and sensors to the 1-phase 2-wire distribution system, as instructed by § 4.1.1.
4. Press or until the icon is selected. This displays the first measurement screen for a 1-phase 2-wire hookup (Active power/current/voltage).
5. Navigate through the measurement screens as instructed in the previous table.
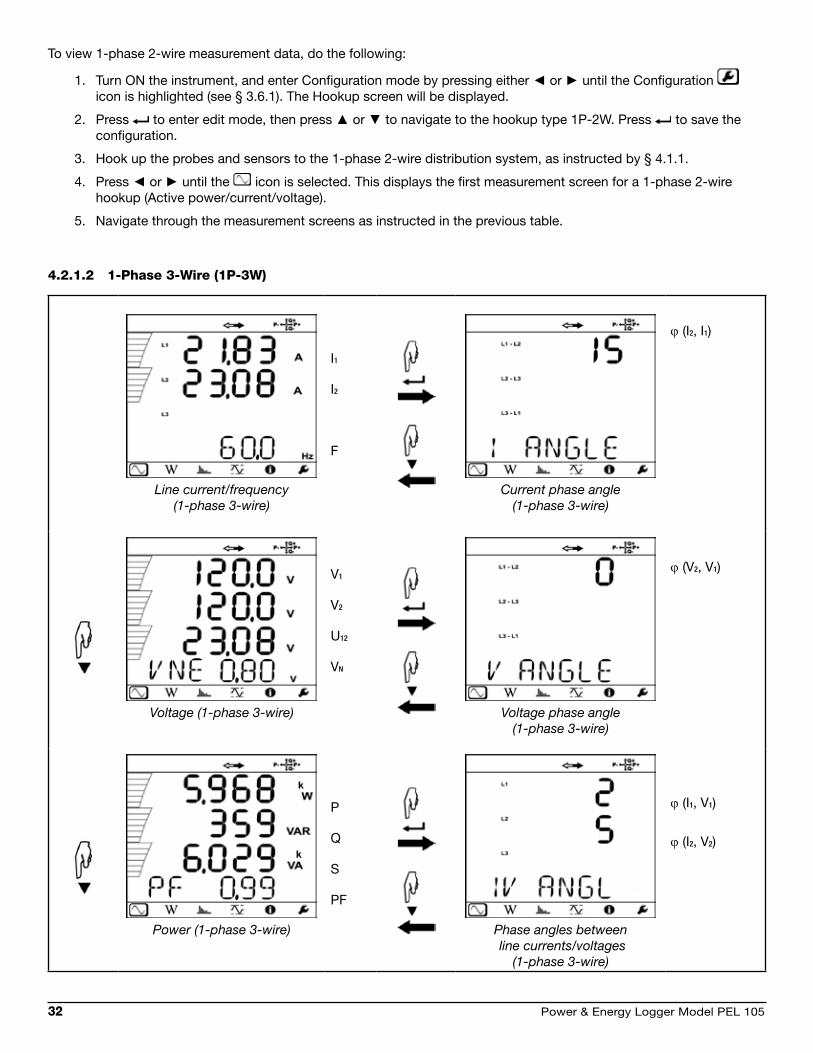
4.2.1.2 1-Phase 3-Wire (1P-3W)
Line current/frequency (1-phase 3-wire)
I1
I2
F
Current phase angle(1-phase 3-wire)
ϕ (I2, I1)
Voltage (1-phase 3-wire)
V1
V2
U12
VN
Voltage phase angle (1-phase 3-wire)
ϕ (V2, V1)
Power (1-phase 3-wire)
P
Q
S
PF
Phase angles between line currents/voltages
(1-phase 3-wire)
ϕ (I1, V1)
ϕ (I2, V2)

Power & Energy Logger Model PEL 105 33
Tangent (1-phase 3-wire)
P
Q
S
TAN
To view 1-phase 3-wire measurement data, do the following:
1. Turn ON the instrument, and enter Configuration mode by pressing either or until the Configurationicon is highlighted (see § 3.6.1). The Hookup screen will be displayed.
2. Press to enter edit mode, then press or to navigate to the hookup type 1P-3W. Press to save the configuration.
3. Hook up the probes and sensors to the 1-phase 3-wire distribution system, as instructed by § 4.1.2.
4. Press or until the icon is selected. This displays the first measurement screen for a 1-phase 3-wire hookup (Line current/frequency).
5. Navigate through the measurement screens as instructed in the table above.
4.2.1.3 3-Phase 3-Wire unbalanced
Line current(3-phase 3-wire unbalanced)
I1
I2
I3
Current phase angle(3-phase 3-wire unbalanced)
ϕ (I2, I1)
ϕ (I3, I2)
ϕ (I1, I3)
Phase voltage/frequency(3-phase 3-wire unbalanced)
U12
U23
U31
F
Phase voltage phase angles(3-phase 3-wire unbalanced)
ϕ (U31, U23)
ϕ (U12, U31)
ϕ (U23, U12)

34 Power & Energy Logger Model PEL 105
Power (3-phase 3-wire unbalanced)
P
Q
S
PF
Phase angles between line currents and phase voltage
(3-phase 3-wire unbalanced)
ϕ (I1, U12)
ϕ (I2, U23)
ϕ (I3, U31)
Tangent (3-phase 3-wire unbalanced)
P
Q
S
TAN
Measurement mode consists of seven screens when the hookup setting is one of the following:
3P-3W∆2 (3-phase 3-wire ∆, two probes)
3P-3W∆3 (3-phase 3-wire ∆, three probes)
3P-3WO2 (3-phase 3-wire open ∆, two probes)
3P-3WO3 (3-phase 3-wire open ∆, three probes)
3P-3WY2 (3-phase 3-wire Y, two probes)
3P-3WY3 (3-phase 3-wire Y, three probes)
To view 3-phase 3-wire unbalanced measurement data, do the following:
1. Turn ON the instrument, and enter Configuration mode by pressing either or until the Configurationicon is highlighted (see § 3.6.1). The Hookup screen will be displayed.
2. Press to enter edit mode, then press or to navigate to the appropriate 3-phase 3-wire unbalanced hookup type (see the list above). Press to save the configuration.
3. Hook up the probes and sensors to the 3-phase 3-wire unbalanced distribution system, as instructed by §§ 4.1.3through 4.1.8 (each of these sections describes a different 3-phase 3-wire unbalanced hookup type).
4. Press or until the icon is selected. This displays the first measurement screen for a 3-phase 3-wireunbalanced hookup (Line current).
5. Navigate through the measurement screens as instructed in the table above.
Power & Energy Logger Model PEL 105 35
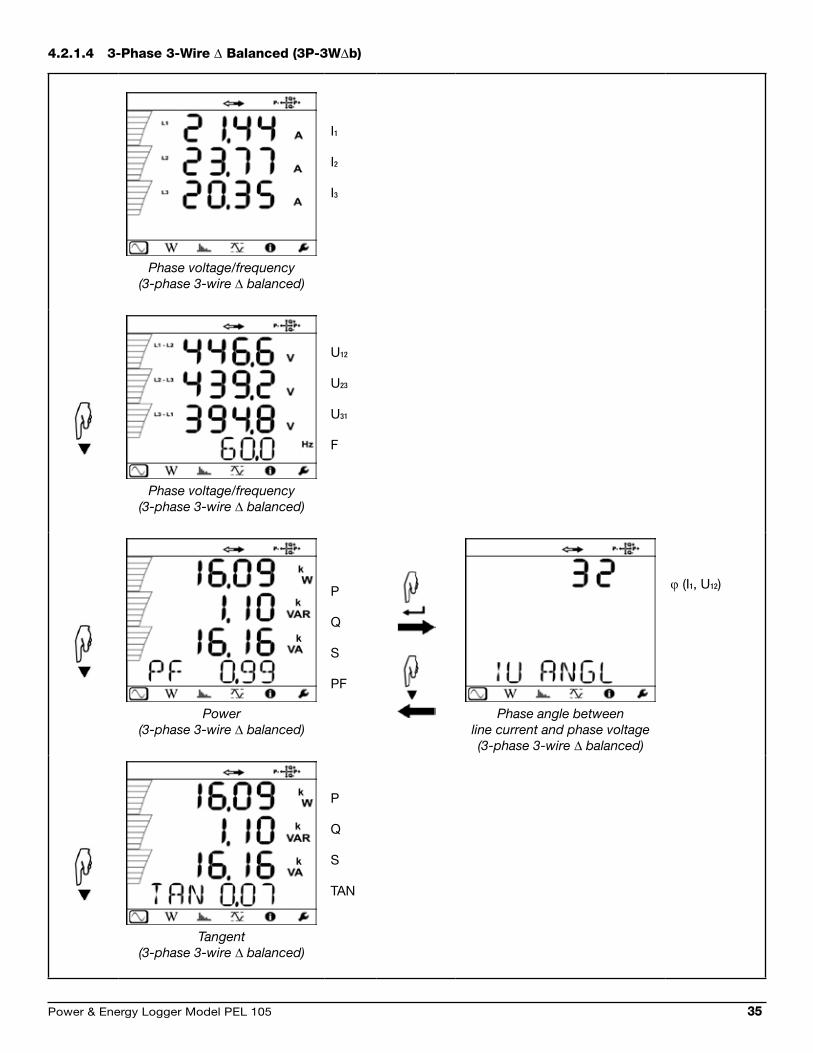
4.2.1.4 3-Phase 3-Wire ∆ balanced (3P-3W∆b)
Phase voltage/frequency (3-phase 3-wire ∆ balanced)
I1
I2
I3
Phase voltage/frequency (3-phase 3-wire ∆ balanced)
U12
U23
U31
F
Power (3-phase 3-wire ∆ balanced)
P
Q
S
PF
Phase angle between line current and phase voltage (3-phase 3-wire ∆ balanced)
ϕ (I1, U12)
Tangent (3-phase 3-wire ∆ balanced)
P
Q
S
TAN

36 Power & Energy Logger Model PEL 105
To view 3-phase 3-wire ∆ balanced measurement data, do the following:
1. Turn ON the instrument, and enter the Configuration mode by pressing either or until the Configurationicon is highlighted (see § 3.6.1). The Hookup screen will be displayed.
2. Press to enter edit mode, then press or to navigate to 3P-3W∆b. Press to save the configuration.
3. Hook up the probes and sensors to the 3-phase 3-wire balanced distribution system, as instructed by § 4.1.9.
4. Press or until the icon is selected. This displays the first measurement screen for a 3-phase 3-wire balanced hookup (Phase voltage/frequency).
5. Navigate through the measurement screens as instructed in the previous table.
4.2.1.5 3-Phase 4-Wire unbalanced
Line current(3-phase 4-wire unbalanced)
I1
I2
I3
IN
Current phase angle(3-phase 4-wire unbalanced)
ϕ (I2, I1)
ϕ (I3, I2)
ϕ (I1, I3)
Line voltage(3-phase 4-wire unbalanced)
V1
V2
V3
VN
Line voltage phase angles(3-phase 4-wire unbalanced)
ϕ (V2, V1)
ϕ (V3, V2)
ϕ (V1, V3)
Phase voltage/frequency(3-phase 4-wire unbalanced)
U12
U23
U31
F
Phase angles between line currents and phase voltage
(3-phase 4-wire unbalanced)
ϕ (U31, U23)
ϕ (U12, U31)
ϕ (U23, U12)
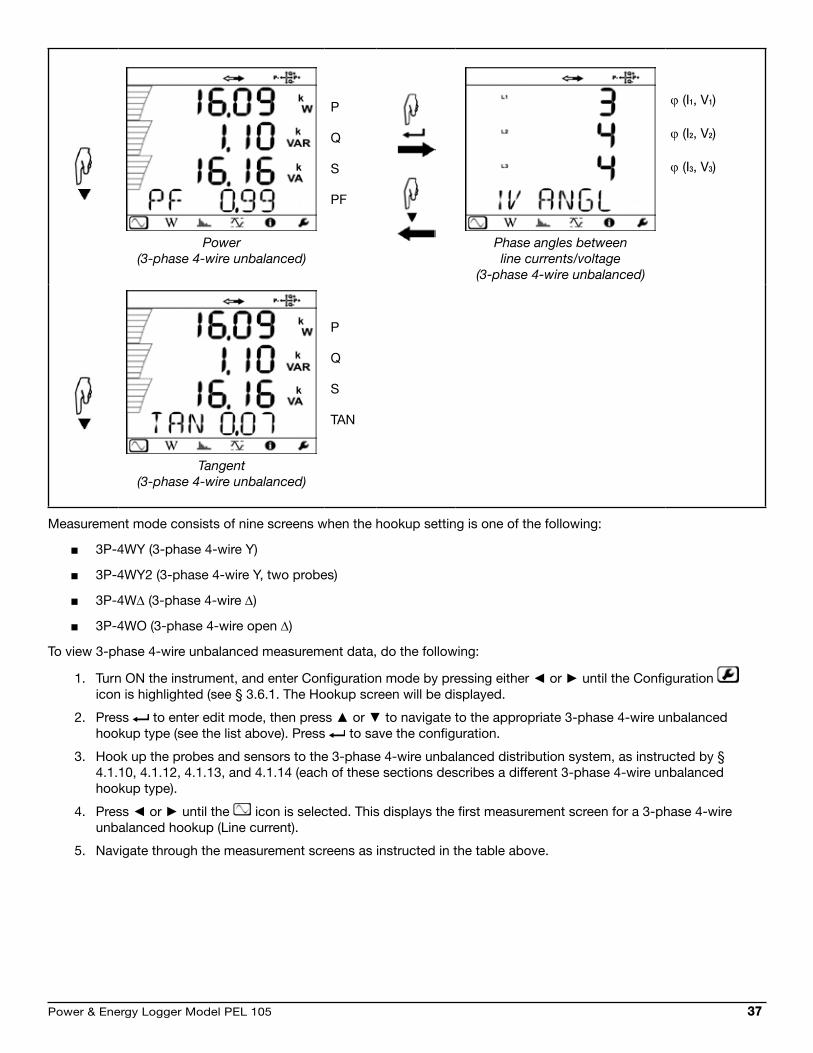
Power & Energy Logger Model PEL 105 37
Power (3-phase 4-wire unbalanced)
P
Q
S
PF
Phase angles between line currents/voltage
(3-phase 4-wire unbalanced)
ϕ (I1, V1)
ϕ (I2, V2)
ϕ (I3, V3)
Tangent (3-phase 4-wire unbalanced)
P
Q
S
TAN
Measurement mode consists of nine screens when the hookup setting is one of the following:
3P-4WY (3-phase 4-wire Y)
3P-4WY2 (3-phase 4-wire Y, two probes)
3P-4W∆ (3-phase 4-wire ∆)
3P-4WO (3-phase 4-wire open ∆)
To view 3-phase 4-wire unbalanced measurement data, do the following:
1. Turn ON the instrument, and enter Configuration mode by pressing either or until the Configurationicon is highlighted (see § 3.6.1. The Hookup screen will be displayed.
2. Press to enter edit mode, then press or to navigate to the appropriate 3-phase 4-wire unbalanced hookup type (see the list above). Press to save the configuration.
3. Hook up the probes and sensors to the 3-phase 4-wire unbalanced distribution system, as instructed by §4.1.10, 4.1.12, 4.1.13, and 4.1.14 (each of these sections describes a different 3-phase 4-wire unbalancedhookup type).
4. Press or until the icon is selected. This displays the first measurement screen for a 3-phase 4-wire unbalanced hookup (Line current).
5. Navigate through the measurement screens as instructed in the table above.
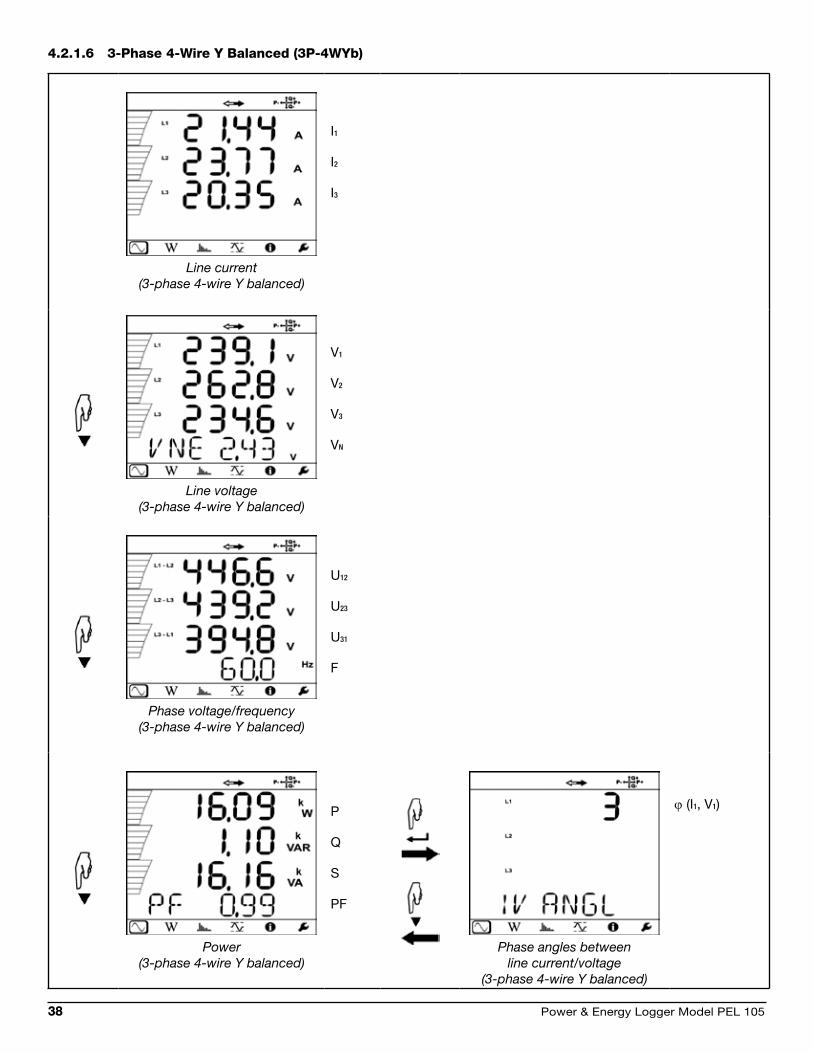
38 Power & Energy Logger Model PEL 105
4.2.1.6 3-Phase 4-Wire Y balanced (3P-4WYb)
Line current(3-phase 4-wire Y balanced)
I1
I2
I3
Line voltage(3-phase 4-wire Y balanced)
V1
V2
V3
VN
Phase voltage/frequency(3-phase 4-wire Y balanced)
U12
U23
U31
F
Power (3-phase 4-wire Y balanced)
P
Q
S
PF
Phase angles between line current/voltage
(3-phase 4-wire Y balanced)
ϕ (I1, V1)
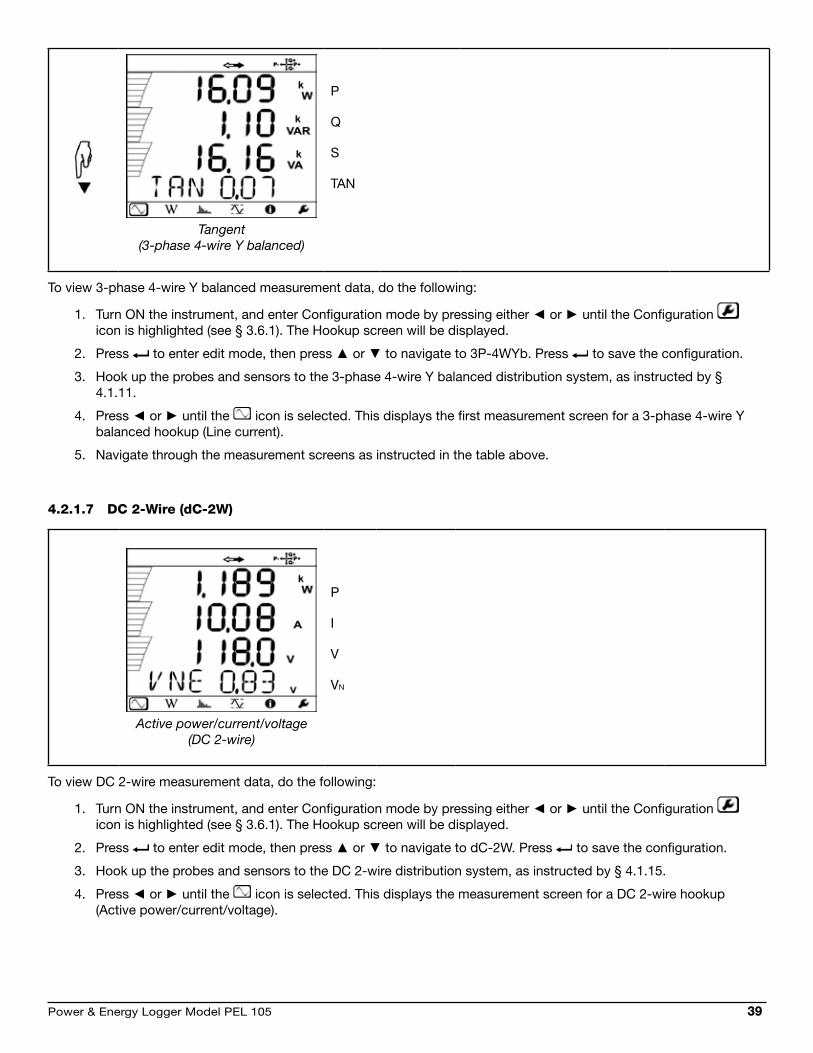
Power & Energy Logger Model PEL 105 39
Tangent (3-phase 4-wire Y balanced)
P
Q
S
TAN
To view 3-phase 4-wire Y balanced measurement data, do the following:
1. Turn ON the instrument, and enter Configuration mode by pressing either or until the Configuration icon is highlighted (see § 3.6.1). The Hookup screen will be displayed.
2. Press to enter edit mode, then press or to navigate to 3P-4WYb. Press to save the configuration.
3. Hook up the probes and sensors to the 3-phase 4-wire Y balanced distribution system, as instructed by § 4.1.11.
4. Press or until the icon is selected. This displays the first measurement screen for a 3-phase 4-wire Y balanced hookup (Line current).
5. Navigate through the measurement screens as instructed in the table above.
4.2.1.7 Dc 2-Wire (dc-2W)
Active power/current/voltage(DC 2-wire)
P
I
V
VN
To view DC 2-wire measurement data, do the following:
1. Turn ON the instrument, and enter Configuration mode by pressing either or until the Configuration icon is highlighted (see § 3.6.1). The Hookup screen will be displayed.
2. Press to enter edit mode, then press or to navigate to dC-2W. Press to save the configuration.
3. Hook up the probes and sensors to the DC 2-wire distribution system, as instructed by § 4.1.15.
4. Press or until the icon is selected. This displays the measurement screen for a DC 2-wire hookup (Active power/current/voltage).

40 Power & Energy Logger Model PEL 105
4.2.1.8 Dc 3-Wire (dc-3W)
Line current(DC 3-wire)
I1
I2
IN
Voltage (DC 3-wire)
V1
V2
VN
Active power (DC 3-wire)
P
To view DC 3-wire measurement data, do the following:
1. Turn ON the instrument, and enter the Configuration mode by pressing either or until the Configuration icon is highlighted (see § 3.6.1). The Hookup screen will be displayed.
2. Press to enter edit mode, then press or to navigate to dC-3W. Press to save the configuration.
3. Hook up the probes and sensors to the DC 3-wire distribution system, as instructed by § 4.1.16.
4. Press or until the icon is selected. This displays the first measurement screen for a DC 3-wire hookup (Line current).
5. Navigate through the measurement screens as instructed in the table above.
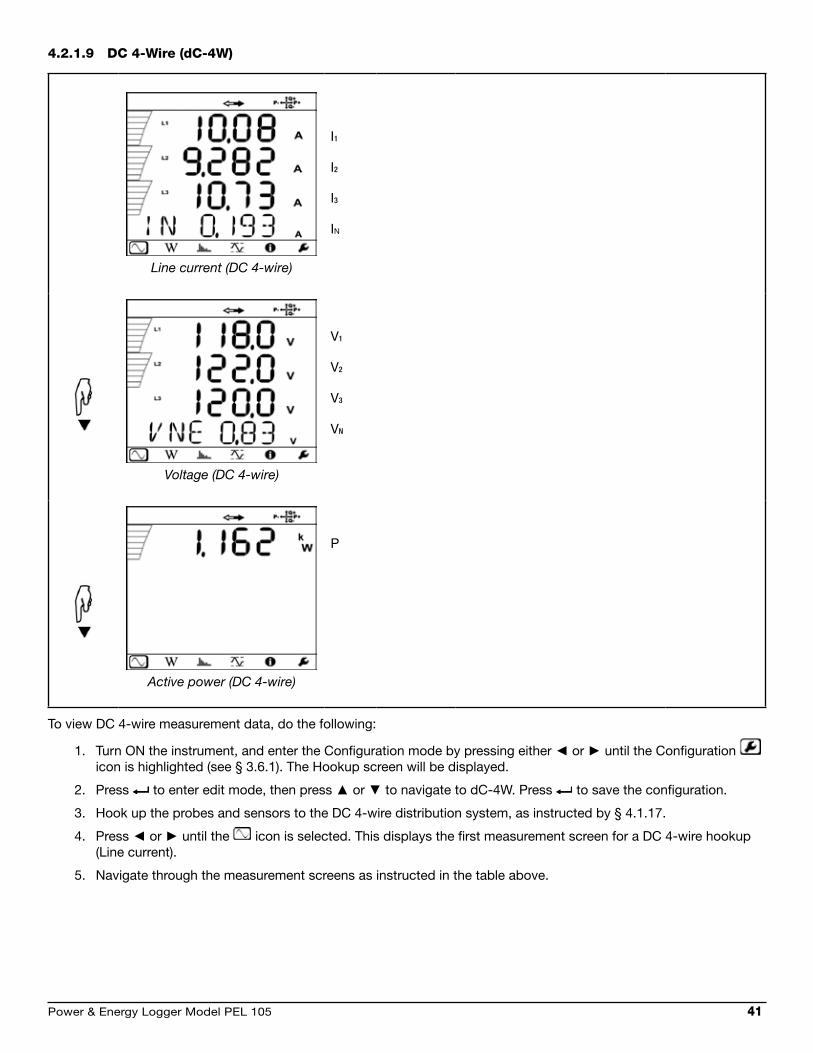
Power & Energy Logger Model PEL 105 41
4.2.1.9 Dc 4-Wire (dc-4W)
Line current (DC 4-wire)
I1
I2
I3
IN
Voltage (DC 4-wire)
V1
V2
V3
VN
Active power (DC 4-wire)
P
To view DC 4-wire measurement data, do the following:
1. Turn ON the instrument, and enter the Configuration mode by pressing either or until the Configuration icon is highlighted (see § 3.6.1). The Hookup screen will be displayed.
2. Press to enter edit mode, then press or to navigate to dC-4W. Press to save the configuration.
3. Hook up the probes and sensors to the DC 4-wire distribution system, as instructed by § 4.1.17.
4. Press or until the icon is selected. This displays the first measurement screen for a DC 4-wire hookup (Line current).
5. Navigate through the measurement screens as instructed in the table above.
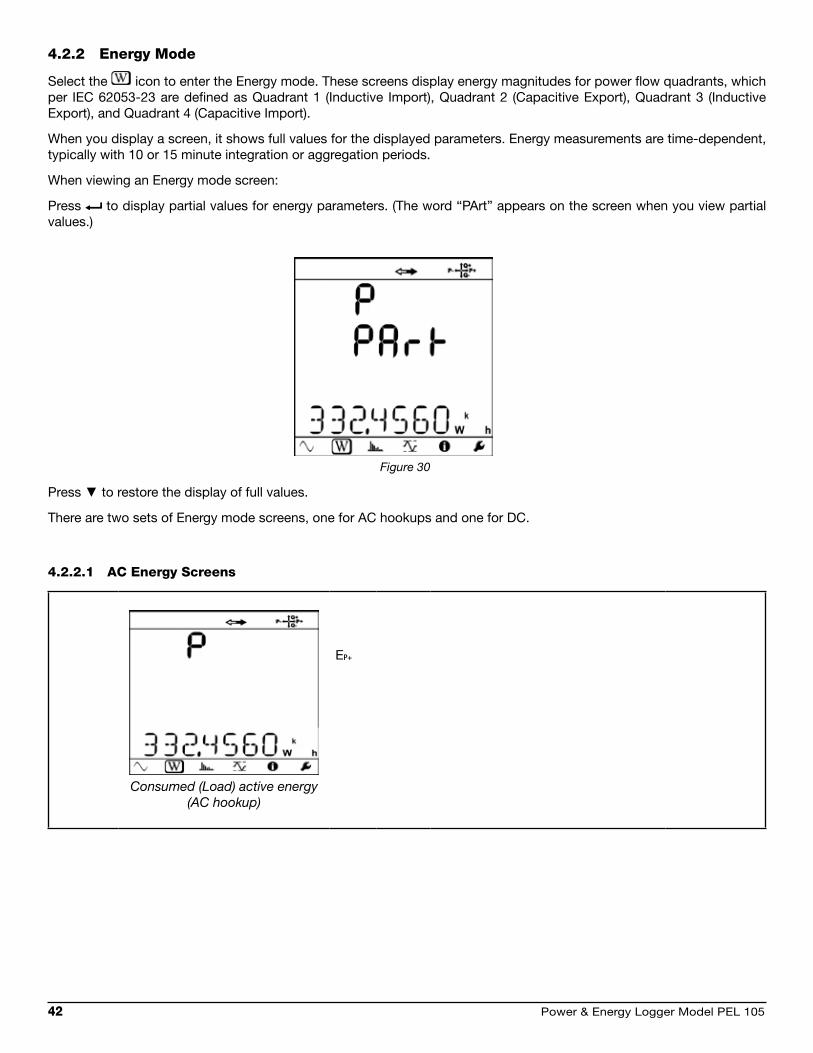
42 Power & Energy Logger Model PEL 105
4.2.2 Energy Mode
Select the icon to enter the Energy mode. These screens display energy magnitudes for power flow quadrants, which per IEC 62053-23 are defined as Quadrant 1 (Inductive Import), Quadrant 2 (Capacitive Export), Quadrant 3 (Inductive Export), and Quadrant 4 (Capacitive Import).
When you display a screen, it shows full values for the displayed parameters. Energy measurements are time-dependent, typically with 10 or 15 minute integration or aggregation periods.
When viewing an Energy mode screen:
Press to display partial values for energy parameters. (The word “PArt” appears on the screen when you view partial values.)
Figure 30
Press to restore the display of full values.
There are two sets of Energy mode screens, one for AC hookups and one for DC.
4.2.2.1 ac Energy screens
Consumed (Load) active energy(AC hookup)
EP+

Power & Energy Logger Model PEL 105 43
Generated (Source) active energy(AC hookup)
EP-
Reactive energy on Quadrant 1(Inductive Import)
EQ1Note that for this and the following quadrant screens, the character represents the letter Q.
Reactive energy on Quadrant 2(Capacitive Export)
EQ2
Reactive energy on Quadrant 3(Inductive Export)
EQ3

44 Power & Energy Logger Model PEL 105
Reactive energy on Quadrant 4(Capacitive Import)
EQ4
Consumed (Load) apparent energy
ES+
Generated (Source) apparent energy
ES-

Power & Energy Logger Model PEL 105 45
4.2.2.2 Dc Energy screens
Consumed (Load) active energy(DC hookup)
EP+
Generated (Source) active energy(DC hookup)
EP-

46 Power & Energy Logger Model PEL 105
4.2.3 Harmonics Mode
Select the icon to enter Harmonics mode. These screens display total harmonic distortion (THD) values for AC voltage and current. There are either one or two Harmonics mode screens, depending on hookup type.
NOTE: Harmonics mode is not available for DC hookups.
4.2.3.1 1-Phase 2-Wire (1P-2W)
Total Harmonic Distortion(1-phase 2-wire)
THD_I
THD_V
4.2.3.2 1-Phase 3-Wire (1P-3W)
Current THD(1-phase 3-wire)
THD_I1
THD_I2
Voltage THD(1-phase 3-wire)
THD_V1
THD_V2
THD_U12
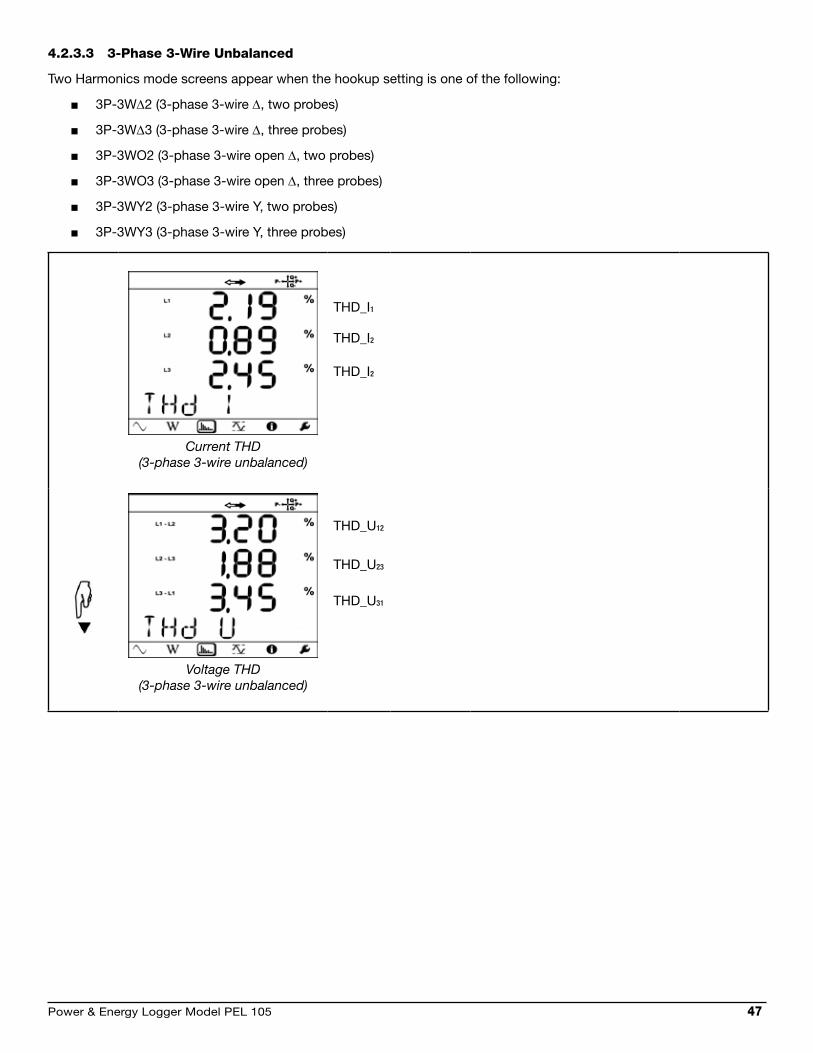
Power & Energy Logger Model PEL 105 47
4.2.3.3 3-Phase 3-Wire unbalanced
Two Harmonics mode screens appear when the hookup setting is one of the following:
3P-3W∆2 (3-phase 3-wire ∆, two probes)
3P-3W∆3 (3-phase 3-wire ∆, three probes)
3P-3WO2 (3-phase 3-wire open ∆, two probes)
3P-3WO3 (3-phase 3-wire open ∆, three probes)
3P-3WY2 (3-phase 3-wire Y, two probes)
3P-3WY3 (3-phase 3-wire Y, three probes)
Current THD(3-phase 3-wire unbalanced)
THD_I1
THD_I2
THD_I2
Voltage THD(3-phase 3-wire unbalanced)
THD_U12
THD_U23
THD_U31
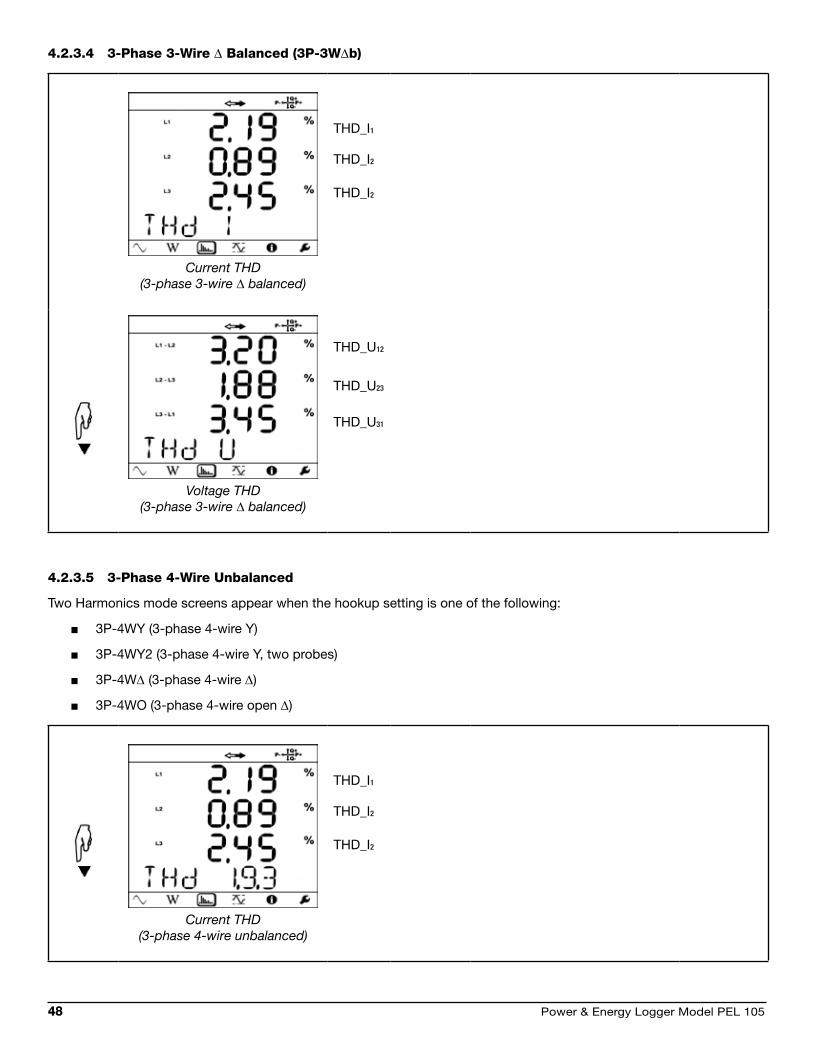
48 Power & Energy Logger Model PEL 105
4.2.3.4 3-Phase 3-Wire ∆ balanced (3P-3W∆b)
Current THD(3-phase 3-wire ∆ balanced)
THD_I1
THD_I2
THD_I2
Voltage THD(3-phase 3-wire ∆ balanced)
THD_U12
THD_U23
THD_U31
4.2.3.5 3-Phase 4-Wire unbalanced
Two Harmonics mode screens appear when the hookup setting is one of the following:
3P-4WY (3-phase 4-wire Y)
3P-4WY2 (3-phase 4-wire Y, two probes)
3P-4W∆ (3-phase 4-wire ∆)
3P-4WO (3-phase 4-wire open ∆)
Current THD(3-phase 4-wire unbalanced)
THD_I1
THD_I2
THD_I2

Power & Energy Logger Model PEL 105 49
Voltage THD(3-phase 4-wire unbalanced)
THD_U12
THD_U23
THD_U31
4.2.3.6 3-Phase 4-Wire balanced (3P-4WYb)
Current THD(3-phase 4-wire balanced)
THD_I1
THD_I1
THD_I1
Voltage THD(3-phase 4-wire balanced)
THD_V1
THD_V1
THD_V1
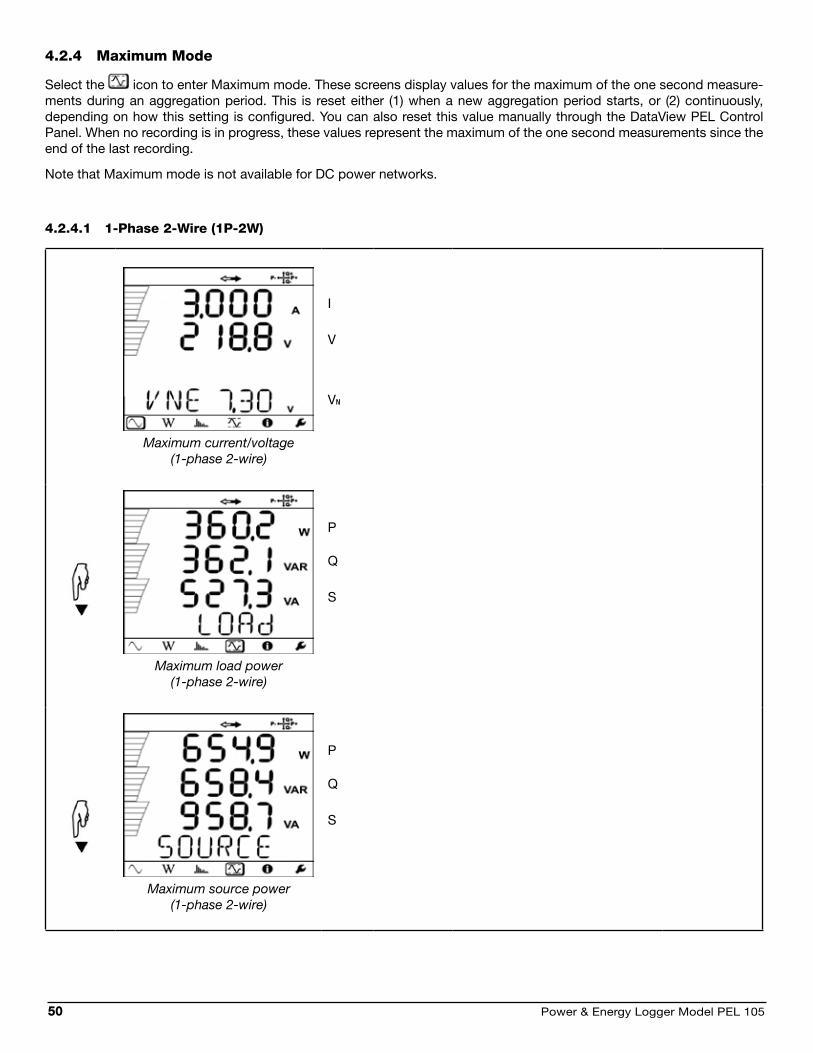
50 Power & Energy Logger Model PEL 105
4.2.4 Maximum Mode
Select the icon to enter Maximum mode. These screens display values for the maximum of the one second measure-ments during an aggregation period. This is reset either (1) when a new aggregation period starts, or (2) continuously, depending on how this setting is configured. You can also reset this value manually through the DataView PEL Control Panel. When no recording is in progress, these values represent the maximum of the one second measurements since the end of the last recording.
Note that Maximum mode is not available for DC power networks.
4.2.4.1 1-Phase 2-Wire (1P-2W)
Maximum current/voltage(1-phase 2-wire)
I
V
VN
Maximum load power(1-phase 2-wire)
P
Q
S
Maximum source power(1-phase 2-wire)
P
Q
S

Power & Energy Logger Model PEL 105 51
4.2.4.2 1-Phase 3-Wire (1P-3W)
Maximum current/voltage(1-phase 3-wire)
I1
I2
Maximum current/voltage(1-phase 3-wire)
V1
V2
U12
VN
Maximum load power(1-phase 3-wire)
P
Q
S
Maximum source power(1-phase 3-wire)
P
Q
S

52 Power & Energy Logger Model PEL 105
4.2.4.3 3-Phase 3-Wire
Four Maximum mode screens appear when the hookup type is one of the following:
3P-3W∆2 (3-phase 3-wire ∆, two probes)
3P-3W∆3 (3-phase 3-wire ∆, three probes)
3P-3WO2 (3-phase 3-wire open ∆, two probes)
3P-3WO3 (3-phase 3-wire open ∆, three probes)
3P-3WY2 (3-phase 3-wire Y, two probes)
3P-3WY3 (3-phase 3-wire Y, three probes)
3P-3W∆b (3-phase 3-wire ∆ balanced)
Maximum line current(3-phase 3-wire)
I1
I2
I3
Maximum line voltage(3-phase 3-wire)
U12
U23
U31
Maximum load power(3-phase 3-wire)
P
Q
S

Power & Energy Logger Model PEL 105 53
Maximum source power(3-phase 3-wire)
P
Q
S
4.2.4.4 3-Phase 4-Wire
Four Maximum mode screens appear when the hookup type is one of the following:
3P-4WY (3-phase 4-wire Y)
3P-4WY2 (3-phase 4-wire Y, two probes)
3P-4W∆ (3-phase 4-wire ∆)
3P-4WO (3-phase 4-wire open ∆)
Maximum line current(3-phase 4-wire)
I1
I2
I3
IN
Note that for 3-phase 4-wire Y balanced hookups, the maximum neutral current (IN) is not dis-played.
Maximum voltage(3-phase 4-wire)
V1
V2
V3
VN

54 Power & Energy Logger Model PEL 105
Max. phase-to-phase voltage(3-phase 4-wire)
U12
U23
U31
Maximum load power(3-phase 3-wire)
P
Q
S
Maximum source power(3-phase 3-wire)
P
Q
S

Power & Energy Logger Model PEL 105 55
5. rEcorDinG Data
The instrument can record measurement data and store the results. You can start a recording immediately, or (using the DataView PEL Control Panel) schedule one with a defined start date/time and duration. The session can then be down-loaded for viewing, analysis, and distribution.
5.1 recording session overview
Recording sessions are configured through the PEL Control Panel. This provides a number of recording options, such as selecting which data to include in the recording, the demand (aggregation) period, and recording schedule. This also includes changing the instrument’s date and time, if required (see § 6.3). After you complete a recording session, you can add information such as session name, the operator who conducted the recording, and the location where it took place. In addition, the PEL Control Panel enables you to download recordings and clear them from the instrument.
Typically, recording sessions are started, stopped, and scheduled through the PEL Control Panel. You can also start and stop a recording session on the instrument itself (see § 5.2). You can also set the aggregation period for a recording, as explained in § 3.6.4.
Recording sessions are stored in the instrument’s SD card. The memory required for a recording session primarily depends upon the duration of the recording and the storage period. Recording rates for the different types of session data are as follows:
200ms trends: 92MB per day
1-second harmonics: 91MB per day.
1-second trends: 36MB per day.
Aggregated trend: 1.7MB per day for 1 minute periods. For longer periods, this rate is divided by the period in minutes. For example, for an aggregation period of 10 minutes, the rate will be 0.17MB per day; for 15 minute periods this is 0.113MB per day, and so on.
Aggregated harmonics: 1.6MB per day for 1 minute periods. (For longer periods, use the same formula described above for aggregated trend data.)
For instance, a five-day session recording aggregated trends and harmonics with a 15 minute demand period, 1 second trends, and 1 second harmonics would consume approximately 636MB of storage.
The recommended maximum recording times for a single session on an instrument are:
21 days when recording 200-ms trends and 1-minute aggregated data (trend and harmonics).
One month when recording 1-minute aggregated data, 1-second trends, and 1-second harmonics.
15 weeks when recording 1-minute aggregated data and 1-second trend data but not harmonics.
Three years when recording only 1 minute aggregated data (including aggregated harmonics).
Multiple years when recording only 15-minute aggregated data (without aggregated harmonics).
Other recommendations include:
Do not store more than 32 recording sessions on the SD card.
For recordings with harmonics or with a duration longer than one week, use class 4 or higher SDHC cards.
Avoid downloading large sessions via Bluetooth, because this may require many hours to finish. If Bluetooth is the only communication method available, you can reduce the amount of data to be downloaded by selectively excluding 200ms trends, 1 second trends, and harmonics from the download. Doing so reduces the data downloaded from a 30 day recording with 15-minute aggregation to 3.4MB. (You can choose which recorded data to include/exclude in the download via the PEL Control Panel.)

56 Power & Energy Logger Model PEL 105
5.2 starting and stopping a recording
Before starting a recording, ensure that the instrument is not currently locked (the word LOCK appears on the screen in Configuration mode). The instrument cannot begin a recording when it is locked. The instrument is locked when:
Being configured via the PEL Control Panel.
Disabled through an option in the PEL Control Panel (see § 3.6).
A recording session is already in progress. Note that in this case the button remains active so you can stop the recording. However, you cannot start a new recording if one is in progress.
If any of these situations is in effect, take appropriate action as necessary to unlock the instrument. Then check the SD card LED.
If the LED is green, the SD card is ready to store recordings.
If the LED glows steady red, ensure that: - The SD card is installed. If not, consult § 2.7. - The write-protect sliding tab on the card is in the “unlock” position (towards the metal contacts). - The SD card is formatted. Formatting can be performed either through the PEL Control Panel, or through a
Windows command on your computer.
Note that the LED briefly blinks red when the card is initializing.
If the LED blinks alternately red and green, the SD card is full. Download any data you want to save to your computer, then erase the content of the card through the PEL Control Panel.
When the LED indicates the SD card is ready, you can begin recording. To do this through the PEL Control Panel, follow the instructions provided in the PEL Control Panel Help system. To record through the instrument user interface, do the following:
1. Press and hold it down until the LED lights. Then release .
2. The LED should now blink twice every five seconds, indicating a recording is in progress.
3. To stop a recording, press and hold it down until the LED lights up, then release .
To view the recording session, connect the instrument to your computer running DataView (see § 6).

Power & Energy Logger Model PEL 105 57
6. DataViEW® & PEL controL PanEL
DataView enables a computer to connect to and interact with a variety of AEMC instruments, including the Model PEL 105. As its name implies, the primary purpose of DataView is to view data that has been recorded by the instrument and display it as a report.
With DataView, you can:
Connect the instrument to a computer. This connection can be through USB cable, LAN network, direct Ethernet connection, Wi-Fi, or Bluetooth.
Display and analyze real-time data on the computer via a frames style interface.
Download previously recorded data from the instrument. You need DataView to view recording sessions, since these sessions cannot be displayed through the instrument’s interface.
Start, schedule, stop, and cancel a recording session.
Configure a wide variety of instrument settings.
Perform instrument maintenance such as formatting the SD card and erasing its content.
Generate reports for viewing and printing the data, using standard templates or ones you customize to your requirements.
DataView includes a core set of features used by all instruments. These features are designed for viewing data, and for opening, creating, and saving reports. DataView also includes components called Control Panels for interacting with the instrument. A Control Panel lets you connect to the instrument, download data, and configure the instrument’s settings. Each AEMC product family has its own dedicated Control Panel; you select the one(s) you need during DataView installation.
For example, DataView includes the PEL Control Panel specifically designed for working with Model PEL Series instruments. The PEL Control Panel provides all the features available in the instrument’s user interface, as well as many additional features.
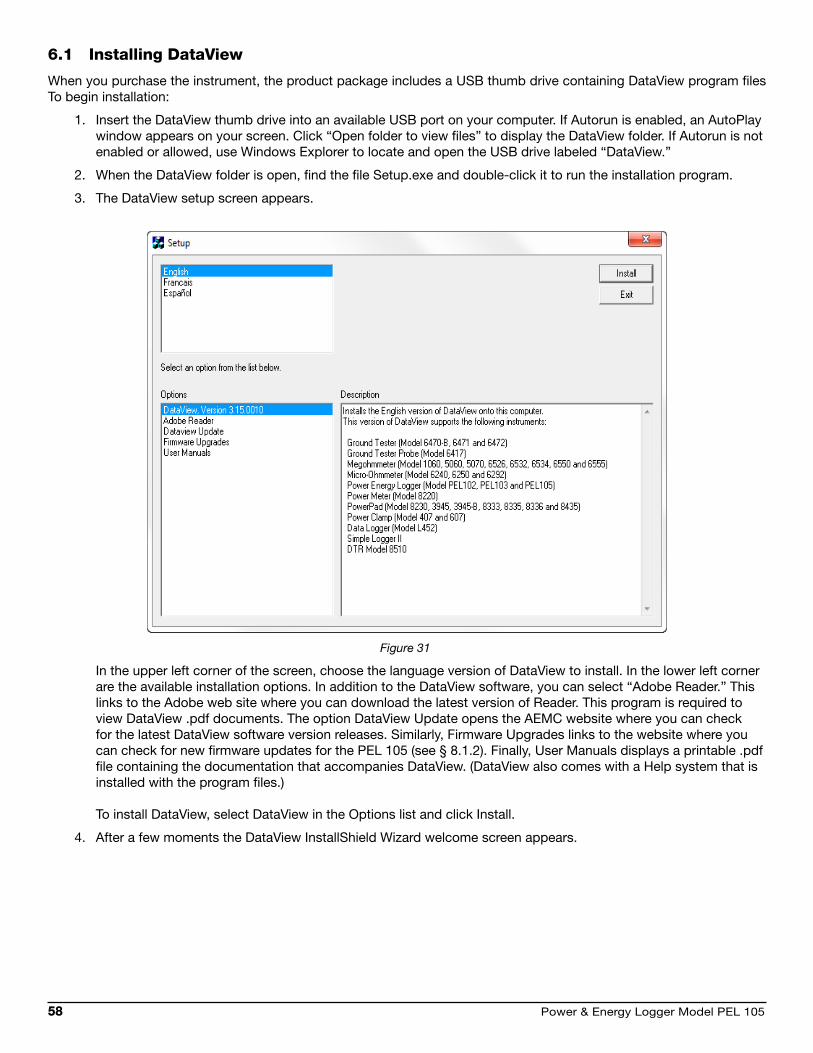
58 Power & Energy Logger Model PEL 105
6.1 installing DataView
When you purchase the instrument, the product package includes a USB thumb drive containing DataView program files To begin installation:
1. Insert the DataView thumb drive into an available USB port on your computer. If Autorun is enabled, an AutoPlay window appears on your screen. Click “Open folder to view files” to display the DataView folder. If Autorun is not enabled or allowed, use Windows Explorer to locate and open the USB drive labeled “DataView.”
2. When the DataView folder is open, find the file Setup.exe and double-click it to run the installation program.
3. The DataView setup screen appears.
Figure 31
In the upper left corner of the screen, choose the language version of DataView to install. In the lower left corner are the available installation options. In addition to the DataView software, you can select “Adobe Reader.” This links to the Adobe web site where you can download the latest version of Reader. This program is required to view DataView .pdf documents. The option DataView Update opens the AEMC website where you can check for the latest DataView software version releases. Similarly, Firmware Upgrades links to the website where you can check for new firmware updates for the PEL 105 (see § 8.1.2). Finally, User Manuals displays a printable .pdf file containing the documentation that accompanies DataView. (DataView also comes with a Help system that is installed with the program files.) To install DataView, select DataView in the Options list and click Install.
4. After a few moments the DataView InstallShield Wizard welcome screen appears.

Power & Energy Logger Model PEL 105 59
Figure 32
The InstallShield Wizard program leads you through the DataView installation process. To proceed, click Next.
5. Read the license agreement and indicate your acceptance by clicking “I accept the terms of the licenseagreement.” Then click Next.
6. At the Customer Information screen, enter your username and company name. Also choose whether thisinstallation is for all users of the computer, or just for your username. Click Next to proceed.
7. The next screen lets you select the DataView setup. If you choose Custom, you are prompted to select individualDataView components to install. To install the full DataView product, select Complete and then click Next.

60 Power & Energy Logger Model PEL 105
8. You are now prompted to select the Control Panel(s) you want to install.
Figure 33
Each AEMC product family has its own specially designed Control Panel. If you are performing a Complete install, by default all available Control Panels are selected. Control Panels take up disk space on the computer; so unless you have other types of AEMC instruments, we recommend that you select PEL and deselect the rest. You should also check the option PDF-XChange, which is a requirement if you plan to create .pdf versions of DataView reports.
After you finish selecting and deselecting Control Panels, click Next.
9. The InstallShield Wizard now informs you that the program is ready to install DataView. If you want to review anyof your previous selections, click the Back button to return to earlier screens. Otherwise, click Install to begininstallation.
10. The InstallShield Wizard installs DataView. During this process, a status bar displays the progress of theinstallation. During installation, you may see a warning message about installing DataView with your AEMCinstrument connected to the computer. If the instrument or USB cable is connected, disconnect it now. Thenclick OK to proceed.
11. After a few moments, a screen appears informing you that installation is complete. Click Finish to leave theInstallShield Wizard.
12. Close the DataView Setup screen. The DataView folder now appears on your computer desktop, within which
is the PEL Control Panel icon and the icon(s) for any other Control Panel(s) you have installed.

Power & Energy Logger Model PEL 105 61
6.2 the PEL control PanelClicking the DataView icon in the DataView folder on your desktop opens the core DataView program. Clicking the PEL
Control Panel icon opens the PEL Control Panel:
Figure 34
In general, core DataView features are for creating, viewing, editing, and storing DataView reports; while the PEL Control Panel is for connecting to, configuring, viewing measurements on, and downloading data from the instrument. You can access all DataView features through either the DataView icon or the Control Panel icon. For users who interact with PEL 100 series instruments, we recommend primarily using the PEL Control Panel. However, there are situations where using the core DataView icon may be more convenient for some users, such as when viewing multiple archived reports from different AEMC product families.
For further information about using the PEL Control Panel, consult the Help system that comes with the product. Access this Help by clicking the option Help in the PEL Control Panel’s menu bar at the top of the screen.
6.3 connecting to the computer
Before you can use the PEL Control Panel to communicate with your instrument, you must establish a connection between the instrument and the computer. There are six types of connections available:
USB cable connection
Bluetooth wireless connection
Wi-Fi direct connection
Ethernet point-to-point cable connection
Network connection via LAN or Wi-Fi
Network connection via IRD server

62 Power & Energy Logger Model PEL 105
To begin, ensure that you have installed DataView with the PEL Control Panel. Also ensure that the required communica-tion and connection drivers are installed on your computer. These drivers are installed as part of the DataView installation process.
After the instrument is successfully connected, consult the PEL Control Panel Help system for instructions about viewing real-time data on the instrument, downloading and viewing recorded sessions, creating DataView reports from the down-loaded data, and configuring the instrument.
6.3.1 usb
USB is typically used for connecting a single local instrument. A USB cable comes as part of the instrument’s product package. To begin the connection process:
1. Plug one end of the cable into the instrument, and the other end into an available USB port on the computer. Thefirst time the instrument is connected via USB, drivers will be installed. Wait for the drivers to finish installingbefore proceeding.
2. With the instrument connected, open the PEL Control Panel (see previous illustration).
3. In the menu bar at the top of the screen, select Instrument.
4. In the drop-down menu that appears, click the option Add an Instrument. This opens the Add an InstrumentWizard dialog box.
5. Select USB as the connection type, and complete the Add and Instrument dialog. If you need assistance, pressthe Help button.
Note that USB connection is always available and enables you to change instrument configuration settings at any time.
6.3.2 bluetooth
Bluetooth is a standard for wirelessly connecting devices over short distances. This is especially useful for connecting multiple local instruments to a computer, since unlike USB it does not require a physical connection port for each instru-ment. The PEL 105 includes built-in Bluetooth capability. To use this feature to connect to a computer, Bluetooth must be
enabled on the instrument. Check the Bluetooth LED. If it is OFF, press and hold it down until the LED lights up. Then release the button to enable Bluetooth.
Your computer must also be Bluetooth-enabled. Some computers have Bluetooth connectivity built in, while others require a Bluetooth-USB adapter. When this adapter is plugged into a USB port and configured with the appropriate driver, the computer can communicate via Bluetooth. When the computer is Bluetooth-ready, connect the instrument as follows:
1. Open the Bluetooth Devices dialog on your computer to pair the instrument with your computer. Differentoperating systems have different steps for opening this dialog, so consult your computer’s documentation forinstructions.
2. When the dialog is displayed, click Add a Device. A dialog box appears listing the locally available Bluetoothdevices. There may be several devices of varying types listed, depending on the location of your computer.
3. Find the instrument, which will appear listed by its Bluetooth name. This name consists of the prefix “PEL 105”plus any additional characters you add via the PEL Control Panel. Click the name.
4. You are prompted to enter a pairing code, which for PEL 105 instruments is always 0000. After you enter thecode, click Next.
5. A screen appears informing you that the instrument has been successfully connected with the computer. ClickClose to exit the screen.
6. Open the PEL Control Panel. In the menu bar at the top of the screen, select Instrument.
7. In the drop-down menu that appears, click the option Add an Instrument. This opens the Add an InstrumentWizard dialog box.
8. Select Bluetooth as the connection type, and complete the Add and Instrument dialog. If you need assistance,press the Help button.

Power & Energy Logger Model PEL 105 63
6.3.3 Wi-fi Direct connection
The PEL 105 can also connect via Wi-Fi, either directly to the computer or via a router (see § 6.3.6). To directly connect,
Wi-Fi must be enabled on the instrument. Check the Wi-Fi LED. If it is glowing steadily or blinking, Wi-Fi is enabled. If
it is OFF, press and hold it down until the LED lights up. Then release the button to enable Wi-Fi.
If you direct-connect to the instrument with Wi-Fi, your computer must also be Wi-Fi-enabled.
Before you can connect through the PEL Control Panel, you must create a connection between the computer and instru-ment in Microsoft Windows. A direct Wi-Fi connection requires the instrument’s SSID number and (if required) password, which you can define by connecting the instrument via USB cable, opening the Control Panel, and displaying the Configure dialog box, as instructed by the Control Panel Help. The Configure dialog box includes fields for setting Wi-Fi connection options.
When this connection is established, open the PEL Control Panel and complete the following steps:
1. In the menu bar at the top of the screen, select Instrument.
2. In the drop-down menu that appears, click the option Add an Instrument.
3. Select Wi-Fi direct as the connection type, and complete the Add and Instrument dialog. If you need assistance, press the Help button.
Note that during this process you will be prompted to select the instrument via its Wi-Fi IP address. Each PEL 105 comes
with a Wi-Fi IP address, which you can view by entering Information mode and pressing until the Wi-Fi address is displayed.
6.3.4 Point-to-Point Ethernet cable
Another connection option is Ethernet cable. To use this connection method, your computer must be equipped with an available Ethernet port. You must also have an Ethernet cable (purchased separately).
1. Plug one end of the Ethernet cable into the instrument, and the other end into the Ethernet port on the computer.
2. With the instrument connected, open the PEL Control Panel.
3. In the menu bar at the top of the screen, select Instrument.
4. In the drop-down menu that appears, click the option Add an Instrument. This opens the Add an Instrument Wizard dialog box.
5. Select Point-to-point Ethernet cable (APIPA mode) as the connection type, and complete the Add and Instrument dialog. If you need assistance, press the Help button.
Note that during this process you will be prompted to select the instrument’s IP address. Each PEL 105 has a default IP
address, which you can view by entering Information mode and pressing until the IP address is displayed.
6.3.5 Ethernet network via Lan or Wi-fi
The PEL Control Panel can connect to a PEL 105 through a network. To do this, the instrument must be connected to a network accessible to the computer. The network connection can be either via LAN or Wi-Fi router. Consult your network administrator if you need assistance with this. When this connection is established, open the PEL Control Panel. Then do the following:
1. In the menu bar at the top of the screen, select Instrument.
2. In the drop-down menu that appears, click the option Add an Instrument.
3. Select Ethernet (LAN or Wi-Fi) as the connection type, and complete the Add and Instrument dialog. If you need assistance, press the Help button.
Note that during this process you will be prompted to select the instrument’s IP address. Each PEL 105 has a default IP
address, which you can view by entering Information mode and pressing until the IP address is displayed. (The instrument can also automatically obtain an IP address from a DHCP server on the network to which it is connected.)

64 Power & Energy Logger Model PEL 105
6.3.6 network via irD server
An IRD server allows you to connect your computer to instruments on different networks. You must first connect the instru-ment to a network that can access the internet. Consult your network administrator if you need assistance with this. When this connection is established, open the PEL Control Panel. Then do the following:
1. In the menu bar at the top of the screen, select Instrument.
2. In the drop-down menu that appears, click the option Add an Instrument.
3. Select IRD server as the connection type, and complete the Add and Instrument dialog. If you need assistance,press the Help button.
Note that during this process you will be prompted to enter the instrument’s serial number and password. This information is provided on a label attached to the instrument when it first ships.
6.4 setting Date and time
As explained in Section 3.6, you can view the instrument’s date and time in Information mode, but you cannot change this information through the instrument’s interface. To change the instrument’s date/time, open the PEL Control Panel and do the following:
1. Ensure that the instrument is connected by checking its status in the PEL Network frame (a green check markappears next to its name). If not, reconnect it by highlighting the instrument, selecting Instrument in the menubar, and clicking Reconnect Instrument.
2. Select the instrument, and click Instrument in the menu bar.
3. Select Configure. This displays the Configure Instrument dialog box.
4. Click the Set Clock button. This displays a dialog for setting the date and time on the instrument.
5. You can synchronize the instrument’s clock with the computer’s clock, or use the Date and Time fields to selectanother date and time.
6. Click OK to save the change.
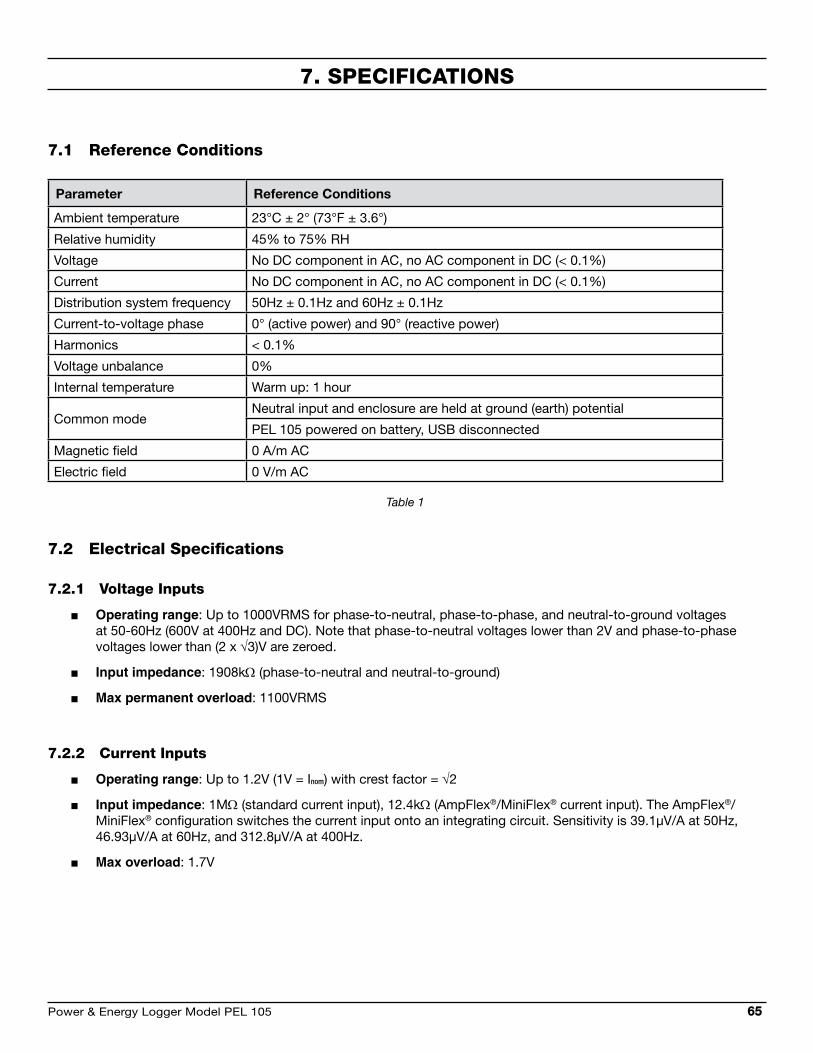
Power & Energy Logger Model PEL 105 65
7. sPEcifications
7.1 reference conditions
Parameter Reference Conditions
Ambient temperature 23°C ± 2° (73°F ± 3.6°)
Relative humidity 45% to 75% RH
Voltage No DC component in AC, no AC component in DC (< 0.1%)
Current No DC component in AC, no AC component in DC (< 0.1%)
Distribution system frequency 50Hz ± 0.1Hz and 60Hz ± 0.1Hz
Current-to-voltage phase 0° (active power) and 90° (reactive power)
Harmonics < 0.1%
Voltage unbalance 0%
Internal temperature Warm up: 1 hour
Common modeNeutral input and enclosure are held at ground (earth) potential
PEL 105 powered on battery, USB disconnected
Magnetic field 0 A/m AC
Electric field 0 V/m AC
Table 1
7.2 Electrical specifications
7.2.1 Voltage inputs
Operating range: Up to 1000VRMS for phase-to-neutral, phase-to-phase, and neutral-to-ground voltages at 50-60Hz (600V at 400Hz and DC). Note that phase-to-neutral voltages lower than 2V and phase-to-phase voltages lower than (2 x √3)V are zeroed.
Input impedance: 1908kΩ (phase-to-neutral and neutral-to-ground)
Max permanent overload: 1100VRMS
7.2.2 current inputs
Operating range: Up to 1.2V (1V = Inom) with crest factor = √2
Input impedance: 1MΩ (standard current input), 12.4kΩ (AmpFlex®/MiniFlex® current input). The AmpFlex®/MiniFlex® configuration switches the current input onto an integrating circuit. Sensitivity is 39.1µV/A at 50Hz, 46.93µV/A at 60Hz, and 312.8µV/A at 400Hz.
Max overload: 1.7V

66 Power & Energy Logger Model PEL 105
7.2.3 Measurement ranges
7.2.3.1 Measurement specifications at 50/60Hz
Quantity Unit Measurement range Accuracy
Frequency (f) Hz 42.5 to 69Hz ± 0.1Hz
Phase-to-Neutral volt-age (V)
V 10 to 1000V ± (0.2% Rdg + 0.2V)
Neutral-to-Ground/Earth voltage (VPE)
V 10 to 1000V ± (0.2% Rdg + 0.2V)
Phase-to-phase voltage (U)
V 17 to 1000V ± (0.2% Rdg + 0.4V)
Current (I) A 0.2 to 120% Inom ± (0.2% Rdg + 0.02% Inom)
Neutral current (IN) A 0.2 to 120% Inom ± (0.2% Rdg + 0.02% Inom)
Active Power (P) W
PF = 1V = 100 to 1000VI = 5 to 120% Inom
± (0.5% Rdg + 0.005% Pnom)
PF = 0.5 inductive 0.8 capacitiveV = 100 to 1000VI = 5 to 120% Inom
± (0.7% Rdg + 0.007% Pnom)
Reactive Power (Q) var
Sin ϕ = 1V = 100 to 1000VI = 5 to 120% Inom
± (1% Rdg + 0.01% Qnom)
Sin ϕ = 0.5 inductive; 0.5 capacitiveV = 100 to 1000VI = 5 to 120% Inom
± (1.5% Rdg + 0.01% Qnom)
Sin ϕ = 0.25 inductive; 0.25 capacitiveV = 100 to 1000VI = 10 to 120% Inom
± (1.5% Rdg + 0.015% Qnom)
Apparent Power (S) VAV = 100 to 1000VI = 5 to 120% Inom
± (0.5% Rdg + 0.005% Snom)
Power Factor (PF) -
PF = 0.5 inductive; 0.5 capacitiveV = 100 to 1000VI = 5 to 120% Inom
± 0.05
PF = 0.2 inductive; 0.2 capacitiveV = 100 to 1000VI = 5 to 120% Inom
± 0.1
Tan ϕ -
Tan ϕ = √3 inductive; √3 capacitiveV = 100 to 1000VI = 5 to 120% Inom
± 0.02
Tan ϕ = 3.2 inductive; 3.2 capacitiveV = 100 to 1000VI = 5 to 120% Inom
± 0.05

Power & Energy Logger Model PEL 105 67
Active energy (EP) Wh
PF = 1V = 100 to 1000VI = 5 to 120% Inom
± 0.5% Rdg
PF = 0.5 inductive; 0.8 capacitiveV = 100 to 1000VI = 10 to 120% Inom
± 0.7% Rdg
Reactive energy (EQ) varh
Sin ϕ = 1V = 100 to 1000VI = 5 to 120% Inom
± 2% Rdg
Sin ϕ = 0.5 inductive; 0.5 capacitiveV = 100 to 1000VI = 5 to 120% Inom
± 2.5% Rdg
Apparent energy (ES) VAhV = 100 to 1000VI = 5 to 120% Inom
± 0.5% Rdg
Fundamental Harmonic Distortion Rate (THDF)
%fV = 100 to 1000VI = 10 to 120% Inom
± 1% Rdg
In the preceding table:
Rdg = Reading (displayed value).
Inom is the nominal current of the selected current probe.
Pnom and Snom are the Active Power and the Apparent Power for V = 1000V, I = Inom, and PF = 1.
Qnom is the Reactive Power for V = 1000V, I = Inom, and Sin ϕ = 1.
The uncertainty for input current (I) is specified for an isolated input voltage of 1V = Inom. The accuracy of the connected current probe should be added to this uncertainty to determine the total uncertainty. For MiniFlex® and AmpFlex® probes, the uncertainty of current input (I) is not specified.
When there is no current probe, the uncertainty for neutral current IN is the sum of the uncertainties on I1, I2, and I3.
Table 2
7.2.3.2 Measurement specifications at 400Hz
Quantity Unit Measurement range Accuracy
Frequency (F) Hz 340 to 460Hz ± 0.3Hz
Phase-to-Neutral volt-age (V)
V 5 to 600V ± (0.2% Rdg + 0.5V)
Neutral-to-Ground/Earth voltage (VPE)
V 4 to 600V ± (0.2% Rdg + 0.5V)
Phase-to-phase voltage (U)
V 10 to 600V ± (0.2% Rdg + 0.5V)
Current (I) A 0.2 to 120% Inom ± (0.5% Rdg + 0.05% Inom)
Neutral current (IN) A 0.2 to 120% Inom ± (0.5% Rdg + 0.05% Inom)
Active Power (P) W
PF = 1V = 100 to 600VI = 5 to 120% Inom
± (2% Rdg + 0.2% Pnom)
PF = 0.5 inductive 0.8 capacitiveV = 100 to 600VI = 5 to 120% Inom
± (3% Rdg + 0.3% Pnom)
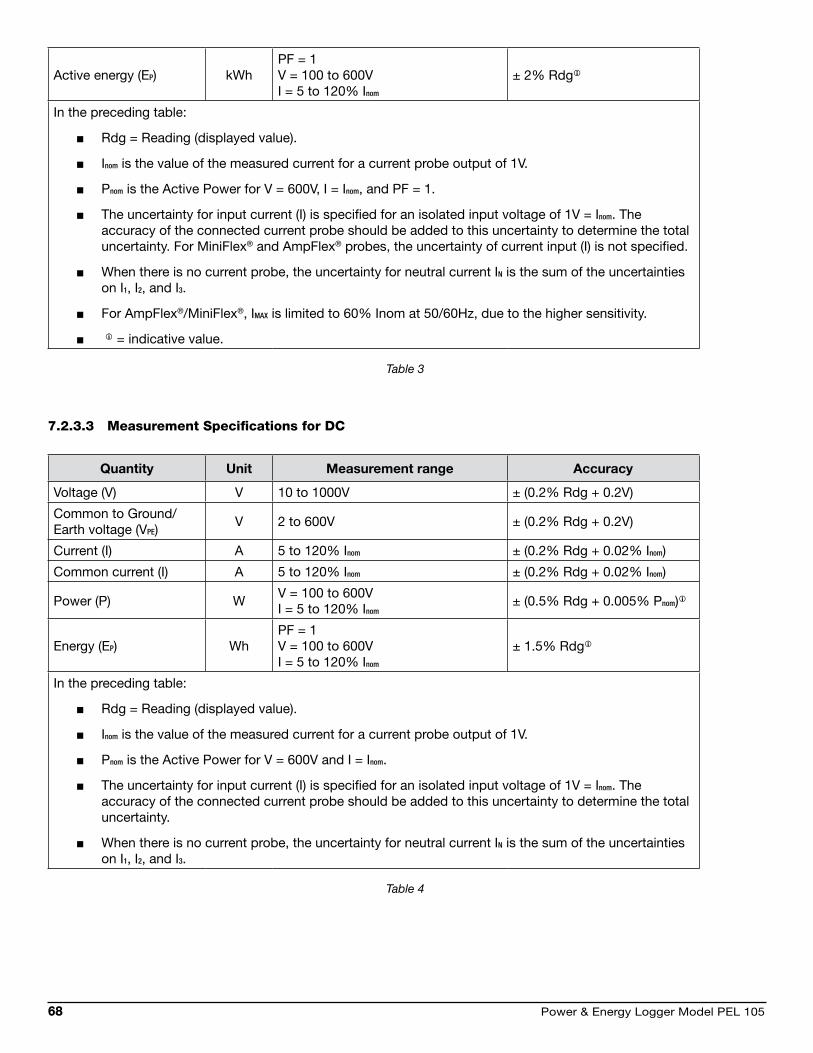
68 Power & Energy Logger Model PEL 105
Active energy (EP) kWhPF = 1V = 100 to 600VI = 5 to 120% Inom
± 2% Rdg
In the preceding table:
Rdg = Reading (displayed value).
Inom is the value of the measured current for a current probe output of 1V.
Pnom is the Active Power for V = 600V, I = Inom, and PF = 1.
The uncertainty for input current (I) is specified for an isolated input voltage of 1V = Inom. The accuracy of the connected current probe should be added to this uncertainty to determine the total uncertainty. For MiniFlex® and AmpFlex® probes, the uncertainty of current input (I) is not specified.
When there is no current probe, the uncertainty for neutral current IN is the sum of the uncertainties on I1, I2, and I3.
For AmpFlex®/MiniFlex®, IMAX is limited to 60% Inom at 50/60Hz, due to the higher sensitivity.
= indicative value.
Table 3
7.2.3.3 Measurement specifications for Dc
Quantity Unit Measurement range Accuracy
Voltage (V) V 10 to 1000V ± (0.2% Rdg + 0.2V)
Common to Ground/Earth voltage (VPE)
V 2 to 600V ± (0.2% Rdg + 0.2V)
Current (I) A 5 to 120% Inom ± (0.2% Rdg + 0.02% Inom)
Common current (I) A 5 to 120% Inom ± (0.2% Rdg + 0.02% Inom)
Power (P) WV = 100 to 600VI = 5 to 120% Inom
± (0.5% Rdg + 0.005% Pnom)
Energy (EP) WhPF = 1V = 100 to 600VI = 5 to 120% Inom
± 1.5% Rdg
In the preceding table:
Rdg = Reading (displayed value).
Inom is the value of the measured current for a current probe output of 1V.
Pnom is the Active Power for V = 600V and I = Inom.
The uncertainty for input current (I) is specified for an isolated input voltage of 1V = Inom. The accuracy of the connected current probe should be added to this uncertainty to determine the total uncertainty.
When there is no current probe, the uncertainty for neutral current IN is the sum of the uncertainties on I1, I2, and I3.
Table 4

Power & Energy Logger Model PEL 105 69
7.2.3.4 temperature
For V, U, I, P, Q, S, and energies:
300 ppm/°C, with 5% < I < 120% and PF=1
500 ppm/°C, with 10% < I < 120% and PF= 0.5 inductive
DC offset (V and I):
10 mV/°C typical
30 ppm x Inom/°C typical
7.2.3.5 common Mode rejection
The common mode rejection ratio on neutral input is 140dB typical. For example, a voltage of 110V applied on the neutral input will add 11µV to AmpFlex®/MiniFlex® values. This is a 230mA error at 60Hz. A voltage of 110V applied on the neutral input will add 11µV to other current probes values, an additional error of 0.01% Inom.
7.2.4 current Probe specifications
7.2.4.1 current Probes with 1V output
The following currents probe uncertainties do not include instrument uncertainties. The numbers listed below should be added to the uncertainties listed in Tables 2, 3, and 4 to calculate total uncertainty when using the instrument with a spe-cific probe.
ModelI nominal of the range
Measurement current range
AccuracyMaximum
phase error at 50/60Hz
Typical phase error at 50/60Hz
Typical phase error
at 400Hz
J93 3500AAC 5000ADC
50 to 250A ± (2% Rdg + 2.5A) ± 3° - -
250 to 500A ± (1.5% Rdg + 2.5A) ± 2° - -
500 to 3500A ± 1% Rdg ± 1.5° - -
3500 to 5000A(DC only)
± 1% Rdg - - -
SR193 1000AAC
1 to 50A ± 1% Rdg - - -
50 to 100A ± 0.5% Rdg ± 1° +0.25° +0.1° @ 1000A100 to 1200A ± 0.3% Rdg ± 0.7° +0.2°
MN93 200AAC
0.5 to 5A ± (3% Rdg + 1A) - - -
5 to 40A ± (2.5% Rdg + 1A) ± 5° ± 2° -1.5° @ 40A
40 to 100A ± (2% Rdg + 1A) ± 3° ± 1.2°-0.8°
@ 100A
100 to 240A ± (1% Rdg + 1A) ± 2.5° ± 0.8° -1° @ 200A
MN193
100AAC
200mA to 5A ± (1% Rdg + 2mA) ± 4° - -
5 to 120A ± 1% Rdg ± 2.5° + 0.75°-0.5°
@100A
5AAC5 to 250mA ± (1.5% Rdg + 0.1mA) - - -
250mA to 6A ± 1% Rdg ± 5° + 1.7° -0.5° @ 5A
5A Adapter 5AAC
5 to 250mA ± (0.5% Rdg +2mA) ± 0.5°- -
250mA to 6A ± (0.5% Rdg +1mA) ± 0.5°
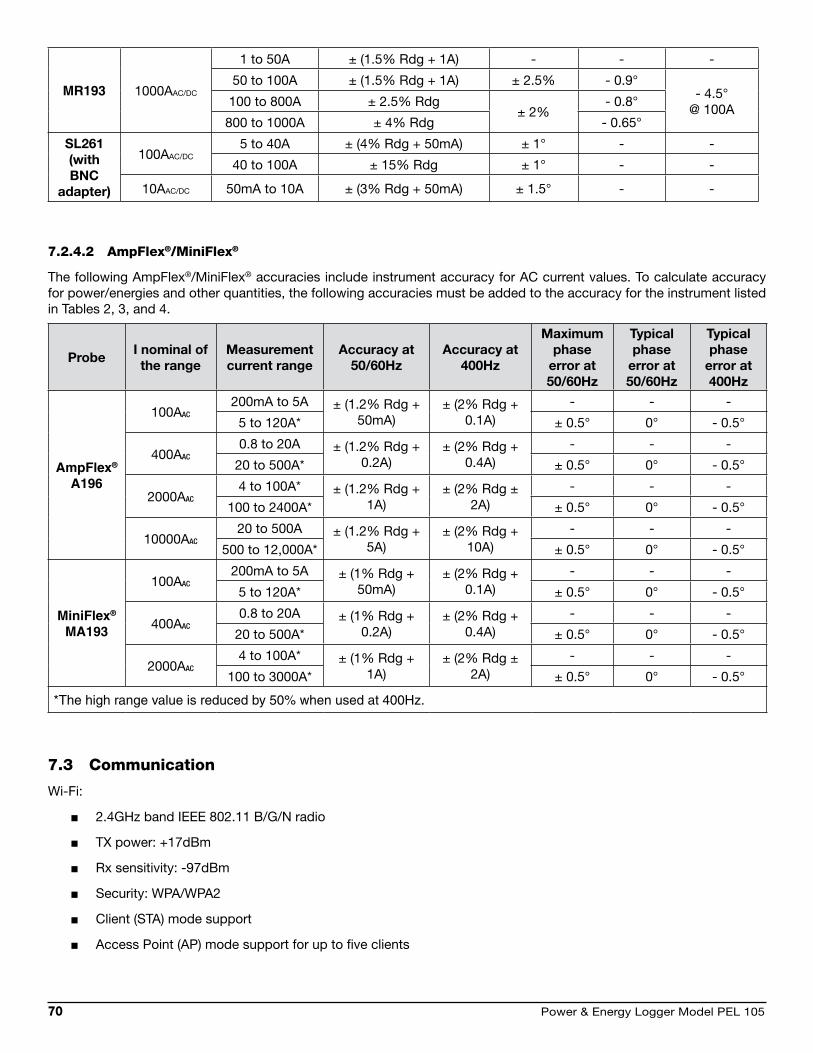
70 Power & Energy Logger Model PEL 105
MR193 1000AAC/DC
1 to 50A ± (1.5% Rdg + 1A) - - -
50 to 100A ± (1.5% Rdg + 1A) ± 2.5% - 0.9°- 4.5°
@ 100A100 to 800A ± 2.5% Rdg
± 2%- 0.8°
800 to 1000A ± 4% Rdg - 0.65°
SL261 (with BNC
adapter)
100AAC/DC5 to 40A ± (4% Rdg + 50mA) ± 1° - -
40 to 100A ± 15% Rdg ± 1° - -
10AAC/DC 50mA to 10A ± (3% Rdg + 50mA) ± 1.5° - -
7.2.4.2 ampflex®/Miniflex®
The following AmpFlex®/MiniFlex® accuracies include instrument accuracy for AC current values. To calculate accuracy for power/energies and other quantities, the following accuracies must be added to the accuracy for the instrument listed in Tables 2, 3, and 4.
ProbeI nominal of the range
Measurement current range
Accuracy at 50/60Hz
Accuracy at 400Hz
Maximum phase
error at 50/60Hz
Typical phase
error at 50/60Hz
Typical phase
error at 400Hz
AmpFlex® A196
100AAC200mA to 5A ± (1.2% Rdg +
50mA)± (2% Rdg +
0.1A)- - -
5 to 120A* ± 0.5° 0° - 0.5°
400AAC0.8 to 20A ± (1.2% Rdg +
0.2A)± (2% Rdg +
0.4A)- - -
20 to 500A* ± 0.5° 0° - 0.5°
2000AAC4 to 100A* ± (1.2% Rdg +
1A)± (2% Rdg ±
2A)- - -
100 to 2400A* ± 0.5° 0° - 0.5°
10000AAC20 to 500A ± (1.2% Rdg +
5A)± (2% Rdg +
10A)- - -
500 to 12,000A* ± 0.5° 0° - 0.5°
MiniFlex®
MA193
100AAC200mA to 5A ± (1% Rdg +
50mA)± (2% Rdg +
0.1A)- - -
5 to 120A* ± 0.5° 0° - 0.5°
400AAC0.8 to 20A ± (1% Rdg +
0.2A)± (2% Rdg +
0.4A)- - -
20 to 500A* ± 0.5° 0° - 0.5°
2000AAC4 to 100A* ± (1% Rdg +
1A)± (2% Rdg ±
2A)- - -
100 to 3000A* ± 0.5° 0° - 0.5°
*The high range value is reduced by 50% when used at 400Hz.
7.3 communication
Wi-Fi:
2.4GHz band IEEE 802.11 B/G/N radio
TX power: +17dBm
Rx sensitivity: -97dBm
Security: WPA/WPA2
Client (STA) mode support
Access Point (AP) mode support for up to five clients

Power & Energy Logger Model PEL 105 71
Network:
RJ 45 connector with two integrated LEDs
Ethernet:
100 Base T
Bluetooth 2.1, Class 1
Range: up to 100m (approximately 328’) line-of-sight
Default pairing code: 0000
Nominal output power: +15dBm
Nominal sensitivity: -82dBm
Rate: 115Kbits/s
USB 2.0, Type B connector
7.4 Power consumption
Phase power via voltage measurement terminals, overvoltage Category 4 ground (earth) connection. Operating range: 100 to 1000V (±10%) @ 42.5 to 69Hz, 100 to 600V (± 10%) @ 340 to 460Hz.
Maximum power: 30VA, 140 to 1000VDC
Rechargeable NiMH battery, charge time approximately 5 hours, recharge temperature -20° to 55°C (-4° to 140°F), provides approximately one hour standalone operation without Bluetooth or Wi-Fi running. The battery is designed to last through at least 1000 recharge-discharge cycles over two years.
Battery life: 1 hour without Bluetooth or Wi-Fi activated.
External AC power input: 15VDC.
Note that the internal clock is maintained for 20 days with the isntrument powered down.
7.5 Physical
Weight: approximately 4kg (8.8lb)
Dimensions: - Depth: 245mm (9.65") - Width: 270mm (10.6"), 320mm (12.6") with leads connected - Height: 180mm (7.1")
LCD: 107 by 84mm (4.2 by 3.3")
Inputs: four current, five voltage
Drop test: 20cm (approximately 8") in the most severe position without permanent mechanical damage and functional deterioration.
Resistance to sunlight: Complies with the sunlight, UV, and water resistance requirements of UL 746C (f1).
Degrees of protection provided by enclosure (IP code) according to IEC 60529: - IP67 when the cover is closed in any position and under operating conditions when terminals are mated or
capped and the AmplFlex A196 connectors are screwed tight. - IP54 with caps when the cover is open in the horizontal position and under operating conditions. - IP40 without caps when the cover is open in the horizontal position and under operating conditions.

72 Power & Energy Logger Model PEL 105
7.6 Environmental
Temperature and Relative Humidity (RH):
Reference Temperature: 68 to 78.8°F (20 to 26°C) from 45 to 75% RH
Operating Temperature: 32 to 108.5°F (0 to 42.5°C) from 10 to 85% RH32 to 122°F (0 to 50°C) from 45 to 75% RH
Storage Temperature:
With batteries: -4 to 95°F (-20 to 35°C) from 0 to 95% RH-4 to 122°F (-20 to 50°C) from 0 to 75% RH
Without batteries: N/A
Recharging Temperature: N/A
Altitude:
Operating altitude: 0 to 2000m (0 to approximately 6600 ft)
Storage altitude: 0 to 10000m (0 to approximately 6.2 miles)
7.7 Electrical safety
The instrument complies with IEC 61010-1:Ed3 and IEC 61010-2-030:Ed1 for the followings: 1000V Category IV, pollution degree 4 in closed position. (pollution degree 3 with cover open)
The current probes comply with IEC 61010-2-032.
The test leads and alligator clips comply with IEC 61010-031.
Note that the overall rated voltage and the measurement category of the instrument/probe system may be reduced depending on the current probe type or other accessories.
The instrument is protected internally by 1000V fuses against excessive current being drawn from the phase power supply due to faulty equipment or transient overvoltages. These fuses can only be replaced by authorized AEMC service personnel.
7.8 Electromagnetic compatibility
Immunity: Complies with IEC 61326-1. Immunity test requirements are for equipment intended for use in industrial locations.
With MiniFlex® and AmpFlex® probes, the typical influence is 0.5% of full scale with a maximum of 5A.
7.9 Memory card
The PEL 105 accepts FAT32 formatted SD and SDHC cards with up to 32GB capacity.
7.10 current Probes and sensors
The following tables provide specifications for the AmpFlex® Model A196-24-BK and all other supported probes and sensors. Note that only the A196-24-BK carries an IP67 rating.
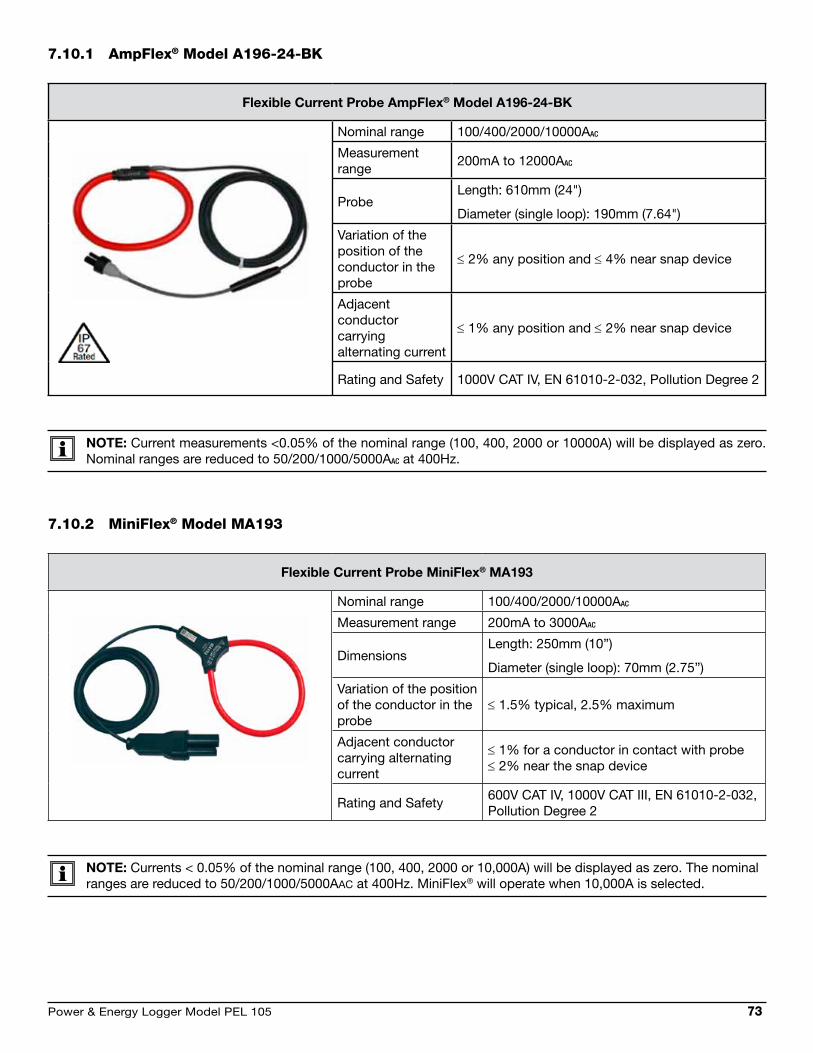
Power & Energy Logger Model PEL 105 73
7.10.1 ampflex® Model a196-24-bK
Flexible Current Probe AmpFlex® Model A196-24-BK
Nominal range 100/400/2000/10000AAC
Measurement range
200mA to 12000AAC
ProbeLength: 610mm (24")
Diameter (single loop): 190mm (7.64")
Variation of the position of the conductor in the probe
≤ 2% any position and ≤ 4% near snap device
Adjacent conductor carrying alternating current
≤ 1% any position and ≤ 2% near snap device
Rating and Safety 1000V CAT IV, EN 61010-2-032, Pollution Degree 2
NOTE: Current measurements <0.05% of the nominal range (100, 400, 2000 or 10000A) will be displayed as zero. Nominal ranges are reduced to 50/200/1000/5000AAC at 400Hz.
7.10.2 Miniflex® Model Ma193
Flexible Current Probe MiniFlex® MA193
Nominal range 100/400/2000/10000AAC
Measurement range 200mA to 3000AAC
DimensionsLength: 250mm (10”)
Diameter (single loop): 70mm (2.75”)
Variation of the position of the conductor in the probe
≤ 1.5% typical, 2.5% maximum
Adjacent conductor carrying alternating current
≤ 1% for a conductor in contact with probe≤ 2% near the snap device
Rating and Safety600V CAT IV, 1000V CAT III, EN 61010-2-032, Pollution Degree 2
NOTE: Currents < 0.05% of the nominal range (100, 400, 2000 or 10,000A) will be displayed as zero. The nominal ranges are reduced to 50/200/1000/5000AAC at 400Hz. MiniFlex® will operate when 10,000A is selected.

74 Power & Energy Logger Model PEL 105
7.10.3 Model J93
Clamp-On AC/DC Current Probe Model J93
Nominal range3500AAC 5000ADC
Measurement range50 to 3500AAC 50 to 5000ADC
Maximum conductor size
72mm (2.84”) diameter
Variation of the position of the conductor in the probe
≤ 2%
Adjacent conductor carrying alternating current
≤ 35dB typical, DC to 2kHz
Rating and Safety600V CAT IV, 1000V CAT III, IEC 61010-2-032, Pollution Degree 2
Battery9V alkaline (battery life 70 hours; typical consumption 11mA)
7.10.4 Model Mr193-bK
Clamp-On AC/DC Current Probe Model MR193-BK
Nominal range 1000AAC, 1400ADC max
Measurement range 1 to 1000AAC, 1 to 1300A peak AC+DC
Maximum conductor size
One 42mm (1.6”) or two 25.4mm (0.98”) cables
Two bus bars 50 x 5mm (1.96 x 0.19”)
Variation of the position of the conductor in the probe
< 0.5% DC to 440Hz
Adjacent conductor carrying alternating current
< 10mA/A at 50/60Hz
Rating and Safety300V CAT IV, 600V CAT III, EN 61010-2-032, Pollution Degree 2
Battery9V alkaline (battery life 70 hours; typical consumption 11mA)
NOTE: Currents < 1AAC/DC will be displayed as zero.

Power & Energy Logger Model PEL 105 75
7.10.5 Model Mn93-bK
Clamp-On AC Current Probe Model MN93-BK
Nominal range 200AAC for f ≤1kHz
Measurement range 0.5 to 240AAC max (I >200A not permanent)
Maximum conductor size
20mm (0.8”) diameter
Variation of the position of the conductor in the probe
< 0.5% at 50/60Hz
Adjacent conductor carrying alternating current
≤ 15mA/A
Rating and Safety300V CAT IV, 600V CAT III, EN 61010-2-032, Pollution Degree 2
NOTE: Currents < 0.1A will be displayed as zero.
7.10.6 Model sr193-bK
Clamp-On AC Current Probe Model SR193-BK
Nominal range 1000AAC for f ≤1kHz
Measurement range 1 to 1200AAC max (I >1000A not continuously)
Maximum conductor size
52mm (2”) diameter
Variation of the position of the conductor in the probe
< 0.5% DC to 440Hz
Adjacent conductor carrying alternating current
< 10mA/A at 50/60Hz
Rating and Safety600V CAT IV, 1000V CAT III, EN 61010-2-032, Pollution Degree 2
NOTE: Currents < 0.5A will be displayed as zero.
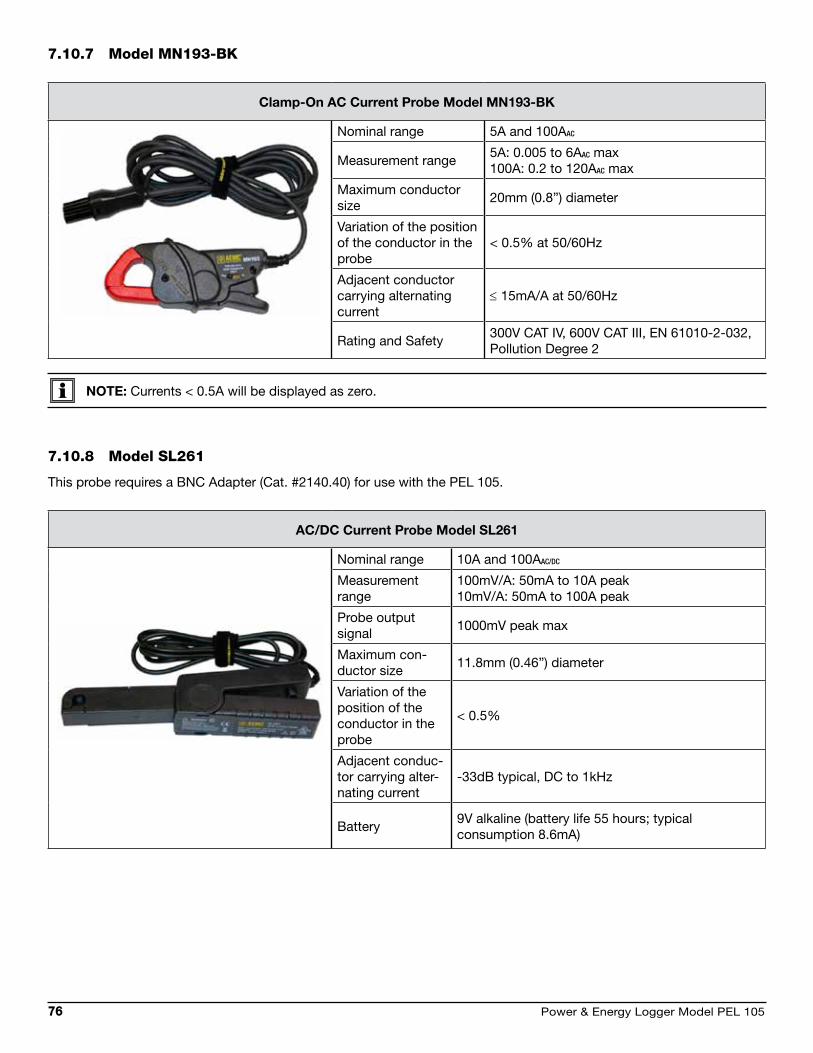
76 Power & Energy Logger Model PEL 105
7.10.7 Model Mn193-bK
Clamp-On AC Current Probe Model MN193-BK
Nominal range 5A and 100AAC
Measurement range5A: 0.005 to 6AAC max100A: 0.2 to 120AAC max
Maximum conductor size
20mm (0.8”) diameter
Variation of the position of the conductor in the probe
< 0.5% at 50/60Hz
Adjacent conductor carrying alternating current
≤ 15mA/A at 50/60Hz
Rating and Safety300V CAT IV, 600V CAT III, EN 61010-2-032, Pollution Degree 2
NOTE: Currents < 0.5A will be displayed as zero.
7.10.8 Model sL261
This probe requires a BNC Adapter (Cat. #2140.40) for use with the PEL 105.
AC/DC Current Probe Model SL261
Nominal range 10A and 100AAC/DC
Measurement range
100mV/A: 50mA to 10A peak10mV/A: 50mA to 100A peak
Probe output signal
1000mV peak max
Maximum con-ductor size
11.8mm (0.46”) diameter
Variation of the position of the conductor in the probe
< 0.5%
Adjacent conduc-tor carrying alter-nating current
-33dB typical, DC to 1kHz
Battery9V alkaline (battery life 55 hours; typical consumption 8.6mA)
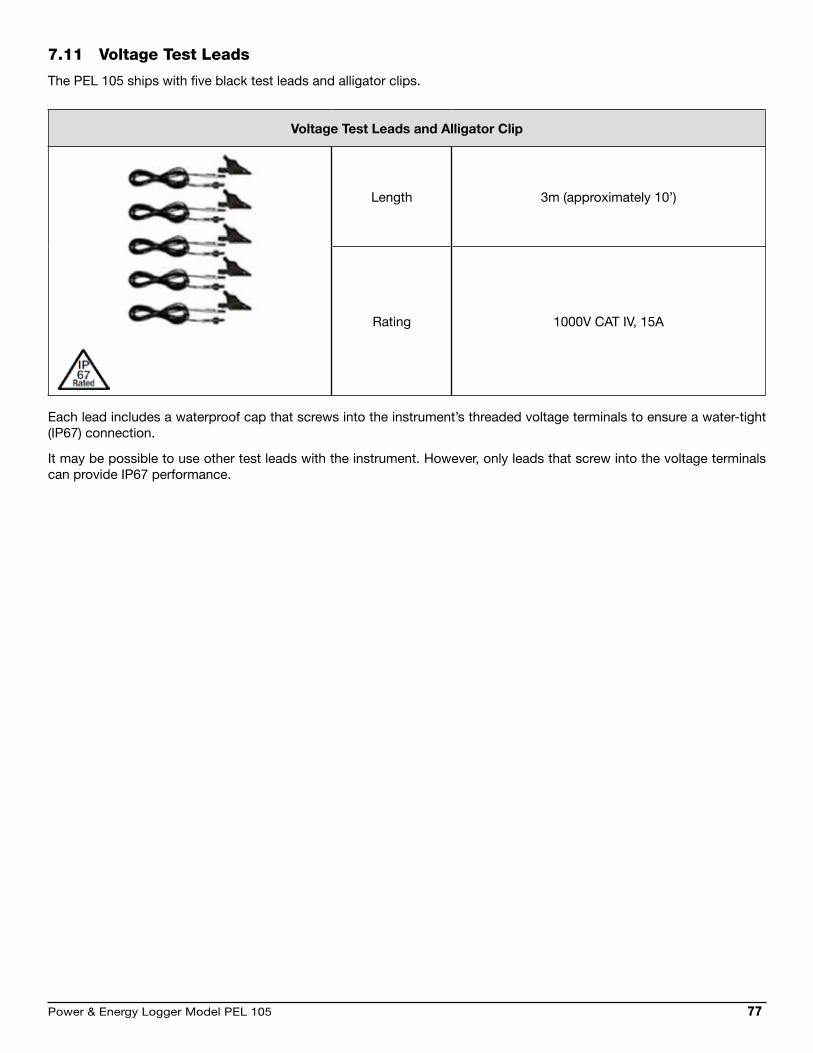
Power & Energy Logger Model PEL 105 77
7.11 Voltage test Leads
The PEL 105 ships with five black test leads and alligator clips.
Voltage Test Leads and Alligator Clip
Length 3m (approximately 10’)
Rating 1000V CAT IV, 15A
Each lead includes a waterproof cap that screws into the instrument’s threaded voltage terminals to ensure a water-tight (IP67) connection.
It may be possible to use other test leads with the instrument. However, only leads that screw into the voltage terminals can provide IP67 performance.

78 Power & Energy Logger Model PEL 105
8. MaintEnancE & troubLEsHootinG
There are several routine maintenance tasks you should perform periodically to ensure optimal operation of your instru-ment. In addition, the instrument may exhibit unexpected behavior that requires troubleshooting.
This chapter explains procedures you can perform to maintain the instrument and correct issues you may encounter.
8.1 Maintenance
Instrument maintenance tasks include:
Erasing and upgrading the SD card
Upgrading to the latest firmware revision
Maintaining the batteries
Cleaning the instrument
The following sections explain how to perform these tasks.
8.1.1 Erasing and upgrading Memory
When the SD card LED either (1) blinks alternately red and green, or (2) blinks green once per second, the SD card is either full or does not have enough remaining space to store the scheduled or in-progress recording session. In either case, you must erase the SD card to ensure sufficient storage capacity for future recordings. This is done via an option in the PEL Control Panel.
NOTE: Erasing the SD card deletes all the records stored in memory. To save one or more recording sessions, you must download the session(s) to the computer.
You can remove the 8GB SD card that comes with the instrument and replace it with an SD card with up to 32GB storage. To do this:
1. Remove the existing SD card from the instrument by pressing down and then releasing it. The card will pop up, allowing you to pull it from the card slot.
2. Check the replacement card to ensure its write-protect sliding tab is in the “unlock” position (towards the metal contacts).
3. Insert the SD card into the slot, with the metal contacts facing towards the top of the card.
4. Press the SD card into the slot until it clicks in place.
5. If necessary, format the card by connecting the instrument to a computer running the PEL Control Panel and selecting the Format SD Card option.
When the new card is ready for storing recordings; the LED glows steady green.
8.1.2 upgrading firmware
Periodically AEMC may release new firmware for the PEL 105. This firmware controls the features and functionality of the instrument.
We recommend checking for firmware upgrades on a regular basis, to ensure your instrument has the most current version. The easiest way to do this is from the PEL Control Panel. The Help menu in the Control Panel includes the option Update. When you click this option, the Control Panel automatically checks to ensure you have the latest version of firmware, and displays a message informing you whether or not your firmware is up to date.
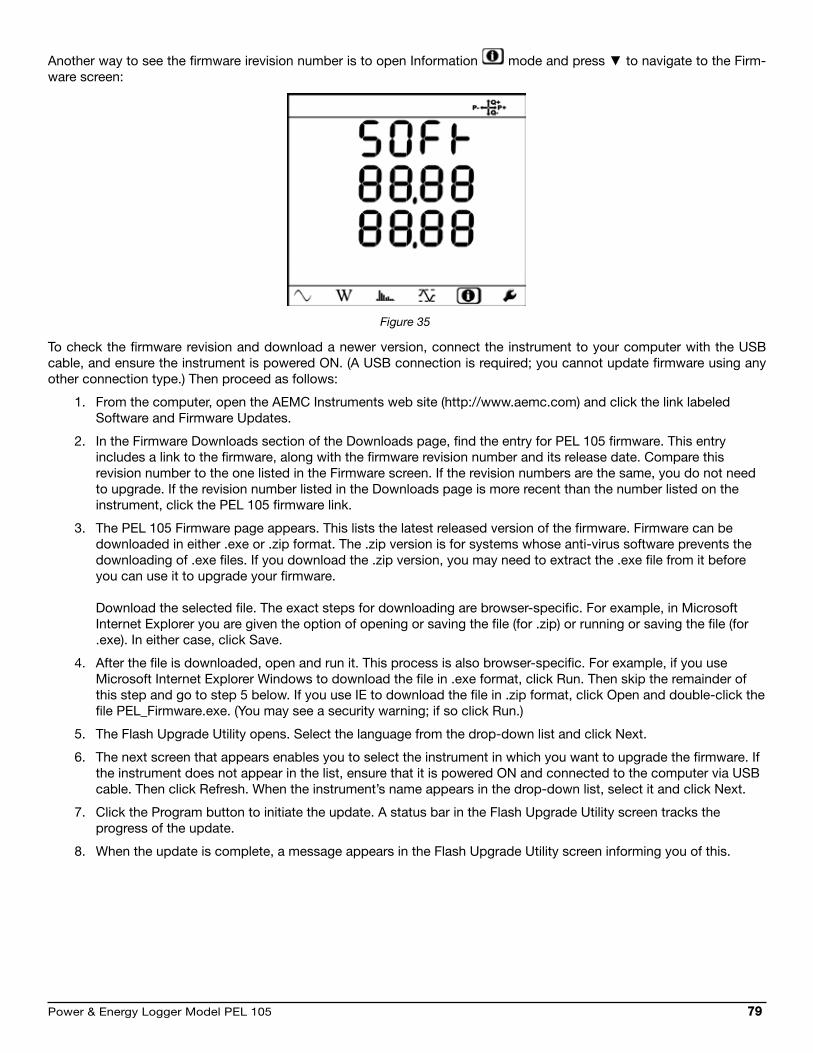
Power & Energy Logger Model PEL 105 79
Another way to see the firmware irevision number is to open Information mode and press to navigate to the Firm-ware screen:
Figure 35
To check the firmware revision and download a newer version, connect the instrument to your computer with the USB cable, and ensure the instrument is powered ON. (A USB connection is required; you cannot update firmware using any other connection type.) Then proceed as follows:
1. From the computer, open the AEMC Instruments web site (http://www.aemc.com) and click the link labeledSoftware and Firmware Updates.
2. In the Firmware Downloads section of the Downloads page, find the entry for PEL 105 firmware. This entryincludes a link to the firmware, along with the firmware revision number and its release date. Compare thisrevision number to the one listed in the Firmware screen. If the revision numbers are the same, you do not needto upgrade. If the revision number listed in the Downloads page is more recent than the number listed on theinstrument, click the PEL 105 firmware link.
3. The PEL 105 Firmware page appears. This lists the latest released version of the firmware. Firmware can bedownloaded in either .exe or .zip format. The .zip version is for systems whose anti-virus software prevents thedownloading of .exe files. If you download the .zip version, you may need to extract the .exe file from it beforeyou can use it to upgrade your firmware.
Download the selected file. The exact steps for downloading are browser-specific. For example, in MicrosoftInternet Explorer you are given the option of opening or saving the file (for .zip) or running or saving the file (for.exe). In either case, click Save.
4. After the file is downloaded, open and run it. This process is also browser-specific. For example, if you useMicrosoft Internet Explorer Windows to download the file in .exe format, click Run. Then skip the remainder ofthis step and go to step 5 below. If you use IE to download the file in .zip format, click Open and double-click thefile PEL_Firmware.exe. (You may see a security warning; if so click Run.)
5. The Flash Upgrade Utility opens. Select the language from the drop-down list and click Next.
6. The next screen that appears enables you to select the instrument in which you want to upgrade the firmware. Ifthe instrument does not appear in the list, ensure that it is powered ON and connected to the computer via USBcable. Then click Refresh. When the instrument’s name appears in the drop-down list, select it and click Next.
7. Click the Program button to initiate the update. A status bar in the Flash Upgrade Utility screen tracks theprogress of the update.
8. When the update is complete, a message appears in the Flash Upgrade Utility screen informing you of this.

80 Power & Energy Logger Model PEL 105
8.1.3 battery Maintenance
The instrument is equipped with a NiMH battery, which provides approximately one hour of power. After prolonged stor-age, the battery may be completely discharged. If so, it must be completely charged. This requires approximately 5 hours. (See § 3.2.)
To make the best possible use of your battery and extend its effective service life:
Only charge the battery at temperatures between -20° and 55°C (-4° and 140°F).
Comply with the instrument usage and storage conditions defined in § 1.
Note that you cannot change the battery. This must be done at an authorized AEMC Service Center as part of the instru-ment’s regular maintenance.
8.1.4 cleaning the instrument
The instrument should be cleaned periodically. This keeps the LCD clear and easily viewable, and also prevents dirt and grease buildup around the instrument’s buttons and input terminals.
CAUTION! Risk of Electric Shock.
Before cleaning, disconnect all input(s) to prevent possible electric shock.
The body of the instrument should be cleaned with a damp and soapy cloth. Do not submerge the instrument in water. Do not use solvent.
8.2 troubleshooting
This section describes how to correct several potential issues you may encounter. These include:
The instrument does not turn ON when you press the Power button.
The instrument turns ON but does not function.
You cannot configure settings through the instrument’s front panel interface.
You cannot start a recording session.
Recording sessions end before the specified end date and time.
You cannot connect to a computer.
The instrument does not turn OFF when you press .
The following sections explain some of the possible causes for these issues and how you can address them. If you perform these troubleshooting actions but the issue still persists, or if you encounter a problem not covered in this section, please contact AEMC Technical Support.
8.2.1 instrument Does not turn on
The most common cause of failure to power ON is a completely discharged battery. Connect the instrument to an external power source, either external AC power or phase power. The instrument should immediately turn ON, and the Battery LED should glow yellow and blink indicating the battery is recovering from a full discharge.
If the instrument does not turn ON when connected to external power, contact AEMC Technical Support.
Power & Energy Logger Model PEL 105 81
8.2.2 instrument turns on but Does not function
If the instrument has been stored in a cold and damp environment, condensation may form inside. This can short internal circuitry, preventing the instrument from operating normally. In this case, turn OFF the instrument and place it in a warm, dry environment for several hours. Then turn the instrument ON and try navigating through the screen interface to deter-mine whether or not it has been restored to normal functionality.
8.2.3 cannot configure the instrument
Several conditions may cause some or all configuration options to appear disabled, or function in unexpected ways. For example, when the instrument is locked or when it is recording data, none of the Configuration mode options is enabled. Instead, the word LOCK appears on the LCD when you enter Configuration mode.
The instrument is locked when it is being configured through the PEL Control Panel Configure Instrument dialog box. It can also be locked through a configuration option in the PEL Control Panel. When this option is enabled, the instrument remains locked even when disconnected from the computer.
To return local control to the instrument, ensure that the “Lock out the Control button on the instrument front panel” option in the PEL Control Panel is unchecked (see § 3.6). Then disconnect the instrument from the PEL Control Panel. If the instru-ment remains locked, check whether or not a recording is in progress. (The LED blinks twice every five seconds when a recording is active.) If so, either stop the recording or wait until it completes (see § 5.2).
If some configuration screens are active, while others are inactive (or don’t appear at all), you may have the wrong hookup
type selected. Hookup settings can affect which configuration screens are available. In this case, enter Information mode and ensure the appropriate hookup type is selected.
8.2.4 recording sessions Do not start
If you attempt to start a recording either by pressing or via the PEL Control Panel and the session does not start, check whether or not a recording is already in progress on the instrument (the LED blinks twice per second). To start a new recording, either wait for the in-progress recording to finish, or stop the recording.
Also check that the SD card is installed, operational, and has sufficient space to save the recording. If the LED glows red, it is write-protected, not installed, or not recognized. If it blinks alternately red and green, it is full. If it blinks green once per second, it does not have enough space for the recording you are attempting to start.
Another condition that could prevent a recording session from starting is if the start and/or end times and dates are config-ured incorrectly, such as a stop date/time that has already passed. If the instrument has sufficient memory for the recording but it still will not start, check the recording’s start and stop times/dates to ensure they are configured properly.
See § 5.2 for information about configuring a recording session.
8.2.5 recording sessions End Prematurely
If a recording session terminates before its scheduled stop time, a likely cause is that the SD card memory has become full. When this happens, the LED glows red. Download any data you want to save, then erase the contents of the SD card through the PEL Control Panel (see § 8.1.1).
8.2.6 cannot connect to a computer
If you cannot connect the computer via Wi-Fi or Bluetooth, ensure that the communication protocol through which you
are attempting to connect is enabled. Check the appropriate LED: for Wi-Fi, for Bluetooth. If it is OFF (indicating the protocol is disabled) enable it as instructed in § 3.

82 Power & Energy Logger Model PEL 105
If the LED is blinking, the instrument is actively communicating with a computer. Only one Bluetooth connection at a time is supported; so ensure no other Bluetooth connection is active before attempting to connect to the instrument via Bluetooth.
If you are attempting to connect via USB or point-to-point Ethernet, ensure that the cable is securely connected to both the instrument and the computer. If the connections are secure, close the PEL Control Panel, disconnect the cable, wait a few seconds, then reconnect the cable. This resets the connection with the computer.
Also check the Communication settings in the PEL Control Panel, as explained in the PEL Control Panel Help system.
If you are attempting to connect via Bluetooth but you cannot connect the instrument via the PEL Control Panel – for exam-ple, the PEL 105 does not appear as available when you attempt to connect with it – the instrument may not be paired with the computer. Different computers and operating systems have different processes for pairing Bluetooth devices; consult the documentation that comes with your computer for instructions about how to do this.
8.2.7 cannot turn off the instrument
The Power button is disabled if a recording is active or pending. In addition, you cannot turn OFF the instrument if it is operating on external AC or phase power. Disconnect the power source, hold down until all the instrument’s LEDs light up, then release the button to turn OFF the instrument.

Power & Energy Logger Model PEL 105 83
aPPEnDiX a: tHEorY of oPEration
The instrument calculates measurements in accordance with IEC 61557-12 and IEC 61010-4-30. The following is a graphic representation of active and reactive power, in accordance with clauses 12 and 14 of IEC 60375.
Figure 36
In this diagram:
The current vector is fixed on the right-hand line.
The voltage vector V varies direction according to the phase angle ϕ.
The phase angle ϕ between voltage V and current I is considered mathematically positive (counter-clockwise).
a.1 samplingThe sampling period is calculated every second, and varies according to the line frequency (50Hz, 60Hz, or 400Hz).
50Hz:
42.5 to 57.5Hz (50Hz ±15%), sampling period is locked to the main frequency. There are 128 samples available for each main cycle.
Outside 42.5 to 57.5Hz, sampling period is 128 x 50Hz.
60Hz:
51 to 69Hz (60Hz ±15%), sampling period is locked to main frequency. 128 samples are available for each main cycle.
Outside 51 to 69Hz, sampling period is 128 x 60Hz.
400Hz:
340 to 460Hz (400Hz ±15%), sampling period is locked to main frequency. For each main cycle, 16 samples are available.
Outside 340 to 460Hz, sampling period is 16 x 400Hz.
Note that DC is not a frequency parameter for sampling. A pure DC measured signal is considered to be outside the fre-quency ranges. In this case sampling frequency is 6.4kHz (50/400Hz) or 7.68kHz (60Hz). By default, sampling frequency is locked on V1. If V1 is missing, the instrument attempts to lock sampling frequency V2, then V3, I1, I2, and I3.

84 Power & Energy Logger Model PEL 105
a.1.1 Locking the sampling frequency
By default, the sampling frequency is locked to V1. If V1 is missing, the instrument attempts to lock to V2, then to V3, I1, I2, and I3.
a.1.2 ac/Dc
The PEL 105 makes AC and DC measurements for AC and DC distribution networks. AC or DC is selected by the user.
The AC + DC values are available via the DataView PEL Control Panel.
a.1.3 neutral current Measurement
Depending on the distribution network, if there is no current sensor on the IN terminal, the neutral current is calculated.
a.1.4 “200ms” Quantities
The instrument calculates the following quantities every 200ms based on measurements of 10 periods for 50Hz, 12 periods for 60Hz, and 80 periods for 400Hz. The “200ms” quantities are used for:
Trends on the “1s” quantities
Aggregation of the values for the “1s” quantities (see § A.1.6).
All “200ms” quantities can be recorded on the SD card during the recording session.
a.1.5 “1s” Quantities (one second) The instrument calculates the following quantities every second on measurements of 50 periods for 50Hz, 60 periods for
60Hz, and 400 periods for 400Hz. The “1s” quantities are used for:
Real-time values
Trends
Aggregation of the values for the aggregated quantities (see § A.1.6).
Determination of the values and maximum/minimum for the values of the aggregated trends
All “1s” quantities can be recorded on the SD card during the recording session.
a.1.6 aggregation
An aggregated quantity is a value calculated for a defined period. Aggregation periods always start on rounded hours/minutes. The period is one of the following: 1, 2, 3, 4, 5, 6, 10, 12, 15, 20, 30, and 60 minutes.
All aggregated quantities are saved on the SD card during the recording session. They can be displayed in the PEL Control Panel.
a.1.7 Minimum and Maximum
The Min and Max are the minimum and maximum values observed during the aggregation period. They are recorded with their dates and times. The Max of some aggregated values are displayed directly on the instrument.

Power & Energy Logger Model PEL 105 85
a.1.8 Energy calculations
Energies are calculated every second. Total energy is the demand during the recording session. Partial energy can be determined for one of the following integration periods: 1h, 1 day, 1 week, or 1 month. The partial energy index is available only in real time. It is not recorded.
Note that total energies are available with the data of the recorded session.
a.2 Phase sequenceEvery second, the instrument determines the phase sequence. If the phase sequence does not meet the criteria listed in
the tables below, the red Phase Sequence LED blinks. In addition, the Phase Sequence icon appears on the LCD.
To ensure proper phase sequence, the current phase sequence, voltage phase sequence, and current vs voltage phase sequence for that hookup must all be correct. Note that:
Phase sequence for voltage channels is only displayed when voltages are displayed on the LCD.
Phase sequence for current channels only is displayed when currents are displayed.
Phase sequence for voltage and current channels is displayed when the other screens are displayed.
Load or source is set by the PEL Control Panel.
In some hookups (such as DC) the phase sequence does not always apply.
The following tables list the measurement ranges that ensure correct current phase sequence, voltage phase sequence, and current vs voltage phase sequence respectively.
a.2.1 current Phase sequence
HookupCurrent Phase
SequenceRange
1P-2W (1-Phase 2-Wire)
No
1P -3W (1-Phase 3-Wire)
Yes ϕ (I2, I1) = 180° ± 30°
3P-3W∆2 (3-Phase 3-Wire ∆, 2 current probes)
Yes ϕ (I1, I3) = 120° ± 30°No I2 current probes
3P-3WO2 (3-Phase 3-Wire Open ∆, 2 current probes)
3P-3WY2 (3-Phase 3-Wire Y, 2 current probes)
3P-3W∆3(3-Phase 3-Wire ∆, 3 current probes)
Yes [ϕ (I1, I3), ϕ (I3, I2), ϕ (I2, I1)] = 120° ± 30°3P-3WO3(3-Phase 3-Wire Open ∆, 3 current probes)
3P-3WY3(3-Phase 3-Wire Y, 3 current probes)
3P-3W∆b (3-Phase 3-Wire ∆ balanced)
No
3P-4WY (3-Phase 4-Wire Y)
Yes [ϕ (I1, I3), ϕ (I3, I2), ϕ (I2, I1)] = 120° ± 30°
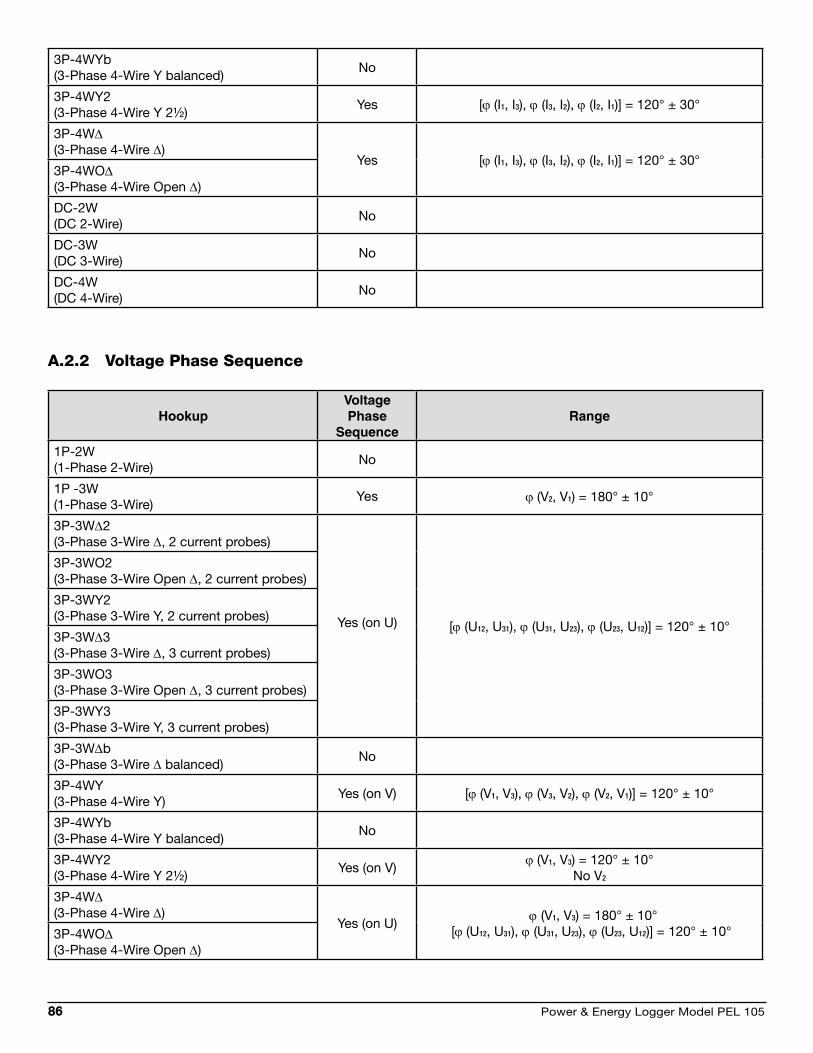
86 Power & Energy Logger Model PEL 105
3P-4WYb (3-Phase 4-Wire Y balanced)
No
3P-4WY2(3-Phase 4-Wire Y 2½)
Yes [ϕ (I1, I3), ϕ (I3, I2), ϕ (I2, I1)] = 120° ± 30°
3P-4W∆(3-Phase 4-Wire ∆)
Yes [ϕ (I1, I3), ϕ (I3, I2), ϕ (I2, I1)] = 120° ± 30°3P-4WO∆(3-Phase 4-Wire Open ∆)
DC-2W(DC 2-Wire)
No
DC-3W(DC 3-Wire)
No
DC-4W(DC 4-Wire)
No
a.2.2 Voltage Phase sequence
HookupVoltage Phase
SequenceRange
1P-2W (1-Phase 2-Wire)
No
1P -3W (1-Phase 3-Wire)
Yes ϕ (V2, V1) = 180° ± 10°
3P-3W∆2 (3-Phase 3-Wire ∆, 2 current probes)
Yes (on U) [ϕ (U12, U31), ϕ (U31, U23), ϕ (U23, U12)] = 120° ± 10°
3P-3WO2 (3-Phase 3-Wire Open ∆, 2 current probes)
3P-3WY2 (3-Phase 3-Wire Y, 2 current probes)
3P-3W∆3(3-Phase 3-Wire ∆, 3 current probes)
3P-3WO3(3-Phase 3-Wire Open ∆, 3 current probes)
3P-3WY3(3-Phase 3-Wire Y, 3 current probes)
3P-3W∆b (3-Phase 3-Wire ∆ balanced)
No
3P-4WY (3-Phase 4-Wire Y)
Yes (on V) [ϕ (V1, V3), ϕ (V3, V2), ϕ (V2, V1)] = 120° ± 10°
3P-4WYb (3-Phase 4-Wire Y balanced)
No
3P-4WY2(3-Phase 4-Wire Y 2½)
Yes (on V)ϕ (V1, V3) = 120° ± 10°
No V2
3P-4W∆(3-Phase 4-Wire ∆)
Yes (on U) ϕ (V1, V3) = 180° ± 10°
[ϕ (U12, U31), ϕ (U31, U23), ϕ (U23, U12)] = 120° ± 10°3P-4WO∆(3-Phase 4-Wire Open ∆)

Power & Energy Logger Model PEL 105 87
DC-2W(DC 2-Wire)
No
DC-3W(DC 3-Wire)
No
DC-4W(DC 4-Wire)
No
a.2.3 current vs Voltage Phase sequence
Hookup
Current vs VoltagePhase
Sequence
Range
1P-2W (1-Phase 2-Wire)
Yes ϕ (I1, V1) = 0° ± 60° for load ϕ (I1, V1) = 180° ± 60° for source
1P -3W (1-Phase 3-Wire)
Yes [ϕ (I1, V1), ϕ (I2, V2)] = 0° ± 60° for load [ϕ (I1, V1), ϕ (I2, V2)] = 180° ± 60° for source
3P-3W∆2 (3-Phase 3-Wire ∆, 2 current probes)
Yes[ϕ (I1, U12), ϕ (I3, U31)] = 30° ± 60° for load
[ϕ (I1, U12), ϕ (I3, U31)] = 210° ± 60° for sourceNo I2 current probes
3P-3WO2 (3-Phase 3-Wire Open ∆, 2 current probes)
3P-3WY2 (3-Phase 3-Wire Y, 2 current probes)
3P-3W∆3(3-Phase 3-Wire ∆, 3 current probes)
Yes[ϕ (I1, U12), ϕ (I2, U23), ϕ (I3, U31)] = 30° ± 60° for load
[ϕ (I1, U12), ϕ (I2, U23), ϕ (I3, U31)] = 210° ± 60° for source3P-3WO3(3-Phase 3-Wire Open ∆, 3 current probes)
3P-3WY3(3-Phase 3-Wire Y, 3 current probes)
3P-3W∆b (3-Phase 3-Wire ∆ balanced)
Yes ϕ (I3, U12) = 90° ± 60° for load ϕ (I3, U12) = 270° ± 60° for source
3P-4WY (3-Phase 4-Wire Y)
Yes[ϕ (I1, V1), ϕ (I2, V2), ϕ (I3, V3)] = 0° ± 60° for load
[ϕ (I1, V1), ϕ (I2, V2), ϕ (I3, V3)] = 180° ± 60° for source
3P-4WYb (3-Phase 4-Wire Y balanced)
Yes ϕ (I1, V1) = 0° ± 60° for load ϕ (I1, V1) = 180° ± 60° for source
3P-4WY2(3-Phase 4-Wire Y 2½)
Yes[ϕ (I1, V1), ϕ (I3, V3)] = 0° ± 60° for load
[ϕ (I1, V1), ϕ (I3, V3)] = 180° ± 60° for source No V2
3P-4W∆(3-Phase 4-Wire ∆)
Yes[ϕ (I1, U12), ϕ (I2, U23), ϕ (I3, U31)] = 30° ± 60° for load
[ϕ (I1, U12), ϕ (I2, U23), ϕ (I3, U31)] = 210° ± 60° for source3P-4WO∆(3-Phase 4-Wire Open ∆)
DC-2W(DC 2-Wire)
No
DC-3W(DC 3-Wire)
No
DC-4W(DC 4-Wire)
No

88 Power & Energy Logger Model PEL 105
aPPEnDiX b: MEasurEMEnt QuantitiEs
The following table lists all quantities measured or calculated by the instrument, organized by hookup type. Circles indicate that the quantity is measured for the hookup.
For example, the first quantity listed in the table is V1 (line 1 voltage). Circles in the 1P-2W and 1P-3W columns indicate V1 is measured for single-phase 2-wire and single-phase 3-wire hookups. The absence of a circle in the 3P-3W∆b column indicates V1 is not measured for 3-phase 3-wire ∆ balanced hookups.
Quantities 1P-2W 1P-3W3P-3W∆23P-3WO23P-3WY2
3P-3W∆33P-3WO33P-3WY3
3P-3W∆b 3P-4WY 3P-4WYb 3P-4WY23P-4W∆
3P-4WO∆ DC-2W DC-3W DC-4W
V1 AC RMS
V2 AC RMS =V1
(10)
V3 AC RMS =V1
VN AC RMS
V1 DC
V2 DC
V3 DC
VN DC
V1AC+DC
RMS
V2AC+DC
RMS (1) (10)
V3AC+DC
RMS (1)
VNAC+DC
RMS
U12 AC RMS (1) (10)
U23 AC RMS (1) (1) (10)
U31 AC RMS (1) (1)
I1 AC RMS (1)
I2 AC RMS (2) (1) (1)

Power & Energy Logger Model PEL 105 89
Quantities 1P-2W 1P-3W3P-3W∆23P-3WO23P-3WY2
3P-3W∆33P-3WO33P-3WY3
3P-3W∆b 3P-4WY 3P-4WYb 3P-4WY23P-4W∆
3P-4WO∆ DC-2W DC-3W DC-4W
I3 AC RMS (1)
IN AC RMS (11)
I1AC+DC
RMS (1)
I2AC+DC
RMS (2) (1) (1)
I3AC+DC
RMS (1)
INAC+DC
RMS
I1 DC
I2 DC
I3 DC
IN DC
V1CF
V2CF (1) (10)
V3CF (1)
I1CF
I2CF (2) (1) (1)
I3CF (1) (1)
V+ (10)
V- (4) (4) (10)
V0 (4) (4) (10)
I+
I- (4) (4)
I0 (4) (4)

90 Power & Energy Logger Model PEL 105
Quantities 1P-2W 1P-3W3P-3W∆23P-3WO23P-3WY2
3P-3W∆33P-3WO33P-3WY3
3P-3W∆b 3P-4WY 3P-4WYb 3P-4WY23P-4W∆
3P-4WO∆ DC-2W DC-3W DC-4W
U0 (4) (4) (4) (3)
U2 (4) (4) (4) (3)
I0 (4) (4) (3)
I2 (4) (4) (3)
F
P1 AC
P2 AC (1) (10)
P3 AC (1)
PT AC (7) (1)
P1 DC
P2 DC
P3 DC
PT DC (7)
P1 AC+DC
P2 AC+DC (1) (10)
P3 AC+DC (1)
PT AC+DC (7) (1)
PF1
PF2 (1) (10)
PF3 (1)
PFT (7) (1)
P+ (1)
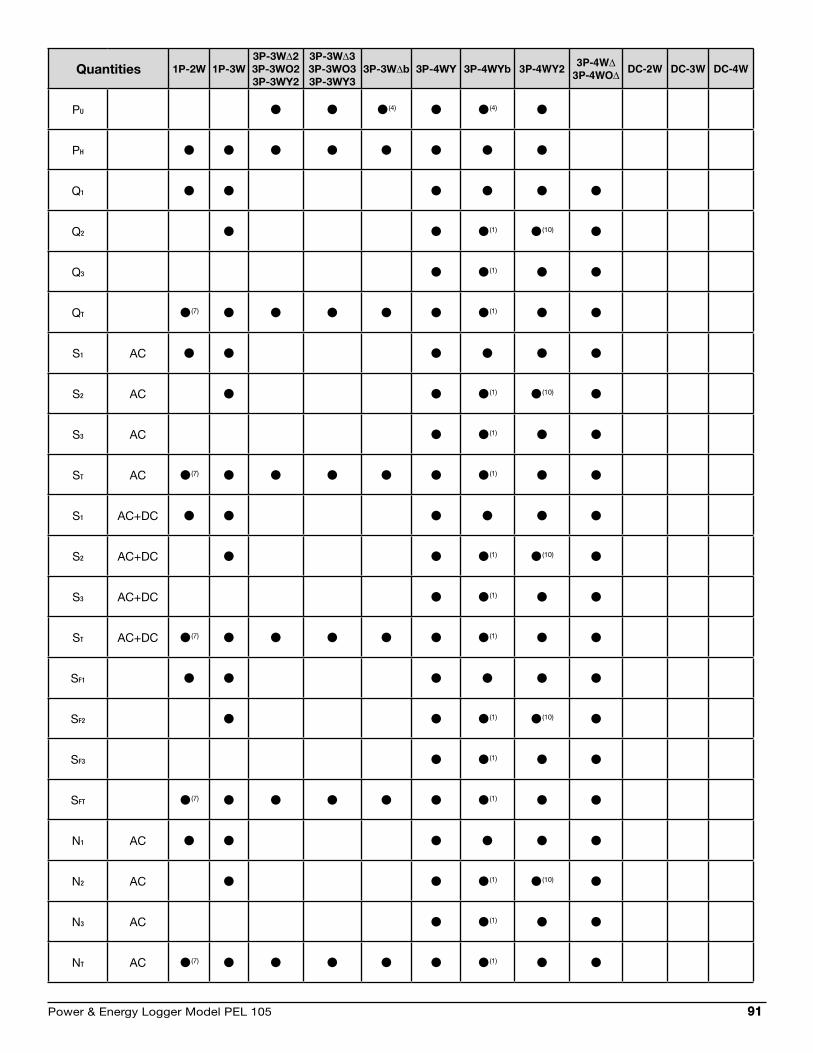
Power & Energy Logger Model PEL 105 91
Quantities 1P-2W 1P-3W3P-3W∆23P-3WO23P-3WY2
3P-3W∆33P-3WO33P-3WY3
3P-3W∆b 3P-4WY 3P-4WYb 3P-4WY23P-4W∆
3P-4WO∆ DC-2W DC-3W DC-4W
PU (4) (4)
PH
Q1
Q2 (1) (10)
Q3 (1)
QT (7) (1)
S1 AC
S2 AC (1) (10)
S3 AC (1)
ST AC (7) (1)
S1 AC+DC
S2 AC+DC (1) (10)
S3 AC+DC (1)
ST AC+DC (7) (1)
SF1
SF2 (1) (10)
SF3 (1)
SFT (7) (1)
N1 AC
N2 AC (1) (10)
N3 AC (1)
NT AC (7) (1)

92 Power & Energy Logger Model PEL 105
Quantities 1P-2W 1P-3W3P-3W∆23P-3WO23P-3WY2
3P-3W∆33P-3WO33P-3WY3
3P-3W∆b 3P-4WY 3P-4WYb 3P-4WY23P-4W∆
3P-4WO∆ DC-2W DC-3W DC-4W
N1 AC+DC
N2 AC+DC (1) (10)
N3 AC+DC (1)
NT AC+DC (7) (1)
D1 AC
D2 AC (1) (10)
D3 AC (1)
DT AC (7) (1)
D1 AC+DC
D2 AC+DC (1) (10)
D3 AC+DC (1)
DT AC+DC (7) (1)
PF1
PF2 (1) (10)
PF3 (1)
PFT (7) (1)
Cos ϕ1
Cos ϕ2 (1) (10)
Cos ϕ3 (1)
Cos ϕT (7) (1)
TAN ϕ (3) (10)

Power & Energy Logger Model PEL 105 93
Quantities 1P-2W 1P-3W3P-3W∆23P-3WO23P-3WY2
3P-3W∆33P-3WO33P-3WY3
3P-3W∆b 3P-4WY 3P-4WYb 3P-4WY23P-4W∆
3P-4WO∆ DC-2W DC-3W DC-4W
V1-Hi
i=1 to 50(6)
%f
V2-Hi (1) (10)
V3-Hi (1)
U12-Hi
i=1 to 50(6)
%f
(1) (10)
U23-Hi (1) (1) (10)
U31-Hi (1) (1)
I1-Hi
i=1 to 50(6)
%f
(1)
I2-Hi (2) (1) (1)
I3-Hi (1)
IN-Hi (2) (11) (4) (2) (2)
V1-Hi
i=1 to 50(6)
RMS
V2-Hi (1) (10)
V3-Hi (1)
U12-Hi
i=1 to 50(6)
RMS
(1) (10)
U23-Hi (1) (1) (10)
U31-Hi (1) (1)
I1-Hi
i=1 to 50(6)
RMS
(1)
I2-Hi (2) (1) (1)
I3-Hi (1)
IN-Hi (2) (11) (4) (2) (2)
V1-THD %f

94 Power & Energy Logger Model PEL 105
Quantities 1P-2W 1P-3W3P-3W∆23P-3WO23P-3WY2
3P-3W∆33P-3WO33P-3WY3
3P-3W∆b 3P-4WY 3P-4WYb 3P-4WY23P-4W∆
3P-4WO∆ DC-2W DC-3W DC-4W
V2-THD %f (1) (10)
V3-THD %f (1)
U12-THD %f (1) (10)
U23-THD %f (1) (1) (10)
U31-THD %f (1) (1)
I1-THD %f (1)
I2-THD %f (2) (1) (1)
I3-THD %f (1)
IN-THD %f (2) (11) (4) (2) (2)
Phase sequence
I
V
I, V
ϕ(V2, V1) (9)
ϕ(V3, V2) (9)
ϕ(V1, V3) (9)
ϕ(U23, U12) (9) (9)
ϕ(U12, U31) (9) (9)
ϕ(U31, U23) (9) (9)
ϕ(I2, I1) (9) (9)
ϕ(I3, I2) (9) (9)
ϕ(I1, I3) (9) (9)

Power & Energy Logger Model PEL 105 95
Quantities 1P-2W 1P-3W3P-3W∆23P-3WO23P-3WY2
3P-3W∆33P-3WO33P-3WY3
3P-3W∆b 3P-4WY 3P-4WYb 3P-4WY23P-4W∆
3P-4WO∆ DC-2W DC-3W DC-4W
ϕ(I1, V1) (8)
ϕ(I2, V2)
=ϕ(I1, V1)
ϕ(I3, V3)
=ϕ(I1, V1)
EPTSource
AC (5) (5) (5)
EPTLoadAC (5) (5) (5)
EQT Quad 1 (5) (5) (5)
EQT Quad 2 (5) (5) (5)
EQT Quad 3 (5) (5) (5)
EQT Quad 4 (5) (5) (5)
EST Source (5) (5) (5)
EST Load (5) (5) (5)
EPTSource
DC (5) (5) (5) (5) (5) (5) (5) (5) (5)
EPTLoadDC (5) (5) (5) (5) (5) (5) (5) (5) (5)
Available
(1) Extrapolated
(2) Calculated
(3) Not a real quantity
(4) Always = 0
(5) AC+DC when selected
(6) Rank 7 for 400Hz
(7) P1 = PT, Q1 = QT, N1 = NT, D1 = DT, S1 = ST, PF1 = PFT, Cos ϕ1 = Cos ϕT, PF1 = PFT
(8) ϕ (I3, U12)
(9) Always = 120°
(10) Interpolated
(11) Calculated or measured if a current sensor is con-nected

96 Power & Energy Logger Model PEL 105
aPPEnDiX c: PoLE MountinG
Accessory brackets (Cat. #2137.81) enable you to mount the Model PEL 105 on a utility pole or similar structure.
Figure 37
To mount the instrument on a pole, turn it OFF and detach all leads and other connections. Then do the following:
1. Slide the brackets onto the bottom of the instrument.
Figure 38

Power & Energy Logger Model PEL 105 97
2. Attach the bracket by inserting the four connecting pins into the holes in the instrument case.
3. Insert the four clips into the holes in the pins.
Figure 39
4. Run two straps (not included) through the slots in the brackets. These slots are 25.4 x 4mm (1 x 0.157”).
5. Position the instrument on the pole, and attach it by fastening the straps.
Figure 40
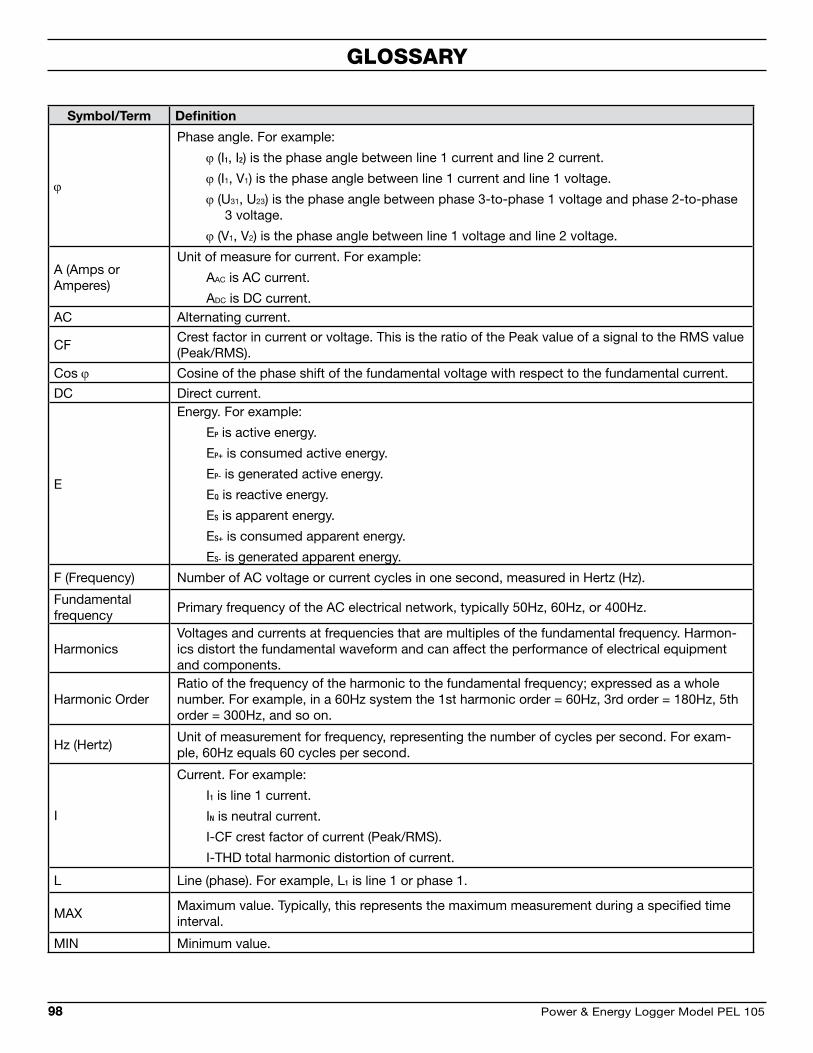
98 Power & Energy Logger Model PEL 105
GLossarY
Symbol/Term Definition
ϕ
Phase angle. For example:
ϕ (I1, I2) is the phase angle between line 1 current and line 2 current.
ϕ (I1, V1) is the phase angle between line 1 current and line 1 voltage.
ϕ (U31, U23) is the phase angle between phase 3-to-phase 1 voltage and phase 2-to-phase 3 voltage.
ϕ (V1, V2) is the phase angle between line 1 voltage and line 2 voltage.
A (Amps or Amperes)
Unit of measure for current. For example:
AAC is AC current.
ADC is DC current.AC Alternating current.
CFCrest factor in current or voltage. This is the ratio of the Peak value of a signal to the RMS value (Peak/RMS).
Cos ϕ Cosine of the phase shift of the fundamental voltage with respect to the fundamental current.
DC Direct current.
E
Energy. For example:
EP is active energy.
EP+ is consumed active energy.
EP- is generated active energy.
EQ is reactive energy.
ES is apparent energy.
ES+ is consumed apparent energy.
ES- is generated apparent energy.
F (Frequency) Number of AC voltage or current cycles in one second, measured in Hertz (Hz).
Fundamental frequency
Primary frequency of the AC electrical network, typically 50Hz, 60Hz, or 400Hz.
HarmonicsVoltages and currents at frequencies that are multiples of the fundamental frequency. Harmon-ics distort the fundamental waveform and can affect the performance of electrical equipment and components.
Harmonic OrderRatio of the frequency of the harmonic to the fundamental frequency; expressed as a whole number. For example, in a 60Hz system the 1st harmonic order = 60Hz, 3rd order = 180Hz, 5th order = 300Hz, and so on.
Hz (Hertz)Unit of measurement for frequency, representing the number of cycles per second. For exam-ple, 60Hz equals 60 cycles per second.
I
Current. For example:
I1 is line 1 current.
IN is neutral current.
I-CF crest factor of current (Peak/RMS).
I-THD total harmonic distortion of current.
L Line (phase). For example, L1 is line 1 or phase 1.
MAXMaximum value. Typically, this represents the maximum measurement during a specified time interval.
MIN Minimum value.
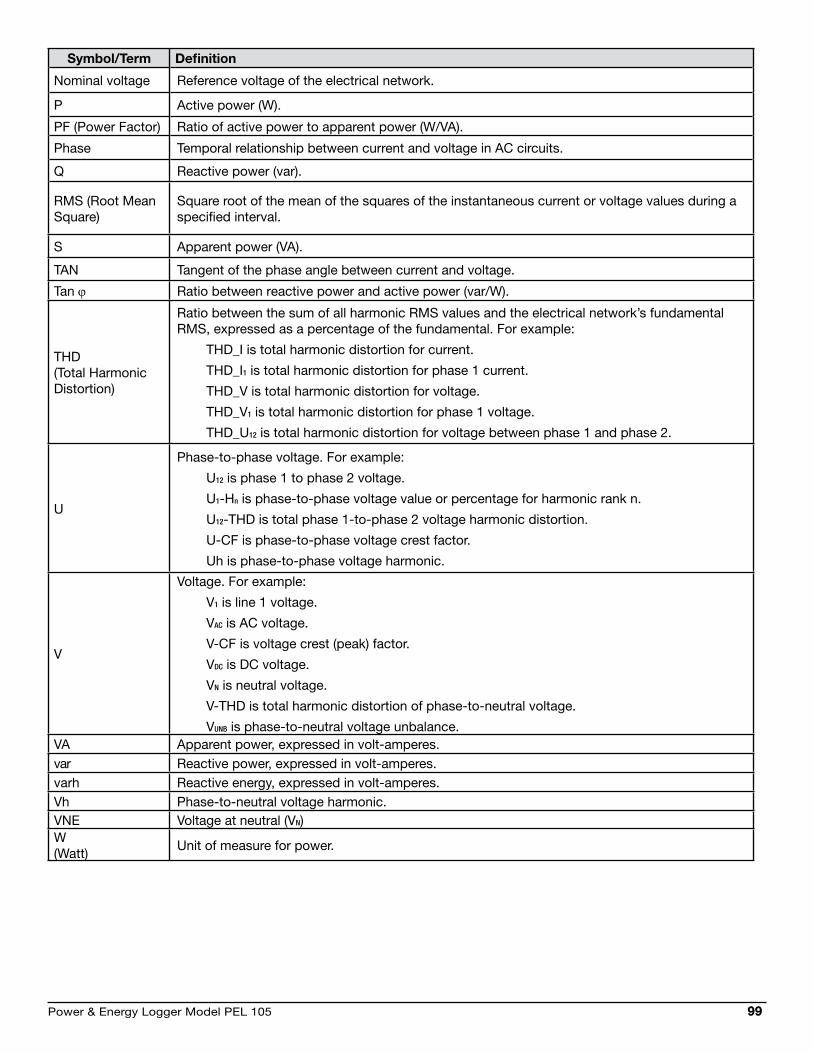
Power & Energy Logger Model PEL 105 99
Symbol/Term Definition
Nominal voltage Reference voltage of the electrical network.
P Active power (W).
PF (Power Factor) Ratio of active power to apparent power (W/VA).
Phase Temporal relationship between current and voltage in AC circuits.
Q Reactive power (var).
RMS (Root Mean Square)
Square root of the mean of the squares of the instantaneous current or voltage values during a specified interval.
S Apparent power (VA).
TAN Tangent of the phase angle between current and voltage.
Tan ϕ Ratio between reactive power and active power (var/W).
THD(Total Harmonic Distortion)
Ratio between the sum of all harmonic RMS values and the electrical network’s fundamental RMS, expressed as a percentage of the fundamental. For example:
THD_I is total harmonic distortion for current.
THD_I1 is total harmonic distortion for phase 1 current.
THD_V is total harmonic distortion for voltage.
THD_V1 is total harmonic distortion for phase 1 voltage.
THD_U12 is total harmonic distortion for voltage between phase 1 and phase 2.
U
Phase-to-phase voltage. For example:
U12 is phase 1 to phase 2 voltage.
U1-Hn is phase-to-phase voltage value or percentage for harmonic rank n.
U12-THD is total phase 1-to-phase 2 voltage harmonic distortion.
U-CF is phase-to-phase voltage crest factor.
Uh is phase-to-phase voltage harmonic.
V
Voltage. For example:
V1 is line 1 voltage.
VAC is AC voltage.
V-CF is voltage crest (peak) factor.
VDC is DC voltage.
VN is neutral voltage.
V-THD is total harmonic distortion of phase-to-neutral voltage.
VUNB is phase-to-neutral voltage unbalance.VA Apparent power, expressed in volt-amperes.var Reactive power, expressed in volt-amperes.varh Reactive energy, expressed in volt-amperes.Vh Phase-to-neutral voltage harmonic.VNE Voltage at neutral (VN)W (Watt)
Unit of measure for power.

100 Power & Energy Logger Model PEL 105
rEPair anD caLibration
To ensure that your instrument meets factory specifications, we recommend that it be scheduled to be sent back to our factory Service Center at one-year intervals for recalibration, or as required by other standards or internal procedures.
For instrument repair and calibration:
You must contact our Service Center for a Customer Service Authorization Number (CSA#). This will ensure that when your instrument arrives, it will be tracked and processed promptly. Please write the CSA# on the outside of the shipping container. If the instrument is returned for calibration, we need to know if you want a standard calibration, or a calibration traceable to N.I.S.T. (Includes calibration certificate plus recorded calibration data).
Ship To: Chauvin Arnoux®, Inc. d.b.a. AEMC® Instruments15 Faraday Drive • Dover, NH 03820 USAPhone: (800) 945-2362 (Ext. 360)
(603) 749-6434 (Ext. 360)Fax: (603) 742-2346 or (603) 749-6309E-mail: [email protected]
(Or contact your authorized distributor.)
Costs for repair, standard calibration, and calibration traceable to N.I.S.T. are available.
NOTE: You must obtain a CSA# before returning any instrument.
tEcHnicaL anD saLEs assistancE
If you are experiencing any technical problems, or require any assistance with the proper operation or application of your instrument, please call, fax, or e-mail our technical support team:
Chauvin Arnoux®, Inc. d.b.a. AEMC® Instruments
Phone: (800) 343-1391 • (508) 698-2115Fax: (508) 698-2118E-mail: [email protected]

Power & Energy Logger Model PEL 105 101
LiMitED WarrantY
The Model PEL 105 is warranted to the owner for a period of two years from the date of original purchase against defects in manufacture. This limited warranty is given by AEMC® Instruments, not by the distributor from whom it was purchased. This warranty is void if the unit has been tampered with or abused, or if the defect is related to service not performed by AEMC® Instruments.
Full warranty coverage and product registration is available on our website at: www.aemc.com/warranty.html.
Please print the online Warranty Coverage Information for your records.
What AEMC® Instruments will do: If a malfunction occurs within the two-year period, you may return the instrument to us for repair, provided we have your warranty registration information on file or a proof of purchase. AEMC® Instruments will, at its option, repair or replace the faulty material.
WarrantY rEPairs
What you must do to return an Instrument for Warranty Repair:
First, request a Customer Service Authorization Number (CSA#) by phone or by fax from our Service Department (see address below), then return the instrument along with the signed CSA Form. Please write the CSA# on the outside of the shipping container. Return the instrument, postage or shipment pre-paid to:
Ship To: Chauvin Arnoux®, Inc. d.b.a. AEMC® Instruments15 Faraday Drive • Dover, NH 03820 USAPhone: (800) 945-2362 (Ext. 360)
(603) 749-6434 (Ext. 360)Fax: (603) 742-2346 or (603) 749-6309E-mail: [email protected]
Caution: To protect yourself against in-transit loss, we recommend you insure your returned material.
NOTE: You must obtain a CSA# before returning any instrument.

99-MAN 100427 v6 - 06/18
Chauvin Arnoux®, Inc. d.b.a. AEMC® Instruments15 Faraday Drive • Dover, NH 03820 USA • Phone: (603) 749-6434 • Fax: (603) 742-2346
www.aemc.com