power across texas 2015 energy innovation challenge texas tech energy innovation challenge team ebru...
TRANSCRIPT

POWER ACROSS TEXAS 2015 ENERGY INNOVATION CHALLENGE
Texas Tech Energy Innovation Challenge TeamEbru Unal
James UrbanRitesh Sevanthi
Soraya Honarparvar
Waste to Wealth: Reducing the Water Footprint of the Oil and Gas Industry

CHALLENGE
• Water Stress• Water Use• Social Responsibility• Economics
Existing Supply Limited Demand

CURRENT WATER LIFE CYCLE
Estimated Total Cost$4.30/bbl

ESTIMATES OF VOLUME
• Rig counts of 2014 and 2015,used to postulate amount of water available from fracturing in 2015 -2021
• 40 billion gallons will be disposed in the Permian basin in the years 2015-2020. Currently only 5% is reused

RATIONALE FOR MULTIPLE USE APPROACH

• Bacterial Growth
• Oil and gas residue
• Cation Interference
• Scale formation
ClO2 Disinfection
ClO2 oxidation and induced gas
flotation
API Separators and induced gas
flotation unit
Is it going to be an issue?
CHALLENGES IN REUSE

SUGGESTED TREATMENT & COST
To ensure every drop of water is efficiently used
Chad Knutson and Seyed A. Dastgheib (PI). “Reuse of Produced Water from CO2 Enhanced Oil Recovery, Coal-Bed Methane, and Mine Pool Water by Coal-Based Power Plants”; (July 2012)
Cost $ /bblCost per frac
job FPW $
0.56 36440.630.00 104.000.07 4647.500.01 450.450.01 1300.000.66 42942.58
ClO2 DisinfectionTotal Treatment Cost
Treatment
Storage Tank O&M CostsAPI SeparatorGas Floatation
Oxidation Tank Air + ClO2

Reuse in Hydraulic Fracturing
POWER ACROSS TEXAS 2015 ENERGY INNOVATION CHALLENGE

Approach:e-NRTL a concentrated brine solution model under development
Scale formation
Sulfate Scaling
Carbonate Scaling
Barium sulfate (BaSO4)
Strontium Sulfate (SrSO4)
Strontium Carbonate (SrCO3)
Barium Carbonate (BaCO3)
Calcium carbonate (CaCO3)
REUSE IN HYDRAULIC FRACTURING

BaSO4 SrSO4 BaCO3 SrCO3 CaCO30
0.2
0.4
0.6
0.8
1
1.2
Saturation Indices of flowback pro-duced water for hydraulic fracturing
at 77 ˚F and 14.6 psi
Components
Sat
ura
tion
In
dex
BaSO4 SrSO4 BaCO3 SrCO3 CaCO30
0.2
0.4
0.6
0.8
1
1.2
Solubility Indices of diluted flowback produced water at 150 ˚F and 10,000
psi
Components
Sol
ub
ility
In
dex
Modeling results for reusing in hydraulic fracturingThe expected solutions are marginally scaling at the temperature and pressure of the formation but easily managed with anti-scalants
REUSE IN HYDRAULIC FRACTURING

Cost estimation
• Fresh water
Typical cost $0.85/bbl
• Treated produced water
Treatment cost for reuse $0.66/bbl
Elimination of disposal cost
REUSE IN HYDRAULIC FRACTURING

Legal & public perception
Groundwater Rights: Mineral owner has “Reasonable Use” of surface estate
{which includes groundwater}• On-lease operations is reasonable
• Off lease use is unreasonable
Alternatives: • Lease agreement or
• Rule adoption as reasonable use by Railroad Commission
House Bill 40
REUSE IN HYDRAULIC FRACTURING

Used in Cooling Towers for Power Generation
POWER ACROSS TEXAS 2015 ENERGY INNOVATION CHALLENGE

REUSE IN POWER PLANTS
Feasibility of reuse in power plants
Data from California Energy Commission
2D Graph 1
Major Ions in Solution
Na K Ca Mg HCO3 Cl SO4
Con
cent
ratio
n (m
g/L)
0
10000
20000
30000
40000
50000
2X Sea WaterPermian Basin

BaSO4 SrSO4 BaCO3 SrCO3 CaCO30
0.2
0.4
0.6
0.8
1
1.2
Saturation Indices of flowback & pro-duced water used for power plant at 77
˚F and 14.6 psi
Components
Sat
ura
tion
In
dex
BaSO4 SrSO4 BaCO3 SrCO3 CaCO3-0.2
-1.66533453693773E-16
0.2
0.4
0.6
0.8
1
1.2
Solubility Indices of Diluted flowback & produced water at 212 ˚F and 14.6
psi
ComponentsSo
lubi
lity
Indi
ces
Modeling results for reusing in power plant
The expected solutions are marginally scaling at the temperature and pressure of the cooling water system but easily managed with anti-scalants
REUSE IN POWER PLANTS

• Reduction in Fresh Water Consumption 40 -80%• Minimal increase in O&M• Airborne particulate issues• Legal issues mirror the ones faced by reuse in
hydraulic fracturing
Data from California Energy Commission
Cost increase & challenges of reuse in power plants
Increased equipment costs
REUSE IN POWER PLANTS

Used in Solar Ponds
POWER ACROSS TEXAS 2015 ENERGY INNOVATION CHALLENGE

SALT GRADIENT SOLAR PONDS
Capturing solar energy and storing thermal energy
Applications:
• Electricity generation
• Industrial process heating
• Aquaculture
• Desalination

SALT GRADIENT SOLAR PONDS
• Upper Convective Zone
• Non-Convective Zone
• Lower Convective Zone
Increasing salinity and temperature gradient UCZ
NCZLCZ
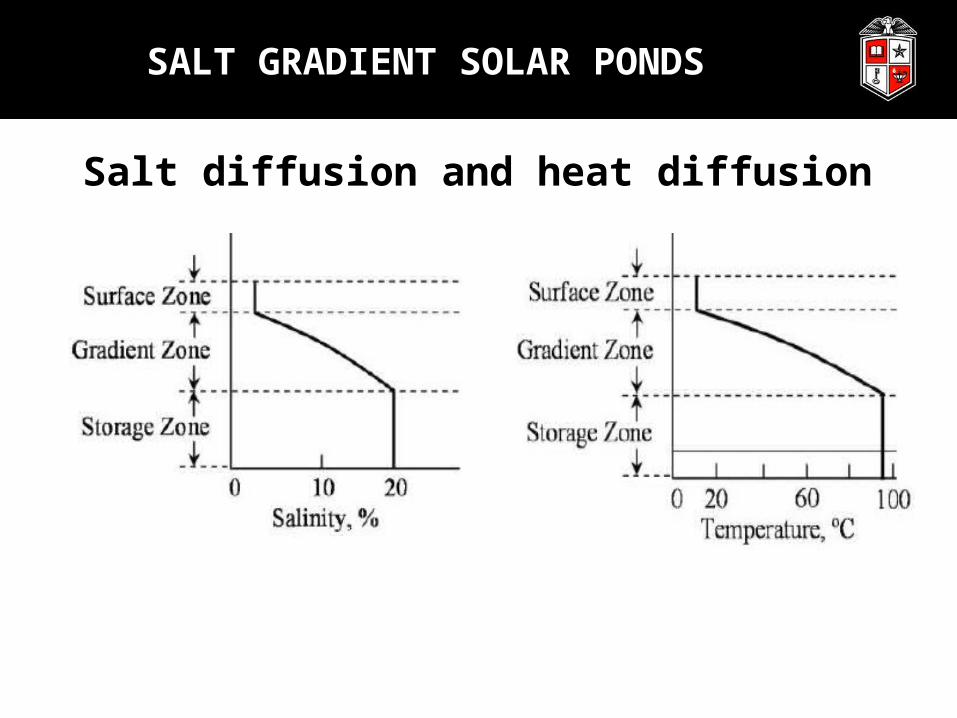
Salt diffusion and heat diffusion
SALT GRADIENT SOLAR PONDS

SALT GRADIENT SOLAR PONDS
(Bozkurt et.al., 2015)
UCZ NCZ LCZ
Density of the zones (kg/m3) 1000-1020 1030-1150 1170-1200
Salinity (%) 3.03 11.31 22.58
Calculated criteria of the flowback and produced water
Density of the zones (kg/m3) 1021.49- 1110.48
Salinity (%) 3.07- 14.85

SALT GRADIENT SOLAR PONDS
January
Febru
ary
Marc
hApril
May
JuneJuly
August
Septem
ber
Octo
ber
November
Decem
ber0
5
10
15
20
25
30
35
40Solar radiation
Cairo Riyadh Texas Permian Basin
Rad
iati
on (
MJ/
m2/
day
)
(https://eosweb.larc.nasa.gov/sse/)

SALT GRADIENT SOLAR PONDS
• 70 kW power generation in El Paso • 15 kW power generation in Australia
SALT GRADIENT SOLAR PONDS
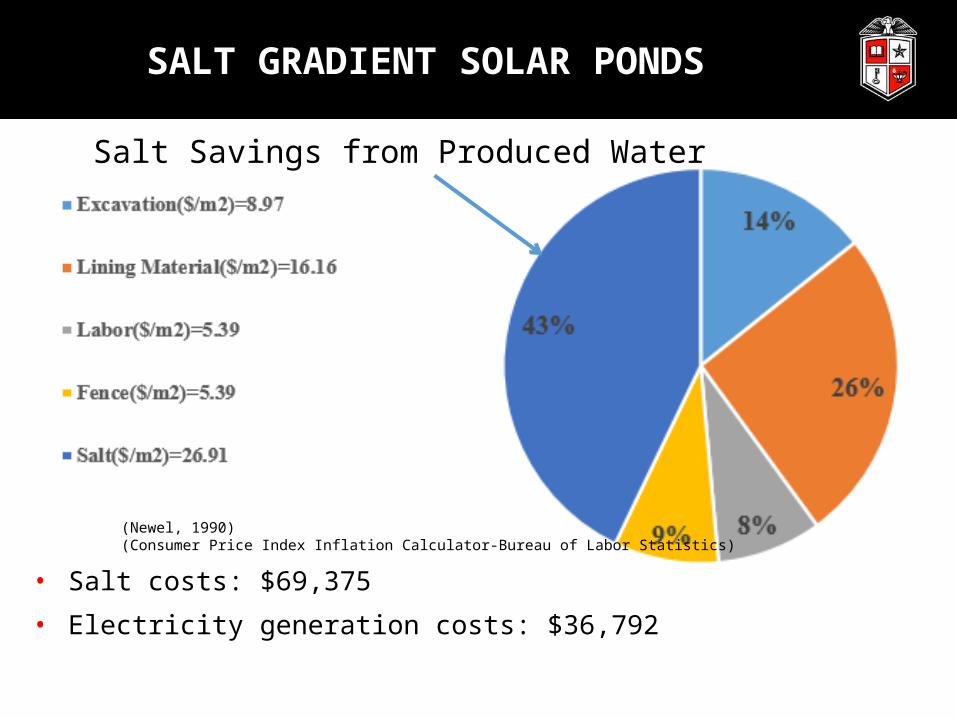
• Salt costs: $69,375
• Electricity generation costs: $36,792
(Newel, 1990)(Consumer Price Index Inflation Calculator-Bureau of Labor Statistics)
Salt Savings from Produced Water

Legal & public perception
Texas Commission on Environmental Quality Regulatory and Permitting Process
Texas Interconnection power grid North American Electric Reliability Corporation (NERC) Electric Reliability Council of Texas (ERCOT)
Public Perception Concerns Environmental, Health, Economic, and Social Public opinion research and public input
SALT GRADIENT SOLAR PONDS

Used for Anti-Icing
POWER ACROSS TEXAS 2015 ENERGY INNOVATION CHALLENGE

ANTI-ICING OF ROADWAYS
Creating a chemical layer ahead of the event to: Prevent freeze bond Prevent frost or black ice formation Increase needed response time
Anti-icing chemicals Liquids (Sodium Chloride & Magnesium Chloride)

Data from University Transportation Research Center
Typical oil-field brine
ANTI-ICING OF ROADWAYS

Cost Reduction by using Flow-back & Produced Water ~50%
Data from Iowa Department of Transportation
Cost reduction
ANTI-ICING OF ROADWAYS

Legal & public perception
Public Concerns: Vehicle Damage Effects of runoff Roadway Deterioration
ANTI-ICING OF ROADWAYS
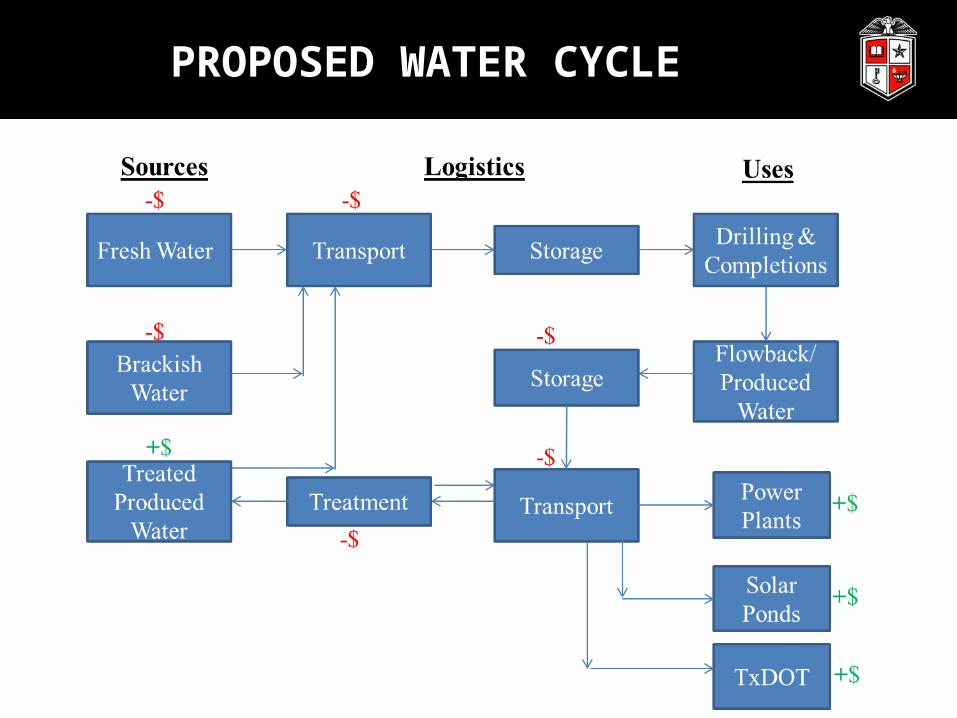
PROPOSED WATER CYCLE

Questions
POWER ACROSS TEXAS 2015 ENERGY INNOVATION CHALLENGE
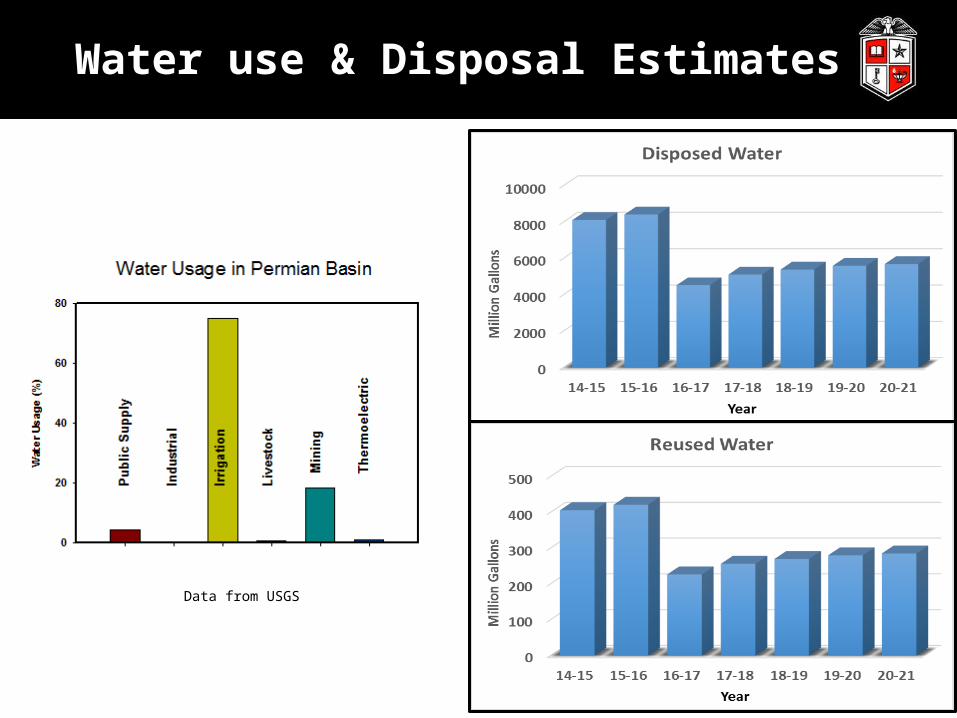
Water use & Disposal Estimates
Data from USGS

Availability of flowback and produced water in Permian Basin
High flowback and produced water level Total Dissolved Solid (TDS) of flowback and Produced water is
100,000 mg/l
Ba+2 Ca+2 K+ Mg+2 Na+ Sr+2 Cl- CO3-2 HCO3- SO4-2
0
10000
20000
30000
40000
50000
60000
70000
93.544226.89
686.36 1348.31
30220.17
329.54
59927.98
670.83 555.31 1816.26
Average Concentration of flowback and produced water over 22 counties in Permian basin
Ions
Con
cen
trat
ion
(m
g/l)
Reuse in Hydraulic Fracturing

Reuse in Hydraulic Fracturing
Environmental concern of large water withdrawal for Hydraulic fracturing
Local water shortage
Change in groundwater and surface water quality and quantity
Aquifer compaction
Aquifer depletion
Increasing bacterial growth
DO we really need fresh water for hydraulic
fracturing?
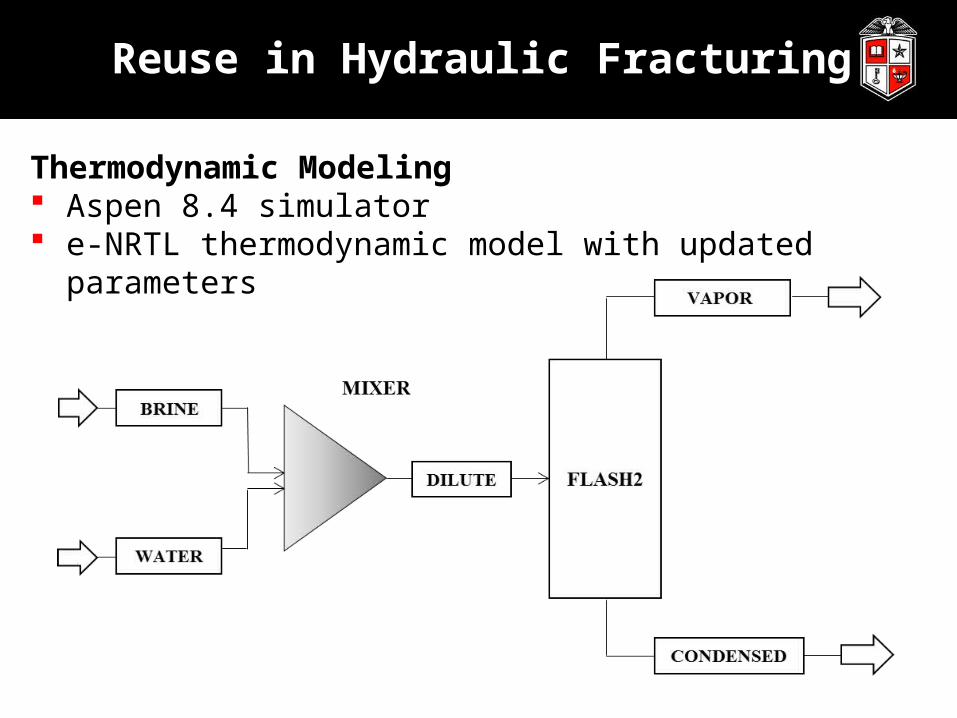
Thermodynamic Modeling Aspen 8.4 simulator e-NRTL thermodynamic model with updated parameters
Reuse in Hydraulic Fracturing
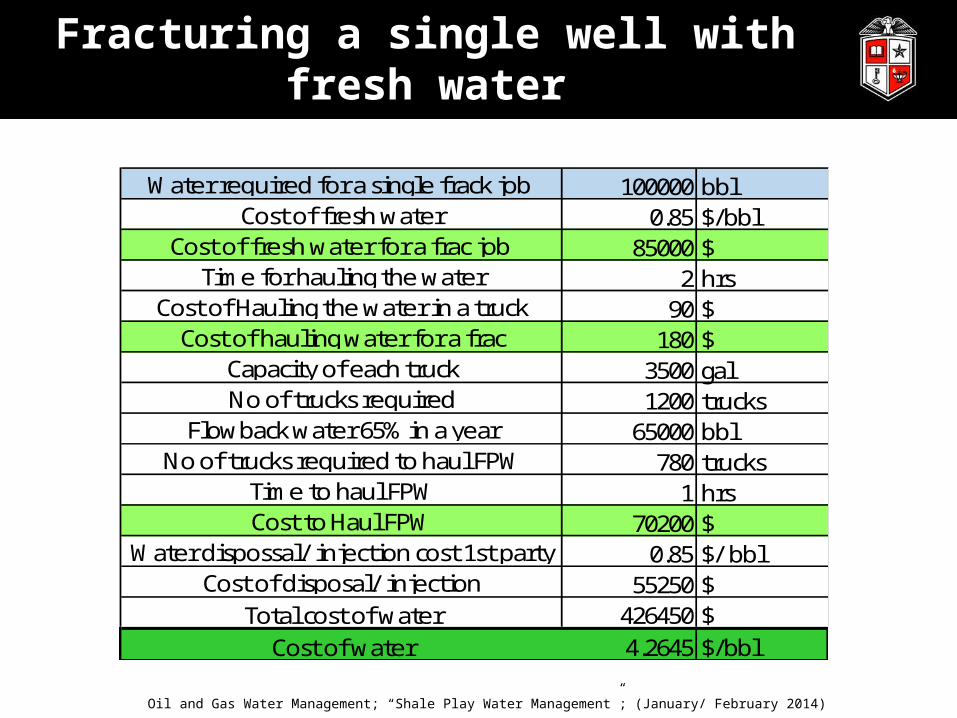
Fracturing a single well with fresh water
100000 bbl0.85 $/bbl
85000 $2 hrs
90 $180 $
3500 gal1200 trucks
65000 bbl780 trucks
1 hrs70200 $
0.85 $/ bbl55250 $
426450 $4.2645 $/bblCost of water
Water required for a single frack job Cost of fresh water
Cost of fresh water for a frac job Time for hauling the water
Cost of Hauling the water in a truckCost of hauling water for a frac
Capacity of each truckNo of trucks required
Total cost of water
Flowback water 65% in a yearNo of trucks required to haul FPW
Time to haul FPWCost to Haul FPW
Water dispossal/ injection cost 1st partyCost of disposal/ injection
Oil and Gas Water Management; “Shale Play Water Management”; (January/ February 2014)