poverty, income distribution and...
TRANSCRIPT

Carleton University
African Economic Development May 23, 2012
Poverty, Income Distribution and
Development
(Text, Chapter 7)


Agenda
1. Significance of Topic
2. Concept and Measurement
Poverty Measures
Income Distribution Measures
3. Equity, Poverty and Well-Being
4. Comments on Evidence re Poverty and Income Distribution
5. The Roots of Poverty and Income Mal-distribution
Kuznet’s “Inverted U Hypothesis”
6. Policies for Pro-Poor Growth
7. Millennium Development Goals
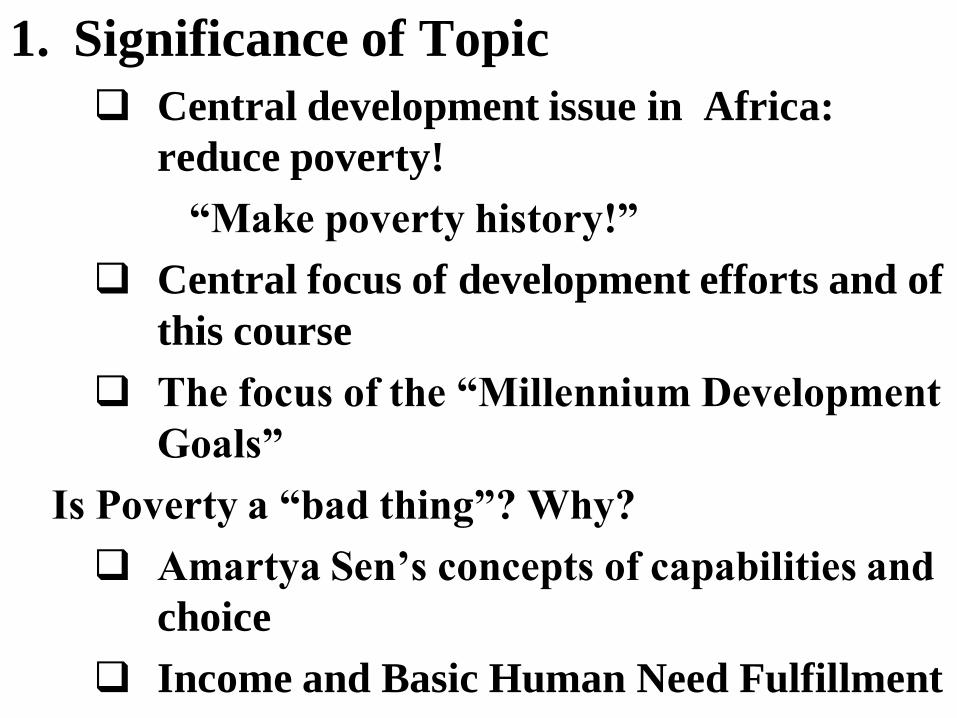
1. Significance of Topic
Central development issue in Africa:
reduce poverty!
“Make poverty history!”
Central focus of development efforts and of
this course
The focus of the “Millennium Development
Goals”
Is Poverty a “bad thing”? Why?
Amartya Sen’s concepts of capabilities and
choice
Income and Basic Human Need Fulfillment

Income Distribution:
Central to our ideas of fairness and justice
A more equitable income distribution is
supportive of both Growth and Poverty
Reduction
Growth generally reduces Poverty; But Growth
is “Neutral” regarding the “fairness” of
income distribution ……..
Unless major efforts are made to achieve distributional
objectives simultaneously with growth,

2. Concept and Measurement
Problems of Measuring Real Incomes
Income or consumption?
Accurate Information: sources
Definition of income:
Market generated Income? Or
Market generated Income + Transfers Or
Market generated Income + Transfers – Taxes? Or
Market Income + Transfers –Taxes + In-Kind Subsidies? Or
Market Income + Transfers –Taxes + In-Kind Subsidies +
Publicly-provided Education + Health Services?
Market Income + Transfers –Taxes + In-Kind Subsidies +
Education + Health + Home-Produced G $ S
Other complications: Home-produced G&S;
Differing prices
Differing needs in different circumstances

A. Poverty Concepts and Measures
1. The United Nations “Human Poverty Index”
(Used until 2009; now replaced by another measure)
Attempts to measure poverty with a composite index including:
1. Probability of not surviving to age 40;
2. Adult illiteracy rate;
3. Population without access to improved water source
4. Underweight children under age five.
2. Arbitrary Income “Cut-Offs” or Measures
e.g. population with real incomes (PPP) below some threshold such as $US 1.00 or $2.00

A. Poverty Concepts and Measures, cont’d
3. Calculations of real income necessary to meet basic human needs (used in Latin America – ECLA - and national measures)
4. Canada: “LICO” or lower income cut-off, i.e. 50% of median income;
(more a measure of distribution than of poverty)
5. Composite measures of Basic Need Fulfillment in real terms (access to water, literacy, child
mortality, etc. (as in example in text)

6. The New UNDP “Multidimensional Poverty
Index” (MPI)
• Identification of poverty status through a dual cutoff:
• First, cutoff levels within each dimension (analogous
to falling below a poverty line for example $1.25 per
day for income poverty);
• Second, cutoff in the number of dimensions in which
a person must be deprived (below a line) to be
deemed multidimensionally poor.
• MPI focuses on deprivations in health, education,
and standard of living; and each receives equal (that
is one-third of the overall total) weight.

MPI Indicators 1. Health (1/3rd weight) - two indicators with equal weight –
• whether any child has died in the family, and
• whether any adult or child in the family is malnourished –
weighted equally (each counts as one-sixth weight toward
the maximum deprivation in the MPI)
2. Education (1/3rd) - two indicators with equal weight (1/6th
each) –
• whether no household member completed 5 years of
schooling, and
• whether any school-aged child is out of school for grades 1
through 8 (each counts one-sixth toward the MPI).
3. Living Standards (1/3rd) : measured as an average of six
deprivations (1/18th each): safe water, electricity, sanitation,
flooring, improved cooking fuel, and possession of at least two
of telephone, bicycle, radio, TV, motorbike or car

Computing the MPI The MPI for the country (or region or group) is then
computed
• A convenient way to express the resulting value is
H*A, so that MPI = H*A i.e., The product of the headcount ratio “H” (the percent of people
living in multidimensional poverty), and the average intensity of
deprivation “A” (the percent of weighted indicators for which poor
households are deprived on average).
• The adjusted headcount ratio HA is readily calculated
HA satisfies some desirable properties. Important example:
Dimensional monotonicity: If a person already identified as
poor becomes deprived in another indicator she is
measured as even poorer - not the case using a simple
headcount ratio.

Multi-dimensional Poverty Indices for some African Countries
Country
MPI
2000-2008
MPI
Head-count, % of Total
Population
Population
below Poverty
Line $1.25 PPP per person
per day
Czech Rep. 0.000 0.0 0.0
China 0.056 12.5 15.9
Kenya 0.302 60.4 19.7
Ghana 0.140 30.1 30.0
Nigeria 0.582 63.5 43.4
Tanzania 0.367 65.3 88.5
Zambia 0.325 63.7 64.3
Ethiopia 0.582 90.9 39.0
Liberia 0.482 83.9 83.7
Niger 0.642 92.7 65.7

7. Measuring Poverty
Measuring Absolute Poverty
– Headcount Index: H/N
Where H is the number of persons who are poor and N is
the total number of people in the economy
– Total Poverty Gap:
Where Yp is the absolute poverty line; and Yi the income
of the ith poor person
TPG (Yp Yi)i 1
H

Measuring the Total Poverty Gap

MPI Rankings and Poverty Headcounts for Selected
Countries

Other Poverty Measures for Some African Countries, 2005
Country &
HDI Rank
Human Poverty Index
(pre-2009) (UNDP)
Per Cent
GDPpc (PPP)
$US
Population below
US$1.00 per day,
Per Cent
65. Mauritius 11.4 12,715 11.9
121. South Africa 23.5 11,110 10.5
135. Ghana 32.3 2,480 44.8
148. Kenya 30.8 1,240 22.8
151. Zimbabwe 40.3 2.038 56.1
154. Uganda 34.7 1,454 11,9
158. Nigeria 37.3 1.128 70.8
159. Tanzania 32.5 744 57.8
169. Ethiopia 54.9 1,055 23.0
177. Sierra Leone 51.7 806 57.0
81. China 11,7 7,100 9.9
Source: UNDP. Human Development Report, 2007/2008

Human Development Indices, Africa, 1975-2005
Country 1974 1985 1995 2005
Mauritius na .692 .751 .804
South
Africa
.650 .690 .745 .674
Ghana .442 .482 .542 .553
Kenya .466 .534 .544 .521
Zimbabwe .550 .615 .613 .513
Uganda na .420 .433 .545
Nigeria .321 .391 .432 .470
Tanzania na na .419 .467
Ethiopia na .311 .347 .406
China .530 ,595 .691 .777 Source: UNDP. Human Development Report, 2007/2008

Income Distribution and Well-Being
Income distribution and poverty: the differences
The Broad-Based Sense of “Fairness”
– Religious Basis
– Design of Human Institutions
• The Law;
• United Nations
• Welfare states & income taxation
• Democracy and human rights
• Development assistance
– Economistic “Games” showing that generally people
prefer Fairness

Income Distribution:
Central to our ideas of fairness and justice
A more equitable income distribution is supportive of
both Growth and Poverty Reduction
Growth generally reduces Poverty; But Growth may be
“Neutral” regarding income distribution
(Unless major efforts are made to achieve distributional
objectives simultaneously with growth)
Incentives and Income Distribution

Vote !!

Perceptions of Individual Well-Being and Happiness
Liberia Kenya USA Canada
Overall Life Satisfaction
Min 0 to 10 Max
3.4
3.7
7.5
8.0
Satisfaction with Standard of
Living (%)
46
25
75
87
Happiness:
Purposeful Life
100
98
95
91
Happiness:
Treated with Respect
82
78
94
93
Negative Life Experience
17 19 28 25
Source: UNDP Human Development Report 2010

Income Distribution Concepts and
Measures
1. Income shares of groups in the population
(quintiles or deciles)
2. Ratios of shares,
e.g. income share of top 10% / income share of poorest
10%
3. Lorenz Curve (See text, pp37-41)
4. Gini Coefficient (in class)

Figure 5.2 The Greater the Curvature of the Lorenz
Line, the Greater the Relative Degree of Inequality

Figure 5.3 Estimating the Gini Coefficient

4. Evidence re Income Distribution
Some International Comparisons

Income Distribution Measures for Some African Countries
Country Gini
Coefficient
Income Share of
Richest 20%
Poorest 20 %
Income Share
of Poorest
20%
Income Share
of Richest
20%
S. Africa .578 17.0 3.5% 62.2
Ghana .408 8.4 5.6 46.6
Kenya .425 8,2 6.0 49.1
Zimbabwe .501 12.0 4.6 55.7
Uganda .357 9.2 5.7 52.5
Nigeria .429 9.1 5.1 48.6
Tanzania .346 5.8 7.3 42.4
Ethiopia .399 4.3 9.1 39.4
Sierra Leone .629 57.6 1.1 63.4
China .570 12.2 4,3 51.9
Source: UNDP. Human Development Report, 2007/2008

“Who are the “’Poor’” in Africa?
Domestic Aspects
– Rural character
– Regional dimension
– Gender & children
– Indigenous dimension
Characteristics of the poor:
– Assets;
– Human capital (education, health);
– Income vulnerability
– Weak access to public services,
– Environmentally hostile environments,
– Lack of supportive networks

5. The Roots of Income Mal-distribution
in Africa (and Poverty to some extent)
1. Historical Inheritance and its Momentum:
A. Pre-Colonial Social Structures
Significant levels of equality in pre-colonial
eras;
High equality for “hunting and gathering”
peoples

B.Impacts of Colonialism
Unequal property rights and institutions
imposed by colonial powers
Imperial country living standards for
colonizers; traditional levels for Africans
Public services directed at settler peoples,
not indigenous peoples
Colonial hierarchies: Social stratification
based on Race and Ethnicity

2. Political Factors: Disproportionate power and influence of
elites and moneyed interests (e.g. property, gender, and literacy qualifications to the vote until recently)
Result:
– Public Policy has often been shaped in their interests
Thus:
– “Urban bias”
– “Upper and middle income class bias” and
– “Modern sector bias” in public policy

3. The Nature of the “Modernization”
Process:
Does a “Rising Tide Lift all Boats”?
Would you expect that a process of
modernization / development would
improve everyone’s living standards
simultaneously?
What forces generate “Inequities”?
“Equities”?

Note the
Latin American
Effect

3. The Nature of the “Modernization”
process: Forces Generating Inequalities
“Scarce capital” generates high returns for
its owners;
Scarce skilled labour generates higher
incomes for those with crucial skills;
Abundant unskilled labour generates low
wages and incomes;

3. The Nature of the “Modernization” process:
Forces Generating Inequalities, cont’d
International technological transfer: much
recent vintage technology is “labour-saving,”
thereby reducing the demand for labour and
thus wages and incomes.
“Backwash Effects” of “modernization” and
tech. change
Uneven access to opportunities
• Prior Elites;
• Regional Advantages;
• Personal Advantages

3. continued: The Nature of the “Modernization”
Process: Forces Generating Greater Equalities
The exhaustion of surplus labour in agriculture and
the informal economy?
Increasing productivity generally promotes rising
incomes in supporting service-type activities
Broadening Tax Base permits social programs &
welfare state type programs
Broadening human development (education health
etc.) broadens earning capabilities
Regional and rural-urban spread effects
• rising demand for goods and services from
elsewhere;
• linkage effects

Emphasis on
Human
Development
South Korea: Causal Factors Shaping Income Distribution and Growth
Successful
Export
Promotion
Good
Macroeconomic
Management
Good Private-
Public
Gov’t Market Mix
Land Reform
Coops;
Well Qualified
Labour Force
Population
Deceleration
Lower LF
Growth Rate
Rapid Job
Creation
Egalitarian Urban
Income Distribution
Rural-Urban
Equity
Egalitarian
Rural Distribution;
Income Growth
Rural Urban
Balance Agricultural
Expansion
Rapid Growth of
Manufacturing
Rapid Growth, Distributional Equity, Poverty Reduction [HDI: # 15 in world; 1970: .707; 2005 .901; Gini: 0.316; Growth pc, 1975-03: 6.1% pa]
Price Policy
Activist and Expanding
Social Policies
Increasing Taxes

Empirical Validity of Kuznets” Hypothesis?
Which effects predominate?

Note the
Latin American
Effect
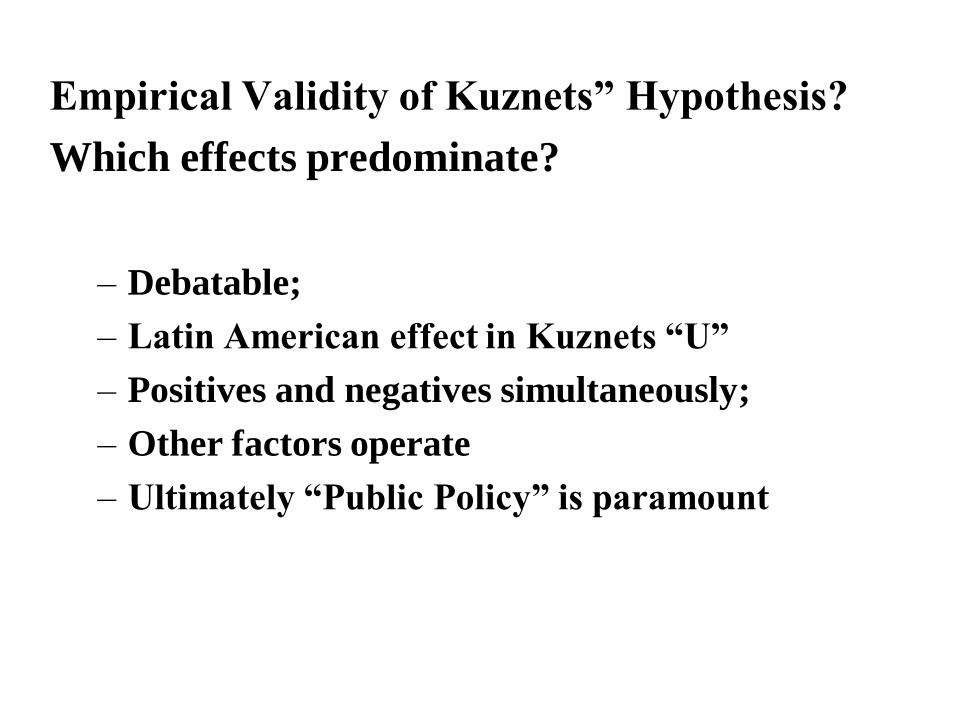
Empirical Validity of Kuznets” Hypothesis?
Which effects predominate?
– Debatable;
– Latin American effect in Kuznets “U”
– Positives and negatives simultaneously;
– Other factors operate
– Ultimately “Public Policy” is paramount

4. Nature of Development Strategies (and Theorizing):
Early Theorizing: • Capital-Centered theories,
• Dualistic Development Models (W.A. Lewis)
• The Soviet Model,
• Prebisch - UN ECLAC)
• W. W. Rostow ………….
All emphasized
Growth first; income distribution later;
• Investment in the Modern Sector, esp. Industry;
• Import-substituting industrialization;
• Investment in physical capital
• De-emphasize traditional economy and informal sector

5. “Neo-Liberal” or “Washington Consensus” approach focused on growth first.
• Escape from hyper-inflation, macro-economic and external sector unsustainability and debt, led to “structural adjustment” programs
• which often generated “short-term pain” hopefully but not always for “long term gain”

6. Demographic and Sociological Factors:
“The Poor Have More Children:” large family
size among the poor
• reduces family investment per child and
• reduces possible inheritances per child vis-à-vis
the rich;
Labour force participation for poor women is low vis-
à-vis rich women;
• Higher female labour force participation rates for
better-off women raise family incomes for better-off
groups.
The rural poor sometimes have little alternative to
damaging their own environment, often resulting in
worsening future poverty.

7. “Market Power”
– Concentrated ownership patterns
– Monopoly and oligopoly power of
enterprise and individuals
– The power of professional associations,
unions and organized groups
– Political power determining income
patterns

8. International Factors
– Multinational Enterprise: islands of modernity and higher incomes
– Technological Transfer of modern capital-intensive machinery and equipment
higher incomes for some
– Internationally transferable skills help generate international income levels for some, while the unskilled remain with low incomes.

6. Policies for Pro-Poor Growth Possible Approaches and Components of Poverty
Reduction and Equity-Oriented Programs
1. Achieve Sustained Economic Growth Exceeding population growth rates;
• Permitting rising levels of personal or family
income and tax revenues;
• Permitting significant levels of domestic &
national savings
[Note: this is a necessary but insufficient
condition for enduring reductions in poverty]

2. Strive for “Equity with Growth”
– Make the growth process compatible
with equity, that is poverty reduction,
improved income distribution and
human development for low income
groups
– Focus sharply on the poorest.
– HOW?

3. Emphasize Investment in Human Development – Fairly Allocated
– Education, Health, Nutrition, Clean Water, Sanitation,
– Family Planning
– Build the capabilities of the state to provide necessary public goods
• [i.e. effective and efficient Tax Administration
– Plus effective and incorruptible public administration.]


4. Increase Demand for the abundant resource of the poor, namely labour, [i.e. rapid job creation]
[Difficult due to China’s manufacturing dominance due to cheap labour, mega-economies of large scale, undervalued exchange rate]
Improve the appropriateness of technology?
At an Appropriate Time, Switch from Import Substituting Industrialization to Job-creating Export Promotion
Promote labour intensive public works and infrastructure, especially that serving the needs of the poor;

5. Invest in the Physical Assets of the Poor
Support the “Informal Sector” [in various
ways;]
– Note the role of “Micro-credit”
Support Urban Development for low income
neighbourhoods [water, sanitation, sidewalks,
streets, electricity, security, etc.]
Support Agriculture and Rural Development,
focusing on low income rural peoples
– Rural roads; water & sanitation; drainage &
irrigation; garbage collection, law and order,
electrification in time

Avoid hyper-concentrated
urbanization and “First City” Bias
Promote Agriculture & Rural
Development
Regional Development;

7. Redistribute Assets
Land Reform of various sorts;
Democratic ownership patterns;
• Cooperative Property forms
• Taxation towards equity
• Favour small & local enterprise?
• Democratization of private ownership
Support Territorial Claims of
Indigenous Peoples;

8. Construct Safety Nets and Transfers as possible [for middle income countries]
Target the neediest groups;
Support Human development –promoting activities
[e.g. as in Brazil under Lula, financial support for the poorest families that keep their children in school;
or as in Chile, where school lunches programs are provided in low income neighbourhoods]