labor markets, poverty, and income distribution
DESCRIPTION
Labor Markets, Poverty, and Income Distribution. Introduction. Observations People with similar skills earn very different incomes. Some of the world’s wealthiest people come from poor countries. Many Americans are homeless and malnourished. The Economic Value of Work. The Market for Labor - PowerPoint PPT PresentationTRANSCRIPT

MB MC
Labor Markets, Poverty, and
Income Distribution
Labor Markets, Poverty, and
Income Distribution

Chapter 14: Labor Markets,Poverty, and Income Distribution
Slide 2
MB MC
Copyright c 2007 by The McGraw-HillCompanies, Inc. All rights reserved.
Introduction
ObservationsPeople with similar skills earn very different
incomes.Some of the world’s wealthiest people
come from poor countries.Many Americans are homeless and
malnourished.

Chapter 14: Labor Markets,Poverty, and Income Distribution
Slide 3
MB MC
Copyright c 2007 by The McGraw-HillCompanies, Inc. All rights reserved.
The Economic Value of Work
The Market for LaborEquilibrium wage and quantity are
determined by the supply of and demand for a specific category of labor.
Changes in supply and demand will change the equilibrium wage and quantity.

Chapter 14: Labor Markets,Poverty, and Income Distribution
Slide 4
MB MC
Copyright c 2007 by The McGraw-HillCompanies, Inc. All rights reserved.
The Economic Value of Work
ObservationWages will differ among workers with
different levels of productive ability.
ExampleHow much will potters earn?

Chapter 14: Labor Markets,Poverty, and Income Distribution
Slide 5
MB MC
Copyright c 2007 by The McGraw-HillCompanies, Inc. All rights reserved.
The Economic Value of Work
Mackintosh Pottery Works:Is in a competitive market.Price of pots = $1.10/each.Clay is available at no cost and is the only
input.Rennie and Laura are the only potters.Cost = $0.10 handling fee/pot.Rennie produces 100 pots/wk and Laura
produces 120 pots/wk.
Chapter 14: Labor Markets,Poverty, and Income Distribution
Slide 6
MB MC
Copyright c 2007 by The McGraw-HillCompanies, Inc. All rights reserved.
The Economic Value of Work
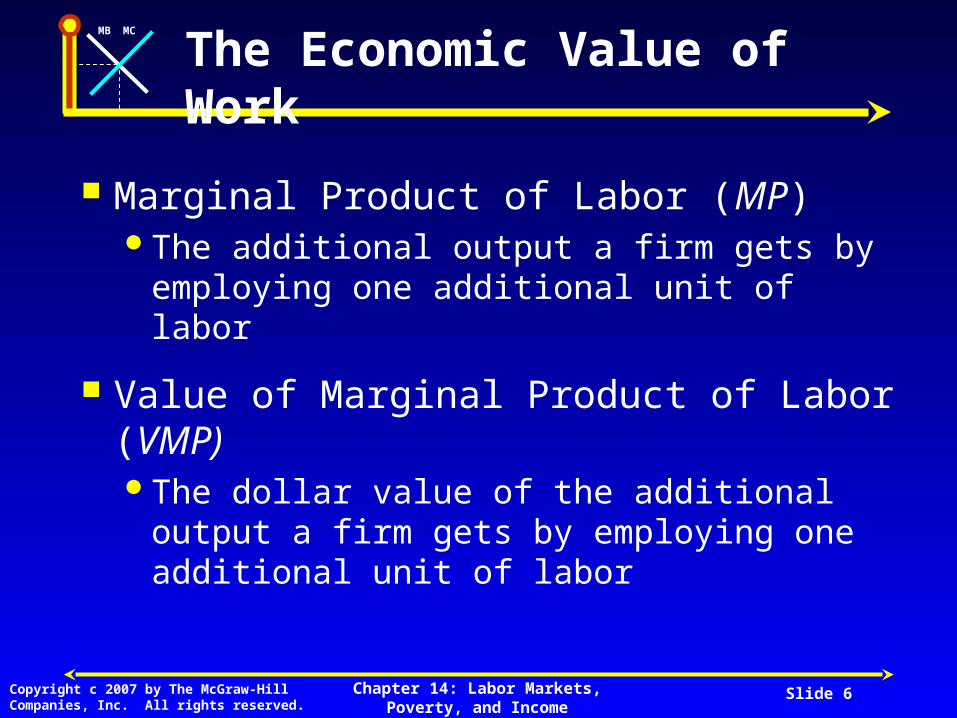
Marginal Product of Labor (MP)The additional output a firm gets by
employing one additional unit of labor
Value of Marginal Product of Labor (VMP)The dollar value of the additional output a
firm gets by employing one additional unit of labor

Chapter 14: Labor Markets,Poverty, and Income Distribution
Slide 7
MB MC
Copyright c 2007 by The McGraw-HillCompanies, Inc. All rights reserved.
The Economic Value of Work
Assuming a competitive labor market:Rennie’s wage will be $100.Laura’s wage will be $120.
The wage equals the value of marginal product (VMP).
Chapter 14: Labor Markets,Poverty, and Income Distribution
Slide 8
MB MC
Copyright c 2007 by The McGraw-HillCompanies, Inc. All rights reserved.
The Economic Value of Work
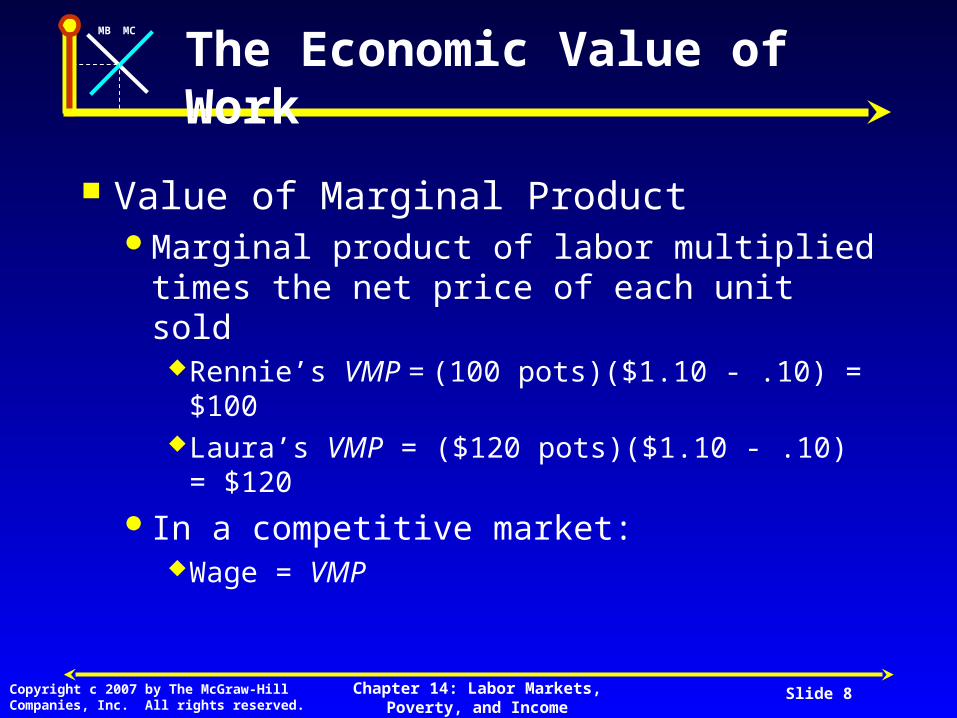
Value of Marginal ProductMarginal product of labor multiplied times
the net price of each unit soldRennie’s VMP = (100 pots)($1.10 - .10) = $100Laura’s VMP = ($120 pots)($1.10 - .10) = $120
In a competitive market:Wage = VMP

Chapter 14: Labor Markets,Poverty, and Income Distribution
Slide 9
MB MC
Copyright c 2007 by The McGraw-HillCompanies, Inc. All rights reserved.
Employment and Productivity in a Woodworking Company (when cutting boards sell for $20 each)
Number of workers
Total number of cutting
boards/weekVMP
($/week)
MP(extra cuttingboards/week)
0 0
1 30
2 55
3 76
4 94
5 108
30 600
25 500
21 420
18 360
14 280
•Competitive labor market•Wage = $350/wk•MP reflects diminish returns•If VMP > wage - continue to hire
•Adirondack would hire 4 workers•At a given wage the number employed depends on:
•MP of the worker•Price of the product

Chapter 14: Labor Markets,Poverty, and Income Distribution
Slide 10
MB MC
Copyright c 2007 by The McGraw-HillCompanies, Inc. All rights reserved.
The Occupational Demand for Labor
Employment in firm 1(person-hours/day)
Wag
e ($
/ho
ur)
Employment in firm 2(person-hours/day)
Wag
e ($
/ho
ur)
D1 = VMP1 D2 = VMP2
6
12
100 150
6
12
50 100
+
+

Chapter 14: Labor Markets,Poverty, and Income Distribution
Slide 11
MB MC
Copyright c 2007 by The McGraw-HillCompanies, Inc. All rights reserved.
The Occupational Demand for Labor
Total Employment(person-hours/day)
Wag
e ($
/ho
ur)
D = VMP1 + VMP2
250150
6
12
=
=

Chapter 14: Labor Markets,Poverty, and Income Distribution
Slide 12
MB MC
Copyright c 2007 by The McGraw-HillCompanies, Inc. All rights reserved.
The Supply Curve of Labor
Employment of programmers(person-hours/year)
Wag
e ($
/ho
ur)
S
L2L1
W1
W2
• Supply for a specific occupation is upward-sloping.
• Supply for the economy may be vertical or downward-sloping.

Chapter 14: Labor Markets,Poverty, and Income Distribution
Slide 13
MB MC
Copyright c 2007 by The McGraw-HillCompanies, Inc. All rights reserved.
The Effect of an Increase in the Demand for Computer Programmers
Employment of programmers(person-hours/year)
Wag
e ($
/ho
ur)
S
L1
W1
D1
L2
W2
D2
• Changes in equilibrium W & Q occur when the supply and/or demand for labor changes.

Chapter 14: Labor Markets,Poverty, and Income Distribution
Slide 14
MB MC
Copyright c 2007 by The McGraw-HillCompanies, Inc. All rights reserved.
Explaining Differences in Earnings
When labor markets are competitive, differences in wages are determined by differences in VMPs.

Chapter 14: Labor Markets,Poverty, and Income Distribution
Slide 15
MB MC
Copyright c 2007 by The McGraw-HillCompanies, Inc. All rights reserved.
Explaining Differences in VMPsHuman Capital
An amalgam of factors such as education, training, experience, intelligence, energy, work habits, trustworthiness, and initiative that affect the value of a worker’s marginal product.
Explaining Differences in Earnings

Chapter 14: Labor Markets,Poverty, and Income Distribution
Slide 16
MB MC
Copyright c 2007 by The McGraw-HillCompanies, Inc. All rights reserved.
Explaining Differences in VMPsHuman Capital Theory
A theory of pay determination that says a worker’s wage will be proportional to his or her stock of human capital
Explaining Differences in Earnings
Chapter 14: Labor Markets,Poverty, and Income Distribution
Slide 17
MB MC
Copyright c 2007 by The McGraw-HillCompanies, Inc. All rights reserved.
Explaining Differences in VMPsLabor Union
A group of workers who bargain collectively with employers for better wages and working conditions
Explaining Differences in Earnings

Chapter 14: Labor Markets,Poverty, and Income Distribution
Slide 18
MB MC
Copyright c 2007 by The McGraw-HillCompanies, Inc. All rights reserved.
Explaining Differences in VMPsChanges in demand can influence the
value of human capital.
Explaining Differences in Earnings
Chapter 14: Labor Markets,Poverty, and Income Distribution
Slide 19
MB MC
Copyright c 2007 by The McGraw-HillCompanies, Inc. All rights reserved.
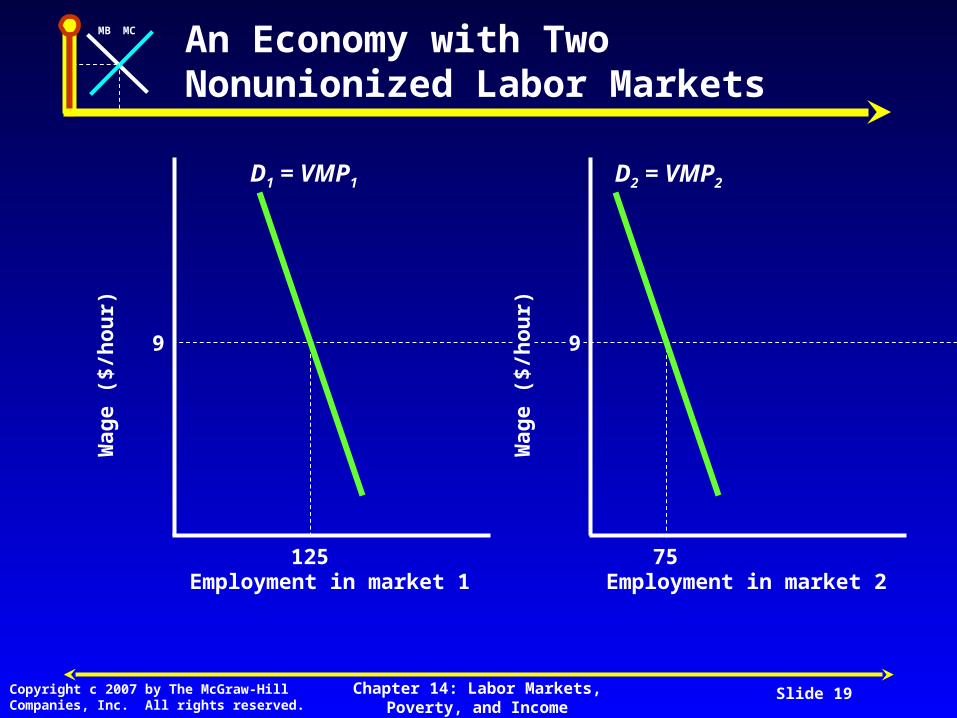
An Economy with Two Nonunionized Labor Markets
Employment in market 1
Wag
e ($
/ho
ur)
Employment in market 2
Wag
e ($
/ho
ur)
125
9
75
9
D1 = VMP1 D2 = VMP2

Chapter 14: Labor Markets,Poverty, and Income Distribution
Slide 20
MB MC
Copyright c 2007 by The McGraw-HillCompanies, Inc. All rights reserved.
An Economy with Two Nonunionized Labor Markets
Total employment(workers/day)
Wag
e ($
/ho
ur)
S0
200
9
D = VMP1 + VMP2
• A nonunionized labor market
•W = $9 & Q = 200

Chapter 14: Labor Markets,Poverty, and Income Distribution
Slide 21
MB MC
Copyright c 2007 by The McGraw-HillCompanies, Inc. All rights reserved.
The Effect of a Union Wage Above the Equilibrium Wage
Employment in market 1(unionized market)
Wag
e ($
/ho
ur)
D1 = VMP1
125
WU = 12
Employment in market 2(nonunionized market)
Wag
e ($
/ho
ur)
75 100
D2 = VMP2
9
WN = 6
9
100
• Market 1 unionizes and sets W = $12
• Employment falls to 100
• Mkt 2 W falls to $6 and employment increases to 100
• Loss in economic surplus

Chapter 14: Labor Markets,Poverty, and Income Distribution
Slide 22
MB MC
Copyright c 2007 by The McGraw-HillCompanies, Inc. All rights reserved.
Economic NaturalistIf unionized firms have to pay more, how
do they manage to survive in the face of competition from their nonunionized counterparts?
Explaining Differences in Earnings

Chapter 14: Labor Markets,Poverty, and Income Distribution
Slide 23
MB MC
Copyright c 2007 by The McGraw-HillCompanies, Inc. All rights reserved.
Economic NaturalistUnionization may increase productivity by:
Allowing employers to set higher employment standards.
Improving communication.Improving morale.Reducing turnover.
Explaining Differences in Earnings

Chapter 14: Labor Markets,Poverty, and Income Distribution
Slide 24
MB MC
Copyright c 2007 by The McGraw-HillCompanies, Inc. All rights reserved.
Economic NaturalistThe impact of unions on wage differentials
is probably small because:The union wage premium is small.Only 1 in 6 workers belong to a union.
Explaining Differences in Earnings
Chapter 14: Labor Markets,Poverty, and Income Distribution
Slide 25
MB MC
Copyright c 2007 by The McGraw-HillCompanies, Inc. All rights reserved.
Compensating Wage DifferentialsThe wage rate depends on the VMP and
the working conditions.
Explaining Differences in Earnings

Chapter 14: Labor Markets,Poverty, and Income Distribution
Slide 26
MB MC
Copyright c 2007 by The McGraw-HillCompanies, Inc. All rights reserved.
Economic NaturalistWhy do some ad copy writers earn more
than others?
Explaining Differences in Earnings

Chapter 14: Labor Markets,Poverty, and Income Distribution
Slide 27
MB MC
Copyright c 2007 by The McGraw-HillCompanies, Inc. All rights reserved.
Economic NaturalistWhich job would you choose?
Writing ad copy for the American Cancer Society or Camel cigarettes
o They both pay the same, $30,000/yro Both have the same prospects for advancement
How much would you have to be paid to switch?
Explaining Differences in Earnings

Chapter 14: Labor Markets,Poverty, and Income Distribution
Slide 28
MB MC
Copyright c 2007 by The McGraw-HillCompanies, Inc. All rights reserved.
Economic NaturalistCornell Survey
90% chose the American Cancer SocietyMedian wage premium = $15,000
Explaining Differences in Earnings

Chapter 14: Labor Markets,Poverty, and Income Distribution
Slide 29
MB MC
Copyright c 2007 by The McGraw-HillCompanies, Inc. All rights reserved.
Compensating Wage DifferentialThe differences in the wage rate -- positive
or negative -- that reflects the attractiveness of a job’s working conditions
ExamplesJob safety
o Police and fire-fighters
Scheduleso Day vs. nighto Teachers
Explaining Differences in Earnings

Chapter 14: Labor Markets,Poverty, and Income Distribution
Slide 30
MB MC
Copyright c 2007 by The McGraw-HillCompanies, Inc. All rights reserved.
Discrimination in the Labor MarketCompetitive labor theory predicts that
wage differentials not based on differences in VMP will be eliminated.
However, women and minorities continue to receive lower wages than white males with similar measures of human capital.
Explaining Differences in Earnings
Chapter 14: Labor Markets,Poverty, and Income Distribution
Slide 31
MB MC
Copyright c 2007 by The McGraw-HillCompanies, Inc. All rights reserved.
Employer DiscriminationAn arbitrary preference by an employer for
one group of workers over another
Explaining Differences in Earnings

Chapter 14: Labor Markets,Poverty, and Income Distribution
Slide 32
MB MC
Copyright c 2007 by The McGraw-HillCompanies, Inc. All rights reserved.
Discrimination by EmployersAssume
Male and female employees are equally productive.
An employer prefers to hire male employees.Male employees are paid more.
Explaining Differences in Earnings

Chapter 14: Labor Markets,Poverty, and Income Distribution
Slide 33
MB MC
Copyright c 2007 by The McGraw-HillCompanies, Inc. All rights reserved.
Discrimination by EmployersThen:
The discriminating firm’s profit will be less.Firm’s employing females will be more
profitable.The demand for females will increase and
female wage rates will rise until it equals the wage for males and the VMP.
To discriminate, the employers would pay males a wage that is greater than their VMP and reduce their profit.
Explaining Differences in Earnings

Chapter 14: Labor Markets,Poverty, and Income Distribution
Slide 34
MB MC
Copyright c 2007 by The McGraw-HillCompanies, Inc. All rights reserved.
Discrimination by OthersCustomer Discrimination
The willingness of consumers to pay more for a product produced by members of a favored group, even if the quality of the product is unaffected
Socialization within the family
Explaining Differences in Earnings
Chapter 14: Labor Markets,Poverty, and Income Distribution
Slide 35
MB MC
Copyright c 2007 by The McGraw-HillCompanies, Inc. All rights reserved.
Other Sources of the Wage GapWillingness to accept riskQuality versus quantity of educationCourses taken and degrees pursued by
sex and race
Explaining Differences in Earnings

Chapter 14: Labor Markets,Poverty, and Income Distribution
Slide 36
MB MC
Copyright c 2007 by The McGraw-HillCompanies, Inc. All rights reserved.
Winner-Take-All MarketsOne in which small differences in human
capital translate into large differences in pay
Explaining Differences in Earnings

Chapter 14: Labor Markets,Poverty, and Income Distribution
Slide 37
MB MC
Copyright c 2007 by The McGraw-HillCompanies, Inc. All rights reserved.
Economic NaturalistWhy does Renee Fleming earn millions
more than sopranos of only slightly lesser ability?
Explaining Differences in Earnings
Chapter 14: Labor Markets,Poverty, and Income Distribution
Slide 38
MB MC
Copyright c 2007 by The McGraw-HillCompanies, Inc. All rights reserved.
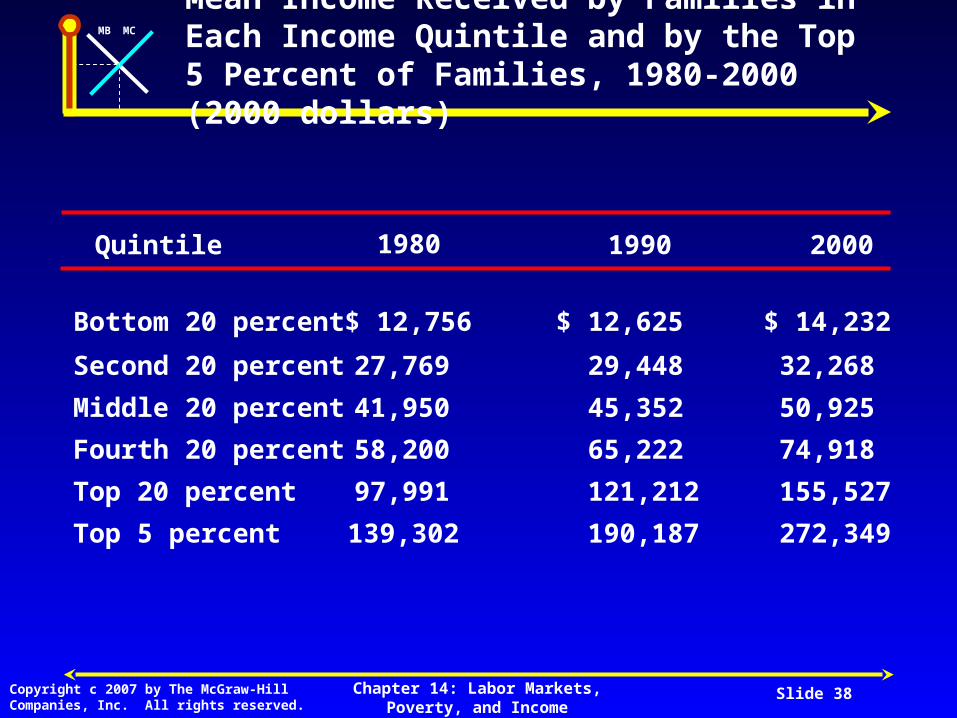
Mean Income Received by Families in Each Income Quintile and by the Top 5 Percent of Families, 1980-2000 (2000 dollars)
Quintile 1980 20001990
Bottom 20 percent $ 12,756 $ 12,625 $ 14,232
Second 20 percent 27,769 29,448 32,268
Middle 20 percent 41,950 45,352 50,925
Fourth 20 percent 58,200 65,222 74,918
Top 20 percent 97,991 121,212 155,527
Top 5 percent 139,302 190,187 272,349

Chapter 14: Labor Markets,Poverty, and Income Distribution
Slide 39
MB MC
Copyright c 2007 by The McGraw-HillCompanies, Inc. All rights reserved.
Recent Trends in Inequality
ObservationsFrom WWII to the 1970s income growth
was almost 3%/yr for all groups.From 1980-2000 the income growth of the
bottom 20% was less than half of 1%.Real income of the top 1% more then
doubled from 1980 - 2000.

Chapter 14: Labor Markets,Poverty, and Income Distribution
Slide 40
MB MC
Copyright c 2007 by The McGraw-HillCompanies, Inc. All rights reserved.
Recent Trends in Inequality
ObservationsIn 1980, CEOs earned 42 times as much
as the average worker; today they earn 500 times as much.
The U.S. has a high degree of upward and downward economic mobility.

Chapter 14: Labor Markets,Poverty, and Income Distribution
Slide 41
MB MC
Copyright c 2007 by The McGraw-HillCompanies, Inc. All rights reserved.
Is Income Inequalitya Moral Problem?
Choosing the Rules for Distributing IncomeAssume
A “veil of ignorance”National income is fixedMost people are risk adverse

Chapter 14: Labor Markets,Poverty, and Income Distribution
Slide 42
MB MC
Copyright c 2007 by The McGraw-HillCompanies, Inc. All rights reserved.
Is Income Inequalitya Moral Problem?
What Do You Think?How would people choose to allocate the
income?
Chapter 14: Labor Markets,Poverty, and Income Distribution
Slide 43
MB MC
Copyright c 2007 by The McGraw-HillCompanies, Inc. All rights reserved.
Is Income Inequalitya Moral Problem?
What Do You Think?What would happen to the incentive to
work if wealth depended on productivity and everyone was guaranteed an equal amount of income?
Chapter 14: Labor Markets,Poverty, and Income Distribution
Slide 44
MB MC
Copyright c 2007 by The McGraw-HillCompanies, Inc. All rights reserved.
Is Income Inequalitya Moral Problem?
Rewards for hard work and risk taking raise national income.
Such rewards lead to inequality.

Chapter 14: Labor Markets,Poverty, and Income Distribution
Slide 45
MB MC
Copyright c 2007 by The McGraw-HillCompanies, Inc. All rights reserved.
Is Income Inequalitya Moral Problem?
The inequality created by a market system may be inefficient if people would choose less inequality when choosing distributional rules from behind a “veil of ignorance.”

Chapter 14: Labor Markets,Poverty, and Income Distribution
Slide 46
MB MC
Copyright c 2007 by The McGraw-HillCompanies, Inc. All rights reserved.
Methods of Income Redistribution
Difficulties in Developing Programs to Reduce Income InequalityIdentifying who will receive benefitsUndermining the incentive to work

Chapter 14: Labor Markets,Poverty, and Income Distribution
Slide 47
MB MC
Copyright c 2007 by The McGraw-HillCompanies, Inc. All rights reserved.
Methods of Income Redistribution
Welfare Payments and In-kind TransfersAssistance to the poor includes:
Cash transfersIn-kind transfers
Chapter 14: Labor Markets,Poverty, and Income Distribution
Slide 48
MB MC
Copyright c 2007 by The McGraw-HillCompanies, Inc. All rights reserved.
Methods of Income Redistribution
In-Kind TransferA payment made not in the form of cash,
but in the form of a good or service

Chapter 14: Labor Markets,Poverty, and Income Distribution
Slide 49
MB MC
Copyright c 2007 by The McGraw-HillCompanies, Inc. All rights reserved.
Methods of Income Redistribution
Welfare Payments and In-kind TransfersAid to Families with Dependent Children
(AFDC)Federal Cash Transfer ProgramCriticisms
o Created an incentive for the father to leave the household
o Reduced the incentive to work

Chapter 14: Labor Markets,Poverty, and Income Distribution
Slide 50
MB MC
Copyright c 2007 by The McGraw-HillCompanies, Inc. All rights reserved.
Methods of Income Redistribution
Welfare Payments and In-kind Transfers1996 Personal Responsibility Act
Responsibility of welfare transferred to the states
States receive a lump-sum payment from the federal government
Five-year lifetime limit on receipt of benefitsDebatable on how successful the program has
been

Chapter 14: Labor Markets,Poverty, and Income Distribution
Slide 51
MB MC
Copyright c 2007 by The McGraw-HillCompanies, Inc. All rights reserved.
Methods of Income Redistribution
Means-Tested Benefit ProgramsBenefit level declines as the recipient
earns additional incomeMay make people better off if they do not
workCostly to administer

Chapter 14: Labor Markets,Poverty, and Income Distribution
Slide 52
MB MC
Copyright c 2007 by The McGraw-HillCompanies, Inc. All rights reserved.
Methods of Income Redistribution
The Negative Income Tax (NIT)Every person would receive a tax credit.A person with no income would receive the
credit in cash.People who earn income would receive the
tax credit and pay taxes on their income at less than 100%.

Chapter 14: Labor Markets,Poverty, and Income Distribution
Slide 53
MB MC
Copyright c 2007 by The McGraw-HillCompanies, Inc. All rights reserved.
Methods of Income Redistribution
The Negative Income Tax (NIT)Advantages
Incentive to workLower administrative cost

Chapter 14: Labor Markets,Poverty, and Income Distribution
Slide 54
MB MC
Copyright c 2007 by The McGraw-HillCompanies, Inc. All rights reserved.
Methods of Income Redistribution
The Negative Income Tax (NIT)An Example
Poverty threshold in 2001 = $18,000 for a family of four living in a city
Assume the NIT credit = $18,000Eight families pool their payments ($144,000)
and move to a rural location and produce their own food

Chapter 14: Labor Markets,Poverty, and Income Distribution
Slide 55
MB MC
Copyright c 2007 by The McGraw-HillCompanies, Inc. All rights reserved.
Methods of Income Redistribution
The Negative Income Tax (NIT)An Example
Creates and incentive not to workThe political cost is high because the NIT
guarantees income to all who do not work

Chapter 14: Labor Markets,Poverty, and Income Distribution
Slide 56
MB MC
Copyright c 2007 by The McGraw-HillCompanies, Inc. All rights reserved.
W
L0L1
Wmin
Unemployment
The Effect of Minimum Wage Legislation on Employment
Employment
Wag
e ($
/ho
ur)
S
D

Chapter 14: Labor Markets,Poverty, and Income Distribution
Slide 57
MB MC
Copyright c 2007 by The McGraw-HillCompanies, Inc. All rights reserved.
Employer surpluswithout minimum wage
Worker surpluswithoutminimum wage
Worker and Employer Surplus in an Unregulated Labor Market
L (person-hours/day)
W (
$/h
ou
r)
By how much will a minimum wage reduce total economic surplus?
S
D
5,000
5
10
10,0000

Chapter 14: Labor Markets,Poverty, and Income Distribution
Slide 58
MB MC
Copyright c 2007 by The McGraw-HillCompanies, Inc. All rights reserved.
The Effect of a Minimum Wageon Economic Surplus
S
W (
$/h
ou
r)
D
5,000
5
10
10,0003,000
3
7
L (person-hours/day)0
Employer surpluswith minimum wage
Worker surpluswith minimumwage
Reduction in total surpluscaused by minimum wage
Chapter 14: Labor Markets,Poverty, and Income Distribution
Slide 59
MB MC
Copyright c 2007 by The McGraw-HillCompanies, Inc. All rights reserved.
Methods of Income Redistribution
The Earned-Income Tax Credit (EITC)A policy under which low-income workers
receive credits on their federal income taxIn 2004, family of four with earned income
of $13,000 had an EITC of $4,000.

Chapter 14: Labor Markets,Poverty, and Income Distribution
Slide 60
MB MC
Copyright c 2007 by The McGraw-HillCompanies, Inc. All rights reserved.
Methods of Income Redistribution
ExampleUsing an Earned-Income Tax Credit
With no minimum wage, employment = 5,000 person-hours/day
Workers get paid $5/hrWorker surplus is $4,000/day less than with the
minimum wageThe tax credit would be $0.80/hr for 5,000
person hours/day
Chapter 14: Labor Markets,Poverty, and Income Distribution
Slide 61
MB MC
Copyright c 2007 by The McGraw-HillCompanies, Inc. All rights reserved.
Methods of Income Redistribution
ExampleIf the EITC were financed by a $4,000 tax
on employers, employer surplus would be $4,000 greater than under the $7 minimum wage.

Chapter 14: Labor Markets,Poverty, and Income Distribution
Slide 62
MB MC
Copyright c 2007 by The McGraw-HillCompanies, Inc. All rights reserved.
Methods of Income Redistribution
Public Employment for the PoorOvercomes the shortcomings of the EITC
and NITEITC does not help the unemployedNIT reduces the incentive to work

Chapter 14: Labor Markets,Poverty, and Income Distribution
Slide 63
MB MC
Copyright c 2007 by The McGraw-HillCompanies, Inc. All rights reserved.
Methods of Income Redistribution
Public Employment for the PoorDisadvantages of public service
employmentPeople may leave private sector jobs.The output created by the jobs may not have
any value.Increase in government bureaucracy.

Chapter 14: Labor Markets,Poverty, and Income Distribution
Slide 64
MB MC
Copyright c 2007 by The McGraw-HillCompanies, Inc. All rights reserved.
Methods of Income Redistribution
A Combination of MethodsUse a NIT with payment set below the
poverty thresholdSet the public service wage below the
minimum wagePrivatize the management of the public
service employment program

Chapter 14: Labor Markets,Poverty, and Income Distribution
Slide 65
MB MC
Copyright c 2007 by The McGraw-HillCompanies, Inc. All rights reserved.
NIT
Public Job
NIT + Public Job
NIT + Private Job
Income by Source in a Combination NIT – Jobs Program
Povertythreshold

MB MC
End ofChapterEnd of
Chapter