poverty and environment: understanding linkages at … · poverty and environment: understanding...
TRANSCRIPT
Poverty and Environment: Understanding Linkages at the Household Level
Environment Department The World Bank June 2007
40218
Pub
lic D
iscl
osur
e A
utho
rized
Pub
lic D
iscl
osur
e A
utho
rized
Pub
lic D
iscl
osur
e A
utho
rized
Pub
lic D
iscl
osur
e A
utho
rized
Pub
lic D
iscl
osur
e A
utho
rized
Pub
lic D
iscl
osur
e A
utho
rized
Pub
lic D
iscl
osur
e A
utho
rized
Pub
lic D
iscl
osur
e A
utho
rized

Table of Contents 1. Understanding Poverty-Environment Linkages at the Household Level ..................... 5
Poverty and environmental change at the macro scale ................................................. 6 Environmental management and pathways to household welfare................................ 8 Scope of the report ...................................................................................................... 11
2. Local Natural Resources, Poverty, and Degradation—Examining Empirical Regularities ................................................................................................................. 13 Environmental income matters to the poor................................................................. 13 Commons as a source of insurance............................................................................. 16 Growth unlikely to stem local resource use................................................................ 19 Low welfare impacts of degradation........................................................................... 23 Poverty’s role in environmental change ..................................................................... 25 Environmental contributions to poverty reduction—Some conclusions .................... 26
3. Health Outcomes and Environmental Pathogens........................................................ 29 Theoretical linkages between health outcomes and environmental conditions .......... 30 Key evidence on linkages between health outcomes and environmental conditions . 36 How robust are these empirical findings?................................................................... 44 Conclusions and some tentative policy implications .................................................. 46
4. Household Welfare and Policy Reforms..................................................................... 48 Selected policy reforms............................................................................................... 50 The Right Data............................................................................................................ 62 Conclusion .................................................................................................................. 63
5. Poverty and Environment—Directions for Change.................................................... 65 References......................................................................................................................... 70 Boxes Box 2-1 The role of natural resources in providing insurance before and after Hurricane Mitch................................................................................................................................. 18 Box 2-2 Poverty and Environment in Cambodia............................................................. 21 Box 3-1 The importance of health information ............................................................... 39 Box 3-2 Piped water and diarrhea incidence in rural India ............................................. 40 Box 3-3 External benefits are subject to diminishing returns.......................................... 42 Box 4-1 Impact evaluation methodology......................................................................... 50 Box 4-2 Participation ....................................................................................................... 53 Box 4-3 Welfare distribution: poor versus non-poor....................................................... 55 Figures Figure 2-1 Households engaged in natural-resource-dependent activities by consumption quintiles in rural areas (2004) ........................................................................................... 21 Figure 2-2 Biomass availability in Malawi...................................................................... 23 Figure 2-3 Change in welfare for rural poor in Malawi................................................... 24 Figure 3-1 Determination of child health from a lifecycle perspective ........................... 32

Tables Table 1-1 Selected macro indicators linking poverty, natural resources, and .................... 6 Table 2-1 Percent of environmental income relative to total income.............................. 16 Table 2-2 Mean comparisons of the same households in 1998 (before Hurricane Mitch) and 2001............................................................................................................................ 18 Table 2-3 Commune opinion poll responses from Cambodia on natural resource decline........................................................................................................................................... 21
1. Understanding Poverty-Environment Linkages at the Household Level The World Bank’s fundamental goal is poverty reduction. While the Bank participates in lending and development through many different types of activities, it is important to examine these practices through a poverty lens. In 2002, some 50 percent of the global population subsisted on less than $2 a day. Approximately 44 percent of all households in Africa and 31 percent of people in South Asia lived below the dollar-a-day poverty line (WDI 2006). As these figures suggest, the Bank’s poverty mandate remains vast, important, and urgent. The Bank is also one of the largest international donors in the area of environmental management. Last year alone, the Bank provided $1.4 billion (in either loans or grants) in aid to poor countries to improve the environment. The Bank’s activities in this arena include lending for forestry operations; improvements in air quality; changes in environmental institutions and governance; and investments in water and sanitation infrastructure. In partnership with the Global Environment Facility (GEF), the Bank plays a major role in global efforts to stem climate change, biodiversity degradation, and toxic and chemical waste impacts. The question is whether these large investments in poverty reduction and environmental management are mutually reinforcing. History ultimately will provide an answer; in the meantime, there are smaller issues that can be addressed now. An important component of this question, for example, is whether—and to what extent—environmental management can contribute to poverty reduction. Are current environmental management strategies successful in addressing the problems of the poor, and what challenges do they face? And, most importantly, what is the role of the poor and their behavioral strategies as management programs are put forth? Poverty reduction is a three-part problem. It involves (1) stemming the fall of households into further poverty, (2) enabling movements out of poverty, and (3) ensuring that the non-poor do not become poor. Reducing vulnerability is as important as reducing poverty. While there is a role for environmental management in each of these areas, the importance and type of management will differ. It is important to take a microscopic view of the poverty-environment problem and to understand how households rely on the environment, what factors condition household dependence on the environment, and the extent to which improvements in environmental management change the choices faced by the poor. These questions are at the core of this report. We focus on two classes of poverty-related welfare outcomes: (1) the more usually identified income and expenditure measures, and (2) health outcomes. Our attention to household-level analyses and actions distinguishes this report from other more broad-based analyses.
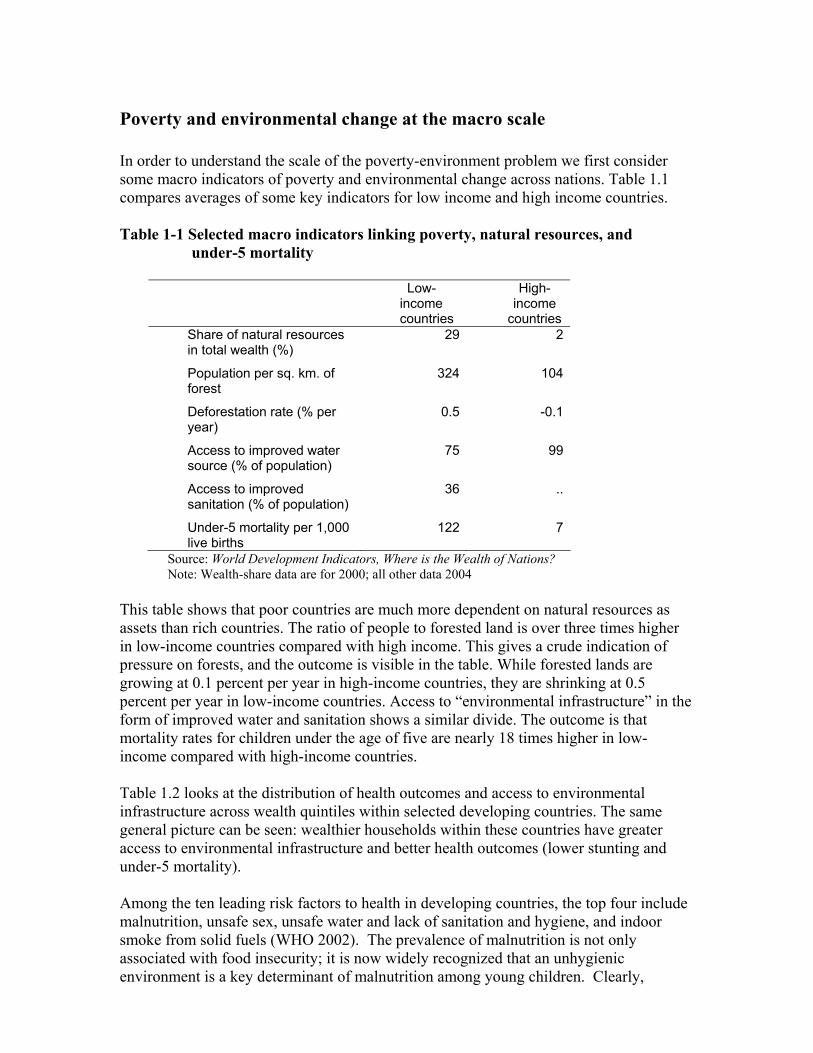
Poverty and environmental change at the macro scale In order to understand the scale of the poverty-environment problem we first consider some macro indicators of poverty and environmental change across nations. Table 1.1 compares averages of some key indicators for low income and high income countries. Table 1-1 Selected macro indicators linking poverty, natural resources, and under-5 mortality
Low- income countries
High- income
countries Share of natural resources in total wealth (%)
29 2
Population per sq. km. of forest
324 104
Deforestation rate (% per year)
0.5 -0.1
Access to improved water source (% of population)
75 99
Access to improved sanitation (% of population)
36 ..
Under-5 mortality per 1,000 live births
122 7
Source: World Development Indicators, Where is the Wealth of Nations? Note: Wealth-share data are for 2000; all other data 2004
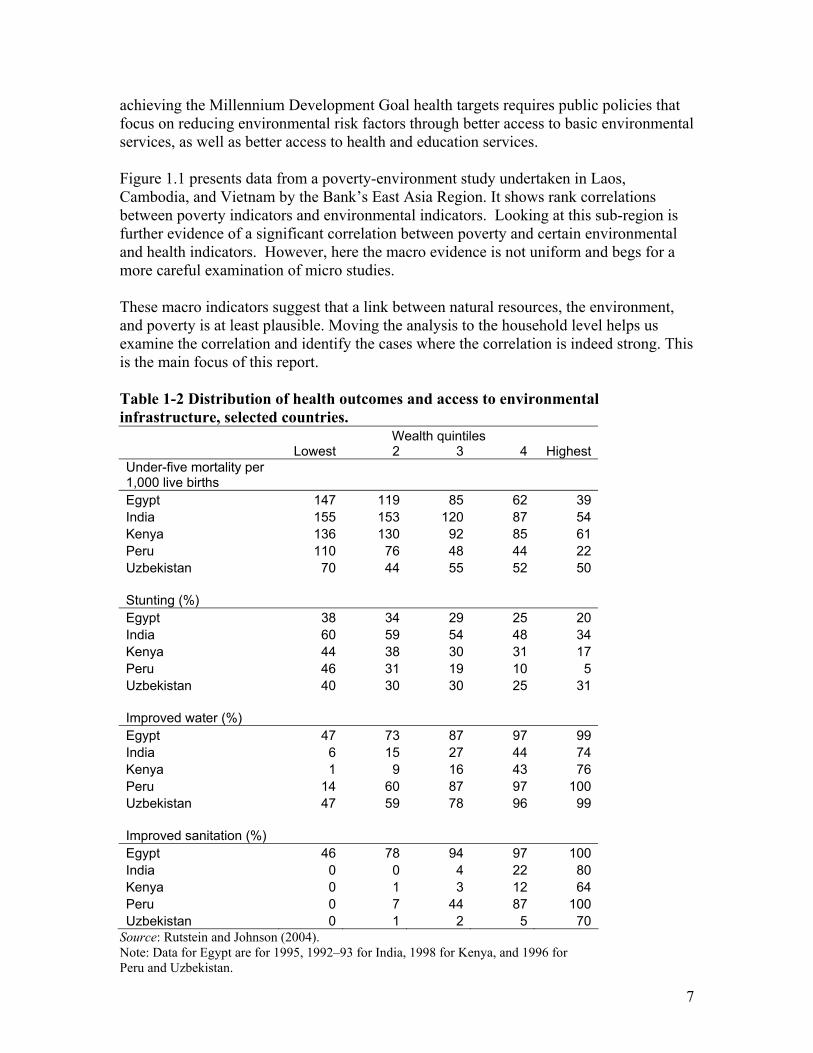
This table shows that poor countries are much more dependent on natural resources as assets than rich countries. The ratio of people to forested land is over three times higher in low-income countries compared with high income. This gives a crude indication of pressure on forests, and the outcome is visible in the table. While forested lands are growing at 0.1 percent per year in high-income countries, they are shrinking at 0.5 percent per year in low-income countries. Access to “environmental infrastructure” in the form of improved water and sanitation shows a similar divide. The outcome is that mortality rates for children under the age of five are nearly 18 times higher in low-income compared with high-income countries. Table 1.2 looks at the distribution of health outcomes and access to environmental infrastructure across wealth quintiles within selected developing countries. The same general picture can be seen: wealthier households within these countries have greater access to environmental infrastructure and better health outcomes (lower stunting and under-5 mortality). Among the ten leading risk factors to health in developing countries, the top four include malnutrition, unsafe sex, unsafe water and lack of sanitation and hygiene, and indoor smoke from solid fuels (WHO 2002). The prevalence of malnutrition is not only associated with food insecurity; it is now widely recognized that an unhygienic environment is a key determinant of malnutrition among young children. Clearly,
7
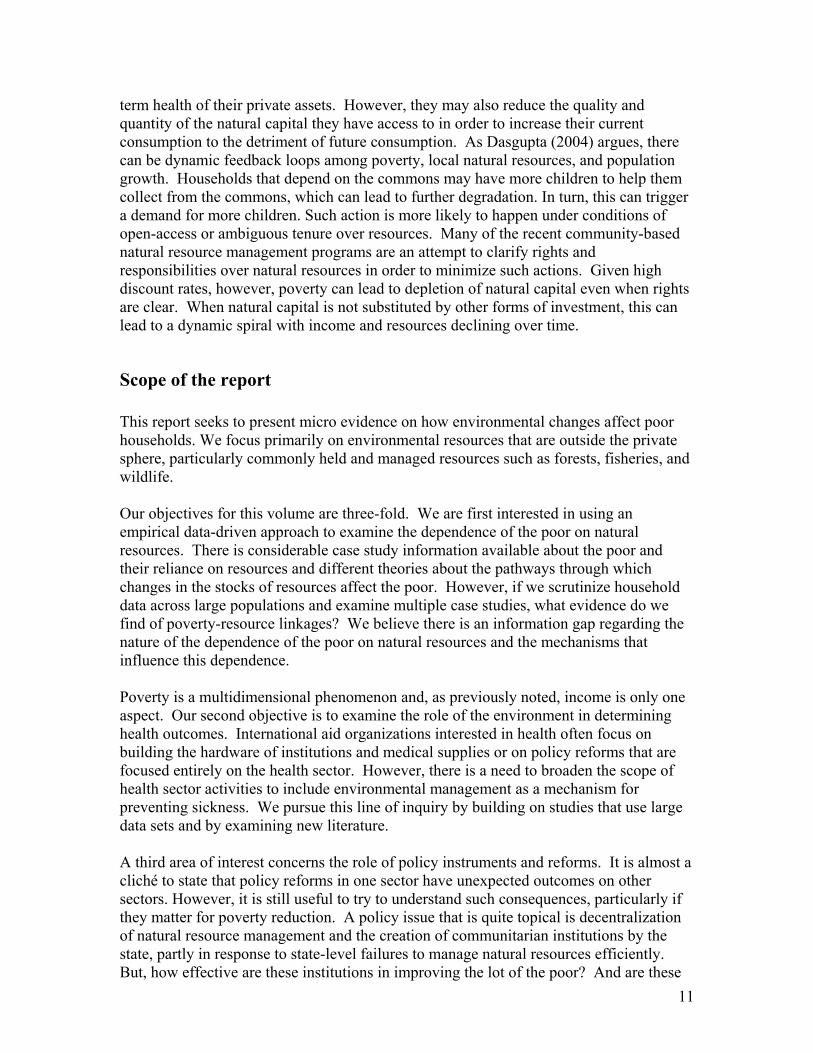
achieving the Millennium Development Goal health targets requires public policies that focus on reducing environmental risk factors through better access to basic environmental services, as well as better access to health and education services. Figure 1.1 presents data from a poverty-environment study undertaken in Laos, Cambodia, and Vietnam by the Bank’s East Asia Region. It shows rank correlations between poverty indicators and environmental indicators. Looking at this sub-region is further evidence of a significant correlation between poverty and certain environmental and health indicators. However, here the macro evidence is not uniform and begs for a more careful examination of micro studies. These macro indicators suggest that a link between natural resources, the environment, and poverty is at least plausible. Moving the analysis to the household level helps us examine the correlation and identify the cases where the correlation is indeed strong. This is the main focus of this report. Table 1-2 Distribution of health outcomes and access to environmental infrastructure, selected countries. Wealth quintiles Lowest 2 3 4 Highest Under-five mortality per 1,000 live births
Egypt 147 119 85 62 39 India 155 153 120 87 54 Kenya 136 130 92 85 61 Peru 110 76 48 44 22 Uzbekistan 70 44 55 52 50 Stunting (%) Egypt 38 34 29 25 20 India 60 59 54 48 34 Kenya 44 38 30 31 17 Peru 46 31 19 10 5 Uzbekistan 40 30 30 25 31 Improved water (%) Egypt 47 73 87 97 99 India 6 15 27 44 74 Kenya 1 9 16 43 76 Peru 14 60 87 97 100 Uzbekistan 47 59 78 96 99 Improved sanitation (%) Egypt 46 78 94 97 100 India 0 0 4 22 80 Kenya 0 1 3 12 64 Peru 0 7 44 87 100 Uzbekistan 0 1 2 5 70
Source: Rutstein and Johnson (2004). Note: Data for Egypt are for 1995, 1992–93 for India, 1998 for Kenya, and 1996 for Peru and Uzbekistan.

Figure 1-1 Correlations between poverty and different environmental indicators found from previous PEN work in Cambodia, Lao PDR, and Vietnam
-0.40
-0.20
0.00
0.20
0.40
0.60
0.80
1.00
DeforestationRate
Fragile Land(Slope>16%)
Indoor AirPollution
(wood/charcoal use);Vietnam: ARI
No Access toClean Water
NoSanitation;
Vietnam: notoilets
Number ofDiarrhea
Cases
Outdoor AirPollution
(number ofdeaths from
PM10)
Indicator
Ran
k co
rrel
atio
n w
ith p
over
ty
Cambodia Lao PDR Vietnam
Environmental management and pathways to household welfare Environmental change, particularly of local natural resources, can affect poverty through many pathways (Sunderlin et al. 2005; Dasgupta 2004, 2003; Wunder 2001; Duraiappah 1998; Reardon and Vosti 1995). To see this relationship more clearly, we build on a simple model by Barrett (2004) that links household income and assets. Consider a poor household whose welfare is dependent on assets that the household has access to or owns. These assets may include biophysical, human, environmental, and constructed capital. At any point in time, household well-being depends on the returns to these assets and any exogenous shocks. Exogenous shocks simply reflect unexpected changes as a result of natural disasters, death, gifts, or macro market changes. Further, returns to assets generally have two components: (1) known returns, and (2) an uncertain component that depends on weather, sickness, and so on. Changes in welfare can thus result from four types of changes: (1) changes in asset holdings, (2) changes in returns to these holdings, (3) changes in the uncertain component of returns, as well as (4) changes in exogenous income, which can be positive or negative (Barrett 2004). The interesting issue is how environmental management can affect household well-being. While we use household income and welfare interchangeably, we recognize that income
8

9
is only one measure of well-being. Household health would be another measure; aspects of the discussion below would apply equally to health outcomes. Changes in environmental management can have two effects in the short to medium term. First, it can change the return to assets. For example, agro-forestry techniques might improve the productivity of household land holdings, or smokeless stove programs might contribute to improved indoor air quality, health, and productivity. Thus, one reason to improve environmental quality would be to add greater value to the flows from household land or labor. Any health improvements that come from environmental management will also have direct welfare impacts that are independent of productivity improvements. Changes in resource management can also increase household assets. For example, this could occur if there are land reforms or if households secure access to forests through community forestry. Another aspect of this is improved environmental quality, which may contribute to reduced morbidity or mortality and greater labor power. It is important to recognize that labor is often the only asset that poor households have, and that sickness and death can have intergenerational effects. Any improvements in environmental health can have long-term impacts on households’ ability to move out of poverty. Over the longer run, environmental changes can contribute to unexpected shocks. Climate change can increase the variability of returns, for example, with greater variation in rainfall patterns, the variability of crop yields may increase. New disease vectors emerging from climate change might make households more vulnerable. Exogenous shocks, such as floods or hurricanes, can also wipe out household assets and contribute to loss of life. Environmental management matters to the extent that natural barriers such as mangroves and coral reefs diminish the effect of these shocks. Further, there is potentially an interactive relationship between poverty and the environment. However, these simultaneous and ongoing changes are difficult to empirically isolate. This simple model reminds us that households care about expected welfare outcomes as well as variations in these outcomes. For poor households that are unable to bear shocks, maintaining a steady but low level of economic activity may well be the optimal strategy (Barrett 2004). Such households are simply unwilling or unable to make the changes required to build up their assets or improve their productivity to get themselves out of poverty. For example, in areas with ecotourism or if there is an increase in demand for local forest products, very poor households may not gain from growth in the industry (Lybbert et al. 2002). Even if the returns are high, for example, they may not participate in new jobs because of perceived risks of switching to new types of labor or because of initial costs associated with switching. Similarly, while access to clean water would improve child health, obtaining a new connection to the main distribution line may be too expensive for the poor (World Bank 2006). In addition, many households in low-income countries may be uninformed about the mechanisms available to mitigate the effects of poor water quality or the health risks of staying indoors during peak emission periods of cooking with biomass fuels. Better
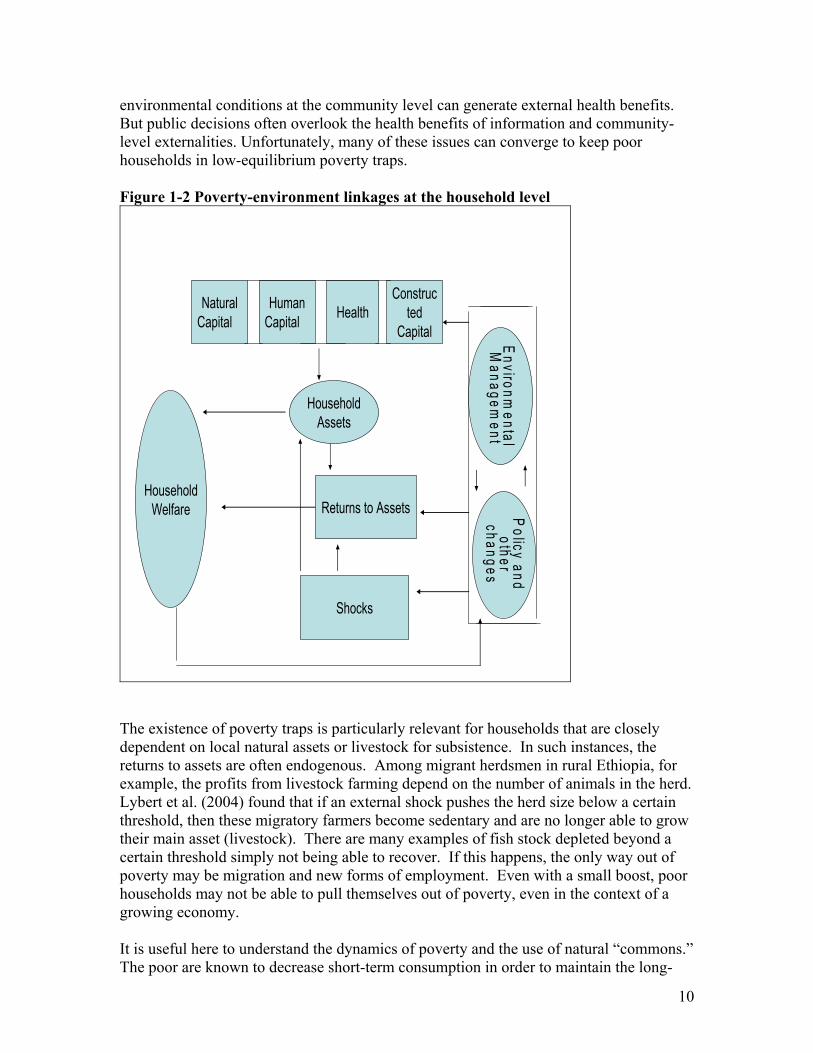
environmental conditions at the community level can generate external health benefits. But public decisions often overlook the health benefits of information and community-level externalities. Unfortunately, many of these issues can converge to keep poor households in low-equilibrium poverty traps. Figure 1-2 Poverty-environment linkages at the household level
Returns to Assets
Shocks
Natural Capital
Human Capital Health
Constructed
Capital Environm
entalM
anagement
Policy and
other changes
HouseholdWelfare
HouseholdAssets
The existence of poverty traps is particularly relevant for households that are closely dependent on local natural assets or livestock for subsistence. In such instances, the returns to assets are often endogenous. Among migrant herdsmen in rural Ethiopia, for example, the profits from livestock farming depend on the number of animals in the herd. Lybert et al. (2004) found that if an external shock pushes the herd size below a certain threshold, then these migratory farmers become sedentary and are no longer able to grow their main asset (livestock). There are many examples of fish stock depleted beyond a certain threshold simply not being able to recover. If this happens, the only way out of poverty may be migration and new forms of employment. Even with a small boost, poor households may not be able to pull themselves out of poverty, even in the context of a growing economy. It is useful here to understand the dynamics of poverty and the use of natural “commons.” The poor are known to decrease short-term consumption in order to maintain the long-
10
11
term health of their private assets. However, they may also reduce the quality and quantity of the natural capital they have access to in order to increase their current consumption to the detriment of future consumption. As Dasgupta (2004) argues, there can be dynamic feedback loops among poverty, local natural resources, and population growth. Households that depend on the commons may have more children to help them collect from the commons, which can lead to further degradation. In turn, this can trigger a demand for more children. Such action is more likely to happen under conditions of open-access or ambiguous tenure over resources. Many of the recent community-based natural resource management programs are an attempt to clarify rights and responsibilities over natural resources in order to minimize such actions. Given high discount rates, however, poverty can lead to depletion of natural capital even when rights are clear. When natural capital is not substituted by other forms of investment, this can lead to a dynamic spiral with income and resources declining over time.
Scope of the report This report seeks to present micro evidence on how environmental changes affect poor households. We focus primarily on environmental resources that are outside the private sphere, particularly commonly held and managed resources such as forests, fisheries, and wildlife. Our objectives for this volume are three-fold. We are first interested in using an empirical data-driven approach to examine the dependence of the poor on natural resources. There is considerable case study information available about the poor and their reliance on resources and different theories about the pathways through which changes in the stocks of resources affect the poor. However, if we scrutinize household data across large populations and examine multiple case studies, what evidence do we find of poverty-resource linkages? We believe there is an information gap regarding the nature of the dependence of the poor on natural resources and the mechanisms that influence this dependence. Poverty is a multidimensional phenomenon and, as previously noted, income is only one aspect. Our second objective is to examine the role of the environment in determining health outcomes. International aid organizations interested in health often focus on building the hardware of institutions and medical supplies or on policy reforms that are focused entirely on the health sector. However, there is a need to broaden the scope of health sector activities to include environmental management as a mechanism for preventing sickness. We pursue this line of inquiry by building on studies that use large data sets and by examining new literature. A third area of interest concerns the role of policy instruments and reforms. It is almost a cliché to state that policy reforms in one sector have unexpected outcomes on other sectors. However, it is still useful to try to understand such consequences, particularly if they matter for poverty reduction. A policy issue that is quite topical is decentralization of natural resource management and the creation of communitarian institutions by the state, partly in response to state-level failures to manage natural resources efficiently. But, how effective are these institutions in improving the lot of the poor? And are these
institutions egalitarian in their outcomes? We look at evidence from multiple countries to address these questions. Another instrument available for environmental management is payments for environmental services. We have a growing number of examples of this instrument in Latin American countries. However, what do we understand about its poverty impacts? Are the poor willing to participate in such schemes? This is another area that is explored in this report. This report uses general economics literature as well as data collected by the World Bank and its partners to analyze poverty-environment linkages at the household level. The data are mainly from household surveys such as the Living Standards Measurement Surveys and include information on a broad range of poverty indicators. The data were not necessarily collected to answer questions regarding environmental changes and their links to poverty. However, they have considerable information that we have been able to exploit for this purpose. Poverty-environment linkages are inherently dynamic and involve behavioral responses that make the identification of cause and effect difficult. Thus, questions related to these linkages are ideally answered with the use of panel datasets or with data from randomized experiments. However, detailed panel or experimental data are rarely available, and there is merit to identifying empirical regularities through rigorous examination of cross-sectional data. We discuss some of the methodological challenges faced in analyzing poverty-environment problems throughout this volume, and explain some of these issues in more detail in Chapter 4 (Box 4.1). We also fill important gaps with information drawn from peer-reviewed literature.
12
2. Local Natural Resources, Poverty, and Degradation—Examining Empirical Regularities Rural households make up a large proportion of the world’s poor. While markets and infrastructure such as roads, irrigation dams and water pipes have made their way into the lives of these households, many millions of households still largely depend on two assets for their subsistence: labor and nature’s capital. But is this reliance on natural assets so significant that investments in nature can contribute to poverty reduction? In this chapter, we address three questions related to the dependence of the poor on natural resources:
• To what extent is the environment important to poor households, both in terms of contributing to household income and decreasing variations in household consumption?
• As households move out of poverty, is it reasonable to expect dependence on natural resources to also decrease?
• With resource degradation, what kinds of welfare losses do the poor bear? What are appropriate strategies for poverty reduction and conservation?
Analyzing causal linkages between poverty and natural resource degradation is not an easy undertaking. The prevalence of feedback loops between natural resource changes and household use of these resources; the inadvertent reliance of researchers on cross-sectional data because of a lack of good time-series information; and differences in local conditions (markets, resources, infrastructure, customs and so on), make it hard to arrive at general conclusions. However, we can observe some connections that occur on a regular basis. This chapter summarizes these linkages based on a review of recent analytical work from within and outside the Bank.
Environmental income matters to the poor Economic analyses two or three decades ago focused on agricultural farm income and often neglected the role of other forms of off-farm labor income, petty trade, remittances, and other types of jobs and income that supported the rural economy. We now understand that there are multiple sources of income in rural areas and that households often diversify and support themselves with different earnings. Income that is still frequently neglected is income from natural resources such as forests, fisheries, and wildlife. Real income that accrues to households from village commons, from state-owned forests, or open-access aquatic resources often do not get included in national income accounts or estimates of rural household income. This can lead to an underestimation of the use of local natural resources by the poor and can also contribute to an overestimation of poverty (Sjaastad et al. 2005; Vedeld et al. 2004; Cavendish 2000).
Of interest to policy makers is how much environmental income contributes to the lives of the poor. The literature on this issue highlights the difference between “use” and “dependence” (Cavendish 2000; Narain et al. 2005; Chetri-Khatri 2007). Resource use generally refers to the amount of resources consumed or collected by subsistence households, while dependence refers to the contribution of resources to overall household income. This distinction is important since resource use and dependence can differ considerably among rich and poor households. Is this dependence worth worrying about in poverty reduction strategies that account for different sources of income obtained by the poor? This question is difficult to address because of the multiple definitions of income that are used in different empirical studies.1 The study that originally brought the most attention to the link between environmental income and the poor was N.C. Jodha’s work on village commons in India in 1986 (Jodha 1986). He found, based on data from 82 villages, that poor rural households on average derived 9 to 26 percent of their income from common property natural resources, while rich households derived 1 to 4 percent of their income from this source. Jodha’s study suggested that the commons in India, however degraded, were important to the livelihoods of the poor. Almost a decade later recently, Cavendish (2000) undertook a careful study of 29 villages in rural Zimbabwe and their resource dependence. He studied income obtained by households from all sources over two periods of time in an agro-pastoral area that cannot be classified as resource rich. This is one of the best examples of how a careful accounting of local natural resources can throw surprising light on poverty and well-being. Cavendish (2000) found that 35 to 37 percent of rural households’ income came from environmental sources. In 1996–97, the richest 20 percent of households obtained about 30 percent of their income from nature, while for the poorest 20 percent of households, 44 percent of total income could be considered environmental. Based on his rich dataset, Cavendish concluded that “environmental income over and above income sources normally captured by rural household surveys would have boosted measured mean income by as much as 47.3 percent in 1993–94 and 46 percent in 1996–99.” Two other recent studies provide us with a sense of the continued contribution of environmental income. Chettri-Khattri (2007) undertook a micro study of two villages in the forested middle hills of Nepal. He found a wide difference in environmental income, in his case defined as income from non-timber forest products, based on the type of property rights held over the commons. In one village, where there was a community management user group, environmental income contributed some 2 percent of income to the poorest (lowest quartile) and 1 percent of income to the richest households. In another village, where there was no formal user group but looser informal rules over the commons, 20 percent of the income of the poor (and 14 percent of the income of the richest households) came from the commons. While other reasons, such as access to markets and employment, may contribute to this significant difference in environmental income, Chettri-Khattri argued that rules of access were the most important factor.
14
If we move way from forested Nepal and Zimbabwe to rural Madhya Pradesh in India, do we get similar results? Narain et al. (2005) examined 60 villages in Jhabua district of Madhya Pradesh. In contrast to Chettri’s study district, which is almost 60 percent forested, Jhabua is only 19 percent forested. In Jhabua, 54 percent of the land is considered agricultural and the rest is classified as degraded. The study villages were selected to maximize variation in forest stock. This study interestingly shows that the lowest and the richest quartiles obtain about 18 percent of their income from the commons, while middle-income groups obtain more. Essentially, the poorest households are less dependent on natural resources than the less poor, who are more dependent than the rich. Another interesting finding from this study is that dependence on resources is much lower (across all income quartiles) in resource-scarce areas relative to resource-rich areas. These results mimic Chettri’s results about dependence being much lower in a village where resources are inaccessible compared to a village where resources were more accessible or available. While there have been other such studies that show the importance of natural resources to the poor, an important question is whether such results can be generalized, and if so, to what extent. A meta study commissioned by the Bank and undertaken by Vedeld et al. (2004) attempted, at least partly, to answer this question. This paper examined 54 case studies around the world, with some 61 percent of these studies coming from Africa. These cases reflected a sample of communities that live in rural areas at the fringes or within tropical forests. While any such meta study encounters problems emerging from differences in the underlying case studies, it still offers useful insights into general trends. On average, Vedeld et al. found that approximately 22 percent of household income could be attributed to forests. Environmental income contributed most to the incomes of the poor—32 percent, compared to 17 percent for the rich. Based on our review, we conclude that local natural resources make a contribution to the welfare of the poor and in some cases this contribution can be considerable. While we say this with some confidence, this result cannot be generalized to all rural households. It applies mainly to households that live in forest fringes or households that are largely dependent on natural resources for subsistence purposes. Some of the case study findings also suggest that poor households are dependent on the commons even in areas where resources are scarce or less accessible; however, this dependence is lower relative to biomass-rich or accessible areas.
15
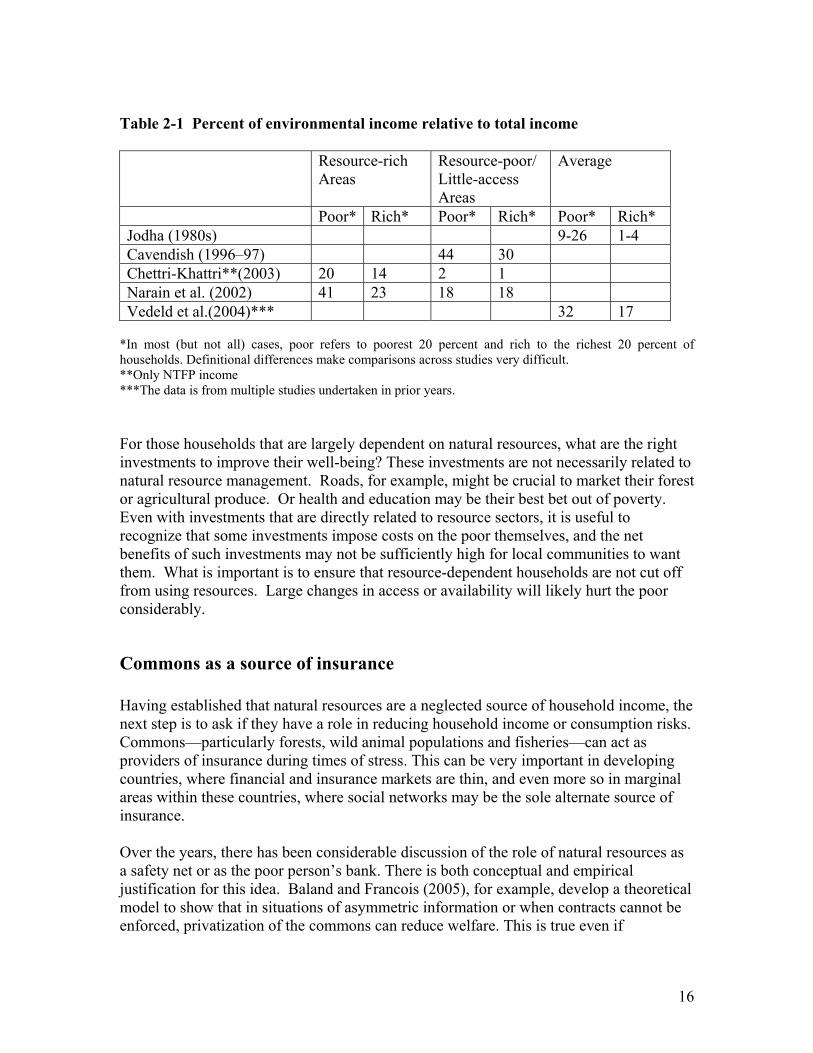
Table 2-1 Percent of environmental income relative to total income Resource-rich
Areas Resource-poor/ Little-access Areas
Average
Poor* Rich* Poor* Rich* Poor* Rich* Jodha (1980s) 9-26 1-4 Cavendish (1996–97) 44 30 Chettri-Khattri**(2003) 20 14 2 1 Narain et al. (2002) 41 23 18 18 Vedeld et al.(2004)*** 32 17
*In most (but not all) cases, poor refers to poorest 20 percent and rich to the richest 20 percent of households. Definitional differences make comparisons across studies very difficult. **Only NTFP income ***The data is from multiple studies undertaken in prior years. For those households that are largely dependent on natural resources, what are the right investments to improve their well-being? These investments are not necessarily related to natural resource management. Roads, for example, might be crucial to market their forest or agricultural produce. Or health and education may be their best bet out of poverty. Even with investments that are directly related to resource sectors, it is useful to recognize that some investments impose costs on the poor themselves, and the net benefits of such investments may not be sufficiently high for local communities to want them. What is important is to ensure that resource-dependent households are not cut off from using resources. Large changes in access or availability will likely hurt the poor considerably.
Commons as a source of insurance Having established that natural resources are a neglected source of household income, the next step is to ask if they have a role in reducing household income or consumption risks. Commons—particularly forests, wild animal populations and fisheries—can act as providers of insurance during times of stress. This can be very important in developing countries, where financial and insurance markets are thin, and even more so in marginal areas within these countries, where social networks may be the sole alternate source of insurance. Over the years, there has been considerable discussion of the role of natural resources as a safety net or as the poor person’s bank. There is both conceptual and empirical justification for this idea. Baland and Francois (2005), for example, develop a theoretical model to show that in situations of asymmetric information or when contracts cannot be enforced, privatization of the commons can reduce welfare. This is true even if
16
privatization is costless and equitable. This is because of the insurance role of the commons, which would not be picked up by private insurance providers. The empirical literature on the insurance role of natural resources tends to be somewhat thin. In general, we understand more about household management of ex-ante known risks relative to responses to unexpected shocks. A selection of studies from Latin America sheds some light on these issues. Pattanayak and Sills (2001) examined forest collection trips in the Tapajos region in the middle of the Amazon in Brazil. They asked whether households responded to known agricultural risks and sudden agricultural shocks by increasing their dependence on natural resources. Takasaki et al. (2004) examined coping strategies in response to covariate flood shocks around Peru’s Pacaya-Samiria National Reserve. McSweeney (2005) offered an interesting account of the natural insurance provided by forests in Honduras before and after Hurricane Mitch. These studies provide initial evidence of the role of resources as providers of natural insurance. Pattanayak and Sills (2001) found that forest-product collection was correlated with agricultural yield risks (income smoothing response) and unexpected production shocks (consumption smoothing response). In their study, the statistical link between forest trips and known risks was strongly significant and relatively more robust than the link between forest trips and unexpected shocks. Takasaki’s research suggests that for the very poor, who have only labor available and few land assets, non-timber forest resources act as a source of insurance during difficult times. McSweeney’s paper uses both quantitative and qualitative approaches to show that forests have a critical insurance role. Box 2.1 discusses McSweeney’s findings in further detail. Such findings are broadly corroborated by work in Asia on the effect of the regional economic crisis in the 1990s on forests. There was a clear trend among rural households to compensate for the loss of agricultural income by increasing forest use in Indonesia (Sunderlin et al. 2000). While the income and consumption services of natural resources are somewhat understood, their risk management functions are often neglected. However, ignoring the buffering function of natural resources can undermine the implementation of environmental management or poverty reduction programs. An example from Africa illustrates this point. Many conservation programs in Africa use game meat distribution as a strategy for local conservation and development. But do such programs work once we recognize the insurance role of resources? Barrett and Arcese (1998) used a simulation exercise to examine this question in the context of the Serengeti ecosystem, where wildebeest meat is distributed to reduce poaching pressure. While ecosystem managers accomplished their goal during normal times, this strategy was likely to fail when natural shocks occurred. Wildlife poaching was an important source of sustenance when rains failed and agricultural produce declined. However, this was also the time when the wildebeest herd could least withstand increased harvest. Thus, there was a double pressure on the wildebeest, which could lead to a collapse in the population and management strategy.
17
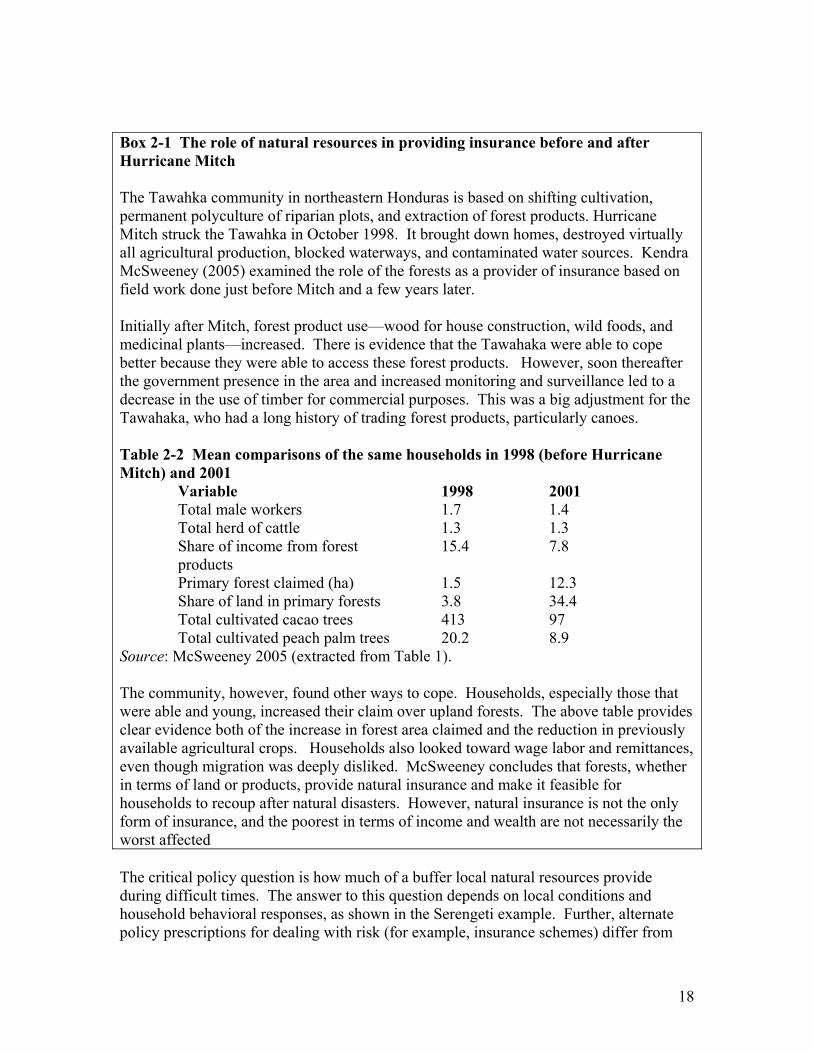
Box 2-1 The role of natural resources in providing insurance before and after Hurricane Mitch The Tawahka community in northeastern Honduras is based on shifting cultivation, permanent polyculture of riparian plots, and extraction of forest products. Hurricane Mitch struck the Tawahka in October 1998. It brought down homes, destroyed virtually all agricultural production, blocked waterways, and contaminated water sources. Kendra McSweeney (2005) examined the role of the forests as a provider of insurance based on field work done just before Mitch and a few years later. Initially after Mitch, forest product use—wood for house construction, wild foods, and medicinal plants—increased. There is evidence that the Tawahaka were able to cope better because they were able to access these forest products. However, soon thereafter the government presence in the area and increased monitoring and surveillance led to a decrease in the use of timber for commercial purposes. This was a big adjustment for the Tawahaka, who had a long history of trading forest products, particularly canoes. Table 2-2 Mean comparisons of the same households in 1998 (before Hurricane Mitch) and 2001
Variable 1998 2001 Total male workers 1.7 1.4 Total herd of cattle 1.3 1.3 Share of income from forest products
15.4 7.8
Primary forest claimed (ha) 1.5 12.3 Share of land in primary forests 3.8 34.4 Total cultivated cacao trees 413 97 Total cultivated peach palm trees 20.2 8.9
Source: McSweeney 2005 (extracted from Table 1). The community, however, found other ways to cope. Households, especially those that were able and young, increased their claim over upland forests. The above table provides clear evidence both of the increase in forest area claimed and the reduction in previously available agricultural crops. Households also looked toward wage labor and remittances, even though migration was deeply disliked. McSweeney concludes that forests, whether in terms of land or products, provide natural insurance and make it feasible for households to recoup after natural disasters. However, natural insurance is not the only form of insurance, and the poorest in terms of income and wealth are not necessarily the worst affected The critical policy question is how much of a buffer local natural resources provide during difficult times. The answer to this question depends on local conditions and household behavioral responses, as shown in the Serengeti example. Further, alternate policy prescriptions for dealing with risk (for example, insurance schemes) differ from
18
those that have to do with shocks (food support or employment schemes). We need to improve our understanding of whether natural resources serve the same type of function in both cases. Until clear alternate options are available, it makes sense to manage local natural resources as part of a portfolio of assets required to minimize consumption risks and help the poor cope with shocks. Attempts to reduce vulnerability need to pay cognizance to the role of local natural resources in buffering the poor against market, policy, or environmental uncertainties.
Growth unlikely to stem local resource use There is sometimes a natural assumption that as households and economies grow they will reduce their dependence on local natural resources such as fuelwood, fisheries, grass, or wildlife. This, in turn, may then reduce pressure on these resources. But as households become wealthier, do they decrease or increase their dependence on natural resources? As household wealth increases, we expect demand for energy, fodder, or water to increase. This is an income or scale effect, which can lead to increased use and perhaps further resource degradation. Increases in wealth also improve education and awareness and increase the opportunity cost of time. Improved awareness might contribute to a more discriminate use of resources. For example, households may try to find substitutes to fuelwood in order to reduce indoor air pollution.2 Economic growth would also bring exit opportunities for labor—migration, for example—with consequent reductions in resource dependence. It would also increase the value of time, which may reduce the collection of natural resources. Another important consideration is that local economic growth does not affect everybody in the area evenly. Even if markets open up new opportunities, only a part of the local population may be able to avail themselves of these opportunities, while others may continue to be as dependent on the resources as ever. Finally, opening of markets for specific natural resources without proper regulatory systems in place may well lead to indiscriminate use. In short, the overall effect of increased development may well follow a Kuznets curve, with large reductions in use appearing only at rather high levels of income. Theoretically, there are multiple possible outcomes of local economic growth on resource use, but what do we know from empirical studies on this issue? The best way to study how growth might affect use and dependence is by examining households over a period of time. However, few studies have the luxury of obtaining time-series data. The popular alternate approach is to examine a cross-section of households. Cross-sectional estimates are reasonably proxies for what may happen over time, but they may also overestimate the impacts of growth, since households will make temporal adjustments (Baland et al. 2006).
19
Several papers provide insights into the empirical relationship between growth of income and wealth and resource use. Vedeld et al. (2004) uses a meta dataset to examine the link between environmental income and total income in a number of different ways. Their first finding is that the income elasticity of environmental income is close to one; that is, a 1 percent increase in total income usually means a 1 percent increase in environmental income. Thus, across their sampled rural communities, an increase in total income is closely correlated with a proportional increase in the use of forests and wild products. Though somewhat less robust, a second result is that forest dependence increases and then decreases with total income. The authors break their data set into five income quintiles and find a bell-shaped relationship between income and dependence. Groups in the middle-income categories were the most dependent on forests. The Jhabua study by Narain et al. (2005) had a similar finding. This is not entirely surprising: middle-income households with land or livestock are the ones who are most dependent on forests for complementary goods. Two research papers undertaken at the World Bank—one on India (Bandyopadhyay and Shyamsundar 2004) and a second on Nepal (Bandyopadhyay and Shyamsundar 2005)— provide some additional perspectives on this issue. Both papers use large datasets on rural households and examine (among other things) the relationship between wealth, measured as an index of household durable goods, and fuelwood use. The India paper looks at five states across India and examines factors that affect fuelwood consumption. The Nepal paper focuses on fuelwood collection by rural households. In India, Bandyopadhyay and Shyamsundar found that fuelwood consumption decreases with wealth. Interestingly, the opposite result is obtained in Nepal. This suggests that given the availability of substitutes, households do move away from fuelwood as a source of energy. However, markets for fuelwood are thin in Nepal and there are few affordable substitutes available; thus, as wealth increases, fuelwood use increases.
20
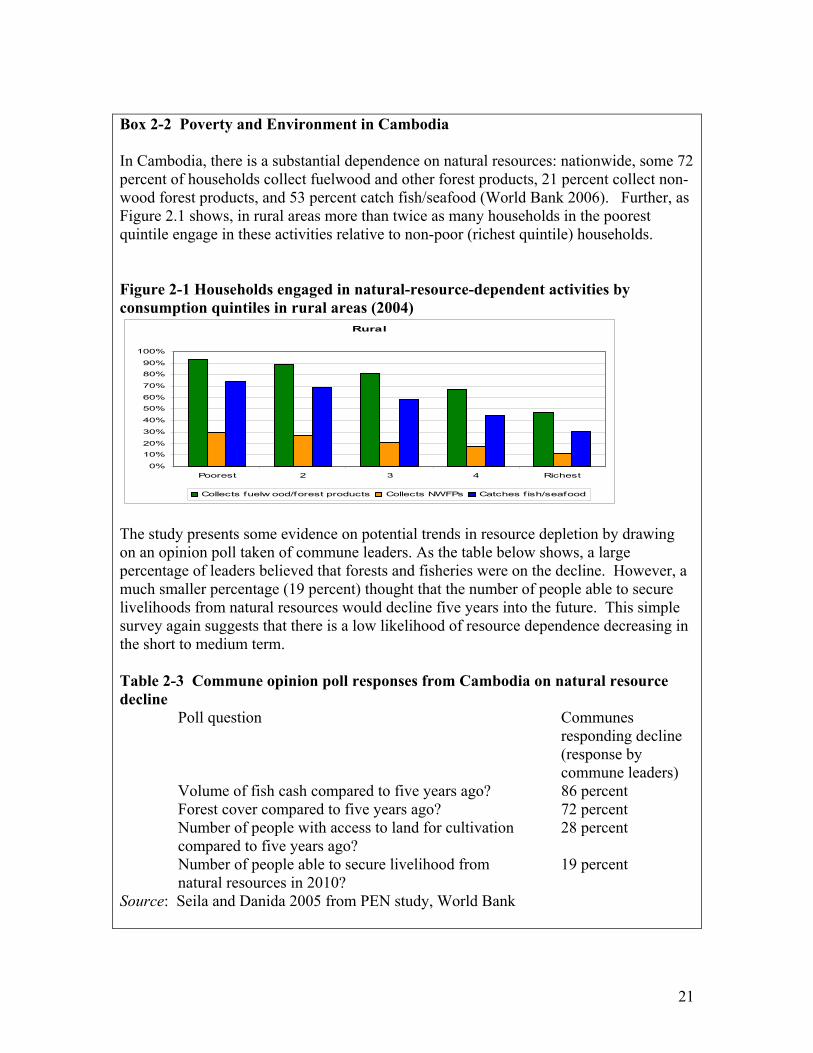
Box 2-2 Poverty and Environment in Cambodia In Cambodia, there is a substantial dependence on natural resources: nationwide, some 72 percent of households collect fuelwood and other forest products, 21 percent collect non-wood forest products, and 53 percent catch fish/seafood (World Bank 2006). Further, as Figure 2.1 shows, in rural areas more than twice as many households in the poorest quintile engage in these activities relative to non-poor (richest quintile) households. Figure 2-1 Households engaged in natural-resource-dependent activities by consumption quintiles in rural areas (2004) Rural
0%
10%
20%
30%
40%
50%
60%
70%
80%
90%
100%
Poorest 2 3 4 Richest
Collects fuelw ood/forest products Collects NWFPs Catches f ish/seafood The study presents some evidence on potential trends in resource depletion by drawing on an opinion poll taken of commune leaders. As the table below shows, a large percentage of leaders believed that forests and fisheries were on the decline. However, a much smaller percentage (19 percent) thought that the number of people able to secure livelihoods from natural resources would decline five years into the future. This simple survey again suggests that there is a low likelihood of resource dependence decreasing in the short to medium term. Table 2-3 Commune opinion poll responses from Cambodia on natural resource decline
Poll question Communes responding decline (response by commune leaders)
Volume of fish cash compared to five years ago? 86 percent Forest cover compared to five years ago? 72 percent Number of people with access to land for cultivation compared to five years ago?
28 percent
Number of people able to secure livelihood from natural resources in 2010?
19 percent
Source: Seila and Danida 2005 from PEN study, World Bank
21

An interesting recent paper by Baland et al. (2006) corroborates some of these results. Their study is based on data from over 3,000 households in 161 villages in two states in India in the mid-Himalayas (Himachal and Uttaranchal). It examined the relationship between per capita fuelwood consumption and income and the opportunity cost of labor. The authors found that fuelwood consumption per capita increased with income and decreased with the time costs of collecting wood. The net effect of a simultaneous increase in income and labor costs results in fuelwood demand being inelastic with respect to growth. However, population growth is likely to lead to further extraction. Thus, they argue, based on reasonable assumptions about the future it is very unlikely that fuelwood extraction will decline in these states without some strong policy measures. Growth by itself is in-sufficient to stem forest resource use. We conclude that as rural areas develop and households are pulled out of poverty, it is hard to predict whether resource use will decrease or increase—a lot will depend on the other factors that prevail in specific countries. Thus, at least with prevailing levels of income and poverty, it may be appropriate to assume that local economic growth in conjunction with a growing population is likely to contribute to more local resource use rather than less.
22
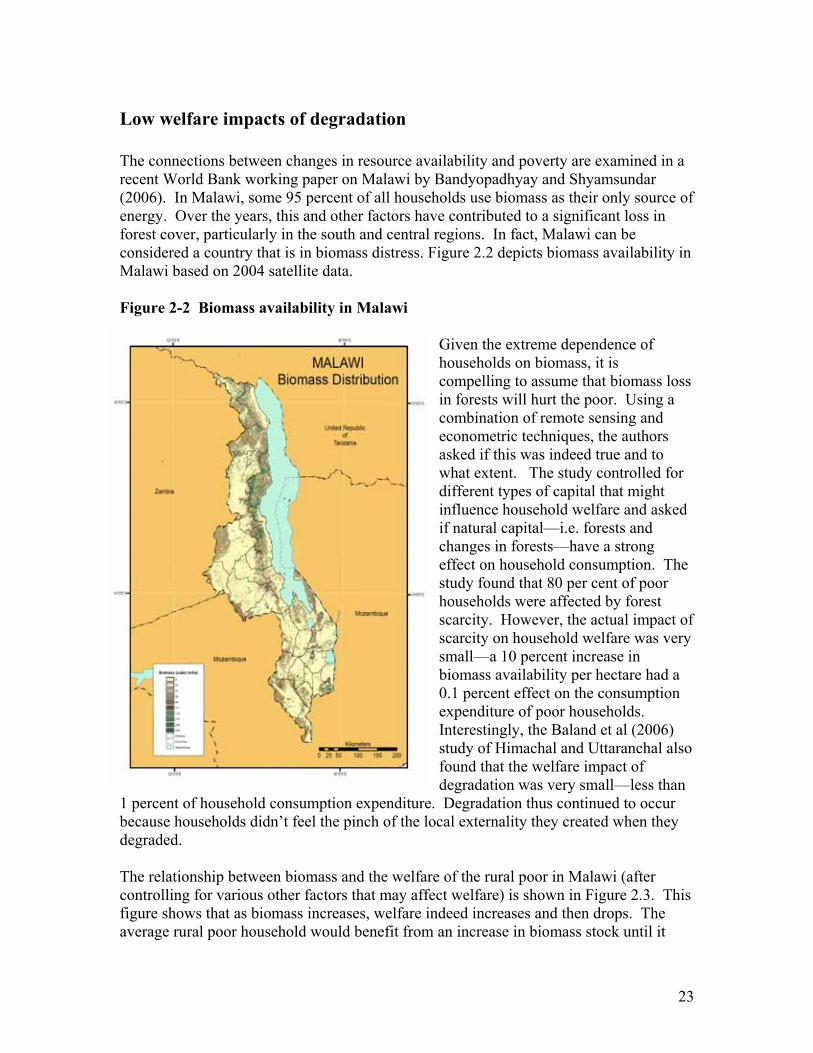
Low welfare impacts of degradation The connections between changes in resource availability and poverty are examined in a recent World Bank working paper on Malawi by Bandyopadhyay and Shyamsundar (2006). In Malawi, some 95 percent of all households use biomass as their only source of energy. Over the years, this and other factors have contributed to a significant loss in forest cover, particularly in the south and central regions. In fact, Malawi can be considered a country that is in biomass distress. Figure 2.2 depicts biomass availability in Malawi based on 2004 satellite data. Figure 2-2 Biomass availability in Malawi
Given the extreme dependence of households on biomass, it is compelling to assume that biomass loss in forests will hurt the poor. Using a combination of remote sensing and econometric techniques, the authors asked if this was indeed true and to what extent. The study controlled for different types of capital that might influence household welfare and asked if natural capital—i.e. forests and changes in forests—have a strong effect on household consumption. The study found that 80 per cent of poor households were affected by forest scarcity. However, the actual impact oscarcity on household welfare was verysmall—a 10 percent increase in biomass availability per hectare had a 0.1 percent effect on the consumption expenditure of poor households. Interestingly, the Baland et al (2006) study of Himachal and Uttaranchal also found that the welfare impact of degradation was very small—less than
1 percent of household consumption expenditure. Degradation thus continued to occur because households didn’t feel the pinch of the local externality they created when they degraded.
f
The relationship between biomass and the welfare of the rural poor in Malawi (after controlling for various other factors that may affect welfare) is shown in Figure 2.3. This figure shows that as biomass increases, welfare indeed increases and then drops. The average rural poor household would benefit from an increase in biomass stock until it
23
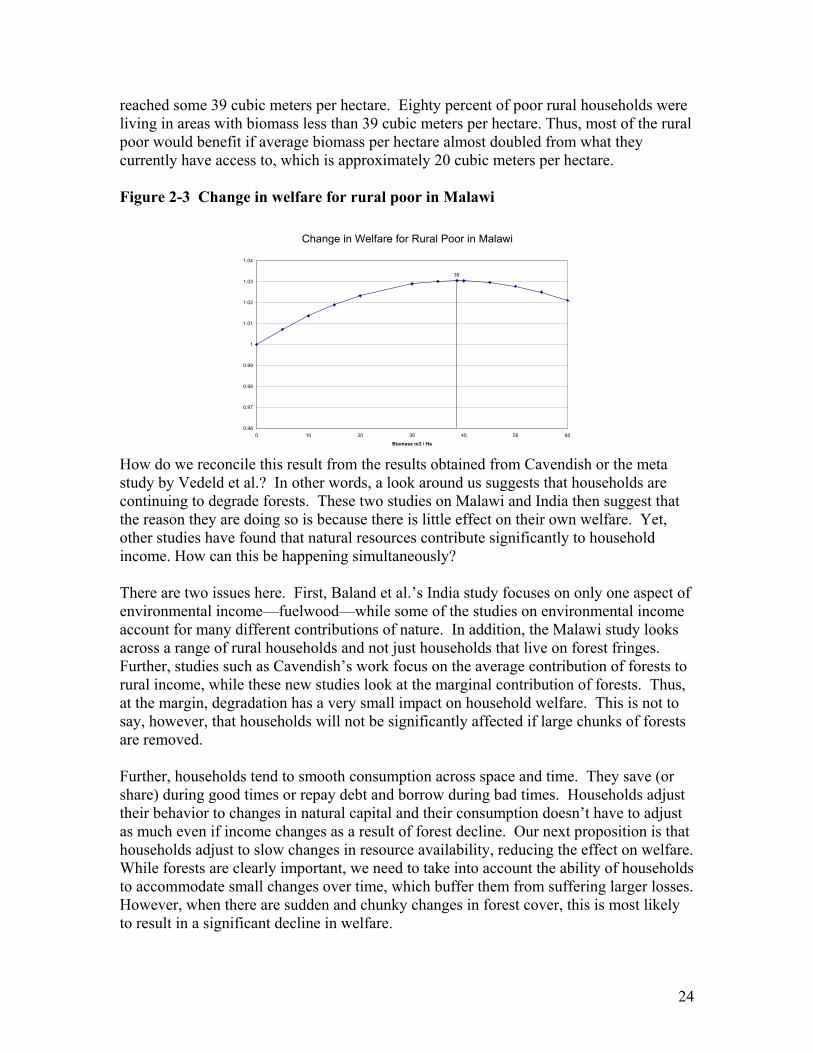
reached some 39 cubic meters per hectare. Eighty percent of poor rural households were living in areas with biomass less than 39 cubic meters per hectare. Thus, most of the rural poor would benefit if average biomass per hectare almost doubled from what they currently have access to, which is approximately 20 cubic meters per hectare. Figure 2-3 Change in welfare for rural poor in Malawi
Change in Welfare for Rural Poor in Malawi
39
0.96
0.97
0.98
0.99
1
1.01
1.02
1.03
1.04
0 10 20 30 40 50 6
Biomass m3 / Ha0
How do we reconcile this result from the results obtained from Cavendish or the meta study by Vedeld et al.? In other words, a look around us suggests that households are continuing to degrade forests. These two studies on Malawi and India then suggest that the reason they are doing so is because there is little effect on their own welfare. Yet, other studies have found that natural resources contribute significantly to household income. How can this be happening simultaneously? There are two issues here. First, Baland et al.’s India study focuses on only one aspect of environmental income—fuelwood—while some of the studies on environmental income account for many different contributions of nature. In addition, the Malawi study looks across a range of rural households and not just households that live on forest fringes. Further, studies such as Cavendish’s work focus on the average contribution of forests to rural income, while these new studies look at the marginal contribution of forests. Thus, at the margin, degradation has a very small impact on household welfare. This is not to say, however, that households will not be significantly affected if large chunks of forests are removed. Further, households tend to smooth consumption across space and time. They save (or share) during good times or repay debt and borrow during bad times. Households adjust their behavior to changes in natural capital and their consumption doesn’t have to adjust as much even if income changes as a result of forest decline. Our next proposition is that households adjust to slow changes in resource availability, reducing the effect on welfare. While forests are clearly important, we need to take into account the ability of households to accommodate small changes over time, which buffer them from suffering larger losses. However, when there are sudden and chunky changes in forest cover, this is most likely to result in a significant decline in welfare.
24
Poverty’s role in environmental change Are the poor victims or perpetuators of environmental change? While this controversial question has been much debated, most reasonable responses recognize that the relationship between the poor and natural resources is mediated by a number of micro and macro factors such as labor and credit markets, property rights, information about best practices, etc.(Adhikari 2005; Fisher et al. 2005; Wunder 2001; Duraiappah 1998; Bluffstone 1995). Under varying circumstances, it may indeed be optimal for poor and rich people to mine natural resources. The Himachal/Uttaranchal study by Baland et al. (2006) study offers some simple insights into the household subsistence use of fuel and fodder in India. They found that timber accounted for biomass removal of only 48 tons per village, while firewood accounted for 456 tons of biomass removed per year. Most of the forested areas in this region were degraded and not deforested—thus, fuelwood use appeared to be the main cause. A similar story is told by Takasaki et al. (2004) in discussing households living around Peru’s Pacaya-Samiria National Reserve (PSNR). In this area, there was very little timber logging or colonization—less than 1 percent of the area had been transformed into agriculture. Degradation was largely from subsistence use of resources. This story of degradation is of course only part of the story of environmental loss. In many other parts of the world, commercial timber logging, forest conversion to agriculture, or coral mining lead to major changes in prevailing ecosystems (Sunderlin et al. 2005). Macroeconomic wealth and downturns can trigger such transformations because of accompanying shifts in relative prices, technological changes, or public investments (Wunder 2001; Kaimowitz et al. 1998). The plight of the forests, for instance, may depend on whether market, technological, and policy changes favor extensification, mechanization of agriculture, or increased urbanization and out-migration of labor. As a general rule, changes in prices and technology that favor capital-intensive agriculture can contribute to deforestation (Angelsen and Kaimowitz 2001). Further, where commercial interests are involved, the returns to land-use changes are more likely to accrue to the rich rather than the poor. A case in point is made in the new World Bank report At Loggerheads, which discusses the intense deforestation that occurred in Brazil between 1999 and 2002. Much of this deforestation could be attributed to increased profits in land uses such as soybean cultivation and pasture development, which was driven by exogenous changes in global markets for soybeans, currency exchange, and so on (World Bank 2006). Most of the gains went to large farmers and the wealthy rather than the poor. Under certain circumstances, poverty may force households to consume assets that may support a longer term income stream. A recent World Bank report (Silva 2005) explores this issue econometrically in the context of marine protected areas off Tanzania and Zanzibar. The coastal areas of mainland Tanzania are home to 25 percent of its
25
population, while some 1 million people live on the islands of Zanzibar. A large proportion of these people depend on fisheries for food and income. In her paper, Silva examined the role of destructive fishing gear—such as gillnets, beach seine nets, and drive nets—and practices such as spear gun fishing, poison fishing, and dynamite fishing. She found that poverty was associated with an increase in the use of illegal gear and practices that were harmful to the marine ecosystem. Female-headed households and households that were food insecure were more likely to use such gear; wealth and education decreased use. Further, households got a boost in their welfare, measured in terms of consumption expenditure, from the use of destructive gear. This study seems to provide evidence that poverty and environmental degradation can be linked in a downward spiral. However, this is a static representation of a dynamic problem. Whether the poor will pull themselves out of poverty as a result of the consumption boost or other factors, or whether this will result in a poverty trap is hard to establish without a careful understanding of poverty-resource use dynamics. Banning destructive gear, which would be good for the long-term health of the fishery, is likely to hurt the poor. This is a familiar situation, where conservation of environmental attributes of the commons can in the short run hurt the poor. In Tanzania, the solution appears to be in the creation of alternative income generation activities (AIGA). Silva found that an ongoing alternative income program had a significant impact on household welfare. Thus, a dual approach that imposes costs on the use of destructive gear and provides alternate strategies for increasing income appears to be the way forward. However, such alternative strategies are often difficult to implement. An interesting twist to the poverty-environmental degradation story in Silva’s paper concerns the role of credit and ownership of fishing gear. Both these factors, which are frequently used as instruments to get people out of poverty, contribute to an increase in the probability of using destructive gear. Thus, while the poor are more likely to participate in destructive practices, some solutions to reduce poverty may simply exacerbate this problem. Any attempts to reduce poverty through normally used instruments such as credit must be accompanied by strategies to control destructive environmental actions. Reforming one market can exacerbate a failure in another market. It is important to recognize the sectoral effects of different reforms undertaken for different purposes by different agencies.
Environmental contributions to poverty reduction—Some conclusions This paper reviewed the evidence on natural resources and household welfare. Several insights emerged from this review:
• Natural resources serve as a significant source of income to some households. Resources can also serve as a buffer or insurance during times of need; however, our current understanding of the insurance role of natural resources is limited.
26
• With economic growth, local resource use is unlikely to dramatically decline in rural areas. It is more likely that it will grow in the short to medium term unless some significant policy measures are put in place.
• Poor and wealthy households contribute to resource degradation. The lack of markets in some cases and growth in markets in others, poor governance institutions, high discount rates, and population growth will all likely continue to contribute to degradation of local natural resources.
• One of the reasons households degrade natural resources is because the impact of slow and small changes in resource availability on welfare is small. Households adapt to changes over time—they use alternate resources or obtain their resources from alternate areas. Further, as long as the opportunity cost of time is low, the welfare impact of degradation is likely to be small.
• Attempts to reduce poverty will need to be matched with separate environmental management strategies if the goal is conserve natural resources or services while reducing poverty. Poverty reduction will not necessarily lead to an improved environment unless specific environmental action is taken.
What policy insights does this review provide in terms of environmental management for poverty reduction? Policy makers need to worry about pushing people out of poverty as well as stemming their fall into poverty. In this context, ensuring that resource-dependent communities have a sustainable source of income from nature is one way to prevent households from experiencing deeper poverty. Discrete and substantive changes in resource availability or access will push the poor into further poverty, unless these changes directly result in alternate sources of income. While there is some evidence to suggest that degradation has a smaller effect on household welfare because of how households adapt, this is not its only impact on the poor. Households may feel compelled to make less risky decisions as resource availability becomes less secure. One way to help households make high risk-high return decisions, thereby enabling movements out of poverty, is to ensure that resource-dependent households feel they can rely on nature’s bank. The choices available to the poor need to increase. Strategies or technologies that increase the productivity of natural assets would help the poor. Agro-forestry, value addition through commercial sale of non-timber forest products, and improved local management are some examples of such strategies. We will return to other such strategies in Chapter 4 and the concluding section of this report. On a cautionary note, however, there are costs to improved resource management. Unrealistic expectations related to the poverty impacts of resource management often stem from ignoring these costs. Of particular importance is that these costs can add additional burdens on local communities and governments and thus contribute to failed programs. Many of the pathways out of poverty will be created outside the natural resources sectors. The most promising investments for poverty reduction (Figure 1.2) may lie in strengthening human capital, health, and providing infrastructure that will allow the poor to access external markets and information. From a purely poverty reduction perspective,
27

natural assets are not necessarily the assets that will provide the biggest payoffs. However, they are assets that cannot be ignored in any investment strategy for poverty reduction.
28
3. Health Outcomes and Environmental Pathogens
Improving health outcomes of poor people—through reducing environmental risk factors and providing better access to health and education services—is widely recognized as an essential approach to achieving the MDG health targets. Recent evidence shows that environmental risk factors account for about one-fifth of the total burden of disease in low-income countries (World Bank 2001). Among the ten leading risk factors identified in developing counties, malnutrition is ranked the first, unsafe sex second, unsafe water and lack of sanitation and hygiene third, and indoor smoke from solid fuels fourth (WHO 2002). It is also important to recognize that the prevalence of malnutrition, in particular among young children, is itself closely associated with environmental risk factors; this is becoming a major focus of World Bank work on malnutrition (World Bank 2006). Recent studies confirm that factors other than food insecurity and poor child care—such as maternal malnutrition, an unhealthy environment, and poor health care—are also key determinants of the prevalence of malnutrition. In addition, underweight children have a higher risk of mortality from infectious illnesses such as diarrhea and pneumonia, which are caused mainly by exposure to poor environmental conditions (WHO 2004). This chapter provides a review of the findings from several key studies that analyze the links between health outcomes and environmental conditions using household survey data. Environmental conditions, either at the household or community level, are typically defined narrowly due to data limitations in household surveys. The key environmental factors include access to water (water sources, types of ownership, and distance to residence), access to sanitation services and disposal of human waste, and access to energy sources (types of cooking fuels). Health outcome indicators used in these studies include child mortality risk and prevalence of diarrhea illness, prevalence of malnutrition (underweight and stunting), and incidence of ARI for children and adults. Empirically analyzing environmental health linkages is challenging. There are intrinsic difficulties in the measurement of health outcomes and environmental quality (e.g. water quality and quantity, and bacterial counts), and the complexity in the transmission channels from environment conditions to health outcomes. In addition, households’ behavioral responses affect both health outcomes and access to environmental services, and investment in environmental infrastructure at the household level is likely to also benefit neighbors; that is, there may be external health benefits from private investment. Consequently, conflicting findings often emerge from these studies, even when conducted using similar analytical methods and data sources. This chapter aims to address three key questions through an extensive review of empirical studies focusing on the linkages between health and environment conditions.
• What are the key analytical issues in the area of environmental health? • What are the key findings? • How robust is this body of evidence?
29
Based on the findings from these studies, we provide some policy-related recommendations subject to various caveats in the concluding section.
Theoretical linkages between health outcomes and environmental conditions Studies of the determinants of health outcomes often follow different approaches and methodologies across the fields of social science, medical, and epidemiological research (Mosley and Chen 1984). Social science studies focus primarily on statistical associations between socioeconomic and environmental factors and health outcomes—for example, child survival outcomes or nutritional status—using household-level survey data. These studies often do not address medical causes of child death or explain the mechanisms by which socioeconomic (as well as environmental) conditions operate to produce the observed mortality outcomes. Medical research focuses on the biological processes of diseases, attributing mortality to specific disease processes (such as infections or malnutrition) based on death reports collected either from clinical sources or recalls from household surveys. Epidemiological studies emphasize the mechanisms of disease transmission in the environment, linking health outcomes with environmental contamination (e.g. drinking water, waste disposal or indoor air pollution). Nutrition studies tend to focus mainly on linkages between breastfeeding, dietary practices, food availability, and nutritional status. The critical problem with these disparate research approaches is that the selection of a particular research methodology often results in policy and program recommendations biased in favor of a specific discipline. For example, past studies on child malnutrition commonly lead to advocacy of particular health interventions such as feeding programs, which largely overlook the evidence that malnutrition is as much dependent on maternal health factors and environmental conditions (poor hygiene due to unsafe water and sanitation-induced diarrhea diseases and infections) as it is on nutrient deficiency (Mata 1978; Cole and Parkin 1977; Pinstrup-Andersen et al. 1995). To address this problem, Mosley and Chen (1984) proposed a general analytical framework that incorporates both social, economic, and medical science methodologies to study the determinants of child survival. Wolpin (1997) advanced the literature by constructing an analytical structural model in the setting of optimal household decision making and identified key issues and associated difficulties in empirical implementation. The analytical framework outlined by Wolpin (1997) has provided the base for many empirical studies that have used household surveys as the principal data source for analyzing the determinants of health.
30
31
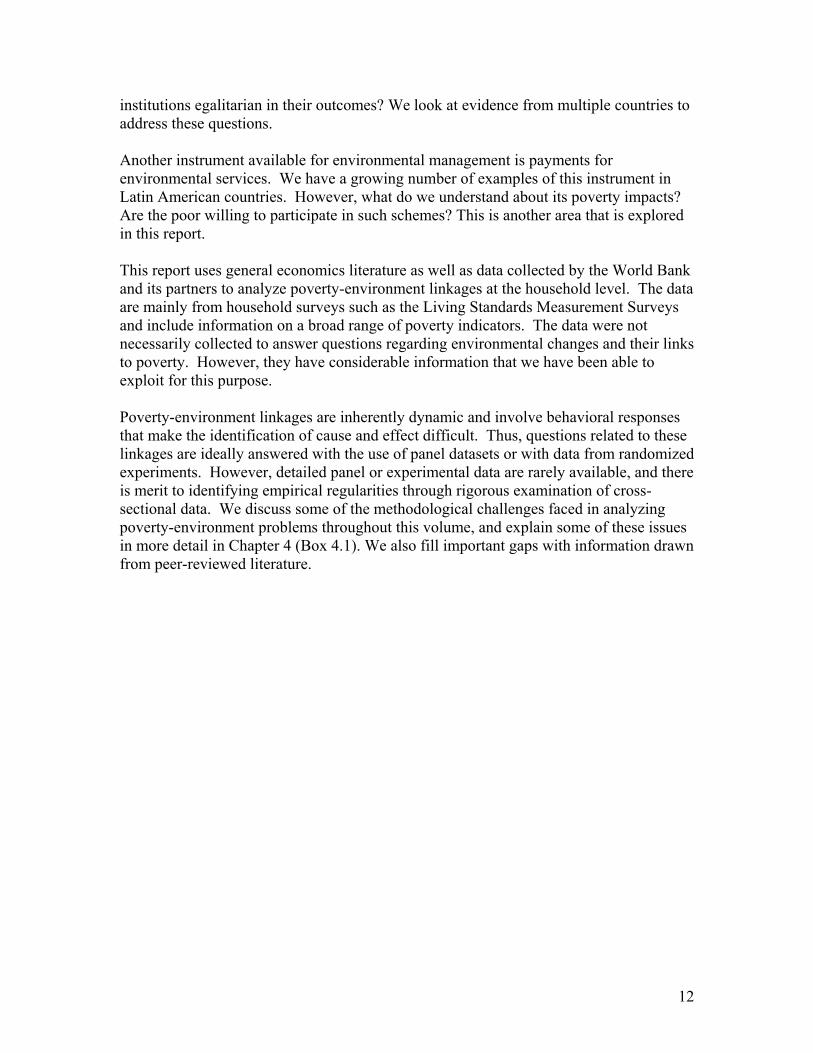
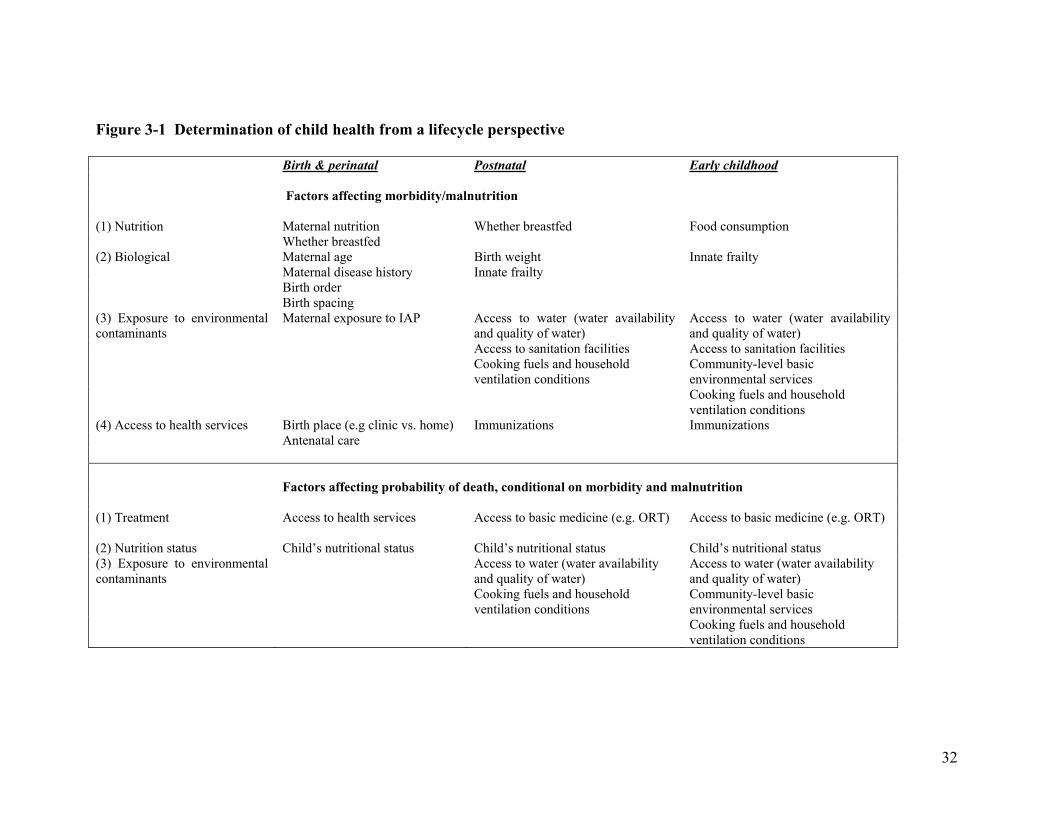
The analytical framework Figure 3.1 provides an illustration of the determination of child health from a lifecycle perspective, starting from maternal pregnancy through birth, the perinatal period, the postnatal period, and early childhood. Since the effect of many factors on mortality risk can vary with the age of the child, it is important to construct a model of child health with varying age effects and analyze environmental determinants of child health by age. In Figure 3.1, the factors affecting child health are grouped into factors that affect the likelihood of a child becoming ill or malnourished, and the factors that affect the probability of a child dying, conditional on becoming ill or malnourished. These factors are further grouped into nutrition, biological conditions, environmental conditions, and heath service access. To a large extent, the level of access to services (health care, use of oral rehydration therapy) and environmental conditions (connection to piped water and water quality) are determined by a household’s health information, the level of education (in particular of the female head), hygienic behavior (hand washing or water disinfection), intra-household resource allocation in food consumption, and other socioeconomic factors (e.g., income). Many factors that affect environmental conditions also affect health outcomes, but they are not directly observable (or difficulty to quantify) in survey data. This data deficiency poses the key challenge in analyzing environmental health linkages using household surveys. In this chapter, we focus on studies that examine the impact of exposure to environmental contaminants on child health outcomes. Exposure to diarrheal disease through the oral-fecal contamination route depends on household sanitation (how the household disposes of fecal matter), availability of water for personal and domestic hygiene, and the quality of drinking water. However, the impact of access to safe water and improved sanitation on exposure depends on the knowledge and use of good hygiene practices. Exposure to indoor air pollution may increase the incidence of acute respiratory illness. The impact of the type of cooking fuel on exposure to indoor air pollution (IAP) depends on time spent indoors during periods of peak exposure, which is likely to be influenced by knowledge of health effects.
32
Figure 3-1 Determination of child health from a lifecycle perspective Birth & perinatal Postnatal Early childhood Factors affecting morbidity/malnutrition (1) Nutrition Maternal nutrition Whether breastfed Food consumption Whether breastfed (2) Biological Maternal age Birth weight Innate frailty Maternal disease history Innate frailty Birth order Birth spacing (3) Exposure to environmental contaminants
Maternal exposure to IAP Access to water (water availability and quality of water)
Access to water (water availability and quality of water)
Access to sanitation facilities Access to sanitation facilities Cooking fuels and household
ventilation conditions Community-level basic environmental services
Cooking fuels and household ventilation conditions
(4) Access to health services Birth place (e.g clinic vs. home) Immunizations Immunizations Antenatal care Factors affecting probability of death, conditional on morbidity and malnutrition (1) Treatment Access to health services Access to basic medicine (e.g. ORT) Access to basic medicine (e.g. ORT) (2) Nutrition status Child’s nutritional status Child’s nutritional status Child’s nutritional status (3) Exposure to environmental contaminants
Access to water (water availability and quality of water)
Access to water (water availability and quality of water)
Cooking fuels and household ventilation conditions
Community-level basic environmental services
Cooking fuels and household ventilation conditions

Figure 3.1 has two important implications for studies that measure the effects of access to water and sanitation (WSS) or fuel type on child health outcomes. One is that looking at the impact of WSS or cooking fuel on child health should be conditional on parental knowledge of hygiene practices or factors that may mediate the effects of burning biomass on a child’s exposure to indoor air pollution. A second point is that in measuring the impact of these environmental factors on mortality or morbidity, the researcher should control for the other determinants of health listed in Figure 3.1.3
33
Key empirical issues Studies that use household surveys to analyze the health impacts of environmental conditions aim to obtain unbiased estimates of these impacts with high precision. Four problems commonly plague such studies. One is the inability to control for some of the factors affecting health listed in Figure 3.1. If these are correlated with environmental conditions, estimates of environmental effects will be biased. A second problem is obtaining a sufficiently large sample to detect an effect. This is particularly problematic in studies of infant mortality. A third problem is sample selection bias in morbidity studies. If the weakest members of the population have died, the impacts of an environmental condition on a randomly chosen member of the population will likely be underestimated. Finally, errors in measuring environmental conditions will likely bias estimates of their effects toward zero. The bias caused by omitted variables sometimes occurs because household datasets do not contain information on child health status, family access to healthcare, or parental knowledge of health effects. In some cases, even proxies for these variables—such as family income or assets, or maternal education—are unavailable. Omitting these variables is likely to bias estimates of the impacts of the impact of access to improved sanitation or clean fuels, since these environmental variables are likely to be positively correlated with unobserved factors that improve child health. One way of handling this problem is to conduct a randomized trial of interventions to reduce exposure to environmental contaminants. The advantage of a randomized trial is clear: if the distribution of an intervention is truly random, it will be independent of other factors—observed and unobserved—that affect health. Randomized trails have been conducted for home drinking water disinfection (Quick et al.1999, 2002; Semenza et al. 1998) and for handwashing (Luby et al. 2005; Cairncross and Valdemanis 2006). A randomized trial of improved stoves has recently been conducted in Guatemala by Kirk Smith and colleagues (2006). Unfortunately, some water and sanitation interventions—for example, piped water connections and toilets—are not as amenable to randomized trials, hence controlled experiments are unlikely to be a significant source of data in the WSS area for many years. The problem of omitted variable bias in observational studies can sometimes be handled by the use of appropriate econometric techniques. Propensity score matching—see, for example, Jalan and Ravallion (2003)—selects households without access to WSS or clean fuels who are observationally equivalent to households with access to serve as a control group for the latter. The logic is that households who look similar in terms of their observed characteristics are (hopefully) similar in terms of their unobserved attributes. If observations on the health impact of (e.g.) IAP exist for several household members, household fixed effects (a household dummy variable) can control for unobserved variables common to all household members (Pitt, Rosenzweig, and Hassan 2006). If panel data are available, a dummy variable can be included for each household member to control for unobserved factors affecting health that change slowly over time.
34

The second problem mentioned above—having a large enough sample to detect an effect when the health outcome is the infant or child mortality rate—may argue in favor of using household surveys. It is much cheaper to collect data on factors affecting infant mortality through large-scale household surveys than through a randomized trial. Conducting a randomized trial of sufficient power to detect an effect of an environmental intervention on infant mortality would be prohibitively expensive.4 The third problem is the sample selection bias resulting from analyzing the health impact of environment infrastructure using only the surviving population. It is well-recognized in the health literature that children who survive differ systematically from those who die, particularly in high mortality populations such as in many African countries, where under-five child mortality rates are over 100 per 1,000 births, compared with about 30 per 1,000 births in middle-income countries. Consequently, inferences about the health benefits of infrastructure programs—such as public investment to provide universal access to safe drinking water, or sanitation service access—can substantially underestimate the effectiveness of health benefits (or even lead to spurious associations) owing to the failure to take account for the potential reduction of mortality of those who were in the birth cohorts but are not recorded in the surviving population. Most studies of nutritional status that are based only on surviving children are likely to be subject to such sample selection bias if appropriate estimation methods for correcting the sample bias are not applied. Finally, it should be emphasized that measuring an environmental exposure with error—using type of cooking fuel as a proxy for a child’s personal exposure to particulate matter—will result in a classic error-in-variables problem, which biases coefficients toward zero. Despite these empirical difficulties, a large number of studies have been conducted analyzing the determinants of health outcomes using cross-sectional household survey data. Indeed, Fewtrell and Colford (2004) argue that these cross-sectional household survey studies are needed to fill the serious gaps that exist in our knowledge of the effectiveness of sanitation interventions in particular.
35
Key evidence on linkages between health outcomes and environmental conditions In this section, we provide a summary of findings from several key studies grouped into four key dimensions of health outcomes: (1) child mortality, (2) child morbidity from diarrhea, (3) child malnutrition, and (4) IAP-induced health risks. Child mortality Health benefits from access to safe water. A large body of literature that focuses on the determinants of child mortality is published in biomedical, demography, and economics journals. However, studies that focus primarily on environmental determinants of child mortality using household surveys are relatively few. These include Lee, Rosenzweig and Pitt (1997) on Bangladesh and the Philippines; Ridder and Tunali (1999) on Malaysia; Merrick (1985) on Brazil; Lavy, Strauss, and Thomas (1996) on Ghana; Hughes, Lvovsky, and Dunleavy (2001) on India; Bhargrava (2003) on Uttar Pradesh in India; Jacoby and Wang (2004) on China; and Van der Klaauw and Wang (2005) on India. The studies on China (Jacoby and Wang 2004), India (Hughes, Lvovsky, and Dunleavy 2001, using 1992–93 national family health survey data), and India (Van der Klaauw and Wang 2005, using 1998–99 NFHS data) use a hazard function to estimate the impact of environmental factors on child mortality risk. One of the major advantages of the China and India studies is the large sample size. The total number of live births was 160,899 for the China study, 59,000 for India in 1992-93, and 53,201 for India in 1998–99. A large sample size of household survey data, with a sufficient number of observations on child deaths, is particularly important for obtaining a statistically significant estimate of the impact of household as well as community access to environmental services on child mortality. Improving access to safe water sources has been identified as one of the most critical preventive environmental measures for reducing child mortality and morbidity in policy making. However, empirical studies based on household surveys do not often provide consistent evidence to support such a premise. The study on China by Jacoby and Wang (2004) provides strong evidence indicating access to safe water sources is associated with lower child mortality risks. The estimates show that the largest and most significant impact on child mortality reduction comes from access to safe water, which includes water sources from pipes, inside household or public taps, and deep wells within a short talking distance. The results estimate that improving safe water access from the average level of 33 percent in the early 1990s to universal access (100 percent) in rural China could reduce the under-five child mortality rate from 33 to about 30 per 1,000 births, representing a 9 percent reduction in the under-five mortality rate. In addition, targeted investments in improving access to safe water can generate a significantly larger health impact: improving safe water access to poor localities increases the health benefit by about 33 percent (in terms of mortality rate reduction) compared with untargeted investments. These results on the child mortality benefits of access to safe water are
36
emphasized in recent work by Cairncross and Valdemanis (2006) on disease control priorities in developing countries. Using information collected on causes of death in the China health survey, Jacoby and Wang (2004) also attempt to validate the causal interpretations of safe water access on child mortality reduction. The results show that the probability of child death from causes (birth related deaths and neonatal tetanus) that should not be associated with safe water is indeed not related to access to safe water. While the probability of dying from diarrhea diseases is, as expected, most responsive to interventions that improve access to safe water, the China study also provided a statistically significant association between safe water access and fever/ARI. This emerging and potentially very important water-hygiene-infectious agent transmission pathway for acute lower respiratory infections (ALRI), which kill 2 million children annually, is not yet recognized to be part of the water, sanitation, and hygiene risk factor in WHO global burden of disease estimates, but appears strongly in a randomized trial in Karachi reported by Luby and others (2005). However, the studies on India using the 1992–93 NFHS and 1998–99 NFHS find no significant impact of household-level access to safe water sources on child survival probability.5 Hughes et al. (2001) show that improving community access (that is, increasing coverage within a community) to safe water or sanitation in both urban and rural areas significantly reduces child mortality risks. The studies by Lee et al. (1997) on Bangladesh and the Philippines, and by Ridder and Tunali (1999) on Malaysia do not provide any evidence on the health benefits of access to safe water sources. The relatively small sample size in these studies might be the underlying reason for the lack of statistical significance of the results. The number of observations for Bangladesh was 611, and for the Philippines 837.
37
Child mortality risks vary with age. The China and India studies also show that the impact of environmental conditions on child survival probability varies by children’s age. The China study shows that access to safe drinking water sources significantly reduces child mortality risks after one month of birth, but not before the first month. The findings based on the India 1998-99 NFHS show that having access to sanitation facilities (flush toilet, pit toilet, and latrine) reduces child mortality risks for children between one and five, but not under one. Using survey data from Uttar Pradesh in India, however, Bhargrava (2003) shows that access to sanitation facilities significantly reduces infant mortality. Studies from both sets of NFHS data from India (1992–93 and 1998–99) provide evidence indicating that the use of clean cooking fuels (biogas, electricity, LPG, kerosene, and charcoal) reduces child mortality risk. Using a hazard model that allows an age-varying effect of environmental conditions on mortality risks, Van der Klaauw and Wang (2004) find that having a separate kitchen and using clean cooking fuel significantly improves child survival probability during the first month of birth, but not after. This finding possibly confirms results from studies on indoor-air-pollution-related health problems in many low-income countries, which establish linkages between exposure to IAP for women during pregnancy and low birth weight and associated perinatal conditions (Boy, Bruce, and Delgado 2002). A detailed discussion on IAP-related health risks is presented later in this section. Child mortality and access to electricity. Several studies have found a statistically significant impact of access to electricity on child mortality. The India studies using the NFHS data show that having access to regular electricity supply significantly improves children’s survival chances. The 1998–99 survey shows access to electricity increases the survival probability of new-born babies (before first month). The 1992–93 survey finds that access to electricity reduces under-five mortality risks; this effect is independent of the influence of clean cooking fuels. Similar results were also obtained using Malaysian data by Ridder and Tunali (1999) when controlling potential confounding factors such as income. Using cross-country data constructed from comparable DHS surveys, Wang (2003) finds a robust impact of access to electricity on under-five mortality, controlling for income and health expenditure. These findings are difficult to interpret because the survey instruments do not give any additional information that might link access to electricity and health outcomes. One possible explanation might be that a household connection to electricity facilitates access to information through television and radio, which are key sources of information on public health, as well as providing light for reading in the evening (Box 3.2). Among high-income households, the health benefits of electricity access might include refrigeration, which has been identified as an important measure for reducing the incidence of food-linked infectious diseases among young children.
38
Child morbidity from diarrheal disease There is a large literature that attempts to estimate the impact of access to safe water and sanitation on diarrheal morbidity. A useful summary of the literature is provided in Fewtrell and Colford (2004).) In estimating the global burden of disease due to unsafe water and lack of sanitation, the World Health Organization (Pruss-Ustan et al. 2004) relied both on studies using household survey data (for example, Esrey’s 1996 analysis of data from the DHS surveys) and randomized trials of home drinking water disinfection and hand washing. Box 3-1 The importance of health information Jalan and Somanathan (2004) analyzed the effect of information on household mitigation behavior to purify water using a random experiment approach based on households from the city of Gurgaon in India. They found that households who were told that their drinking water was “dirty” were 11 percentage points more likely to begin some form of home purification in the next seven weeks than households that received no information. The water test kit that costs less than 50 US cents per sample is available off the shelf from many NGOs in Delhi and simple enough for households to use themselves. The study demonstrates that the impact of such a water test kit on the probability of purification is equivalent to about two-and-a-half times that of an additional year of schooling, and more than two-thirds that of a move from one wealth quartile to the next. This indicates that public programs that focus on dissemination of health information are cost-effective and relatively easy to implement in low-income countries. It could stimulate demand for better environmental quality through political expression or increased willingness to pay for improvement of environmental services. Randomized trials of home drinking water disinfection (Quick et al. 1999, 2002; Semenza 1998) have been shown to reduce the incidence of diarrhea in children under five from 44 percent (Bolivia) to 62 percent (Uzbekistan). Jalan and Somanathan (2004) (Box 3.1) have shown the importance of providing information about drinking water contamination in inducing households to purify their water. Hand washing is another area in which randomized trials have demonstrated the effectiveness of a simple method of reducing exposure to environmental contaminants. In a study in Karachi, Pakistan, Luby et al. (2005) found that children under 5 in households given plain soap had a 50 percent lower incidence of ARI and a 53 percent lower incidence of diarrhea than children in control households, a result that confirms earlier hand-washing studies (Cairncross and Valdemanis 2006).
39
Box 3-2 Piped water and diarrhea incidence in rural India Jalan and Ravallion (2003) analyzed the impact of access to piped water using the 1998–99 India NFHS data on the prevalence and duration of diarrhea for children under five. They found significantly lower prevalence and shorter duration of the disease for children living in households with piped water as compared with a comparable group of households. Health gains from piped water tend to be smaller for children with less-educated women in the household, indicating that education is likely to be a proxy variable for knowledge about how to assure that water is safe to drink and that diarrheal disease is identified and treated in a timely manner. An interesting finding from the comparison of the health gains from piped water access by level of access (i.e. inside tap versus public tap) shows that the impact of access to an inside tap on the duration of diarrhea is significantly larger in households where the female member is illiterate. This suggests that piped water access with an inside tap may partly compensate for the knowledge disadvantages of being illiterate. Jalan and Ravallion (2003) apply propensity score matching techniques to data from the 1998–99 Indian National Family Health Survey to examine the impact of access to piped water on diarrheal disease (Box 3.2). The results show significantly lower prevalence and shorter duration of the disease for children residing in households with piped water compared to children living in households that have no piped water connection, but have similar observable characteristics that determine the probability of connecting piped water. In addition, there is a strong interaction effect between the level of piped water access (inside tap versus public tap) and female education status, suggesting inside tap access partly reduces the health knowledge disadvantages of being illiterate Child malnutrition The nutritional status of young children is an outcome of household-level decisions regarding food consumption (quality and quantity), health outcomes, and childcare. These choices are, in turn, determined by household preferences, access to health and basic environmental services, and their ability to utilize private as well as community resources (Alderman, Henschel, and Sabates 2003). The immediate causes of malnutrition—including insufficient intake of energy, nutrients, or both—and prevalence of infectious diseases are well-known in the literature (Pinstrup-Andersen, Pelletier, and Alderman 1997). There is also a large literature relating malnutrition to diarrheal disease (Brown 2003). Children who experience repeated episodes of diarrhea are likely to become malnourished; hence water and sanitation interventions that prevent diarrhea may also prevent malnutrition.6
40
Previous studies by social scientists have concentrated on the impact of several underlying determinants—in particular maternal education, access to health care, and basic environmental services—on children’s nutritional status (Thomas, Lavy, and Strauss 1991; Alderman and Garcia 1994; and Barrera 1990). Glewwe (1999) shows that maternal education influences nutritional outcomes through several channels, including directly transmitting health knowledge to mothers; teaching quantitative and literacy skills needed for diagnoses and appropriate treatment of common childhood illness; and exposing women to modern medical treatment. Improving female access to education also empowers women through raising their control within households in resource allocation decisions (e.g. spending a larger share of the budget on children’s food consumption as apposed to alcohol or cigarettes) and utilizing more health care services (Smith and Haddad 1999; Alderman et al. 2002). Recent studies have provided evidence indicating that private investment in female education and access to water and sanitation services is likely to generate external health effects on child nutritional status. These studies show that children living in households with inadequate access to basic services can still benefit, in terms of health status, from a neighbor’s investment that results in better community environmental conditions. Studies using household surveys find similar evidence across several countries, including Gragnolati (1999) for rural Guatemala, Thomas and Strauss (1992) for Brazil, Glewwe (1999) for Morocco, Alderman et al. (2003) for Peru, and Silva (2005) for Ethiopia. Using the 1997 Peru Living Standards Measurement Study (LSMS) survey, Alderman et al. (2003) estimated the derived health demand function to study the external benefits of investment in education, water, and sanitation access on children’s nutritional status (measured by height for age); that is, households benefit from investments in these factors by their neighbors. They find significant externalities to the investment in household-level environmental infrastructure (water and sanitation) and human capital (particularly female education in rural areas). In addition, they find that in rural areas households with neither water nor sanitation infrastructure only benefit from being located near households with access to both services, but not safe water or sanitation alone, which is similar to findings by Hughes et al. (2001) on child mortality in India. The study by Silva (2005), which follows similar model specification and estimation methods as Alderman et al. (2003), focuses on the impact of externalities of water and sanitation services on nutritional status using the 2000 Ethiopia Demographic and Health Survey. Two nutritional indicators are examined in the Ethiopia study: (1) underweight (weight for age), which is often regarded as a short-term measure of nutritional status; and (2) stunting (height by age), a long-term measure. Two interesting findings emerge from the Ethiopia study. First, access to water and sanitation services have a significant effect on the short-term nutritional status (underweight), but not on stunting, which differs from the findings in Alderman et al. (2003). The second finding is that households’ own access to water or sanitation has no significant impact on child health status (underweight), with a strong health benefit emerging solely from community access to water or basic sanitation facilities.
41
Box 3-3 External benefits are subject to diminishing returns The commonly observed externality impact of community water and sanitation conditions on children’s health status depends on the average level of community access. In rural Peru (Alderman et al. 2003), the positive externality health effect of access to sanitation services diminishes as the average level of community access to sanitation increases, and the positive externalities on children’s height become insignificant after about half of the neighborhood has access to sanitation. The similar diminishing externality effect of community access to water and sanitation on children’s nutritional status measured by underweight is also confirmed using the Ethiopia health survey by Silvia (2005). The study on India based on 1992–93 NFHS data by Hughes et al. (2002) also shows that health benefits (on child survival probability) are a function of the community level of water and sanitation access. They estimate that the critical threshold is about 50 to 60 percent of households with access to a private safe water connection or with toilets, above which no additional health benefit is observed from infrastructure investment. The diminishing health impact of community-level environmental infrastructure is also consistent with the finding from the China study of Jacoby and Wang (2004), which shows that larger health benefits (in terms of child mortality reduction) are obtained from targeting public investment in improving access to safe water in poor localities, where general environmental conditions tend to be much worse than richer. These results on the external benefits of access to water and sanitation lend important support to the “total sanitation” concept that the World Bank and partners have been following in South Asia (World Bank 2005). This approach combines increased access to water and sanitation with public education on hygiene, as well as promotion of toilet usage through community action programs. Indoor-air-pollution-induced health risks Indoor air pollution (IAP) poses a major health risk, in particular for poor households. This is because biomass fuel—such as wood, charcoal, crop residuals, and dung—remains the principle source of energy for cooking and heating in many rural areas of low-income countries. Many studies have provided a consistent statistical association between the exposure to IAP and the incidence of diseases—acute respiratory infections (ARI), middle-ear infection, chronic obstructive pulmonary disease, lung cancer and asthma—and a variety of perinatal conditions, possibly as a result of maternal exposure to IAP during pregnancy (Ezzati and Kammen 2002; Smith et al. 2000; Smith et al. 2004).7 ARI caused by exposure to IAP is not only a leading cause of death among children under five in low-income countries; in addition, exposure to air pollution (both indoors and outside) during childhood can have long-term adverse health consequences into adulthood (Gauderman 2004). The magnitude of the disease burden associated with the health risks of IAP is widely documented in the literature and increasingly recognized as a major health issue among health and environment experts. The World Health Organization (Smith et al. 2004) estimates that 910,000 annual deaths (56 percent of all causes of death) and 31,919,000 disability-adjusted life years (2.2 percent of total DALYs) are associated with exposure to indoor air pollution each year.
42
There are important differences between studies of the impact of water and sanitation on child health and studies of the effects of indoor air pollution (IAP). Most water and sanitation studies directly measure the impact of an intervention—hand washing, home drinking water disinfection, or piped water connections—on health. In the case of IAP, it is possible to measure indoor concentrations of particulate matter (PM10 or PM2.5) and even to measure personal exposure to PM, which can be related to mortality and morbidity through a dose-response function. It is also possible to study separately the factors that affect IAP concentrations.8 There is a growing literature on the impact of fuel use, stove type, and other factors on indoor air concentrations (Ahmed et al. 2005; Dasgupta et al. 2004, 2006). There is also a growing epidemiological literature relating to measurements of personal exposure to health effects. It should, however, be noted that in the early literature relating indoor air pollution to child health (Smith et al. 2000), exposure is usually measured very crudely—for example, by dummy variables indicating type of fuel used for cooking. Ezzati, Saleh, and Kammen (2000) and Ezzati and Kammen (2001) represent an early attempt to estimate dose-response functions for IAP. In a series of studies in Kenya, the authors measured concentrations of PM10 inside 55 homes and also recorded the time spent by different family members indoors, in different parts of the house, and outdoors. These were used to construct measures of personal exposure. A cross-sectional analysis was performed relating the incidence of respiratory illness, diagnosed by health professionals over a two-year period, to personal exposure. Ezzati and Kammen found that exposure to 24-hour concentrations of PM between 1,000 and 2,000 micrograms per cubic meter more than doubled the chances of a child experiencing acute lower respiratory infections compared to children in households with 24-hour concentrations below 200 micrograms per cubic meter.9
Three other important findings emerge from Ezzati et al.’s work. First, for the highest exposure group (the women who take charge of cooking and young children looked after by these women), about half of daily exposure occurs in a high-intensity episode (cooking period). Second, the commonly reported significant gender effect of the health impact of IAP on incidence of ARI disappears when controlling for time spent for cooking and period of high-intensity IAP exposure. This indicates that the gender variable simply picks up the effect of omitted cooking time and peak exposure variables. Third, empirical results based on average daily PM10 concentration measures can significantly underestimate the exposure of women more than men, consequently resulting in a systematic bias in the assessment of the exposure-response relationship. To better understand factors determining personal exposures, Dasgupta et al. (2004, 2006) measured indoor air concentrations using newly developed monitoring equipment. They used air samplers that measure 24-hour average PM10 concentrations and real-time monitors that recorded PM10 and PM2.50 at 2-minute intervals for 24 hours for a stratified sample in urban, periurban, and rural areas of the Dhaka region in Bangladesh. The exposure measures focused on two dimensions: (1) an individual’s time spent in different
43
locations (cooking areas, living areas, and outside), and (2) hourly fluctuations in pollution from cooking. Three key findings emerge from the study by Dasgupta et al (2006). First, IAP pollution is not confined mainly to cooking areas and can disperse into living areas rapidly (the monitoring data show that pollution is only moderately below cooking area pollution). Secondly, they find a high level of exposure (around 200 ug/m3) for infant and young children (aged between 1 and 5) of both sexes. The gender-based divergence occurs among adults, with women’s exposure nearly twice as much as for men in the age group 20–60, and about 40 percent higher for older women (over 60). Third, poorly educated women in poor households face IAP pollution levels that are four times those of men in higher-income households with more educated women. These findings are consistent with another study of IAP exposure in Andhra Pradesh in India (World Bank 2002). The Bangladesh studies suggest that reducing IAP-related health risks can be effectively achieved through (1) improving ventilation, and (2) reallocation of activities and time spent indoor during high-emission periods.10 For example, children’s exposure to IAP can be halved by simply increasing their outdoor time from 3 to 5 hours per day and concentrating outdoor time during peak cooking periods. To some extent, this implies that investment in cleaner stoves11 or switching to better fuels should be of secondary policy priorities in addressing IAP-related health, particularly in the short-term, while providing information to households to influence their allocation of activities is more effective.
How robust are these empirical findings? The inherent difficulties in the study of health outcome determinants based on household survey data highlighted earlier raise questions about the robustness of the empirical findings. This is a highly relevant point, as empirical results from these studies are often used to provide the basis for policy making, ranging from allocating public investment across sectors (e.g. between health, education, environment, and energy), to making investment choices among different types of environmental infrastructure, or to targeting various health-focused public programs. Empirical findings from cross-section household surveys are often criticized on the grounds of (1) failing to prove a causal relationship between health and environmental conditions, and (2) providing biased estimates of the impact of environmental variables (e.g. access to safe water source or use of cooking fuels).12 Critics argue that these studies do not provide useful guidance for allocating resources in the areas of public infrastructure investment or health programs. This deficiency in household surveys has led to a tendency in recent economic literature to endorse only findings from randomized trials or properly designed experimental field studies. However, despite the obvious advantages of randomized trials or experimental approaches, studies on the determinants of health outcomes are likely to rely primarily on
44

household surveys. There are several reasons. First, in the area of child morality, child death is a rare event and the measurement of child mortality risk requires a large sample, or the accumulation of mortality experiences of smaller samples over long periods of time (often over five years). Secondly, health outcomes of exposure to environmental risks (e.g. IAP) may depend on cumulative exposure; therefore, it is very difficult to apply any short- or medium-term program evaluation approaches to assess the health impacts of a program. Third, the difficulties of randomization of infrastructure services (piped water and sanitation services) further handicap experimental approaches for studying child mortality or morbidity, although it is possible to implement a randomized trial for some environmental interventions, such as improved cooking fuels, improved stoves, water projects, or nutritional programs. In the light of the analytical constraints from various approaches for studying the linkages between health and environmental conditions, we may be confident of some findings from the studies reviewed in this chapter. First, the China and India studies on child mortality have utilized large household datasets that provide a sufficiently large number of child deaths for analyzing child mortality risks. Secondly, the China study further validates the causal effect of environmental factors on child mortality using cause of death information. The results from the hazard function, which allows the child mortality rate to vary by cause of death, confirm that access to safe water does not affect the probability of death from causes such as birth-related deaths or neonatal tetanus that should not be associated with safe water. These findings are very similar to that from the study by Galiani et al. (2005) in Argentina using municipality mortality data. They find that localities with water privatization, which has brought increased access to the water and sanitation network and improved service quality, have a significantly lower rate of child mortality from infectious and parasitic diseases and perinatal deaths, but no significant effect on mortality from other causes such as accidents, cardiovascular disease, or cancer. Third, by allowing the environmental effect on child mortality risk to vary by age, the China and India studies also show that environmental factors (safe water access or sanitation facilities), which are not likely to affect neonatal deaths, are indeed not significant. This further increases our confidence in these studies, indicating that the results do not merely pick up spurious correlations between health and environmental conditions. The confidence in results from the several studies on nutritional status is supported by the fact that findings from these studies for several countries are very consistent, in particular those by Alderman et al. (2003) and Silva (2005). The critical issue in the area of nutritional study is the sample selection bias resulting from using only the survival population, as discussed above. Since no studies on nutritional status, to our knowledge, have explicitly taken account of the sample selection bias problem, it remains an important area for future research, in particular for African countries with high mortality rates. The findings from studies on the health effects of IAP are less numerous; hence, policy conclusions regarding both health impacts of different levels of exposure and of methods
45
to reduce indoor exposure await the application of good quality monitoring data and appropriate analytical methods in more studies.
Conclusions and some tentative policy implications The previously identified empirical issues in analyzing health and environment linkages, as well as the sometimes weak evidence from the available literature, remind us that it is important to interpret results cautiously from studies based on cross-sectional household survey data. However, the key findings from the above studies provide some useful policy implications for guiding project or program design in four key areas. First, these studies reinforce the message that designing health-focused programs/projects should be based on much broader considerations, including health, environment, education, nutrition, and public health information. How to design and implement such multidimensional programs, however, remains a challenge to the Bank’s operational activities. Future policy and analytical work should aim to provide more specific and operational guidance for the Bank’s policy lending and project investment that aims to address health issues. Second, allocating resources, either in the form of public programs or direct public investment in environmental infrastructure, should focus on targeting poor communities rather than poor households because investments in clean water and sanitation infrastructure have an externality effect on household health. Publicly funded programs need to recognize and capture this externality. Third, the role of information, which plays a critical role in improving health outcomes in low-income countries, is largely overlooked in many health-related studies. More importantly, the role of health information is often omitted in policy making, which may imply that health program resources are misallocated. The lack of information about the health impacts of poor environmental services—ranging from water quality to exposure to indoor air pollution—may affect the demand for better environmental quality (by way of political expression or lack willingness to pay for improvements) and household behavioral responses in mitigation. Future studies on environmental health should attempt to focus on evaluation of the impact of public information on household mitigation behavior and health outcomes. This has important implications for guiding health-focused program and project design. Fourth, while it is widely recognized that the use of biomass fuel poses a serious health risk to households in low-income countries, key factors that determine human exposure and policy recommendations on reducing exposure require further study. The key factors include energy technology (high-efficiency and low-emission stoves) and housing characteristics and behavioral responses (who is assigned to cooking tasks within households, and the amount of time spent indoors during peak cooking period). More thorough cost-benefit analysis is needed to provide answers to such questions as whether public programs should focus on promoting wood stoves or the transition of fuel use from
46
biomass to charcoal, or kerosene or gas. In addition, studies on the health effects of IAP should also consider linkages between fuel use, deforestation, and carbon emissions, in particular when climate change has become a policy focus. In the area of environmental health studies, future policy analysis should focus mainly on improving data collection to address data deficiencies and enhance the robustness of empirical evidence. In particular, researchers should attempt to collect longitudinal survey data, and incorporate questions in household surveys to collect cause of death information and other retrospective information on social, environmental, and health conditions at the household level. Evidence generated from household surveys should be validated by supplementary studies using experimental approaches in appropriate circumstances, or matching methods to control unobservable confounding factors.
47
4. Household Welfare and Policy Reforms Policy changes that affect the natural environment can have direct and indirect impacts on household welfare. Poverty alleviation and an increase in a household’s economic welfare is one possible impact. Better nutritional and health outcomes are another possible effect. This chapter focuses on policy reforms that influence both aspects of household welfare through better management of environmental resources. Reforms with positive environmental and welfare impacts do not always originate from the environmental sector. Some reforms—such as creation of common property rights, incentives for better management of natural resources, or creation of novel markets for environmental services—pertain directly to environmental resources. In other cases, sectoral or macro policies intended to improve other aspects of the economy may also have environmental and welfare benefits; strengthening of private property rights is one example. The last several years have seen significant changes globally in who has access to and control over natural resources. There have been parallel trends toward strengthening the rights of local communities and the private sector over natural resources in many countries. The strengthening of local rights has been either through devolution of state control to the communities, increased legal access to natural resources, or power sharing agreements with the state. The strengthening of private rights has occurred thorough privatization of public sector enterprises, improved security of land tenure, and creation of economic value from environmental services. There are many examples of reforms not accomplishing their goals or having unintended consequences on the poor. For example, strengthening communitarian rights may, in some cases, contribute to further deprivation of the very poor. Sundar (2000), Sarin and others (1988), and Agarwal (2001), for example, argue that joint forest management programs in India, by closing off access to certain forests, help well-off villagers who can secure alternate sources of fuelwood, but burdens poor villagers and women. Dzingirai (2003) argues that community-based natural resource management programs like CAMPFIRE do not benefit the rural poor. Similarly, extending private rights and creating novel markets may not always benefit all the poor. Securing land rights for one group may deny it to another. Munyao and Barrett (2006) found that more secure land rights had a negative impact on traditional pastoralism in Northern Kenya. In Burkina Faso, Brasselle and others (2002) showed that less secure land tenure encouraged more investment in land where such investments could improve future tenure security. When payments for environmental services were targeted to owners of large forest areas, Zbinden and Lee (2005) found that program payments tended to go to better educated, wealthier farmers. This chapter examines a range of policy reforms through case studies with positive benefits to the poor. The six country studies in this chapter assess the impacts of these
48
types of policy reforms on broad indicators of welfare. Different policy mechanisms highlighted in the studies were intended to influence environmental resources—such as forestry, wildlife, water, and land—in Nepal, Namibia, the Philippines, China, and Nicaragua. The Argentine case study examined reforms aimed at increasing coverage of water supply and sanitation. The rest of the chapter is organized as follows. Section 2 focuses on the selected policy reforms examined with the case studies. Section 3 draws attention to the need for the right kind of data collection and some of the limitations of the case studies. Section 4 concludes with the benefits and advancement in the knowledge base of environment-poverty linkages derived from household-level welfare analysis
49
Selected policy reforms
This section focuses on five policy reforms: (1) creating common property rights; (2) strengthening private property rights; (3) creating incentives for better management of environmental resources; (4) creating novel markets for environmental services; and (5) increasing access to services. Of these reforms, creating common property rights and creating incentives for better resource management are devolution-type policy reforms. Strengthening private property rights, creating novel markets for environmental services, and private provision of access to services are policy reforms that build on private property rights.
Our interest in the privatization of water utilities stems from an increase in access to water infrastructure. In general, privatization of a public sector functions have two goals: (1) increased efficiency; and (2) access to new financial resources through private investment. In this chapter, we look at privatization as a reform tool that allows increased access to water infrastructure and its impact on health welfare.
The studies examined in this chapter use impact evaluation methods to measure the impact of policy reforms on household welfare. Box 4.1 describes various impact evaluation methodologies used in the case studies discussed in this chapter. Box 4-1 Impact evaluation methodology Impact evaluation methods attempt to answer the question: what is the average gain in welfare to those households selected in the reform as compared with the hypothetical situation where the same households were not included in the reform? The resulting measure is known as the impact of average treatment on the treated (ATT) (Imbens 2004). The hypothetical welfare of households if they were not included in the reform cannot be observed. Empirical analyses depend on division of the sample households and communities into control and treatment groups. Randomized social experiments would ensure households participating in the reform are not statistically different from those in the control group. However, randomized social experiments imply denying the benefits of reform to some households who may need it most. In other cases, the nature of the reform may make randomization at the household level impractical (Moffitt 2003; Keane 2006). In the cases discussed in this chapter, randomized selection into treatment and control was not possible. In cases where the non-random allocation of the treatment is decided either by the policy maker or is self-selected by the households, selection bias may cloud the impact estimation results. Selection bias may be of two types: (1) selection bias based on observed data; and (2) selection bias based on unobservable data. The “difference in difference” method takes into account selection biases of both kinds by taking the difference between treatment and control groups’ welfare averages before and after the
50
Box 4-1 (continued) Impact evaluation methodology reform implementation. It requires data from before and after the reform program implementation for both the control and treatment groups. The difference in difference method was used in the Argentina case study. In the absence of before and after data, estimation methods are limited to cross-sectional analytical tools. Most of the studies examined in this chapter used cross-sectional data. The “propensity score matched difference” method calculates ATT differences in welfare between treatment and control households after they are matched with one another on the basis of propensity scores (Imbens 2004). Each household is assigned a propensity score based on a vector of its characteristics. The propensity score match difference method can correct for selection bias based on observed variables if these variables are included in the calculation of the propensity score. However, this method is not appropriate if selection biases based on unobserved variables are present. The cross-sectional data in the case studies were used with the “instrument variable” (IV) method to calculate ATT (Wooldridge 2002). In this method, both selection into the treatment group as well as the welfare indicator are modeled with estimated parameters of equations. Unlike the other methods, the IV method’s estimates depend on the structure of the models. Like the difference in difference method, the IV method does not suffer from the two types of selection biases based on observed and unobservable factors. The inherent problems of using cross-sectional data mentioned in the previous chapters were present in these studies as well. In particular, cross-sectional data can only identify associations between a policy change and its possible effect on an outcome. Without the time dimension in the data, the analytical methods alone cannot determine causalities where the factors are confounding. The associations identified in the studies may reinforce and point in the direction of possible relationships. For a comprehensive review of household welfare-based impact evaluation methodologies, see Ravallion (2007). Creating common property rights Creation of common property rights implies transfer of rights and responsibilities from the state to user groups at the local level. In Namibia, for example, registration of communal conservancies provided communities with rights and responsibilities of wildlife management within the conservancies. In Nepal, changes in national forest policy allowed forest management by local user groups. Common property rights are by no means uniform across countries and across types of properties under consideration. For example, in Namibia, formation of conservancies
51
allows communities as a whole to enjoy use rights to wildlife, though these rights do not permeate to individual households. In Nepal, individual households enjoy collection and use rights to fuelwood from community forests. The case studies of Namibia and Nepal highlight similarities and differences in policy reforms creating common property rights in two different contexts, and how these reforms resulted in changes in household welfare. The first study (Bandyopadhyay and Shyamsundar 2004) focuses on increased legal access to wildlife through community conservancies in Namibia where communities have certain rights over wildlife and tourism. The second study (Bandyopadhyay et al. 2006) focuses on the devolution of control of forestry resources to community “forest user groups” (FUGs) in Nepal. The Nepal and Namibia studies consider the impact of community participation in wildlife and forestry management on consumption expenditure and other measures of household welfare. Creation of common property rights does not always imply that the disadvantaged in the community have equal access to those properties. In particular, the issue of elite capture cannot be ignored in any discussion of common property rights. Elite capture is the situation where a few elites in the community usurp the rights to a common property and exclude the disadvantaged from exercising their common property rights. Some of the studies test the elite capture hypothesis and more generally try to answer three questions:
• Who participates in the community management of environmental resources? • Do participants gain more, the same, or less, as compared with the rest of the
community? • Are poor and disadvantaged households prevented from benefiting from the
common properties? Box 4.2 focuses on the first two questions and draws on the similarities and differences between the studies. Box 4.3 looks at the question of who among the poor and the non-poor benefit more from the reforms.
52
Box 4-2 Participation In some cases and countries, when resource management is handed over to communities, all households automatically become members of the local institution. However, even under these circumstances, not all households engage with the community organization or even know about it. An interesting question is how important is it for the households to actively participate? Does lack of participation result in a reduction in benefits, given that most changes affect the entire community?
In Namibia, community conservancies increased the welfare of households living within them, but participants did not gain relative to non-participants. The authors speculated that participants may share their wildlife-related income with others. It is also possible that the increase in welfare was a result of community public goods and NGO activities in the area. In Nepal, participation in FUGs by households was not observed in the data. However, a similar study on joint forest management in India (Bandyopadhyay and Shyamsundar 2004) found that on average community forestry did not contribute to increased access to fuelwood consumption, but those households who were participants increased their consumption of fuelwood. It is possible that participation translated to increased access to forestry officials and increased local power. Though the results from India may not be applicable in Nepal, the India study illustrates the opposite of the results from the Namibia study. That is, active participation in community forestry may result in additional benefits to households.
Ideally, impact estimations should be based on randomized experiments. Randomized experiments may not be always practical, in case of many environmental management policy changes. The level and intensity participation of households in the change may differ. It is not only important to understand what motivates households to participate in community- and private-entity-based environmental management, but it is also important to measure how the participating households stand to gain from the participation.
Namibia Namibia has pioneered legal access of communities to wildlife resources through communal conservancies. Namibia’s community conservancy program was largely shaped by the presence of successful commercial conservancies that formed a successful wildlife industry (Jones and Murphree 2001). In 1995, the Government of Namibia laid out a set of progressive access rules for communal lands.13 Under the policy reform, communal conservancies as a whole could exploit and gain from wildlife resource management. Few studies have quantitatively assessed the welfare impact of Namibia’s communal conservancy program. Brian Jones (1999b) provides anecdotal evidence that communities have benefited in cash and kind.
The policy reform in Namibia requires that communal conservancies be registered with the state, with recorded geographical boundaries and a comprehensive list of members. Communities in registered communal conservancies enjoy economic rights to wildlife resources within the boundaries of the conservancies. The communities also take responsibility for conserving these resources. By the end of 2003, nearly one-fourth (23 percent) of all communal land in Namibia were under conservancies (NASCO 2004). The communal conservancies prepare annual wildlife management plans that include a count of existing stock. Their allocated use is subject to state regulations for protection of understocked species. Jones indicates that meat distribution to the member households is a major benefit. Communal conservancies may gain from profit-sharing agreements with tourist lodges and employment generated through tourism-related activities. The study used household survey data undertaken in 2002 by the Wildlife Integration for Livelihood Diversification (WILD) project and the Environmental Economics Unit of the Directorate of Environmental Affairs in the Ministry of Environment and Tourism. It included 1,192 households in seven conservancies from two regions, Kunene and Caprivi. The survey did not include any households living outside the seven conservancies. To overcome this data limitation, the study utilized the fact that the full benefits from a conservancy can be achieved only after the conservancy has been in operation for several years. The study thus distinguished between two types of conservancies, “established” and “comparator.” It then evaluated differences in income measures between these two types of conservancies. The Namibia and other studies used instrument-variable and propensity-score-based impact estimation methodologies. These methods econometrically compared households in control groups with those in the treatment groups where the treatment was the environmental policy or program intervention whose impact was being measured. See Box 4.1 for a brief review of these methodologies. The study on Namibia examined four indicators of welfare: (1) household income, (2) household consumption, (3) per capita income, and (4) per capita consumption. At least in the Kunene region of Namibia, communities had a higher per capita income (28 percent higher) relative to comparator groups, which was attributed to the presence of conservancies. These improvements in income were attributed to an increased ability to engage directly with tourism as well as NGO activities. The study found the impact of conservancies was poverty-neutral in some regions and pro-poor in others. The study examined the welfare impact of conservancies in four types of disadvantaged households, such as those with low education levels, female-headed households, asset-poor households, and livestock-poor households. In all the cases, the study found that the disadvantaged groups were at least as well off as the rest of the communities in terms of benefiting from communal conservancies.
54
The study demonstrated that devolution of common property rights to the community organization of communal conservancies and increased economic activities resulted in measurable welfare gains to the household. Moreover, the poor and the other disadvantaged groups gained at least as much as the other groups in the communities. Box 4-3 Welfare distribution: poor versus non-poor A few elites in the community may take over the management as well as the potential benefits from the environmental resources and exclude the rest of the community. On the other hand, if the gains from the resources are evenly distributed within the community, participation in the management initiatives may not result in additional benefits to the participating households. Does policy reform contribute to some form of elite capture? Are richer and poorer households equally well off as a result of increased community or private control? A related question is: Are the poorest in communities hurt by some community management? The ability to ascertain differential distributional impacts on the poor versus the extremely poor, or the smallholders versus the landless is important to policy makers. The studies identify subgroups of the vulnerable community with relatively lesser benefits that will allow better targeting to the vulnerable in the community. The Nepal study distinguished between landed-non-poor, land-poor (households with some land but among the poor), and the landless-poor households. It found the land-poor gained more from community forestry relative to the landed-non-poor or landless. The findings suggested that the poor were better off when forests complemented existing private assets. The landless-poor households were at least as well off as the landed-non-poor in terms of welfare gains from community forestry. The study in Nicaragua bore some similarities to that in Nepal. It looked at non-poor, moderately poor, and extremely poor participants to the PES program. The study showed that the moderately poor households, but not the extremely poor, consistently had higher intensity of participation and benefits as compared with the non-poor and the extremely poor. The extremely poor households were at least as well off as the non-poor households in terms of PES participation. Thus, an important issue that needs to be probed is how the institutional changes affect the needs of the landless rural poor in Nepal and extremely poor PES participants in Nicaragua. The study in Argentina found that privatization of water systems did not affect child mortality in municipalities with less than 25 percent poor households. The privatization of water services was associated with a 26.5 percent reduction in child mortality in municipalities with more than 50 percent poor households.
55

All the six studies found that the poor, vulnerable, and other disadvantaged groups (like the less educated or female-headed households) were at least as well off as the rest of the community in terms of benefiting from the devolution of management of natural resources to communities (in the cases of Nepal, Namibia, and the Philippines). Devolution of environmental resource management to private entities in Argentina and Nicaragua also were associated with higher gains for the poor.
Nepal The Government of Nepal, as in many parts of the world, has strengthened the rights of local communities over forests through power-sharing agreements, by legalizing access to forests, and through decentralization of forest oversight agencies (Shyamsundar and others 2005). The new policy required local communities to create “forest user groups” (FUGs) and register them with the district forest officer. The forest user groups then had the responsibility to create a forest operational plan for the community forest of interest. Operational rules to protect, harvest, use, and manage the forest were under the control of the FUG. Local forest officers helped FUGs with technical advice on forest management, provided seedlings for rehabilitation, and helped stem any violation of rules as well as resolve conflicts among users (Tachibana and others 2001). Nepal is a prime example of institutional change in forestry. In 1993, the Nepal government passed a Forest Act that radically changed forest use (Kanel 2004). This act resulted in the transfer of nationalized forests from state control to local communities. FUGs were the institutional tool used to facilitate this transfer. Forest transfer to communities accelerated in the 1990s; currently, some 13,000 FUGs manage 25 percent of Nepal’s forests.
Unlike the restriction of communal resource use in Namibia, in Nepal FUGs can and do allow individual household access and use of the forestry resources for domestic fuelwood consumption. The study assesses whether community forestry and greater household access to common resources translates into household welfare gains. The study hypothesized that greater community property rights over forest assets and increased access to funds for infrastructure development and services results in improvements in two economic indicators—household consumption expenditure and household income.
The study used data from Nepal Living Standard Survey (NLSS II) conducted by the Central Bureau of Statistics between April 2003 and April 2004. It followed the World Bank’s Living Standard Measurement Survey (LSMS) methodology. The study looked at rural households in three regions where forestry user groups are common: (1) rural western mountains and hills, (2) rural eastern mountains and hills, and (3) rural western Terai. In Nepal, the treatment group consisted of households and communities that had formed FUGs. Conversely, the control group in Nepal included households and communities
56
that did not participate in community-based forest management. Impacts of FUGs were estimated at both the community and household level. At the community level, semi-parametric propensity-score-based methods were used to measure the impact of FUGs on fuelwood collection. Parametric methods of maximum likelihood estimation of a two-equation model were used for household estimation of the impact of FUGs on fuelwood collection, income, and expenditure measures of household welfare. Edmonds (2002), using data from three districts in Nepal, robustly shows that community forestry resulted in a 14 percent decline in fuelwood collection. Our study found no measurable difference in fuelwood collection between FUG and non-FUG villages. One possible reason for the differences between our results and that of Edmonds’ may be because the data used by Edmonds were from the early days of FUGs with depleted forests, while our data represent more established FUGs with regenerated forests. The Nepal study examined the nature of the impacts of community forestry. It asked the question whether community forestry, by increasing local control over forest resources, improves household welfare. Over time, community management of forests is expected to increase household income by (a) increasing the biomass available from forests; (b) increasing the stock of agricultural and livestock inputs obtained from forests; (c) reducing labor time used for collection activities; or (d) improving the flow of services provided by forests. The study found that the presence of community forestry and reinvesting in community infrastructure in a village is associated with a 6 percent increase in household welfare.
Strengthening Private Property Rights: China This study examines the impact of an experiment in longer land tenure in China’s Guizhou province and measures its effect on long-term investment in the land by private land users (Deininger, Jin 2003). Jacoby, Li, and Rozelle (2003) suggest insecure land tenure in China prevented much-needed investment in land improvement and may have contributed to environmentally unsustainable methods of cultivation and overexploitation of natural resources. Adoption of household land-use rights under the household responsibility system (HRS) in the late 1970s and early 1980s in rural China contributed to agricultural productivity gains (Lin 1992). However, agricultural growth flattened out in the late 1980s. It is widely believed that more secure individual land use rights could improve agricultural growth (Qi 1999). In 1986, the Chinese government revised the Land Management Law to improve tenure security and extended land tenure to 30 years.
Guizhou province was designated by the State Council in 1987 as one of the experimental areas. Agricultural land use tenure in the province was extended to 50 years as compared with 30-year national tenure in 1994. Guizhou province also stopped the practice of adjusting the size of land holdings based on population changes. These two measures, longer land tenure and prevention of frequent readjustment of land holding size, provided
57
a higher level of security of tenure to farmers in Guizhou province compared with the rest of China.
To explore the impact of longer land tenure, the study used a survey of 1,001 households from 110 villages in Guizhou, western Hunan, and Yunan provinces. Hunan and Yunan provinces were chosen as control areas on the basis of their proximity and climatic and geographical similarity to Guizhou. Investments in long-term sustainable agricultural practices are more profitable when tenure rights are assured. Such investments are also environmentally sustainable and may include positive environmental externalities to the community such as better water-shade management. The study found that longer land tenure in Guizhou province was associated with 2.6 to 2.8 times greater investment as compared with the neighboring provinces with shorter and less secure land tenure. Creating Incentives for Better Management Management of irrigation water resources has traditionally been the responsibility of the state. The earliest transfers of the management of irrigation water services to farmer organizations took place in the United States and France in the mid-20th century. Governments in Asia, Latin America, and Africa have reduced their roles in irrigation management, while irrigation associations and farmers’ groups have taken them over (Vermillion 1992). According to Vermillion (1997), there are three reasons irrigation management transfers (IMTs) were preferred to centrally managed irrigation system: (1) farmers have direct interests in managing irrigation systems, while state bureaucracies may not have the right incentives; (2) an increase in efficiency from IMT may offset any increased cost of irrigation to farmers; and (3) IMT saves government resources in terms of decreased responsibilities for routine operation and maintenance. Along with the irrigation management responsibilities, the farmers’ groups or irrigation associations may also be allowed to collect irrigation fees and retain part of the fees to offset operations and maintenance expenditures. While early IMTs were targeted to large-scale farmers in developed countries, recent IMTs in developing countries have targeted more poor and small-scale farmers. IMTs as donor-funded projects have gained ground in recent years (Shah et al. 2002; Groenfeldt and Svendsen 2000).
58
The Philippines This study (Bandyopadhyay et al. 2006) focuses on power sharing agreements between the state and user groups in the form of IMT contracts in the Philippines. It assesses impacts on maintenance efficiency and farm yield. Fifty percent of the irrigated area in the Philippines is managed publicly under national irrigation systems, 37 percent is managed by communal irrigation systems, and 13 percent by private irrigation systems. The national systems are owned and operated by the National Irrigation Administration (NIA), a semiautonomous government corporation that is responsible for irrigation development (Sabio and Mendoza 2002; Bagadion 2002). In the late 1990s, NIA initiated IMT contracts with selected irrigators’ associations (IAs) that handed over irrigation fee collection and operations and maintenance responsibilities of secondary canals to IAs. The study area included 1,020 farm households in the Magat River Integrated Irrigation System (MRIIS) in Region 2 in Luzon. The irrigation system is located in the basin of the Magat River, which runs into the Cagayan Valley. The study selected a random sample of 43 treatment IAs under IMT contracts and 25 control IAs that were not under IMT. The study examined the IAs with IMT contracts and compared their performance with similar IAs that had yet to sign these contracts. In MRIIS, the focus is on rice production in areas where power sharing agreements in the form of IMTs had occurred between farmer organizations and the national irrigation agency. The study compared very similar areas where farmer organizations do not have such contracts with the national irrigation agency. IMT resulted in IAs having greater access to resources through member fees, allowed them to more directly respond to maintenance requirements, and to control the release of water. The study showed that this increased community control over resources had an impact on rice yields in the area. Rice yields were 2 to 6 percent higher in IMT areas where farmers effectively managed resources, even after the authors controlled for various other differences among rice farmers in areas with and without IMT. Participation in Novel Markets Payments for environmental services (PES) have emerged as a novel market mechanism to finance conservation in developing countries (Landell-Mills and Porras 2002; Pagiola and others 2002; Wunder 2005). PES is based on two principles: (1) those who benefit from environmental services should pay for them; and (2) those who contribute to generating these services should be paid. The PES approach has three potential positive aspects: (1) PES accesses new financing sources that may not otherwise be available for environmental management; (2) PES may be sustainable if its incentives are compatible for both service users and providers; and (3) PES may be efficient in the sense that it would only work for the environmental services whose benefits exceed the costs to the service providers. However, for global environmental services, such as conserving biodiversity and sequestering carbon dioxide, PES may depend on donor funding and may compete with other donor-funded activities.
Pagiola and others (2005) have asked three key questions regarding potential linkages between PES and poverty:
• Who participates in PES and how many of them are poor? • Are poor households able to participate in PES programs? • Are poor households affected indirectly by PES programs?
Nicaragua The Nicaragua study (Pagiola et al. 2007) differed from the rest since it only focused on participation in the PES program. In this case, the benefits to households in the form of PES were well-defined and non-random. The study used a variety of measures of participation based on the area under silvopastoral land management and the chosen complexity and intensity of the program by the households. These factors—the area and chosen intensity of the program—determined the amount of benefit payments to the households. Thus the observed level of participation had a direct and proportional effect on the received benefits to the households. On the other hand, households that did not or could not participate in the PES program did not enjoy any benefits. The study considered participation of poor households in the creation of economic value to households through payments for environmental services toward silvopastoral land use in Nicaragua. It focused on the Regional Integrated Silvopastoral Ecosystem Management Project implemented in Nicaragua and other countries as a pilot PES program financed by the Global Environment Facility (GEF). The silvopastoral practice includes three components: (1) planting high densities of trees and shrubs in pastures to provide shade and diet supplements and prevent soil erosion; (2) creating fodder banks in areas used for other agricultural practices; and (3) using fast-growing trees and shrubs for fencing and wind screens. The study focused on the participation of poorer households in the PES program. The program promoted silvopastoral land use at various levels of technical complexity to livestock farmers. Compared to traditional pastoral land use, silvopastoral land use had several public externalities, such as better water-shade management, increased biodiversity, and higher carbon sequestration. The PES program internalized some of these benefits and offered monetary incentives to private landholders for observable changes in land use to silvopastoral practices. The study used before and after data from 2002 and 2004 for 103 households in the Matiguas-Rio Blanco area located in the department of Matagalpa, about 140 km from Managua. The analysis was conducted for three groups, the non-poor, moderately poor, and extremely poor. The study found that moderately poor households participated in the program to a greater extent as compared with the non-poor households and thus benefited more from the PES program. The extent of participation by poor households was not limited to simpler and less expensive options. Poor households tended to implement more substantial changes
60
in land use. By undertaking complex land use changes, the poor households in Nicaragua provided greater environmental benefits and in return received higher payments. The study also found that the intensity of participation for the extremely poor households was not significantly higher than for the non-poor households. See Box 4.3 above for similarities between welfare benefits to the moderately poor and extremely poor in Nicaragua and the land-poor and landless-poor in Nepal.
Increasing Access to Services One of the eight Millennium Development Goals (MDGs) agreed upon by the United Nations (UN) member countries in 2000 was to reduce the number of households with no access to safe water by half by 2015. There is little consensus on how to provide increased access to safe water to a large part of the population. Privatization of water services is one of the controversial methods of increasing access to safe water. This section is not about privatization and its potential ill-effects. It looks at privatization as one of the means of delivering improved access to environmental services such as safe water. Argentina This study (Galiani et al. 2005) focuses on increased access to safe water through privatization of water services in Argentina and measures its impact on child mortality in the areas where water services were privatized. Water services were managed by the federal water and sanitation authorities from the late nineteenth century until 1980. By 1990, local public companies provided water services to two-thirds of the municipalities, and non-profit cooperatives provided services to the remaining one-third. Privatization of public water services started in Argentina in 1991. By 1999, about 50 percent of the local public water companies were turned over to private enterprises.
The study looked at annual municipality-level child mortality and other data between 1990 and 1999. The availability of annual time-series data allowed the analysis of before and after data for the treatment as well as control groups of municipalities. The study used difference-in-difference estimations of the impact of privatization on child mortality. (See Box 4.1 for a brief explanation of the difference-in-difference method.) The study compared changes in child mortality in the treatment group before and after privatization to changes in child mortality in the control group for the corresponding periods. In Argentina, the study measured the welfare benefits of privatized water supply with changes in child mortality in the municipalities with and without private water services. The local governments in Argentina privatizing water services were motivated by potential efficiency gains and savings in public expenditure. It was not clear that the increased efficiency gains from privatization would result in improved health outcomes. The study found that privatization of water services was associated with a 5 percent reduction in the mortality rate from the baseline.
61
The Argentina study is one of the few studies that measure significant health benefits from privatized water supply. In a meta study of water privatization and public health in Latin America, Mulreany and others (2006) found no compelling case for privatizing existing public water utilities based on public health grounds.
The Right Data Household-level data is necessary to establish the linkages between various environmental and natural resource management activities and household welfare. Collection of large-scale household data is expensive and time consuming. The six case studies in this chapter used household survey data from a variety of sources, with advantages and disadvantages associated with each type of survey. This section examines some of the challenges and limitations of different types of data used in the studies to analyze environmental pathways out of poverty.14
The Nepal study of FUGs and measurement of household welfare attributable to the community management of forestry resources used data from the second Nepal Living Standards Survey conducted in 2003–04. The case study was based on data from 1,708 households in 158 villages spread through most of the country. There are some advantages to using nationally representative large sample surveys such as this. The main advantage is the ability to draw broad conclusions that are nationally significant. The general applicability of conclusions from such analysis provides policy makers with general guidance regarding the direction of national policy. For example, the measurably higher household welfare attributable to FUGs in Nepal may justify continued policy support of community-based forestry management. The broadly applicable conclusions about the whole country available from a national sample survey come with some costs. In particular, in the case of Nepal, the Living Standards Survey did not include sufficiently detailed information about household participation in FUGs and was deficient in its measurement of natural resource stocks, such as the quantity and quality of forest resources available to the households. One solution to this problem may be to include an environment module to the living standards surveys. Unfortunately, this solution may not be always practicable. For example, the size of the survey instrument may prevent addition of an extra module. Household and community questionnaires may not be the best instruments to collect natural resource stock data. The second solution is to augment the national standard of living survey data with environmental data from other sources. The chief obstacle to this method is the absence of sufficient means of combining the two datasets at the appropriate level of aggregation. For example, the biomass stock at the community level may be one of the main determinants of participation in FUGs in Nepal. However, the information on area under different types of forests was available only at the district level. Such mismatches between two datasets hinder analysis. In another case study in Malawi, remote sensing
62
data on biomass stock matched with living standard data at the community level. This was possible in Malawi because Geographic Information System (GIS) coordinate information was available with the survey data (Bandyopadhyay et al. 2006). A third approach is design and execution of a specialized household survey to measure the welfare impact of a specific environmental policy change. This approach was undertaken in the case studies of communal conservancies in Namibia, IMTs in the Philippines, and land tenure in China. Budgetary considerations may restrict the scope and scale of such surveys, as were the cases in Namibia, the Philippines, and China. In Namibia, the survey was restricted to two regions and seven communal conservancies. In the Philippines, the study only looked at a single irrigation system, the Magat River Integrated Irrigation System. In China, the study was restricted to three provinces, Guizhou, Hunan, and Yunnan. The smaller scale and the narrower scope of specialized surveys allow for much more detailed investigation of specific environmental and natural resource management issues and associated policy measures that may affect household welfare. A fourth source of environment-poverty linkage data may come from pilot projects, as was the case in Nicaragua. Monitoring and evaluation is an integral part of pilot projects. Such projects not only allow for tailored survey design and other methods of data collection, but they may also allow for embedding tools for impact evaluation at the project design stage. For example, elements of randomized experiments may be included in the design of pilot projects to allow for better use of impact evaluation analysis methods. The Nicaragua case study was deficient in its selection of randomized control and treatment groups. The control group selected during the data collection stage was later determined to be dissimilar to the group of treatment households who received payments for environmental services. Randomized experiments are more common in the area of environmental health pilots, as discussed in the previous chapter. The availability of time-series data from Argentina allowed this study to use the difference-in-difference method of impact analysis. This estimate of health welfare impact does not suffer from two types of selection biases from observed and unobservable factors. This study is an example of one of the most reliable methods of parametric impact estimation. Randomized experiments, before and after data, and appropriate treatment and control groups are three requirements to assign causality between changes in environmental resource management and household economic and health-based welfare measures. When a randomized experiment is not practical, attention to survey design to cover appropriate control groups, and collection of data on relevant indicators of changes, observable selection factors, and outcomes are keys to successful impact analysis.
Conclusion The pathways between environmental policy reform and household welfare are varied and complex. One group of such environmental reform is devolution of environmental
63
and natural resource management to communities and private entities. Recent policy changes in many governments have allowed devolution of control and management of environmental resources to communities and private entities. Payments for environmental services programs in many countries provide direct economic incentives to households that engage in better environmental management of private natural resources. The case studies illustrate how impact evaluation methods can be used on household survey data to estimate quantitative associations between community-based environmental resource management and household welfare. The five key messages of this chapter are:
• Household participation in community-based management of environmental resources has mixed results. Some studies show participants derive larger welfare benefits. Other studies indicate participating and nonparticipating households share benefits more equally.
• In these studies, community-based environmental resource management has a positive and measurable impact on household welfare. Higher welfare stems from (a) increased economic activities, (b) reinvesting in community infrastructure, and (c) effective management of resources.
• The poor benefit more from most of the reform programs examined in this chapter. However, in two cases, the landless and the extremely poor do not benefit any more than their richer counterparts. Measuring the distribution of benefits from policy reforms can confirm whether or not vulnerable groups received the benefits, and can therefore pave the way for better targeting in the future.
• Measurement of the welfare impact of environmental reforms using data from randomized social experiments or data from before and after the reform are most desirable. However, such estimations are not always practical. Future analysis may benefit from more attention to control and treatment groups, before and after data collection, and randomized experiments where feasible.
• Cross-sectional household data have limitations regarding establishing causality between environmental reforms and poverty alleviation. It is possible to draw policy-relevant conclusions from the cross-sectional household data with appropriate treatment and control groups and selection of the right analytical tools.
64
5. Poverty and Environment—Directions for Change
Poor households have limited assets that they can use to make investments; they confront fewer income-earning opportunities, are exposed to higher health risks, and are less able to cope with adverse economic and health shocks. In this context, it is appropriate to worry about the environmental problems the poor face and ask whether there is a way to reduce poverty through environmental management. Our review of the analytical work in this area, while it lays some doubt on certain linkages between poverty and the environment, also provides evidence of mechanisms that can lead to poverty reduction. Use of Local Natural Resources Resources serve as a significant source of income to many rural households. The case study information suggests that resource use may increase with income, while dependence decreases with income. There is also some evidence from which an even more nuanced picture emerges. Households who are neither the poorest nor the richest may be the main beneficiaries of nature’s bounty. This is possible because resources found in the commons often complement private assets such as land and livestock. For example, the poorest, who do not have these private resources, may be dependent on forests for energy and housing needs, but less so for other purposes. Access to resources can also serve as a buffer or insurance during times of need. In poor countries with limited financial and credit markets, it is easy to appreciate that the poor may depend on friends and family as well as commonly available resources during times of stress. However, our current empirical understanding of household responses to unexpected shocks and the insurance role of natural resources is limited. To reduce vulnerability, we need to better understand this role through careful empirical studies. Is local degradation likely to decrease in the near future, particularly if there is growth in household wealth and income? This is an often-made assumption. However, empirical evidence does not point to this possibility. Our own assessment is that local resource use is unlikely to dramatically decline in rural areas. One of the reasons households continue to degrade natural resources is because the impact of slow and small changes in resource availability on welfare is small. Households adapt to changes in resource availability by, for example, using alternate resources or obtaining their resources from alternate areas. Further, as long as the opportunity cost of time is low, the welfare impact of degradation is likely to be small. Thus, better environmental management, increases in non-farm and non-resource-based economic opportunities, and changes in regulatory policies are likely to be important in stemming degradation. The poor and rich contribute to environmental loss. The lack of markets in some cases and growth in markets in others, poor governance institutions, high discount rates, and

population growth all play a role in this. Many of these forces that contribute to significant changes in ecosystems originate from macroeconomic and policy changes that may have little to do with natural resource sectors. Reducing poverty among resource-dependent households may thus not directly or immediately contribute to improvements in local natural resources. There is no substitute for environmental management as a component of a practical and strong regulatory framework to ensure sustainability. Fisheries, lakes, animal populations, and various natural processes are able to withstand changes to a certain extent, but may collapse if perturbed beyond natural thresholds with significant negative impacts on the resource-dependent poor. Further, the more the poor consume natural resources, the less is available for the future, which may impoverish them further. Is there evidence of such poverty traps, where there is a downward spiral of natural resource loss and increased poverty? While work within and outside the Bank suggests that that this type of negative dynamic relationship may be present in some areas, this is an issue that really needs a great deal more examination. We need more research to understand the complex dynamics of natural systems and the inter-linkages to poor resource-dependent households. Another area where more work is needed has to do with environmental services. Our empirical investigations do not do justice to the role of environmental services such as flood control services, hydrological functions of forests, and so on in aiding the poor. Design Principles for Improving Environmental Health Good environmental quality—particularly of air, water, and sanitation—is a necessary condition for improving the welfare of the poor. The empirical studies in this area reinforce the message that health-focused policies and public investments should be based on much broader considerations such as environment, education, nutrition, and public health information. However, how to design and implement such multidimensional programs remains a challenge. The next step is to identify design principles that will allow for successful implementation of these more complex projects. One component of the design of health-focused projects is an increased emphasis on environmental infrastructure. Investments in clean water and sanitation infrastructure have an externality effect on household health. Publicly funded programs need to recognize and capture this externality. Targeting significant coverage of water and sanitation needs to be a key component of any “total sanitation” program. Another aspect of designing more holistic projects is greater emphasis on public health information. Lack of information about the health impact of poor air and water can affect demand for environmental quality and household mitigating behavior. There is some good evidence that suggests that health information can lead to behavioral responses that mitigate the adverse health effects of poor environmental conditions more than would increases in wealth or improvements in education. Households do respond to information, particularly with regard to health issues, and projects need to take this into account.
66
While some aspects of designing water and sanitation projects are fairly well-known, there is a huge gap in our understanding about indoor air pollution and mechanisms to reduce its impacts. It is estimated that about 20 percent of the estimated 12 million annual deaths of children under five, and about 10 percent of perinatal deaths are directly related to acute lower respiratory infection (ALRI) as a result of exposure to indoor air pollution every year. As these numbers show, this is not a trivial problem. The question is what do we do about this? Our understanding of key factors that contribute to and reduce the impacts of indoor air pollution is limited. We recognize that many variables matter: energy technology, housing characteristics, and behavioral responses can all play a role. But should we focus on promoting efficient wood stoves or transition fuel use from biomass to charcoal or kerosene? Or, is there a role for increased household information on housing structure and ventilation? Here the need is for careful studies that can identify the relative importance of different factors that affect pollution and responses to pollution. Better Data for Monitoring Change How important is data collection and analysis in this area? We continuously make large investments in health and natural resource management projects. While there are many tools available for assessing the success of these projects, it is hard to evaluate their poverty outcomes without quantitative data. Every policy change or investment need not be subject to a careful quantitative evaluation. However, a small but systematic effort to collect data and analyze outcomes would be very useful for making progress in this complex field. The cross-sectional household data that is generally available for poverty-environment analyses are limited in their ability to establish causality. It is possible, however, to draw policy-relevant conclusions from these data by carefully selecting a set of appropriate analytical tools. Many of these conclusions will need to be qualified, and policy recommendations will need to build on the uncertainties involved. One way forward is to consider “add-ons” to the Living Standards Measurement Surveys that are undertaken in many countries. Specific modules could be created to collect a subset of environmental health and natural resources management information. These modules would only be used in specific surveys and specific countries, but would ensure the collection of longitudinal data that is vital to evaluate changes. Future analysis would benefit tremendously from more attention to data collection in four areas: longitudinal studies, control and treatment comparisons, before and after intervention studies, and randomized experiments. In the areas of environmental health studies, further information is needed in specific areas such as cause-of-death information and other retrospective information on social, environmental, and health conditions at the household level. Further, quantitative studies need to be complemented with in-depth and more contextual qualitative methods of analyses. Future policy analysis should aim to combine quantitative with qualitative approaches in order to provide more credible evidence for guiding the design and implementation of programs.
67
Policy Reforms for Managing the Environment and Reducing Poverty The last two decades have seen new reforms in environmental management that have community participation and even economic development as core goals. Our review focused on reforms that strengthened community rights, created stronger incentives for resource management, and developed new markets that facilitate payments for environmental services. We also examined reforms outside the environment sector that strengthened private property rights and increased access to services. A key conclusion from our analyses is that decentralization of natural resource management is beginning to work for some communities. Even though it does not work as well as it should and there are many layers of challenges, community-based resource management can have a positive and measurable impact on household welfare. This result will not, of course, hold true for all examples of decentralized resource management. The improved benefits from community management of local resources appear to come from three sources: (1) investments in community infrastructure; (2) increased economic activities; and (3) effective management of resources. All these aspects of community projects need additional support and additional monitoring.
An important query raised with community-oriented resource management programs is whether participation is equitable or captured by the elite. We find that participation is not always limited to community elites. Also, participation does not always imply larger welfare benefits as compared with nonparticipating households. There are diverse distributional impacts of community-based natural resource management programs. In two cases of community management, we find that the landless and the extremely poor do not benefit any more than their richer counterparts. There is scope for investigating how local political and power positions determine who participates and how economic profits are allocated among households. However, we need to expect to be surprised; some standard hypotheses may not hold. The poor are willing to participate in fairly complex environmental management programs if they have the right incentives. Emerging evidence suggests that the poor are willing to contribute to the provision of environmental services. In Nicaragua, for example, poor households were willing to implement changes that brought about public benefits such as increased biodiversity and higher carbon sequestration in return for payments for these services. Two other case studies focused on strengthening incentives through irrigation management and land reform. Both studies suggest that there are positive productivity benefits from such reforms. Do these reforms, which often stem from nonenvironmental considerations, strengthen sustainable resource use? Further examination of the physical changes brought about would help identify long-term impacts on sustainability.
68
Increasing access to environmental infrastructure for safe water and sanitation can decrease child mortality. The evidence for this from Argentina is particularly strong because the analytical methods employed eliminated selection bias and reduced the potential impact of unobserved variables. Moving Forward Poverty reduction and sustainable resource use go hand-in-hand under certain circumstances and not in others. Going forward, we make the following recommendations:
• The poor are dependent on local resources for income and consumption. We know less about the role of the commons in providing a buffer or insurance, the dynamics of ecosystem changes and their impacts on the poor, and the value of various natural services, particularly related to mitigating natural disasters. We need careful analyses in this area.
• Mechanisms to reduce indoor air pollution are not very well understood.
Improving indoor air will impact health and may also affect forest use, with potential implications for carbon sequestration. It would be particularly useful to design joint “intervention and analyses” projects on this issue.
• Health programs need to pay greater attention to both the coverage of
interventions (to capture positive externalities) and the role of health information in prompting behavioral change. We recommend a broad-based approach toward health that embraces environmental as well as more traditional health-sector interventions.
• The poor are willing to participate in a variety of resource management programs,
some of which lead to significant welfare improvements. We need to continue to make prudent investments in projects that create new incentives and strengthen property rights.
• Ensuring that the poor are helped by environmental management projects will be
an important and continuous challenge. Equally important is the complementary task of ensuring that poverty reduction programs contribute to sustainable development. We will need to increase our efforts to collect good quantitative and qualitative data to help us monitor and evaluate these programs.
69
References Adhikari, B. 2003. “Property Rights and Natural Resources: Socioeconomic heterogeneity and distributional implications of community forest management.” SANDEE Working Paper No. 1-03, Katmandu, Nepal. Adhikari, Bhim. 2005. Poverty, property rights and collective action: understanding the distributive aspects of common property resource management. Environment and Development Economics 10: 7–31. Agarwal, B. 2001. “Participatory Exclusions, Community Forestry, and Gender: An Analysis for South Asia and a Conceptual Framework.” World Development 29 (10): 1623–1648. Ahmed, Kulsum, Yewande Awe, Maureen Cropper, Douglas Barnes, and Masami Kojima. 2005. Environmental Health and Traditional Fuel Use in Guatemala. Washington, DC: World Bank. Alderman H and Garcia M, 1994, “Food security and health security: Explaining the levels of nutritional status in Pakistan.” Economic development and Cultural change 42(3): 485–508. Alderman, H., J. Hentschel, and R. Sabates. 2003. “With the health of ones’ neighbors: externalities in the production of nutrition in Peru.” Social Science and Medicine 56: 2019–2031. Angelsen, A., and D. Kaimowitz. 2001. “Agricultural technology and forests: a recapitulation.” In A. Angelsen and D. Kaimowitz (eds.). Agricultural technologies and tropical deforestation. Wallingford, Oxon, UK: CABI Publishing. Bagadion, B. 2002. “Role of Water Users Associations for Sustainable Irrigation Management.” In Organizational Change for Participatory Irrigation Management. Report of the APO Seminar on Organizational Change for Participatory Irrigation Management, Philippines, 23–27 October 2000. Tokyo: Asian Productivity Organization. Baland, Jean-Marie and Patrick Francois. 2005. “Commons as insurance and the welfare impact of privatization.” Journal of Public Economics 80: 211–231. Baland, Jean-Marie, Pranab Bardhan, Sanghamitra Das, Dilip Mookherjee, and Rinki Sarkar. 2006. “Managing the environmental consequences of growth. Forest degradation in the Indian mid-Himalayas.” Manuscript.
Bandyopadhyay, Sushenjit and Priya Shyamsundar. 2004. Fuelwood Consumption and Participation in Community Forestry in India. Policy Research Working Paper 3331. Washington, DC: The World Bank. Bandyopadhyay, Sushenjit, Michael Humavindu, Priya Shyamsundar, and Limin Wang. 2004. Do Households Gain from Community-based Natural Resource Management? An evaluation of Community Conservancy in Namibia. Policy Research Working Paper 3337. Washington, DC: The World Bank. Bandyopadhyay, Sushenjit, Priya Shyamsundar, and Alessandro Baccini. 2006. Forests, Biomass Use, and Poverty in Malawi. Policy Research Working Paper 4068. Washington, DC: World Bank. Bandyopadhyay, Sushenjit, Priya Shyamsundar, and Keshav Raj Kanel. 2006. “Forestry User Groups in Nepal—Can Institutional Change Lead to Economic Development?” Mimeo. Washington, DC: World Bank. Bandyopadhyay, Sushenjit, Priya Shyamsundar, and Mei Xie. 2006. “Yield Impact of Irrigation Management Transfer: A Success Story from the Philippines.” Background paper for the Nepal Poverty Assessment. Washington, DC: World Bank. Barrett, Christopher. 2004. “Rural poverty dynamics: development policy implications.” Agricultural Economics 32(1): 43–58. Barrett, Christopher, and Peter Arcese. 1998. “Wildlife Harvest in Integrated Conservation and Development Projects: Linking harvest to household demand, agricultural production and environmental shocks in Serengeti.” Land Economics 74(4):449–65. Bhargrava A. 2003, “Family planning, gender differences and infant mortality: Evidence from Uttar Pradesh, India.” Journal of Econometrics 112: 225–240. Bluffstone, R. 1995. “The effects of labor markets on deforestation in developing countries under open access: an example from rural Nepal.” Journal of Environmental Economics and Management 29(10): 42–63. Brasselle, A.S., F. Gaspart, and J.P. Platteau. 2002. “Land tenure and investment incentives: puzzling evidence form Burkina Faso.” Journal of Development Economics 67: 373–418. Brown, Kenneth H. 2003. “Diarrhea and Malnutrition.” Journal of Nutrition 133(1):328S–332S. Cairncross, Sandy, and Vivian Valdemanis. 2006. “Water Supply, Sanitation and Hygiene Promotion.” In Dean T. Jamison et al. (eds.). Disease Control Priorities in
71

Developing Countries. Second Edition. Oxford, UK, and Washington, DC: Oxford University Press and The World Bank. Cavendish,W. 2000. Empirical regularities in poverty-environment relationship of rural households: evidence from Zimbabwe. World Development 28(11), 1979–2003. Chapman, Robert S., Xingzhou He, Aaron E. Blair, and Qing Lan. 2005. “Improvement in Household Stoves and Risk of Chronic Obstructive Pulmonary Disease in Xuanwei, China: Retrospective Cohort Study.” BMJ 331 (7524, November 5): 1050, doi: 10.1136/bmj.38628.676088.55. Chettri-Khattri, Arun. 2007. “Who pays for conservation: Evidence from Forestry in Nepal.” In R. Ghate, N.C. Jodha, and P. Mukhopadhyay (eds). Promise, Trust and Evolution: Managing the Commons of South Asia. Oxford, UK: Oxford University Press (forthcoming). Cole, T. J., and J. M. Parkin. 1977. “Infection and its effects on growth of young children: A comparison of the Gambia and Uganda.” Transaction of the Royal Society of Tropical Medicine and Hygiene 71:196–198. Dasgupta, Partha. 2003. “Population, poverty and the natural environment.” In K-G Maler and J. Vincent (eds.). Handbook of Environmental Economics. Vol. 1. Amsterdam: Elsevier Press. Dasgupta, Partha. 2004. “World poverty: causes and pathways.” In B. Pleskovic and N. H. Stern (eds). World Bank Conference on Development Economics. Washington, DC: World Bank. Dasgupta, S., M. Huq, M. Khaliquzzaman, K. Pandey, and D.Wheeler. 2006a. “Who suffers from indoor air pollution: Evidence from Bangladesh.” Health Policy and Planning 21(6): 444–458. Dasgupta, S., M. Huq, M. Khaliquzzaman, K. Pandey. and D. Wheeler. 2006b. “Indoor air quality for poor families: New evidence from Bangladesh.” Indoor Air 16(6): 426–444. Deininger, Klaus, and Songqing Jin. 2003. “The Impact of Property Rights on Households’ Investment, Risk Coping, and Policy Preferences: Evidence from China.” Economic Development and Cultural Change 51 (4): 851–82. Duraiappah, Anantha, K. 1998. “Poverty environment degradation: A review and analyses of the nexus.” World Development 26(12): 2169–2179. Dzinggirai, V. 2003. “The New Scramble for African Countryside.” Development and Change 34: 243–263.
72
Esrey, Steve. 1996. “Water, Waste and Well-Being: A Multi-Country Study.” American Journal of Epidemiology 143(6):608–623. Ezzati, M., B.N. Mbinda, and D. M. Kammen. 2000. “Comparison of emission and residential exposure from traditional and improved biofuel stoves in rural Kenya.” Environmental science technology 34:578–83. Ezzati, M., and D. M. Kammen. 2001. “Indoor air pollution from biomass combustion and acute respiratory infections in Kenya: an exposure-response study.” The Lancet 358: 619–624. Ezzati, M. and D. M. Kammen. 2002. “The heath impacts of exposure to indoor air pollution from solid fuels in developing countries: Knowledge, gaps and data needs.” Environmental Health Perspectives 110:1057–1068. Fewtrell, Lorna and John M. Colford. 2004. “Water, Sanitation and Hygiene: Interventions and Diarrhoea – A Systematic Review and Meta-analysis.” HNP Discussion Paper, Water Supply & Sanitation Sector Board. Washington, DC: World Bank. Fisher, M., G. Shively, and S. Buccola. 2005. “Activity choice, labor allocation and forest use in Malawi.” Land Economics 81(4): 503–517. Galiani, S., P. Gertler, and E. Schargrodsky. 2005. “Water for life: the impact of the privatization of water services on Child mortality.” Journal of Political Economy 113: 83–120. Glewwe, P. 1999. “Why does mothers’ schooling raise child health in developing countries: evidence from Morocco.” The Journal of Human Resources 34(1): 124–136. Godoy, R., D. Wilke, H. Overman, A. Cubas, G. Cubas, J. Demmer, K. McSweeney, and N. Brokaw. 2000. “Valuation of consumption and sale of forest goods from a central American rain forest.” Nature 406 (6): 62–63. Groenfeldt, D. and M. Svendsen (eds.) 2000. Case Studies in Participatory Irrigation Management. Washington, DC: World Bank Institute. Hughes, G., K. Lvovsky, and M. Dunleavy. 2001. “Environmental Health in India: Evidence from Andhra Pradesh.” Environment and Social Development Division, South Asia Region. Washington, DC: World Bank. (processed) Imbens, Guido. 2004. “Nonparametric Estimation of Average Treatment Effects under Exogeneity: A Review.” Review of Economics and Statistics 86(1): 4–29. Jacoby, H.G., Guo Li, and Scott Rozelle. 2003. “Hazards of Expropriation: Tenure Insecurity and Investments in Rural China.” American Economic Review 92(5): 1420–47.
73
Jacoby, H., and L. Wang. 2004. “Environmental determinants of child mortality in rural China: A competing risks approach.” World Bank Research Working Paper 3241. Washington, DC: World Bank. Jalan, J., and M. Ravallion. 2003. “Does piped water reduce diarrhea for children in rural India?” Journal of Econometrics 112:153–173. Jalan, J., and E. Somanathan. 2004. “The importance of being informed: Experimental evidence on the demand for environmental quality.” SANDEE working paper No 8-04, Kathmandu, Nepal. Jodha, N. S. 1986. “Common property resources and the rural poor in dry regions of India.” Economic and Political Weekly 21(27):1169–1181. Jones, B.1999a. “Policy Lessons from the Evolution of a Community-Based Approach to Wildlife Management, Kunene Region, Namibia.” Journal of International Development 11:295–304. Jones, B. 1999b. “Rights Revenues and Resources: The problems and potentials of conservancies as community wildlife management institutions in Namibia.” Evaluating Eden Series Discussion Paper No. 2. London: IIED. Jones, B., and M. Murphree. 2001. “The Evolution of Policy and Community Conservation in Namibia and Zimbabwe.” In D. Hulme and M. Murphree (eds.). African Wldlife and Livelihoods: The Promise and Performance of Community Conservation. Oxford: James Currey Ltd. Kanel, K. R. 2004. “Twenty-five years of community forestry. Contribution to millennium development goals.” In Proceedings of the Fourth National Workshop on Community Forestry. Kathmandu, Nepal: Community Forestry Division, Department of Forests. Kaimowitz, D., Erwidodo, O. Ndoye, P. Pacheco, P.P. Balanza, and W.D. Sunderlin. 1998. “Considering the impact of structural adjustment policies on forests in Bolivia, Cameroon and Indonesia.” Unasylva 49(194): 57–64. Keane, Michael. 2006. “Structural vs. Atheoretical Approaches to Econometrics.” Mimeo. New Haven, Connecticut: Yale University. Landell-Mills, N., and I. Porras. 2002. Silver Bullet or Fools’ Gold? A Global Review of Markets for Forest Environmental Services and Their Impact on the Poor. London: IIED. Lavy, V., J. Strauss, D. Thomas, and P. De Vreyer. 1996. “Quality of health care, survival and health outcomes in Ghana.” Journal of Health Economics 15:333–57.
74
Lee, L. F., M. R. Rosenzweig, and M. M. Pitt. 1992. “The effects of nutrition, sanitation, and water purity on child health in high mortality populations.” Journal of econometrics 77:209–235. Lin, J.Y. 1992. “Rural Reforms and Agricultural Growth in China.” American Economic Review 82:34–51. Luby, Stephen, Mubina Agboatwalla, Daniel Feikin, John Painter, Ward Billhimer, and Robert Hoekstra. 2005. “Effect of hand washing on child health: a randomized controlled trial.” Lancet 366:225–233. Lybbert, Travis, J., Christopher B. Barrett, Solomon Desta, and D. Layne Coppock. 2004. “Stochastic wealth dynamics and risk management among a poor population.” The Economic Journal 114:750–777. Lybbert, Travis J., Christopher B. Barret, and Hamid Narjisse. 2002. “Market-based conservation and local benefits: the case of argan oil in Morocco.” Ecological Economics 41:125–144. Mata, L. 1978. The children of Santa Maria Cauque: A prospective field study of health and growth. Cambridge, Mass.: MIT Press McSweeney, K. 2005. “Natural insurance, forest access and compounded misfortune: forest resources in small holder coping strategies before and after Hurricane Mitch, north eastern Honduras.” World Development 33(9): 1453–1471. Merrick, T. 1985. “The effect of piped water on early childhood mortality in urban Brazil, 1970 to 1976.” Demography 22:1–24. Moffitt, Robert. 2003. “The Role of Randomized Field Trials in Social Science Research: A Perspective from Evaluations of Reforms of Social Welfare Programs.” Cemmap Working Paper CWP23/02. London: Department of Economics, University College. Mosley, W., and L. C. Chen. 1984. “An analytical framework for the study of child survival in developing countries.” Population and Development Review 10: 25–45. Mulreany, J.P., S. Calikoglu, S. Ruiz, and J.W. Sapsin. 2006. “Water privatization and public health in Latin America.” Rev Panam Salud Publica. 19(1):23–32. Munyao, K., and C. Barrett. 2006. “Decentralization of pastoral resources management and its effect on environmental degradation and poverty: Experience from northern Kenya.” Mimeo. Ithaca, New York: Cornell University. Narain, Urvashi, Klaas van’t Veld, and Shreekant Gupta. 2005. “Poverty and the Environment: Exploring the Relationship Between Household Incomes, Private Assets,
75
and Natural Assets.: Resources for the Future Discussion Paper 05-18. Washington, DC: RFF. Pagiola, Stefano, Ana R. Rios, and Agustin Arcenas. 2007. “Can the Poor Participate in Payments for Environmental Services? Lessions from Silvopastoral Project in Nicaragua.” Environment and Development Economics (forthcoming). Pagiola, S., A. Arcenas, and G. Platais. 2005. “Can payments for environmental services help reduce poverty? An exploration of the issues and the evidence to date from Latin America.” World Development 33:237–253. Pagiola, S., N. Landell-Mills, and J. Bishop. 2002. “Making market-based mechanisms work for forests and people.” In S. Pagiola, J. Bishop, and N. Landell-Mills (eds.). Selling Forest Environmental Services: Market-based Mechanisms for Conservation and Development. London: Earthscan. Pattanayak, Subhrendu, and Erin O. Sills. 2001. “Do tropical forests provide natural insurance? The microeconomics of non-timber forest product collection in the Brazilian Amazon.” Land Economics 77(4): 595–612. Pitt, M., M. Rosenzweig, and M. N. Hassan. 2006. “Sharing the burden of disease: gender, the household division of labor and the health effects of indoor air pollution.” CID Working Paper No. 119. Cambridge, Mass: Harvard University. Pinstrup-Andersen, P., D. Pelletier, and H. Alderman (eds.). 1995. Child growth and nutrition in developing countries: priorities for action. Ithaca, New York: Cornell University Press. Pruss-Ustun, Annette, David Kay, Lorna Fewtrell, and Jamie Bartram. 2004. “Unsafe Water, Sanitation and Hygiene.” In M. Ezzati, A. Lopez, A. Rodgers, and C. Murray (eds.). Comparative Quantification of Health Risks: Global and Regional Burden of Disease due to Selected Major Risk Factors. Geneva: World Health Organization. Available at: http://www.who.int/publications/cra/chapters/volume2/1321-1352.pdf Qi, J.C. 1999. “Two Decades of Rural Reform in China: An Overview and Assessment.” China Quarterly 159: 616–28. Quick, R.E., L.V. Venczel, E.D.Mintz et al. 1999. “Diarrhea Prevention in Bolivia through Point-of-Use Water Treatment and Safe Storage: A Promising New Strategy.” Epidmiology and Infection 122:83–90. Quick, R.E., A. Kimura, A. Thevos, M. Tmbo, I. Shamputa, L. Hutwagner, and E. Mintz. 2002. “Diarrhea Prevention through household-level water disinfection and safe storage in Zambia.” American Journal of Tropical Medicine and Hygiene 66(5):584–589.
76
Ravallion, M. 2007. “Evaluating Anti-Poverty Programs.” In T.P. Schultz and J. Strauss (eds). Handbook of Development Economics. Vol. 4. Amsterdam: North-Holland. Reardon, T. and S.A.Vosti. 1995. “Links between rural poverty and the environment in developing countries: Asset categories and investment poverty.” World Development 23 (9): 1495–1506. Ridder, G., and I. Tunali. 1999. “Stratified partial likelihood estimation.” Journal of econometrics 92: 193–232. Sabio, E.A., and A.D. Mendoza. 2002. “Philippines.” In Organizational Change for Participatory Irrigation Management, Report of the APO Seminar on Organizational Change for Participatory Irrigation Management, Philippines, 23–27 October 2000. Tokyo: Asian Productivity Organization. Sarin, M., with L. Ray, M.S. Raju, M. Chatterjee, N. Banerjee, and S. Hiremath. 1988. Who Gains? Who Loses? Gender and Equity Concerns in Joint Forest Management. New Delhi: SPWD. Semenza, J.C., L. Roberts, A . Henderson, J. Bogen, and C.H. Rubin. 1998. “Water Distribution System and Diarrheal Disease Transmission: A case study in Uzbekistan.” The American Journal of Tropical Medicine and Hygiene 59(6):941–946. Shah, T., B. Koppen, D. Merrey, M. Lange, and M. Samad. 2002. “Institutional Alternatives in African Small Holder Irrigation: Lessons from International Experience with IMT.” Research Report 60. Colombo, Sri Lanka: International Water Management Institute. Shyamsundar, P., E. Araral, and S. Weeraratne. 2005. “Devolution of Resource Rights, Poverty, and Natural Resource Management – A Review.” Environment Department Paper No. 104. Washington, DC: World Bank. Siela and Danida. 2005. “A national opinion poll: commune council’s perception of its natural resource base and livelihood options.” In World Bank. 2006. Poverty-Environment Nexus: Sustainable approaches to poverty reduction in Cambodia, Laos, and Vietnam. Washington, DC: World Bank. Silva, P. 2005. “Environmental factors and children’s malnutrition in Ethiopia.” World Bank Research Working Paper 3489. Washington, DC: World Bank. Silva, P. 2005. “Exploring the link between poverty, marine protected area management and the use of destructive fishing gear.” Policy Research Working Paper 3831. Washington DC: World Bank. Sjaastad, Espen, Arild Agelsen, Pal Vedeld, and Jan Bojo. 2005. “What is environmental income?” Ecological Economics 55: 37–46
77
Smith, Kirk R., Jonathan M. Samet, Isabelle Romieu, and Nigel Bruce. 2000. “Indoor Air Pollution in Developing Countries and Acute Lower Respiratory Infections in Children.” Thorax 55: 518–532. Smith, Kirk, S. Mehta, and M. Maeusezahl. 2004. “Indoor Air Pollution from Household Use of Solid Fuels.” Comparative Quantification of Health Risks 18:1435–1492. Smith, Kirk. 2006. Presentations from the Guatemala air pollution intervention trial (RESPIRE). Available at: http://ehs.sph.berkeley.edu/krsmith/page.asp?id=19 Smith, L., and L Haddad. 1999. “Explaining child malnutrition in developing countries: a cross-country analysis.” Food Consumption and Nutrition Division discussion paper. Washington, DC: IFPRI. Sundar, N. 2000. “Unpacking the ‘Joint’ in Joint Forest Management.” Development and Change 31: 255–279. Sunderlin, W.D., I.A.P. Resosudarmo, E. Rianto, and A. Angelsen. 2000. “The effect of Indonesia’s economic crisis on small farmers and natural forest cover in the outer islands.” CIFOR Occasional Paper 28(1). Bogor, Indonesia: CIFOR. Sunderlin, W.D., A. Angelsen, B. Belcher, P. Burgers, R. Nasi, L. Santoso, and S. Wunder. 2005. “Livelihoods, Forests and Conservation in Developing Countries: An Overview.” World Development 33(9): 1383–1402. Tachibana, T., H.K. Upadhyay, R. Pokharel, S. Rayamajhi, and K. Otsuka. 2001. “Common Property and Forest Management in the Hill Region of Nepal.” In K. Otsuka and F. Place (eds.). Land Tenure and Natural Resource Management. A Comparative Study of Agrarian Communities in Asia and Africa. Baltimore and London: Johns Hopkins University Press and International Food Policy Research Institute. Takasaki, Yoshita, Bradford L. Barham, and Oliver T. Coomes. 2004. “Risk coping strategies in tropical f orests: flood, illnesses and resource extraction.” Environment and Development Economics 9: 203–224. Thomas, D., V. Lavy, and J. Strauss. 1996. “Public policy and anthropometric outcomes in Cote d’ Ivoire.” Journal of Public Economics 61: 155–192. Van der Klaauw, B., and L. Wang. 2005. “Child mortality in rural India.” World Bank Research Working Paper. Washington, DC: World Bank. Vedeld, Paul, Arild Angelsen, Espen Sjaastad, and Gertrude K. Berg. 2004. “Counting on the environment. Forest incomes and the rural poor.” Environment Department Paper No. 98. Washington, DC: World Bank.
78
Vermillion, D.L. 1997. “Impacts of Irrigation Management Transfer: A Review of the Evidence.” Research Report 11. Colombo, Sri Lanka: IIMI. Vermillion, D.L. 1992. “Irrigation Management Turnover: Structural Adjustment or Strategic Evolution?” IIMI Review 6 (2): 3–12. Wang, L. 2003. “Determinants of child mortality in LDCs: Empirical findings from demographic and health surveys.” Health policy 64: 277–299. Wolpin, K. I. 1997. “Determinants and consequences of the mortality and health of infants and children.” In M. R. Rosenzweig and O. Stark (eds.). Handbook of Population and Family Economics. Vol 1A. Amsterdam: Elsevier. Wooldridge, Jeffrey. 2002. Econometric Analysis of Cross-Section and Panel Data. Cambridge, Mass.: MIT Press. World Bank. 2006. Poverty-Environment nexus. Sustainable approaches to poverty reduction in Cambodia, Lao PDR, and Vietnam. Washington, DC: World Bank. World Bank. 2006. At loggerheads? Agricultural expansion, poverty reduction and environment in the tropical forests. Washington, DC: World Bank. World Bank. 2006. World Development Indicators. Washington, DC: World Bank. World Bank. 2006. Repositioning Nutrition as Central to Development: A Strategy for Large-Scale Action. Directions in Development Series. Washington, DC: World Bank World Bank 2005. “Lessons Learned from Bangladesh, India, and Pakistan: Scaling-Up Rural Sanitation in South Asia.” Water and Sanitation Program Report. Washington, DC: World Bank. World Bank. 2001. “Health and Environment.” Background paper for the World bank Environment Strategy. Washington, DC: World Bank. World Health Organization. 2002. The World Health Report 2002: Reducing risks, Promoting Healthy Life. Geneva: WHO. Wunder, S. 2005. “Payments for environmental services: Some nuts and bolts.” CIFOR Occasional Paper No.42. Bogor, Indonesia: CIFOR. Zbinden, S., and D. Lee. 2005. “Paying for Environmental Services: An Analysis of Participation in Costa Rica’s PSA program.” World Development 33: 255–272. Wunder, Sven. 2001. “Poverty alleviation and tropical Forests: What scope for synergies?” World Development 29(1): 1817–1833.
79
Notes 1 What is environmental income? In its most fundamental sense, environmental income is rent acquired from nature’s provision of goods and services. Rent, however, is difficult to estimate. A working definition given by Sjaastad et al. (2005) identifies environmental income as rent or value added from “alienation or consumption of natural capital in the first link in a market chain, starting from the point at which the natural capital is extracted or appropriated.” This definition is useful because it also limits the scope of products that can contribute to environmental income. 2 Awareness can also contribute to behavioral changes—more hand washing, care to reduce pesticide exposure, and so on—with impacts on health. 3 It is possible that some of these factors will interact with environmental exposures: for example, the impact of IAP on ARI in children may depend on a child’s nutritional status. 4 In the epidemiological literature, case-control studies are often conducted to study rare outcomes. For example, to study the impact of IAP on deaths due to ARI, a sample of children who die of ARI would be compared to a control group of children dying of a non-air-pollution-related cause (e.g., diarrheal disease). Case-controlled studies, however, also suffer from omitted variable bias problems, and rarely have enough observations to apply techniques such as propensity score matching. 5 Private safe water in Hughes, Lvovsky, and Dunleavy (2001) and Van der Klaauw and Wang (2004) includes a piped water connection, a hand pump, or a well located in a household’s yard or inside dwelling. 6 The World Health Organization estimates that 50 percent of the burden of disease associated with malnutrition is attributable to environmental factors (WHO, 2004). 7 The current scientific consensus indicates that most respiratory health problems result from inhalation of respirable particles with a diameter less than 10 microns (PM10) or ever finer particles (PM2.5) released from combustion of solid fuel. 8 It is also possible to study the impact of interventions such as introduction of improved stoves using experimental methods. See Kirk Smith (2006). 9 This result controls for child age and gender, but not for nutritional status, which was measured in the study. 10 Pitt et al. (2006) used a panel dataset constructed from the 1981/82 and 2002/03 Bangladesh household surveys to test the assumption that an individual’s health endowment affects the allocation of cooking time. Their study suggests that households rationally allocate cooking activities to women who are in poorer health. If this is the case, it may be difficult to reduce these women’s exposures, except by improving ventilation or changing the type or amount of fuel burned. 11 It should be noted that improved stove programs have not been a great success, partly because of lack of community involvement in stove design, and possibly because of failure to understand the long-term health consequences of exposure to IAP. For example, the clean stove program of Enterprise Works in Ghana mentions nothing about the health effects of using improved stoves, emphasizing instead fuel savings, reduced deforestation, and reduced greenhouse gas emissions. 12 It is widely known, for example, that households with latrines behave more hygienically in general than households without latrines, making it difficult to attribute any health benefit to latrines alone. 13 Communal land refers to areas where property is commonly held with some form of traditional authorities in place. However, all communal land in Namibia belongs to the state. 14 Best practice of any econometric exercise is to use base modeling and hypothesis tests on qualitative information about the ground realities. In particular, specific aspects of implementation of each policy reform, as well as local customs and conditions, are not always captured by quantitative data. Collection of
80

qualitative information is vital to the understanding and interpretation of the quantitative data collected at the household level.
81