causality linkages among energy poverty, income …pide.org.pk/pdf/pdr/2015/volume4/407-425.pdf ·...
TRANSCRIPT

©The Pakistan Development Review
54:4, Part II (Winter 2015) pp. 407–425
Causality Linkages among Energy Poverty, Income
Inequality, Income Poverty and Growth: A System
Dynamic Modelling Approach
GHULAM MURTAZA and MUHAMMAD ZAHIR FARIDI1*
1. INTRODUCTION
The energy services stipulation of a country discloses its importance as a decency
of course of action necessary for economic prosperity, lessening the poverty and
depolarising the social asymmetry [Barnes, et al. (2011)]. The accomplishment of basic
needs of energy services that include excess to electricity, commercial use of energy for
production process as well as usage of electricity in the residential areas and modern use
of energy sources for cooking purposes portraits an image of high-quality living standard
of individuals and offers a way forward to economic development.12
The notion of pro-
poor growth is well documented in the recent literature for assurance of thinning the
poverty that is congregated through translation of growth into the lives of poor by
reshaping the income distribution23
for marginalised group of people. Ekouevi and
Tuntivate (2012) and studies of international agencies [AGECC (2010); WHO (2006);
UNDP and WHO (2009)] have preliminary acknowledged the need of improving the
access to reliable and affordable modern energy services in the developing economies for
economic prosperity and social welfare of individuals.
As for as social inequality is concern, energy poverty is of enormous worth to
address it as deficiency in supplying commercial energy especially electricity, tends to
emphasise the social asymmetry in the society [Pereira (2010)]. While the energy
Ghulam Murtaza <[email protected], [email protected]> is PhD Scholar at Pakistan
Institute of Development Economics, Islamabad. Muhammad Zahir Faridi <[email protected]> is
Associate Professor of Economics, Bahauddin Zakariya University, Multan.
Authors’ Note: The first author is indebted to Prof. Dr. Khurshed Hassan Khawar, Govt. Gorden
College, Rawalpindi, for his interminable efforts and worthy support in pulling-off my aspirations. The earlier
version of this paper is presented at the 30th AGM and Conference 2014, PSDE, PIDE, Islamabad. The authors
much appreciate the helpful comments of conference participants and further benefitted from the remarkable
comments and suggestions of Ms. Rashida Haq, Discussant, PSDE, PIDE. 1International Energy Agency report (2010) declares that 1.3 billion people living without excess to
electricity and about 2.6 million people who are not provided clean cooking facilities globally. This indicates a
serious impediment to social and economic development and must be addressed uncompromisingly for the
achievement of UN Millennium Development Goals [Dagoumas and Kitsios (2014)]. 2According to Scheikman (2002), the prudent government policies formulated with the aim of reducing
poverty and income inequality account education and health substances a lot and these issues cannot be
accomplished without required energy services.
408 Murtaza and Faridi
development mitigates the poverty as it provides the sustainability and enhances the
opportunities for growth that leads to better quality of life [Pereira (2010)]. The
significance of energy services in the mechanism of structural transformation for
development and trading off the old modes of living for new ones has made the concept
of energy poverty a leading concern now a days. In the developing countries like
Pakistan, energy services supplies are not met perfectly that create social injustice by
depriving people form clear cooking facility that badly effect their health conditions; as
well as from education as new modes of training and guidance demand electricity
essentially. Comfort and ease of life purely rely on the use of modern home appliance and
on vehicles which run from electricity and fuel accordingly. Thus unswervingly
availability of energy components (i.e., oil, gas, electricity and coal) at affordable prices
diminishes social asymmetry; eliminates poverty; boosts up economic performance and
ultimately up lifts the living standard of people.
The above deliberation urges to find out the causality linkages among energy
poverty, income inequality, income poverty and growth for Pakistan. Moreover,
secondly, study intends to examine the energy services conditions through construction of
an Energy development index (EDI) that measures the energy poverty in Pakistan at
macro level. Thirdly, study creates distinction on methodological grounds from rest of the
studies. Study follows multivariate TY- procedure for the estimation of VAR system
through seemingly unrelated regression (SUR) using modified Wald test for the causality
analysis.
After a brief introduction in the first section, trends and size of energy services in
Pakistan and its comparison with the rest of the economies and regions is drafted under
Section 2. Section 3 is about the energy development index (EDI) and its construction.
Review of Literature is presented in Section 4. Data and methodology is provided in
Section 5 while the empirical results and discussion are presented in Section 6. At the
end, Section 7 is consisting on conclusions and policy recommendations.
2. ENERGY POVERTY SCENARIO IN PAKISTAN
Per capita commercial energy consumption is thought-out well gauge for energy
development which gears up economic growth and eliminates poverty. The present per
capita energy use for Pakistan is near to the ground. The per capita energy use is 481.61
Kg tons of oil equivalent (Kg of Toe) for Pakistan while the average per capita energy
use of South Asia is 555 kg Toe; OECD members countries has a average of 4176 kg
Toe; Sub-Saharan Africa region has 681 Kg Toe; and, World average per capita energy
consumption is 1890 kg Toe, the estimates of [WDI (2011)] reveal. This picture depicts
the situation of energy poverty in Pakistan regarding use of energy as within the region,
Pakistan energy consumption is about 15 percent below than average energy
consumption of South Asia; 21 percent less than that of India; and, even less than Sri
Lanka equals to 5 percent nearly. With respect to world energy consumption, Pakistan
uses 75 percent less energy and in comparison to OECD countries its value is 88 percent.
The Figure 2.1 demonstrates the situation of energy use for Pakistan as compared to
different countries of the world.
People access to electricity is considered first-rated indicator for excess to modern
energy services. The world development indicators show 1.2 percent increase, from 67.4

Causality Linkages among Energy Poverty, Income Inequality, Income Poverty and Growth 409
percent to 68.6 percent, in population accessed with the electricity in Pakistan for the
year 2010 to 2011. Figure 2.2 displays an inclusive comparison of Pakistan with different
regions and countries to make energy poverty incidence clear for Pakistan. Within the
region of South Asia, Pakistan is providing electricity less than India, Sri Lanka and
Nepal. In contrast to Malaysia and Unites Arab Emiratis who are providing electricity to
whole population almost, Pakistan has succeeded just 68.6 percent in providing
electricity to its population. Similarly, Pakistan is also 18 percent below than middle
income countries and almost 10 percent below than the world average in percentage of
providing excess to electricity.
Fig. 2.1. Per Capita Energy Use in Pakistan Compared to World
Authors’ assemblage. Source: WDI (World Bank Data CD-Rom).
Figure 2.3 presents substantial dependence of developing countries on biomass for
cooking purposes. The statistics of World Energy Outlook, 2012 (IEA) and WHO
database (2010) indicate that 2588 million people (38 percent of world population); over
1.8 billion people (equals to half of developing Asia population); and, about 700 million
people (80 percent of the sub-Saharan Africa), who are using traditional biomass sources
for cooking purposes and deprived from clean cooking facilities. 64 percent of population
(111 million people) of Pakistan is using traditional biomass for cooking purposes. While
in China, India, Indonesia, Philippines, Vietnam and rest of developing Asia, 29 percent,
66 percent, 55 percent, 50 percent, 56 percent and 54 percent of population is not availing
clean cooking facilities respectively.

410 Murtaza and Faridi
Fig. 2.2. Excess to Electricity in Pakistan Compared to World
Authors’ assemblage. Source: WDI (World Bank Data CD-Rom).
Comparative exploration of modern fuel sources available for cooking purposes
show the incidence of energy poverty in Pakistan. Biomass dependence, in Pakistan, is
almost double than that of china and world average, almost equal to India and Africa
region, 10 percent more than Vietnam and developing Asia average, 60 percent more
than Middle East, 15 percent more than Philippines and developing countries. So, large
dependence on biomass consumption for cooking purposes designates Pakistan a poor
country who is failing in providing health and safe cooking facilities. Yet, Pakistan has
shown an improvement in that indicator of energy poverty as in the list of developing
Asian countries Pakistan is keeping pace with China, Thailand and Vietnam where a
notable improvement in lessening biomass dependence is observed.
Fig. 2.3. Use of Biomass for Cooking in Pakistan and Developing Countries- 2010
Source: World Energy Outlook 2012, IEA and WHO database (2010).

Causality Linkages among Energy Poverty, Income Inequality, Income Poverty and Growth 411
3. LITERATURE REVIEW
The leading intention of the paper is to present a comprehensive review of prior
work to confer a deep insight about the issue of energy poverty and its integrating factors.
The empirical studies on the issue of energy poverty for the developing countries are not
in surfeit. However, study makes a healthy endeavour to present literature on prior work
done until now in the following.
The significance of the role of energy especially electricity as a mean of economic
development is dated back at least to 1950s. Supply of electricity causes to stimulate
human productivity and welfare that ultimately improve economic status of population. It
is considered that poverty elimination, efficiency of productivity, pollution reduction, and
health improvement is the fruit comes from provision of modern energy [United Nations
(1954)].
After gaining the importance from a number of overseas development agencies
[World Bank (1985); WIN (2005); UNDP (2007, 2012); ADB (2010a, b)], the energy
related issues have, now, become the central focus for economic development and social
wellbeing of individuals. The UN General Assembly has announced the years 2014-2024,
to be ―the decade of sustainable energy for all‖ [United Nations (2014)].
Recent literature and UNDP reports have re-conceptualised the poverty across-the-
board that withdraw it from traditional perception in which poor were jammed with the
notion of earning less than 2 dollar a day [Sovacool (2012)]. A number of factors have,
now, encompassed in the definition of poverty that include life expectancy, literacy,
caloric intake, housing quality and excess to energy [UNDP (2010)]. This inaugurated the
intuition of non-income dimensions of poverty such as lack of excess to electricity and
reliance on the traditional biomass fuel for cooking [Joneset, et al. (2010); International
Energy Agency (2010)].
The health impacts of biomass combustion form cooking are observed in a number
of studies. The pragmatic studies of [Pokhreletal (2005, 2013); Shrestha and Shrestha
(2005); WIN (2005); Joshi, et al. (2009); Dhimal, et al. (2010); Mallaetal (2011)] come
to a conclusion that emissions from burning of biomass are harmful for individuals health
significantly, especially, for women and children health which reduce life expectancy,
productivity and efficiency. Besides this, searching for biomass fuel is a time taking
activity that restricts women and children from any other productive activity [Saghir
(2005); Barnes and Toman (2006)].
Causality linkages of income inequality and energy poverty are well examined in
the studies of [Hussain (2011); Sovacool (2012); Larson and Kartha (2000); Masud, et al.
(2007)]. Studies narrated that income poor pay eight times more than the other group of
income for the same unit of energy they use. It is estimated that on average 20-30 percent
income is spent on the energy services by the poor households directly while additional
20-40 percent income is paid out indirectly in term of time and health injury related with
collection and use of raw energy material respectively. On the other hand, in contrast,
making use of modern energy services in running heavy machinery, illumination of shops
and factories, refrigeration of products for preservation and development of the
mechanisation process has lifted up employment opportunity and provided incentive to
poor by decreasing inequality and increasing their income level.
412 Murtaza and Faridi
Savacool (2012) pointed out a significant relationship between energy poverty and
economic wellbeing of people in the developing countries. Income poverty and energy
deprivation move together, where a significant proportion of income is allocated for
availing energy services. For an instance, in case of Nepal, the introduction of renewable
energy technologies is the centre focus of government policies that has activated the
balanced growth and helping out to eradicate poverty [Malla (2013)]. The studies of
[Roddis (2000); Cabraal and Barnes (2006); World Bank (2002)] also drawn the same
conclusion of bi-directional causality between energy development and poverty.
Above narratives make us available a termination that energy services must be the
essential meeting point of any economic agenda and planning for social development.
This leads us to put up an augmented system that will connect poverty, growth and
inequality with the new no-income dimensions of poverty that is— energy poverty. A
plausible causality linkage among these variables may leave new foresights for economic
planners.
4. THE ENERGY DEVELOPMENT INDEX (EDI)
Ecological scientists and social welfare organiser always put forth the need of
understanding energy poverty to mitigate it [Pachauri and Spreng (2011)]. It requires
apparatus and structure in which it could be measured, monitored, recorded and reported.
A number of scientists, over last 20 years, are involved in the energy and development
issues to understand the concept of energy poverty [Bravo, et al. (1979); Bazilian, et al.
(2010); Saghir (2004); Krugmann and Goldemberg (1983); Pachauri and Spreng (2004);
Goldemberg (1990); Pachauri and Spreng (2011); Foster, et al. (2000)]. The present
study construct Energy Development Index (EDI) to measure34
the energy poverty at
national level for Pakistan following the definition and computation methods of [IEA
(2004); Malla (2013)]. The EDI is a composite index consists of four indicators or
components that are equally weighted but this study assigned the weight to each indictor
on the basis of principal component analysis (PCA). The Table 4.1 briefly describes the
definitions, proxies and measuring units of indicators of energy poverty for Pakistan.
Each indicator is normalised first by using the following formula;
Indicator = –
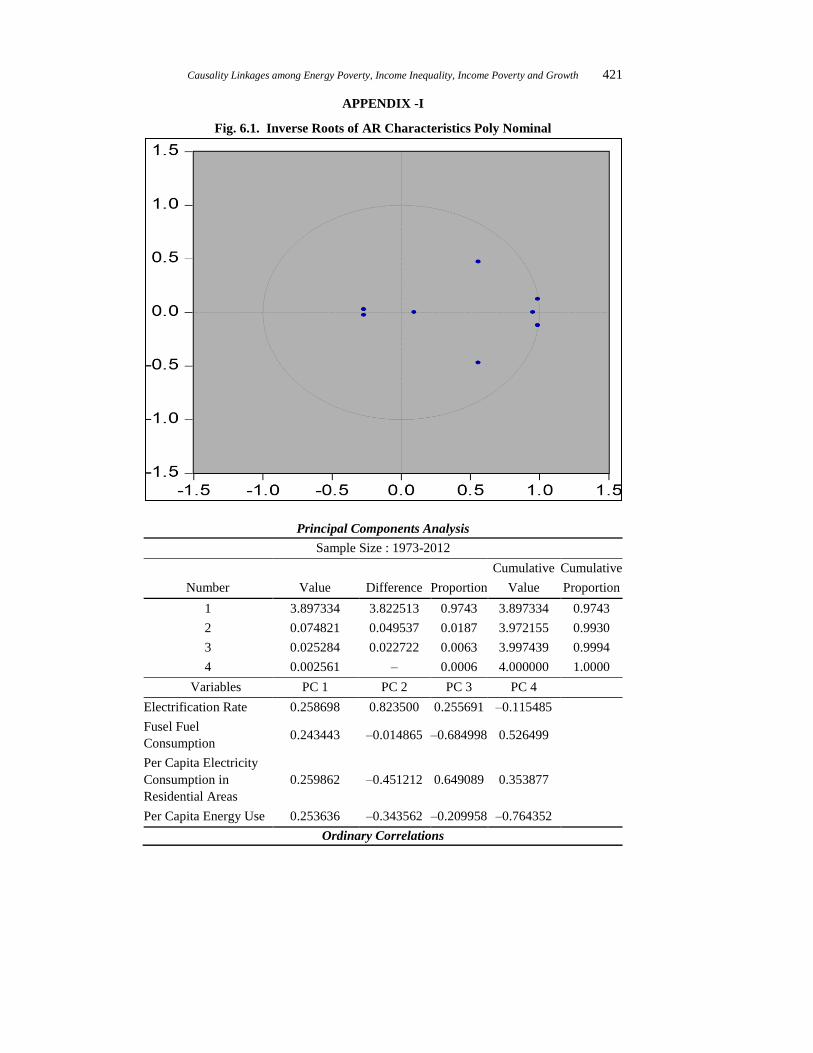
The principal component analysis (PCA) is utilised on all normalised indicators of
energy services to find weights for computing the energy development index (EDI). The
outcomes of PCA show that (PC 1) explain 97 percent of the standardised variance, the
Eigen values of (PC 1) reveal. While (PC 2), (PC 3) and (PC 4) explain standardised
variance equals to 0.018 percent, 0.006 percent, 0.0006 percent respectively. So the first
component (PC1) is best for assigning the weights to normalised indicators. The
individual share of each indicator to EDI is given as under;
3Still there is no consensus on the issue of measuring energy poverty [Nussbaumer, et al. (2012)]. Different
studies on measuring the Energy poverty based on; different approaches; definitions; data availability are being cited as
under for reference and not discussed in detail as this is beyond the scope of this paper. [Bazilian, et al. (2010); Foster,
et al. (2000); Mirza and Szirmai (2010); Barnes, et al. (2010); Practical Action (2010); Awan, et al. (2013); Pachauri, et
al. (2004); IEA (2004); World Energy Outlook (2010); United Nations Development Program (2010); Jones (2010);
Holdren and Smith (2000); Khandker, et al. (2012); Sovacool, et al. (2012)].

Causality Linkages among Energy Poverty, Income Inequality, Income Poverty and Growth 413
Fig. 4.1. Trends in Energy Development Index (EDI) for 1973-2013
Energy Development Index (EDI) = 0.25(Per capita energy consumption) + 0.244(Excess to electricity) + 0.25(Per
capita electricity in residential sector)+ 0.255(Share of modern energy fuel in total residential energy use).
The results of ordinary correlates (provided in Appendix-I) call for a composite
index. The outcomes of the Energy Development Index (EDI) are graphed for each year
as shown in Figure 4.1. The trend of EDI indicates the development of energy services
over the time .Yet this growth in not in line with the growth rates of other developing
countries. It is observed that from 2007 to onward a decrease in the trend points out the
incidence of energy crisis. The shortage of energy supply, especially of electricity has
increased the magnitude of energy poverty in Pakistan.
Table 4.1
Indicators for Energy Development Index (EDI)
Indicator Definition Proxy
Units of
Measurement
Per Capita
Commercial Energy
Consumption
It is the amount of energy per capita used in
the production process indicates the overall
economic development of the country.
Commercial Energy
Consumption Per
Capita
Tonnes of oil
equivalent (Toe)
Excess to Electricity People from total population availing
the facility of electricity which is an
indicator for social asymmetry, reliance
and ease of life.
Rate of
Electrification Percentage
Per Capita
Electricity in
Residential Sector
It is per capita consumption of
electricity in the residential sector that
express the ability of the consumer for
the payment of electricity services and
basic reliability.
Per Capita
Electricity
Consumption in
Residential Sector
Tonnes of oil
equivalent (Toe)
Share of Modern
Energy Fuel in
Total Residential
Energy Use
The excess of modern energy services
for cooking purposes out of total energy
services provided to household instead
of traditional biomass burning for
cooking. It includes the use of oil, gas
and electricity.
Share of Fossil
Fuel Energy
Consumption in
Total Consumption
Percentage
0
0.2
0.4
0.6
0.8
1
1.2
Energy Development Index
(EDI)

414 Murtaza and Faridi
5. DATA AND METHODOLOGY
The study intends to find out the causality linkages among energy poverty,
economic growth, income inequality and income poverty in case of Pakistan. A number
of studies have presented a system that provides the scheme in which the poverty, growth
and inequality are well studied. The present study augments this system by incorporating
the new dimension of poverty that is— energy poverty. Thus, the study estimates the
dynamic Granger non-causality relationship between poverty, growth, income inequality
and energy poverty by employing multivariate Tota and Yomamto (1995),TY-modeling.
5.1. Data
The study uses annually time series data for Pakistan ranges from 1973 to 2012.
The data are sourced from Economic Survey of Pakistan (various issues), the World
Development Indicators database CR-ROM, Jamal (2006) and Pakistan labour force
survey (various issues), depending upon the availability of data while some absent values
of data are interpolated by using software, Eviews 7.0 package.
The study uses four variables for the analysis. GDP Per Capita (GDPPC) is the
income per individual measured in Pak rupees, Income Inequality (INEQ) indicates the
distribution of income among different income groups of people of country proxies by
Gini-coefficient (in percentage), Income Poverty (POV) is measured with head count
ratio (percentage) while the energy poverty (EDI) is expressed with the help of energy
development index (EDI)45
measured in percentage. All the variables are expressed in
percentage after taking the natural log of GDPPC.
5.2. Time Series Properties of Data
Before proceeding to multivariate TY-procedure, it requires the time series
properties of data to be scrutinised for obtaining the maximum order of integration of
series. The study uses augmented Dickey- Fuller (1979), ADF test as well as Phillips
Perron (1988), PP test for robustness of unit root results.
The ADF test works in the following specification where optimal lag length is selected on
the basis of Schwars information criteria (SIC); 1
, i,t-1 , i,t
1
= c + v + + T + k
i t i i t j
j
s s
… … … … (1)
Where Si,t indicates the respective time series variables i.e., GDPPC, POV, INEQ, EDI. T
specifies time trend, ∆ shows first difference operator and ἐi,t is the white noise error. The
Equation (1) tests the Null hypothesis ( = 0) for the existence of a unit root process in
the series against the alternative hypothesis of ( ≠ 0) mean-stationary.
For an exogenous shock to a time series that already has a deterministic trend (T),
the under-rejection of the hypothesis is inevitable that may not supply robust results
[Philip and Perron (1988)]. So, permitting for dependence and heterogeneity in the error
term, following specification presents the non-parametric adjustment to ADF test
statistic;
4EDI is measured with the help of a composite index consists of four variables. Definitions, measuring
units and proxies of all four variables (indicators) are provided in Table 4.1 under Section 4 in detail.
Causality Linkages among Energy Poverty, Income Inequality, Income Poverty and Growth 415
i,t-1, i,t= c+ + +2
i tc
s t s
… … … … (2)
Where, Si,t is the corresponding time series (i.e., GDPPC, POV, INEQ, EDI),
is the
time trend,c stands for sample size and ἐi,t is white noise error.
5.3. Econometrics Methodology
Existing Literature presents a variety of methodologies available for causality
inferences depending on the characteristics of time series data. Granger non-causality,
Johnson and Juselius (1990) ECM causality, ARDL modeling causality suggested by Pesaran
and Shin (1998), TY- multivariate model causality and DP nonparametric causality proposed
by Diks and Panchenko (2006) are considered the standard causality tests available.
This paper follows Toda and Yomamota (1995) to employ TY-multivariate
modeling because of a number of advantages over other methodologies. Unlike Johnson
ECM causality which necessitates same order of integration of all time series, TY-
Procedure is feasible even when the order of integration of time series is mixed. Thus
TY-Procedure is free from pre-testing of co-integration of the series. Likewise, in ECM
Granger causality, use of standard Wald F-Stat for coefficient restrictions on parameter
after estimating VAR system from OLS, confers non- standard asymptotic distribution of
Wald F-stat that may involve nuisance parameters if one or more series contain a unit
root [Toda and Phillips (1993); Sims(1990)]. So, TY- modeling is preeminent procedure
for causality inferences as it does not demand any co-integration test and presents an
augmented VAR system narrated as VAR (k+ dmax
) through which restrictions are
implemented with the help of modified Wald Test (MWALD) on VAR(k) after
estimating augmented VAR system from Seemingly unrelated Regression (SUR) at level.
Here, k is the number of lags and dmax
represents the maximum order of integration
among all the time series. Kuzozumi and Yamamoto (2000) asserted that the model will
be valid until the condition; k>dmax
holds.
We examine the dynamic causality among energy poverty, growth, inequality and
income poverty by applying the TY- procedure, speified as follows;
… (3)
Specifying this generalised version of TY-procedure for our concerned variables
(i.e.,EDI, INEQ, GDPPC and POV), we obtain the following augmented VAR system of
equations;
max max
1 1 2 1 2 1
1 1 1 1 1
max max
2 1 2 1,t
1 1 1
= + + + + +
+ + + + ..........
k d k d k
t i t i t j i t i t j i t
i j k i j k i
d k d
i t j i t i t j
j k i j k
EDI EDI EDI INEQ INEQ POV
POV GDPPC GDPPC
...... (4)
max max
1 1 2 1 2 1
1 1 1 1 1
max max
2 1 2 2,t .
1 1 1
= + + + + +
+ + + + .....
k d k d k
t i t i t j i t i t j i t
i j k i j k i
d k d
i t j i t i t j
j k i j k
INEQ INEQ INEQ EDI EDI POV
POV GDPPC GDPPC
.......... (5)

416 Murtaza and Faridi
max max
1 1 2 1 2 1
1 1 1 1 1
max max
2 1 2 3,t
1 1 1
= + + + + +
+ + + +
k d k d k
t i t i t j i t i t j i t
i j k i j k i
d k d
i t j i t i t j
j k i j k
GDPPC GDPPC GDPPC EDI EDI INEQ
INEQ POV POV
............... (6)
max max
1 1 2 1 2 1
1 1 1 1 1
max max
2 1 2 4,
1 1 1
...........
k d k d k
t i t i t j i t i t j i t
i j k i j k i
d k d
i t j i t i t j t
j k i j k
POV POV POV EDI EDI INEQ
INEQ GDPPC GDPPC
.... (7)
After the augmented VAR system is constructed, it is estimated from seemingly
unrelated regression(SUR).Standard MWALD is used for the parameter restrictions on
VAR(k) from VAR(k+dmax
)to get the value of chi-square statistic that is asymptotically
normally distributed [Zapata and Rambaldi (1997)].
To demonstrate how MWALD works, we consider equation (4) where we can test
the hypothesis that income inequality (INEQ) does not Granger cause energy poverty (EDI)
if 1 0i i ; likewise, income poverty (POV) does not Granger cause energy poverty (EPI) if
0i i ; similarly, growth (GDPPC) does not granger cause energy poverty (EDI) if
0i i . The same mechanism is extended for the Equations (5), (6) and (7).
5.5. The Innovation Accounting System
This system demonstrates how a variable retorts from a shock that comes across in
other variables within the system and whether this shock dies or continues over the time.
Following Pesaran and Shin (1948) and Koop, et al. (1996), we have employed
generalised impulse response function (GIRF) to gauge the comparative potency of
causality in an out-of-sample period as the TY-procedure tests only the long run causality
within the sample period. The generalised impulse response function (GIRF) has
advantages of other standard impulse response functions [Ewing and Payne (2005)].
6. RESULTS AND DISCUSSIONS
The empirical evidences of Granger non-causality among poverty, growth,
inequality and energy poverty call for a dynamic system as designed in TY-modeling.
This representation persists an augmented VAR (k+dmax
) system. For this sake, to find
the values of k and dmax
for estimating augmented VAR (k+dmax
), unit root properties and
lag length selection of variables are thin slices of this segment.
6.1. Stationarity of Data and Lag Length Selection
For any time series analysis, the identification of the unit root in the time series is
important. Study used ADF and PP tests for scrutinising the order of integration of series.
Results are reported in Table 6.1. Maximum order of integration of concerned variables is
(dmax
=1) which fulfill the requirement of TY-Procedure for Granger non-causality
inference.

Causality Linkages among Energy Poverty, Income Inequality, Income Poverty and Growth 417
Table 6.1
Stationarity of Data
Variable
At Level With First Difference
Max.*
Lag Length
Order of
Integration
Intercept Trend and Intercept Intercept Trend and Intercept
ADF PP ADF PP ADF PP ADF PP
RGDPC 0.33 1.65 –4.21 –4.42* –10.5* –10.92* – – 9 I(0)
EDI –2.69 –2.69 0.31 0.02 –4.23* –4.24* – – 9 I(1)
POV –0.70 –1.28 –2.35 –1.57 –1.73 –4.12* –0.40 –4.1* 9 I(1)
INEQ –2.63*** –2.92** –2.85 –3.3** – – – – 9 I(0)
Source: Authors’ calculations, * max lag length for ADF test is 9 where optimal lag length is chosen on the basis Schwarz info
criterion. For PP test, Bandwidth is opted on the basis of Newey-West using Bartlett kernel. Critical values for different level
of significance are cited from MacKinnon (1996). *,**, *** represents 1 percent, 5 percent and 10 percent level of significance
respectively.
Next is to find out the maximum lag length (k) of the time series variables for the
estimation of augmented VAR (k+dmax
). Different criterions are available for lag length
selection consisting on Akaike information criteria, Likelihood Ratio, Hannan-Quinn,
Final prediction error and Schwarz information criterion (SIC). Taking small sample size
into account, we supply [1 3] interval for unrestricted VAR output and same for finding
maximum lag length (k). Results are reported in Table 6.2 which shows that consistent
maximum lag length is (k=2).
Table 6.2
VAR Lag Order Selection Criteria
Lag LogL LR FPE AIC SC HQ
0 –362.7281 NA 4777.565 19.82314 19.99730 19.88454
1 –136.2288 391.7825 0.055020 8.444803 9.315569* 8.751788
2 –112.3280 36.17433* 0.037106* 8.017727 9.585107 8.570302*
3 –95.76586 21.48596 0.039199 7.987344* 10.25134 8.785507
Source: Authors calculations.
For dynamic Granger non-causality inferences, we have estimated the augmented
VAR (k+dmax
) that is—VAR(3) in level. The stability condition of VAR(3) as well
Diagnostic tests for each separate equation of VAR system are performed.
Table 6.3
Diagnostic Test Results of VAR(3)
Diagnastic Tests Test Statistics p-values
Autocorrelation LM 261.90 .158
Residual Noramlity (J–B test) 13.35 .101
White Heteroskedasticity Test 22.98 .114
VAR Stability -No root lies outside the unit circle-
Source: Authors calculations.

418 Murtaza and Faridi
Now, the diagnostic tests are carried out reported in Table 6.3 for the estimated
VAR of order 3. Results indicate that the VAR system is free from any biasness of
regression results. The test of stability of VAR(3) shows that roots does not lie outside
the unit root circle as confirmed in Figure 6.1. In the same way, we have also applied the
diagnostic tests on each endogenous equation of VAR system before proceeding to
Granger non-Causality tests. Results are presented in Table 6.4 which indicates that each
equation passes the diagnostic tests.
Table 6.4
Diagnostic Tests of Estimated Endogenous Equations
Equations
Autocorrelation-
LM
Residual
Normality (J–B)
White
Heteroskedasticity(ARCH) CUSUM Test
EDI .301
(.824)
13.97
(.497)
0.244
(0.62) Within limits
INEQ 1.089
(.375)
13.54
(.0331)
2.733
(.107) Within limits
GDPPC 1.051
(.390)
.382
(.825)
.853
(.361) Within limits
POV 3.026
(0.042)
9.431
(.097)
7.131
(.0329) Within limits
Source: Authors calculations.
6.2. Granger Causality Results
The results of Granger non-causality are reported in Table 6.5. Results provide
interesting causality relationship between energy poverty, growth and income
poverty and income inequality for Pakistan and exemplify worthy integration of
variables within the dynamic system to locate the net collision. We are noteworthy
interested in the direction of causality among economic growth, energy poverty and
income poverty besides a number of other results. The results show bi-directional
long run causality between economic growth and energy poverty; running from
energy poverty to economic growth and vis verse. It explores the fact that excess to
modern energy services are highly significant for the economic prosperity of Pakistan
as energy is considered the main driver of any economic activity that wheel up the
production process many fold. Similar results are observed for industrialised, less
developed as well as for developing countries like Nigeria, India, Pakistan and
Bangladesh [(Paul and Bhattacharya (2004); [Worrell, et al. (2001); Mozumder and
Marathe (2007); Ojinnaka (1998); Shahbaz and Feridun (2011); Javid, et al. (2013);
Faridi and Murtaza (2013)].

Causality Linkages among Energy Poverty, Income Inequality, Income Poverty and Growth 419
Table 6.5
Results of Dynamic Granger non-Causality
Dependant
Variables
MWALD Test
Causality Inferences
Economic
Growth
Income
Poverty
Energy
Poverty
Income
Polarisation
Economic
Growth 1
5.841**
(0.053)
16.482*
(0.0003)
1.948
(0.377)
Economic Growth←
Income Poverty
Economic Growth ←
Energy Poverty
Income Poverty 0.521
(0.770) 1
3.972
(0.121)
2.853
(.248) –
Energy Poverty 17.140*
(0.0002)
10.160*
(0.006) 1
7.719*
( 0.021)
Energy Poverty←
Economic Growth
Energy Poverty← Income
Poverty
Energy Poverty← Income
Polarisation
Income
Polarisation
3.741
(0.154)
13.850*
(0.001)
1.666
(0.4346) 1
Income Polarisation←
Income Poverty
Source: Authors calculations. *, ** represent significance level of 1 percent and 5 percent respectively.
On the other hand, results reveal that economic well being may ultimately leads to
greater resources to be had to meet the energy demand challenges and to endow the
easiness of life regarding clean cooking facilities and making more use of modern home
appliances. Likewise, uni-directional causality among energy poverty, income poverty
and income inequality; running from income poverty and income inequality to energy
poverty is observed. This indicates that low income households, in Pakistan, are not able
to afford fully the modern energy services as essentially they have to devote a large share
of their income for energy services payments as their there exist high income inequality.
The causality linkages also explain that growth is not pro poor in Pakistan as an increase
in national income is not translated into lives of the poor because growth is not reducing
the size of income distribution imbalances. Consequently, retaining people income poor
makes people energy poor depriving them from clean cooking fuel and other modern
energy services.
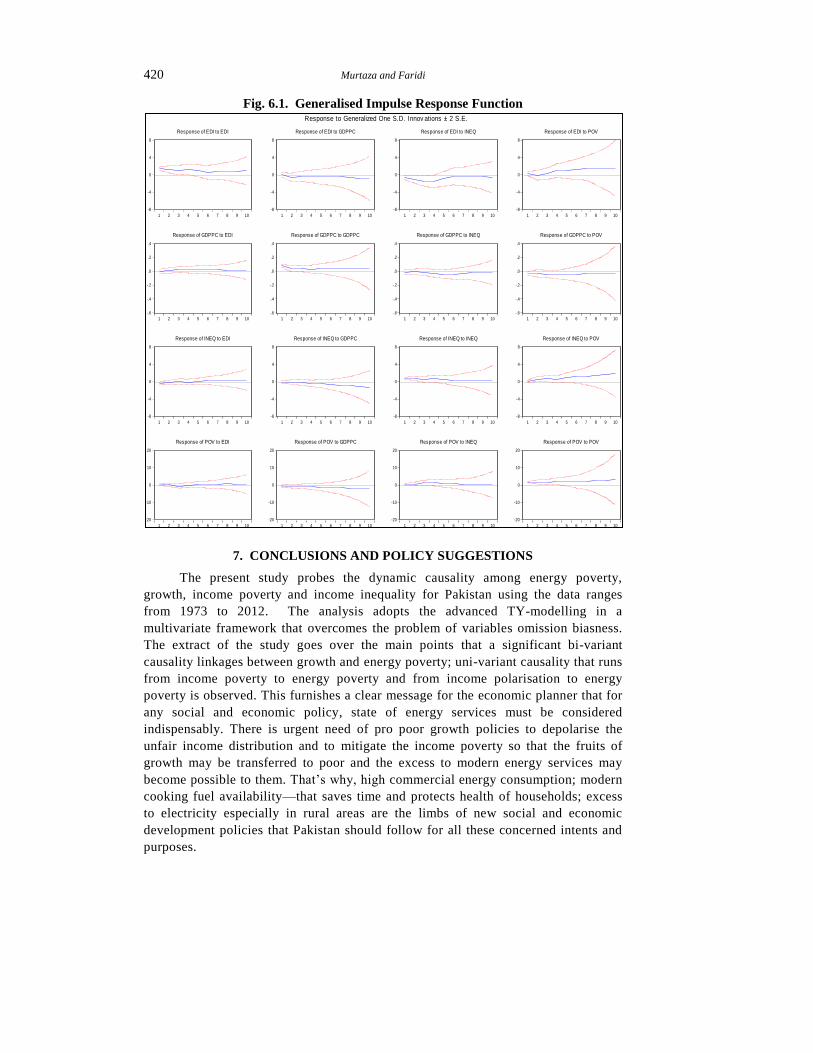
After the investigation of causality between energy poverty, growth, income
poverty and inequality, we also estimated the generalised impulse response function
to find the response of a shock of a variable to other variable within the dynamic
VAR system. In order to find the standard errors, Monte Carlo Simulation is used
with 5000 replications. The results shown in Figure 6.1 verified that the long run
causality that the shock impacts are persistent for a longer period of time. The impact
of income poverty on energy poverty involves a two year lags after that it gets
persistent. Yet response of energy poverty to inequality is for shorter period of time
and dies out after 5 to 6 years.
420 Murtaza and Faridi
Fig. 6.1. Generalised Impulse Response Function
7. CONCLUSIONS AND POLICY SUGGESTIONS
The present study probes the dynamic causality among energy poverty,
growth, income poverty and income inequality for Pakistan using the data ranges
from 1973 to 2012. The analysis adopts the advanced TY-modelling in a
multivariate framework that overcomes the problem of variables omission biasness.
The extract of the study goes over the main points that a significant bi-variant
causality linkages between growth and energy poverty; uni-variant causality that runs
from income poverty to energy poverty and from income polarisation to energy
poverty is observed. This furnishes a clear message for the economic planner that for
any social and economic policy, state of energy services must be considered
indispensably. There is urgent need of pro poor growth policies to depolarise the
unfair income distribution and to mitigate the income poverty so that the fruits of
growth may be transferred to poor and the excess to modern energy services may
become possible to them. That’s why, high commercial energy consumption; modern
cooking fuel availability—that saves time and protects health of households; excess
to electricity especially in rural areas are the limbs of new social and economic
development policies that Pakistan should follow for all these concerned intents and
purposes.
-8
-4
0
4
8
1 2 3 4 5 6 7 8 9 10
Response of EDI to EDI
-8
-4
0
4
8
1 2 3 4 5 6 7 8 9 10
Response of EDI to GDPPC
-8
-4
0
4
8
1 2 3 4 5 6 7 8 9 10
Response of EDI to INEQ
-8
-4
0
4
8
1 2 3 4 5 6 7 8 9 10
Response of EDI to POV
-.6
-.4
-.2
.0
.2
.4
1 2 3 4 5 6 7 8 9 10
Response of GDPPC to EDI
-.6
-.4
-.2
.0
.2
.4
1 2 3 4 5 6 7 8 9 10
Response of GDPPC to GDPPC
-.6
-.4
-.2
.0
.2
.4
1 2 3 4 5 6 7 8 9 10
Response of GDPPC to INEQ
-.6
-.4
-.2
.0
.2
.4
1 2 3 4 5 6 7 8 9 10
Response of GDPPC to POV
-8
-4
0
4
8
1 2 3 4 5 6 7 8 9 10
Response of INEQ to EDI
-8
-4
0
4
8
1 2 3 4 5 6 7 8 9 10
Response of INEQ to GDPPC
-8
-4
0
4
8
1 2 3 4 5 6 7 8 9 10
Response of INEQ to INEQ
-8
-4
0
4
8
1 2 3 4 5 6 7 8 9 10
Response of INEQ to POV
-20
-10
0
10
20
1 2 3 4 5 6 7 8 9 10
Response of POV to EDI
-20
-10
0
10
20
1 2 3 4 5 6 7 8 9 10
Response of POV to GDPPC
-20
-10
0
10
20
1 2 3 4 5 6 7 8 9 10
Response of POV to INEQ
-20
-10
0
10
20
1 2 3 4 5 6 7 8 9 10
Response of POV to POV
Response to Generalized One S.D. Innov ations ± 2 S.E.
Causality Linkages among Energy Poverty, Income Inequality, Income Poverty and Growth 421
APPENDIX -I
Fig. 6.1. Inverse Roots of AR Characteristics Poly Nominal
Principal Components Analysis
Sample Size : 1973-2012
Cumulative Cumulative
Number Value Difference Proportion Value Proportion
1 3.897334 3.822513 0.9743 3.897334 0.9743
2 0.074821 0.049537 0.0187 3.972155 0.9930
3 0.025284 0.022722 0.0063 3.997439 0.9994
4 0.002561 – 0.0006 4.000000 1.0000
Variables PC 1 PC 2 PC 3 PC 4
Electrification Rate 0.258698 0.823500 0.255691 –0.115485
Fusel Fuel
Consumption 0.243443 –0.014865 –0.684998 0.526499
Per Capita Electricity
Consumption in
Residential Areas
0.259862 –0.451212 0.649089 0.353877
Per Capita Energy Use 0.253636 –0.343562 –0.209958 –0.764352
Ordinary Correlations

422 Murtaza and Faridi
Variables
Electrification
Rate
Fusel Fuel
Consumption
Per Capita Electricity
Consumption in
Residential Areas
Per Capita
Energy Use
Electrification Rate 1.000000
Fusel Fuel
Consumption 0.961786 1.000000
Per Capita Electricity
Consumption in
Residential Areas
0.936884 0.970316 1.000000
Per Capita Energy Use 0.945549 0.990971 0.988608 1.000000
REFERENCES
ADB (2010a) Inclusive Growth: Impact Stories from Nepal. Manila: ADB.
ADB (2010b) Clean Energy in Asia: Case Studies of ADB Investments in Low-Carbon
Growth. Manila: ADB.
AGECC (2010) Energy for a Sustainable Future. Advisory Group on Energy and Climate
Change (AGECC). New York: United Nations.
Awan, S. (2013) Determinants of Multidimensional Energy Poverty in Pakistan. The
Pakistan Development Review 52:4.
Barnes, D. F., S. R. Khandker, Sand H. A. Samad (2011) Energy Poverty in Rural
Bangladesh. Energy Policy 39, 894–904.
Barnes, Douglas, and Michael Toman (2006) Energy, Equity and Economic
Development. In Ramon Lopez and Michael Toman (Eds.) Economic Development
and Environmental Sustainability: New Policy Options. Oxford: Oxford University
Press.
Bazilian, M., P. Nussbaumer, A. Cabraal, R. Centurelli, R. Detchen, G. Gielen, H.
Rogner, M. Howells, H. McMahon, V. Modi, N. Nakicenovic, B. O’Gallachoir, M.
Radka, K. Rijal, M. Takada, and F. Ziegler (2010) Measuring Energy Access:
Supporting a Global Target. Earth Institute, Columbia University, NY, USA.
Bravo, V., G. G. Mendoza, J. Legisa, C. E. Suarez, and I. Zyngierman (1979)
Estudiosobrerequerimientosfuturos no convencionales de energiaen America Latina.
Project RLA/74/030, Report to the UNDP, Appendix 9. FundacionBariloche, Buenos
Aires.
Dhimal, M., P. Dhakal, N. Shrestha, K. Baral, and M. Maskey (2010) Environmental
Burden of Acute Respiratory Infection and Pneumonia Due to Indoor Smoke in
Dhading. Journal of Nepal Health Research Council 8, 1–4.
Dickey, D. and W. A. Fuller (1979) Distribution of the Estimate for Autoregressive Time
Series with a Unit Root. Journal of American Statistical Association 74, 427–31.
Diks, C. G. H. and V. Panchenko (2006) A New Statistic and Practical Guidelines for
Nonparametric Granger Causality Testing. Journal of Economic Dynamics and
Control 30, 1647–1669.
Ekouevi, K. and V. Tuntivate (2012) Household Energy Access for Cooking and
Heating: Lessons Learned and the Way Forward. Washington, DC: World Bank.
Ewing, B. T. and J. E. Payne (2005) The Response of Real Estate Investment Trust
Returns to Macroeconomic Shocks. Journal of Business Research 58, 293–300.

Causality Linkages among Energy Poverty, Income Inequality, Income Poverty and Growth 423
Faridi Z. and G. Murtaza (2013) Disaggregate Energy Consumption, Agricultural Output
and Economic Growth in Pakistan. The Pakistan Development Review 52:4.
Foster, V., J. P. Tre, and Q. Wodon (2000) Energy Prices, Energy Efficiency, and Fuel
Poverty. Unpublished paper Latin America and Caribbean Regional Studies Program.
The World Bank, Washington, DC.
Goldemberg, J. (1990) One Kilowatt Per Capita. Bulletin of the Atomic Scientists 46:1.
Goldemberg, J., E. L. La Rovere, and S. T. Coelho (2004) Expanding Access to
Electricity in Brazil.
Holdren, J. P. and K. R. Smith (2000) Energy, the Environment, and Health. In
Kjellstrom Tord, Streets David, Wang Xiadong (eds.) World Energy Assessment:
Energy and the Challenge of Sustainability. New York: United Nations Development
Programme, 61–110.
Hussain, F. (2011) Challenges and Opportunities for Investments in Rural Energy.
Presentation to the United Nations Economic and Social Commission for Asia and the
Pacific (UNESCAP) and International Fund for Agricultural Development (IFAD)
Inception Workshop on ―Leveraging Pro-Poor Public-Private-Partnerships (5Ps) for
Rural Development,‖ United Nations Convention Centre, Bangkok, Thailand.
IEA, International Energy Agency (2004) World Energy Outlook. Paris.
Jamal, H. (2006) Does Inequality Matter for Poverty Reduction? Evidence from
Pakistan’s Poverty Trends. The Pakistan Development Review 45:3, 439–459.
Johansen, S. and K. Juselius (1990) Maximum Likelihood Estimation and Inference on
Cointegration: With Application to the Demand for Money. Oxford Bull Econ Stat 52,
169–210.
Jones, R. (2010) Energy Poverty: How to Make Modern Energy Access Universal?
Special Early Excerpt of the World Energy Outlook 2010 for the UN General
Assembly on the Millennium Development Goals. Paris: International Energy
Agency/OECD.
Joshi, H. D., R. Pandey, and B. Dhakal (2009) Health Impact of Indoor Air Pollution.
Journal of Nepal Health Research Council 7, 69–75.
Khandker, S. R., D. F. Barnes, and H. A. Samad (2012) Are the Energy Poor Also
Income Poor? Evidence from India. Energy Policy 47, 1–12.
Koop, G., M. H. Pesaron, and S. M. Potter (1996) Impulse Response Analysis in Non-
linear Multivariate Models. Journal of Econometrics 74, 119–47.
Krugmann, Hartmut and Jose Goldemberg (1983) The Energy Cost of Satisfying Basic
Human Needs. Technological Forecasting and Social Change 24, 45–60.
Kuzozumi, E. and T. Yamamoto (2000) Modified Lag Augmented Autoregressions.
Econometric Review 19, 207–31.
Larson, E. D. and S. Kartha (2000) Expanding Roles for Modernised Biomass Energy.
Energy Sustain Dev. 4:3, 15–25.
Lutkepohl, H. (1993) Introduction to Multiple Time Series. 2nd ed. Berlin: Springer.
Malla, M. B., N. Bruce, E. Bates, and E. Rehfuess (2011) Applying Global Cost–benefit
Analysis Methods to Indoor Air Pollution Mitigation Interventions in Nepal, Kenya
and Sudan: Insights and Challenges. Energy Policy 39, 7518–7529.
Malla, S. (2013) Household Energy Consumption Patterns and Its Environmental
Implications: Assessment of Energy Access and Poverty in Nepal. Energy Policy 61,
990–1002.

424 Murtaza and Faridi
Masud, J., D. Sharan, and B. N. Lohani (2007) Energy for All: Addressing the Energy,
Environment, and Poverty Nexus in Asia. Manila: Asian Development Bank.
Mirza, B. and A. Szirmai (2010) Towards a New Measurement of Energy Poverty: A
Cross-Community Analysis of Rural Pakistan. United Nations University, Maastricht
Economic and social Research and Training Centre on Innovation and Technology.
(UNU-MERIT Working Paper Series 024).
Mozumder, P. and A. Marathe (2007) Causality Relationship Between Electricity
Consumption and GDP in Bangladesh. Energy Policy 35, 395–402.
Nussbaumer, P., M. Bazilian, and V. Modi (2012) Measuring Energy Poverty: Focusing
on What Matters. Renewable and Sustainable Energy Reviews 16, 231–243.
Pachauri, S. and D. Spreng (2004) Energy Use and Energy Access in Relation to Poverty.
Economic and Political Weekly 39:3, 17–23.
Pachauri, S. and D. Spreng (2011) Measuring and Monitoring Energy Poverty. Energy
Policy 39, 7497–7504.
Pachauri, S., A. Muller, A. Kemmler, and D. Spreng (2004) On Measuring Energy
Poverty in Indian Households. World Development 32:12, 2083–2104.
Paul., S. and R. N. Bhattacharya (2004) Causality Between Energy Consumption and
Economic Growth in India: A Note on Conflicting Results. Energy Economics 26,
977– 983.
Pereira, M. G., M. A. V. Freitas, and N. F. D. Silva (2010) Rural Electrification and
Energy Poverty: Empirical Evidence from Brazil. Renewable and Sustainable Energy
Review 14, 1229–1240.
Pesaran, M. H. and Y. Shin (1998) Generalised Impulse Response Analysis in Linear
Multivariate Models. Economics Letters 58, 17–29.
Pesaran, M. H. and Y. Shin (1998) Impulse Response Analysis in Linear Multivariate
Models. Energy for Sustainable Development 8:4, 86–94.
Phillips, P. C. B. and P. Perron (1988) Testing for a Unit Root in Time Series Regression.
Biometrika 75:2, 336–346.
Pokhrel, A. K., K. R. Smith, A. Khalakdina, A. Deuja, and M. N. Bates (2005) Case-
control Study of Indoor Cooking Smoke Exposure and Cataract in Nepal and India.
International Journal of Epidemiology 34, 702–708.
Pokhrel, A. K., M. N. Bates, S. P. Shrestha, I. L. Bailey, R. B. Dimartino, and K. R.
Smith (2013) Biomass Stoves and Lens Opacity and Cataract in Nepalese Women.
Optometry and Vision Science 90, 257–268.
Practical, Action (2010) Poor People’s Energy Outlook.
Sagar, A. D. (2005) Alleviating Energy Poverty for the World’s Poor. Energy Policy 33,
1367–1372.
Saghir, J. (2004) Energy and Poverty: Myths, Links, and Policy Issues. Energy Sector
Notes. Energy and Mining Sector Board, 4, World Bank, Washington, DC.
Scheikman, J. A. (2002) An Agenda Perdida–diagno´ sticos e propostas para a retomada
do crescimento com maiorjustic¸a social. Rio de Janeiro, Instituto de Estudos do
Trabalho e Sociedade (IETS).
Shahbaz, M. and M. Feridun (2011) Electricity Consumption and Economic Growth
Empirical Evidence from Pakistan. Qual Quant.

Causality Linkages among Energy Poverty, Income Inequality, Income Poverty and Growth 425
Shrestha, I. L., and S. L. Shrestha (2005) Indoor Air Pollution from Biomass Fuels and
Respiratory Health of the Exposed Population in Nepalese Households. International
Journal of Occupational and Environmental Health 11, 150–160.
Sims, C. and J. Stock (1990) Watson M. Inference in Linear Time Series Models with
Unit Roots. Econometrica 58, 113–44.
Sovacool, B. K., C. Cooper, M. Bazilian, K. Johnson, D. Zoppo, S. Clarke, J. Eidsness,
M. Crafton, T. Velumail, and H. A. Raza (2012) What Move Sand Works:
Broadening the Consideration of Energy Poverty. Energy Policy 42, 715–719.
Toda, H. Y. and P. C. B. Phillips (1993) Vector Autoregressions and Causality.
Econometrica 61, 1367–93.
Toda, H. Y. and T. Yamamoto (1995) Statistical Inference in Vector Autoregression with
Possibly Integrated Processes. Journal of Econometrics 66, 225–250.
UNDP (2007) Energy and Poverty in Nepal: Challenges and the Way Forward. Regional
Energy Programme for Poverty Reduction. Kathmandu: UNDP.
UNDP (2012) Energy to Move Rural Nepal Out of Poverty: The Rural Energy
Development Programme Model in Nepal. Kathmandu: UNDP.
UNDP, WHO (2009) The Energy Access Situation in Developing Countries: A Review
Focusing on the Least Developed Countries and Sub-Saharan Africa. New York.
United Nations (1954) Rural Electrification. Prepared by the Secretariat of the Economic
Commission for Asia and the Far East. Geneva: Department of Economic Affairs.
United Nations Development Program (2010). Human Development Report. New York:
UNDP.
WHO (2006) Fuel for Life: Household Energy and Health. Geneva: World Health
Organisation (WHO).
WIN (2005) Household Energy, Indoor Air Pollution and Health Impacts: Status Report
for Nepal. Kathmandu: Winrock International Nepal (WIN).
World Bank (1985) Energy Assessment Status Report: Nepal. World Bank, Washington,
DC. (Report No. 028/84).
World Bank (2002) Rural Electrification and Development in the Philippines: Measuring
the Social and Economic Benefits. Energy Sector Management Assistance
Programme (ESMAP), 255/02. World Bank, Washington, DC.
Worrell, E., L. Price, and LBNL (2001) Pew Centre/NCEP 10-50. Improving Industrial
Energy Efficiency in the U.S.: Technologies and Policies for 2010 to 2050. Workshop
Proceedings. ―The 10-50 Solution: Technologies and Policies for a Low-Carbon
Future.‖
Zapata, H. O. and A. N. Rambaldi (1997) Monte Carlo Evidence on Cointegration and
Causation. Oxford Bulletin of Economics and Statistics 59, 285–98.