poultry pocketbook - ahdb porkpork.ahdb.org.uk/media/273704/poultry-pocketbook-2017.pdf · index -...
TRANSCRIPT
Poultry Pocketbook

1
Index - Poultry Pocketbook
Chapter 1 - Marketing Chain 3Table 1.1 UK poultry meat supply balance 3Table 1.2 UK eggs supply balance 3Table 1.3 EU poultry meat supply balance 4Table 1.4 EU egg supply balance 5
Chapter 2 - Poultry Numbers 5Figure 2.1 Density of poultry flock, June 2013 5Table 2.1 UK poultry numbers, June survey 6Table 2.2 UK chick and poult placings 6
Chapter 3 - Slaughterings and Production 7Table 3.1 UK poultry slaughterings 7Table 3.2 UK poultry meat production 7Figure 3.1 UK broiler meat production 8Figure 3.2 Average liveweight of broilers in England and Wales 8Table 3.3 UK egg packing station throughput 9Table 3.4 UK production of egg products by processors 9Figure 3.3 EU broiler meat production, 2016 10Figure 3.4 EU egg production for human consumption, 2016 10
Chapter 4 - Poultry and Egg Prices 11Table 4.1 Average UK egg packer price paid to producers 11Figure 4.1 Quarterly average UK egg packer price paid to producers 11Figure 4.2 UK wholesale chicken prices 12Figure 4.3 EU and UK broiler meat wholesale market price 12Figure 4.4 EU and UK egg (large and medium) wholesale market price 13Figure 4.5 Average poultry compound feed price, GB 13

2
Chapter 5 - Imports and Exports 14Table 5.1 UK egg trade by volume 14Table 5.2 Volume and value of UK poultry meat imports 14Table 5.3 Volume and value of UK poultry meat exports 15Table 5.4 UK fresh/frozen poultry meat imports by source 15Table 5.5 UK fresh/frozen poultry meat exports by destination 16Table 5.6 UK processed poultry meat imports by source 16Figure 5.1 Map of UK fresh frozen poultry meat exports by destination 17Table 5.7 UK processed poultry meat exports by destination 18 Table 5.8 EU exports of fresh/frozen poultry meat by destination 18
Chapter 6 - Consumption 19Table 6.1 UK per capita consumption of major meats 19Table 6.2 GB retail chicken and egg value by type of outlet 19Figure 6.1 Trends in GB household chicken purchases by volume 20Figure 6.2 Trends in GB household egg purchases by volume 20Figure 6.3 Change in GB retail volume and value sales of chicken by product, 2016 21Figure 6.4 GB volume sales of chicken by product, 2016 21Figure 6.5 Change in GB retail volume and value sales of eggs, 2016 22Figure 6.6 Volume sales of eggs, 2016 22Figure 6.7 Average GB retail price of chicken cuts, 2016 23Figure 6.8 Average GB retail price of eggs, 2016 23Figure 6.9 Proportion of chicken products sold on promotion in GB retail outlets 24Figure 6.10 Proportion of eggs sold on promotion in GB retail outlets 24

3
Chapter 1 - Marketing Chain
‘000 tonnes 2012 2013 2014 2015 2016
roduction 1 0 1 1 1 1 1 1 0
Im orts (b) 1 2 2 9 2 1 012
orts (b) 334 2 323 335
Total consumption 2 091 2 10 2 1 0 2 9 2
Sel su ciency ( ) 77 9 77 74 72
Million dozen 2011 2012 2013 2014 2015*roduction
( or human consum tion) 21 9 29 9
Sold in shell 5 95 95 29
rocessed 15 143 134 144 137
Im orts (a) 12 1 153 15 1
orts (a) 11 19 23 11 9
Total consumption 9 9 1 959 9 1 02
Sel su ciency ( ) 5 5 5
Table 1.1 UK poultry meat supply balance (a)
Table 1.2 UK eggs supply balance
(a) ncludes poultry o als. (b) ncludes trade in salted and processed poultry meat. All data in carcase weight equivalent Source: Defra, IHS Maritime & Trade – Global Trade Atlas®/HMRC, AHDB
(a) ncludes shell egg e uivalent of whole (dried, fro en and li uid) egg, egg yolk and albumen. *Provisional Source: Defra

4
Marketing Chain
‘000 tonnes 2012 2013 2014 2015 2016
Indigenous roduction 12 0 12 92 1 2 0 1 1 92
Imports 2 92 21 5 2
orts 1 1 1 0 1 2 1 5 1 2
Total consumption 12 229 12 2 2 12 51 1 2 1 92
Sel su ciency ( ) 10 10 10 10 10
'000 tonnes 2012 2013 2014 2015 2016 (e)
Indigenous roduction 0 0 1 5 02
Imports 0 22 1 20 24
orts 235 2 9 09
Total consumption 5 0 09 2 9
Sel su ciency ( ) 10 10 10 105 105
Table 1.3 EU poultry meat supply balance (a)
Table 1.4 EU egg supply balance
(a) ncludes poultry o alsSource: EU Commission
Note: The E Commission has again revised the series compared with last year’s pocketbook. All data is in whole egg equivalent and consumption includes hatching eggs (e) estimate Source: EU Commission

5
Chapter 2 - Poultry Numbers
Figure 2.1 Density of poultry flock, June 2013
Data covers commercial holdings only.Source: Defra
Po ul try density(po ul try per square km)
Under 20
20-9 9
100-4 9 9
500-9 9 9
1000+
Orkney and Shetlands

Poultry Numbers
Million head (a) 2012 2013 2014 2015 2016
Total poultry 160 163 170 168 173
otal breeding and laying owl 47 47 50 51
ens and ullets laying eggs for eating 37 37 37
otal breeding oc 10 11 11 13 13
able chic ens (broilers) 10 105 110 10 111
Other poultry 11 11 11 11 11
ur eys 4 4 4 4 4
Table 2.1 UK poultry numbers, June survey
(a) Due to production cycles, subgroups within the poultry population are often volatile as the ‘point in time’ nature of the June Survey can lead to large variations in the numbers in each category Source: Defra
Million head 2012 2013 2014 2015 2016*
ommercial broilers 91 9 9 9 2 1 012
ommercial layers 35 34 35
ur eys (a) 1 17 1 1 1
emale broiler breeders (b) 7 7 9 9
Table 2.2 UK chick and poult placings
*53-week statistical year (a) Including female breeder poults (b) emale parents only. Excludes grandparent chicks and by-product’ chicks. ncludes imported female parent chicks. Source: Defra

7
Chapter 3 - Slaughterings and Production
Million head Broilers Boiling Fowl Turkeys
2000 0 27
2005 2 19
2010 41 1
201 900 42 15
2015 95 45 17
201 99 57 1
‘000 tonnes Broilers Boiling Fowl Turkey Ducks Total
2000 1 1 52 2 41 1 519
2005 1 2 2 51 192 37 1 5
2010 1 2 53 1 2 0 1 5
201 1 5 172 32 1
2015 1 5 5 1 1 29 1 1
201 1 515 2 1 0 1 9
Table 3.1 UK poultry slaughterings
Table 3.2 UK poultry meat production (a)
*53-week statistical year Boiling fowl includes spent hens and spent breeders Source: Defra
*53-week statistical year (a) Excludes other bird types, eg geese Source: Defra

Slaughterings and Production
Figure 3.1 UK broiler meat production
Figure 3.2 Average liveweight of broilers in England and Wales
*53-week statistical yearSource: Defra
*53-week statistical yearSource: Defra
1,163
1,2821,323
1,383
1,4561,515
1,000
1,100
1,200
1,300
1,400
1,500
1,600
2000 2005 2010* 2014 2015 2016*
‘000 tonnes
2.21
2.24
2.21
2.232.22 2.21
2.10
2.12
2.14
2.16
2.18
2.20
2.22
2.24
2.26
2000 2005 2010* 2014 2015 2016*
kg

9
Slaughterings and Production
'000 cases Total Enriched Cage Barn Free
Range Organic
2000 22 0 1 1 1 5 59 n/a
2005 2 5 15 55 1 5 2 n/a
2010 2 0 1 522 1 11 2 92
201 2 09 1 09 2 11 591 2
2015 2 1 1 0 5 12 2
201 2 12 1 2 1 5 19
Tonnes Liquid Egg Hard Boiled* Other* Total
2000 5 022 N/A 1 5 91
2005 0 2 9 1 0 120 5
2010 59 1 9
201 910 9 101
2015 2 1 50 99
201 11 2 2 100
Table 3.3 UK egg packing station throughput
Table 3.4 UK production of egg products by processors
1 case = 360 eggs n/a = Not available Source: Defra
* = combined from 2010 onwards Source: Defra

10
40
50
60
70
80
90
100
110
Qtr 1 2012 Qtr 1 2013 Qtr 1 2014 Qtr 1 2015 Qtr 1 2016
p/dozen
All types Enriched Free range
54
83
71
Slaughterings and Production
Figure 3.3 EU broiler meat production, 2016
Figure 3.4 EU egg production for human consumption, 2016
Source: EU Commission
Source: EU Commission
1,834
1,471
1,285 1,2541,134 1,080
980
390 364
1,897
0
500
1,000
1,500
2,000
Oth
ers
Rom
ania
Hun
gary
Italy
Net
herla
nds
Fran
ce
Spai
n
Denm
ark
Uni
ted
King
dom
Pola
nd'000 tonnes
872805 800 773
671 638516
345
1,334
0
200
400
600
800
1,000
1,200
1,400
Oth
ers
Rom
ania
Pola
nd
Net
herla
nds
Uni
ted
King
dom
Spai
n
Denm
ark
Italy
Fran
ce
‘000 tonnes

11
Chapter 4 - Poultry and Egg Prices
Pence per dozen Total Enriched
cage Barn Free Range Organic
2000 9 32.3 2
2005 45.7 34.4 52 0 9
2010 0 1 5 72.2 135.5
201 1 c 100 1 c
2015 2 1 1 c 9 c
201 1 0 54.5 c c
Table 4.1 Average UK egg packer price paid to producers
Figure 4.1 uarterly average UK egg packer price paid to producers
Data covers all Class A eggs passed over a grader, including seconds. Prices include bonus payments from 2012. rom 200 the average total types price includes organic eggs.c confidential Source: Defra
Source: Defra
40
50
60
70
80
90
100
110
Qtr 1 2012 Qtr 1 2013 Qtr 1 2014 Qtr 1 2015 Qtr 1 2016
p/dozen
All types Enriched Free range
54
83
71

12
271
298
262
238229
219 225236 237
100
150
200
250
300
2012 2013 2014 2015 2016Qtr 1 Qtr 2 Qtr 3 Qtr 4
£/tonne
80
90
100
110
120
130
140
150
160
170
Jan 12 Jul 12 Jan 13 Jul 13 Jan 14 Jul 14 Jan 15 Jul 15 Jan 16 Jul 16 Jan 17
p/kg
UK EU
105
93
Poultry and Egg Prices
Figure 4.2 UK wholesale chicken prices
Figure 4.3 EU and UK broiler meat wholesale market price
Source: London wholesale market
is fresh broiler price, E is mixture of fresh and fro en Source: EU Commission, London Wholesale Market
50
100
150
200
250
300
350
400
Jan 12 Jul 12 Jan 13 Jul 13 Jan 14 Jul 14 Jan 15 Jul 15 Jan 16 Jul 16 Jan 17
p/kg
Fresh broiler: 1.35kg–1.55kg Fresh skinless breast filletsFresh skinless breast fillets (calibrated) Frozen broiler: 1.15kg–2.05kg
370
155128
100
110
120
130
140
150
160
170
180
Jan 12 Jul 12 Jan 13 Jul 13 Jan 14 Jul 14 Jan 15 Jul 15 Jan 16 Jul 16 Jan 17
p/kg
EUUK
147
150

13
271
298
262
238229
219 225236 237
100
150
200
250
300
2012 2013 2014 2015 2016Qtr 1 Qtr 2 Qtr 3 Qtr 4
£/tonne
80
90
100
110
120
130
140
150
160
170
Jan 12 Jul 12 Jan 13 Jul 13 Jan 14 Jul 14 Jan 15 Jul 15 Jan 16 Jul 16 Jan 17
p/kg
UK EU
105
93
Poultry and Egg Prices
Figure 4.4 EU and UK egg (large and medium) wholesale market price
Source: EU Commission
Figure 4.5 Average poultry compound feed price, GB
Source: Defra
50
100
150
200
250
300
350
400
Jan 12 Jul 12 Jan 13 Jul 13 Jan 14 Jul 14 Jan 15 Jul 15 Jan 16 Jul 16 Jan 17
p/kg
Fresh broiler: 1.35kg–1.55kg Fresh skinless breast filletsFresh skinless breast fillets (calibrated) Frozen broiler: 1.15kg–2.05kg
370
155128
100
110
120
130
140
150
160
170
180
Jan 12 Jul 12 Jan 13 Jul 13 Jan 14 Jul 14 Jan 15 Jul 15 Jan 16 Jul 16 Jan 17
p/kg
EUUK
147
150

14
Chapter 5 - Imports and Exports
Table 5.1 UK egg trade by volume
Table 5.2 Volume and value of UK poultry meat imports
‘000 cases 2012 2013 2014 2015 2016 (e)
ImportsShell eggs 2 2 1 1 1 1 51 1 5 1 1 2
gg roducts 15 2 1 2 5 1 5 Total 5,438 5,099 5,263 5,836 5,548
ExportsShell eggs 2 9 2 0 243 1 1 25
gg roducts 129 145 1 0 111 10Total 398 425 383 293 362
Tonnes, product weight 2012 2013 2014 2015 2016
Fresh/frozen poultry (inc offals) 2 0 12 0 0 022 9 9
Salted oultry 9 9 10 5 09 0 90 0 100
rocessed oultry 292 2 291 19 05 9 02 1
Total 717,794 724,619 769,824 837,214 907,820
£’000 2012 2013 2014 2015 2016
Fresh/frozen poultry (inc offals) 9 1 95 9 1 020 95 1 0 5 501 1 120
Salted oultry 5 009 10 090 11 1 112 0 10 910
rocessed oultry 02 25 1 91 9 2 9 2
Total 1,823,629 1,908,308 2,022,987 2,061,766 2,211,644
1 case 3 0 eggs. All data converted to shell egg e uivalent. (e) estimate Source: Defra
Source: IHS Maritime & Trade – Global Trade Atlas®/HMRC

15
Imports and Exports
Table 5.3 Volume and value of UK poultry meat exports
Table 5.4 UK fresh/frozen poultry meat imports by source
Source: IHS Maritime & Trade – Global Trade Atlas®/HMRC
Note: ncludes o als. Source: IHS Maritime & Trade – Global Trade Atlas®/HMRC
Tonnes, product weight 2012 2013 2014 2015 2016
resh ro en oultry (inc offals) 2 9 2 1 1 51 05 299 515 295 0
Salted oultry 2 929 2 11 5 1 1
rocessed oultry 5 50 2 5 51 9 1
Total 338,566 387,180 402,986 347,755 338,208
£’000 2012 2013 2014 2015 2016
resh ro en oultry (inc offals) 2 9 29 2 29 00 2 02 2 900
Salted oultry 5 59 5 21
rocessed oultry 1 5 12 1 5 92 11 101 10 09
Total 418,217 461,577 440,385 356,793 349,930
Tonnes, product weight 2012 2013 2014 2015 2016
Total 382,067 383,812 407,833 440,022 478,979
etherlands 1 0 9 0 1 19 1 9 192 0 202 5
oland 1 51 55 5 10 5
Ireland 2 9 25 5 5 15 1 055
elgium 2 00 25 0 0 09 5 29
ermany 25 9 9 2 1 0 1 1 0 1 09
Italy 1 9 12 9 10 5 15 1 1 29
Romania 0 052 901 10 5 9 1 25
France 1 1 22 1 10 2 12 2 9
Spain 1 2 005 19 11 09
Tonnes, product weight 2012 2013 2014 2015 2016
Fresh/frozen poultry (inc offals) 2 0 12 0 0 022 9 9
Salted oultry 9 9 10 5 09 0 90 0 100
rocessed oultry 292 2 291 19 05 9 02 1
Total 717,794 724,619 769,824 837,214 907,820
£’000 2012 2013 2014 2015 2016
Fresh/frozen poultry (inc offals) 9 1 95 9 1 020 95 1 0 5 501 1 120
Salted oultry 5 009 10 090 11 1 112 0 10 910
rocessed oultry 02 25 1 91 9 2 9 2
Total 1,823,629 1,908,308 2,022,987 2,061,766 2,211,644

1
Imports and Exports
Table 5.5 UK fresh/frozen poultry meat exports by destination
Table 5.6 UK processed poultry meat imports by source
Note: ncludes o als. Source: IHS Maritime & Trade – Global Trade Atlas®/HMRC
Source: IHS Maritime & Trade – Global Trade Atlas®/HMRC
Tonnes, product weight 2012 2013 2014 2015 2016
Total 292,288 291,197 305,893 336,802 368,741 2 12 00 1 1 1 2 95 159 5 1 0
etherlands 1 0 2 12 9 2 9 9 Ireland 2 5 9 00 29 9 0 1 1 5 9
oland 11 9 9 1 1 25 2 91 ermany 15 0 1 5 1 2 25 5 2 0
France 9 01 11 11 11 5 11 99 1 19 elgium 59 5 02 9 552
hailand 1 9 11 51 12 50 12 22 1 1 0 ra il 21 5 29 00 0 1 2 229 15 hina 00 9 22 9 5 110
Tonnes, product weight 2012 2013 2014 2015 2016
Total 289,787 342,161 351,058 299,515 295,806 2 20 52 2 9 115 2 19 2 0 9 199 2 1
etherlands 100 521 10 91 9 5 10 Ireland 5 1 5 199 France 1 5 21 0 21 911 22 5 2 1 1
ermany 15 2 19 9 22 02 2 102 22 Spain 1 029 1 020 12 5 1 0 12 9
elgium 2 1 22 11 5 9 9 0 509 oland 1 5 021 2 1 2 00 1 5
South Africa 2 02 1 01 1 15 Hong Kong 25 9 20 25 11 1 1 5

17
Imports and ExportsR
egio
nE
U
Non
EU
Figu
re 5
.1 M
ap o
f UK
fres
h/fr
ozen
pou
ltry
mea
t exp
orts
by
dest
inat
ion
Not
e: T
he a
bove
map
sho
ws
coun
trie
s th
e U
K e
xpor
ted
fres
h/fr
ozen
pou
ltry
mea
t to
in 2
016
acco
rdin
g to
IHS
Mar
itim
e &
Tra
de –
Glo
bal T
rade
Atla
s®/H
M R
even
ue &
Cus
tom
s.
The
web
site
bel
ow p
rovi
des
guid
ance
on
expo
rtin
g, in
clud
ing
a lis
t of E
xpor
t Hea
lth C
ertif
icat
es (
EH
C)
avai
labl
e:
http
s://w
ww
.gov
.uk/
guid
ance
/exp
ortin
g-liv
e-an
imal
s-or
-ani
mal
-pro
duct
s-to
-non
-eu-
coun
trie
s
Sour
ce:
IHS
Mar
itim
e &
Tra
de –
Glo
bal T
rade
Atla
s®/H
M R
even
ue &
Cus
tom
s
Figure 5.1 Map of UK fresh frozen poultry meat exports by destination
Not
e: th
e ab
ove
map
sho
ws
coun
tries
the
exp
orte
d fre
sh/fr
oen
pou
ltry
to in
201
acc
ordi
ng to
HS
ariti
me
Tra
de -
loba
l Tr
ade
Atla
s®/H
M R
even
ue &
Cus
tom
sTh
e w
ebsit
e, h
ttp://
ww
w.u
kecp
.com
, pro
vides
gui
danc
e on
exp
ortin
g, in
clud
ing
a lis
t of E
xpor
t Hea
lth C
ertifi
cate
s (E
HC
) ava
ilabl
e.So
urce
: IH
S M
ariti
me
& Tr
ade
- Glo
bal T
rade
Atla
s®/H
M R
even
ue &
Cus
tom
s

1
Imports and Exports
Table 5.7 UK processed poultry meat exports by destination
Table 5.8 EU exports of fresh/frozen poultry meat by destination
Source: IHS Maritime & Trade – Global Trade Atlas®/HMRC
Source: IHS Maritime & Trade – Global Trade Atlas®/Eurostat
Tonnes, product weight 2012 2013 2014 2015 2016
Total 45,850 42,586 48,517 44,669 38,661
Ireland 25 59 22 159 22 12 20 5 1 9
etherlands 5 5 2 9 299 90
ermany 5 9 2 2 5 05 5 25 2
Tonnes, product weight 2012 2013 2014 2015 2016
Total 1,236,838 1,231,484 1,294,614 1,301,541 1,411,771South Africa 129 90 150 99 195 0 209 259 0Saudi rabia 1 25 15 51 121 1 1 1 5 120 5
enin 1 1 10 1 2 0 1 55 115 21Hong Kong 109 11 101 5 5 120 0 025 10 0 5
hili ines 22 1 2 0 9 2 9raine 250 5 2 5 125 2 2
hana 951 2 95 5 11 0 111ongo em e 050 2 0 2 9 2 525
Vietnam 1 11 51 1 0 2 9 5abon 25 01 2 9 2 2 1 1ongo 1 95 22 10 2 299 5 1 0
Malaysia 2 99 2 9 9 25 1 9 2 29 0acedonia 2 1 0 1 2 2 1 2 9 2 901
Liberia 11 0 1 9 12 5 20 2 2 5Togo 1 1 0 1 2 20 5 21
hina 10 115 1 19 1 22 10 21 5

19
Chapter 6 - Consumption
Source: antar orldPanel
Table 6.1 UK per capita consumption of major meats
kg/person/year Poultry meat Pig meat Beef & veal Total meat
2000 0 5 2 1 5 9 22005 1 24.7 20200 31.2 2 9 20 9 2200 0 0 25.7 20 9 2200 29 5 24.5 20 0 0 02009 29 9 24.3 1 2 92010 1 24.1 1 92011 32.7 2 1 1 0 02012 2 2 1 0 9201 2 2 9 17.3201 0 24.4 1 92015 1 25.1 1 2201 37.3 2 2 1 2
Supplies available for consumption. All data in carcase weight e uivalent. Source: AHDB Calculations based on data from Defra, HMRC, ONS
Table 6.2 GB retail chicken and egg value by type of outlet
Data covers 52 weeks ending early January of the following year Source: antar orldPanel
% Multiples Freezer centres Butchers Other
Chicken
201 5 0 0 3.1
2015 5.1 3.2
201 5 5 0 9 3.7
Eggs
201 5.3 1.4 5
2015 1 5.2 1.2 5.5
201 9 0 4.5 1.1 5.4

20
9.8
2.2
13.9
30.7
-2.3
29.1
-11.5
11.7
-1.4
2.3
-1.8
1.7
26.7
-5.9
22.1
-14.1
5.6
-2.4
-20Fresh
BreastsFreshWhole
FreshLeg
FreshRoll/Roast
FrozenBreast
FrozenWhole
FrozenLeg
FrozenRoll/Roast
SlicedCooked
-15-10-505
101520253035
yoy % change
Volume Value
151,168
217,777
89,217
3,625
42,228
1,883 4,531 4,86022,808
0
50,000
100,000
150,000
200,000
250,000
FreshBreasts
FreshWhole
FreshLeg
FreshRoll/Roasts
FrozenBreasts
FrozenWhole
FrozenLeg
FrozenRoll/Roast
SlicedCooked
Tonnes
Consumption
Figure 6.1 Trends in GB household chicken purchases by volume
Figure 6.2 Trends in GB household egg purchases by volume
570,000
580,000
590,000
600,000
610,000
620,000
630,000
31Jan
28Feb
27Mar
24Apr
22May
19Jun
17Jul
14Aug
11Sep
09Oct
06Nov
04Dec
01Jan
2014 2015 2016
Tonnes
Note: Figures include ‘Ready to cook’ and ‘Chilled main meal accompaniment’ productsSource: antar orldPanel
Source: antar orldPanel
‘000s
5,000,000
5,100,000
5,200,000
5,300,000
5,400,000
5,500,000
5,600,000
5,700,000
5,800,000
5,900,000
2014 2015 2016
31Jan
28Feb
27Mar
24Apr
22May
19Jun
17Jul
14Aug
11Sep
09Oct
06Nov
04Dec
01Apr
52 wee s ending
52 wee s ending

21
Consumption
Figure 6.3 Change in GB retail volume and value sales of chicken by product, 2016
Figure 6.4 GB volume sales of chicken by product, 2016
Source: antar orldPanelData covers 52 weeks ending early January of the following year
Source: antar orldPanelData covers 52 weeks ending 1 January 2017
9.8
2.2
13.9
30.7
-2.3
29.1
-11.5
11.7
-1.4
2.3
-1.8
1.7
26.7
-5.9
22.1
-14.1
5.6
-2.4
-20Fresh
BreastsFreshWhole
FreshLeg
FreshRoll/Roast
FrozenBreast
FrozenWhole
FrozenLeg
FrozenRoll/Roast
SlicedCooked
-15-10-505
101520253035
yoy % change
Volume Value
151,168
217,777
89,217
3,625
42,228
1,883 4,531 4,86022,808
0
50,000
100,000
150,000
200,000
250,000
FreshBreasts
FreshWhole
FreshLeg
FreshRoll/Roasts
FrozenBreasts
FrozenWhole
FrozenLeg
FrozenRoll/Roast
SlicedCooked
Tonnes
Figure 6.1 Trends in GB household chicken purchases by volume
Figure 6.2 Trends in GB household egg purchases by volume

22
6.53
2.68 3.03
8.12
3.81
2.23 2.01
4.82
6.77
0
1
2
3
4
5
6
7
8
9£/kg
FreshBreasts
FreshWhole
FreshLeg
FreshRoll/Roast
FrozenBreast
FrozenWhole
FrozenLeg
FrozenRoll/Roast
SlicedCooked
10
17
33
9
0
5
10
15
20
25
30
35
Barn Free RangeNon-organic
Free RangeOrganic
Non-free Range
Pence/egg
Consumption
Figure 6.5 Change in GB retail volume and value sales of eggs, 2016
Figure 6.6 Volume sales of eggs, 2016
Data covers 52 weeks ending early January of the following year Source: antar orldPanel
Data covers 52 weeks ending 1 January 2017. Source: antar orldPanel
-30.2
11.616.4
-1.8
-29.5
9.6 7.3
-6.0
-35-30-25-20-15-10-505
101520
Barn Free Range Non-organic
Free Range Organic Non-free Range
yoy % change
Volume Value
Barn Free Range Non-organic
Free Range Organic
Non-free Range
111,489
3,263,341
80,197
2,386,518
0
500,000
1,000,000
1,500,000
2,000,000
2,500,000
3,000,000
3,500,000
‘000 eggs

23
Consumption
Figure 6.7 Average GB retail price of chicken cuts, 2016
Figure 6.8 Average GB retail price of eggs, 2016
Data covers 52 weeks ending 1 January 2017. Source: antar orldPanel
Data covers 52 weeks ending 1 January 2017. Source: antar orldPanel
6.53
2.68 3.03
8.12
3.81
2.23 2.01
4.82
6.77
0
1
2
3
4
5
6
7
8
9£/kg
FreshBreasts
FreshWhole
FreshLeg
FreshRoll/Roast
FrozenBreast
FrozenWhole
FrozenLeg
FrozenRoll/Roast
SlicedCooked
10
17
33
9
0
5
10
15
20
25
30
35
Barn Free RangeNon-organic
Free RangeOrganic
Non-free Range
Pence/egg
24
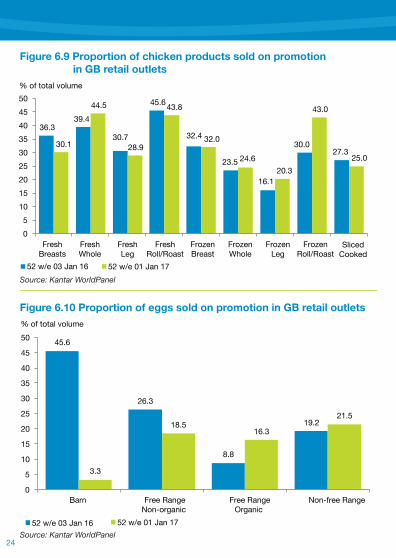
Figure 6.9 Proportion of chicken products sold on promotion in GB retail outlets
Figure 6.10 Proportion of eggs sold on promotion in GB retail outlets
36.339.4
30.7
45.6
32.4
23.5
16.1
30.027.3
30.1
44.5
28.9
43.8
32.0
24.620.3
43.0
25.0
05
101520253035404550% of total volume
52 w/e 03 Jan 16 52 w/e 01 Jan 17
FreshBreasts
FreshWhole
FreshLeg
FreshRoll/Roast
FrozenBreast
FrozenWhole
FrozenLeg
FrozenRoll/Roast
SlicedCooked
Source: antar orldPanel
Source: antar orldPanel
45.6
26.3
8.8
19.2
3.3
18.516.3
21.5
0
5
10
15
20
25
30
35
40
45
50
Barn Free RangeNon-organic
Free RangeOrganic
Non-free Range
% of total volume
52 w/e 03 Jan 16 52 w/e 01 Jan 17

44
Agriculture and Horticulture Development Board Stoneleigh Park Kenilworth Warwickshire CV8 2TL Tel: 024 7669 2051 www.ahdb.org.uk
© Agriculture and Horticulture Development Board 2017. All rights reserved.
While the Agriculture and Horticulture Development Board seeks to ensure that the information contained within this document is accurate at the time of publication, no warranty is given in respect thereof and, to the maximum extent permitted by law, the Agriculture and Horticulture Development Board accepts no liability for loss, damage or injury howsoever caused (including that caused by negligence) or suffered directly or indirectly in relation to information and opinions contained in or omitted from this document.
Cover Images:Hens - Vladimir Voronchenko/Shutterstock.com
ISBN 978-1-904437-97-0