potential for electrical power generation using forest
TRANSCRIPT

Purdue UniversityPurdue e-Pubs
Open Access Theses Theses and Dissertations
2013
Potential for electrical power generation usingforest wood biomass in rural areas of CataloniaArnau GonzalezPurdue University, [email protected]
Follow this and additional works at: https://docs.lib.purdue.edu/open_access_theses
Part of the Chemical Engineering Commons, Electrical and Computer Engineering Commons,and the Sustainability Commons
This document has been made available through Purdue e-Pubs, a service of the Purdue University Libraries. Please contact [email protected] foradditional information.
Recommended CitationGonzalez, Arnau, "Potential for electrical power generation using forest wood biomass in rural areas of Catalonia" (2013). Open AccessTheses. 53.https://docs.lib.purdue.edu/open_access_theses/53

Graduate School ETD Form 9 (Revised 12/07)
PURDUE UNIVERSITY GRADUATE SCHOOL
Thesis/Dissertation Acceptance
This is to certify that the thesis/dissertation prepared
By
Entitled
For the degree of
Is approved by the final examining committee:
Chair
To the best of my knowledge and as understood by the student in the Research Integrity and Copyright Disclaimer (Graduate School Form 20), this thesis/dissertation adheres to the provisions of Purdue University’s “Policy on Integrity in Research” and the use of copyrighted material.
Approved by Major Professor(s): ____________________________________
____________________________________
Approved by: Head of the Graduate Program Date
Arnau Gonzalez
Potential for electrical power generation using forest wood biomass in rural areas of Catalonia
Master of Science
Michael J. Dyrenfurth
Robert J. Herrick
Nathan S. Mosier
Jordi Riba
Michael J. Dyrenfurth
Kathryne A. Newton 04/10/2013

POTENTIAL FOR ELECTRICAL POWER GENERATION USING FOREST WOOD BIOMASS IN RURAL AREAS OF CATALONIA
A Thesis
Submitted to the Faculty
of
Purdue University
by
Arnau González Juncà
In Partial Fulfillment of the
Requirements for the Degree
of
Master of Science
May 2013
Purdue University
West Lafayette, Indiana

ii
ii
To my wife, Noelia – she is there whenever my mood wavers
Your love drives me to get the best of me

iii
iii
ACKNOWLEDGEMENTS
I would like to thank my chair, Dr. Michael Dyrenfurth, for his useful and
continued guidance and advice. I also would thank my co-chair, Dr. Jordi Riba for
giving me help and support regardless of the distance.
To everybody that made the Atlantis program possible, I thank them for giving
me the opportunity of having this fruitful experience.

iv
iv
TABLE OF CONTENTS
Page
LIST OF TABLES ................................................................................................ vii
LIST OF FIGURES ...............................................................................................ix
LIST OF ABBREVIATIONS ..................................................................................xi
ABSTRACT ........................................................................................................ xiii
CHAPTER 1 INTRODUCTION ........................................................................ 1
1.1 Statement of the problem .............................................................. 2
1.2 Significance of the problem ........................................................... 5
1.3 Statement of purpose .................................................................... 6
1.4 Research questions ....................................................................... 6
1.5 Scope ............................................................................................ 6
1.6 Assumptions .................................................................................. 7
1.7 Delimitations .................................................................................. 8
1.8 Limitations ..................................................................................... 8
1.9 Definitions ...................................................................................... 9
1.10 Summary ..................................................................................... 13
CHAPTER 2 LITERATURE REVIEW ................................................................. 14
2.1 Methodology for the review of the literature ................................. 15
2.2 Biomass as an energy source for the future ................................ 16
2.3 Biomass types and availability ..................................................... 18
2.4 Biomass conversion technologies ............................................... 20

v
v
Page
2.4.1 Primary conversion technologies .......................................... 21
2.4.2 Secondary conversion technologies ...................................... 29
2.5 Summary ..................................................................................... 39
CHAPTER 3 FRAMEWORK AND METHODOLOGY .................................... 42
3.1 Study Context .............................................................................. 43
3.1.1 Population, Stratum and Sample ........................................... 43
3.1.2 Technologies to assess ......................................................... 44
3.2 Methodology description .............................................................. 45
3.2.1 Biomass resource availability ................................................ 45
3.2.2. Selection of most suitable conversion technology ................. 47
3.2.3 Potential for electricity production in the area of study .......... 48
3.3 Methodology overview ................................................................. 49
CHAPTER 4 DATA ANALYSIS, CALCULATIONS AND FINDINGS ............. 51
4.1 Population and Sample ............................................................... 51
4.1.1 Territorial organization of Spain ............................................ 52
4.1.2 Spanish climates ................................................................... 58
4.1.3 Validity and reliability ............................................................. 59
4.1.4 Summary ............................................................................... 60
4.2 Amount and characteristics of available resource ....................... 60
4.2.1 Wood biomass studied .......................................................... 61
4.2.2 Types of forest found in the region of study .......................... 62
4.2.3 Annual growth rate ................................................................ 69
4.2.4 Heating value of existing biomass ......................................... 74
4.2.5 Amount and chemical energy of yearly available resource ... 78
4.2.6 Summary ............................................................................... 79
4.3 Technology selection ................................................................... 80
4.3.1 Assessment of current efficiencies of available technologies 80
4.3.2 Selection of a tentative power output .................................... 84
4.3.3 Technology selection and average efficiency ........................ 85

vi
vi
Page
4.3.4 Validity and reliability ............................................................. 86
4.3.5 Summary ............................................................................... 87
4.4 Electricity production potential and power plant size ................... 88
CHAPTER 5 CONCLUSIONS, DISCUSSION AND RECOMMENDATIONS ..... 91
5.1 Summary of Research Questions, Methodology and Findings .... 91
5.2 Conclusions ................................................................................. 92
5.2.1 Conclusions of Research Question 1 .................................... 93
5.2.2 Conclusions of Research Question 2 .................................... 93
5.2.3 Conclusions of Research Question 3 .................................... 94
5.3 Discussion ................................................................................... 95
5.4 Recommendations for future work ............................................... 99
5.4.1 Recommendations for practice .............................................. 99
5.4.2 Recommendations for further research ................................. 99
REFERENCES ................................................................................................. 102
APPENDICES
Appendix A Forest characterization of the region of Anoia and the township of
Argençola .................................................................................. 113
Appendix B Summary of efficiencies of biomass conversion technologies ... 116
VITA ................................................................................................................. 128

vii
vii
LIST OF TABLES
Table .............................................................................................................. Page
Table 2.1 Existing types of biomass ................................................................... 19
Table 2.2 Biomass conversion primary technologies summary .......................... 21
Table 2.3 Gasification technologies summary .................................................... 24
Table 2.4 Biomass conversion secondary technologies summary ..................... 29
Table 4.1 Forest area data for the comarca of Anoia ......................................... 54
Table 4.2 Forest area data for the municipi of Argençola ................................... 57
Table 4.3 Main characteristics of the selected sample, municipi of Argençola ... 60
Table 4.4 Annual growth rates of predominant trees in the comarca of Anoia ... 70
Table 4.5 Yearly growth rate of some tree species ............................................. 72
Table 4.6 Gross calorific value, water content and net calorific value of different
wood biofuels .................................................................................... 77
Table 4.7 Outcomes of the resource assessment step ....................................... 80
Table 4.8 Outcomes of the technology selection step ........................................ 88
Table 4.9 Input data to calculate the electricity production potential................... 88
Table 4.10 Electricity production potential of the sample and optimal power plant
size .................................................................................................... 90

viii
viii
Appendix Table ............................................................................................... Page
Table A 1 Area covered by the different kinds of trees in the comarca of Anoia
and actual number of trees sampled ............................................... 113
Table A 2 Area covered by the different kinds of trees in the municipi of
Argençola ........................................................................................ 115
Table B 1 Power plant location and size, electrical efficiency, conversion
technology and fuel used and reference of different real biomass-
based power plants ......................................................................... 117

ix
ix
LIST OF FIGURES
Figure ............................................................................................................. Page
Figure 1.1 Electricity generation in Spain by source, 2009 ................................... 3
Figure 2.1 Venn diagram of studied concepts .................................................... 16
Figure 2.2 Schematic diagram of the three types of fixed-bed gasifiers: a: updraft;
b: downdraft; and c: cross-flow ........................................................ 26
Figure 2.3 Schematic diagram of the two types of fluidized-bed gasifiers: a:
bubbling fluidized bed; b: circulating fluidized bed ........................... 28
Figure 3.1 Flow chart summarizing the methodology ......................................... 50
Figure 4.1 Political organization of Spain ........................................................... 52
Figure 4.2 Regions constituting Catalonia .......................................................... 54
Figure 4.3 Rural, semi-urban and urban townships in Anoia .............................. 56
Figure 4.4 Climate areas by geography .............................................................. 59
Figure 4.5 Pinus halepensis ............................................................................... 63
Figure 4.6 Pinus nigra ........................................................................................ 63
Figure 4.7 Pinus pinea ........................................................................................ 64
Figure 4.8 Quercus pubescens ........................................................................... 64
Figure 4.9 Quercus ilex ...................................................................................... 65
Figure 4.10 Relative importance of tree species in the comarca of Anoia .......... 67
Figure 4.11 Relative importance of tree species in the municipi of Argençola .... 68
Figure 4.12 Summary of electrical efficiencies (%) against power output (MWe)82
Figure 4.13 Summary of electrical efficiencies (%) of small-scale existing power
plants against power output (kWe) .................................................. 83
Figure 4.14 Summary of electrical efficiencies (%) of micro-scale existing power
plants against power output (kWe) .................................................. 83

x
x
Appendix Figure ............................................................................................. Page
Figure A 1 Relative importance of each tree species in Anoia, forest area basis
........................................................................................................ 114
Figure A 2 Relative importance of each tree species in Anoia, number of trees
basis ................................................................................................ 114
Figure A 3 Relative importance of each tree species in Argençola, forest area
basis ................................................................................................ 115

xi
xi
LIST OF ABBREVIATIONS
ηe ................ electrical efficiency
ηth ............... thermal efficiency
ηtot ............... overall efficiency
ACw ............. ash content of wet biomass
CO2 ............. carbon dioxide
GJ ............... GigaJoules
Hdaf ............. hydrogen content of dry ash free biomass
HHVdaf ......... HHV of dry ash free biomass
kg ................ kilogram
kWe ............ kiloWatts of electric power
kWth ........... kiloWatts of thermal power
kWhe .......... kiloWatts hour of electric energy
kWhth ......... kiloWatts hour of thermal energy
LHVar .......... LHV of biomass “as received”, i.e. with moisture and ash content.
LHVdaf ......... LHV of dry ash free biomass
LHVw ........... LHV of wet biomass
MCw ............ moisture content of wet biomass

xii
xii
MJ ............... megaJoules
MWe ........... megaWatts of electric power
MWth .......... megaWatts of thermal power
MWhe ......... megaWatts hour of electric energy
MWhth ........ megaWatts hour of thermal energy
tn ................ metric tons

xiii
xiii
ABSTRACT
Gonzalez Junca, Arnau. M.S., Purdue University, May 2013. Potential for Electrical Power Generation Using Forest Wood Biomass in Rural Areas of Catalonia. Major Professor: Michael J. Dyrenfurth. Biomass is a renewable energy source that has been used for many years.
However, its usage as an electricity source in Spain is not well developed due to
many causes, among which highlights the lack of knowledge about the available
technical potential. This research sought to close this gap assessing the
technical potential for electricity generation using forest wood biomass in rural
areas of Catalonia. The study characterizes the amount and type of biomass
available in Catalonian forests that can be used to produce electricity without
going beyond the capacity of regeneration of the forest, as well as the state-of-
the-art efficiencies for commercially available biomass conversion to electricity
technologies. The main outcomes of this research include the choice of a
suitable technology and the evaluation of the technical potential for electricity
generation in a sample of a rural Catalonian township. In particular, it was found
that the forests of rural Catalonia yearly produce about 1.6 metric tons of
biomass per hectare, with a heating value of 12.8 GJ per ton at 30% of moisture
content.

xiv
xiv
To take advantage from such resource it was found that, given the amount of
available resource, nowadays the most efficient technology is the internal
combustion engine (ICE) coupled to a biomass gasification unit, with an electrical
efficiency around 25%. However it was observed that this choice is linked to the
scale of generation and, thereby, for larger amounts of biomass other
technologies such as gas or steam turbines could perform better. To improve the
efficiency of biomass usage, combined heat and power opportunities should be
sought. Therefore, it is strongly recommended to study the possibilities of
cogeneration in rural areas of Catalonia, looking for potential applications for the
excess heat produced during the electricity generation process. Another aspect
that requires additional work is the environmental and economic evaluation of the
technologies to support a more informed choice of technology.
In addition to these relevant outcomes, applicable to similar regions in terms of
area and type of forests, this research also ended up with the development of a
methodology that can be used to find out the best option to take advantage of
forest wood biomass resources in other regions.

1
1
CHAPTER 1. INTRODUCTION
Electricity is one of the most essential commodities in our society. Its
advantages are widely known, but so are its drawbacks. Among them, stands the
CO2 emissions caused by fossil fuel burning that are the main cause of climate
change (Prentice, et al., 2001) as 70% of all greenhouse gas emissions are
caused by the energy sector (Höök & Tang, 2013).
In order to reduce the rate of CO2 emissions, the electricity generation
industry has turned to renewable energy technologies for electricity production.
There are many different alternatives such as solar and wind among others.
However, the main disadvantage of these technologies is that their supply can
only be predicted rather than controlled, so these energy sources required
backup generation plants to counteract those hours when the resource is not
available.
In contrast, biomass is a storable renewable source that permits a
controllable supply, making it a key alternative for the future electricity generation
scheme. In addition, biomass conversion technologies using forest woods could
help to improve the forest management strategies and reduce the risk of forest
wild fires.

2
2
However, due to the lack of technical and feasibility studies of
implementation of these technologies, biomass is only accounting for a very
small share of the electricity supply distribution of developed countries.
The purpose of this thesis is to help to address that lack of technical studies
focusing on the evaluation of the potential capacity, not considering the economic
side, for electrical power generation using biomass-based conversion
technologies in the particular context of rural areas in Catalonia, Spain. The main
goal sought with the research is to evaluate the amount of electricity potentially
producible in a sample township from rural Catalonia using the amount of
biomass resource available within the township in a sustainable way, i.e., not
consuming more fuel than the quantity that the forest produces by itself.
An assessment of the available wood biomass in a sample township in rural
Catalonia will be performed based on information published in different
databases and articles. Then, a selection of an appropriate technology will be
made in terms of relative efficiency to later calculate how much electricity can be
generated using the available resource and the selected technology.
1.1 Statement of the Problem
Spain is one of Europe’s biggest emitters of CO2 due to its high energy
consumption and the use of mainly fossil fuels for electricity generation
(International Energy Agency, 2011), as represented in Figure 1.1. In addition,
the generalized use of fossil fuels, which are not available in Spain, increases the
energy dependency on other countries.

3
3
Figure 1.1 Electricity generation in Spain by source, 2009
In the present context of increasing prices of energy due to volatility and
rising of fossil fuel prices caused by their current depletion, and with the global
concern about CO2 emissions that result in international treaties such as the
Kyoto protocol (United Nations, 1998), more attention is being placed, not only in
Spain but also in Europe and Western countries, on the development of cleaner
alternatives to conventional energy sources. Among these alternatives, one that
is very promising is the use of biomass-based technologies to generate both
electricity and heat, due to its flexibility of use and storage, which are the main
weaknesses of renewable energy sources (Passey, Spooner, MacGill, Watt, &
Syngellakis, 2011). In addition, electricity generation plants fed with biomass can
COAL AND PEAT 13%
OIL 6%
GAS 37%
BIOFUELS 1%
WASTE 0%
NUCLEAR 18%
HYDRO 10%
SOLAR THERMAL
0%
WIND 13%
SOLAR PV 2% OTHER
SOURCES 0%
Source: Personal compilation based on International Energy Agency (2011)

4
4
serve as a backup to complement generation from renewable sources inherently
variable and unpredictable.
Among all the regions of Spain, Catalonia is one of the autonomous
communities that have more wood biomass resource available for electrical
power production within its territory (Gómez, Rodrigues, Montañés, Dopazo, &
Fueyo, 2010).
In rural areas of Catalonia, there is a missed latent potential for generating
electricity from biomass obtained from agricultural and forest waste. The lack of
studies that evaluate the technical, economic and environmental feasibility
constitutes an obstacle to the use of this energy, which would improve the energy
supply in Catalonia reducing its environmental impact and increasing the security
of supply through the use of indigenous sources.
In addition, in many rural areas of Catalonia there is a lack of forest
management as they are mainly privately-owned. This entails a high risk of wild
fires during the dry summer season in the Mediterranean area.
There are several major issues to consider when assessing whether or not
it is feasible to generate power through biomass-based technologies in Catalonia.
For example, the scale of generation, which in rural areas of Catalonia is likely to
be confined in the small- or micro-scale range due to low forest production, is an
important factor affecting the efficiency of the system. Another example is the
conversion mechanisms, because there is a wide range of different efficiencies
according to the type of technology used. Then, it is worth mention the
environmental impact of the whole process, from production to consumption

5
5
including transport and pre-treatment. Furthermore, the price of electricity
generated should be compared with existing prices and to assess if it is
economically viable at present times, if it will be viable in the near future or,
conversely, if the definitive deployment of this technology requires financial
support as feed-in tariffs or dedicated grants.
These issues are not the only ones that have to be considered to analyze
the feasibility of deployment of a renewable energy technology, but they are the
primary ones, and several technical and feasibility studies could help in these
fields to encourage renewable electricity production deployment.
1.2 Significance of the Problem
Addressing the high-carbon emission and extremely dependent from
foreign resources electricity supply is one of the major challenges of Western
developed countries such as Spain, but there are still some technical and
economic hurdles to overcome.
Knowing the available potential that Catalonia has for electricity generation
using biomass sources and the environmental and, if any, economic benefits
derived from the switch to the usage of these sources, will encourage the
installation of new electricity generation power plants as well as cogeneration
facilities for small buildings and households. The small-scale generation
deployment is a key element in the transition to the distributed generation model
that will help the implementation of the Smart Grid and the own-consumption
scheme (Monteiro, Moreira, & Ferreira, 2009).

6
6
Furthermore, through the promotion of the use of forest biomass as an
energy source, it may be given economic value to forest residues and,
consequently, improve forest management and reduce the risk of forest fires that
are very likely to happen in the dry summer season of Mediterranean areas.
1.3 Statement of Purpose
The purpose of this thesis was to establish the potential, not considering
economic and long-term maintenance, for small-scale electrical power generation
from biomass-based conversion technologies in a rural Catalonia sample
township.
1.4 Research Questions
To achieve the purpose, the researcher addressed the following research
questions:
How much forest wood biomass is available in a sample township in rural
Catalonia?
What is the most suitable commercially available technology for small-
scale electricity generation using forest biomass?
How much electricity can be generated using the available forest wood
biomass in the township under study and the selected technology?
1.5 Scope
This thesis was focused on a rural Catalonian sample township.

7
7
Regarding the availability of biomass in a rural township placed in Catalonia,
data from existing databases such as the Forest Inventory of Catalonia provided
by the Centre for Ecological Research and Forestry Applications (Centre de
Recerca Ecològica i Aplicacions Forestals, CREAF), and specialized journals
such as Biomass and Bioenergy, were sought to estimate the amount of metric
tons of wood biomass produced each year per hectare in forests. The study was
focused on forest wood biomass among all biomass types available for electricity
generation purposes.
Regarding the election of the most suitable technology, those technologies
already commercially available or at a point close to commercialization were
considered. The choice was made in terms of relative efficiencies obtained at
small-scale and their principles of operation, including the possibility of usage of
the available biomass resource.
According to all the characteristics mentioned above, the research is
designed as an ex post facto descriptive and analytical experiment.
1.6 Assumptions
The following assumptions were relevant to this study:
The database Forest Inventory of Catalonia (Burriel, Gracia, Ibàñez, Mata,
& Vayreda, 2000) is reliable
Efficiency data coming from simulations are comparable to actual power
plant data

8
8
The mix of different biomass species available in the area of study has a
unique heating value.
The moisture of the wood biomass picked will be assumed to be
homogeneous among different species and seasons
1.7 Delimitations
The delimitations of the research were:
The research is limited to a sample township in rural Catalonia
Biomass types other than forest wood biomass such as agricultural
biomass, energy crops or municipal and industrial waste were not covered
Large-scale biomass power plants, i.e., with more than 1 MW of electric
output, were not covered
The electric power generation and cogeneration technologies not fuelled
with biomass were not covered
Technologies that are not already commercially available were not
considered when choosing the most suitable technology
Co-firing technologies were not considered
Economic feasibility and long-term maintenance were not studied
1.8 Limitations
The main limitations identified in this research were:
The sample may not be fully representative of the whole population

9
9
The biomass annual growth rate can vary among years due to weather
changes and could override the amount of biomass that can be used
sustainably.
1.9 Definitions
This section defines the main terminology related to the area of research:
(biomass) integrated gasification combined cycle ((B)IGCC) – power plant design
consisting on the following layout: biomass dryer (if necessary), gasifier,
gas cleanup system (if necessary), gas turbine-generator, heat recovery
steam generator (HRSG) (Larson, Williams, & Leal, 2001)
Centre de Recerca Ecològica i Aplicacions Forestals (CREAF) – public-funded
research centre aimed to production of new knowledge and tools for the
terrestrial ecology field, improving rural and urban environment
management (CREAF, 2013)
Centre Tecnològic Forestal de Catalunya (CTFC) – technological forestry center
of Catalonia, governmental organization aimed at contribution to forestry
industry modernization, rural development and sustainable management
of environment (CTFC, 2013)
co-firing system – electricity production system fuelled using two or more fuels,
for example producer gas and natural gas (Rodrigues, Faaij, & Walter,
2003)

10
10
combined heat and power (CHP) – “also known as cogeneration, means that
both electrical and thermal energy are generated simultaneously”
(Monteiro, Moreira, & Ferreira, 2009, pp.290)
diesel engine – type of internal combustion engine in which the ignition occurs by
compression of the fuel (Onovwiona & Ugursal, 2006)
European Union (EU) – “economic and political partnership between 27
European countries that together cover much of the continent”
(Communication Department of the European Commission, 2013)
Food and Agriculture Organization of the United Nations (FAO) – governmental
organization aimed to food security achievement among other goals (FAO,
2013)
heat recovery steam generator (HRSG) – heat cycle designed to generate steam
from the excess heat at the exhaust of a gas turbine and circulate the
steam through a steam turbine to produce additional electricity (Larson,
Williams, & Leal, 2001)
high heating value (HHV) – it “is the total heat generated by the combustion of a
fuel” (Onovwiona & Ugursal, 2006: p. 393). It also receives the name of
gross calorific value, or GCV (Obernberger, 1998)
internal combustion engine (ICE) – engine with combustion chamber inside
which the fuel ignites, comprising two main types according to their
method of ignition: spark-ignition engine and Diesel engine (Onovwiona &
Ugursal, 2006)

11
11
International Energy Agency (IEA) – “autonomous organisation which works to
ensure reliable, affordable and clean energy for its 28 member countries
and beyond”. Its main focus areas are “energy security, economic
development, environmental awareness, and engagement worldwide”
(IEA, 2013)
Inventari Ecològic i Forestal de Catalunya (IEFC) – inventory of all forests found
in Catalonia, considering “not only structural aspects (such as density or
diameter), but also functional aspects (such as leaf area index, incident
radiation, biomass and production of wood, bark, branches and leaves or
growth series)
lower heating value (LHV) – also known as the net calorific value (NCV), the LHV
is a thermodynamic property of a fuel giving the energy content of that
fuel, expressed in MJ/kg. It “is defined as the higher heating value of the
fuel (HHV) less the energy required to vaporize the water produced during
combustion” (Onovwiona & Ugursal, 2006: p. 393). It is also called net
calorific value, or NCV (Obernberger, 1998)
micro-scale cogeneration – different definitions of micro-scale cogeneration
systems are found in the literature with regard to maximum power output
of these systems. Among them, it has been chosen 50 kWe of maximum
power output as the limit (Directive 2004/8/EC of the European Parliament
and of the Council of the 11 February 2004 on the promotion of
cogeneration based on the useful heat, 2004)

12
12
micro-turbine – small-scale energy production gas turbine with an electrical
power generation below 500 kWe (Invernizzi, Iora, & Silva, 2007), that
typically mounts generator, compressor and turbine in a common shaft
(Salomón, Savola, Martin, Fogelholm, & Fransson, 2011)
Otto engine – type of internal combustion engine in which the ignition occurs by
the effect of a spark (Onovwiona & Ugursal, 2006)
organic fluid – organic compound characterized by higher molecular mass and
lower ebullition/critical temperature than water, consequently requiring
less heat during evaporation (Tchanche, Lambrinos, Frangoudakis, &
Papadakis, 2011)
organic rankine cycle (ORC) – thermodynamic cycle operating under the same
principle as the conventional Rankine cycle, but using as a working fluid
an organic fluid such as toluene or propanol instead of water (Salomón,
Savola, Martin, Fogelholm, & Fransson, 2011)
Rankine cycle – thermodynamic cycle that uses a source of heat to produce high
pressure steam that is later expanded in a turbine, also called condensing
extraction steam turbine (Larson, Williams, & Leal, 2001)
small-scale cogeneration – different definitions of small-scale cogeneration
systems are found in the literature with regard to the maximum installed
capacity of these systems. Among them, a maximum power output of 1
MWe has been chosen as the limiting value (Directive 2004/8/EC of the
European Parliament and of the Council of the 11 February 2004 on the
promotion of cogeneration based on the useful heat, 2004)

13
13
syngas – also called product gas or producer gas, is a gas obtained through
gasification that “can be used by boilers, internal combustion engines or
gas turbines to produce heat and power in CHP systems after proper
cleaning and conditioning” (Dong, Liu, & Riffat, 2009, pp. 2121)
Stirling engine – engines that use an external heat source to produce power. Two
main types exist: free-piston and kinematic (Monteiro, Moreira, & Ferreira,
2009)
1.10 Summary
Among all the renewable energy alternatives, electricity generation using
biomass sources is a good opportunity to take advantage of a missed latent
potential for using and giving economic value to forest wood biomass and
improve the energy supply of both developing and developed countries. However,
it is necessary to work on the technical and economic feasibility of these
technologies in general and of biomass-based technologies in particular, with aim
to encourage its usage at all levels.
This study was focused on the technical side of biomass-based electricity
generation feasibility, and its purpose was to find out which is the current
potential for electricity generation using forest wood biomass sources and current
conversion technologies at small scale.

14
CHAPTER 2. LITERATURE REVIEW
A comprehensive literature review was performed in order to achieve a good
understanding of the state of the art in the field of study and the main reasons
that underlie behind the growing interest and focus on the switch from traditional
energy sources to renewable energy sources as biomass.
Main topics covered were the justifications for the use of renewable energy
technologies and, particularly, biomass conversion technologies, as well as the
availability and under development technologies including both biomass-based
electricity generation and combined heat and power technologies.
These topics could be grouped into five main categories:
Combustion technologies
Gasification technologies
Small- and micro-scale generation technologies
Technology reviews
Feasibility

15
15
2.1 Methodology for the review of the literature
Several sources were accessed to cover a wide range of all the available
information in an attempt to discover what is the scientific community working
with at present time.
The bulk of information was obtained by using electronic databases. Among
them, the following ones should be emphasized:
Google Scholar
ScienceDirect
Institute of Electrical and Electronics Engineers IEEEXplore
Thomson Reuters Web of Knowledge
Although all of them are generic databases not focused on a particular
topic, some screening was done in terms of limiting the search of specialized
journals.
The first step performed was a brief search for terms such as biomass,
electricity, combined heat and power, CHP and small-/micro-scale.
Once identified those journals related with the field of biomass conversion
to electricity and, in particular, with small-scale and micro-scale technologies,
searches were refined by journal. Particularly, Renewable and Sustainable
Energy Reviews, Renewable Energy, Biomass and Bioenergy, Energy for
Sustainable Development, Applied Energy and Energy were mostly used.
References consulted could be classified between technology related sources
and biomass related sources.
16
16
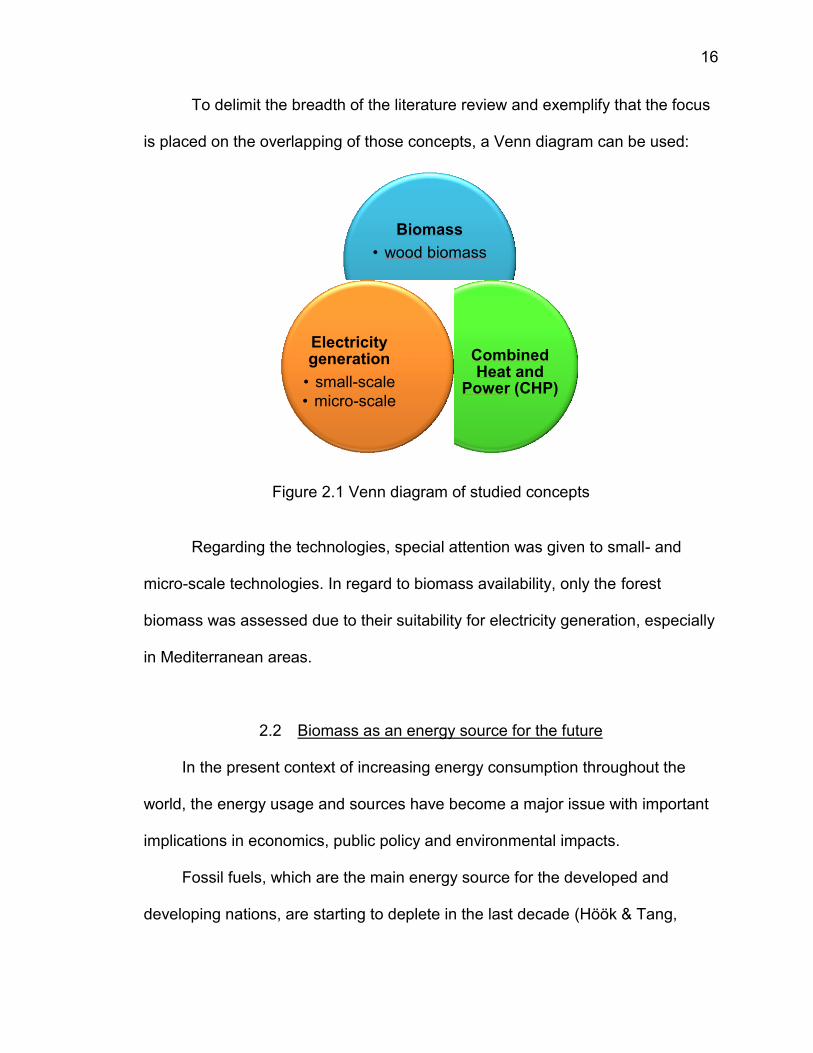
To delimit the breadth of the literature review and exemplify that the focus
is placed on the overlapping of those concepts, a Venn diagram can be used:
Figure 2.1 Venn diagram of studied concepts
Regarding the technologies, special attention was given to small- and
micro-scale technologies. In regard to biomass availability, only the forest
biomass was assessed due to their suitability for electricity generation, especially
in Mediterranean areas.
2.2 Biomass as an energy source for the future
In the present context of increasing energy consumption throughout the
world, the energy usage and sources have become a major issue with important
implications in economics, public policy and environmental impacts.
Fossil fuels, which are the main energy source for the developed and
developing nations, are starting to deplete in the last decade (Höök & Tang,
Biomass
• wood biomass
Combined Heat and
Power (CHP)
Electricity generation
• small-scale
• micro-scale

17
17
2013). In a free-market economy, that leads to increasing prices and thus
decreased competitiveness of those countries highly dependent on these energy
sources. In addition, in countries such as Spain with low or even no indigenous
fossil fuel availability, the usage of fossil fuels results in energy dependency on
foreign countries. Finally, the high level of greenhouse gas emissions derived
from the combustion of fossil fuels is one of the biggest causes of climate change
through the global warming that it entails (Höök & Tang, 2013).
Facing all mentioned odds, there are the renewable energy technologies,
which are indigenous sources of virtually perpetual energy, scalable and carbon
neutral (Buragohain, Mahanta, & Moholkar, 2010).
Furthermore, renewable energies could help to implement the distributed
generation model that consists on energy production close to both renewable
energy resources and consumption and, consequently, large production plants
are substituted or complemented by small-scale and micro-scale plants (Monteiro,
Moreira, & Ferreira, 2009). Distributed generation, in turn, is a key tool to address
the problems of security of supply and CO2 emissions and to improve the
efficiency of energy systems (Kuhn, Klemes, & Bulatov, 2008), as well as to
overcome the problem of rising electricity costs and shortages (Buragohain,
Mahanta, & Moholkar, 2010). Finally, distributed generation has social benefits in
terms of encouragement of development in rural areas by providing electricity at
those places where the grid transmission is not reliable (Buragohain, Mahanta, &
Moholkar, 2010) and by generating new income opportunities through revaluation
of local resources (Herran & Nakata, 2012).
18
18
Among all the renewable sources, biomass is one of the most promising
options. Particularly, the fact of being a proven technology, its flexibility of
operation and installation (Buragohain, Mahanta, & Moholkar, 2010), its low
(even null) and stable (especially when compared with fossil fuels) price because
of being often a waste product, its flexibility to be converted to several forms of
energy such as heat, gas or electricity and its easy and efficient scalability
(Prasad, 1990) are strong reasons for it. In addition, biomass is, together with
hydro, the unique renewable source that can be stored and continuously used to
have a predictable output not dependent of weather (Passey, Spooner, MacGill,
Watt, & Syngellakis, 2011).
Furthermore, biomass admits the usage of combined heat and power
technologies, which have better efficiencies (Gustavsson, Biomass and district-
heating systems, 1994) and lower consumption (Raj, Iniyan, & Goic, 2011) than
heat and electricity production individually. Biomass-fuelled CHP systems can be
used in both commercial buildings such as hospitals and schools (Dong, Liu, &
Riffat, 2009), commercial centers, hypermarkets, and heated swimming pools
(Monteiro, Moreira, & Ferreira, 2009) and residential dwellings due to their low
operating and maintenance costs, high overall efficiencies and their low noise,
vibration and emissions levels (Kuhn, Klemes, & Bulatov, 2008).
2.3 Biomass types and availability
Biomass is defined as “the organic material from recently living things,
including plant matter from trees, grasses, and agricultural crops” (Ciferno &

19
19
Marano, 2002: p. 5). It includes all living and dead plants and residues derived
from their processing (Osowski & Fahlenkamp, 2006), and can be classified in
four main categories: woody materials, herbaceous and annual growth materials,
forestry and agricultural residues and waste materials such as municipal solid
waste (Franco & Giannini, 2005). Among them, those that can be used for
electricity production are agricultural crop and residues such as bagasse, forest
residues and wood wastes (bark, wood chips and sawdust) and dedicated
energy crops (Evans, Strezov, & Evans, 2010; Salomón, Savola, Martin,
Fogelholm, & Fransson, 2011).
Main characteristics affecting the quality of biomass resource are density,
presence or lack of uniformity and moisture level (Prasad, 1990). It is noteworthy
to mention that biomass for combustion and gasification purposes is required to
have a low moisture level, within an appropriate range between 10% and 15%
(Buragohain, Mahanta, & Moholkar, 2010). The types of biomass are
summarized in Table 2.1:
Table 2.1 Existing types of biomass
Biomass type Description
Woody materials Firewood, Wood
Herbaceous and annual growth
materials (energy crops) Mischantus, Switch grass, Wheat straw, Beechwood
Forestry and agricultural
residues
Wood chips, Wood pellets, Bark, Sawdust, Bagasse,
Corn cob, Rice husks, Pits
Waste materials Dry sewage, Municipal solid waste
Source: personal compilation based on (Vallios, Tsoutsos, & Papadakis, 2009) and (Yoshida, et al., 2003)
In the Mediterranean area, the main tree species is the maritime pine,
followed by the eucalyptus (Viana, Cohen, Lopes, & Aranha, 2010).

20
20
The deep assessment of the biomass resource available in Portugal made
by Viana, et al. (2010) ended up finding that the available biomass resource
coming from those species is about 0.85 and 0.90 metric tons per year and
hectare.
2.4 Biomass conversion technologies
Several sources summarize the main conversion technologies available
and break them down into primary technologies and secondary technologies.
Primary technologies are those that perform the first conversion step. They
are combustion, gasification and pyrolysis technologies (Evans, Strezov, &
Evans, 2010; Dong, Liu, & Riffat, 2009; McKendry, 2002).
Secondary technologies are those coupled to a primary technology to use
the end product (producer gas, fuel or heat from combustion) to generate
electricity. They are internal combustion engine (ICE), steam engine, steam
turbine, external combustion (commonly called Stirling) engine, organic Rankine
cycle (ORC) applications, gas turbine, micro-gas turbine and fuel cells (Dong, Liu,
& Riffat, 2009; Salomón, et al., 2011). In addition to them, there are some ideas
under research such as evaporative gas turbines, externally fired gas turbines,
pulverized-fired gas turbines, air bottoming cycles and powdered-fuelled ICEs
(Salomón, Savola, Martin, Fogelholm, & Fransson, 2011).
Some studies such as the review carried out by Dong, et al. (2009) state
that primary and secondary technologies might be combined in multiple ways,
while others provide only a few possible combinations. For example, Buragohain,

21
21
et al. (2010) claim that there are actually seven conversion mechanisms
available (gasifier with ICE, combustion and steam engine or turbine, biomass
integrated gasification combined cycle (BIGCC) with steam or gas turbine,
external combustion engines and biomethanation with ICE); and that only two of
them are commercially viable and widely deployed at present. They are biomass
gasification coupled with an ICE and biomass combustion coupled with a steam
turbine.
Throughout the following sub-sections the main findings related to these
existing technologies are summarized.
2.4.1 Primary conversion technologies
The primary conversion technologies are those that convert biomass into
another form of energy, for example heat or a raw gas. There are three main
primary conversion technologies, described in the following subsections.
Table 2.2 summarizes the different primary conversion technologies found
in the literature and a brief description of the principles of operation:
Table 2.2 Biomass conversion primary technologies summary
Primary Technology Principle of operation
Pyrolysis Chemical reaction that converts biomass into a liquid
or gaseous fuel though indirect heating
Gasification Chemical process that converts dry biomass into a
gaseous combustible through partial oxidation
Combustion Complete oxidation of dry biomass creating freeing
energy in heat form
Source: personal compilation based on Evans, Strezov, & Evans (2010) and McKendry (2002)

22
22
From these options, gasification and direct combustion have been pointed
out as the most efficient processes to get the maximum advantage of dry
biomass such as forestry residues (Yoshida, et al., 2003).
2.4.1.1 Pyrolisis
Pyrolosis is a chemical process consisting on the conversion of biomass
to liquid, gases and condensable vapors through indirect heating (to around
500 ºC) applied in an anaerobic environment (Bain, Overend, & Craig, 1998;
Evans, Strezov, & Evans, 2010; McKendry, 2002).
The obtained products can be used for both electricity and heat production
and as a fuel for transport purposes (Murphy & McKeogh, 2004).
2.4.1.2 Gasification
Gasification is a chemical process consisting on the conversion of dried
biomass into a combustible in a gaseous state through a partial oxidation,
typically at around 800-900 ºC (Difs, Wetterlund, Trygg, & Söderström, 2010;
Evans, Strezov, & Evans, 2010; McKendry, 2002). Gasification has been defined
as a clean, efficient and versatile process that is suitable for heat and electricity
generation purposes in both developed and developing countries (Kirkels &
Verbong, 2011). For example, gasification has been proposed as the best
technology for providing cooking and heating gas to a rural agricultural village

23
23
while generating electricity for household and industry consumption (Shuying,
Guocai, & DeLaquil, 2001).
Regarding the efficiency, biomass gasification is considered to have
higher efficiencies than direct combustion, thus having fewer greenhouse gas
emissions per kWh produced (Murphy & McKeogh, 2004).
The gasification process comprises several stages. Typically, a pre-
treatment of the biomass is done before being introduced to the gasifier where
the gasification reaction occurs. Then, a gas cleaning stage is required in most of
the cases before fuelling the chosen secondary technology (Bain, Overend, &
Craig, 1998; Kirkels & Verbong, 2011; Osowski & Fahlenkamp, 2006; Zhang,
Chang, Guan, Chen, Yang, & Jiang, 2012), which typically is gas engines and
gas turbines or combustion boilers (McKendry, 2002).
Among all the existing variables affecting the process, it is worth
highlighting the tar formation or the gas cleanup (Difs, Wetterlund, Trygg, &
Söderström, 2010), but the gasifier is probably the most important. The different
types of gasifiers can be classified according to the fluid-biomass contact. Using
this criterion, fixed bed, circulating-fluidized bed and entrained flow reactors exist
(Bain, Overend, & Craig, 1998; Buragohain, Mahanta, & Moholkar, 2010; Ciferno
& Marano, 2002; Osowski & Fahlenkamp, 2006; Zhang, et al., 2012).
Table 2.3 summarizes these three types of gasification reactors found in the
literature and the different sub-types available:

24
24
Table 2.3 Gasification technologies summary
Gasifiers Principle of operation
FIXED-BED REACTORS
Direct current Gasification fluid flows in the same direction as
biomass
Counter current Gasification fluid flows in the opposite direction to
biomass
Cross-flow Gasification fluid is introduced from one side and exist
from the opposite, while biomass moves up-down
FLUIDIZED-BED REACTORS
Bubbling fluidized-bed Frictional forces of fluidizing material reach equilibrium
with biomass weight
Circulating fluidized-bed Frictional forces are higher so the biomass particles
are entrained by the fluid
ENTRAINED FLOW REACTORS
Suspension flow or dust cloud Used for coal and oil gasification. Small particles of fuel
are entrained by the gasification fluid
Source: personal compilation based on (Ciferno & Marano, 2002)
Fixed-bed gasifiers are more suitable for small-size projects while
circulating-fluidized beds are widely used in small- and large-scale projects as
Zhang, et al. (2012) inferred using actual data of gasification plants in China.
Regarding the accepted fuel, Zhang, et al., (2012) claimed that fixed-bed
gasifiers should be used for large and dense fuels such as wood chips or
densified biomass, while the fluidized bed reactors accept low density fuels such
as sawdust.

25
25
2.4.1.2.1 Fixed bed reactors
In this kind of reactors the fluid, oxygen or air, passes through the biomass
that is placed in a fixed position. This type of gasifier has low investment costs
(Osowski & Fahlenkamp, 2006). Three different types exist: updraft, downdraft
and cross-flow gasifiers (see Figure 2.2).
Downdraft gasifiers, i.e., direct current, have a fluid flow in the same
direction as biomass, up-down. In these reactors, almost all tar formed is also
consumed (Ciferno & Marano, 2002), so low-tar gas is produced even when the
fuel is wood (FAO Forestry Department, 1986). According to Buragohain, et al.
(2010), the tar present in the producer gas may condense in the engine shaft,
which results in more cleaning tasks. Consequently, downdraft gasifiers have
been identified as the most suitable type for rural village applications in
developing countries due to their low operating and maintenance requirements
(Henderick & Williams, 2000). However, it has some disadvantages such as the
high temperature at which the producer gas exits the reactor and the low
moisture content of biomass fuel required (Buragohain, Mahanta, & Moholkar,
2010; Ciferno & Marano, 2002).
Updraft gasifiers, i.e., counter current, have a fluid flow in the opposite
direction than the biomass. In comparison with downdraft reactors, updraft
gasifiers have high tar content, thus having higher operating and maintenance
costs (Osowski & Fahlenkamp, 2006). However, as they are the oldest type of
gasifiers, they constitute a proven and reliable technology that also accepts
biomass with high moisture content as a fuel (Ciferno & Marano, 2002).

26
26
Last type of fixed bed reactors are the cross-flow gasifiers, where the fluid
is introduced from one side and exiting from the other while the biomass has an
up-to-down movement (Zhang, et al., 2013).
Source: (Zhang, et al., 2012: p.179)
Figure 2.2 Schematic diagram of the three types of fixed-bed gasifiers: a: updraft; b: downdraft; and c: cross-flow
2.4.1.2.2 Fluidized bed reactors
The main principle that underlies the fluidized bed reactors is that a small
amount of feedstock together with a large amount of fluidizing material such as
sand or alumina can be gasified when a heated fluid (either oxygen or air) is
introduced (Kirkels & Verbong, 2011). Two different types exist: bubbling and
circulating fluidized bed gasifiers (Kirkels & Verbong, 2011; Onovwiona &
Ugursal, 2006), represented in Figure 2.3. These are mainly applied at medium
to large scales, from 5 to 10 MWth. Both of them have been proven reliable for
wood-biomass burning, as they reduce the risk of slagging in heat transfer
surfaces (Siewert, Niemelä, & Vilokki, 2004) and have better contact between

27
27
solid and fluid leading to more adjustable and uniform temperature distribution
(Osowski & Fahlenkamp, 2006; Zhang, et al., 2012). However, they admit only
biomass with small particulate size, so the wood has to be crushed (Osowski &
Fahlenkamp, 2006).
In bubbling fluidized bed gasifiers, equilibrium is reached between the
frictional forces of the fluidizing material and the weight of the feedstock. At this
point, biomass appears to be bubbling and the gasification reaction occurs
(Ciferno & Marano, 2002) at a temperature that ranges between 700 and 900 ºC
depending on the fuel/fluid ratio (Zhang, et al., 2013). The producer gas is
uniformly generated and the gasifier accepts a wide range of particle size
(Ciferno & Marano, 2002).
Circulating fluidized bed gasifiers operate at higher velocities so the
particles are entrained by the fluid. These reactors achieve higher carbon
conversion rates and thus the gasification reaction is faster even though the
velocity is limited by the size of fuel particles (smaller particles allow to achieve
higher velocities) and the heat exchange is less efficient than that obtained with a
bubbling fluidized bed (Ciferno & Marano, 2002). These kinds of reactors require
a quite higher investment than that for bubbling fluidized bed reactors due to
increased complexity and size (Osowski & Fahlenkamp, 2006). In addition, they
are more suitable for large scale and IGCC as they already work with pressurized
gas so the pressurization is not done in vain (Kirkels & Verbong, 2011).
The research by Zhang, et al. (2012) also describes a third type of
fluidized bed reactor: the dual fluidized bed gasifier, which still is under research.

28
28
Source: (Zhang, et al., 2012: p. 179)
Figure 2.3 Schematic diagram of the two types of fluidized-bed gasifiers: a: bubbling fluidized bed; b: circulating fluidized bed
2.4.1.2.3 Entrained flow reactors
Entrained flow reactors, i.e., suspension flow or dust cloud reactors, have
been applied for oil and coal gasification. In this design, small particles are
entrained in a flow of the fluidizing medium (Kirkels & Verbong, 2011).
2.4.1.3 Combustion
Direct combustion consists on the complete oxidation of biomass in an
aerobic environment (Evans, Strezov, & Evans, 2010).This process frees the
chemical energy from the biomass and converts them into heat that can be used
for both heating and electricity production purposes through the use of a suitable
technology like boiler, steam turbine and others (McKendry, 2002). Although
there are several possible uses of combustion, the most widely scattered option
is the usage of heat from combustion to convert water to vapor and drive a

29
29
turbine. The turbine is based on the thermodynamic Rankine cycle (Bain,
Overend, & Craig, 1998).
According to Bain, et al. (1998), there are several combustors available,
including pile burner, stoker grate, bubbling and circulating fluidized bed and
suspension burners among other non-conventional options.
2.4.2 Secondary conversion technologies
The secondary conversion technologies are those that convert the
intermediate form of energy, i.e., that obtained after the primary conversion
technology, into electricity. There are three many secondary conversion
technologies, described in the following subsections.
The table below (see Table 2.4) summarizes the different secondary
conversion technologies found in the literature, split by whether or not being
commercially available, along with the primary conversion technology to which
each one can be coupled and a brief description of the principles of operation:
Table 2.4 Biomass conversion secondary technologies summary
Secondary
Technology
May be coupled to…
(Primary Technology) Principle of operation
COMMERCIALLY AVAILABLE TECHNOLOGIES
Internal Combustion
Engines (ICE)
(Otto, Diesel)
Gasification
Pyrolisis
Heat from combustion in an internal
comb. chamber drives a piston
through gas expansion
Stirling Engine
(Free-piston,
Kinematic)
Combustion Heat from combustion in an external
comb. chamber drives a piston
through gas expansion
Steam Engine Combustion Steam generated through thermal

30
30
Secondary
Technology
May be coupled to…
(Primary Technology) Principle of operation
evaporation of a fluid drives an engine
Steam Turbine Combustion Steam generated through thermal
evaporation of a fluid is expanded in a
turbine
Organic Rankine
Cycle (ORC)
Combustion Same as steam turbine but organic
fluids are used as working fluids
Gas Turbine /
Biomass Integrated
Gasification
Combined Cycle
(BIGCC)
Gasification Clean gas is compressed before burnt
in a combustion chamber and then
expanded in a turbine / Biomass
gasification cycle is attached to a CHP
application using a gas turbine
Microturbine Gasification Same as gas turbine but with power
output < 500 kW
TECHNOLOGIES UNDER R&D
Externally-fired gas
turbine
Gasification
Combustion
Combustion chamber of gas turbine
substituted by a heat exchanger
Pulverized wood-fired
gas turbine, ICE or
Stirling engine
Combustion Gas turbine, Diesel engine or Stirling
engine fired with micro-particulates of
pulverized wood
BIGCC with air-
bottoming cycle
Gasification Same as BIGCC but with a steam
turbine added at the exhaust to use
waste heat
Gas Turbine co-fired
with fossil fuels
Gasification Producer gas is burnt together with
natural gas or coal
Source: personal compilation based on Buragohain, Mahanta, & Moholkar (2010), Franco and Giannini (2005), Henderick and Williams (2000), Invernizzi, Iora, and Silva (2007), Larson,
Williams, and Leal (2001), Monteiro, Moreira, and Ferreira (2009), and Salomón, Savola, Martin, Fogelholm, and Fransson (2011)
31
31
2.4.2.1 Internal combustion engine (ICE)
Internal combustion engines are the widely-spread technologies of Otto
engine (spark-ignition) and Diesel engine. They have been labeled as the only
secondary technologies at a maturity level for the utilization of producer gas
(Henderick & Williams, 2000).
In ICEs, producer gas obtained from biomass can be used together with
diesel or other fossil fuels in a co-firing scheme as well as alone, but only with
spark-ignition engines (Buragohain, Mahanta, & Moholkar, 2010; Henderick &
Williams, 2000). However, ICEs do not admit the combination with direct
combustion application, due to their requirement of a fluid fuel. Furthermore,
ICEs are considered an interesting possibility to reach high efficiencies for small-
and micro-scale plants (Ahrenfeldt, et al., 2006).
Several articles provide data about the efficiency of gasification
technologies coupled with ICEs. Onovwiona and Ugursal (2006) and Monteiro,
Moreira, & Ferreira (2009) summarized the technical characteristics of some
micro-scale ICE-based CHP systems. Electrical efficiencies reported range from
21% to 30%, increasing with the power output, and overall efficiencies from 78%
to 90% (Onovwiona & Ugursal, 2006) and from 50% to around 60% (Monteiro,
Moreira, & Ferreira, 2009). Other authors reported electrical efficiencies ranging
from 20 to 26% with overall efficiencies up to 90% (Barbieri, Spina, & Venturini,
2012), and electrical and overall efficiencies of 25% and 90% respectively, for an
ICE-based small-scale CHP plant of 100 kWe of power output (Kimming, et al.,
2011). The high variability in both size and efficiencies is shown in International

32
32
Energy Agency (2007), which reported efficiencies as low as 5% going up to 30%,
for outputs from 200 kWe to 1 MWe.
The BERI project carried out in Karnataka, India, consisted on building a
gasification plant coupled with a 120 kWe spark-ignited gas engine, and an
electrical efficiency of 18% was obtained (Dasappa, Subbukrishna, Suresh, Paul,
& Prabhu, 2011). The Viking gasification plant set up at the Technical University
of Denmark used a 19 kWe engine generator and 25% of electrical efficiency
was obtained (Ahrenfeldt, et al., 2006).
2.4.2.2 Stirling engine
Stirling engines are external combustion engines. Both two types, free-
piston and kinematic, are based on the Stirling cycle (Monteiro, Moreira, &
Ferreira, 2009). That means that the combustion takes place outside the closed
cylinder so these engines accept all kinds of fuel and have less maintenance
requirements (Kuhn, Klemes, & Bulatov, 2008) making the process simpler when
compared with ICE’s requirements (Nishiyama, et al., 2007). Consequently,
Stirling engines have been identified as one of the more suitable technologies for
micro-scale applications (Monteiro, Moreira, & Ferreira, 2009).
As a result of their operating mode with external combustion, Stirling
engines have low electrical efficiency and high overall efficiency due to a high
thermal efficiency (Kuhn, Klemes, & Bulatov, 2008; Monteiro, Moreira, & Ferreira,
2009), which is theoretically higher than that for a Diesel engine (Obara, Tanno,

33
33
Kito, Hoshi, & Sasaki, 2008). Some studies (Monteiro, Moreira, & Ferreira, 2009)
have reported electrical efficiencies that vary between 10% and 33% and that
approach 40% (Onovwiona & Ugursal, 2006), when using this technology.
According to the same sources the overall efficiency ranges between 65% and
90%. Other researches showed that a small-scale CHP unit of 100 kWe of power
output based on Stirling engine technology reaches 12% of electrical efficiency
and 90% of overall efficiency (Kimming, et al., 2011).
2.4.2.3 Steam engine
Steam engine technology uses steam generated through thermal
evaporation of a working fluid, usually water, to drive an engine. Nowadays, this
technology is being replaced by steam turbines because of the higher level of
superheating reached by the latter (Salomón, Savola, Martin, Fogelholm, &
Fransson, 2011). Steam engines can be used with all primary technologies, but
due to their capacity to take advantage of produced heat to generate electricity
are more suitable for direct combustion applications.
Electrical efficiencies of about 16% have been reported for small-scale
systems, i.e., 25 kWe of output, using steam generated with biomass direct
combustion driving a steam engine (Prasad, 1990). In Hartberg, Styria (Austria),
a 730 kWe screw-type steam engine was installed in 2003 as the prime mover of
a CHP plant. The plant reached an electric efficiency of about 10% and an
overall efficiency around 80% while fuelled with wood chips, bark and sawdust

34
34
from nearby areas (Hammerschmid, Stallinger, Obernberger, & Piatkowski,
2004).
2.4.2.4 Steam turbine
The steam turbine is a technology based on the conventional Rankine
thermodynamic cycle. It is a proven and mature technology widely used for
biomass conversion to electricity, especially for large-scale plants, i.e., above 3
MW of electric output (Franco & Giannini, 2005; Salomón, et al. 2011). However,
this maturity stage reached makes virtually impossible for this technology to
achieve any relevant breakthrough (Buragohain, Mahanta, & Moholkar, 2010).
The most common layout for a steam turbine plant consists on a boiler
fuelled with biomass coupled with a heat exchanger where the heat from
combustion is used to vaporize a fluid, usually water, that is expanded thorough
the steam turbine (Larson, Williams, & Leal, 2001). This mode of operation
makes this technology especially useful for direct combustion applications
although it can be used with all other primary technologies.
This technology admits the residual heat utilization so it can be used in
conventional power plants and CHP plants. Existing experiences showed
electrical efficiencies from 18% up to 34%, depending on the scale (Wahlund,
Yan, & Westermark, 2001).

35
35
2.4.2.5 Organic Rankine cycle (ORC)
The ORC technology is based on the same principle that steam turbines,
the Rankine cycle, but in this case organic fluids such as propanol, toluene and
isobutane are used as a working fluid (Salomón, Savola, Martin, Fogelholm, &
Fransson, 2011). These fluids have lower vaporization temperature than water
and therefore they allow the use of lowest temperature heat sources (Liu, Shao,
& Li, 2011; Tchanche, Lambrinos, Frangoudakis, & Papadakis, 2011) and reach
higher cycle efficiencies (Dong, Liu, & Riffat, 2009).
ORC applications have better performances in small- and micro-scale
installations and reduce the risk of turbine damage due to partial vaporization of
the working fluid. They also allow the use of single-stage turbines as they do not
reach high temperature gradients between evaporation and condensation phases
(Tchanche, Lambrinos, Frangoudakis, & Papadakis, 2011).
The ORC technology can be virtually used with all primary technologies
but, as in case of steam turbines, its characteristics make it more suitable for
direct combustion applications. However, ORC applications are also interesting
for using excess heat in bottoming cycles or for applications in the micro-scale
range as claimed by Invernizzi, et al. (2007).
Several papers reported electrical efficiencies around 15% (Dong, Liu, &
Riffat, 2009) and up to 20% (Liu, Shao, & Li, 2011). Dong et al. (2009) also
stated that in the Lienz CHP plant, which has a 1000 kW of power output, an
electrical efficiency of 18% have been achieved. Finally, Liu, et al. (2011) found

36
36
that electrical efficiency between 7.5-13% could be reached in a 2 kW CHP
systems using the ORC technology, depending on the fluid used.
2.4.2.6 Gas turbines/Biomass integrated gasification combined cycle (BIGCC)
Gas turbines layouts almost always consist of a gasification unit, a
producer gas cleaning unit, a gas turbine and a heat recovery steam generator
(HRSG) in case of CHP plants (Corti & Lombardi, 2004; Jurado, Cano, & Carpio,
2003; Larson, Williams, & Leal, 2001). This layout is called biomass integrated
gasification combined cycle (BIGCC) or biomass integrated gasification gas
turbine (BIGGT) depending on the presence or absence of a heat recovery cycle.
Different combination of gasification technologies with gas turbines alone
or combined with a HRSG are commercially available (Pellegrini, de Oliveira
Júnior, & Burbano, 2010). Obviously, this technology can only be used with
gasification as a primary technology because gas turbines need a gas fluid to
work.
The efficiencies achieved with these technologies are higher than those
obtained with a steam turbine under the same conditions (Larson, Williams, &
Leal, 2001). Other studies also showed that they also perform better than other
combustion technologies including not only steam turbines but also gas engines
(Dornburg & Faaij, 2001).
Reported efficiencies are around 30-45% (Wahlund, Yan, & Westermark,
2001). These figures are supported by some demonstration plants as the

37
37
Värnamo demonstration plan that reached 32% of electrical efficiency (Stahl &
Neergaard, 1998) or the simulations of the Termiska Processer that gave an
electrical efficiency of 32.5% (Faaij, et al., 1997). For large-scale BIGCC power
plants, efficiencies up to 43% have been reported (Uddin & Barreto, 2007).
2.4.2.6.1 Microturbines
The main drawback of gas turbines is their scale of operation. Due to their
large scale, they are not usable in places where there is a low availability of
biomass resources, for example in Mediterranean areas. Microturbines solve this
weakness, as they are commercially available in the range between 25 to 80 kW
of power output and even smaller output turbines are under intensive research
(Monteiro, Moreira, & Ferreira, 2009). Other sources claim can be considered
microturbines all turbines under 500 kW of power output (Invernizzi, Iora, & Silva,
2007) or all turbines under 250 kW of thermal and electric output for CHP
applications (Kuhn, Klemes, & Bulatov, 2008).
Microturbines-based power plants have a slightly different layout than gas
turbine-based applications. In the case of microturbines, the gas turbine, the
generator and the compressor share a common shaft (Kuhn, et al., 2008;
Salomón, et al., 2011). The principle of operation is the same as that for
aerospace turbines, and is described in depth by Henderick and Williams (2000)
in their article.

38
38
Microturbines are a down-scaled version of conventional gas turbines and
thus they are designed for working with a fluid fuel, so a biomass gasification
stage is expected to be set up before the microturbine.
The efficiency of microturbines is stated to be around 30%, slightly lower
than that obtained with an ICE, by Invernizzi, et al. (2007). Other studies reported
efficiencies of commercial units from Capstone that range from 26 to 33% for 30
to 200 kW of power output (Basrawi, Yamada, Nakanishi, & Katsumata, 2012).
Onovwiona and Ugursal (2006) demonstrated in their research that the efficiency
for a Capstone microturbine is slightly lower when it is fuelled with biomass (26%)
instead of natural gas (30%), but still higher than when it is fuelled with diesel
(25%). Finally, Monteiro, et al. (2009) also summarized the efficiencies achieved
by some commercial units and found that they are comprised between 24-30%.
2.4.2.7 Other designs
Other designs based on gas turbine technology are available. Salomón, et
al. (2011) and Invernizzi, et al. (2007) described in their article the air bottoming
cycle alternative, consisting on adding another turbine for using the waste heat at
the exhaust of the gas turbine. With this system an increase of 10%, from 30% to
40% in efficiency is obtained. It is also stated that this variation of the gas turbine
design admits not only electricity production increases but also cooling and
heating production.

39
39
Another available variation of the gas turbine design is the co-firing of
producer gas with coal or natural gas. With this option, an increased efficiency
can be obtained (Franco & Giannini, 2005). According to the authors, two
different alternatives are implementable: mix of both fuels in the gas turbine or a
topping cycle fuelled with the fossil fuel and a bottoming cycle fuelled with
producer gas obtained from biomass.
Externally-fired gas turbines are the last modification that can be found in
the existing literature. These designs substitute the combustion chamber by a
heat exchanger so the combustion can take place outside the gas turbine
(Salomón, Savola, Martin, Fogelholm, & Fransson, 2011) and thus not only
gasification can be used as a primary technology but also direct combustion is
admitted. Two different options are available, open cycle, where the working fluid
is discharged to the environment, and closed cycle, where the working fluid is
confined in a closed circuit (Al-attab & Zainal, 2010). This layout also ensures
that the working fluid in the turbine is completely clean so lower maintenance
costs are expected (Al-attab & Zainal, 2010). Al-attab and Zainal (2010), Franco
and Giannini (2005) and Wahlund, Yan, and Westermark (2001) claimed that the
efficiency obtained with these systems is around 30%.
2.5 Summary
Existing literature available focused on the biomass conversion to electricity
topic was accessed in order to achieve a solid knowledge about the state of the
art at present time.

40
40
Regarding the energy usage and its environmental, social and economic
potential problems, several sources suggest that renewable energies will help to
overcome them providing cheaper and indigenous energy for both developed
and developing countries. Biomass has been identified as a key renewable
source because it is based on proven technologies that admit both electricity and
combined heat and power production. Furthermore, its price is expected to
remain low and stable, especially when comparing with that of fossil fuels.
Several types of biomass can be used in electricity production and
cogeneration facilities, among which stand out the forest residues for their
availability in the Mediterranean areas such as Catalonia where a lack of forest
management leads to wildfires from time to time so there is a potentially available
resource.
From all reviewed sources, it was found that the conversion of biomass to
electricity can be made using several mechanisms which can be classified as
primary or secondary technologies and supporting multiple combinations among
them. The most widely used layouts are those that combine combustion with
steam turbines and gasification with internal combustion engines, but there are
other promising alternatives such as biomas integrated gasification combined
cycle (with either gas turbines or microturbines) or Stirling engines at diverse
levels of development.
In case of small-scale and micro-scale alternatives, the review showed
that the best available options are combustion paired with an organic rankine

41
41
cycle using steam turbines and gasification coupled with either ICEs or
microturbines.

42
42
CHAPTER 3. FRAMEWORK AND METHODOLOGY
The main outcome sought from this research was the potential for electricity
production from biomass sources. The research was approached from a point of
view of a non-experimental quantitative analysis of existent data; consequently
the research design was an ex post facto descriptive analysis.
The methodology of the study involved four main steps. The first one
consisted of the sample selection that will be described in the next section (see
§3.1.1), while the other three were aimed to address the research questions and
will be deeply explained in the following section (see §3.2).
Selection of an appropriate area where the study was focused.
Available forest wood biomass resource assessment.
Selection of the most suitable biomass conversion technology based on
relative efficiencies and principles of operation.
Calculation of the electricity that can be produced using the chosen
technology and with the available biomass in the sample township.

43
43
3.1 Study Context
Due to the research design, two variables were considered. The amount of
forest wood biomass available in sustainable basis, i.e., naturally produced per
year, had to be estimated, and the relative efficiencies of biomass conversion to
electricity technologies must be determined in order to select the most suitable
one in the context of the research.
The selection of these variables was determined by the location of the study
and by the selection of technologies to be assessed in terms of performance.
The criteria for this selection are presented in the following two sub-sections.
3.1.1 Population, Stratum and Sample
As stated above, the selection of the study location was an important step of
the research, because the amount of forest wood biomass resource available is
constrained by the forest surface in the township under study and the tree
species found there.
The population for the study was the country of Spain. It is noteworthy to
mention that the forest wood biomass resources available in the country are very
heterogeneously distributed due to differences in climate and tree species within
the different regions, so differences in the technical and economic viability of
biomass-based electricity production technologies were likely to be expected.
Among all the autonomous regions of Spain, Catalonia was selected as a
stratum to study because it is claimed to be one of those with higher technical
potential for electricity production using biomass (Gómez, Rodrigues, Montañés,

44
44
Dopazo, & Fueyo, 2010). In addition, the researcher has deep knowledge of its
geography, political organization and distribution of the territory as it is his
birthplace and location of his professional education.
However, the study of potential for electricity generation of all Catalonia
would be excessively extensive for the purpose of this thesis so in order to
narrow down the scope, only a sample township in rural Catalonia was selected.
The reason behind the condition of a township from rural Catalonia is that rural
areas are where the amount of biomass produced is most likely to be large
enough to produce a significant portion of the electricity required.
Nevertheless, there are many rural townships in Catalonia that could be
appropriate for the purpose of this research in terms of resource available and
potential for electricity generation. The criterion for selecting one or another was
the quality and readiness of information about the amount of usable biomass and
the electricity consumption of public buildings among others.
3.1.2 Technologies to assess
Regarding the technologies considered for the election of the most suitable
one, only those technologies that were already commercially available for
biomass conversion to electricity were considered. That is because these
technologies have more efficiency data available as well as it will be less
expensive to implement them, making the project more achievable, and move it
away from the purely academic sphere.
45
45
The judgment of whether or not a technology can be labeled as available at
commercial level was made according to the existing literature. For example,
some studies such as the research carried out by Salomón, et al. (2011) have
already classified which technologies are at present at point of commercialization.
Other criteria to figure out which are these available technologies was whether
there is or not data of actual power plants using a technology in the literature.
3.2 Methodology description
After the sample selection was done, the research consisted of three steps,
one for each of the three research questions. The conceptual framework and
tasks required to be carried out in order to do so are presented in the following
subsections.
3.2.1 Biomass resource availability
The first step was aimed to address the first research question, what is the
amount of forest wood biomass available in the selected township in rural
Catalonia.
When assessing the amount of biomass available in a certain region, the rate
of annual growth, i.e., the amount of biomass that a forest produces by itself
during a year, was used to estimate that. This resource estimate is used to
maintain the vegetation of the area. The units for the annual growth rate are
metric tons per hectare and year ( .

46
46
Another important aspect of forest biomass estimation is the different existent
types and their annual growth. On the one hand, there is the biomass from forest
waste, corresponding to the amount of biomass produced by a forest in form of
residues. On the other hand, there is the biomass from whole trees,
corresponding to the amount of trees that could be cut without reducing the
vegetation density of a certain forest. Both quantities are potentially useful for
electricity generation purposes.
Hence, the assessment of biomass resource availability was developed
through the execution of two tasks:
The calculation of the biomass resource available in the area under study
was done using the following database: Forest Inventory of Catalonia
(Burriel, Gracia, Ibàñez, Mata, & Vayreda, 2000) provided by the Centre
for Ecological Research and Forestry Applications (CREAF in its Catalan
acronym).
The relevant output from this step was the quantity of biomass in metric
tons produced in sustainable basis, i.e., by the forest itself each year, in
the forest area comprised in the area of study.
As a checking step, the data provided by the literature focused on forest
production for Mediterranean species was sought, with aim to verify that
the data provided by the databases are reliable and in line with what the
scientific community has found in recent studies.

47
47
As a secondary output, the total area populated by woods was sought, a
datum useful for the estimation of the net mass of biomass available within the
township.
3.2.2 Selection of most suitable conversion technology
The second step was focused on addressing the second research question,
what is the most suitable technology for electricity production of small scale using
forest wood biomass.
When addressing which is the best technology, the amount of biomass that
can be used becomes a critical issue because it determines the scale of
generation, as well as the performance of each technology that determines how
much of the chemical energy stored in the biomass is effectively converted into
electricity. It is also noteworthy to mention that the efficiency of an electricity
production plant is closely related to the size of the plant, in form of a non-linear
positive association.
Consequently, the selection of the most appropriate technology according to
the singularities of the region of study was done carrying out the following tasks:
Using performance data from both actual power plants and simulation of
plants using existing technologies, a plot of efficiency against power plant
size (in kW of electrical output) was made.
From all commercially available technologies for biomass conversion to
electricity, only those that may be used with the forest biomass fuel
available in the area of study were selected as possible alternatives. This

48
48
task involved the selection of an appropriate electrical output for the fuel
supply and thus discarding those technologies that are not implementable
at that scale.
Finally, a single technology was picked among all the feasible solutions.
The selection emphasized the efficiency of the system but without ignoring
other important aspects such as facility of installation, maintenance and
operation or its reliability. The average efficiency of such technology was
also calculated.
3.2.3 Potential for electricity production in the area of study
The last step of the research attempted to address the third research
question, how much electricity can be generated using the selected technology
and with the available biomass resource.
The estimation of potentially producible electricity requires the approach of
how much chemical energy is stored in the biomass. Once having this value, the
electrical energy that can be produced is obtained applying the efficiency of the
conversion system to the total amount of energy released from the available
forest wood biomass.
Accordingly, the estimation of potentially producible electricity was obtained
following the tasks presented below:
The heating value of the biomass was approached from the figures
published in the existing literature. It is reasonable to assume that the
mix of different tree species have a unique heating value because the

49
49
differences between the species in the Mediterranean area are small
enough.
The total amount of energy that could be obtained from the biomass
was obtained multiplying the quantity of biomass obtained in the first
step of the study (see §3.2.1) by the heating value of such biomass:
The electrical energy producible during a year from the chemical
energy stored in the biomass could be calculated using the average
efficiency obtained in the second step of the study (see §3.2.2):
3.3 Methodology overview
With the described methodology, the researcher sought to obtain an
approximate figure of the electricity that could be produced in the sample
township using its own biomass resources in a sustainable manner during one
year.
Indirectly, the study intended to demonstrate whether or not it is technically
feasible the use of forest wood biomass as an energy source for electricity
production.
The achievement of reliability and validity of the different parameters of the
study will be explained in the corresponding section for each datum in Chapter 4.
This whole methodology can be summarized with the following flow chart
(see Figure 3.1):

50
50
Figure 3.1 Flow chart summarizing the methodology
Sample Selection
• Population: Spain
• Stratum: Catalonia (high potential for biomass-based electricity production)
• Sample: Township (readily available and quality of data)
• Population: Spain
• Stratum: Catalonia (high potential for biomass-based electricity production)
• Sample: Township (readily available and quality of data)
Biomass availability
• Available resource estimation: existing databases (Bionline, Forest Inventory of Catalonia) → tn/(year·hectare)
• Waste/resdidues and self-Regeneration
• Checking step: literature review
• Available resource estimation: existing databases (Bionline, Forest Inventory of Catalonia) → tn/(year·hectare)
• Waste/resdidues and self-Regeneration
• Checking step: literature review
Technology selection
• Relative efficiencies summary: plot of efficiency against electrical power output
• Selection of feasible alternatives: selection of electrical power output and rejection of not-implementable technologies
• Technology choice: based on efficiency
• Relative efficiencies summary: plot of efficiency against electrical power output
• Selection of feasible alternatives: selection of electrical power output and rejection of not-implementable technologies
• Technology choice: based on efficiency
Electricity production potential
• Heating value approximation: unique heating value from existing literature → MJ/tn
• Energy stored within the biomass: biomass/year x LHV → MJ/year
• Potentially generable electricity estimation: energy stored x efficiency → kWh/year
• Heating value approximation: unique heating value from existing literature → MJ/tn
• Energy stored within the biomass: biomass/year x LHV → MJ/year
• Potentially generable electricity estimation: energy stored x efficiency → kWh/year

51
51
CHAPTER 4. DATA ANALYSIS, CALCULATIONS AND FINDINGS
To address each of the research questions, a quantitative analysis of existent
data was performed. In the first section, the population of the study and the
criteria underlying the choice of the sample are explained. Then, the main data
analyzed to address each research question is presented along with the
outcomes of each step.
4.1 Population and Sample
Because the design of this research is essentially developmental, the
selection of the sample, while determining the results, is not critical in that other
values can easily substitutable. The overall methodology as a whole can be
extrapolated to other situations.
In the following subsections, the territorial organization of Spain is explained
with the aim to determine the most appropriate sample. The criteria used to
select the sample are then explained by characteristics, such as population,
surface, population density and climate region.

52
52
4.1.1 Territorial organization of Spain
The country of Spain is politically organized into Autonomous Communities,
which would be tantamount to US States. Each Autonomy is constituted by one
or more provinces (see Figure 4.1). In total, Spain is constituted by 17
Autonomous Communities and two Autonomous Cities (Ceuta and Melilla)
(IDESCAT, 2013).
Source: http://2.bp.blogspot.com/-NGv3QJuxInw/T4htyPCXFMI/AAAAAAAAAMU/xjRcbZBMTGk/s1600/MAPA%2BPOLITICO053.jpg
Figure 4.1 Political organization of Spain
In terms of sampling design, these Autonomous Communities could be seen
as the strata while the whole country would be the population. Among the 17
existing divisions, Catalonia has been already pointed as one of those with
considerable technical potential for electricity production using both agricultural

53
53
and forest wood biomass (Gómez, Rodrigues, Montañés, Dopazo, & Fueyo,
2010). Because of this it has been selected as the general target for the study. In
addition, this selection is not only motivated by its technical potential, but also by
being the birthplace and location of professional education and training of the
researcher, who consequently has a deeper knowledge of its geography and
distribution of the territory than he would have for other areas.
Each of the 17 Autonomous Communities in Spain are, in turn, divided in
several comarques, which would be tantamount to a county in using English
terminology. In the case of the selected Autonomy, Catalonia, the Community
consists of 41 comarques (IDESCAT, 2013) (see Figure 4.2). Each comarca is
formed by several municipis, equivalent to townships, which are the smallest
political divisions in Spain. A total of 947 townships exist in Catalonia (IDESCAT,
2013).
The comarca where the study will be focused is Anoia, which is found in the
central area of Catalonia (see Figure 4.2) and which enjoys a significant area
covered by forests. In particular, Anoia has 47196 ha of its 118817 ha of total
surface covered by forests, from which 27478 ha correspond to wooded area and
the other 19718 are scrublands. Main data relevant for this project of the
comarca of Anoia is summarized in Table 4.1:

54
54
Table 4.1 Forest area data for the comarca of Anoia
Region surface (ha) 118,817
Forested area, CREAF (ha) 47196
Wooded area (ha) 27478 (58.22%)
Scrubland (ha) 19718 (41.78%)
Source: personal compilation based on IDESCAT (IDESCAT, 2012) and IEFC (Burriel, Gracia, Ibàñez, Mata, & Vayreda, 2000)
The reason behind the choice of Anoia is that the workplace of the
researcher is the Engineering School of Igualada, the capital city of that region,
where research teams are working together with local organizations to enhance
the deployment of renewable energies within the region.
Source: Edu365 educational website (Saló Fontdevila, 2012)
Figure 4.2 Regions constituting Catalonia

55
55
From the sample and region selected, and for simplification purposes, the
target of analysis was reduced to a single township from Anoia, in rural Catalonia.
It was very important to select a rural township; because that guarantees that a
significant amount of forest will be located within its territory. Accordingly, it is
likely that the available amount of forest wood biomass will be enough to supply
biomass-fuelled power plants while minimizing transportation costs and
environmental impacts.
According to the atlas of rural townships from Catalonia, a township is
considered rural according to its population and population density. There are
three different definitions that apply in the context of Spain (Generalitat de
Catalunya, 2010):
According to the National Statistics Institute from Spain, a rural
township is that with less than 2000 inhabitants
According to the Directorate-General of the European Commission
(EUROSTAT), a rural township have less than 100 inhabitants per
square kilometer
According to the Organization of the Economic Co-operation and
Development (OECD), a rural township is that with less than 150
inhabitants per square kilometer.
For the purpose of this study, the condition of population was narrowed to a
maximum of 1000 inhabitants within the township. In the region of Anoia, there
are many townships that fulfill these requirements, and they are represented in
yellow in Figure 4.3.

56
56
Source: Federació Anoienca de Comerç i Serveis (FACS, 2013)
Figure 4.3 Rural, semi-urban and urban townships in Anoia
Therefore, there are 20 out of Anoia’s 33 townships that can be considered
rural. From these 20 possibilities, the municipi of Argençola is the one with the
best information available, as the Technological Forestry Centre from Catalonia
(Centre Tecnològic Forestal de Catalunya, CTFC), made available the report of
Biomass Availability at the municipi of Argençola in 2009 (Codina & Rodríguez,
2009), and it also stands out for having almost half of its surface covered by
forests. These forests are mainly privately-owned. In particular, more than 96%
of them are private while less than 4% are publicly-owned (Codina & Rodríguez,
2009), what means that giving economic value to the biomass available there
would help to improve the lack of forest management present in the region.
It is also worth mention that Argençola is one of the townships declared as
high fire-risk township by the Catalonia government (Codina & Rodríguez, 2009).
57
57
Better management practices would help to reduce that high risk of wildfires by
reducing the excess of biomass that the forests may have.
According to the Forest Protection Association of the region, Argençola has
2974 hectares of forested area, representing 63% of the 4710 hectares occupied
by the township (Federació ADF Anoia, 2011), while according to the Centre for
Ecological Research and Forestry Applications, the land covered by forest equals
to 2811.40 hectares meaning almost 60% of the whole land covered by the
township (Burriel, Gracia, Ibàñez, Mata, & Vayreda, 2000). From these 2811.40
hectares, only 2191.56 hectares correspond to wooded area while the other
619.84 hectares are scrubland, as summarized in Table 4.2:
Table 4.2 Forest area data for the municipi of Argençola
Township surface (ha) 4710
Forested area, ADF Anoia (ha) 2974
Forested area, CREAF (ha) 2811.40
Wooded area (ha) 2191.56
Scrubland (ha) 619.84
Source: personal compilation based on IDESCAT (IDESCAT, 2012), IEFC (Burriel, Gracia, Ibàñez, Mata, & Vayreda, 2000) and Federació ADF Anoia (Federació ADF Anoia, 2011)
Therefore, a significant amount of energy can be generated using local
biomass resources and thus reducing the environmental impact of the electricity
produced. For the purposes of this study the smallest figure of 2191.56 hectares
was considered, being a conservative approach and considering that brushes are
not useful for electricity production applications.

58
58
4.1.2 Spanish climates
The population for this study is the country of Spain. Spain is a country within
the European Union (EU), placed in the Iberia peninsula, at the west edge of the
European continent. Spain is washed by both the Atlantic Ocean to the West and
the Mediterranean Sea to the East. Therefore, although Spain is a relatively
small country, several different climate areas exist in the nation. These different
climates are, according to the Köpen climate classification (Peel, Finlayson, &
McMahon, 2007), the oceanic, continental, mountainous, subtropical (only in the
Canarias islands), semi-arid and Mediterranean climates (Wikimedia Commons,
2012) (see Figure 4.4). This variability directly causes considerable asymmetries
in the types and amount of biomass available in the different regions.
It is also worth mentioning that, thanks to its particular climate, Spain is one
of the Mediterranean countries with the highest percentage of its area covered by
forest and other wooded land, only surpassed by Slovenia. In particular, Spain
has 55% of its area covered by wooded lands while the average of the
Mediterranean countries is 13.1% (FAO, 2011).
The sample selected, the municipi of Argençola, is found in the
Mediterranean climate area. Mediterranean climates have a huge variability in
both flora and fauna. Regarding the forests, the main species that can be found
in Mediterranean forests are fir, beech, pine and oak (FAO, 2011), depending on
the particular forests, but predominantly pine and oak.

59
59
Source: Wikimedia Commons (Wikimedia Commons, 2012)
Figure 4.4 Climate areas by geography
4.1.3 Validity and reliability
As a consequence of the high variability of climates in Spain, the validity of
the sample is restricted to those areas with a similar climate, i.e. Mediterranean
climate. However, that also makes the sample representative of other countries
in the Mediterranean basin such as France, Italy or Greece. It is also worth
mention that the ability to harvest biomass in each region is strongly linked to the
terrain where a particular forest is found and, therefore, the sample may not be
representative enough of regions with sheer or mountainous terrain.

60
60
4.1.4 Summary
From the population of the study, which is the country of Spain, a sample of a
single rural township was selected. This sample is the municipi of Argençola,
found in the comarca of Anoia, and the main criterion for this selection was the
geographical situation in central Catalonia, close to the location of the research
team which includes the researcher; the rural condition of that township, with less
than 1000 inhabitants in a township of 4710 hectares; and the accessibility of
information available.
The municipi of Argençola has 2974 hectares covered by Mediterranean
forest (Federació ADF Anoia, 2011), which means a 63% of the whole area of
the township.
Table 4.3 summarizes the main data for the sample selected:
Table 4.3 Main characteristics of the selected sample, municipi of Argençola
Municipi (township) Argençola
Comarca (region) Anoia
Population (2012) 245 inhabitants
Surface 4710 hectares (47.1 km2)
Population density (2012) 5.20 inhabitants/km2
Forest area 2191.56 hectares (21.92 km2)
Climate region Mediterranean
Source: personal compilation based on IDESCAT (IDESCAT, 2012), (Burriel, Gracia, Ibàñez, Mata, & Vayreda, 2000) and Atlas of Spain (Wikimedia Commons, 2012)
4.2 Amount and characteristics of available resource
Once selected the sample of the study, the next step was to assess how
much biomass is available within the township and find the heating value of such
biomass as the main characteristic. As previously stated, the amount of biomass

61
61
was calculated in terms of annual growth rate to assure that the resource is used
in a sustainable way, i.e., without consuming more than the forest can regenerate
by itself. The time frame of one year is appropriate for that purpose because it
coincides with the period of the cyclical climate variations of the region, so similar
figures of annual growth rate are likely to be expected among different years.
This annual growth rate will be measured in metric tons per hectare and year,
⁄ , so the total amount of biomass available will be obtained
multiplying that average value by the forest surface comprised within the
township (see §4.1.4)
To obtain a reliable figure of the available amount of biomass, several
sources were accessed, including databases such as the Forest inventory of
Catalonia (Burriel, Gracia, Ibàñez, Mata, & Vayreda, 2000) provided by the
Centre for Ecological Research and Forestry Applications (Centre de Recerca
Ecològica i Aplicacions Forestals, CREAF), technical reports such as the report
of Biomass Availability at the municipi of Argençola (Codina & Rodríguez, 2009)
provided by the Technological Forestry Centre of Catalonia (Centre Tecnològic
Forestal de Catalunya, CTFC), and papers from specialized journals and
organizations such as Biomass and Bioenergy or the Food and Agriculture
Organization, FAO.
4.2.1 Wood biomass studied
Wood biomass resource takes several forms, including forest residues and
wood wastes such as bark, wood chips and sawdust, and dedicated energy
62
62
crops. All of them are suitable for electricity production, together with other
agricultural crops and residues (Evans, Strezov, & Evans, 2010; Salomón,
Savola, Martin, Fogelholm, & Fransson, 2011). From all these types of wood
biomass suitable for electricity production, forest residues were selected as the
focus of this thesis because nurseries are prohibited by the Catalan government;
and regarding industrial residues, like those from timber industries, they are not
as much widespread as forests throughout Catalonia. Accordingly, the availability
of biomass coming from this source in the sample would not be representative of
the whole population. Instead, the usage of forest residues in the sample will lead
to higher amounts of available resource as well as more representative of the
entire population.
4.2.2 Types of forest found in the region of study
The types of forest and the area covered by them in both the comarca and
the municipi, were studied using information from two data sources: the Forest
Inventory of Catalonia, (Burriel, Gracia, Ibàñez, Mata, & Vayreda, 2000) and the
report of Biomass Availability at the municipi of Argençola (Codina & Rodríguez,
2009).
The first resource accessed is the Forest Inventory of Catalonia (Burriel,
Gracia, Ibàñez, Mata, & Vayreda, 2000), a comprehensive inventory of forests in
Catalonia, species that form each forest and yearly growth rate. These data is
presented in 8 Forestry Regions in which Catalonia was divided following their
own system; each region consisting on several comarques. The selected sample

63
63
is placed in the Forestry Region IV that comprises the comarques of Anoia,
Bages, Berguedà and Solsonès.
The database provides information about the main tree species found in the
region. In the Anoia, the predominant species are, sorted by importance:
Pinus halepensis, commonly known as the Aleppo pine or pi blanc in
Catalan.
Source: http://www.conifers.org/pi/pi/halepensis01.jpg
Figure 4.5 Pinus halepensis
Pinus nigra, commonly known as European black pine or pinassa in
Catalan.
Source: http://www.plantsystematics.org/users/kcn2/4_13_10_s/2010_April_13_Plantations_212.jpg.48.jpg
Figure 4.6 Pinus nigra

64
64
Pinus pinea, commonly known as stone pine or pi pinyoner in Catalan.
Source: http://upload.wikimedia.org/wikipedia/commons/0/0a/Pinus_pinea_Wellington_Botanic_Gardens.jpg
Figure 4.7 Pinus pinea
Quercus humilis or quercus pubescens, commonly known as downy
oak or roure martinenc in Catalan.
Source: http://2.bp.blogspot.com/-xm3gP45G8gs/TZ2kiE3LnqI/AAAAAAAAAVs/CTRynEdaAGo/s1600/IMG_5110.JPG
Figure 4.8 Quercus pubescens

65
65
Quercus ilex, commonly known as holm and holly oak or alzina in
Catalan.
Source: http://upload.wikimedia.org/wikipedia/commons/thumb/5/55/Mendaza,_Navarra_Spanien-Steineiche.jpg/220px-Mendaza,_Navarra_Spanien-Steineiche.jpg
Figure 4.9 Quercus ilex
In addition to these predominant tree species, other species can also be
found in the region of Anoia. Among these are the oaks family such as the
quercus faginea, commonly called Portuguese oak or roure de fulla petita, and
some of the pines family such as the pinus sylvestris, also called scots pine or pi
roig.
The second set of data accessed is the report of Biomass Availability at the
municipi of Argençola (Codina & Rodríguez, 2009), an assessment of the
existing forestry area in Argençola made by the Technological Forestry Center of
Catalonia. According to them, the forest cover found in that township can be
classified in two categories:
Medium mountain: within the small mountains found in the region,
there are mainly pinus nigra (see Figure 4.6), together with quercus

66
66
pubescens (see Figure 4.8) and quercus faginea, among other trees
with less significance.
Mediterranean lowland: most of the region of Anoia has this type of
vegetation, where the pinus halepensis (see Figure 4.5) predominates
along with the pinus pinea (see Figure 4.6) and the quercus ilex (see
Figure 4.9). In this type of forests, there are a lot of bushes on the
ground, but they’re not considered for not being useful as a source of
biomass.
In the particular case of this sample, the technicians of the CTFC divided all
the forest area in 5 different kinds of forests according to the species that can be
found: monospecific forest of pinus halepensis, monospecific forest of pinus nigra,
mixed forest of pinus halepensis and pinus nigra, mixed forest of conifers (pinus)
and oaks (quercus) and monospecific forest of oaks.
The relative importance of each species in the region studied according to
Burriel, et al., (2000), is shown in Figure 4.10. For accurate information on forest
area covered by each species, as well as the actual number of trees that can be
found, please refer to Appendix A. Please note that the tree distribution is slightly
different from the surface distribution as there are some species such as the holly
oak that, although present in many parts of the region, rarely form dominant
masses of forest.
The relative importance of each species in the sample selected, Argençola,
according to Codina and Rodríguez (2009) is shown by the type of forests
defined by them, and is represented in Figure 4.11.

67
67
The area covered was selected as indicator of relative importance of each
species because the number of trees is not indicative in those cases where the
trees are scattered or found as a secondary species or in the lower layers of a
forest. On the other hand, the forest surface provides better information about
how much importance has a particular species, because it shows how much area
is covered by it.
Figure 4.10 Relative importance of tree species in the comarca of Anoia
P. HALEPENSIS 66%
P. NIGRA 14%
P. PINEA 7%
Q. PUBESCENS 4%
Q. ILEX 3%
Q. FAGINEA 2%
OTHER CONIFERS
1% MIXED FOREST 3%
Source: Personal compilation based on IEFC (Burriel, Gracia, Ibàñez, Mata, & Vayreda, 2000)

68
68
Figure 4.11 Relative importance of tree species in the municipi of Argençola
The distributions presented above suggest that Argençola is quite far from
the distribution of forest vegetation found in the region where it is placed because
in Argençola the relative importance of the Aleppo pine is significantly smaller
due to the increased presence of European black pine. However, these two
species are very similar as they belong to the same tree family, the pines, so
they share most of their characteristics. If we look at the relative importance of
tree species in terms of tree families, we can see that in the comarca of Anoia,
the pines are found in 91% of the forests while in Argençola this family covers 95%
of the forest surface. Therefore, although the distribution of the different species
is quite different in the sample compared with the region, the properties relevant
to this study such as the heating value or the moisture content will be similar
because almost all the forest surface is covered by trees from the pine family.
P. HALEPENSIS 45%
P. NIGRA 32%
P. HALEPENSIS & NIGRA
18%
CONIFERS & OAKS
5%
OAKS 0%
Source: Personal compilation based on report of Biomass Availability at the municipi of Argençola (Codina & Rodríguez, 2009)

69
69
4.2.3 Annual growth rate
The main output sought with the assessment of biomass availability in the
area of study is the annual growth rate of the forests, expressed in metric tons of
dry biomass per hectare and year. Obtaining such value was done with a
calculation based on growth rates of the species found in the sample and their
relative significances and was checked using data available from the literature.
4.2.3.1 Growth rate calculation
First step was the growth rate calculation using the growth rate of the tree
species found in the forests of the sample.
In the Forest Inventory of Catalonia, Burriel, Gracia, Ibàñez, Mata and
Vayreda (2000) provide the annual growth rate of all the species found in a
certain region in . These annual growth rates are given for wood,
branches and bark, together with the total (sum of the three rates).
The values of wood and total annual growth rates of the main species found
in Anoia are summarized in Table 4.4:

70
70
Table 4.4 Annual growth rates of predominant trees in the comarca of Anoia
Tree species Wood annual growth
rate ( ) Total2 annual growth
rate ( )
Pinus halepensis 1.5 2.3
Pinus nigra 1.8 2.7
Pinus pinea 1.0 1.7
Quercus pubescens 0.7 1.1
Quercus ilex 0.4 0.7
Source: personal compilation based on IECF (Burriel, Gracia, Ibàñez, Mata, & Vayreda, 2000)
1 Tons of dry matter
2 Total growth rate equals the sum of wood, bark, leaves and branches growth rates
From the annual growth rates presented above (see Table 4.4), and
considering the distribution of the species in the selected sample (see Figure
4.11), an estimation of the average annual growth rate can be obtained. The mix
of pinus halepensis and nigra has been considered to be exactly 50-50%. The
mix of conifers and oaks have been considered to be 50% p. pinea and the
remaining 50% an equal mixture of quercus pubescens and ilex with an average
growth rate of 0.55. For the purpose of this thesis, only the wood annual growth
rate was considered, provided that branches and bark are not usually useful for
electricity production. The following result was obtained:
(1)
4.2.3.2 Reliability and validity of the obtained value
The validity of the measure of growth rate is guaranteed by the authority of
the data sources accessed which are a technical report from public research

71
71
center and the national forest inventory of Catalonia. In addition, the reliability, as
explained below, was also checked using data from specialized journals ensuring,
in turn, the validity of the calculation.
To check the reliability of the obtained value, it was compared with data
available on the specialized literature.
The first source accessed is the Forest Inventory of Catalonia itself (Burriel,
Gracia, Ibàñez, Mata, & Vayreda, 2000). The researchers from CREAF obtained
the average figure of annual growth rate of dry wood in the whole region of Anoia,
which is .
The second source accessed is an article from a research group in the Fluid
Mechanics department of the University of Zaragoza. The article, called The
potential for electricity generation from crop and forestry residues in Spain
(Gómez, Rodrigues, Montañés, Dopazo, & Fueyo, 2010) and published in the
Biomass and Bioenergy journal, assesses the potential for electricity generation
from both agricultural and forestry residues in Spain. From several sources
accessed, the authors provide the following annual growth rates for the main tree
families found in Spain (see Table 4.5):

72
72
Table 4.5 Yearly growth rate of some tree species
Category Category
Fir 0.9 Bushes 0.5
Maple 1.0 Other 0.5
Mixed forest 0.8 Pine 1.6
Chestnut 1.3 Poplar 3.9
Cypress 1.1 Meadow 0.0
Eucalyptus 1.5 Oak 1.0
Beech 0.7 Willow 1.2
Ash tree 0.9 Tamarisk 0.9
Juniper 0.9 Elm 1.0
Source: Gómez, Rodrigues, Montañés, Dopazo and Fueyo (2010), emphasis added
1 Tons of dry matter
As shown, the annual growth rates of the main species found in the sample,
i.e., pines and oaks, are claimed to be for pines and
for oaks. With these values, the average growth rate
considering the tree distribution provided by Codina and Rodríguez (2009) (see
Figure 4.11) is:
(2)
The third and last source accessed with comparison purposes is the article
Assessment of forest biomass for use as energy. GIS-based analysis of
geographical availability and locations of wood-fired power plants in Portugal
(Viana, Cohen, Lopes, & Aranha, 2010) published in Applied Energy. In their
research, the authors analyze the availability of eucalyptus and pine forestry
residues in several regions of Portugal. For the purposes of this study, the
73
73
comparison is done with the North region because all other regions are
significantly Southern than the sample studied, so big climate differences are
likely to be expected. From the results provided in the article, it can be inferred
that the production of biomass in tons per hectare and year is:
(3)
The result obtained using the equation above is . Again,
the figure is expressed in tons of dry wood.
4.2.3.3 Annual growth rate choice
Once performed the checking step, the first calculated figure of
1.6 tn1/(ha·year) was selected as the annual growth rate to consider in this study.
The reasons behind this selection are that all other estimates, although they
approach the result obtained, are calculated under different assumptions of tree
species found in the forest and annual growth rate of these species.
The value given by the researchers of CREAF in the Forest Inventory of
Catalonia (Burriel, Gracia, Ibàñez, Mata, & Vayreda, 2000) was lower because
that value is provided for the whole region of Anoia where the European black
pine has a lower significance (14% in Anoia in front of 32% in Argençola, see
Figure 4.10 and Figure 4.11). Since this species has a higher growth rate than
other pines, the final weighted average is increased leading to the observed
divergence.
1 Tons of dry matter, considering only wood production (leaving bark, branches and leaves apart)
74
74
The value obtained using the data provided by Gómez, Rodrigues, Montañés,
Dopazo, and Fueyo (2010) is also lower than the first calculated. This difference
is caused by the growth rates used to perform the calculation. The authors
provide an average figure for tree families as a whole and, once again, the fact
that in the sample the prevalent species is the European black pine with a higher
growth rate increase the calculated value. In this case the difference is so slight
that the rounded result equals the calculated one.
Finally, the value obtained using the data from Viana, Cohen, Lopes, and
Aranha (2010) is less accurate than the previous ones given the applicability of
the data to the idiosyncrasies of the sample. The researchers provide a unique
growth rate value for a mix of eucalyptus and maritime pine (pinus pinaster) and
their research is conducted in Portugal. In addition, although the data for the
Northern region of Portugal was used, which corresponds to a climate as similar
as possible to the sample, the tree species are different from those to the sample
and the precipitation and temperature patterns are also different.
However, even with their limitations as predicting values, all data observed in
the literature provide both reliability and validity to the calculation performed
insofar that their magnitude is close to that of the calculated value.
4.2.4 Heating value of existing biomass
In addition to the amount of available resource, another important parameter
of the resource is the heating value of it, a magnitude that represents the
chemical energy stored within the biomass. The heating value was calculated

75
75
using empirical formulas and the validity and reliability of the obtained value were
checked using data from existing literature.
4.2.4.1 Heating value calculation
The heating value of biomass was calculated using data available in the
existing literature. It is worth distinguishing between the higher heating value
(HHV) and the lower heating value (LHV). The former is basically the energy
content in dry material, while the latter is the energy content obtained after
subtracting the energy needed to evaporate the water formed from the hydrogen
in the material and the moisture content from the HHV. Therefore, the LHV has
an inverse relationship with the degree of moisture, i.e., the LHV decreases as
the moisture content increases (Erhart, Strzalka, Eicker, & Infield, 2011).
For the purposes of this study, the LHV was used because when calculating
the efficiency of the whole process the result accounts for the biomass drying
process. The water content was assumed to be 30%, which is the value at which
the chipping process is usually performed (Whittaker, Mortimer, Murphy, &
Matthews, 2011).
The LHV “wet”, i.e., accounting for the water content, was obtained from the
HHV “dry ash free”, i.e., of the fuel completely dry and without the ash content,
using the equation provided by Quaak, Knoef and Stassen (1999) in Annex 1 of
their book:
(4)

76
76
The formula can be rearranged as follows (Quaak, Knoef, & Stassen, 1999):
( )
{
(5)
The HHV, hydrogen content and ash content values were obtained from the
Phyllis database (ECN, 2009). For pine wood chips HHV and hydrogen content
of dry matter free of ashes are 20.4 MJ/kg and 6.2% respectively and the ash
content of wet biomass is 3%. Therefore, the LHV of wood chips at 30% moisture
is:
(6)
4.2.4.2 Validity
The obtained value of 12.8 was checked with data from the literature.
Whittaker, Mortimer, Murphy and Matthews (2011), provide the value of 12.1
for LHV of biomass at 30% moisture, which only differs in 0.7 to the
value obtained above.
Vallios, Tsoutsos and Papadakis (2009) reported that typical LHV of biomass
range from 10.8 to 15.9 , varying with the moisture content, and for
their analysis they picked the value of 13.69 GJ/tn corresponding to a 20% of
moisture content. This figure is slightly higher than the one obtained, a result that

77
77
should be expected provided that the moisture content assumption for the
purposes of this thesis was higher leading to a lower LHV.
Values of both HHV and LHV were also found in another paper for different
wood biomass fuels such as wood pellets, wood chips, bark or sawdust
(Obernberger, 1998). The values are presented in kWh/kg in the article, but for
consistency they are presented in (or ) in Table 4.6:
Table 4.6 Gross calorific value, water content and net calorific value of different wood biofuels
Wood biofuel Water content (%)
HHV ( ) LHV ( )
Wood pellets 10.0 19.8 16.56
Wood chips: hardwood, pre-dried 30.0 19.8 12.24
Wood chips: hardwood 50.0 19.8 7.92
Wood chips: softwood, pre-dried 30.0 19.8 12.24
Wood chips: softwood 50.0 19.8 7.92
Grass: high pressure bales 18.0 18.36 13.68
Bark 50. 20.16 8.28
Triticale (cereals): high pressure bales
15.0 18.72 14.4
Sawdust 50.0 19.8 7.92
Straw (winter wheat): high pressure bales
15.0 18.72 14.4
Source: Self-calculation from Obernberger (1998), emphasis added
In this case the comparable values are those given for softwood pre-dried
wood chips, in this case, 12.24 . Again, although slightly smaller, the value
given in Obernberger (1998) is very highly close to the previously calculated one.
In this case the difference is likely to be related to the usage of a type of wood
other than pine.

78
78
4.2.4.3 Heating value selection
The calculated value was again selected as the most accurate result, while
all other values obtained from the literature (Whittaker, Mortimer, Murphy, &
Matthews, 2011; Vallios, Tsoutsos, & Papadakis 2009; Obernberger, 1998)
suggest reliability of both the method and the result due to a very similar order of
magnitude with the calculated one as well as consistency in the variation pattern
with moisture content. The selection of the calculated result was justified by the
higher accuracy that provides the usage of the specific type of biomass found in
the region in form of forestry residues, i.e. pine wood chips.
4.2.5 Amount and chemical energy of yearly available resource
According to the results obtained in the previous calculations (see §4.2.3 and
4.2.4), the average annual growth rate of the existing biomass within the sample
is 1.5868 tons of dry matter per hectare and year, with a heating value of
12.8247 GJ/tn. Such biomass is spread over forests that cover 2191.56 hectares
as presented in the sample selection section (see §4.1). Therefore, the gross
amount of dry biomass available within the forests found in the sample is:
2 (7)
This amount of biomass stores the following amount of chemical energy.
Please note that the LHV is used so the chemical energy does not account for
the energy necessary to dry the feedstock. Accordingly, the amount of biomass
2 Tons of dry matter

79
79
has been increased by 30% to consider the increased weight due to having a wet
biomass as a fuel input.
(8)
4.2.6 Summary
The availability of biomass in the studied sample was assessed from the tree
species found in the forests of the area under study and the extension of them.
The outputs sought were the annual growth rate of forest wood biomass
expressed in tons3 per hectare and year and the heating value of such biomass
in gigajoules per ton.
After a comprehensive study of the types and extension of forests found in
the region, the average annual growth rate was obtained from the growth rates of
each tree species weighted with the proportion of area covered by them. The
obtained value was validated through a comparison with data found in the
specialized literature. The selected value for this thesis is presented in Table 4.7.
The lower heating value of biomass was identified as the relevant value for
further calculations, as it accounts for the energy required to dry the biomass. A
tentative moisture value of 30% was selected according to information found in
the literature. Again, the reliability and validity of the obtained result was checked
by comparison with data found in specialized journals. The selected value for this
thesis’ purposes is presented in the table below (see Table 4.7).
3 Tons of dry matter, considering only wood production (leaving bark, branches and leaves apart)

80
80
Table 4.7 Outcomes of the resource assessment step
Output Value (units) Source
Average annual growth rate 1.6 ( Self-calculation
Gross amount of biomass 3506.50 ( ) Self-calculation
HHV, dry matter ash free 20.4 ( ) (ECN, 2009)
LHV, 30% moisture 12.8 ( ) Self-calculation
Chemical energy available 58348.16 ( ) Self-calculation
Source: personal compilation.
1 Tons of dry matter
4.3 Technology selection
The third and final analytical step consists on an analysis of the efficiencies
of current biomass conversion technologies for electricity production and
selection of a proper technology considering the idiosyncrasies of the sample
selected such as amount and type of biomass available. After analyzing the
current efficiencies of commercial technologies, a proper power output was
selected according to the amount of biomass available in the sample. Then, the
technology with higher efficiency was selected as the most appropriate and the
average efficiency of that technology was approached using data from literature.
4.3.1 Assessment of current efficiencies of available technologies
A comprehensive analysis of existing efficiency data available in the literature
was performed. The functional unit to compare different efficiencies of available
technologies was the electrical power output. Therefore, data of both electrical
and overall efficiencies were collected along with the electrical power output.
Please refer to Appendix B for detailed information of data.

81
81
The technologies considered were those that were commercially available at
the time of the study. To ascertain which ones fulfill this condition, several papers
were accessed. According to the review Small-scale biomass CHP plants in
Sweden and Finland by Salomón, Savola, Martin, Fogelholm and Fransson
(2011), the commercially available technologies are conventional Rankine cycle
(steam turbine), gas turbine with heat recovery steam generator (BIGCC), steam
engines, microturbines, internal combustion engines (ICE) and Stirling engines.
Several articles reported efficiencies from actual experiences using these
technologies. Another technology to be considered currently available is the
Organic Rankine cycle (ORC), according to some reviews (Barbieri, Spina, &
Venturini, 2012; Dong, Liu, & Riffat, 2009). In addition, there are some articles
reporting efficiencies from existing ORC-based power plants fuelled with wood
biomass (Bini, Di Prima, & Guercio, 2010; Erhart, Strzalka, Eicker, & Infield, 2011;
Obernberger & Hammerschmid, 2001; Obernberger, Thonhofer, & Reisenhofer,
2002).
There are significant differences in suitability of these technologies regarding
the scale of the power plant. For example, for small residential buildings or
medium-size public or industrial buildings, ICEs, microturbines and Stirling
engines have been identified as the most competitive options (Alanne & Saari,
2004; Kuhn, Klemes, & Bulatov, 2008; Monteiro, Moreira, & Ferreira, 2009;
Onovwiona & Ugursal, 2006). Other authors add to these technologies the ORCs
(Barbieri, Spina, & Venturini, 2012). On the other hand, in regard to large-scale,
the most efficient technologies are the conventional Rankine cycles and the gas
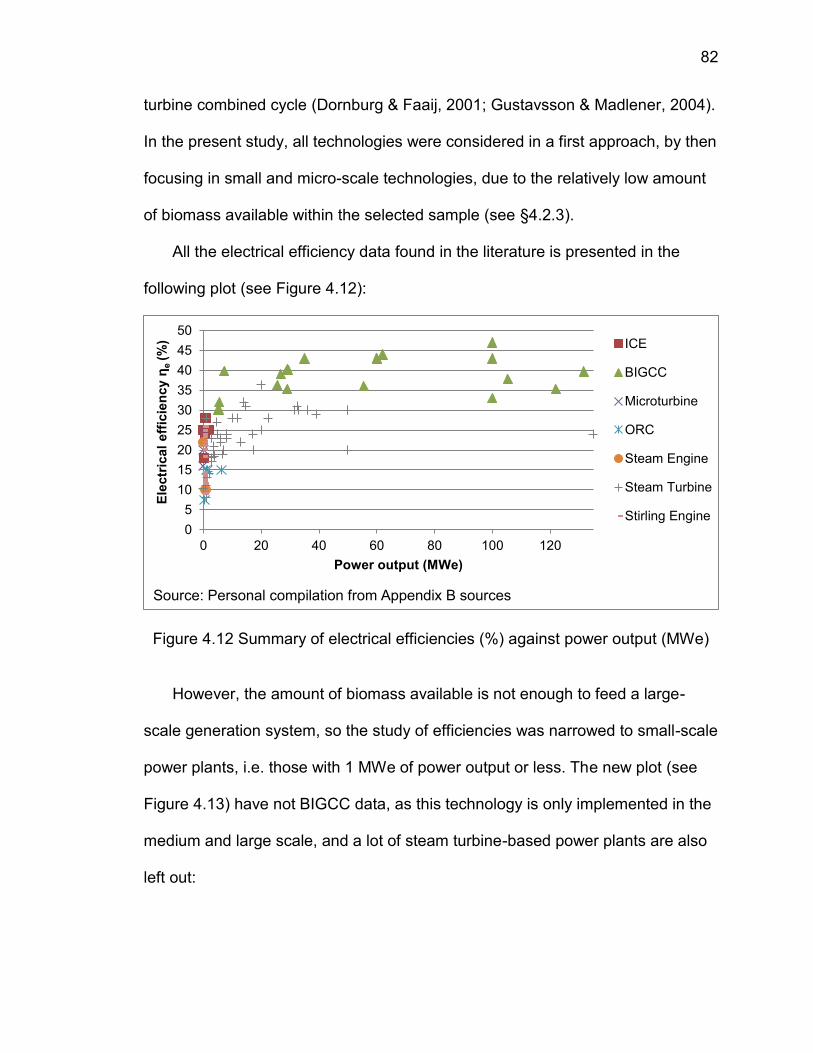
82
82
turbine combined cycle (Dornburg & Faaij, 2001; Gustavsson & Madlener, 2004).
In the present study, all technologies were considered in a first approach, by then
focusing in small and micro-scale technologies, due to the relatively low amount
of biomass available within the selected sample (see §4.2.3).
All the electrical efficiency data found in the literature is presented in the
following plot (see Figure 4.12):
Figure 4.12 Summary of electrical efficiencies (%) against power output (MWe)
However, the amount of biomass available is not enough to feed a large-
scale generation system, so the study of efficiencies was narrowed to small-scale
power plants, i.e. those with 1 MWe of power output or less. The new plot (see
Figure 4.13) have not BIGCC data, as this technology is only implemented in the
medium and large scale, and a lot of steam turbine-based power plants are also
left out:
0
5
10
15
20
25
30
35
40
45
50
0 20 40 60 80 100 120
Ele
ctr
ical
eff
icie
ncy η
e (%
)
Power output (MWe)
ICE
BIGCC
Microturbine
ORC
Steam Engine
Steam Turbine
Stirling Engine
Source: Personal compilation from Appendix B sources

83
83
Figure 4.13 Summary of electrical efficiencies (%) of small-scale existing power plants against power output (kWe)
To clarify the efficiencies in the micro-scale range, an enlargement was done,
limiting the power output to 50 kWe, the upper limit of micro-scale cogeneration
technologies. The resulting plot is presented in Figure 4.14.
Figure 4.14 Summary of electrical efficiencies (%) of micro-scale existing power plants against power output (kWe)
0
5
10
15
20
25
30
0 200 400 600 800 1000
Ele
ctr
ical
eff
icie
ncy η
e (%
)
Power output (kWe)
ICE
Microturbine
ORC
Steam Engine
Steam Turbine
Stirling Engine
Source: Personal compilation from Appendix B sources
0
5
10
15
20
25
30
0 10 20 30 40 50
Ele
ctr
ical
eff
icie
ncy η
e (%
)
Power output (kWe)
ICE
Microturbine
ORC
Steam Engine
Steam Turbine
Stirling Engine
Source: Personal compilation from Appendix B sources

84
84
All distributions show a similar pattern that was, of course, anticipated: the
bigger is the power plant output, the higher is the electrical efficiency. However,
there seems to be a technological limit to that efficiency. For large-scale
technologies, this threshold is about 45%, for small-scale technologies it is
slightly less than 30% and for micro-scale technologies, it is approximately 25%.
4.3.2 Selection of a tentative power output
The selection of an appropriate power output was done using an estimative
process. The power output of a hypothetical power plant depends on the
efficiency of the technology selected and the most appropriate technology and its
efficiency depends on the scale of generation, i.e. the power output. Therefore,
the selection was done approaching the efficiency of the power plant by then
calculate the approximate output of a power plant that would use the available
energy from the biomass resource with the approximate overall electric efficiency
and while operating a certain number of hours, value that was obtained from
literature.
Having obtained the chemical energy stored in the yearly available biomass
(see 4.2.5), the hours of operation of a hypothetical power plant and the
approximate efficiency are the last parameters left to calculate the tentative
power output. Kuhn, Klemes, and Bulatov (2008) claim that “the number of hours
in full usage differs (…) between 1250 and 8000h” (Kuhn, Klemes, & Bulatov,
2008; p. 2042). From all this range, the value of 5500 hours was selected for
being the upper limit of the design value of natural gas combined cycle power

85
85
plants in Spain (Navarro, 2011), which are the more similar power plants in terms
of usage patterns. For the electrical efficiency, an approximate value of 30%,
which is the upper limit for small-scale power plants (see §4.3.1), was chosen.
With these values, the tentative size of the power plant would be:
(9)
4.3.3 Technology selection and average efficiency
From the estimation of the technically feasible power output, it was obtained
the figure of 884 kWe of electrical generation (see section above).
That means that, using the amount of wood biomass produced by the forests
within the township of study during a year, one power plant of approximately 885
kW of electric output could be fuelled during 5500 hours of operation in a year,
more than 60% of the time. The selection of 5500 hours of operation was made
by comparison to usage patterns of natural gas combined cycle power plants
because these power plants show a similar usage patterns than biomass-fuelled
power plants due to the controllable supply of both as well as relatively quick
ignition and shutdown that allow them to be a backup for renewable sources.
Obviously, the same amount of biomass could be used to fuel several smaller
power plants that together add up to 884 kWe of installed capacity, for example if
a distributed generation scheme was adopted in the township with the installation
of micro-scale cogeneration systems in several residential buildings. However,
that would mean a decrease in efficiency according to the pattern observed in the

86
86
assessment of current efficiencies (see §4.3.1). Thus, a single power plant was
the configuration chosen for the study.
At that such scale of generation, the most appropriate technology in terms of
current efficiency is the internal combustion engine (ICE) fed with syngas from
biomass gasification, with an overall electrical efficiency somewhere between 25
and 30% (see Figure 4.13). Due to the lack of specific data – the closest datum
of efficiency found corresponds to 28% of efficiency at 700 kWe – the efficiency
was approached to the value of 25%, being that a conservative value – the actual
efficiency could be greater than 25% but it is very unlikely to be smaller.
4.3.4 Validity and reliability
The solution adopted as “best” is valid only under the assumption that the
power plant will be in operation during approximately 60% of year. Slightly
variations of this figure are not going to affect the validity of the choice, especially
if these variations mean higher usage ratios, but lower usage ratios could lead to
higher installed capacity and thus switch the choice of the better technology to
other options. However, as the main purpose of such hypothetical power plant is
to supply electricity, which is an energy commodity used daily, high usage ratios
should be expected as long as it is economically feasible, and in this thesis the
potential for electricity generation is being assessed so the hypothesis of lower
usage ratios for strategic purposes was not considered.
The reliability of the result is assured by the authority of the data sources
used to determine the electrical efficiency variation with power output pattern and

87
87
values, as well as by the reliability of previously obtained results for growth rate
and heating value of the wood biomass found in within the sample. Regarding
the use of an arbitrarily chosen efficiency value, an iterative process could have
been done in case of having observed a great disparity between the chosen and
the obtained value, although it was not necessary as the choice was made using
the upper limit of small-scale technologies.
4.3.5 Summary
After a comprehensive analysis of data found in the specialized literature
about electrical efficiencies from actual power plants fueled with wood biomass, a
general pattern of electrical efficiency against power output was identified. The
next step was the calculation of a tentative electricity output of a hypothetical
power plant that would use the available resource characterized in terms of
amount and heating value in the previous section (see §4.2). Since the most
appropriate technology is strongly linked to the size of the power plant, the
amount of electricity technically feasible to produce was calculated from the
amount of wood biomass produced by the forests found within the sample, the
heating value of such biomass and a tentative efficiency and number of hours of
operation of the power plant. The result was not anything else than a rough
approach, but enough to select the better conversion technology according to the
scale of generation. Once the technology was selected, the efficiency was
calculated from the data analyzed in §4.3.1. In this case, the chosen figure was a
downward approximation, due to the lack of specific data of electrical efficiency.
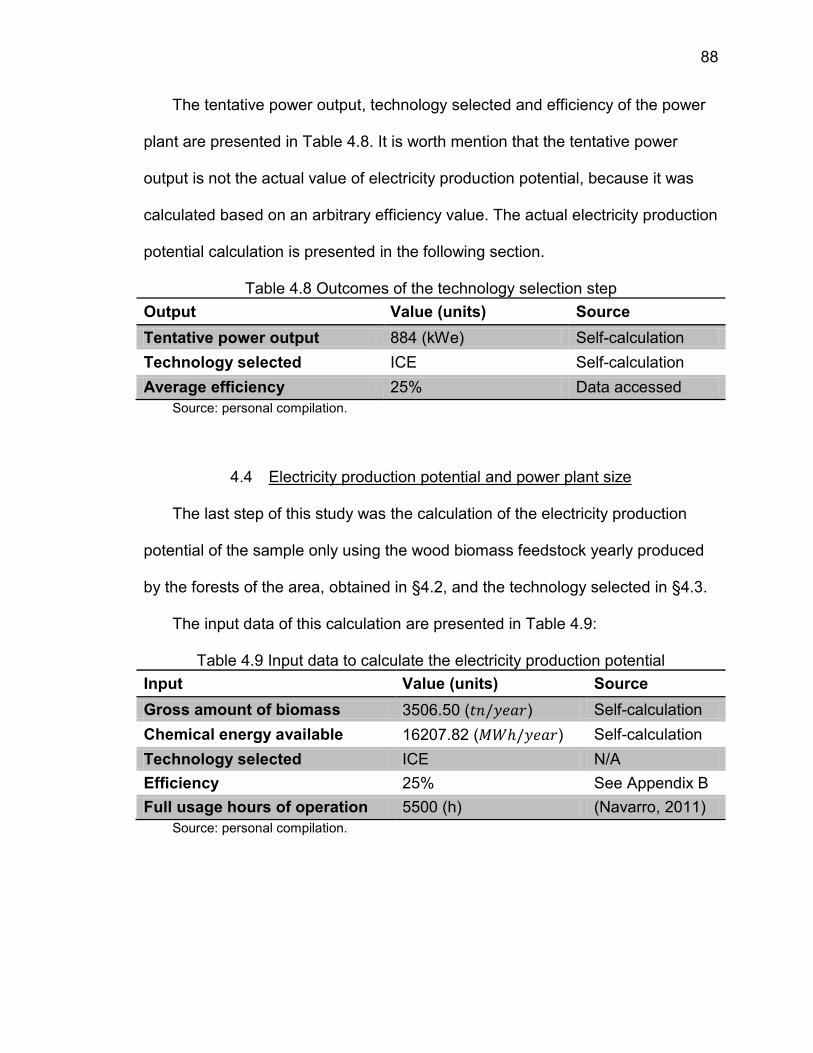
88
88
The tentative power output, technology selected and efficiency of the power
plant are presented in Table 4.8. It is worth mention that the tentative power
output is not the actual value of electricity production potential, because it was
calculated based on an arbitrary efficiency value. The actual electricity production
potential calculation is presented in the following section.
Table 4.8 Outcomes of the technology selection step
Output Value (units) Source
Tentative power output 884 (kWe) Self-calculation
Technology selected ICE Self-calculation
Average efficiency 25% Data accessed
Source: personal compilation.
4.4 Electricity production potential and power plant size
The last step of this study was the calculation of the electricity production
potential of the sample only using the wood biomass feedstock yearly produced
by the forests of the area, obtained in §4.2, and the technology selected in §4.3.
The input data of this calculation are presented in Table 4.9:
Table 4.9 Input data to calculate the electricity production potential
Input Value (units) Source
Gross amount of biomass 3506.50 ( ) Self-calculation
Chemical energy available 16207.82 ( ) Self-calculation
Technology selected ICE N/A
Efficiency 25% See Appendix B
Full usage hours of operation 5500 (h) (Navarro, 2011)
Source: personal compilation.

89
89
The electricity production potential is the amount of electricity that can be
produced using the ICE technology with 25% efficiency. Thereby, it was
calculated as follows:
(10)
The calculation of the power plant size is an analogue process to the
tentative power output calculation, but using in this case valid and reliable data of
efficiency instead of an arbitrarily chosen one. The result, therefore, is:
(11)
Therefore, it can be concluded that, in the township of Argençola, there is the
potential for generating about 3000 MWh of electricity each year only using the
wood biomass that is yearly produced by the forests found in the township. This
electricity would be obtained in a 735 kWe ICE-based power plant, i.e. a power
plant consisting on a gasifier coupled to an internal combustion engine.
Nevertheless, the overall energy production potential could be increased if
heat production was considered. According to the accessed data, the overall
efficiency is about 90% for the selected technology and power plant size (see
Appendix B), again rounding down the value to make a conservative approach.
Thereby, the thermal efficiency would be about 65%, meaning that for each Watt
of electricity produced; more than two and a half Watts of heat would be
additionally generated. So, if thermal energy demand was found nearby the

90
90
power plant, the overall efficiency could be increased improving the exploitation
of the available resource.
The heat production potential, using the above mentioned figures would add
up to the following value. Please note that the estimation of how much heat is
produced has not been made considering the most efficient technology, but it has
been made considering how much heat is additionally produced using the most
efficient technology for electricity production.
(12)
Such heat would be produced in the combined heat and power plant that
would be equivalent to a heat generation plant of the following size:
(13)
The results are summarized in Table 4.10:
Table 4.10 Electricity production potential of the sample and optimal power plant size
Input Value (units) Source
Electricity production potential ~4000 ( ) Self-calculation
Optimal power plant size ~735 ( ) Self-calculation
Heat production potential ~10500 ( ) Self-calculation
Equivalent heat generation plant ~1915 ( ) Self-calculation
Source: personal compilation.

91
91
CHAPTER 5. CONCLUSIONS, DISCUSSION AND RECOMMENDATIONS
Many conclusions can be extracted from the gathered results and findings
detailed in the previous chapter. These are presented in this final chapter after a
short summary of the research questions, the employed methodology and the
main findings. After that, a discussion about the data analysis and implications of
this research are presented. Finally, some recommendations for future work,
including industrial practices and research to be done, are suggested.
5.1 Summary of Research Questions, Methodology and Findings
As a reminder for the readers, the research questions that were laid out are
the following:
How much forest wood biomass is available in a sample township in rural
Catalonia?
What is the most suitable commercially available technology for small-
scale electricity generation using forest biomass?
How much electricity can be generated using the available forest wood
biomass in the township under study and the selected technology?

92
92
In the last chapter, all of them were addressed.
The available amount of biomass was calculated multiplying the average
annual growth rate – obtained using the annual growth rate of the tree species
found in the forests of the sample weighted using their significance in terms of
area covered – by the total area covered by forest in the sample. Additionally, the
heating value of biomass was calculated to obtain the amount of chemical energy
stored in the available biomass resource.
The selection of the most suitable technology to maximize the advantage
taken of the available biomass in terms of electricity production was made
calculating a tentative power output of a hypothetical power plant and looking the
efficiency of commercially available technologies at that scale of generation. A
comprehensive analysis of actual power plant data efficiency was made to
ascertain the pattern and values that the electrical efficiency of biomass-based
power plants shows with plant size variations.
Finally, the potential for electricity production in the sample and the power
plant size were determined multiplying the available chemical energy by the
efficiency of the technology selected and dividing it by the number of hours of full
usage, a value taken from the natural gas cogeneration power plants which are
the most similar ones in usage patterns to a biomass-based power plant.
5.2 Conclusions
After performing the data analysis and calculations detailed in Chapter 4, the
conclusions and findings detailed below were obtained:

93
93
5.2.1 Conclusions of Research Question 1
The analysis of size and characteristics of forest cover in the sample yielded
to an average growth rate of 1.6 which, in a township with 2191.56
hectares of forest means 3506.50 of available biomass. This figure only
accounts for that biomass that forests produce each year, so the usage of this
entire amount would not jeopardize at all the size and health of existing forests.
Then, the heating value of the biomass was calculated. Considering that 95%
of the forested cover of the sample consists of pine forest, the heating value of
pine wood chips was the target value. The lower heating value was identified as
the relevant calorific value as it subtracts the energy required to dry the biomass,
and it was calculated for biomass with 30% moisture content according to the
accessed literature. The figure of 12.8 was obtained, which led to the result
of 58348.16 of available energy.
The results show that there is a significant amount of biomass available in
rural areas of Catalonia similar to the sample selected. It is also worth mentioning
that, nowadays, this biomass is not being used in any way, so there is a missed
opportunity of taking advantage of a valuable resource that is self-produced by
the forests. Additionally, that would help to reduce the risk of wild fires that is
significant in Mediterranean regions.
5.2.2 Conclusions of Research Question 2
The assessment of current efficiencies of biomass-based power plants
showed a pattern of increasing efficiency with size of the plants. The relationship,
94
94
although being clearly positive, was not lineal; it showed a potential behavior with
an upper limit that was around 45% for large-scale technologies, significantly
lower for small-scale technologies (30%), and even lower for micro-scale
technologies (25%). According to this observed pattern, the best configuration to
maximize the exploitation of the available resource is a single power plant with
the higher output as possible.
The most appropriate technology depends on the scale of generation. While
for large-scale power plants BIGCC and steam turbines show the best behavior,
for small-scale and micro-scale internal or external combustion engines perform
better. Thus, after obtaining an approximate power plant size of 884 kWe for
5500 hours of full usage, the technology of ICE was selected as the most
appropriate in terms of efficiency. The efficiency of ICEs at that scale of
generation was considered to be 25% according to the accessed data. A
downward approximation was made to provide a conservative value of electricity
production potential in the next step of analysis.
5.2.3 Conclusions of Research Question 3
The electricity production potential obtained was slightly higher than
4000 , that could be produced, under the assumption of 5500 of
annual usage, in a 735 kWe power plant with a gasification – ICE layout. In
addition, if the adoption of a cogeneration scheme was possible, 10500
could be additionally produced using the same technology and power plant
size. That would be equivalent to a power plant of 1915 kWth.

95
95
5.3 Discussion
Throughout all the research carried out, it has been shown that rural areas of
Catalonia have an undeniable technical potential for electricity generation using
wood biomass without going beyond the regeneration capacity of the indigenous
forests. This local production if combined with local consumption would
encourage the distributed generation and link well to a smart grid. Moreover, the
local production of electricity using indigenous renewable sources would reduce
the transport requirements and, consequently, the associated carbon footprint, in
addition to mitigating fire damage potential.
However, it was also shown that the exact potential for electricity generation
is a variable strongly linked to the idiosyncrasies of the sample selected such as
the area covered by forests or the tree species mainly found in them. Therefore
the potential for electricity generation may not be representative if extrapolated to
other areas with different forest characteristics.
Moreover, the choice of technology would also be affected by the amount of
available biomass because of the different performances of conversion
technologies depending on the scale of generation (see §5.2.2). Other relevant
factors that affect the final choice of technology are the annual full usage hours of
the power plant and the economic competitiveness of the electricity generated.
Although these other factors are very significant, they were left out of the scope
of this research due to their relationship with national economy and electricity
market behavior.

96
96
With respect to the biomass resource assessment, it is worth mention that
the high variability of climates in Spain makes it invalid to extend the findings of
this research regarding the type and amount of biomass produced, and chemical
energy stored within it, to other regions of the country with different climates. Yet,
these findings are applicable to all the area of Catalonia as well as other
countries with Mediterranean climates like Italy, some parts of France, or Greece;
provided that the terrain makes possible to harvest the biomass that is located
there. This is a very important point since the focus of this research was placed
only in the potential evaluation but without considering the technical or economic
difficulties that could appear due to inaccessible or protected forests because of
the local character of these issues, and the lack of problems of this nature in
most of the geography of rural Catalonia. In addition, harvest rates higher than
the obtained growth rate have been proven in managed forests (Siry, Cubbage,
& Ahmed, 2005) so once the initial thinning or pruning actions were performed,
all the available biomass could be harvestable over the following years.
Another important point is that forest management strategies are claimed to
affect the growth rate of trees (Karjalainen, et al., 2000). In particular, growth
rates are higher for young forests and they decrease as the forest gets older.
Therefore, the results are conservative as they are based on current growth rates
that could be higher if forest management strategies were implemented.
Sustainable forest management strategies could increase the growth rate up to
2.5 for pine forests (Siry, Cubbage, & Ahmed, 2005). Even with
only the thinning and pruning practices required to harvest the yearly produced

97
97
biomass, i.e. without active forest management strategies such as logging of
trees, the growth rate of forest would increase as a result of forest rejuvenation.
Therefore, growth rates greater than calculated should be expected once started
the exploitation of the available resource (Karjalainen, et al., 2000).
Regarding the selection of the most appropriate technology, the choice was
made in terms of current efficiencies that can be found in the market. Other
variables were not considered for the selection of technology. For example, cost,
operation and maintenance requirements, noise levels, life cycle, reliability,
payback period… have not been studied, and they could affect the choice if it
was desired to consider them. Furthermore, as shown, the technology selection
is strongly linked to the scale of generation so other samples with larger or
smaller amounts of available resource would possibly have other optimum
conversion technologies that maximize the exploitation of their resource.
Even though all the implications of climate, terrain and variables affecting the
technology are very important and might change the final results of the research,
the whole methodology of this study is really applicable anywhere as a procedure
for assessment of technical potential – not economic – for electricity generation
from biomass and selection of the most appropriate technology to maximize the
usage of the available resource.
It is also worth mention that the whole study focused on electricity generation
potential, overlooking the production of heat associated to all processes involving
combustion of a fuel as the case of biomass-based technologies is. However, the
overall efficiency of the conversion system would be significantly increased if it

98
98
was taken advantage from the produced heat. According to the accessed data,
the overall efficiency of the biomass conversion system could be as high as 90%
at the selected scale of generation. The main hurdle to overcome is obtaining a
demand for such heat at the point of generation or close to it due to the large
difficulty to transport heat in comparison with electricity.
Finally, it is also noteworthy to mention that this research studied the
technical potential for electricity generation using forest wood biomass only
through the assessment of available wood resource and current efficiencies of
conversion technologies. Therefore, the electricity production potential could
have been overestimated because the obtained available biomass value only
accounts for the biomass that is found in the sample without considering possible
issues or difficulties that may appear when harvesting such resource and the
efficiency data were obtained from peer-reviewed sources, but since they came
from a wide variety of layouts, such as actual power plants, demonstrative plants,
manufacturer data…, there is some grade of uncertainty this value. However,
both the available biomass and the efficiency values were downwardly
approximated to obtain a conservative result. In addition, regarding the available
resource calculation, only the growth rate of wood resource was considered to
guarantee a homogeneous resource in terms of heating value, moisture content,
size and shape of the chips but the total available resource, i.e. including bark,
branches and leaves, is higher than calculated. On regards to efficiency values,
higher values are likely to be expected due to the constant improvement in

99
99
conversion technologies. For all these reasons, the obtained result should be
considered a conservative approximation that should be tight to reality.
5.4 Recommendations for future work
With this research, many results related to the availability of biomass in rural
areas and conversion technologies for electricity production have been gathered,
and the main conclusions and findings have been summarized throughout the
previous sections. However, there are still many areas for future work.
5.4.1 Recommendations for practice
An important area of future work involves the size and full usage hours of a
power plant that would take advantage of the available resource. The power
plant size provided as a result is a calculated value rather than an actual
commercial option and the full usage ratio is a tentative figure. A market study
should be done to find the closest commercially available engine and gasifier
size as well as the actual full usage ratio that could be expected.
Another important area of future work is the study of the economic value that
wood residues have in the region due to the cost of harvesting such residue. As
previously stated, the difficulty to harvest biomass in areas of difficult access
could raise the cost of such residue to non-profitable values, despite the fact that
this residue is not being used and has a very low cost in areas where the harvest
process is easy to be done.

100
10
0
5.4.2 Recommendations for further research
First of all, further studies are required to test the environmental impact and
economic viability of the different technologies to inform a better choice of
technology considering these factors in addition to the electrical efficiency. In
particular, a life cycle assessment would be very useful to evaluate the energy
return on investment and would help to consider if the pre-processing and
conversion alternative chosen have a good energy return on energy invested
ratio as well as how significant are the greenhouse gas emissions associated to
the whole electricity generation process.
A second area of future work is the assessment of cogeneration possibilities.
As shown, the electrical efficiency of biomass conversion technologies is
relatively small and higher overall efficiencies would be achieved if electricity
production was combined with heat production. Hence, cogeneration
opportunities should be sought, for example in industrial or public buildings
installations. This research showed that up to two and half watts of heat would be
produced for each watt of electricity using current CHP technologies.
Finally, another area of future research involves the integration of different
renewable energy sources. As previously stated, biomass-based conversion
technologies allow the possibility of being used as backup for non-predictable
renewable energy sources. Smaller power plants or amount of biomass usage
could be beneficial if the main goal of such power plant was to backup other
renewable electricity generation technologies. Hence, optimization studies would
help to determine the optimal size of a hypothetical biomass-based power plant

101
10
1
serving as backup of small wind or solar farms that could be installed in rural
areas of Catalonia.

REFERENCES

102
10
2
REFERENCES
Directive 2004/8/EC of the European Parliament and of the Council of the 11
February 2004 on the promotion of cogeneration based on the useful heat.
(2004). Official Journal of the European Union, 50-60.
Ahrenfeldt, J., Henriksen, U., Jensen, T. K., Gøbel, B., Wiese, L., Kather, A., &
Egsgaard, H. (2006). Validation of a continuous combined heat and power
(CHP) operation of a two-stage biomass gasifier. Energy & Fuels, 20,
2672-2680.
Alanne, K., & Saari, A. (2004). Sustainable small-scale CHP technologies for
buildings: the basis for multi-perspective decision-making. Renewable and
Sustainable Energy Reviews, 8, 401-431.
Al-attab, K. A., & Zainal, Z. A. (2010). Turbine startup methods for externally fired
micro gas turbine (EFMGT) system using biomass fuels. Applied Energy,
87, 1336-1341.
Angrisani, G., Roselli, C., & Sasso, M. (2012). Distributed microtrigeneration
systems. Progress in Energy and Combustion Science, 38, 502-521.
Babcock & Wilcox Vølund. (2010). Biomass-fired combined heat and power plant
Assens, Denmark. Baberton, OH: Babcock & Wilcox Vølund plant fact
sheet.
Bain, R. L., Overend, R. P., & Craig, K. R. (1998). Biomass-fired power
generation. Fuel Processing Technology, 54, 1-16.
Barbieri, E. S., Spina, P. R., & Venturini, M. (2012). Analysis of innovative micro-
CHP systems to meet household energy demands. Applied Energy, 97,
723-733.

103
10
3
Basrawi, M. F., Yamada, T., Nakanishi, K., & Katsumata, H. (2012). Analysis of
the performances of biogas-fuelled micro gas turbine cogeneration
systems (MGT-CGSs) in middle- and small-scale sewage treatment
plants: Comparison of performances and optimization of MGTs with
various electrical power outputs. Energy, 38, 291-304.
Biedermann, F., Carlsen, H., Obernberger, I., & Schöch, M. (2004). Small-scale
CHP plant based on a 75 kWel hermetic eight-cylinder Stirling engine for
biomass fuels - development, technology and operating experiences.
Proceedings of the 2nd World Conference and Exhibition on Biomass for
Energy, Industry and Climate Protection. Rome, Italy.
Biedermann, F., Carlsen, H., Schöch, M., & Obernberger, I. (2003). Operating
experiences with a small-scale CHP power plant based on a 35 kWe
hermetic four cylinder Stirling engine for biomass fuels. Proceedings of the
11th International Stirling Engine Conference. Rome, Italy.
Bini, R., Di Prima, M., & Guercio, A. (2010). Organic Rankine Cycle (ORC) in
biomass plants: An overview on different applications. Brescia, Italy:
Turboden s.r.l.
Buragohain, B., Mahanta, P., & Moholkar, V. S. (2010). Biomass gasification for
decentralized power generation: The Indian perspective. Renewable and
Sustainable Energy Reviews, 14, 73-92.
Burriel, J., Gracia, C., Ibàñez, J., Mata, T., & Vayreda, J. (2000). Inventari
Ecològic i Forestal de Catalunya. Regió Forestal IV. Bellaterra: CREAF.
Ciferno, J. P., & Marano, J. J. (2002). Benchmarking Biomass Gasification
Technologies for Fuels, Chemicals and Hydrogen Production. U.S.
Department of Energy National Energy Technology Laboratory.
Codina, M., & Rodríguez, J. (2009). Informe sobre disponibilitat de biomassa al
municipi d'Argençola. Solsona: Centre Tecnològic Forestal de Catalunya,
CTFC.

104
10
4
Communication Department of the European Commission. (2013, January 28).
How the EU works. Retrieved from European Union:
http://europa.eu/about-eu/index_en.htm
Corti, A., & Lombardi, L. (2004). Biomass integrated gasification combined cycle
with reduced CO2 emissions: Performance analysis and life cycle
assessment (LCA). Energy, 29, 2109-2124.
Craig, K. R., & Mann, M. K. (1996). Cost and Performance analysis of Biomass-
based Integrated Gasification Combined-Cycle (BIGCC) power systems.
Golden, CO: National Renewable Energy Laboratory (NREL).
CREAF. (2013, January 29). Objectius. Retrieved from Centre de Recerca
Ecològica i Aplicacions Forestals:
http://www.creaf.uab.es/cat/organitzacio/objectius.htm
CTFC. (2013, January 29). CTFC Inici. Retrieved from Centre Tecnològic
Forestal de Catalunya: http://www.ctfc.cat/
Dasappa, S., Subbukrishna, D. N., Suresh, K. C., Paul, P. J., & Prabhu, G. S.
(2011). Operational experience on a grid connected 100 kWe biomass
gasification power plant in Karnataka, India. Energy for Sustainable
Development, 15, 231-239.
Difs, K., Wetterlund, E., Trygg, L., & Söderström, M. (2010). Biomass gasification
opportunities in a district heating system. Biomass and Bioenergy, 34,
637-651.
Dong, L., Liu, H., & Riffat, S. (2009). Development of small-scale and micro-scale
biomass-fuelled CHP systems – A literature review. Applied Thermal
Engineering, 29, 2119-2126.
Dornburg, V., & Faaij, A. P. (2001). Efficiency and economy of wood-fired
biomass energy systems in relation to scale regarding heat and power
generation using combustion and gasification technologies. Biomass and
Bioenergy, 21, 91-108.
ECN. (2009, April 29). Phyllis, database for biomass and waste. Retrieved from
Energy Research Centre of the Netherlands: http://www.ecn.nl/phyllis/

105
10
5
Erhart, T., Strzalka, R., Eicker, U., & Infield, D. (2011). Performance analysis of a
biomass ORC poly-generation system. Proceedings of the 2nd European
Conference on Polygeneration – 30th March-1st April, 2011, (págs. 1-11).
Tarragona, Spain.
Evans, A., Strezov, V., & Evans, T. J. (2010). Sustainability considerations for
electricity generation from biomass. Renewable and Sustainable Energy
Reviews, 14, 1419-1427.
Faaij, A., Van Ree, R., Waldheim, L., Olsson, E., Oudhuis, A., Van Wijk, A., . . .
Turkenburg, W. (1997). Gasification of biomass wastes and residues for
electricity production. Biomass and Bioenergy, 12(6), 387-407.
FACS. (2013, January 28). Membres Associats. Retrieved from Federació
Anoienca de Comerç i Serveis: http://www.facs.cat/452/index.html
FAO. (2011). State of Mediterranean Forests (SoMF) Concept Paper. Rome:
FAO Corporate Document.
FAO. (2013, January 29). About FAO. Retrieved from FAO website:
http://www.fao.org/about/en/
FAO Forestry Department. (1986). Wood gas as engine fuel. Rome: Publications
Division, Food and Agriculture Organization (FAO).
Federació ADF Anoia. (2011, January). ADF Argençola. Retrieved from
Federació d’Agrupacions de Defensa Forestal de l’Anoia:
http://www.federacioadfanoia.cat/entitats-fitxa_entitat-2-cat-
adf_argencola.htm
Franco, A., & Giannini, N. (2005). Perspectives for the use of biomass as fuel in
combined cycle power plants. International Journal of Thermal Sciences,
44, 163-177.
Generalitat de Catalunya. (2010, November 9). Atles dels municipis rurals de
Catalunya. Retrieved from Departament d'Agricultura, Alimentació i Acció
Rural: http://www.cedricat.cat/atlescedricat/antecedents.php

106
10
6
Gómez, A., Rodrigues, M., Montañés, C., Dopazo, C., & Fueyo, N. (2010). The
potential for electricity generation from crop and forestry residues in Spain.
Biomass and Bioenergy, 34, 703-719.
Gustavsson, L. (1994). Biomass and district-heating systems. Renewable
Energy, 5(2), 838-840.
Gustavsson, L., & Johansson, B. (1994). Cogeneration: One way to use biomass
efficiently. Heat Recovry Systems and CHP, 14(2), 117-127.
Gustavsson, L., & Madlener, R. (2004). CO2 mitigation costs of large-scale
bioenergy technologies in competitive electricity markets. Energy, 28,
1405-1425.
Hammerschmid, A., Stallinger, A., Obernberger, I., & Piatkowski, R. (2004).
Demonstration and evaluation of an innovative small-scale biomass CHP
module based on a 730 kWel screw-type steam engine. Proceedings of
the 2nd World Conference and Exhibition on Biomass for Energy, Industry
and Climate Protection, (pp. 1745-1748). Rome, Italy.
Henderick, P., & Williams, R. H. (2000). Trigeneration in a northern Chinese
village using crop residues. Energy for Sustainable Development, IV(3),
26-42.
Herran, D. S., & Nakata, T. (2012). Design of decentralized energy systems for
rural electrification in developing countries considering regional disparity.
Applied Energy, 91, 130-145.
Höök, M., & Tang, X. (2013). Depletion of fossil fuels and anthropogenic climate
change - A review. Energy Policy, 52, 797-809.
IDESCAT. (2012, December). Anoia. Retrieved from Institut d'Estadística de
Catalunya:
http://www.idescat.cat/territ/BasicTerr?TC=6&V0=2&CTX=B&ALLINFO=T
RUE&V1=06&VOK=Confirmar
IDESCAT. (2012, December). Argençola (080082). Retrieved from Institut
d'Estadística de Catalunya: http://www.idescat.cat/emex/?id=080082#h0

107
10
7
IDESCAT. (2013, February 10). Codis territorials i d'entitats. Comarques (CAT).
Retrieved from Institut d'Estadística de Catalunya:
http://www.idescat.cat/nomenclatures/?TC=4&V0=3&V1=10&DD=0
IDESCAT. (2013, February 10). Codis territorials i d'entitats. Comunitats
autònomes. Retrieved from Institut d'Estadística de Catalunya:
http://www.idescat.cat/nomenclatures/?TC=4&V0=2&V1=5&DD=0
IDESCAT. (2013, Februrary 2). Codis territorials i d'entitats. Municipis (CAT).
Retrieved from Institut d'Estadística de Catalunya:
http://www.idescat.cat/nomenclatures/Nomencla?TC=4&V0=3&V1=9&DD
=2-2-
2013&VSUB9=450&VSUB9=449&VSUB9=463&VSUB9=455&VSUB9=45
6&VSUB9=464&VSUB9=448&VSUB9=447&VSUB9=446&VSUB9=445&V
SUB9=444&VSUB9=465&VSUB9=443&VSUB9=442&VSUB9=454&VSU
B9=441&VSUB9=466&VSUB9=440&VS
IEA. (2013, January 14). About us. Retrieved from IEA website:
http://www.iea.org/aboutus/
International Energy Agency. (2011). 2009 Energy Balance for Spain. Retrieved
from International Energy Agency:
http://www.iea.org/stats/balancetable.asp?COUNTRY_CODE=ES
Invernizzi, C., Iora, P., & Silva, P. (2007). Bottoming micro-Rankine cycles for
micro-gas turbines. Applied Thermal Engineering, 27, 100-110.
Jurado, F., Cano, A., & Carpio, J. (2003). Modelling of combined cycle power
plants using biomass. Renewable Energy, 28, 743-753.
Karjalainen, T., Nabuurs, G. J., Liski, J., Pussinen, A., Lapveteläinen, T., &
Eggers, T. (2000). Carbon sequestration in Forests. European Forest
Institute, 8(1), 5-7.
Kimming, M., Sundberg, C., Nordberg, A., Baky, A., Bernesson, S., Norén, O., &
Hansson, P. A. (2011). Biomass from agriculture in small-scale combined
heat and power plants - A comparative life cycle assessment. Biomass
and Bioenergy, 35, 1572-1581.

108
10
8
Kirkels, A. F., & Verbong, G. P. (2011). Biomass gasification: Still promising? A
30-year global overview. Renewable and Sustainable Energy Reviews,
15, 471-481.
Kuhn, V., Klemes, J., & Bulatov, I. (2008). MicroCHP: Overview of selected
technologies, products and field test results. Applied Thermal Engineering,
28, 2039-2048.
Larson, E. D., Williams, R. H., & Leal, R. L. (2001). A review of biomass
integrated-gasifier/gas turbine combined cycle technology and its
application in sugarcane industries, with an analysis for Cuba. Energy for
Sustainable Development, V(1), 54-76.
Liu, H., Shao, Y., & Li, J. (2011). A biomass-fired micro-scale CHP system with
organic Rankine cycle (ORC) - Thermodynamic modelling studies.
Biomass and Bioenergy, 35, 3985-3994.
McKendry, P. (2002). Energy production from biomass (part 2): conversion
technologies. Bioresource Technology, 83, 47-54.
Monteiro, E., Moreira, N. A., & Ferreira, S. (2009). Planning of micro-combined
heat and power systems in the Portuguese scenario. Applied Energy, 86,
290-298.
Murphy, J., & McKeogh, E. (2004). Technical, economic and environmental
analysis of energy production from municipal solid waste. Renewable
Energy, 29, 1043-1057.
Navarro, C. (2011). Presente y futuro de las centrales eléctricas de ciclo
combinado. Madrid: Fundación Ciudadanía y Valores.
Nishiyama, A., Shimojima, H., Ishikawa, A., Itaya, Y., Kambara, S., Moritomi, H.,
& Mori, S. (2007). Fuel and emissions properties of Stirling engine
operated with wood powder. Fuel, 86, 2333-2342.
Obara, S., Tanno, I., Kito, S., Hoshi, A., & Sasaki, S. (2008). Exergy analysis of
the woody biomass Stirling engine and PEF-FC combined system with
exhaust heat reforming. International Journal of Hydrogen Energy, 33,
2289-2299.

109
10
9
Obernberger, I. (1998). Decentralized biomass combustion: State of the art and
future development. Biomass and Bioenergy, 33-56.
Obernberger, I., & Hammerschmid, A. (2001). Biomass fired CHP plant based on
an ORC cycle - Project: ORC-STIA-Admont. Admont, Austria: STIA -
Holzindustrie GmbH.
Obernberger, I., Thonhofer, P., & Reisenhofer, E. (2002). Description and
evaluation of the new 1,000 kWel Organic Rankine Cycle process
integrated in the biomass CHP plant in Lienz, Austria. Euroheat & Power,
10, 18-25.
Onovwiona, H. I., & Ugursal, I. V. (2006). Residential cogeneration systems:
review of the current technology. Renewable and Sustainable Energy
Reviews, 10, 389-431.
Onovwiona, H. I., & Ugursal, V. I. (2006). Residential cogeneration systems:
review of the current technology. Renewable and Sustainable Energy
Reviews, 10, 389-431.
Osowski, S., & Fahlenkamp, H. (2006). Regenerative energy production using
energy crops. Industrial Crops and Products, 24, 196-203.
Parente, A., Galletti, C., Riccardi, J., Schiavetti, M., & Tognotti, L. (2012).
Experimental and numerical investigation of a micro-CHP flameless unit.
Applied Energy, 89, 203-214.
Passey, R., Spooner, T., MacGill, I., Watt, M., & Syngellakis, K. (2011). The
potential impacts of grid-connected distributed generation and how to
address them: A review of technical and non-technical factors. Energy
Policy, 39, 6280-6290.
Peel, M. C., Finlayson, B. L., & McMahon, T. A. (2007). Updated world map of
the Köppen-Geiger climate classification. Hydrology and Earth System
Sciences, 11, 1633-1644.
Pellegrini, L. F., de Oliveira Júnior, S., & Burbano, J. C. (2010). Supercritical
steam cycles and biomass integrated gasification combined cycles for
sugarcane mills. Energy, 35, 1172-1180.

110
11
0
Podesser, E. (1999). Electricity production in rural villages with a biomass Stirling
engine. Renewable Energy, 16, 1049-1052.
Prasad, S. B. (1990). Electricity and heat cogeneration from biomass fuels: a
case study in Fiji. Solar and Wind Technology, 7(1), 25-29.
Prentice, I. C., Farquhar, G. D., Fasham, M. R., Goulden, M. L., Heimann, M.,
Jaramillo, V. J., . . . Wallace, D. R. (2001). The Carbon Cycle and
Atmospheric Carbon Dioxide. In J. T. Houghton, Y. Ding, D. J. Griggs, M.
Noguer, P. J. van der Linden, X. Dai, . . . C. A. Johnson, Climate Change
2001: The Scientific Basis (pp. 183-237). Cambridge: Cambridge
University Press.
Pritchard, D. (2002). Biomass combustion gas turbine CHP, ETSU
B/U1/00679/00/REP. Stafford: Talbott’s Heating Ltd. Retrieved from
http://webarchive.nationalarchives.gov.uk/+/http://www.berr.gov.uk/files/file
14922.pdf
Quaak, P., Knoef, H., & Stassen, H. E. (1999). Energy from Biomass: Review of
Combustion and Gasification Technologies. Washington, D.C.: World
Bank Publications.
Raj, N. T., Iniyan, S., & Goic, R. (2011). A review of renewable energy based
cogeneration technologies. Renewable and Sustainable Energy Reviews,
15, 3640–3648.
Rodrigues, M., Faaij, A. P., & Walter, A. (2003). Techno-economic analysis of co-
fired biomass integrated gasification/combined cycle systems with
inclusion of economies of scale. Energy, 28, 1229-1258.
Rollins, M. L., Reardon, L., Nichols, D., Lee, P., Moore, M., Crim, M., . . .
Hughes, E. (2002). Economic evaluation of CO2 sequestration
technologies: Task 4, Biomass Gasification-based processing.
Washington, D.C.: Department of Energy (DOE).
Saló Fontdevila, M. (2012, January 28th). Mapa de Comarques. Retrieved from
Edu 365 educational website:
http://www.edu365.cat/primaria/muds/socials/paisatge_cat/comarques.htm

111
11
1
Salomón, M., Savola, T., Martin, A., Fogelholm, C.-J., & Fransson, T. (2011).
Small-scale biomass CHP plants in Sweden and Finland. Renewable and
Sustainable Energy Reviews, 15, 4451-4465.
Shuying, L., Guocai, W., & DeLaquil, P. (2001). Biomass gasification for
combined heat and power in Jilin province, People's Republic of China.
Energy for Sustainable Development, V(1), 47-53.
Siewert, A., Niemelä, K., & Vilokki, H. (2004). Initial operating experience of three
new high-efficiency biomass plants in Germany. PowerGen Europe
Conference 2004. Barcelona.
Siry, J. P., Cubbage, F. W., & Ahmed, M. R. (2005). Sustainable forest
management: global trends and opportunities. Forest Policy and
Economics, 7, 551-561.
Stahl, K., & Neergaard, M. (1998). IGCC power plant for biomass utilisation,
Värnamo, Sweden. Biomass and Bioenergy, 15(3), 205-211.
Tchanche, B. F., Lambrinos, G., Frangoudakis, A., & Papadakis, G. (2011). Low-
grade heat conversion into power using organic Rankine cycles - A review
of various applications. Renewable and Sustainable Energy Reviews, 15,
3963-3979.
Thiers, S., Aoun, B., & Peuportier, B. (2010). Experimental characterization,
modeling and simulation of a wood pellet micro-combined heat and power
unit used as a heat source for a residential building. Energy and Buildings,
42, 896-903.
Uddin, S. N., & Barreto, L. (2007). Biomass-fired cogeneration systems with CO2
capture and storage. Renewable Energy, 32, 1006-1019.
United Nations. (1998). Kyoto Protocol to the United Nations Framework
Convention on Climate Change. Retrieved December 2012, from
http://unfccc.int/resource/docs/convkp/kpeng.pdf
Vallios, I., Tsoutsos, T., & Papadakis, G. (2009). Design of biomass district
heating systems. Biomass and Bioenergy, 33, 659-678.

112
11
2
Viana, H., Cohen, W. B., Lopes, D., & Aranha, J. (2010). Assessment of forest
biomass for use as energy. GIS-based analysis of geographical availability
and locations of wood-fired power plants in Portugal. Applied Energy, 87,
2551-2560.
Wahlund, B., Yan, J., & Westermark, M. (2001). Comparisons of CO2-reducing
alternatives for Heat and Power generation: CO2 capture and fuel shift to
biomass. In Greenhouse Gas Control Technologies: Proceedings of the
Fifth International Conference (pp. 229-234). Collingwood: CSIRO.
Whittaker, C., Mortimer, N., Murphy, R., & Matthews, R. (2011). Energy and
greenhouse gas balance of the use of forest residues for bioenergy
production in the UK. Biomass and Bioenergy, 35, 4581-4594.
Wikimedia Commons. (2012, November 1). Atlas of Spain. Retrieved from
Wikimedia Commons: http://commons.wikimedia.org/wiki/Atlas_of_Spain
Yoshida, Y., Dowaki, K., Matsumura, Y., Matsuhashi, R., Li, D., Ishitani, H., &
Komiyama, H. (2003). Comprehensive comparison of efficiency and CO2
emissions between biomass energy conversion technologies-position of
supercriticalwater gasification in biomass technologies. Biomass and
Bioenergy, 25, 257-272.
Zeiler, M., Padinger, R., Spitzer, J., & Podesser, E. (2007). Operating
experiences with biomass driven Stirling engines; 3 kW and 30 kW.
Freiburg: PolySMART Project Publications.
Zhang, K., Chang, J., Guan, Y., Chen, H., Yang, Y., & Jiang, J. (2013).
Lignocellulosic biomass gasification technology in China. Renewable
Energy, 49, 175-184.

APPENDICES

113
11
3
Appendix A Forest characterization of the region of Anoia and the township of
Argençola
For the region of Anoia, the forest characterization is presented in terms of
area covered and tree species. The values are detailed in Table A 1 and figures
Figure A 1 and Figure A 2.
Table A 1 Area covered by the different kinds of trees in the comarca of Anoia and actual number of trees sampled
Tree species Forest area (ha) # of trees (thousands)
Pinus halepensis 18117 13982
Pinus nigra 3724 3144
Pinus pinea 1912 1082
Quercus pubescens 1208 1759
Quercus ilex 906 2169
Quercus faginea 503 1003
Mixt forest 906 -
Other oaks (quercus) - 626
Other conifers (pinus) 202 159
Source: personal compilation based on IECF (Burriel, Gracia, Ibàñez, Mata, & Vayreda, 2000)
The relative importance of each tree species based on forest area covered is
represented in Figure A 1, and the relative importance of each tree species
based on actual number of trees is represented in Figure A 2.
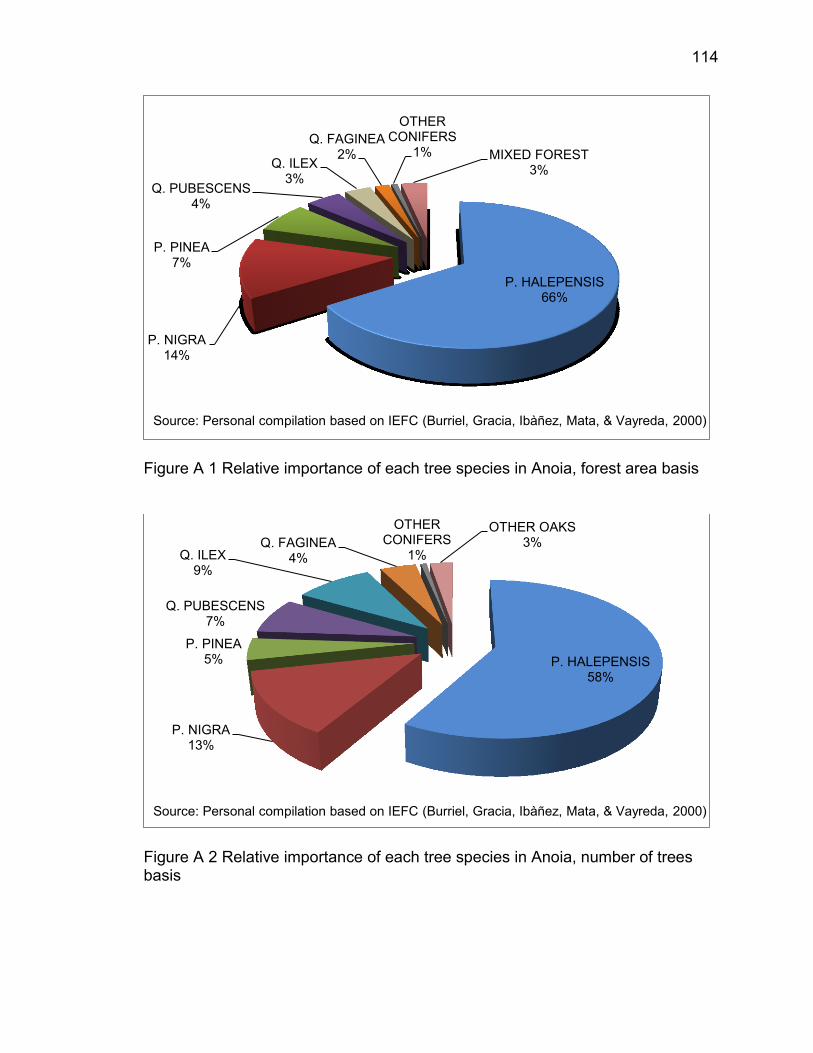
114
11
4
Figure A 1 Relative importance of each tree species in Anoia, forest area basis
Figure A 2 Relative importance of each tree species in Anoia, number of trees basis
P. HALEPENSIS 66%
P. NIGRA 14%
P. PINEA 7%
Q. PUBESCENS 4%
Q. ILEX 3%
Q. FAGINEA 2%
OTHER CONIFERS
1% MIXED FOREST 3%
Source: Personal compilation based on IEFC (Burriel, Gracia, Ibàñez, Mata, & Vayreda, 2000)
P. HALEPENSIS 58%
P. NIGRA 13%
P. PINEA 5%
Q. PUBESCENS 7%
Q. ILEX 9%
Q. FAGINEA 4%
OTHER CONIFERS
1%
OTHER OAKS 3%
Source: Personal compilation based on IEFC (Burriel, Gracia, Ibàñez, Mata, & Vayreda, 2000)
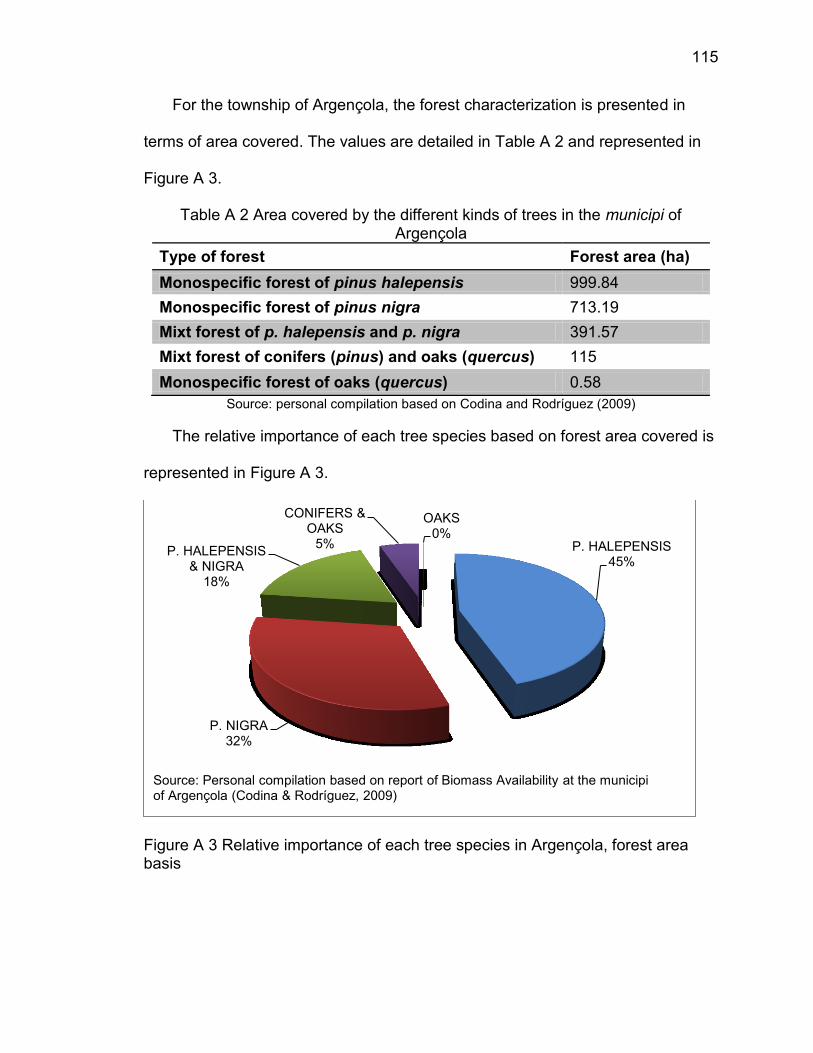
115
11
5
For the township of Argençola, the forest characterization is presented in
terms of area covered. The values are detailed in Table A 2 and represented in
Figure A 3.
Table A 2 Area covered by the different kinds of trees in the municipi of Argençola
Type of forest Forest area (ha)
Monospecific forest of pinus halepensis 999.84
Monospecific forest of pinus nigra 713.19
Mixt forest of p. halepensis and p. nigra 391.57
Mixt forest of conifers (pinus) and oaks (quercus) 115
Monospecific forest of oaks (quercus) 0.58
Source: personal compilation based on Codina and Rodríguez (2009)
The relative importance of each tree species based on forest area covered is
represented in Figure A 3.
Figure A 3 Relative importance of each tree species in Argençola, forest area basis
P. HALEPENSIS 45%
P. NIGRA 32%
P. HALEPENSIS & NIGRA
18%
CONIFERS & OAKS
5%
OAKS 0%
Source: Personal compilation based on report of Biomass Availability at the municipi of Argençola (Codina & Rodríguez, 2009)

116
11
6
Appendix B Summary of efficiencies of biomass conversion technologies
The electrical efficiencies, power plant name and size, conversion technology
used and source from which the information was retrieved are presented in Table
B 1. All data comes from real biomass-based power plants or manufacturer data,
as specified.

11
7
Table B 1 Power plant location and size, electrical efficiency, conversion technology and fuel used and reference of different real biomass-based power plants
Power Plant Location Power Output (kWe)
Electrical efficiency1 ηe (%)
Overall efficiency ηtot (%)
Conversion tech.
Fuel Reference
Viking Gasification Plant
Denmark 18.55 25.1 N/A ICE Wood chips
(Ahrenfeldt, et al., 2006)
BERI project India 120 18 81 ICE Wood chips
(Ahrenfeldt, et al., 2006)
Tervola Finland 470 24 82 ICE Wood residues
(Salomón, Savola, Martin, Fogelholm, & Fransson, 2011)
Harboøre Denmark 700 28 96 ICE Wood chips
(Ahrenfeldt, et al., 2006)
Kokemäki Finland 1800 25 60 ICE
Wood chips, sawdust, bark
(Salomón, Savola, Martin, Fogelholm, & Fransson, 2011)
Güssing Austria 2000 25 81 ICE Wood chips
(Ahrenfeldt, et al., 2006)
Hawaii Paia Hawaii 5000 30 N/A BIGCC Bagasse (Rollins, et al., 2002)
Värnamo Sweden 5500 30 76 BIGCC Wood chips
(Wahlund, Yan, & Westermark, 2001)
Värnamo Sweden 5500 32 83 BIGCC Wood chips
(Stahl & Neergaard, 1998)
Biocycle Finland 7200 39.9 77.3 BIGCC Wood (Rollins, et al., 2002)
Simulation The Netherlands
25600 36.3 N/A BIGCC Organic domestic waste
(Faaij, et al., 1997)

11
8
Power Plant Location Power Output (kWe)
Electrical efficiency1 ηe (%)
Overall efficiency ηtot (%)
Conversion tech.
Fuel Reference
Simulation The Netherlands
26800 39 N/A BIGCC Verge grass
(Faaij, et al., 1997)
Simulation The Netherlands
29000 40.3 N/A BIGCC Clean Wood
(Faaij, et al., 1997)
Simulation The Netherlands
29000 35.4 N/A BIGCC
Sludge-demolition wood mixture
(Faaij, et al., 1997)
Simulation The Netherlands
29300 40 N/A BIGCC Demolition Wood
(Faaij, et al., 1997)
Bioflow Sweden 35000 43 86 BIGCC Wood (Gustavsson & Johansson, 1994)
Institute of Gas Technology (IGT) RENUGAS®
Hawaii 55500 362 N/A BIGCC Wood chips
(Craig & Mann, 1996)
Plant without CO2 capture
N/A 60000 43 86 BIGCC N/A (Gustavsson & Madlener, 2004)
Plant without CO2 capture
N/A 60000 43 86 BIGCC N/A (Gustavsson & Madlener, 2004)
Vega project Sweden 62000 44 90 BIGCC Wood (Gustavsson & Johansson, 1994)
Modelization of Plant without CO2 caputre
N/A 100000 43 86 BIGCC
Salix and forest/ logging residues
(Uddin & Barreto, 2007)
Modelization of Plant with CO2 capture
N/A 100000 33 N/A BIGCC
Salix and forest/ logging
(Uddin & Barreto, 2007)

11
9
Power Plant Location Power Output (kWe)
Electrical efficiency1 ηe (%)
Overall efficiency ηtot (%)
Conversion tech.
Fuel Reference
residues
Plant without CO2 capture
N/A 100000 47 N/A BIGCC
(Gustavsson & Madlener, 2004)
World Bank’s Global Environment Facility (GEF)
Brazil 105400 37.92 N/A BIGCC Wood chips
(Craig & Mann, 1996)
Battelle Columbus Laboratory, Burlington, VT
USA 122000 35.42 N/A BIGCC Wood chips
(Craig & Mann, 1996)
Institute of Gas Technology (IGT) RENUGAS®
Hawaii 131700 39.72 N/A BIGCC Wood chips
(Craig & Mann, 1996)
Simulation N/A 204502 36.27 N/A BIGCC Biomass poplar
(Corti & Lombardi, 2004)
ETSU B/U1/00679/00/REP
UK 30 17 80 Microturbine Wood pellets
(Pritchard, 2002)
Admont, Styria Austria 400 7.4 48.2 ORC Wood chips, sawdust
(Obernberger & Hammerschmid, 2001)
Lienz CHP plant Austria 1000 15 97 ORC Wood chips
(Obernberger, Thonhofer, & Reisenhofer, 2002)
Ostrow Wielkopolski
Poland 1500 15 89 ORC Wood chips
(Bini, Di Prima, & Guercio, 2010)
Schnarhauser Park, Ostfildern
Germany 6300 15 81.6 ORC Wood chips
(Erhart, Strzalka, Eicker, & Infield,

12
0
Power Plant Location Power Output (kWe)
Electrical efficiency1 ηe (%)
Overall efficiency ηtot (%)
Conversion tech.
Fuel Reference
2011)
Australian Nat University rural electricity supply syst
Fiji Islands 25 22 N/A Steam Engine Sawmill, crop wastes
(Prasad, 1990)
Hartberg, Styria Austria 730 10 80 Steam Engine
Wood chips, bark, sawdust
(Hammerschmid, Stallinger, Obernberger, & Piatkowski, 2004)
Lion Powerblock manufacturer 2 10.4 94 Steam Turbine
Wood pellets, Natural Gas, Oil
(Barbieri, Spina, & Venturini, 2012)
Kiuruvesi Finland 900 11 85 Steam Turbine
Bark, sawdust, wood chips
(Salomón, Savola, Martin, Fogelholm, & Fransson, 2011)
Karstula Finland 1000 8 85 Steam Turbine
Bark, sawdust
(Salomón, Savola, Martin, Fogelholm, & Fransson, 2011)
Renko Finland 1300 13 81 Steam Turbine
Bark, sawdust
(Salomón, Savola, Martin, Fogelholm, & Fransson, 2011)
Tranas Sweden 1600 14.5 104 Steam Turbine
Sawdust, bark
(Salomón, Savola, Martin, Fogelholm, & Fransson, 2011)
Hallsberg Sweden 2050 14 80 Steam Turbine
Wood (Salomón, Savola, Martin, Fogelholm, & Fransson, 2011;

12
1
Power Plant Location Power Output (kWe)
Electrical efficiency1 ηe (%)
Overall efficiency ηtot (%)
Conversion tech.
Fuel Reference
Wahlund, Yan, & Westermark, 2001)
Vilppula Finland 2900 17 80 Steam Turbine
Bark, sawdust
(Salomón, Savola, Martin, Fogelholm, & Fransson, 2011)
Älvsbyn Sweden 3000 23 100 Steam Turbine
N/A (Salomón, Savola, Martin, Fogelholm, & Fransson, 2011)
Malä Sweden 3000 18 86 Steam Turbine
Wood
(Salomón, Savola, Martin, Fogelholm, & Fransson, 2011; Wahlund, Yan, & Westermark, 2001)
Lomma Sweden 3500 19 93 Steam Turbine
Wood
(Salomón, Savola, Martin, Fogelholm, & Fransson, 2011; Wahlund, Yan, & Westermark, 2001)
Björknäs Finland 3600 21 104 Steam Turbine
Wood chips, wood residues
(Salomón, Savola, Martin, Fogelholm, & Fransson, 2011)
Motala Sweden 3700 18.5 95 Steam Turbine
Wood chips, bark, sawdust
(Salomón, Savola, Martin, Fogelholm, & Fransson, 2011)
Lextorp (Trollhättän)
Sweden 3700 18.5 87 Steam Turbine
Wood chips, bark, sawdust
(Salomón, Savola, Martin, Fogelholm, & Fransson, 2011)

12
2
Power Plant Location Power Output (kWe)
Electrical efficiency1 ηe (%)
Overall efficiency ηtot (%)
Conversion tech.
Fuel Reference
Kuhmo Finland 4800 24 88 Steam Turbine
Wood residues
(Salomón, Savola, Martin, Fogelholm, & Fransson, 2011)
Kankaanpää Finland 6000 23 89 Steam Turbine
Peat, wood
(Salomón, Savola, Martin, Fogelholm, & Fransson, 2011)
Kuusamo Finland 6100 22 86 Steam Turbine
Peat, wood chips, sawdust
(Salomón, Savola, Martin, Fogelholm, & Fransson, 2011)
Bäckelund Sweden 7000 20 85-90 Steam Turbine
Wood chips, MSW
(Salomón, Savola, Martin, Fogelholm, & Fransson, 2011)
Falun Sweden 8000 23 109 Steam Turbine
Bark, wood residues, wood chips
(Salomón, Savola, Martin, Fogelholm, & Fransson, 2011; Wahlund, Yan, & Westermark, 2001)
Lieksa Finland 8000 24 89 Steam Turbine
Peat, wood
(Salomón, Savola, Martin, Fogelholm, & Fransson, 2011)
Nässjö Sweden 8070 24 103 Steam Turbine
Wood
(Salomón, Savola, Martin, Fogelholm, & Fransson, 2011; Wahlund, Yan, & Westermark, 2001)
Sala Sweden 10000 28 89 Steam Turbine
Wood (Salomón, Savola, Martin, Fogelholm, & Fransson, 2011)

12
3
Power Plant Location Power Output (kWe)
Electrical efficiency1 ηe (%)
Overall efficiency ηtot (%)
Conversion tech.
Fuel Reference
Härnösand Sweden 11700 28 106 Steam Turbine
Forest residues, bark sawdust, peat
(Salomón, Savola, Martin, Fogelholm, & Fransson, 2011)
Hudiksvall Sweden 13000 22 82 Steam Turbine
Wood, peat (50-50)
(Salomón, Savola, Martin, Fogelholm, & Fransson, 2011; Wahlund, Yan, & Westermark, 2001)
Lycksele Sweden 14000 32 84 Steam Turbine
Wood (Salomón, Savola, Martin, Fogelholm, & Fransson, 2011)
Iisalmi Finland 14700 31 93 Steam Turbine
Peat, wood, REF
(Salomón, Savola, Martin, Fogelholm, & Fransson, 2011)
Forssa Finland 17200 24 91 Steam Turbine
Wood, REF
(Salomón, Savola, Martin, Fogelholm, & Fransson, 2011)
Karlstad Sweden 17500 20 111 Steam Turbine
Wood
(Salomón, Savola, Martin, Fogelholm, & Fransson, 2011; Wahlund, Yan, & Westermark, 2001)
Kokkola Finland 20000 25 89 Steam Turbine
Peat, wood
(Salomón, Savola, Martin, Fogelholm, & Fransson, 2011)
Enköping Sweden 22500 28 98 Steam Turbine
Wood (Salomón, Savola, Martin, Fogelholm, & Fransson, 2011;

12
4
Power Plant Location Power Output (kWe)
Electrical efficiency1 ηe (%)
Overall efficiency ηtot (%)
Conversion tech.
Fuel Reference
Wahlund, Yan, & Westermark, 2001)
Nyköping Sweden 31500 30 96 Steam Turbine
Wood
(Salomón, Savola, Martin, Fogelholm, & Fransson, 2011; Wahlund, Yan, & Westermark, 2001)
Skelleftea Sweden 32500 31 84 Steam Turbine
Wood, peat (80-20)
(Salomón, Savola, Martin, Fogelholm, & Fransson, 2011; Wahlund, Yan, & Westermark, 2001)
Växjö Sweden 33000 30 87 Steam Turbine
Wood, peat (80-20)
(Salomón, Savola, Martin, Fogelholm, & Fransson, 2011; Wahlund, Yan, & Westermark, 2001)
Plant without CO2 capture
N/A 36000 30 90 Steam Turbine
(Gustavsson & Madlener, 2004)
Plant without CO2 capture
N/A 36000 30 90 Steam Turbine
(Gustavsson & Madlener, 2004)
Brista Sweden 39000 29 87 Steam Turbine
Wood (Wahlund, Yan, & Westermark, 2001)
Modelization of Plant without CO2 caputre
N/A 50000 30 90 Steam Turbine
Salix and forest/ logging residues
(Uddin & Barreto, 2007)
Modelization of Plant with CO2
N/A 50000 20 N/A Steam Turbine
Salix and
(Uddin & Barreto, 2007)
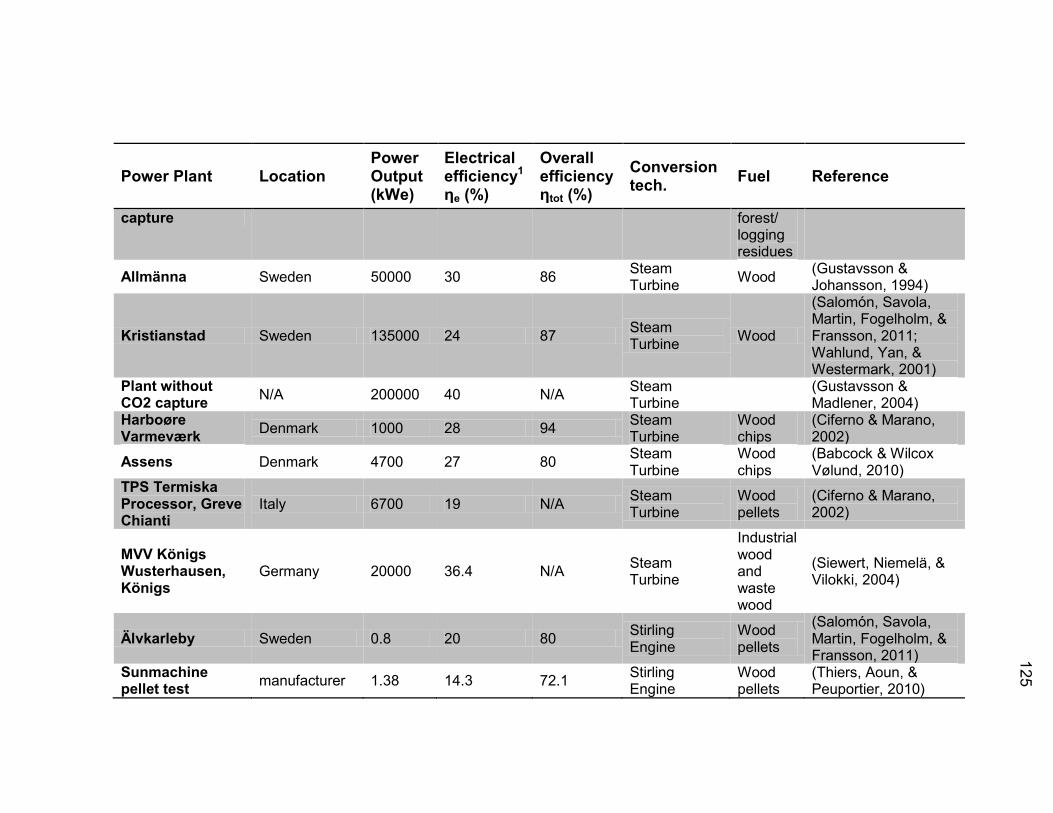
12
5
Power Plant Location Power Output (kWe)
Electrical efficiency1 ηe (%)
Overall efficiency ηtot (%)
Conversion tech.
Fuel Reference
capture forest/ logging residues
Allmänna Sweden 50000 30 86 Steam Turbine
Wood (Gustavsson & Johansson, 1994)
Kristianstad Sweden 135000 24 87 Steam Turbine
Wood
(Salomón, Savola, Martin, Fogelholm, & Fransson, 2011; Wahlund, Yan, & Westermark, 2001)
Plant without CO2 capture
N/A 200000 40 N/A Steam Turbine
(Gustavsson & Madlener, 2004)
Harboøre Varmeværk
Denmark 1000 28 94 Steam Turbine
Wood chips
(Ciferno & Marano, 2002)
Assens Denmark 4700 27 80 Steam Turbine
Wood chips
(Babcock & Wilcox Vølund, 2010)
TPS Termiska Processor, Greve Chianti
Italy 6700 19 N/A Steam Turbine
Wood pellets
(Ciferno & Marano, 2002)
MVV Königs Wusterhausen, Königs
Germany 20000 36.4 N/A Steam Turbine
Industrial wood and waste wood
(Siewert, Niemelä, & Vilokki, 2004)
Älvkarleby Sweden 0.8 20 80 Stirling Engine
Wood pellets
(Salomón, Savola, Martin, Fogelholm, & Fransson, 2011)
Sunmachine pellet test
manufacturer 1.38 14.3 72.1 Stirling Engine
Wood pellets
(Thiers, Aoun, & Peuportier, 2010)

12
6
Power Plant Location Power Output (kWe)
Electrical efficiency1 ηe (%)
Overall efficiency ηtot (%)
Conversion tech.
Fuel Reference
Sunmachine pellet
manufacturer 1.5 20 90 Stirling Engine
Wood pellets
(Thiers, Aoun, & Peuportier, 2010)
Sunmachine pellet
manufacturer 3 25 90 Stirling Engine
Wood pellets
(Thiers, Aoun, & Peuportier, 2010)
Sunmachine manufacturer 3 20.1 90.6 Stirling Engine
Wood pellets
(Barbieri, Spina, & Venturini, 2012)
Sunmachine manufacturer 3 20 90 Stirling Engine
Wood pellets
(Angrisani, Roselli, & Sasso, 2012)
DISENCO N/A 3 18.4 92 Stirling Engine
Wood pellets
(Barbieri, Spina, & Venturini, 2012)
Joanneum Research (Energy Research Institute)
Austria 3.2 23.5 - Stirling Engine
Wood chips
(Podesser, 1999)
Joanneum Research (Institute of Energy Research)
Austria 30 26 - Stirling Engine
Wood chips
(Zeiler, Padinger, Spitzer, & Podesser, 2007)
Technical University of Denmark
Denmark 31 9.2 90 Stirling Engine
Wood chips
(Biedermann, Carlsen, Schöch, & Obernberger, 2003)
Technical University of Denmark
Denmark 75 11.7 85.9 Stirling Engine
Wood chips
(Biedermann, Carlsen, Obernberger, & Schöch, 2004)
SOLO161 Stirling Germany 2 22 92 Stirling Engine
Wood chips
(Kuhn, Klemes, & Bulatov, 2008)
BAXI Ecogen manufacturer 6 13.5 94.6 Stirling Engine
Wood chips
(Angrisani, Roselli, & Sasso, 2012)

12
7
Power Plant Location Power Output (kWe)
Electrical efficiency1 ηe (%)
Overall efficiency ηtot (%)
Conversion tech.
Fuel Reference
SOLO161 Stirling Italy 9 24 96 Stirling Engine
Wood chips
(Parente, Galletti, Riccardi, Schiavetti, & Tognotti, 2012)
SOLO161 Stirling manufacturer 9 25 97.2 Stirling Engine
Wood chips
(Angrisani, Roselli, & Sasso, 2012)
Source: personal compilation.
1 LHV basis
2 HHV basis

VITA

128
12
8
VITA
Arnau Gonzalez Juncà Graduate School, Purdue University
Education M.Sc. in Technology, Leadership and Innovation, 2013, Purdue University, Indiana, United States M.Sc. in Sustainability, 2013, Universitat Politècnica de Catalunya, Catalunya, Spain B.Sc. and M.Sc., Aeronautics Engineering, 2010, Universitat Politècnica de Catalunya, Catalunya, Spain
Work experience Aviation Analyst, 2011, Advanced Logistics Group, ALG (INDRA), Barcelona, Catalunya, Spain Junior Project Engineer, 2010-2011, Applus LGAI, Cerdanyola (Barcelona), Catalunya, Spain Fluid dynamics engineering internship, 2010, Universitat Politècnica de Catalunya, Catalunya, Spain
Research Interests Sustainability Renewable Energy Technologies