post implementation monitoring and analysis pbcs workshop bangkok, thailand, 13-14 may, 2013
TRANSCRIPT

Post Implementation Monitoring and Analysis
PBCS Workshop
Bangkok, Thailand, 13-14 May, 2013

Post Implementation Monitoring - Requirement
• The ICAO Global Plan calls for the implementation of a performance based system and ICAO Annex 11 requires that data link system performance is monitored to verify that an acceptable level of safety continues to be met.
• Annex 11 at paragraph 2.2.7.5 states:
“Any significant safety-related change to the ATC system, including the implementation of a reduced separation minimum or a new procedure, shall only be effected after a safety assessment has demonstrated that an acceptable level of safety will be met and users have been consulted. When appropriate, the responsible authority shall ensure that adequate provision is made for post-implementation monitoring to verify that the defined level of safety continues to be met.”

APANPIRG – Adopt GOLD to replace FOM

State Letter – Adopting GOLD

Monitoring Guidance - GOLD Appendix D (1)
• GOLD Appendix D contains the following guidance material:– (a) ANSP data collection and analysis
• Defines a common data reporting format. • Guidance material on how to obtain the required
data points and on the calculation of actual communication performance (ACP), actual communication technical performance (ACTP), pilot operational response time (PORT), actual surveillance performance (ASP)
• Examples of Analysis and assessing results• Discusses data filtering requirements.

Monitoring Guidance - GOLD Appendix D (2)
• Appendix D contains the following guidance material:– (b) Problem reporting and resolution
• problem identification and resolution process– (c) Regional performance monitoring
• monitoring of ADS‑C RSP and CPDLC RCP at a regional level.

Post Implementation Monitoring
• Oversight of the compliance to the Annex 11 2.2.7.5 requirements is a matter for the States.
• States participate in planning and implementation regional groups (PIRGs), and most use a regional monitoring agency to facilitate monitoring activities within their respective region.
• Individual states/ANSPs will need to provide the data and information and analysis that will portray regional performance measures.
• All stakeholders, ANSPs, operators, CSPs, airframe manufacturers, all need to actively participate in reporting and resolving problems .

Post Implementation Monitoring
• Individual ANSP will develop the data collection mechanisms, monitoring tools, and internal reporting requirements best suiting their own environment.
• All ANSP should collect and maintain a database of FANS1/A performance data using the data formats specified in GOLD Appendix D.
• These databases will provide the means to aggregate measures of ADS‑C Required Surveillance Performance (RSP) and CPDLC Required Communication Performance (RCP) on a regional and global basis.
Note: Data aggregation is useful for identifying performance problems for specific aircraft/fleets

Continuous Performance Improvement
• Monitoring of data link performance in terms of RCP and RSP is an important part of the performance based system described in the ICAO global plan.
• To successfully achieve this performance monitoring on a global scale requires the use of a common data set.
• It is only through this common data set that RCP and RSP data can be aggregated from the individual ANSP level through to a regional level and then to a global level.
• This aggregation of performance data is in accordance with the guidelines provided in ICAO Doc 9883 Manual on Global Performance of the Air Navigation System.
Continuous Performance Improvement
• Monitoring shows that the FANS1/A system is capable of meeting the RCP240 and RSP180 requirements.
• However, not all aircraft meet the requirements. • For those aircraft not meeting the requirements the aim is to
improve their performance by:– Identifying the performance problems by monitoring.– Reporting performance problems through a Central
Reporting Agency that has buy in from all stakeholders. – Resolving the identified performance problems.– Providing feedback to stakeholders.
• Promote a culture of continuous performance improvement among all stakeholders.

FANS1/A Data link - Performance Based System
FANS 1/A
FANS 1/A
CPDLC RCP & ADS-C safety performance monitoring
Central Reporting
Agency
Operator CSP
Aircraft manufacturer
Avionics supplier
Satellite company
Network
Corrective action
Ad
vaafetys
Continuous improvement
ATSP
Performance Analysis - Continuity
• Time to complete a CPDLC transaction or deliver an ADS-C report
• Defines the percentage of transactions or reports delivered within a specified time
• For any transaction not completed within the specified time, the controller or system should take some action
• Value is 99.9% in current RCP/RSP specifications and the time value associated should be used to provide an indication to system or controller when it is exceeded
• A continuity value of 95% is also specified. This value is used in statistical measurement and no indications are provided to the system or controller.

CPDLC Performance Analysis
• CPDLC performance analysis is based on an analysis of controller initiated transactions.– The analysis uses the measurement of transit and
response times to a subset of CPDLC uplinks that receive a single DM 0 WILCO response.
– The rationale behind this is that the critical communications requirement is provided by intervention messages when applying reduced separation standards.
– Incorporating other message types will skew the observed data because of the longer response times from the flight deck.

Flight crew
Navigation
ATM functional capabilities
Aircraft
Communication
Controller
Surveillance Surveillance
ATS unit
ATM functional capabilities
communications and controller intervention buffer
Operational communication transaction
ATM contextATM context
A Z
RCP type
Human or system initiates transaction
Human is confident that transaction is
satisfactorily complete

Monitored performance
Responder performance
Technical communication
Human machine interaction
Human machine interaction
Reacting to message
Human machine interaction
Technical communication
Human machine interaction
A
Initiator acts to send message
Responderreceives an indication of incoming message
Responder acts to display message
Initiator acts to compose message
Responder acts to send message
Initiator receives an indication of incoming message
Initiator completes actions to display message
Responder acts to compose message
D G I K M P Z
Initiator performance
Initiator performance
AT
S U
nit
Co
mm
Air
cra
ft
Air
cra
ft
Co
mm
AT
S
Un
it
Operational compliance target set
Technical performance
Technical performance
TEMPLATE FOR TYPICAL DATA COMPLIANCE TARGET SET

CPDLC Performance Analysis
• To calculate ACP:– the difference between:
• Time uplink message is originated at ATSP • Time WILCO response is received at ATSP.
• To calculate ACTP:– the difference between:
• downlink WILCO aircraft time stamp• Time WILCO response is received at ATSP.
– PLUS –• 1/2 round trip time between:
– Time uplink message is originated at ATSP– Time MAS response is received at ATSP.
• PORT is calculated by the difference between ACP and ACTP.
•

CPDLC Performance Analysis
1 42 3
ACP
Up Down
nt)(Uplink_Seeived)(WILCO_RecACP
DownΔ2
UpΔACTP
ACTPACPPORT
1. Uplink Sent. This is the date/time that the CPDLC clearance was sent to the aircraft.
2. MAS/LACK Received. This is the date/time that the MAS/LACK for the CPDLC clearance was received.
3. WILCO Sent. This is the date/time that the WILCO reply is transmitted.
4. WILCO Received. This is the date/time that the WILCO reply for the CPDLC clearance was received.
The measurements (in seconds) are calculated as follows:
TRN
RCTP
Responder

CPDLC – Data PointsRef Label Description and/or remarks
1 ANSP The four letter ICAO designator of the facility (e.g. NZZO).
2 Aircraft registration
(FANS 1/A)
The aircraft registration in ICAO Doc 4444 Format (no hyphens, packing dots, etc.) (e.g. N104UA).
Note.— Extracted from ACARS header or application message.3 Aircraft type
designatorThe ICAO aircraft type designator (e.g. B744).
Note.— Extracted from ANSP database using aircraft registration as key.
4 Operator designator
The ICAO designator for the aircraft operating agency (e.g. UAL).
Note.— Extracted from ANSP database using aircraft registration as key.
5 Date In YYYYMMDD format (e.g. 20081114).
Note.— Extracted from ANSP system data recording time stamp, synchronized to within 1 second of Universal Time Coordinated (UTC).
6 MAS RGS Designator of the RGS that MAS downlink was received from (e.g. POR1).
Note.— This is a 3 or 4 letter designator extracted from the ACARS header DT line.
7 OPS RGS Designator of the RGS that the operational response was received from (e.g. AKL1).
Note.— This is a 3 or 4 letter designator extracted from the ACARS header DT line.

CPDLC – Data PointsRef Label Description and/or remarks
8 Uplink time The timestamp on the uplink CPDLC message sent by the ANSP in HH:MM:SS format (e.g. 03:43:25).
Note.— Extracted from ANSP system data recording time stamp, synchronized to within 1 second of UTC.
9 MAS/LACK receipt time
The ANSP timestamp on receipt of the MAS in HH:MM:SS format (e.g. 03:43:35).
Note.— Extracted from ANSP system data recording time stamp, synchronized to within 1 second of UTC.
10 MAS/LACK round trip time
In seconds (#9-#8) (e.g. 10).
11 Aircraft FMS time stamp
In the operational response messages in HH:MM:SS (e.g. 03:44:15).
Note 1.— For FANS 1/A, extracted from the ATCmessageHeader timestamp in the decoded operational response message. See RTCA DO-258AEUROCAE ED‑100A section 4.6.3.3.
12 ANSP timestamp on the receipt of the operational response
In HH:MM:SS (e.g. 03:44:45).
Note.— Extracted from ANSP system data recording time stamp, synchronized to within 1 second of UTC.
13 Operational message round trip time
From sending uplink (#8) to receipt of operational response (#12) in seconds (e.g. 80).
14 Downlink response transit time
In seconds (#12-#11) (e.g. 30).

CPDLC – Data PointsRef Label Description and/or remarks
15 Uplink message elements
All uplink message element identifier preceded by U encapsulated between quotation marks with a space between each element (e.g. “U118 U80”)
Note.— Extracted from the decoded operational uplink that initiated the transaction.
16 Downlink message elements
All downlink message elements encapsulated between quotation marks with a space between each element if required (e.g. “D0”)
Note.— Extracted from the decoded operational downlink.17 ACTP Actual communication technical performance in seconds (e.g. 35).
Note.— Truncated to whole seconds.
18 ACP Actual communications performance in seconds measured as the difference between time uplink sent (#8) to operational response received (#12) (e.g. 80).
19 PORT Pilot Operational Response Time = ACP (#18) - ACTP(#17) (e.g. 45).
Note.— Implementers should allow for negative values where the operational response is received before the MAS as per Figure D- 2 above. When graphing PORT negative values should be counted as 0.
Additional fields may include: The data link communications type (COMTYP). Extracted from the MAS RGS and OPS RGS identifying the media used for the uplink and downlink message. There are nine possible entries for COMTYP: SAT, VHF, HF, SV, SH, VS, VH, HS, HV. Value is based on the MAS RGS field (#6) and OPS RGS (#7).

ADS-C Performance Analysis
• ADS-C actual surveillance performance (ASP) analysis is based on the calculation of:– the transit times of the ADS‑C periodic and event
reports between the aircraft and the ANSP ground system.
– This is the difference between the time extracted from the decoded ADS‑C basic group timestamp when the message originated from the FMS and the time the message is received at the ATSP.

ADS-C – Data Points
Ref Label Description and/or remarks1 ANSP The four letter ICAO designator for the facility (e.g. NZZO).
2 Aircraft Registration
The aircraft registration in ICAO Doc 4444 Format (no hyphens, packing dots, etc.) (e.g. N104UA).
Note.— Extracted from ACARS header or application message.
3 Aircraft Type Designator
The ICAO aircraft type designator (e.g. B744).
Note.— Extracted from ANSP database using aircraft registration as key.
4 Operator Designator
The IATA designator for the aircraft operating agency (e.g. UAL).
Note.— Extracted from ANSP database using aircraft registration as key.
5 Date In YYYYMMDD format (e.g. 20081114).
Note.— Extracted from ANSP system data recording time stamp, synchronized to within 1 second of UTC.
6 RGS Designator of the RGS that ADS‑C downlink was received from (e.g. POR1).
Note.— This is a 3 or 4 letter designator extracted from the ACARS header DT line.

ADS-C – Data PointsRef Label Description and/or remarks
7 Report Type The type of ADS‑C report extracted from the ADS‑C basic group report tag where tag value 7=PER, 9=EMG, 10=LDE, 18=VRE, 19=ARE, 20=WCE. As some aircraft concatenate more than one report in the same downlink extract the ADS‑C report tag from each ADS‑C basic group and identify them in the REP_TYPE column by using the first letter of the report type as an identifier (e.g. for a concatenated report containing two ADS‑C basic groups for a periodic report and a waypoint event report the field will contain PW). Where a downlink does not contain a ADS‑C basic group the REP_TYPE field will be left blank.
8 Latitude The current latitude decoded from the ADS‑C basic group. The format is “+” for North or “-“ for South followed by a decimal number of degrees (e.g. -33.456732).
9 Longitude The current longitude decoded from the ADS‑C basic group. The format is “+” for East or “-“ for West followed by a decimal number of degrees (e.g. +173.276554).
10 Aircraft Time The time the ADS‑C message was sent from the aircraft in HH:MM:SS (e.g. 03:44:15).
Note.— Decoded from the ADS‑C basic group timestamp extracted as seconds since the most recent hour. See RTCA DO-258A/EUROCAE ED‑100A, section 4.5.1.4.

ADS-C – Data PointsRef Label Description and/or remarks
11 Received Time The ANSP timestamp on the receipt of the ADS‑C message in HH:MM:SS (e.g. 03:44:45).
Note.— Extracted from ANSP system data recording time stamp, synchronized to within 1 second of UTC.
12 Transit Time The transit time of the ADS‑C downlink in seconds calculated as the difference between #10 Aircraft Time and #11 Received Time (e.g. 30).
Additional fields may include:
The data link communications type (COMTYP) based on the RGS field (#6). Satellite (SAT), Very High Frequency (VHF), High Frequency (HF).

ADS-C and CPDLC Data Points - .csv files
• Comma separated value .csv files are used for data transfer:

Data Filtering
• It is important that consistent data filtering is employed to ensure that all ANSP measure against the same baseline.
• Delayed transactions measured during periods of system outage should not be used when assessing RCP or RSP.
– These delays are easily identified during outages that have been notified by the CSP
– Data should be carefully reviewed for outages that have not been notified.

Data Filtering
Typical outage indication – not notifiedAircraft registration
Aircraft time ANSP system time
Downlink time (Seconds)
ZK-SUI 11:55:38 12:12:52 1034
ZK-SUI 11:44:42 12:12:19 1657
ZK-SUJ 11:41:54 12:12:01 1807
ZK-SUJ 11:26:18 12:09:42 2604
ZK-SUI 11:23:21 12:08:32 2711
ZK-SUJ 11:20:34 12:07:39 2825
ZK-OKG 11:53:52 12:12:51 1139

Data Filtering
• ADS-C data will also include duplicated ADS-C messages which will skew the measurements if not removed.
• Reports may be duplicated two or three times as illustrated below.
LAT_LON Aircraft time ANSP system time
Downlink time (Seconds)
350225S1694139E 22:29:45 22:31:04 79
350225S1694139E 22:29:45 22:34:56 311
350225S1694139E 22:29:45 22:40:05 620

Performance Analysis
• Performance data is usually analyzed on a monthly basis to assess the “health” of the data link system.
• Analysis is performed on the aggregate data set (i.e. data link transactions from all media types – satellite, VHF, HF) for the defined analysis period and on subsets of interest (e.g. satellite transactions only)
• The data is analyzed in various ways e.g. :
– By increments of time (one month, six months, year)
– By media type (SATCOM, VHF, SATCOM+HFDL)
– By Station ID (GES type – VHF, SATCOM)
– By Operator (aircraft type)

Performance Analysis - presentation
• There are a number of ways that data analysis can be presented:
– (1) Cumulative frequency distribution graph

Reading a cumulative frequency distribution
In this example:
2012 Actual Communications Performance meets the RCP240 requirements:
99.9% of transactions completed in 103”
95% of transactions completed in 52”

Performance Analysis - presentation
(2) Graphing performance achieved over time

Performance Analysis - presentation
(3) Tabular

CPDLC Performance Analysis – Media Performance
• ACP and ACTP are used to assess CPDLC transaction performance through the various communications media.
• PORT independent of media is assessed using one media. • Graphs depict measured performance against the RCP and
RCTP requirements at 95% and 99.9% and are completed for the performance specification in use (e.g. RCP 240, RCP 400).
• Typically an analysis is completed for:– Data from all aircraft via all remote ground station (RGS).– Data from all aircraft via SATCOM RGS– Data from all aircraft via VHF RGS– Data from all aircraft via HF RGS– Data from all aircraft via HF and SATCOM RGS

CPDLC Performance Analysis – Media Performance

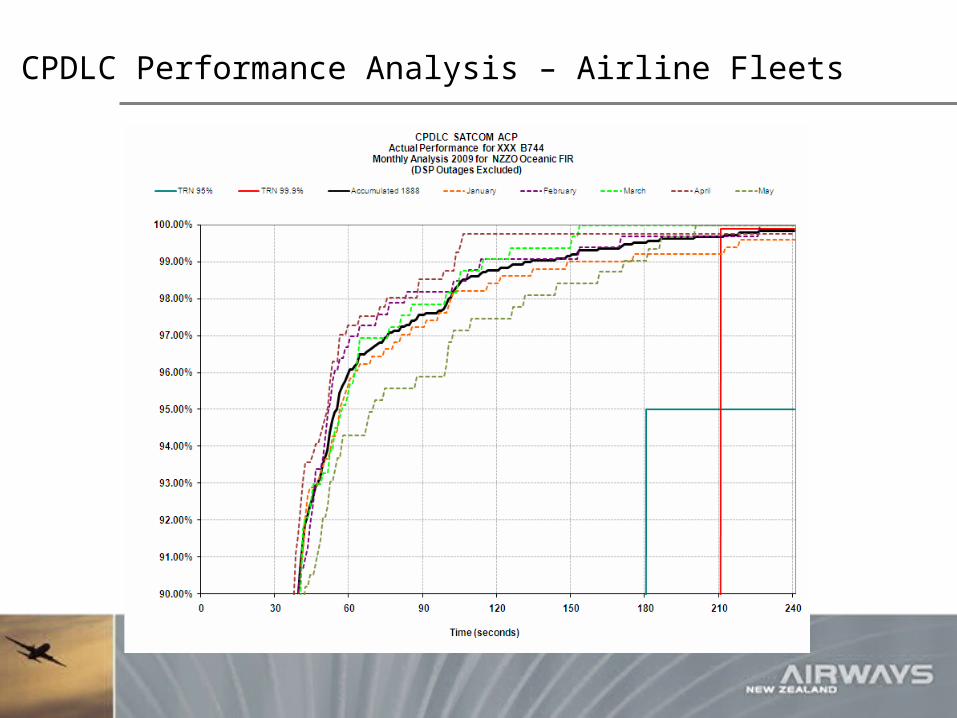
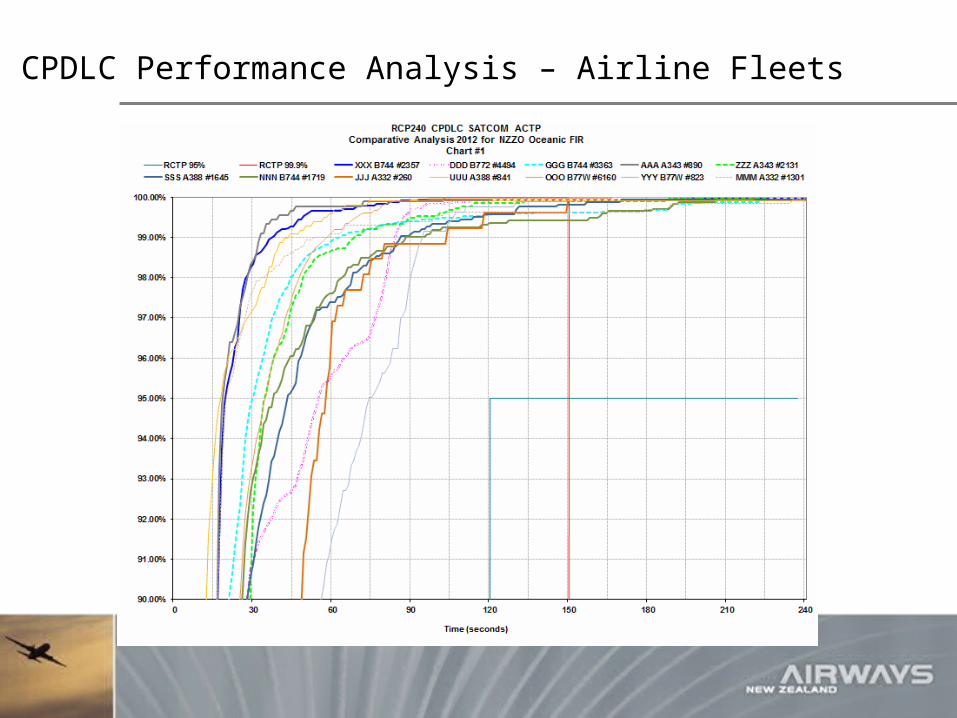
CPDLC Performance Analysis – Airline Fleets
• ACP, ACTP, and PORT can be used to monitor the performance of each aircraft type in an operator’s fleet.
• Usually maintained on a monthly basis and can be used to observe the performance of each type when using different media such as: via SATCOM; via SATCOM + HF; via HF; via VHF; and via all RGS.
• Performance variations may be observed from month to month and these variations can be monitored over a number of months to detect any significant performance degradation that needs further investigation.

CPDLC Performance Analysis – Airline Fleets
CPDLC Performance Analysis – Airline Fleets
CPDLC Performance Analysis – Airline Fleets

ADS-C Performance Analysis – Media Performance
• Graphs illustrating ADS-C surveillance data transit time are used to assess performance through the various communications media.
• The graphs depict measured performance against the surveillance requirements at the 95% and 99.9% level. An analysis is completed for:– Data from all aircraft via all remote ground station (RGS).– Data from all aircraft via SATCOM RGS– Data from all aircraft via VHF RGS– Data from all aircraft via HF RGS– Data from all aircraft via combined HF and SATCOM RGS

ADS-C Performance Analysis – Media Performance

ADS-C Performance Analysis – Fleet Performance
• Graphs illustrating ADS-C surveillance data transit time can be used to monitor the performance of each aircraft type in an operator’s fleet.
• Typically, these are maintained on a monthly basis and can be used to observe the performance of each type when using different media such as: – via SATCOM;– via SATCOM + HF;– via HF; via VHF;– via all RGS.

ADS-C Performance Analysis – Airline Fleets

ADS-C Performance Analysis – Airline Fleets

ADS-C Performance Analysis – Airline Fleets

ADS-C Performance Analysis – Airline Fleets

Some performance initiatives (1) Data2-Data3
• This A345 fleet was gradually fitted with new cabin services using Data 3 from December 2008
• After FANS Problem Report investigation deterioration identified as being caused by an interaction between ACARS Data 2 and Data 3 cabin services.
January
August
October
September

Some performance initiatives (1) Data2-Data3

Some performance initiatives (1) Data2/Data3
Pre R15
R15 +
The fleet achieved RSP180 requirements following the R15 release at Santa Paula.

Some performance initiatives (2) - B777 2008-09
Required99.9%< 180 secAchieved Q4 200897.7% < 180 secAchieved Q4 200998.1% < 180 sec Required95%< 90secAchieved Q4 200895.9% < 90 secAchieved Q4 200995.2% < 90 sec

Some performance initiatives (2) B777 today

ANSP RCP/RSP Monitoring
• RCP/RSP based monitoring as is a significant improvement on historical methods.
• monitoring provides basis for continuous performance improvement by:– Providing all stakeholders with clear indications of
actual performance.– Providing all stakeholders with clear indications of
where improvement is needed.– Verifying the effect of any changes to the FANS-1/A
“system”

Pre RCP/RSP – Monitoring downlink latency

FANS-1/A Current Performance – ADS-C

ADS-C : VHF vs SATCOM
VHF 95% 20”SAT 95% 45”

Performance ADS-C 2009-2012

FANS-1/A Current Performance - CPDLC

Performance – By Fleet – 2012 - ACP

FANS-1/A Current Performance - CPDLC
Month by Month performance 2012

Performance – CPDLC ACP 2009-2012
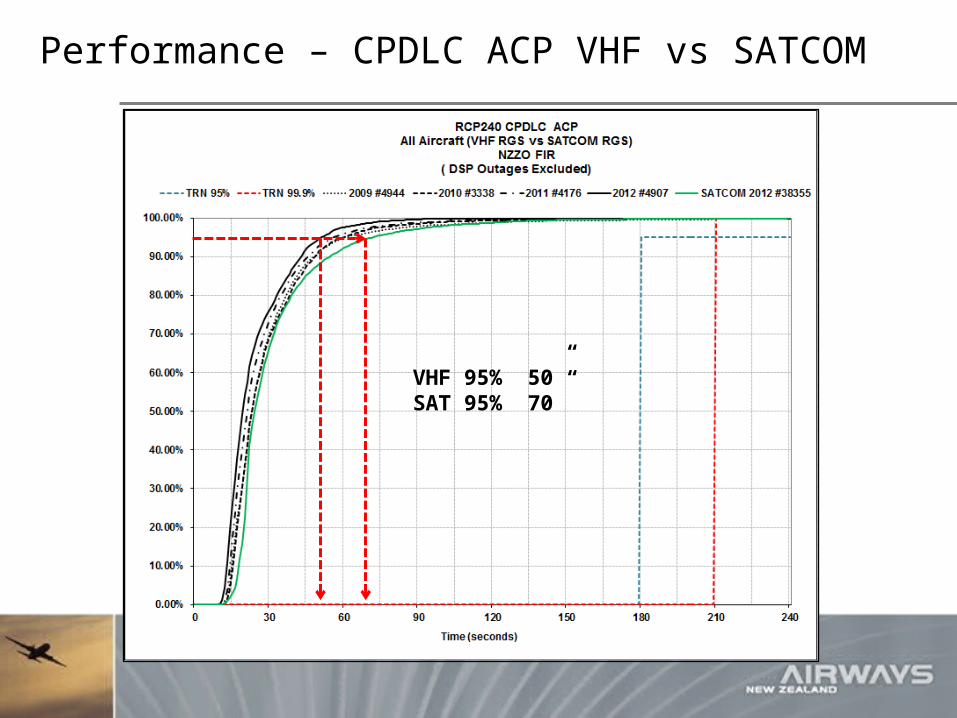
Performance – CPDLC ACP VHF vs SATCOM
VHF 95% 50”SAT 95% 70”

CPDLC PORT – Pilot operational response

Monitoring Availability
• ANSP should report on CSP notified system outages and on detected outages that have not been notified.
• Outages times are used to calculate the actual availability of service provision.
• ANSP can use tabular analysis to report outages and graphical analysis to track availability

Monitoring Availability
• For each outage the following information should be reported:– Time of CSP outage notification: In YYYYMMDDHHMM format or
“Not Notified” if no CSP notification received.– CSP Name: Name of CSP providing outage notification if
applicable.– Type of outage: Report media affected SATCOM, VHF, HF, ALL.– Outage start time: In YYYYMMDDHHMM format– Outage end time: In YYYYMMDDHHMM format– Duration of Outage: In minutes.– As per GOLD Appendix B for RCP240 only outages greater than
10 minutes are reported.

Availability of Service
• Availability of Service– Calculated based on 24/7 operation over a 12 month period of
operation• 24/7 = 168 hours per week x 52 weeks per year = 8736 hours or
524,160 minutes in a 12-month period• 99.9% (for safety) available service allows 0.001 “down time” or
524 minutes of a 24/7 operation • 99.99% (for efficiency) available service allows 0.01 “down time”
or 52.4 minutes/year of a 24/7 operation– Outages greater than 10 min for RCP240 and 20 min for RCP400
included – Outages less than these values are included against continuity
requirement– Down time due to planned service is not included

Monitoring Availability - Inmarsat

Monitoring Availability - Inmarsat
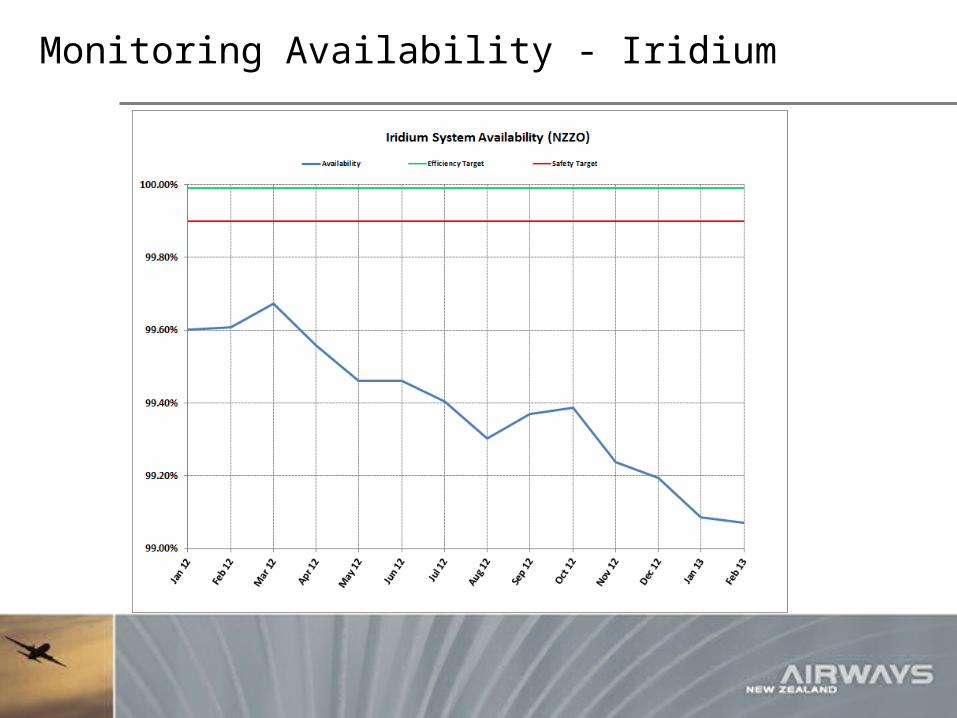
Monitoring Availability - Iridium

Monitoring Availability - Iridium

Thank youPaul RadfordManager Oceanic SystemsAirways New [email protected]