positional accuracy analysis of flickr and panoramio...
TRANSCRIPT

Positional accuracy analysis of Flickr and Panoramio images for
selected world regions
Dennis Zielstra* and Hartwig H. Hochmair
Flickr and Panoramio are fast growing photo sharing services that contain millions of
geotagged images contributed by Web users from all over the world. This study analyzes
the positional accuracy of 1433 images for 45 areas in four selected world regions by
comparing the geotagged position of photos to the manually corrected camera position
based on the image content. The analysis reveals a better positional accuracy for
Panoramio than for Flickr images, and some effects of image category and world region
on positional accuracy. These findings can be helpful when considering Flickr and
Panoramio images as data sources for future geo-applications and services.
*Author to whom correspondence should be addressed:
Dennis Zielstra University of Florida, Geomatics Program, Fort Lauderdale Research and Education Center 3205 College Avenue Ft. Lauderdale, FL-33314 USA Phone: (954) 577-6392 E-mail: [email protected] Hartwig H. Hochmair University of Florida, Geomatics Program, Fort Lauderdale Research and Education Center 3205 College Avenue Ft. Lauderdale, FL-33314 USA Phone: (954) 577-6317 E-mail: [email protected]

1. Introduction
Volunteered Geographic Information (VGI) (Goodchild, 2007) complements
geographic information that can be extracted from traditional sources, such as earth
imagery or census data. Flickr and Panoramio are prominent examples of Web 2.0
applications which facilitate the sharing of VGI in form of geotagged images. These
photo sharing platforms allow a Web user to upload geotagged images to an application
server, where the geographic position of an image is then visualized on a world map
through a thumbnail image.
Shared photos can be annotated with a variety of metadata, including textual tags, title,
geographic position, and capture time. Since data from photo sharing platforms are used
in a variety of spatial analysis tasks (Girardin et al., 2008, Schlieder and Matyas, 2009,
Hochmair, 2010, Lu et al., 2010), there is need to assess the quality of image metadata.
The focus of this paper is on the accuracy of tagged geographic coordinates for Flickr
and Panoramio photos, i.e. positional accuracy. Other studies already explored the
quality of textual tag information, including the accuracy of location tags for Flickr
images (Hollenstein and Purves, 2010), or the completeness of titles for Flickr videos
(Larson et al., 2011). VGI geotagged images can, for example, be used in virtual tours
to give the user a first visual impression of the area if the images are sufficiently
accurate at the street level. An example is shown for downtown Cologne in Figure 1,
which features a local brewery (left image) and the city hall (right image). This type of
geo-application would be particularly helpful in regions where Google Street View is
not available.

Figure 1. Virtual tour of a predefined route
Flickr and Panoramio images, like most Web 2.0 data, are provided by volunteer
Web users with little formal training in geo-spatial mapping techniques, and a
regulatory instance that monitors the data quality of contributed photos is missing.
While there are different aspects of data quality of geographical information, including
completeness, logical consistency, positional accuracy, temporal accuracy, and thematic
accuracy (International Organization for Standardization, 2009), this paper assesses the
2D positional accuracy of Flickr and Panoramio images. It is an extension of an earlier
pilot study which was conducted for selected regions in Europe (Hochmair and Zielstra,
2012).
We hypothesize that the following factors influence the positional accuracy of
geotagged images:

1) Image content (scene type): Images depicting larger areas (e.g. panoramic
images) are less accurately placed than those showing a nearby scene (e.g. a street
building). Possible explanation: The geographic scale is larger for the first type and the
photographer may not be as careful in placing an image of that type on the map during
the upload process.
2) World region: Positional accuracy varies by world region. Possible
explanations: (a) variation in rate of images that were geo-tagged with GPS equipped
cameras as opposed to manual placement, (b) unfamiliar signs for street names or
unfamiliar road naming systems (e.g. Chinese characters being unfamiliar for Western
tourists) which affects manual dragging of images on digital background maps during
upload, (c) variation in ratio between residents and non-residents (e.g. tourists) affecting
manual image placement on background map.
3) Data source: Panoramio images are more accurate than Flickr. Possible
explanation: Panoramio attracts a more spatially aware audience.
4) Peer review: Images that are viewed or commented on more often are more
accurately positioned. Possible explanation: A larger number of views or comments
indicate a more active peer based correction process.
These hypotheses will be tested through a variety of statistical tests based on the
sample image dataset. Further we quantify the occurrence of one particular type of
blunder, which we call position mismatch error. This error occurs during the photo
upload process if a Flickr or Panoramio user manually drags an image icon to the
position of the photographed object instead of that of the camera on a background map.
2. Previous work
Over the recent years, the research community began to explore different ways to
analyze the spatio-temporal information of images found on photo sharing Web sites.

The analyses comprise extraction of travel patterns, identification of image search
behavior, and assessment of data quality, based on spatial and semantic metadata and
image content.
Information from textual tags, i.e., geographic terms, has been used to derive the
location where an image was taken (Serdyukov, 2009). Chung and Yoon (2009)
estimate the effectiveness of image tags by investigating to what extent user-supplied
tags are similar or different from search queries on the Flickr Web site, finding that
Flickr tags have their own unique features compared to user queries for image
searching.
Chen and Roy (2009) explore temporal and locational distributions of tags from
Flickr photos to detect events, which facilitate photo browsing by events.
Girardin et al. (2008) use spatio-temporal information on Flickr images to
reconstruct people’s movement through Rome, Italy, to identify temporal patterns of
visiting activities for selected locations, such as the Colosseum. Andrienko et al. (2009)
use Panoramio images from Germany to retrieve information about places and people,
including identification of events and joint travels. Schlieder and Matyas (2009) analyze
the popularity of places based on the spatial distribution of Flickr images for four
European cities, finding that the popularity follows a power law with very few highly
popular locations and a long tail of places that are visited only occasionally. A recent
study found that the density of Panoramio photos is higher along scenic routes than
along shortest routes (Hochmair, 2010).
Feature-based geometric matching approaches on the image content have been
applied to place recognition in regions where reference views are provided in a database
(Zhang and Kosecka, 2006). This has been used for co-registering online photographs
of landmarks for object-based photo browsing (Snavely et al., 2006) or scene

summarization (Simon et al., 2007). A camera location system developed by Jacobs et
al. (2007) relies on matching images with satellite data. Hays and Efros (2008)
developed a data-driven scene matching approach, including color histograms, texture,
or geometric context, to estimate a distribution over geographic locations from a single
image. Li et al. (2009) and Crandall et al. (2009) use a multiclass vector support
machine based on visual features, textual tag information, and temporal information to
predict at which popular place (landmark, metropolitan area) an image was taken when
compared to an image database. Li et al. (2008) and Li et al. (2010) developed location
recognition algorithms that use matching primitives between overlapping images to
build 3D point models around prominent landmarks from photo collections. The
approach allows for each image the reconstruction of the camera positions in real-world
coordinates if the 3D model is geo-registered. Larson et al. (2011) and Friedland et al.
(2011) combine textual metadata and visual cues to determine the geographic location
of a video (more specifically, of the median frame), using feature matching techniques
with the Flickr image database.
A few papers tackle directly the problem of positional accuracy of images in
photo sharing services. Hollenstein and Purves (2010) analyzed for 9775 Flickr images
around Hyde Park in London the match between tagged geographic terms and the
geotagged position. Results show that 86% of images tagged “hydepark” were located
either within Hyde Park or on adjacent main roads. Stark (2011) assessed the spatial
accuracy of addresses stored in the OpenAddresses (OA) database through comparison
with address locations in Open Web Mapping Services (OWMS) of Bing Maps, Google
Maps, and Yahoo Maps. Results show that OWMS can help identify outliers and
malicious edits in OA, while small positional errors cannot be detected due to limited
positional accuracy of addresses in the OWMS as a result of different geocoding
algorithms used.
3. Data and methods
Data sources
The data retrieved for our analysis originated from the two photo sharing Web sites
Flickr and Panoramio. Flickr, created by Ludicorp in 2004 and acquired by Yahoo! in
2005, underwent a rapid growth within the past seven years. In August 2011 over 6
billion images were hosted on Flickr (Kremerskothen, 2011) of which about 3-4% are
geotagged (Flickr, 2009), a functionality that was added to Flickr in 2006 (Arrington,
2006). One year after the initiation of Flickr, Panoramio, a platform that solely relies on
geotagged images, was launched and acquired by Google in 2007. No current numbers
are published by Panoramio, but back in January 2008 6.8 million geotagged images
were submitted (Taylor, 2008).
Both Web sites allow users to create a free account, upload their photos and
provide additional information in similar ways. Due to the plethora of new devices that
support built-in GPS receivers which obtain the camera position, the number of
geotagged images on both Web sites is rapidly growing. Most devices store a variety of
information such as camera model, focal length, or position in the exchangeable image
file (EXIF) format which can be uploaded to the Flickr and Panoramio portals together
with the image. Some users prefer to add the camera position information manually,
e.g., when obtained from an external GPS device. Further both portals allow the user to
manually drag an image to the corresponding position on a background map during
upload.
The error of a published image position can have a variety of causes. While
using a GPS handheld or built-in GPS receiver might provide accurate 2D-positioning
information with at least three satellites in view, canopy and nearby buildings will
deteriorate this accuracy. Alternatively, geotagging the image manually by dragging it
over a digital background map requires the photographer to be familiar with the local
area the image was taken in, otherwise the camera position may not be correctly
matched with the background map which results in a misloctaed image icon.
The data for our analysis was retrieved through APIs provided by the Panoramio
and Flickr Web sites using PHP. Only images that are declared public by the person
uploading the photos can be downloaded. Both Web sites allow users to assign
uploaded photos to one or several thematic groups which help to specify the content of
the image, besides providing tag information. This additional classification helped us to
filter images for download that were useful for the analysis, i.e. images of outdoor
scenes. Especially in the case of Flickr, where a large percentage of photos show indoor
or close up scenery, applying a filter that only retrieves images from groups such as
“Architecture” or “Travel Photography” proved to be mandatory. No filter was needed
for Panoramio since the majority of images show outdoor scenes.
Measurement procedure and selection of image sample
The positional accuracy is determined through measuring the distance between the
published image position, which is expressed in latitude and longitude, and the
estimated camera position based on image content. The geographic coordinates of an
image are obtained through Flickr and Panoramio APIs, and visualized as point features
in ArcMap (as part of ESRI’S ArcGIS suite). During the data import process to
ArcMap, the URL linking to the photo on the Flickr or Panoramio Web site was also
retained and added as an attribute to the point features. This way, for each mapped
image location, the associated image content could be viewed in a Web browser. Based
on the image content the analysts estimated the camera position on the ArcMap aerial

image background layer and marked it as a new point feature.
Theoretically the zoom level used while taking the image may affect the
estimated camera position. The EXIF file, if available as part of the image metadata,
provides some indirect information relating to the used zoom level, including the focal
length. A larger focal length results in a narrower angle of view and thus a higher
magnification. However, the focal length value varies by photo camera models and is
different for interchangeable lenses, which makes it difficult to derive a zoom level
from a given focal length value in the image metadata. Further, not all images provide
these additional metadata. When analyzing the geometric relationship between
photographed object position, published image position, and estimated camera position
for inaccurate points, it was found that these three locations were rarely located along a
straight line, indicating that the positional error was not caused by a varied zoom level
but some other factors. Figure 2 provides an example for such a situation. The
photographed object is assumed to be in the image center (yellow star), and its true
position is visualized as a star symbol in the map. The yellow circle denotes the posted
image position obtained from the Web, while the red circle denotes the corrected
camera position which was estimated by the analyst with local knowledge from the
image content. The three locations are not located along a line.

Figure 2. Mapped positions of geotagged image, camera (corrected), and photographed
object
For each image, the distance between the imported image position and the
manually corrected camera position was measured in ArcMap along the reference
ellipsoid of the map projection to avoid a distortion of measured distances through the
map projection.
While there are alternative methods to determine the position of the photo
camera during exposure from image content (Li et al., 2008, Li et al., 2010) these
methods are applicable only to areas of high image density with sufficient overlaps, i.e.,
mostly urban areas, which excludes isolated images. Automated extraction of the
camera position for isolated images from the image content alone requires specific
information including camera inclination angle, focal length, measured image
coordinates for three points, and horizontal coordinates in the control system, e.g. in
UTM coordinates (Wolf and Dewitt, 2000). Due to these restrictions we use the before

described manual correction method for the camera position of Flickr and Panoramio
images.
Another concern regarding the estimation of the camera position might be that
its accuracy depends on the distance between photographed object and the photo
camera. However, most images that captured distal objects also have some foreground
information in the image, which allows an analyst to determine the photographers
position based on the image content typically within a few meters. An example is again
Figure 2 with a nearby road in the foreground providing visual clues for assessing the
camera position.
The previously described GIS based measurement task of error distances was
performed by the two authors of this paper and 21 graduate students enrolled in a
graduate GIS course at University of Florida’s Geomatics program who received partial
course credit for completion of the task. All participating students had previous
experience with ArcGIS. Many of the participants come from an international
background and are thus familiar with locations outside Florida. Before preparing
images for distance measurements for the participants, each student provided us with
two small geographic areas he or she was particularly familiar with, allowing us to
expand the study area to 45 areas in ten different countries around the world. Table 1
lists the analyzed areas in the different regions with the numbers of images retained for
final analysis.

Table 1. Number of Flickr and Panoramio images analyzed for different world regions
Region Country City/Town Flickr Panoramio
Asia
China Beijing 21 18 Qingdao 17 17
Shanghai (North) 16 18 Shanghai (South) 4 18
India Bangalore 17 18 Hyderabad 7 19
Iran Tehran (East) 16 19 Tehran (West) 10 19
Europe
Austria Vienna 22 20 Zell am See 19 17
Germany Bonn 23 25 Cologne 13 20
Italy Florence 15 10 Rome 14 13
Latin America
Dominican Republic
Puerto Plata 7 9 Santiago de los Caballeros
14 18
Guatemala Guatemala City 17 24
Paraguay Asuncion (East) 7 21 Asuncion (West) 16 17
North America
USA
Atlanta, GA 19 25 Austin, TX 21 20 Belfast, ME 6 18 Cocoa Beach, FL 9 11 Coral Springs, FL 15 17 Crystal Coast, NC 7 9 Fort Lauderdale, FL 6 14 Fort Pierce, FL 7 18 Gainesville (East), FL 19 24 Gainesville (West), FL 20 24 Helen, GA 1 9 Jacksonville Beach, FL 12 24 Jacksonville (North), FL 17 24 Jacksonville (South), FL 17 12 Key West, FL 20 24 Miami, FL 20 22 New York, NY 18 17 Orlando, FL 19 16 Palm Bay, FL 17 17 Panama City Beach, FL 12 14 San Diego, CA 22 17 Sarasota (East), FL 19 17 Sarasota (West), FL 12 17 St. Augustine, FL 13 23 Tallahassee, FL 16 21
TOTAL 639 794
For each indicated region, images were downloaded through the APIs from both
data sources (Flickr and Panoramio), from which 25 images were randomly selected and
their geotagged positions prepared as point shapefiles. This resulted in a total of 2300
images to be analyzed. After completion of the task, students returned a list of measured
distances for each image analyzed. Images for which participants could not determine
the corrected camera position were excluded from further analysis.
Before the statistical distance analysis, 82 photos provided through bulk-upload
were removed, since this causes a systematic error in camera positions. Bulk-upload can
be easily identified as images taken by the same photographer with identical geotagged
coordinates. Bulk-upload removal should also be conducted when including shared
geotagged images in geo-applications where the camera position is relevant. Further,
only images located near streets and footpaths, i.e., within a 60 m buffer were analyzed,
since these could be most readily used for routing and navigation related geo-
applications. Finally the authors went through each individual image to check the error
distances measured by the participants. For each image we attempted to verify the
correct camera position based on geotagged image position, aerial image of the
surrounding area, image content, and the analyst's provided error distance. If provided
error distances were small (<100m), and the image content did not match with the
corrected camera position of the participant based on information from aerial images or
Google Street View, we either removed the image from analysis if we could not identify
the photographed object (and therefore the corrected camera position), or we re-
measured the error distance between geotagged position and the corrected camera
position otherwise. For larger reported error distances (>100m) the exact distance was
checked (and re-measured if necessary) if the photographed object and the corrected
camera position could be identified on the aerial image and/or Google Street View,
otherwise the provided distance was used. We applied the 100m threshold because
within this particular small radius the corrected camera position could usually be easily
verified on satellite images or Google Street View (and the associated measurement be
corrected or removed), while for larger error distances the verification of the camera
position was more difficult due to the larger radius around the geotagged position.
Finally 1433 images were retained for further analysis. All participants were advanced

GIS users, familiar with their chosen test area. They were therefore assumed to
complete the camera positioning task at a comparable accuracy.
Figure 3 visualizes the locations of analyzed images that were listed in Table 1,
while Figure 4 provides an example of a more zoomed view to one of the areas, in this
case published positions of Flickr and Panoramio images analyzed for Cologne,
Germany.
Figure 3. Analyzed areas
Figure 4. Visualization of selected published Flickr and Panoramio photo positions in
Cologne, Germany

Accuracy of imagery base layers
The chosen approach of distance measurements is based on the assumption that the
camera position can be accurately determined (within a few meters) from the image
content and marked on an aerial or satellite base map layer in ArcMap. As Haklay
(2010) points out, a basic problem in desk based quality assessment of any spatial
dataset is the selection of the reference dataset. In our case, the reference dataset is the
satellite background map, upon which corrected camera positions are mapped by the
analyst in ArcMap, and which are also used by photographers who upload and manually
drag their images on top of the satellite background map provided with the photo
sharing platforms.
Panoramio, owned by Google, provides a background map to geotag images
based on the Google Maps API. It provides options to switch between map and satellite
view, which many internet users are familiar with (Figure 5). High-resolution Geoeye
satellite images were available for all tested regions, and some areas were supplemented
with Sanborn orthophotography images.
Figure 5. Manual geotagging in Panoramio
Flickr, owned by Yahoo, relies on the Yahoo Maps API which also provides
high resolution Geoeye satellite images for all tested areas. Besides satellite and map
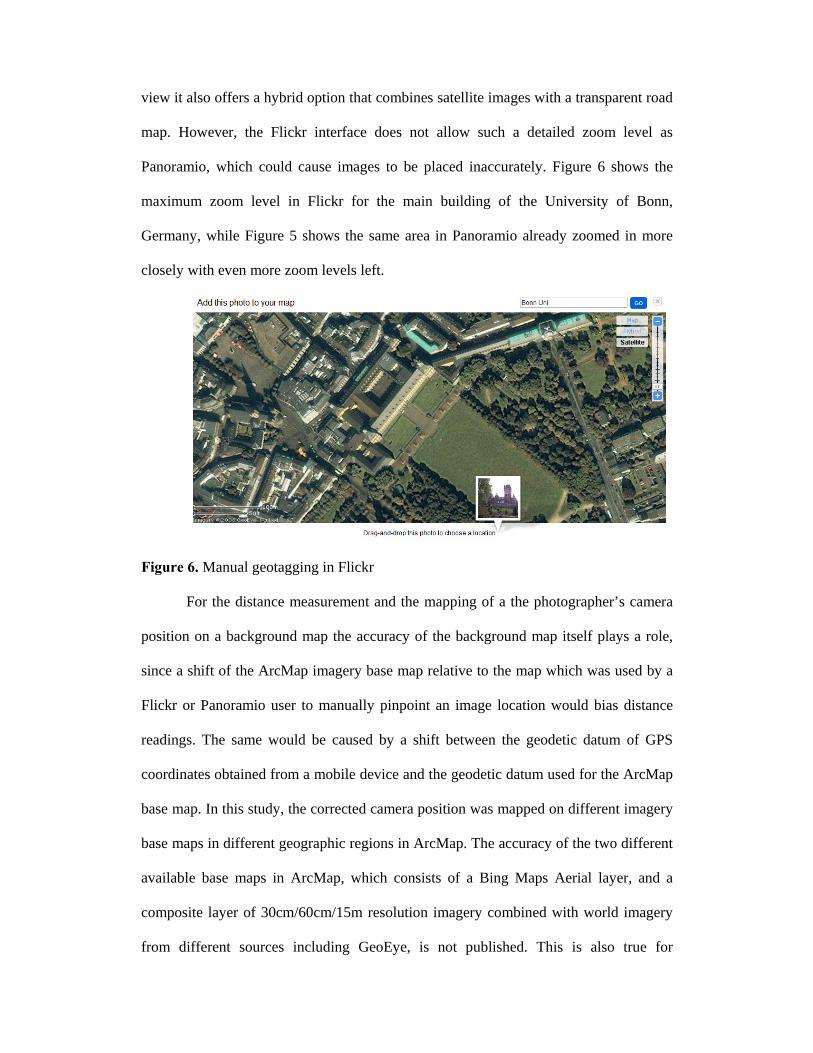
view it also offers a hybrid option that combines satellite images with a transparent road
map. However, the Flickr interface does not allow such a detailed zoom level as
Panoramio, which could cause images to be placed inaccurately. Figure 6 shows the
maximum zoom level in Flickr for the main building of the University of Bonn,
Germany, while Figure 5 shows the same area in Panoramio already zoomed in more
closely with even more zoom levels left.
Figure 6. Manual geotagging in Flickr
For the distance measurement and the mapping of a the photographer’s camera
position on a background map the accuracy of the background map itself plays a role,
since a shift of the ArcMap imagery base map relative to the map which was used by a
Flickr or Panoramio user to manually pinpoint an image location would bias distance
readings. The same would be caused by a shift between the geodetic datum of GPS
coordinates obtained from a mobile device and the geodetic datum used for the ArcMap
base map. In this study, the corrected camera position was mapped on different imagery
base maps in different geographic regions in ArcMap. The accuracy of the two different
available base maps in ArcMap, which consists of a Bing Maps Aerial layer, and a
composite layer of 30cm/60cm/15m resolution imagery combined with world imagery
from different sources including GeoEye, is not published. This is also true for

basemaps used in Flickr and Panoramio. Therefore we quantified the apparent point
shift for selected points with given coordinates between three map service layers, which
are the two ArcMap imagery layers and Google Earth. Since Google Earth, Panoramio,
and Flickr rely on similar satellite imagery sources the shift between ArcGIS base layers
and Google Earth would indicate an inherent systematic positional error in our analysis
caused by a relative shift between background maps used for manual image placement
during upload (Flickr, Panoramio) and analysis (ArcGIS).
For Europe, some of the tested areas (Rome, Florence and Vienna) showed a
shift of seven to ten meters between the Bing Maps Aerials imagery and the World
Imagery in ArcMap while other areas did not show a shift. Similar shifts could be found
between the World Imagery and Google Earth, while Bing Maps did not show any shift
errors in comparison to Google Earth.
A similar magnitude of horizontal shifts could be observed for selected areas in
the US, ranging from zero to eight meters between the World Imagery and Bing Maps
in ArcMap, from three and seven meters between the World Imagery and Google Earth,
and no shift observed between Bing Maps and Google Earth.
Tested areas in Latin America showed a shift of up to five meters between the
two ArcMap data sources, with an exception of the Dominican Republic revealing a
difference of up to 20 meters. Relative to Google Earth the World Imagery layer
revealed errors between five and ten meters, while Bing Maps showed no shift errors in
two of the three tested areas, the only exception being Guatemala with an error of up to
ten meters.
For the Asian continent tests were conducted in three countries. No noticeable
shift was observed between the two ArcGIS base maps and Google Earth for Iran and
India. For China a shift of up to ten meters could be observed between the two ArcMap
sources, and also between Google Earth and the World Imagery base map, while Bing
Maps and Google Earth showed no shift. In summary, most relative shifts were well
within a range of 10 meters.
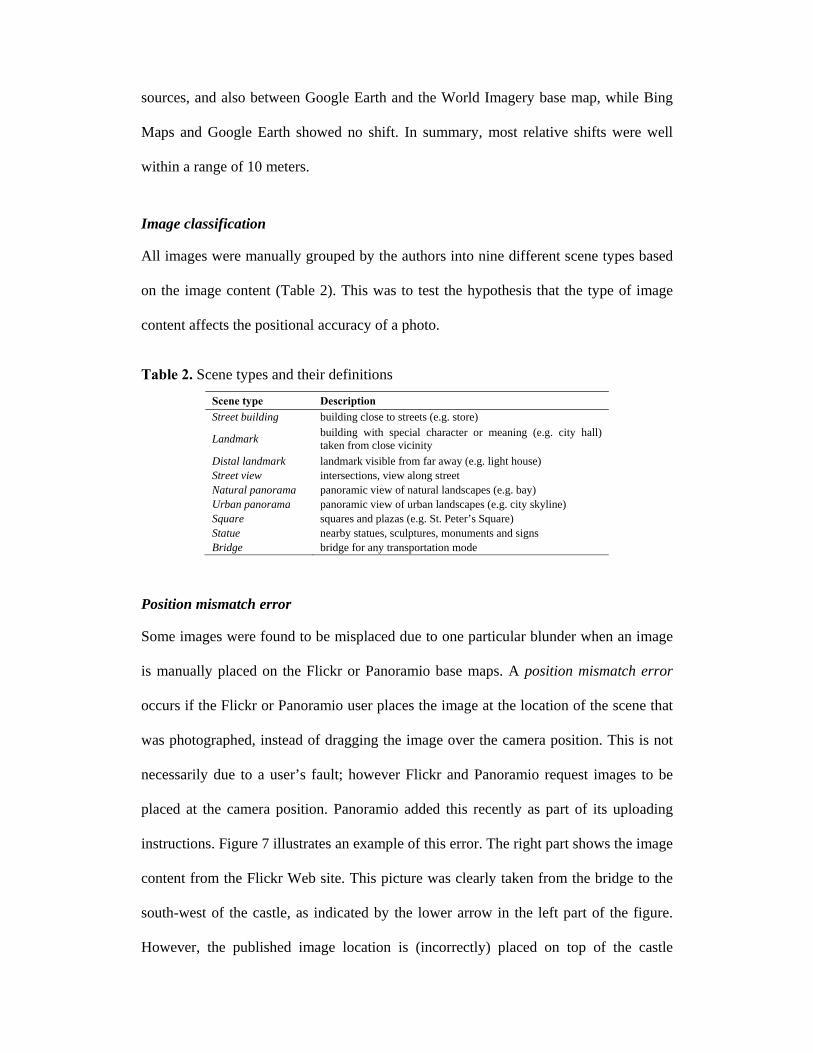
Image classification
All images were manually grouped by the authors into nine different scene types based
on the image content (Table 2). This was to test the hypothesis that the type of image
content affects the positional accuracy of a photo.
Table 2. Scene types and their definitions
Scene type Description
Street building building close to streets (e.g. store)
Landmark building with special character or meaning (e.g. city hall) taken from close vicinity
Distal landmark landmark visible from far away (e.g. light house) Street view intersections, view along street Natural panorama panoramic view of natural landscapes (e.g. bay) Urban panorama panoramic view of urban landscapes (e.g. city skyline) Square squares and plazas (e.g. St. Peter’s Square) Statue nearby statues, sculptures, monuments and signs Bridge bridge for any transportation mode
Position mismatch error
Some images were found to be misplaced due to one particular blunder when an image
is manually placed on the Flickr or Panoramio base maps. A position mismatch error
occurs if the Flickr or Panoramio user places the image at the location of the scene that
was photographed, instead of dragging the image over the camera position. This is not
necessarily due to a user’s fault; however Flickr and Panoramio request images to be
placed at the camera position. Panoramio added this recently as part of its uploading
instructions. Figure 7 illustrates an example of this error. The right part shows the image
content from the Flickr Web site. This picture was clearly taken from the bridge to the
south-west of the castle, as indicated by the lower arrow in the left part of the figure.
However, the published image location is (incorrectly) placed on top of the castle

(upper arrow).
Figure 7. Position mismatch error
4. Analysis of positioning errors
Descriptive statistics
Table 3 provides descriptive characteristics of observed error distances, number of
images (N), and number of individual photographers (P) for Flickr and Panoramio,
separated by world region and scene type. Since measured error distances are not
normally distributed but skewed to the right, median error distances are reported in the
table. The sample size of analyzed images is largest for scene types Street building and
Landmark with one exception for Latin America. The table shows that most images
were taken from different photographers. This means that observed differences in
median distances between scene types, regions, or data sources (in reference to
hypotheses 1-3) would not be caused by the bias of a specific photographer, but by the
corresponding factor under consideration.

Table 3. Descriptive characteristics of error distances (in meters)
Street
building
Landm
ark
Distal
landmark
Street view
Natural
panorama
Urban
panorama
Square
Statue
Bridge
AL
L
Asi
a
Flickr
N / P 20/19 50/42 6/6 9/9 1/1 10/10 2/2 10/9 0/0 108/98 Mdn 175 72 764 0 48996 291.5 1637 115 - 234.5 Min 0 0 7 0 48996 9 416 0 - 0 Max 3832 9700 7082 100 48996 1549 2858 3222 - 48996
Pano-ramio
N / P 47/45 49/47 3/3 11/11 1/1 13/12 0/0 21/18 1/1 146/138 Mdn 23 26 64 35 26 0 - 19 10 24.5 Min 0 0 0 12 26 0 - 0 10 0 Max 1359 743 156 2223 26 314 - 386 10 2223
Eu
rop
e
Flickr
N / P 22/22 28/24 6/6 4/4 13/13 1/1 10/10 17/16 5/5 106/101 Mdn 49 55 25.5 0 250 1491 68 35 315 58.5 Min 0 0 0 0 0 1491 0 0 108 0 Max 1410 2227 4800 252 48000 1491 606 476 2619 48000
Pano-ramio
N / P 27/24 34/33 1/1 9/9 10/10 4/4 9/8 11/11 0/0 105/100 Mdn 0 0 40 0 91.5 0 0 0 - 0 Min 0 0 40 0 0 0 0 0 - 0 Max 430 4870 40 78 2270 0 103 508 - 4870
Lat
in A
mer
ica Flickr
N / P 11/9 24/20 1/1 2/2 6/6 3/2 8/7 6/6 0/0 61/53 Mdn 1531 67.5 2059 7766.5 3100 75 1681 453.5 - 1606 Min 0 0 2059 5792 43 63 10 15 - 0 Max 14861 3619 2059 9741 10422 373 4001 14864 - 14864
Pano-ramio
N / P 35/23 16/14 2/2 19/19 4/4 1/1 4/4 8/8 0/0 89/75 Mdn 17 23.5 16 16 0.5 0 31.5 5 - 16 Min 0 0 0 0 0 0 0 0 - 0 Max 215 135 32 465 81 0 207 41 - 465
Nor
th A
mer
ica Flickr
N / P 112/88 78/72 16/14 22/18 24/23 45/42 7/7 46/42 14/13 364/319 Mdn 31 66.5 94.5 28 64 40 46 33.5 85.5 46 Min 0 0 0 0 0 0 0 0 0 0 Max 20250 2931 21800 225 1853 1328 1987 24595 2474 24595
Pano-ramio
N / P 169/147 68/68 14/14 57/54 26/26 29/29 5/5 62/58 24/22 454/423 Mdn 15 26 13 10 8 37 27 10.5 23 15 Min 0 0 0 0 0 0 4 0 0 0 Max 2650 21000 503 1966 143 41362 87 226 445 41362
P = Number of individual photographers
The table shows a few apparent patterns. Considering all analyzed images from
each world region, median distances associated with Flickr are larger than those for
Panoramio (right most column). This pattern can also be observed when analyzing
differences between Flickr and Panoramio separately for each scene type, with only two
exceptions out of 32 comparisons. The histograms in Figure 8 show the distribution of
error distances for the different world region-data source combinations using a
logarithmic scale on the abscissa, and relative frequencies on the ordinate. In
accordance with results from Table 3, a higher relative frequency at low error distances
can be observed for the Panoramio images compared to Flickr. Further, the histograms

show some noticeable differences in shape between world regions, especially for the
Flickr dataset, e.g., a fatter right tail for Latin America compared to other regions.
Figure 8. Distribution of error distances for Flickr and Panoramio images
Assuming that the assessment of the corrected camera position is possible within
a few meters, it can be seen that this error source is smaller than most reported

measured error distances. One exception are Panoramio images for Europe with a
median error of zero meters, indicating that participants apparently rated a camera
position assessed through image content as correct (0 error distance) even if it was
slightly off the geotagged position.
Effect of scene type – hypothesis (1)
Due to the skewed distribution of the observed error distances the non-parametric
Mann-Whitney test was applied to test for differences in median distance values
between scene types. To increase the sample size, images from all world regions were
included in the tests. However, to avoid potential bias on median distance through
overrepresentation of images from a specific world region for a scene type, the same
numbers of images from a world region were used across compared scene types. Mann-
Whitney tests were conducted for all pairwise scene type comparisons and for each data
provider. Levels of significance for differences in median distances between scene types
in Flickr are provided in Table 4 (not adjusted for multiple comparisons). Parentheses
indicate that the median distance for scene type in the column header is larger than for
the one in the row header, otherwise the reverse is the case.
Table 4. p-values of median distance comparison between different scene types for
Flickr
Street
building L
andmark
Distal
landmark
Street
View
Natural
panorama
Urban
Panoram
a
Square
Statue
Bridge
Street building - .523 (.539) .087+ (.152) (.658) (.531) .870 (.081)+ Landmark - (.150) .209 (.136) (.035)* (.173) (.968) (.070)+ Distal landmark - .007** .520 .812 .445 .186 (.245) Street View - (.140) (.001)** (.116) (.007)** (.015)* Natural panorama - (.261) .881 .212 (.203) Urban Panorama - (.724) .399 .780 Square - .229 (.134) Statue - (.086)+ Bridge -
*p < .05, ** p < .01, + p < .10

Some patterns can be observed. Images of scene type Street view have smaller
median error distances than all other scene types and can therefore be considered most
accurate. For Bridges medians are higher than for all other scene types but for one.
For Panoramio, the same type of analysis gives less pronounced results (not
listed in a table for brevity). Median distances for Street buildings were smaller than for
all other scene types, whereas bridges had higher median distances than six other scene
types. While the number of differences that are significant at a 5% level of significance
is small both for Flickr and Panoramio, this can at least for some scene types be most
likely attributed to the small sample size and the lower power of the test resulting
thereof.
Effect of region – hypothesis (2)
To assess the effect of region on positional photo accuracy, a comparison of median
distances between the four regions was made for each scene type separately since
positioning accuracy could be affected by scene type. Levels of significance for the
pairwise comparison of median distances between the four geographic regions are
provided in Table 5 for Flickr and in Table 6 for Panoramio. Results are only reported
for scene types that show a significant difference in at least one region comparison.
Parentheses indicate that the median distance for the region in the column header is
larger than that for the region in the row header, and p-values in italics indicate a tie in
median error distance.

Table 5. p-values of median distance comparison between different world regions for
Flickr
Street Building Asia Europe Latin America North America Asia - .027* (.133) .002**
Europe - (.003)** (.974) Latin America - .002**
North America - Street View Asia Europe Latin America North America Asia - .825 (.036)* (.103) Europe - (.133) (.283) Latin America - .007**
North America - Natural Panorama Asia Europe Latin America North America Asia - .143 .286 .080+ Europe - (.106) .249 Latin America - .002**
North America - Urban Panorama Asia Europe Latin America North America Asia - (.364) .217 .014*
Europe - .500 .043*
Latin America - .437 North America -Square Asia Europe Latin America North America Asia - .061+ (.889) .222 Europe - (.006)** .962 Latin America - .054+ North America - Statue Asia Europe Latin America North America Asia - .040* (.792) .021*
Europe - (.087)+ (.768)Latin America - .045* North America -
*p < .05, ** p < .01, + p < .10
For the six scene types analyzed in Table 5 images from North America show
most often significantly lower median error distances in pairwise comparison than any
other world region. Europe shows significantly lower median distances than Asia and
Latin America for three scene types, and Street views in Asia show significantly better
accuracy than for Latin America.
With Panoramio images (Table 6), Europe shows for each of the five scene
types presented a significantly smaller median distance than at least one other region.
Further it has significantly shorter distances than all other three regions for scene type
Street building.
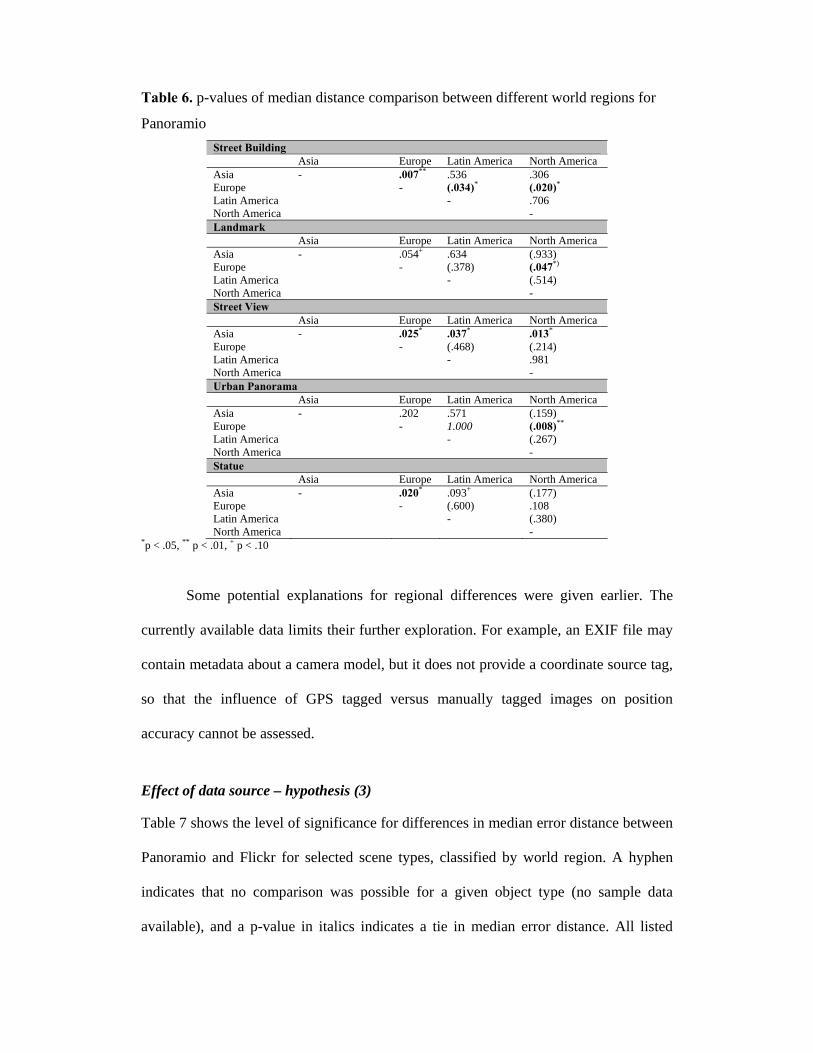
Table 6. p-values of median distance comparison between different world regions for
Panoramio
Street Building Asia Europe Latin America North America Asia - .007** .536 .306 Europe - (.034)* (.020)*
Latin America - .706 North America - Landmark Asia Europe Latin America North America Asia - .054+ .634 (.933) Europe - (.378) (.047*)
Latin America - (.514) North America - Street View Asia Europe Latin America North America Asia - .025* .037* .013*
Europe - (.468) (.214) Latin America - .981 North America - Urban Panorama Asia Europe Latin America North America Asia - .202 .571 (.159) Europe - 1.000 (.008)**
Latin America - (.267) North America -Statue Asia Europe Latin America North America Asia - .020* .093+ (.177) Europe - (.600) .108 Latin America - (.380) North America -
*p < .05, ** p < .01, + p < .10
Some potential explanations for regional differences were given earlier. The
currently available data limits their further exploration. For example, an EXIF file may
contain metadata about a camera model, but it does not provide a coordinate source tag,
so that the influence of GPS tagged versus manually tagged images on position
accuracy cannot be assessed.
Effect of data source – hypothesis (3)
Table 7 shows the level of significance for differences in median error distance between
Panoramio and Flickr for selected scene types, classified by world region. A hyphen
indicates that no comparison was possible for a given object type (no sample data
available), and a p-value in italics indicates a tie in median error distance. All listed

median error distances are larger for Flickr than for Panoramio with the one exception
for scene type Street view in Asia. Reported p-values and the clear pattern of arithmetic
signs for median differences in Table 7, together with descriptive statistics from Table 3
demonstrate that Panoramio images have generally a better positional accuracy than
Flickr images in all tested world regions.
The difference in accuracy between the two data sources could be explained by
the types of images both services host. While Flickr allows users to upload images
without specifying their geographic location, Panoramio requires geotagging
information during the upload process. Panoramio users could also be motivated by the
fact that some Panoramio images are featured in Google Earth. However, to be
considered for Google Earth and to participate in a monthly contest on Panoramio itself,
the images need to be accurately geotagged and of good quality. Thus, Panoramio
seems to attract a community of users that is more spatially aware and interested in
mapping than the Flickr community.
Table 7. p-values of median distance comparison between Panoramio and Flickr for
different scene types
Asia Europe Latin America North America Street building Panoramio Flickr .000** .007** .000** .000** Landmark Panoramio Flickr .000** .028* .062+ .020** Street view Panoramio Flickr (.020)* .825 .010* .114 Natural panorama Panoramio Flickr 1.000 .446 .019 .006** Urban panorama Panoramio Flickr .003** .400 .500 .951 Square Panoramio Flickr ‒ .133 .016** .755 Statue Panoramio Flickr .003** .122 .008** .005** Bridge Panoramio Flickr ‒ ‒ ‒ .082+
*p < .05, ** p < .01, + p < .10
Effect of views and comments – hypothesis (4)
Panoramio allows any registered user to suggest a new position for a misplaced
photograph. Although the API does not provide information about coordinates edits a
photo underwent, the number of photo views and user comments can be read from the
Panoramio Web site. To test for an association between the number of views and
comments and the positional error of an image, we grouped images that belonged to the
same scene type and world region category into two bins, i.e. one containing images
with a number of views below or equal the median number of views (or number of
comments, respectively) in that category, and one with image views or comment above
the median. Next a Mann-Whitney test for two samples was used to test whether the
median of error distances was different between images in the two bins. In the total of
54 tests that included at least one image in each bin (29 tests for views and 25 tests for
comments), only one difference was found to be significant at a 5% level significance,
which is less than the 2.7 expected false positives with this design setup. Thus
hypothesis (4) needs to be rejected.
Position mismatch error
Table 8 lists the number of position mismatch errors (#F) for each data source, world
region, and scene type. The relative error rate (%F) is computed as (#F/N) x 100, where
N is the total number of images analyzed for a given category. The percentage numbers
in the right-most column show that the error rate is approximately balanced between
Flickr and Panoramio data sources and also between world regions while relative
frequencies vary across scene types.

Table 8. Position mismatch errors found in Flickr and Panoramio
Street
bu
ildin
g
Lan
dm
ark
Distal
land
mark
Street V
iew
Natu
ral p
anoram
a
Urb
an
Pan
orama
Squ
are
Statue
Brid
ge Total
Flickr
N 20 50 6 9 1 10 2 10 0 108
Asi
a # F 3 8 0 0 0 1 0 1 0 13 % F 15 16 0 0 0 10 0 10 0 12%
Panoramio N 47 49 3 11 1 13 0 21 1 146 # F 10 8 1 0 0 1 0 3 0 23 % F 22 16 33 0 0 8 0 14 0 16%
Flickr N 22 28 6 4 13 1 10 17 5 106
Eu
rop
e
# F 3 4 0 0 0 0 3 8 1 19 % F 14 14 0 0 0 0 30 47 29 18%
Panoramio N 27 34 1 9 10 4 9 11 0 105 # F 1 4 0 0 0 0 1 3 0 9 % F 4 12 0 0 0 0 11 27 0 9%
Flickr N 11 24 1 2 6 3 8 6 0 61
Lat
in
Am
eric
a
# F 2 2 0 0 1 0 1 1 0 7 % F 18 8 0 0 17 0 13 17 0 11%
Panoramio
N 35 16 2 19 4 1 4 8 0 89 # F 5 3 0 0 2 0 0 1 0 11
% F 14 19 0 0 50 0 0 13 0 12%
Flickr N 113 78 16 22 24 45 7 46 14 365
Nor
th
Am
eric
a
# F 30 7 2 3 1 3 1 4 1 52 % F 27 9 13 14 4 7 14 9 7 14%
Panoramio
N 169 68 14 57 26 29 5 62 24 454 # F 26 7 1 2 0 0 1 3 4 44
% F 15 10 7 4 0 0 20 5 17 10%
A series of Fisher’s exact tests was conducted on 2x2 contingency tables to
identify a potential association of relative error rates with scene type after controlling
for world region and data source. Results in Table 9 (Flickr) and Table 10 (Panoramio)
show world regions where differences in relative error rates were significant.
Parentheses in the table are used as before. If no position mismatch error was observed
in any of the two compared scene types, the p-value (1.000) is printed in italic.
Flickr images in Europe that depict statues had higher mismatch error rates than
the other scene types (Table 9). Thus Flickr users locate their images of statues more
often over the position of the photographed object than for other scene types. In North
America a similar effect was observed for scene type Street building both for Flickr
(Table 9) and Panoramio (Table 10). Further, scene type Bridge showed for Panoramio
data in North America a higher error rate than most other categories (Table 10). Except

for bridges the higher position mismatch error rates did not seem to result in a higher
positional error for scene types Street building and Statue. A possible explanation is that
the distance error caused by a position mismatch error for street buildings and statues is
small, since these objects are being photographed from nearby locations, as opposed to
bridges which extend over larger areas.
Table 9. p-values for Fisher’s exact test analyzing position mismatch errors for Flickr
Street
building L
andmark
Distal
landmark
Street V
iew
Natural
panorama
Urban
Panoram
a
Square
Statue
Bridge
Eu
rop
e
Street building - (1.000) 1.000 1.000 .279 1.000 (.346) (.033)* (1.000) Landmark - 1.000 1.000 1.000 1.000 (.351) (.034) * (1.000)Distal Landmark - 1.000 1.000 1.000 (.250) (.058) + (1.000) Street View - 1.000 1.000 (.506) (.131) (1.000) Natural Panorama - 1.000 (.068) + (.004)** (.278) Urban Panorama - (1.000) (1.000) (1.000) Square - (.448) 1.000 Statue - (.360) Bridge -
S
treet building L
andmark
Distal
landmark
Street V
iew
Natural
panorama
Urban
Panoram
a
Square
Statue
Bridge
Nor
th A
mer
ica
Street Building - .003** .355 .280 .016* .005** .676 .018* .1851 Landmark - (.647) (.687) .677 .745 (.513) 1.000 1.000 Distal Landmark - (1.000) .553 .599 (1.000) .643 1.000 Street View - .336 .386 (1.000) .673 1.000 Natural Panorama - (1.000) (.407) (.654) (1.000) Urban Panorama - (.450) (1.000) (1.000) Square - .522 1.000 Statue - 1.000 Bridge -
* p < .05, ** p < .01, + p < .10
Table 10. p-values for Fisher’s exact test analyzing position mismatch errors for
Panoramio
Street
building L
andmark
Distal
landmark
Street V
iew
Natural
panorama
Urban
Panoram
a
Square
Statue
Bridge
Nor
th A
mer
ica
Street Building - .227 .697 .019* .029* .017* (.574) .042* (1.000) Landmark - 1.000 .179 .184 .992 (.450) .330 (.469) Distal Landmark - .488 .350 .326 (.468) .565 (.633)Street View - 1.000 .548 (.226) (1.000) (.060)+ Natural Panorama - 1.000 (.161) (.552) (.046)*
Urban Panorama - (.147) (.549) (.036)*
Square - .272 1.000 Statue - (.091) Bridge -
* p < .05, ** p < .01, + p < .10

5. Discussion and outlook
This study examined the 2D positional accuracy of Flickr and Panoramio images for
various scene types in four different world regions. The most noticeable effect on
accuracy could be attributed to data source, where Panoramio images were found to be
more accurate for most scene types, possibly because of a more geospatially aware user
community in the case of Panoramio. The identified positional accuracy of Flickr with
median error ranges between 46 meters (North America) and 1606 meters (Latin-
America), support findings from Hollenstein and Purves (2010) that the precision and
accuracy of user generated data are high enough to describe city neighborhoods. As
opposed to this, the positional accuracy of Panoramio, with medians ranging between 0
and 24.5 meters for Europe and Asia, respectively, is of the same magnitude as the
width of roads, so that the photographed scene will closely describe the true scenery
observed at a position with the published photo coordinates in the physical world.
Further, pairwise comparison of positional accuracies between world regions,
controlled for scene type and data source, showed some influence of geographic
location on position accuracy. A possible reason for these differences could be a
varying percentage of images that were taken with GPS equipped units in the different
regions, which cannot be definitely answered since metadata do not show the source
positioning (GPS vs. manual positioning). It could also be caused by a higher
percentage of tourists in certain regions compared to residents, and in particular tourists’
unfamiliarity with street naming conventions when they drag an image on top of a
background map during the upload process.
Some effects of scene type on positioning accuracy were observed both for
Flickr and Panoramio, where street related features (buildings, street view) were found

to be more accurately mapped than other features, with bridges having lowest
accuracies.
Results presented in this paper are based on a moderate sample of images.
Therefore the results might not be representative for all areas where Flickr and
Panoramio images are available. Nevertheless the study gives insight into the magnitude
of the spatial accuracy of these VGI point data sources. For future work, techniques of
automated camera positioning from image content (Li et al., 2008, Li et al., 2010) could
be applied in high photo-density areas, for example, around prominent landmarks, to
expand the geographic range for analyzing image positioning accuracies. Further, one
could assess how photo density in a given area is associated with positional accuracy. It
is possible that existing photos in a place might affect how subsequent users manually
place another photo at the same location on a digital background map.
References
Andrienko, G., Andrienko, N., Bak, P., Kisilevich, S. & Keim, D. (2009) Analysis of community-contributed space-and time-referenced data (example of Panoramio photos). Proceedings of the 17th ACM SIGSPATIAL International Conference on Advances in Geographic Information Systems, Seattle, Washington: ACM, pp. 540-541.
Arrington, M. (2006) Flickr Geo Tagging Now Live [online]. Available from: http://techcrunch.com/2006/08/28/flickr-to-launch-geo-tagging-today/ [Accessed 12 November 2012].
Chen, L. and Roy, A. (2009) Event detection from Flickr data through wavelet-based spatial analysis. Proceedings of the 18th ACM conference on information and knowledge management. Hong Kong, China, ACM, pp. 523-532.
Chung, E. and Yoon, J. (2009) Categorical and specificity differences between user-supplied tags and search query terms for images: an analysis of Flickr tags and Web image search queries. Information Research, vol. 14, no. 3, paper 408.
Crandall, D., Backstrom, L., Huttenlocher, D. and Kleinberg, J. (2009). Mapping the world’s photos. International World Wide Web Conference 2009, Madrid, Spain: ACM, pp. 761-770.
Flickr (2009) code.flickr [online]. Available from: http://code.flickr.com/blog/2009/02/04/100000000-geotagged-photos-plus/ [Accessed 12 November 2012]
Friedland, G., Choi, J., Lei, H. and Janin, A. (2011). Multimodal location estimation on Flickr videos, Proceedings of the 3rd ACM SIGMM international workshop on social media, New York, NY, ACM, pp. 23-38.

Girardin, F., Blat, J., Calabrese, F., Fiore, F.D. and Ratti, C. (2008) Digital Footprinting: Uncovering tourists with user-generated content. Pervasive Computing, vol. 7, pp. 36-43.
Goodchild, M.F. (2007) Citizens as voluntary sensors: Spatial data infrastructure in the world of Web 2.0 (Editorial). International Journal of Spatial Data Infrastructures Research (IJSDIR), vol. 2, pp. 24-32.
Haklay, M. (2010). How good is volunteered geographical information? A comparative study of OpenStreetMap and Ordnance Survey datasets, Environment and Planning B, Planning and Design, vol. 37, pp. 682-703.
Hays, J. and Efros, A.A. (2008) im2gps: estimating geographic information from a single image. Proceedings of IEEE Conference on Computer Vision and Pattern Recognition.
Hochmair, H.H. (2010) Spatial association of geotagged photos with scenic locations. In: A. Car, G. Griesebner and J. Strobl (eds.) Proceedings of the Geoinformatics Forum Salzburg. Heidelberg: Wichmann, pp. 91-100.
Hochmair, H.H. and Zielstra, D. (2012) Positional accuracy of Flickr and Panoramio images in Europe. In: A. Car, G. Griesebner and J. Strobl (eds.) Proceedings of the Geoinformatics Forum Salzburg, Heidelberg: Wichmann, pp. 14-23.
Hollenstein, L. and Purves, R.S. (2010) Exploring place through user-generated content: Using Flickr to describe city cores. Journal of Spatial Information Science, vol. 1, pp. 21-48.
International Organization for Standardization (2009) Standards Guide: ISO/TC 211 Geographic Information/Geomatics [online]. Available from: http://www.isotc211.org/Outreach/ISO_TC_211_Standards_Guide.pdf [Accessed 12 November 2012].
Jacobs, N., Satkin, S., Roman, N., Speyer, R. and Pless, R. (2007) Geolocating static cameras. 11th IEEE international conference on computer vision.
Kremerskothen, K. (2011) flickr Blog - 6,000,000,000 [online]. Available from: http://blog.flickr.net/en/2011/08/04/6000000000/ [Accessed 12 November 2012].
Larson, M., Soleymani, M., Serdyukov, P., Rudinac, S., Wartena, C., Murdock, V., Friedland, G., Ordelman, R. and Jones, G.J.F. (2011) Automatic tagging and geotagging in video collections and communities, Proceedings of the 1st ACM International Conference on Multimedia Retrieval, Trento, Italy, ACM.
Li, X., Wu, C., Zach, C., Lazebnik, S. and Frahm, J.-M. (2008) Modeling and recognition of landmark image collections using iconic scene graphs. In Forsyth, D., Torr, P. and Zisserman, A. (eds.) ECCV 2008, Part I, Berlin: Springer, pp. 427-440.
Li, Y., Crandall, D.J. and Huttenlocher, D.P. (2009) Landmark classification in large-scale image collections. In: IEEE 12th International Conference on Computer Vision, Kyoto, Japan, pp. 1957-1964.
Li, Y., Snavely, N. and Huttenlocher, D.P. (2010). Location recognition using prioritized feature matching. In: K. Daniilidis, P. Maragos and N. Paragios (eds.) Computer Vision – ECCV 2010. Berlin: Springer, pp.791-804.
Lu, X., Wang, C., Yang, J.-M., Pang, Y. and Zhang, L., (2010) Photo2Trip: Generating travel routes from geo-tagged photos for trip planning. MM'10. Firenze, Italy.
Schlieder, C. and Matyas, C. (2009) Photographing a city: An analysis of place concepts based on spatial choices. Spatial Cognition and Computation, vol. 9, pp. 212-228.

Serdyukov, P., Murdock, V. and Van Zwol, R. (2009) Placing Flickr photos on a map. Proceedings of the 32nd international ACM SIGIR conference on research and development in information retrieval. Boston, MA, USA, pp. 484-491.
Simon, I., Snavely, N. and Seitz, S.M. (2007) Scene summarization for online image collections. IEEE international Conference on Computer Vision.
Snavely, N., Seitz, S.M. and Szeliski, R. (2006) Photo tourism: Exploring photo collections in 3D. SIGGRAPH, vol. 25, no. 3, pp. 835 - 846.
Stark, H. (2011) Quality assessment of volunteered geographic information using open Web map services within OpenAddresses. In: A. Car, G. Griesebner and J. Strobl (eds.) Proceedings of the Geoinformatics Forum Salzburg, Heidelberg: Wichmann, pp. 101-110.
Taylor, F. (2008) Google Earth Blog [online] Available from: http://www.gearthblog.com/blog/archives/2008/01/panoramio_layer_adds_2_million_phot.html [Accessed 12 November 2012].
Wolf, P. and Dewitt, B. (2000) Elements of Photogrammetry with Applications in GIS, 3rd ed. Boston, MA: McGrawHill.
Zhang, W. and Kosecka, J. (2006) Image based localization in urban environments. International Symposium on 3D Data Processing, Visualization and Transmission. Chapel Hill, North Carolina.