portfolio management investment criteria
TRANSCRIPT

MCOM 2A PORTFOLIO MANAGEMENT
INVESTMENT ANALYSIS & MARKET INDICATORS 1
Project of Portfolio Management
Presented to Prof. Muzammil
MCOM 2A PORTFOLIO MANAGEMENT
INVESTMENT ANALYSIS & MARKET INDICATORS 2
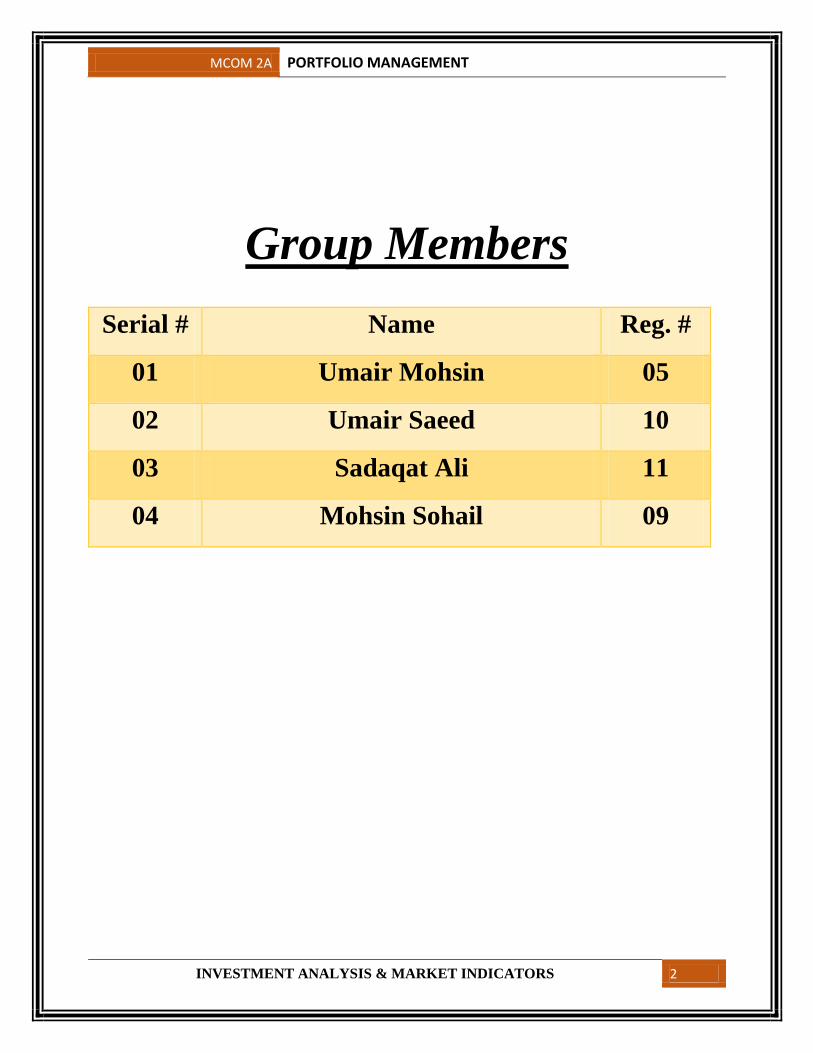
Group Members
Serial # Name Reg. #
01 Umair Mohsin 05
02 Umair Saeed 10
03 Sadaqat Ali 11
04 Mohsin Sohail 09

MCOM 2A PORTFOLIO MANAGEMENT
INVESTMENT ANALYSIS & MARKET INDICATORS 3
Acknowledgement
First of all we would like to thank the Almighty Allah for giving us the
strength and the aptitude to complete this Project within due time. We
are deeply indebted to our course teacher Prof. Muzammil for assigning
us such an interesting topic named “Trading after carrying out
Fundamental and Technical Analysis of U.S Stock”. We also express
the depth of our appreciation to our honorable course teacher for his
suggestions and guidelines, which helped us in completing this project.

MCOM 2A PORTFOLIO MANAGEMENT
INVESTMENT ANALYSIS & MARKET INDICATORS 4
Executive Summary To understand the working of Stock Exchange is a very difficult job but
this project helped us a lot to analyze and understand the conditions
prevailing in Stock Exchange. Trading in U.S. securities by making
dummy account was very informational and interesting activity which
provide us a sound ground and platform as well to deal in stock.
As a student of commerce it is very important for us to understand the
stock market indicators and this project helped us a lot in this regard.
Overall this activity was related to our subject “Portfolio Management”.
We deal in the stocks of renowned U.S. companies such as Microsoft for
our project so, it will also help us in the scenario related to Pakistan.

MCOM 2A PORTFOLIO MANAGEMENT
INVESTMENT ANALYSIS & MARKET INDICATORS 5
TABLE OF CONTENTS
12-Month Price Target Range .............................................................. 15
Consensus Recommendation ............................................................. 16
Momentum ............................................................................................ 16
Detailed Estimates ................................................................................ 17
PEG Ratio ............................................................................................. 17
Price/Earnings(2015) .......................................................................... 18
Earnings per Share Summary ........................................................... 18
Price / Earnings Ratio ........................................................................ 19
12-Month Price Target Range .............................................................. 19
Consensus Recommendation ................................................................ 20
Momentum ............................................................................................ 20
Earnings Growth (2015) ....................................................................... 21
Earnings per Share Summary ............................................................... 21
Price / Earnings Ratio ........................................................................... 22
12-Month Price Target Range .............................................................. 23
Consensus Recommendation ............................................................. 23
Momentum ............................................................................................ 24
Earnings Growth (2015) ....................................................................... 24
Price/Earnings(2015) .......................................................................... 25
Price / Earnings Ratio ........................................................................... 25
Earnings Per Share Summary ............................................................... 26
12-Month Price Target Range .............................................................. 27
Consensus Recommendation ................................................................ 27
Momentum ............................................................................................ 28
MCOM 2A PORTFOLIO MANAGEMENT
INVESTMENT ANALYSIS & MARKET INDICATORS 6
Earnings per Share Summary ........................................................... 28
Earnings Growth (2015) ....................................................................... 29
Price / Earnings Ratio ........................................................................... 29
12-Month Price Target Range .............................................................. 30
Consensus Recommendation ............................................................. 30
Momentum ............................................................................................ 31
Earnings per Share Summary ............................................................... 31
Price / Earnings Ratio ........................................................................... 32
Political ................................................................................................. 40
Economic .............................................................................................. 40
Social .................................................................................................... 40
Technological ....................................................................................... 41
Strengths .............................................................................................. 43
Weaknesses .......................................................................................... 43
Opportunities ...................................................................................... 44
Threats ................................................................................................. 44

MCOM 2A PORTFOLIO MANAGEMENT
INVESTMENT ANALYSIS & MARKET INDICATORS 7
We bought 2000 shares of Intel Corporation
We buy those shares for the following reasons:
Intel Corporation has strong buy history after reading the facts
Intel has also won the backing of successful small Filipino
smartphone vendors e.g. Cherry mobile, Star mobile
Both things are enough reasons to buy the shares of Intel Corporation.
We sold the shares of Intel Corporation for the following reasons:
Samsung is a big threat to Intel
http://app.quotemedia.com/quotetools/newsStoryPopup.go?storyId=736
97128&topic=INTC&symbology=null&cp=null&webmasterId=102117
Intel’s Cherry Trail disappoints with the performance it has a bad
effect on stock holders.
http://app.quotemedia.com/quotetools/newsStoryPopup.go?storyId=737
65073&topic=INTC&symbology=null&cp=null&webmasterId=102117
MCOM 2A PORTFOLIO MANAGEMENT
INVESTMENT ANALYSIS & MARKET INDICATORS 8
We bought 2000 shares of Microsoft for virtual trading.
There are following reasons to buy those shares:
Microsoft has strong buy and shares hold history during the last 3
months which is very good sign for buyers.
The main reason is that Microsoft stock price is currently down at
-0.47 and its peer Micro strategy’s stock price is currently going
downward at -0.65.
Its dividend rate is 1.24 and yield is 2.8278 which is good as
compared to others.
We sold 500 shares of MSFT for the following reasons:
Google is winning the war to power smart connected devices and
the battle is not even close. In 2014, Google's Android OS ran 49%
of the world's connected devices and that ratio is expected to grow
to 59% this year and 63% in 2016. Once dominant Windows is
holding onto a 14-15% share based on its enormous strength in
enterprise, and iOS is holding ground at 11-12%.

MCOM 2A PORTFOLIO MANAGEMENT
INVESTMENT ANALYSIS & MARKET INDICATORS 9
http://app.quotemedia.com/quotetools/newsStoryPopup.go?storyId
=73799703&topic=MSFT&symbology=null&cp=null&webmaster
Id=102117
We bought 2000 shares of Yahoo Corporation for virtual trading
activity.
There are following reasons to buy those shares:
Yahoo launches new mobile applications and analytics tool which
give a good edge to company and its stockholders.
Yahoo announces new mobile developer suite at first yahoo mobile
developer conference which is a new and good news for the
company stockholders.

MCOM 2A PORTFOLIO MANAGEMENT
INVESTMENT ANALYSIS & MARKET INDICATORS 10
Its earning per share ratio is 7.45
Company has strong stock hold position after reading its history
analysis.
We also sold 1000 shares because of the following reasons:
Yahoo’s free cash flow and revenue has actually decreased 28%
and 23% on a trailing 12-month comparison, respectively, during
that span.
http://app.quotemedia.com/quotetools/newsStoryPopup.go?storyId=736
34954&topic=YHOO&symbology=null&cp=null&webmasterId=10211
7
We bought 1000 shares of American Airlines.
There are following reasons to buy those shares:
There is strong buy trend in the history of the above mentioned
company.

MCOM 2A PORTFOLIO MANAGEMENT
INVESTMENT ANALYSIS & MARKET INDICATORS 11
The most important news we read about American airlines is that
American Airlines just managed to scrap its fuel hedging scheme
just in time to take advantage of the collapse in crude oil prices and
has thus benefited from lower jet fuel prices its shareholders for
the following:
An attractive valuation
Strong price momentum
Profitability and growth
Its earning per share ratio is 3.93
http://app.quotemedia.com/quotetools/newsStoryPopup.go?storyId=737
65337&topic=AAL&symbology=null&cp=null&webmasterId=102117
We bought 100 shares of Toronto Dominion Bank.
There are following reasons to buy those shares:
In the news there was information that TD bank meets expectations
of its shareholders this was the news on which we decided to invest
in Toronto Dominion Bank.

MCOM 2A PORTFOLIO MANAGEMENT
INVESTMENT ANALYSIS & MARKET INDICATORS 12
It was also boosting its dividend so this is also a strong reason for
us to buy its shares.
Currently in the graph there was a decreasing trend but after
sometime there were strong chances for its increase.
Its earning per share ratio is 3.75
Its yield is 3.7172 which is good signs for stockholders.
Revenue of C$7.61B (+0.7% Y/Y) beats by C$480M.
http://app.quotemedia.com/quotetools/newsStoryPopup.go?storyId=737
51172&topic=TD&symbology=null&cp=null&webmasterId=102117
We bought 250 shares of Coca Cola Corporation.
There are following reasons to buy those shares.
We want to invest in beverages industry and in this industry coke
is a big fish.

MCOM 2A PORTFOLIO MANAGEMENT
INVESTMENT ANALYSIS & MARKET INDICATORS 13
Coca cola increases its dividend it is like “Clock Work”.
After reading the more closely information quarterly dividend was
boosted to 0.33$/share from 0.305$/share or an 8.2% year over
year increase.
After reading history coca cola has strong stock hold historical
trend over the last 3 months.
We bought 500 shares of Bank of America.
There are following reasons for buying:
The bank's shares have traded with high sensitivity to the rate
outlook, and the Fed continues to work toward increasing rates.
The 5-day chart shown above here reflects that, with BAC shares
climbing approximately 1.4%, just after Tuesday's release of
Chairwoman Yellen's prepared statements. BAC closed up 1.1%
on the day. It's my view that as we approach the first Fed rate hike,
BAC shares will creep toward $18, where they made their home
before last quarter earnings
MCOM 2A PORTFOLIO MANAGEMENT
INVESTMENT ANALYSIS & MARKET INDICATORS 14
http://app.quotemedia.com/quotetools/newsStoryPopup.go?storyId
=73767266&topic=BAC&symbology=null&cp=null&webmasterI
d=102117
We also sold 250 shares of Bank of America for the following reason:
Nervousness grows ahead of the stress test and CCAR results, with
UBS downgrading Bank of America (BAC -2%) to Neutral from
Buy, saying disclosures in the just-released 10-K increase the risk
of a qualified failure in the CCAR http://app.quotemedia.com/quotetools/newsStoryPopup.go?storyId
=73795881&topic=BAC&symbology=null&cp=null&webmasterI
d=102117
MCOM 2A PORTFOLIO MANAGEMENT
INVESTMENT ANALYSIS & MARKET INDICATORS 15
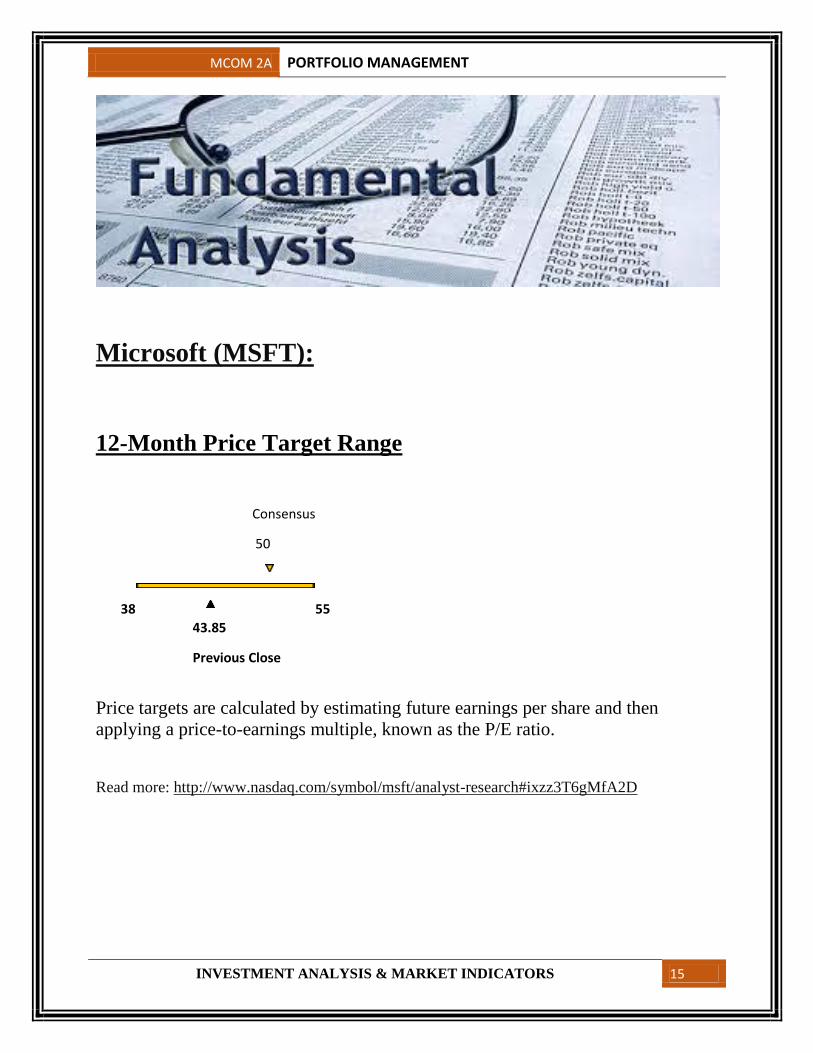
Microsoft (MSFT):
12-Month Price Target Range
Consensus
50
38
43.85
Previous Close
55
Price targets are calculated by estimating future earnings per share and then
applying a price-to-earnings multiple, known as the P/E ratio.
Read more: http://www.nasdaq.com/symbol/msft/analyst-research#ixzz3T6gMfA2D
MCOM 2A PORTFOLIO MANAGEMENT
INVESTMENT ANALYSIS & MARKET INDICATORS 16
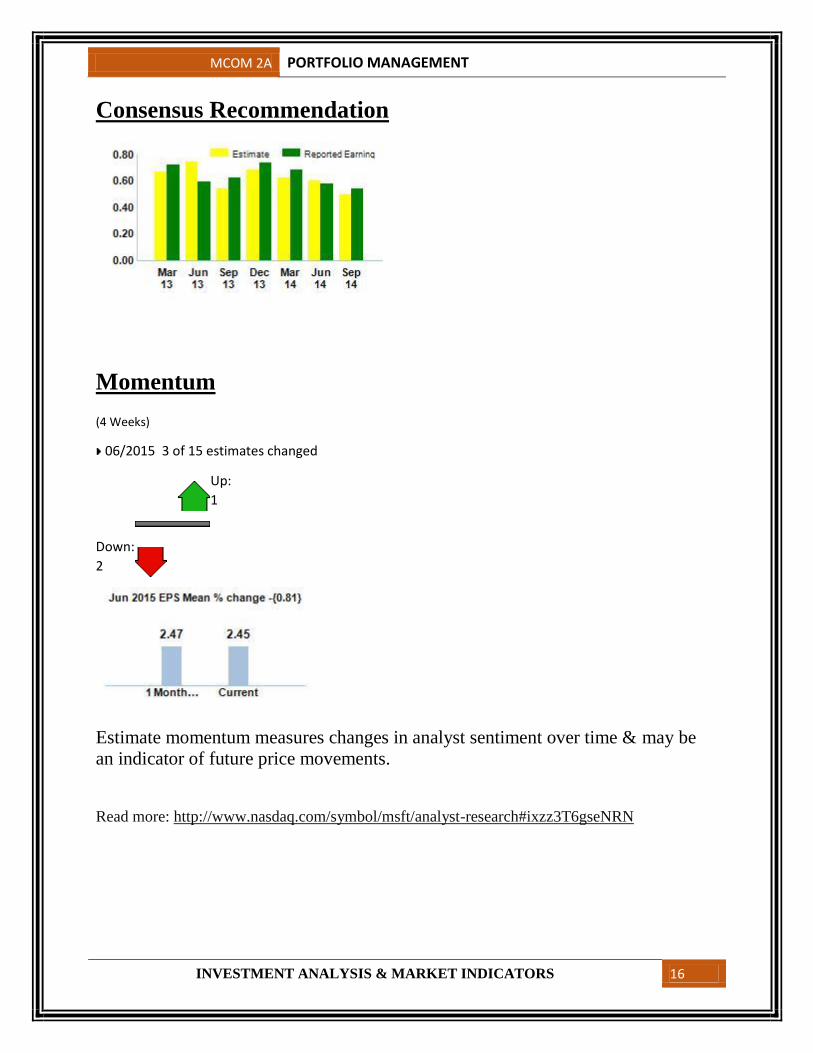
Consensus Recommendation
Momentum
(4 Weeks)
06/2015 3 of 15 estimates changed
Up:
1
Down:
2
Estimate momentum measures changes in analyst sentiment over time & may be
an indicator of future price movements.
Read more: http://www.nasdaq.com/symbol/msft/analyst-research#ixzz3T6gseNRN

MCOM 2A PORTFOLIO MANAGEMENT
INVESTMENT ANALYSIS & MARKET INDICATORS 17
Detailed Estimates
PEG Ratio
PEG ratio is the Price Earnings ratio divided by the growth rate. In this case we use
the forecasted earnings over the next 12 months & the long term forecasted growth
rate (based on the consensus of professional analysts).
Read more: http://www.nasdaq.com/symbol/msft/analyst-research#ixzz3T6i0KQPE

MCOM 2A PORTFOLIO MANAGEMENT
INVESTMENT ANALYSIS & MARKET INDICATORS 18
Price/Earnings(2015)
Price/Earnings ratio is a widely used stock evaluation measure.
http://www.nasdaq.com/symbol/msft/analyst-research#ixzz3T6iM27JR
Earnings per Share Summary
MCOM 2A PORTFOLIO MANAGEMENT
INVESTMENT ANALYSIS & MARKET INDICATORS 19
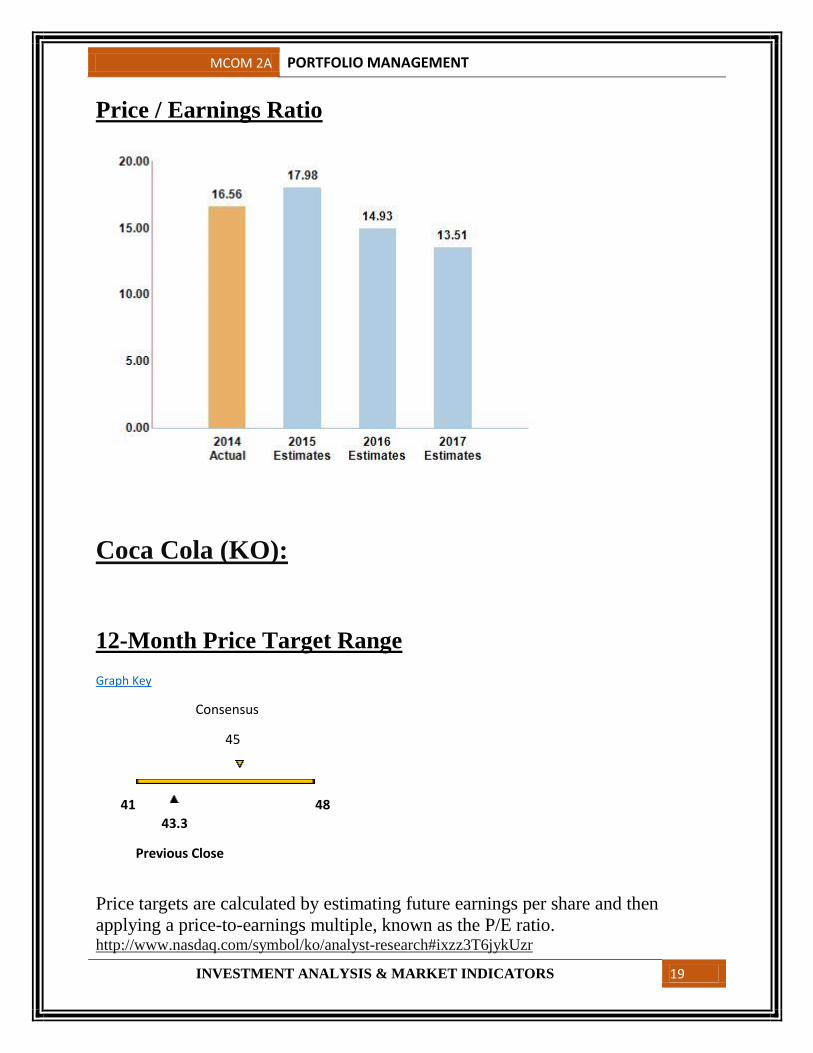
Price / Earnings Ratio
Coca Cola (KO):
12-Month Price Target Range
Graph Key
Consensus
45
41
43.3
Previous Close
48
Price targets are calculated by estimating future earnings per share and then
applying a price-to-earnings multiple, known as the P/E ratio. http://www.nasdaq.com/symbol/ko/analyst-research#ixzz3T6jykUzr

MCOM 2A PORTFOLIO MANAGEMENT
INVESTMENT ANALYSIS & MARKET INDICATORS 20
Consensus Recommendation
Momentum
(4 Weeks)
12/2015 10 of 13 estimates changed
Up:
1
Down:
9
Estimate momentum measures changes in analyst sentiment over time & may be
an indicator of future price movements. http://www.nasdaq.com/symbol/ko/analyst-
research#ixzz3T6kcqoM4

MCOM 2A PORTFOLIO MANAGEMENT
INVESTMENT ANALYSIS & MARKET INDICATORS 21
Earnings Growth (2015)
Earnings Growth is the measure of year on year earnings per share (EPS) growth
from the prior fiscal year, expressed as a percentage.
http://www.nasdaq.com/symbol/ko/analyst-research#ixzz3T6ktTBGu
Earnings per Share Summary

MCOM 2A PORTFOLIO MANAGEMENT
INVESTMENT ANALYSIS & MARKET INDICATORS 22
Price / Earnings Ratio
Price/Earnings Ratio is a widely used stock evaluation measure. For a security, the
Price/Earnings Ratio is given by dividing the Last Sale Price by the Average EPS
(Earnings Per Share) Estimate for the specified fiscal time period.
: http://www.nasdaq.com/symbol/ko/pe-ratio#ixzz3T6lg7CGf

MCOM 2A PORTFOLIO MANAGEMENT
INVESTMENT ANALYSIS & MARKET INDICATORS 23
American Airlines (AAL):
12-Month Price Target Range
56
Consensus
66.5
84.5
47.9
Previous Close
Price targets are calculated by estimating future earnings per share and then
applying a price-to-earnings multiple, known as the P/E ratio.
http://www.nasdaq.com/symbol/aal/analyst-research#ixzz3T6mQOVUb
Consensus Recommendation

MCOM 2A PORTFOLIO MANAGEMENT
INVESTMENT ANALYSIS & MARKET INDICATORS 24
Momentum
(4 Weeks)
12/2015 5 of 8 estimates changed
Up:
2
Down:
3
Estimate momentum measures changes in analyst sentiment over time & may be
an indicator of future price movements. : http://www.nasdaq.com/symbol/aal/analyst-
research#ixzz3T6moJ1Lv
Earnings Growth (2015)
Earnings Growth is the measure of year on year earnings per share (EPS) growth
from the prior fiscal year, expressed as a percentage.
http://www.nasdaq.com/symbol/aal/analyst-research#ixzz3T6nD3yRf

MCOM 2A PORTFOLIO MANAGEMENT
INVESTMENT ANALYSIS & MARKET INDICATORS 25
Price/Earnings(2015)
Price/Earnings ratio is a widely used stock evaluation measure.
http://www.nasdaq.com/symbol/aal/analyst-research#ixzz3T6o5bgji
Price / Earnings Ratio
Price/Earnings Ratio is a widely used stock evaluation measure. For a security, the
Price/Earnings Ratio is given by dividing the Last Sale Price by the Average EPS
(Earnings Per Share) Estimate for the specified fiscal time period.
http://www.nasdaq.com/symbol/aal/pe-ratio#ixzz3T6oLVOZG
MCOM 2A PORTFOLIO MANAGEMENT
INVESTMENT ANALYSIS & MARKET INDICATORS 26
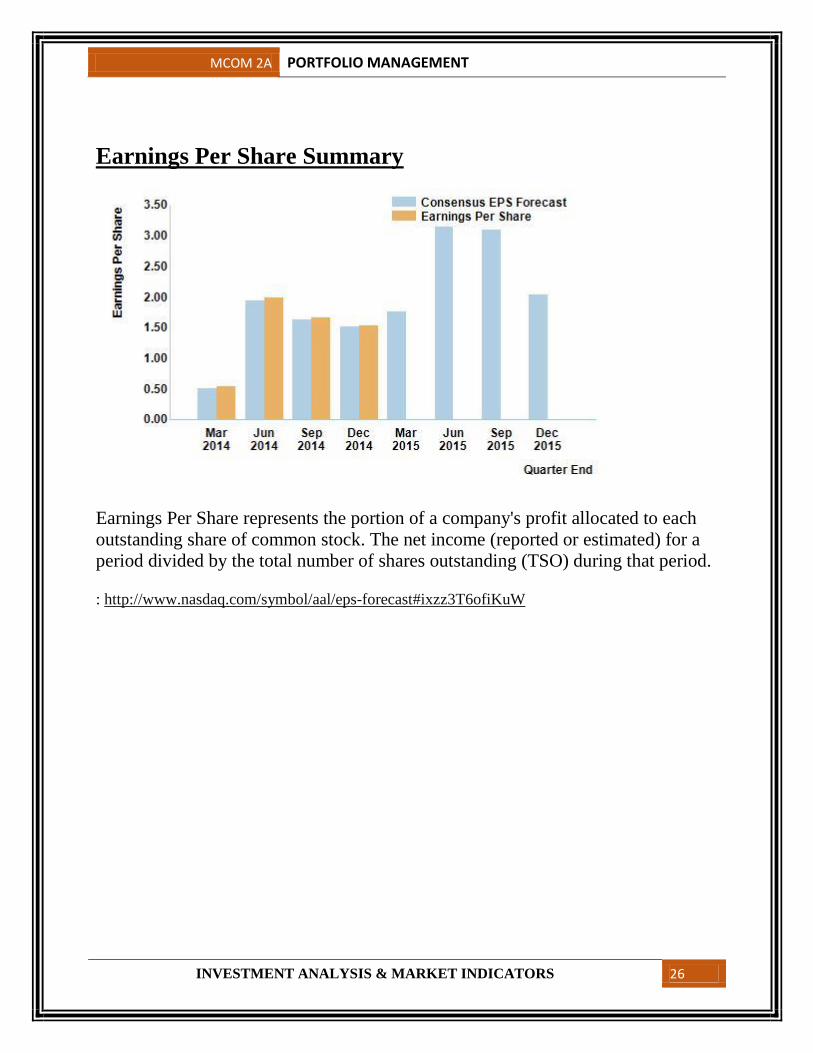
Earnings Per Share Summary
Earnings Per Share represents the portion of a company's profit allocated to each
outstanding share of common stock. The net income (reported or estimated) for a
period divided by the total number of shares outstanding (TSO) during that period.
: http://www.nasdaq.com/symbol/aal/eps-forecast#ixzz3T6ofiKuW
MCOM 2A PORTFOLIO MANAGEMENT
INVESTMENT ANALYSIS & MARKET INDICATORS 27
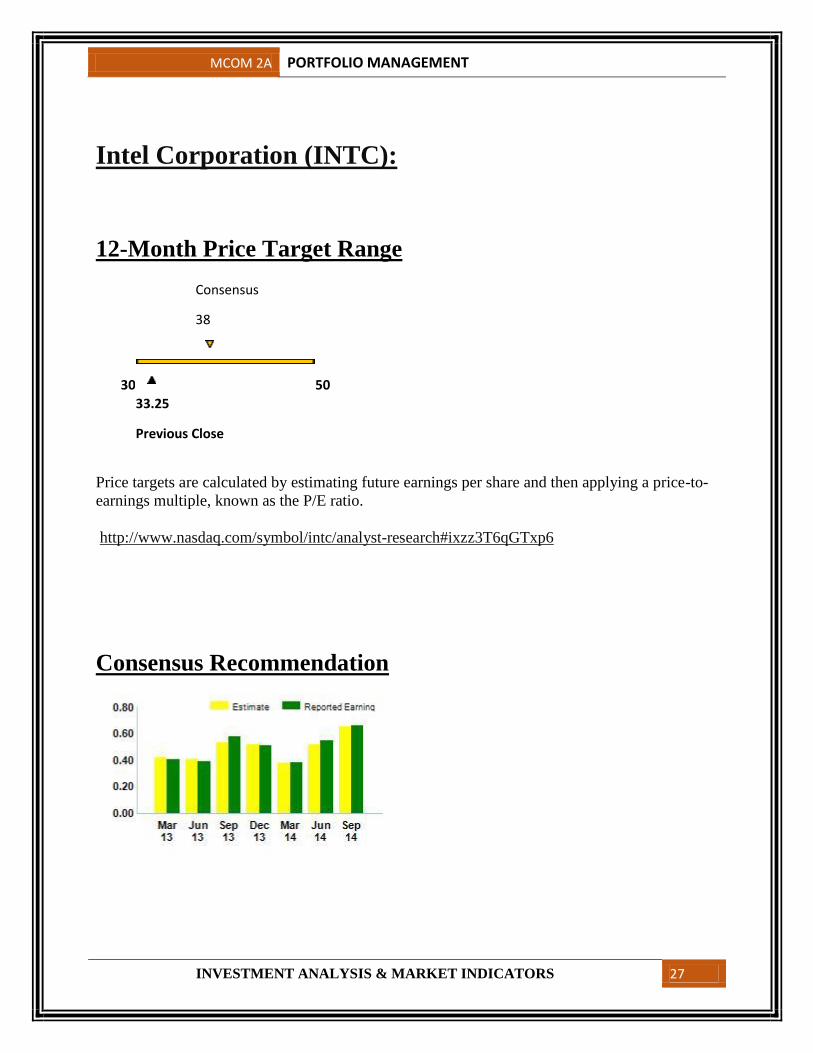
Intel Corporation (INTC):
12-Month Price Target Range
Consensus
38
30
33.25
Previous Close
50
Price targets are calculated by estimating future earnings per share and then applying a price-to-
earnings multiple, known as the P/E ratio.
http://www.nasdaq.com/symbol/intc/analyst-research#ixzz3T6qGTxp6
Consensus Recommendation

MCOM 2A PORTFOLIO MANAGEMENT
INVESTMENT ANALYSIS & MARKET INDICATORS 28
Momentum
12/2015 1 of 22 estimates changed
Up:
1
Down: 0
Estimate momentum measures changes in analyst sentiment over time & may be an indicator of
future price movements.
http://www.nasdaq.com/symbol/intc/analyst-research#ixzz3T6qyZktP
Earnings per Share Summary

MCOM 2A PORTFOLIO MANAGEMENT
INVESTMENT ANALYSIS & MARKET INDICATORS 29
Earnings Growth (2015)
Earnings Growth is the measure of year on year earnings per share (EPS) growth from the prior
fiscal year, expressed as a percentage.
: http://www.nasdaq.com/symbol/intc/analyst-research#ixzz3T6rP0BKb
Price / Earnings Ratio
MCOM 2A PORTFOLIO MANAGEMENT
INVESTMENT ANALYSIS & MARKET INDICATORS 30
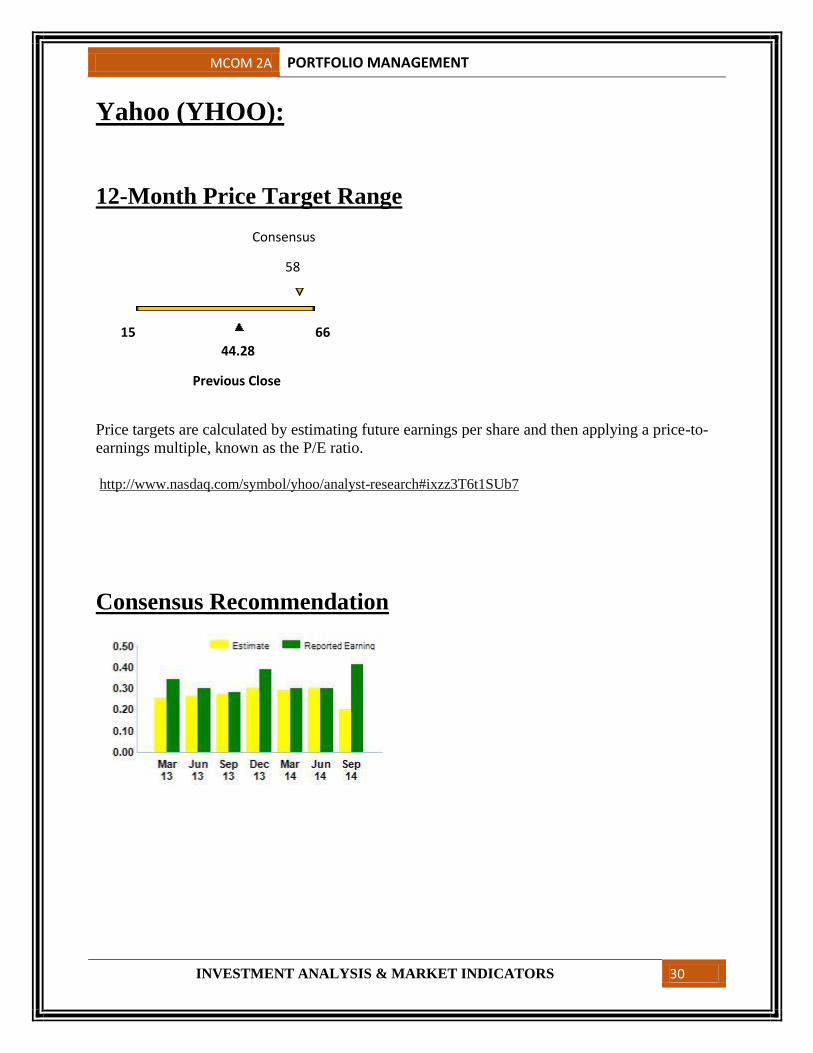
Yahoo (YHOO):
12-Month Price Target Range
Consensus
58
15
44.28
Previous Close
66
Price targets are calculated by estimating future earnings per share and then applying a price-to-
earnings multiple, known as the P/E ratio.
http://www.nasdaq.com/symbol/yhoo/analyst-research#ixzz3T6t1SUb7
Consensus Recommendation

MCOM 2A PORTFOLIO MANAGEMENT
INVESTMENT ANALYSIS & MARKET INDICATORS 31
Momentum
12/2015 7 of 7 estimates changed
Up:
1
Down:
6
Estimate momentum measures changes in analyst sentiment over time & may be an indicator of
future price movements.
http://www.nasdaq.com/symbol/yhoo/analyst-research#ixzz3T6tSrAc7
Earnings per Share Summary

MCOM 2A PORTFOLIO MANAGEMENT
INVESTMENT ANALYSIS & MARKET INDICATORS 32
Earnings Per Share represents the portion of a company's profit allocated to each outstanding
share of common stock. The net income (reported or estimated) for a period divided by the total
number of shares outstanding (TSO) during that period.
http://www.nasdaq.com/symbol/yhoo/eps-forecast#ixzz3T6tnpU91
Price / Earnings Ratio
Price/Earnings Ratio is a widely used stock evaluation measure. For a security, the
Price/Earnings Ratio is given by dividing the Last Sale Price by the Average EPS (Earnings Per
Share) Estimate for the specified fiscal time period.
http://www.nasdaq.com/symbol/yhoo/pe-ratio#ixzz3T6u3Ltmr
.
MCOM 2A PORTFOLIO MANAGEMENT
INVESTMENT ANALYSIS & MARKET INDICATORS 33
Financial Analysis:
Microsoft (MSFT):
We are computing some ratios e.g. Current ratio and net profit ratio which tell us
the financial information and position of that company in which we are going to
invest. Some ratios are as follows:
Comparisons of year 2013 & 2014:
Ratios Year 2014 Year 2013
Current Ratio 2.50 2.71
Debt to equity ratio 0.23 0.16
Net profit margin 0.25 0.28
Return on equity 0.245 0.276
From this comparison we can analyze that the MSFT has better indicators and
performance in year 2013 as compared to year 2014.
Net profit margin is higher in 2013
Return on equity is better in 2013.

MCOM 2A PORTFOLIO MANAGEMENT
INVESTMENT ANALYSIS & MARKET INDICATORS 34
Coca Cola (KO):
We are computing some ratios e.g. Current ratio and net profit ratio which tell us
the financial information and position of that company in which we are going to
invest. Some ratios are as follows:
Ratios Year 2014 Year 2013
Current ratio 1.01 1.12
Debt to equity ratio 0.628 0.577
Net profit margin 0.154 0.183
Return on equity 0.23 0.258
From this comparison we can analyze that the KO has better indicators and
performance in year 2013 as compared to year 2014.
Net profit margin is higher in 2013
Return on equity is better in 2013.
Intel Corporation (INTC):
We are computing some ratios e.g. Current ratio and net profit ratio which tell us
the financial information and position of that company in which we are going to
invest. Some ratios are as follows:
Ratios Year 2014 Year 2013
Current ratio 1.73 2.36
Debt to equity ratio 0.216 0.225
Net profit margin 0.209 0.182
Return on equity 0.209 0.165
From this comparison we can analyze that the INTC has better indicators and
performance in year 2013 as compared to year 2014.
Net profit margin is higher in 2014
Return on equity is better in 2014.

MCOM 2A PORTFOLIO MANAGEMENT
INVESTMENT ANALYSIS & MARKET INDICATORS 35
Yahoo (YHOO):
We are computing some ratios e.g. Current ratio and net profit ratio which tell us
the financial information and position of that company in which we are going to
invest. Some ratios are as follows:
Ratios Year 2014 Year 2013
Current ratio 2.14 3.75
Debt to equity ratio 0.034 0.0938
Net profit margin 1.628 0.292
Return on equity 0.194 0.104
From this comparison we can analyze that the INTC has better indicators and
performance in year 2013 as compared to year 2014.
Net profit margin is higher in 2014
Return on equity is better in 2014.
American Airlines (AAL):
We are computing some ratios e.g. Current ratio and net profit ratio which tell us
the financial information and position of that company in which we are going to
invest. Some ratios are as follows:
Ratios Year 2014 Year 2013
Current ratio 0.901 1.037
Debt to equity ratio 8.01 (5.62)
Net profit margin 0.067 (0.068)
Return on equity 1.426 0.67
From this comparison we can analyze that the INTC has better indicators and
performance in year 2013 as compared to year 2014.
Net profit margin is higher in 2014
Return on equity is better in 2014.

MCOM 2A PORTFOLIO MANAGEMENT
INVESTMENT ANALYSIS & MARKET INDICATORS 36
Micro and Macro Analysis:
Coca cola (KO):
MACRO FACTORS
POLITICAL
Changes in regulations i.e. nutritional info on packaging – fluctuating exchange
rates could result in a loss when trading overseas and sourcing materials.
SOCIAL
Increased interest from consumers in a healthy lifestyle + knowledge of nutritional
info – particularly sugar/fat content (Coca-Cola Company, 2009).
ECONOMIC
Recession, UK 2010 – positive influence on Coca-Cola’s retail sales. Sales reached
£1 billion for ‘My Coke’ (Coca-Cola, Diet Coke and Coca-Cola Zero). This was
the “first ever time that the combined sales of the three Coke brands have broken
through the £1 billion barrier” (Coca-Cola Company, 2010).
LEGAL
Changes in income or corporation tax – increase in such taxes could negatively
effect the financial position of Coca-Cola. Coca-Cola earns income in many
foreign countries, not just the US. A reform to the US tax system
changing corporation tax on foreign earnings, could adversely impact Coca-Cola’s
financial results (Coca-Cola Company, 2012).
ENVIRONMENTAL
Challenged to use more sustainable and environmental friendly products for
their packaging
Cans/bottles always state if they are recyclable and how to dispose of
correctly
Bottles/cans which are recycled has a positive effect on environment

MCOM 2A PORTFOLIO MANAGEMENT
INVESTMENT ANALYSIS & MARKET INDICATORS 37
TECHNOLOGICAL
Do as much as they can on technological front – produced various
applications for smartphones.
Recent app – Share a Coke – allowed users to create a digital can and send it
to someone. This is a fun way to communicate with friends through the
brand and is something that isn’t offered by counter brand Pepsi.
MICRO FACTORS
THE COMPANY
Strong work ethic – “…treat our people well, help them develop and give them a
rewarding life.” Coca-Cola also excel in performance, develop skills and move
towards their career goals. They were ranked No.26 in the Great Place to Work
Institute (Coca-Cola, 2010).
CUSTOMERS
Coca Cola focus on “brand love”. Coca Cola believe that in the long-term that
customer loyalty will strengthen their position.
“We know that we would only have sustainable growth if we are able to build
relationships with our consumers, these relationships convert into sales” Muenster,
Director of knowledge and insights (Warc, 2010).
SUPPLIERS
A ‘sound, stable and ethical supply’ are vital to continued success (Coca-Cola
Company, 2013)
COMPETITION
Pepsi – 14% growth in net revenue in 2011 and has their brand distributed in over
200 countries. (PepsiCo, 2011). Coca Cola and Pepsi are both competitive with
their pricing.

MCOM 2A PORTFOLIO MANAGEMENT
INVESTMENT ANALYSIS & MARKET INDICATORS 38
References
Coca-Cola Company (2009) Coca-Cola China Sustainability Review. Available from:
http://assets.coca-
colacompany.com/16/60/e69bd11e47f4978bc2ef3753f178/EN_final_draft_for_web.pdf
[Accessed 11 October 2013].
Coca-Cola Company (2010) Coke Winning In a Recession. Available from: http://www.coca-
cola.co.uk/press-centre/2010/march/coke-winning-in-a-recession.html
Coca-Cola Company (2012) Annual Report pursuant to section 13 or 15(d) of the securities
exchange act of 1934. Available from: http://www.coca-colacompany.com/annual-
review/2012/pdf/form_10K_2012.pdf
Coca-Cola Company (2013) About Our Suppliers. Available from: http://www.coca-
colacompany.com/our-company/suppliers/suppliers
American Airlines (AAL):
In 2012, American Airlines (AA) impacted the U.S. economy by stimulating $117
billion in economic activity, adding nearly $51 billion to U.S. Gross Domestic
Product (GDP), and effecting the creation of more than 965 thousand jobs. AA
employed nearly 75 thousand people and had direct operating expenditures of $22
billion, nearly 37% of which was from salary and benefits expense for active and
retired employees.
AA is the world's third-largest airline in passenger miles transported, passenger
fleet size, and operating revenues. AA operates a domestic network from five
“cornerstone” markets: New York, Chicago, Dallas/Fort Worth, Los Angeles and
Miami. These markets represent the top four U.S. population centers, and a
geographically unique gateway to Latin American in Miami.
Domestically in 2012, AA served nearly 200 airports in 44 states, and flew more
than one million flights carrying nearly 83 million passengers. Worldwide, AA
serves more than 50 countries and territories with, on average, 3,500 daily flights.
AA is also a founding member of the oneworld® alliance, which brings together
some of the best and biggest names in the airline business. Together, oneworld®
members and members-elect serve more than 840 destinations with more than
9,000 daily flights to 160 countries and territories.
MCOM 2A PORTFOLIO MANAGEMENT
INVESTMENT ANALYSIS & MARKET INDICATORS 39
American Airlines (AAL):
Micro Factors (SWOT):
Strengths
Enrollment of over 50 million
Perennially recognized as one of the best customer loyalty programs
Highest proportion of redeemable seating capacity among legacy
carriers
One of the oldest, most established, carriers in the industry
Only legacy carrier which hasn’t filed for bankruptcy
Hub positions in Dallas, Miami, Chicago
Strong presence in major business hubs
AA generates strong operating cash flow
Highly-rated
Weaknesses
Inability to compete on international flights
Foreign carriers dominate market and offer higher quality service
West coast weakness inhibits ability to reach Asian markets
Financial position
Analysts forecasts losses through 2011
Credit rating inhibits ability to enter fuel hedging contracts
Dependence on resurgence in demand
Labor and Union Issues
Opportunities
Flight plan 2020
Management has laid out a plan of action for the next ten years
Emphasis on investing wisely in fleet, earning loyalty,
strengthening the global network, building workplace community
and flying profitably
Address labor costs
Flight attendant union negotiations
Maintenance outsourcing
Enhance international offerings
Potential for growth in Asian markets
Upgrade business class on long-haul flights
MCOM 2A PORTFOLIO MANAGEMENT
INVESTMENT ANALYSIS & MARKET INDICATORS 40
Threats
Competitors have reduced costs through bankruptcy and consolidation
Fuel market volatility
Escalating militancy of labor unions
Growth in videoconferencing and travel substitutes economics-files.pomona.edu/jlikens/SeniorSeminars/.../pdf/amr.pdf
Macro Analysis (PEST):
Political
The airline industry operates in a highly regulated political environment where
passengers are favored over the airlines. This is due to the fact that passenger
safety is paramount and the political establishment have been made weary of the
airlines and resorted towards strict regulations for their operations, due to their
earlier inclinations towards monopolistic behavior. Furthermore, with there being
more competition in the industry and regulations in demand, passengers are in a
position where they can push for lower prices and amenities.
Economic
The 9/11 attacks left a major impact that the airline industry is yet to recover from.
The prolonged recession, fluctuations in oil prices and an imminent global
slowdown are other debilitating factors that are affecting the growth of the airline
industry. Airlines have to cope with declining passengers, high fuel prices,
competition from low-cost airliners, labor demands and soaring operating and
maintenance costs. In addition, events such as the recent Malaysian airline
disappearance, is also adversely affecting the global airline industry.
Social
Over the years, the millennial generation’s emergence into the consumer class has
resulted in major social changes, more importantly in terms of service, where
consumers have become much more demanding. Therefore, to meet the increasing
demands of this segment, airlines have to stabilize their costs. Additionally, the
passenger profile has changed as well with there being more economically minded
passengers. When it comes to business class passengers, improved communication
facilities have reduced the need to fly down for meetings.
MCOM 2A PORTFOLIO MANAGEMENT
INVESTMENT ANALYSIS & MARKET INDICATORS 41
Technological
With intense competition in the airline industry, latest technology must be adapted
by airliners in order to survive in the already tough environment. Additionally, the
use of latest technology in aircrafts would not only lower fuel consumption, but
also the cost of airline operations and improve efficiency.
Toronto Dominion Bank (TD):
Micro Analysis (SWOT):
Strenghts
Innovative Culture
An innovative culture helps TD BANK to produce unique products and
services that meet their customer’s needs.
Financial Leverage
Financial leverage allows TD BANK to use their balance sheet to expand
their business and increase their profits.
Unique Products
Unique products help distinguish TD BANK from competitors. TD BANK
can charge higher prices for their products because consumes can’t get
these products elsewhere.
Customer Loyalty
When given a choice, customers are loyal to TD BANK. Instead of
targeting all customers, TD BANK only needs to target new customers in
order to grow their business.
Brand Name
A strong brand name is a major strength of TD Bank.

MCOM 2A PORTFOLIO MANAGEMENT
INVESTMENT ANALYSIS & MARKET INDICATORS 42
Weaknesses:
High debt Burden
A high debt burden increases the risk that TD BANK goes bankrupt if they make a
poor business decision. Increasing risks can increase TD BANK’s debt interest
payments… … "High Debt Burden (TD BANK)" has a significant impact, so an
analyst should put more weight into it. "High Debt Burden (TD BANK)" will have
a long-term negative impact on this entity, which subtracts from the entity's value.
This qualitative factor will lead to an increase in costs. This statement will lead to a
decrease in profits. "High Debt Burden (TD BANK)" is a difficult qualitative
factor to overcome, so the investment will have to spend a lot of time trying to
overcome this issue.
Weak Management
Weak management increases business risks and reduces profits for TD BANK,
because they are responsible for the health of the business.
Opportunities:
Online market
The online market offers TD BANK the ability to greatly expand their business.
TD BANK can market to a much wider audience for relatively little expense… …
"Online Market (TD BANK)" has a significant impact, so an analyst should put
more weight into it. "Online Market (TD BANK)" will have a long-term positive
impact on this entity, which adds to its value. This statements will have a short-
term positive impact on this entity, which adds to its value. This qualitative factor
will lead to a decrease in costs.
Emerging Markets
Emerging markets are fast growing regions of the world that enable TD BANK to
quickly expand… … "Emerging Markets (TD BANK)" has a significant impact, so
an analyst should put more weight into it. "Emerging Markets (TD BANK)" will
have a long-term positive impact on the this entity, which adds to its value. This
statements will have a short-term positive impact on this entity, which adds to its
value. This qualitative factor will lead to a decrease in costs. This statement will
lead to an increase in profits for this entity. "Emerging Markets (TD BANK)" is a
difficult qualitative factor to defend, so competing institutions will have an easy

MCOM 2A PORTFOLIO MANAGEMENT
INVESTMENT ANALYSIS & MARKET INDICATORS 43
time overcoming it.
Threats:
Bad Economy:
A bad economy can hurt TD BANK’s business by decreasing the number of
potential customers… … "Bad Economy (TD BANK)" will have a long-term
negative impact on this entity, which subtracts from the entity's value. This
statements will have a short-term negative impact on this entity, which subtracts
from its value. This qualitative factor will lead to an increase in costs. "Bad
Economy (TD BANK)" is a difficult qualitative factor to overcome, so the
investment will have to spend a lot of time trying to overcome this issue.
Intense Competition
Intense completion can lower TD BANK’s profits, because competitors can entice
consumers away with superior products… … "Intense Competition (TD BANK)"
will have a long-term negative impact on this entity, which subtracts from the
entity's value.
Yahoo (YHOO):
Micro analysis (SWOT)
Strengths
Yahoo!’s Overture is a tremendously profitable Internet advertising
business. It focuses on affiliate advertising for large advertising accounts, in
the same way as Google’s Adsense programme. This is an important income
stream for Yahoo!.
Yahoo! has over 350 million users of its services and solutions. This makes
it a very powerful marketing company, with a very well known brand. Some
reports indicate that is it is the most popular website in the World.
Weaknesses
Differentiation is difficult for Yahoo!. Almost all of its packaged services
are available from other sources.
1. (i) Search facilities are available on MSN and Google.
2. (ii) Free E-mail accounts are available from Hotmail (MSN) or G-

MCOM 2A PORTFOLIO MANAGEMENT
INVESTMENT ANALYSIS & MARKET INDICATORS 44
Mail (Google), and many, many others.
3. (iii) New is available from CNN or the BBC.
4. (iv) Shopping is available everywhere on the Internet. Google has
Froogle.
Online advertising is a new income stream for organizations such as MSN,
Yahoo! and Goggle. Yes, today they are very, very profitable. However, as
technology develops and new unforeseen advertising media emerge, the
future is uncertain for these income streams. This is a weakness for Yahoo!
and its competitors.
Another income stream that has been key to Yahoo! is derived from its
partnerships with telecommunication providers. For example, you buy an
Internet connection package from your local telephone company, and it
includes a fee-based Yahoo! package including e-mail accounts, user
support and other added value services. If ever this channel is changed or
removed, the income stream would be affected.
Opportunities
The international market is a huge opportunity for Yahoo!. Yahoo!,
Microsoft and Google are busy carving niches and taking over businesses in
are around the Greater China Region. China has over 1,200,000,000 citizens.
Other economies, such as India, also offer tremendous growth potential.
The Development of the Yahoo! Directory has potential for new business
and income streams. Two thirds of organizations in Ohmae’s Triad (Europe,
Japan and the USA) are Small Medium Enterprises (SME’). SME’s are
potential directory advertisers.
Mobile technologies offer another opportunity for Yahoo!. Today we access
the Internet using personal computers. Tomorrow phones, televisions,
personal organisers, music players and computers will merge and morph.
The mobile devices of the future will need services and solutions. Yahoo!
would be well placed to provide many of them.
Threats
The biggest threat for all web-based organization is competition. Huge
profits attract investors, innovators and entrepreneurs. Dotcom fever has not
gone away, it is now more focused on profit delivery. All of Yahoo!’s key
services have competitors such as AOL, Google and many others.
International, culture specific competitors could affect Yahoo! in the future,

MCOM 2A PORTFOLIO MANAGEMENT
INVESTMENT ANALYSIS & MARKET INDICATORS 45
unless strategic alliances are forged. China has developed its own search
engines, as has India. Why should the World use USA based companies
such as Yahoo!? There needs to be a series of substantial competitive
advantages to see the business remain as an international brand. Look at
what has been learned from the global car industry, or electronics industry.
http://www.marketingteacher.com/yahoo-swot/
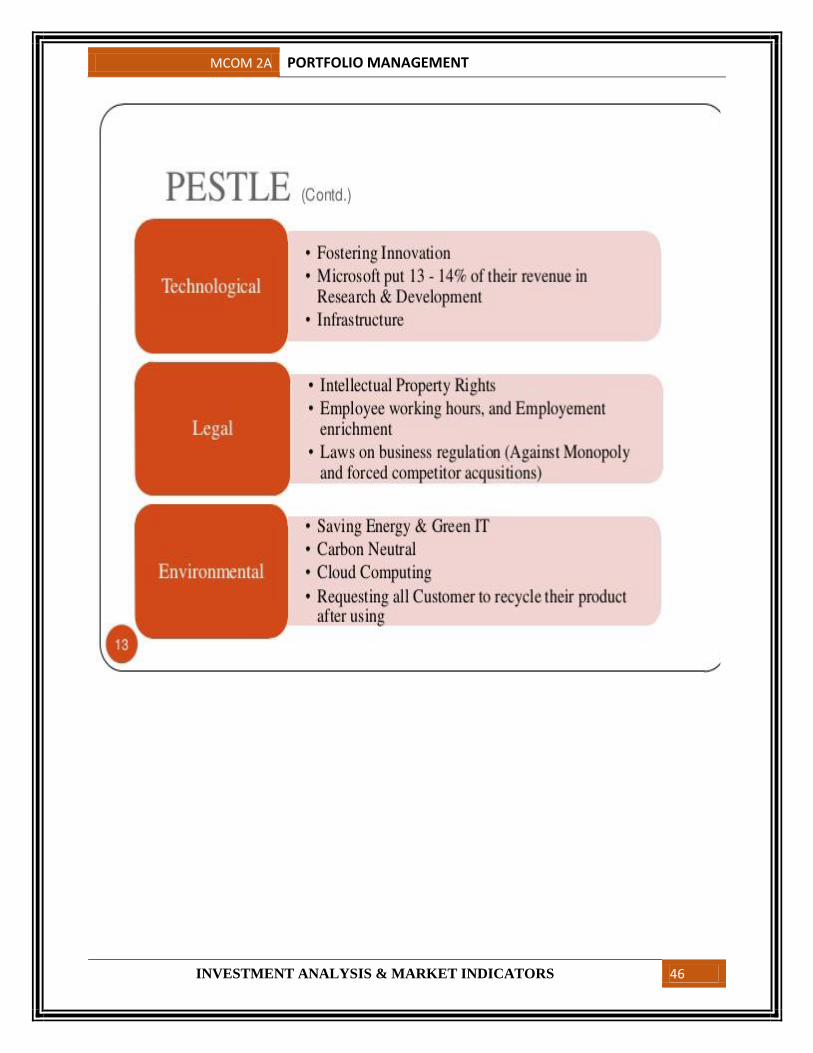
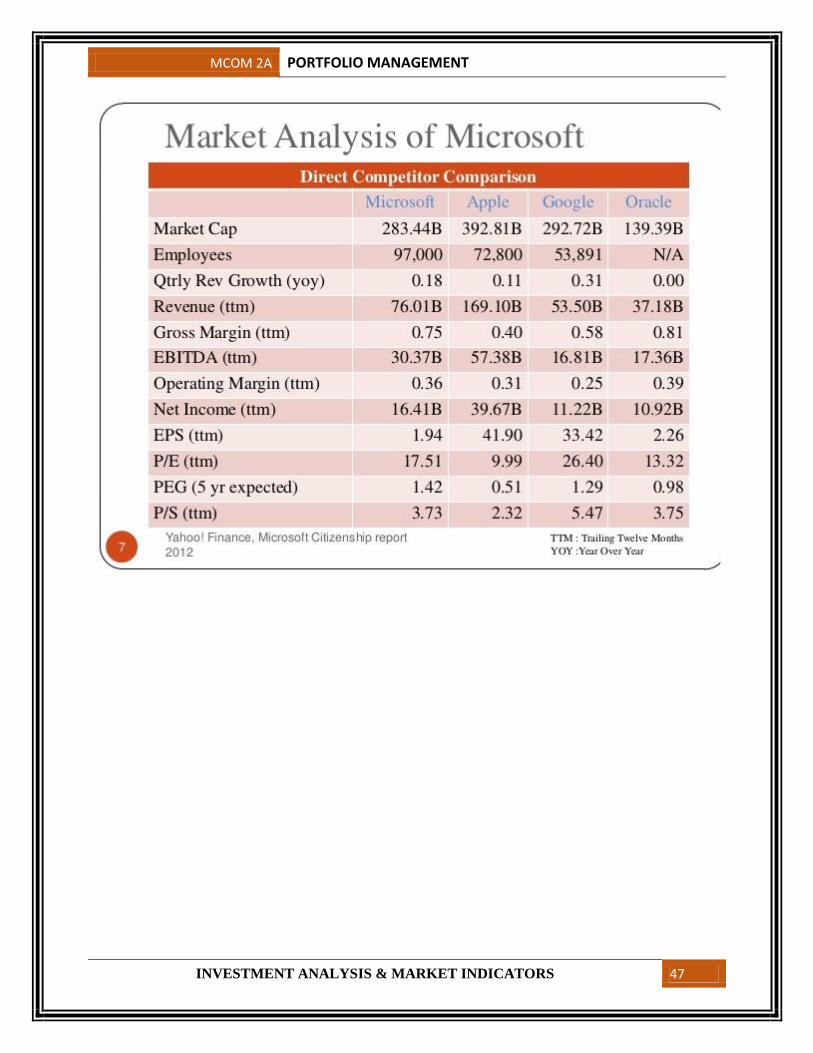
Microsoft (MSFT)
Macro Analysis
MCOM 2A PORTFOLIO MANAGEMENT
INVESTMENT ANALYSIS & MARKET INDICATORS 46
MCOM 2A PORTFOLIO MANAGEMENT
INVESTMENT ANALYSIS & MARKET INDICATORS 47
MCOM 2A PORTFOLIO MANAGEMENT
INVESTMENT ANALYSIS & MARKET INDICATORS 48
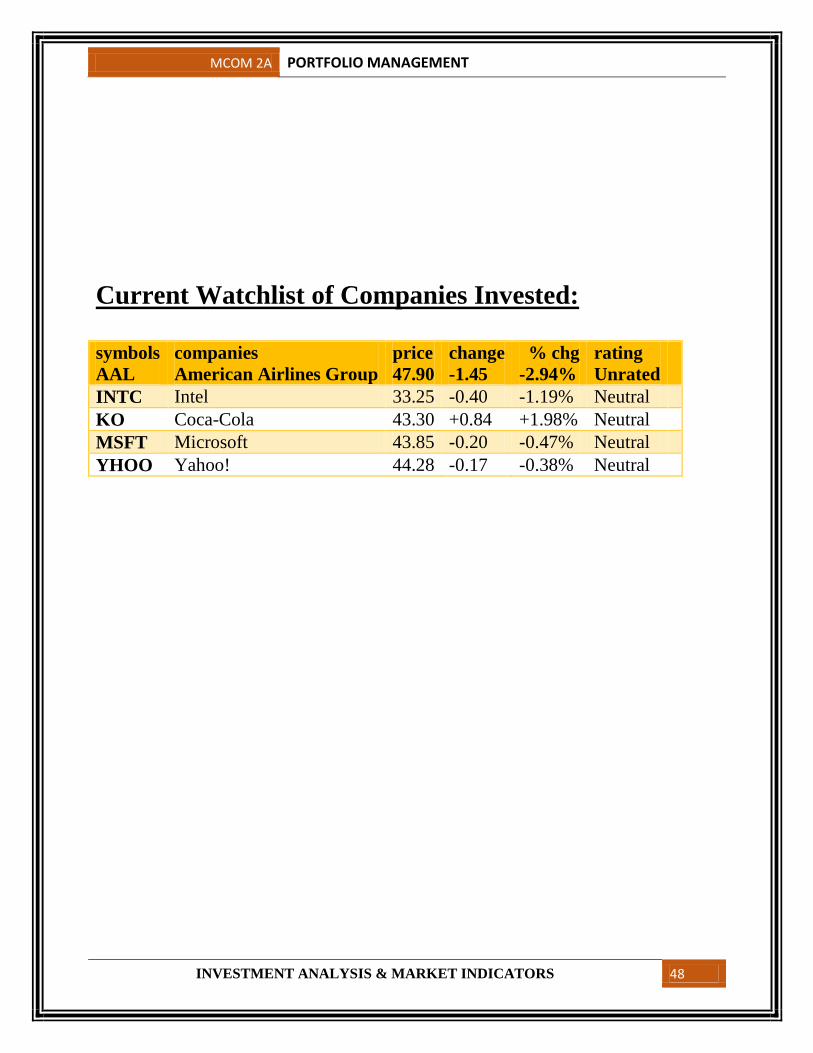
Current Watchlist of Companies Invested:
symbols
AAL
companies
American Airlines Group
price
47.90
change
-1.45
% chg
-2.94%
rating
Unrated
INTC Intel 33.25 -0.40 -1.19% Neutral
KO Coca-Cola 43.30 +0.84 +1.98% Neutral
MSFT Microsoft 43.85 -0.20 -0.47% Neutral
YHOO Yahoo! 44.28 -0.17 -0.38% Neutral

MCOM 2A PORTFOLIO MANAGEMENT
INVESTMENT ANALYSIS & MARKET INDICATORS 49
Recommendations and conclusions:
At the end we can say that before investing in any company and
making any diversification in portfolio of stocks we must read
and have fully knowledge of all market indicators and we also
must analyze financial position of that company in which we are
going to invest. The most important thing is that we also
understand the micro and macro environment of that company
which can give us important information. After considering all
this if we make investment then we can get good results, profits
and the end healthy dividends.

MCOM 2A PORTFOLIO MANAGEMENT
INVESTMENT ANALYSIS & MARKET INDICATORS 50

MCOM 2A PORTFOLIO MANAGEMENT
INVESTMENT ANALYSIS & MARKET INDICATORS 51
MCOM 2A PORTFOLIO MANAGEMENT
INVESTMENT ANALYSIS & MARKET INDICATORS 52

MCOM 2A PORTFOLIO MANAGEMENT
INVESTMENT ANALYSIS & MARKET INDICATORS 53

MCOM 2A PORTFOLIO MANAGEMENT
INVESTMENT ANALYSIS & MARKET INDICATORS 54