port and ocean engineering under arctic conditions
TRANSCRIPT

PORT AND OCEAN ENGINEERING
UNDER ARCTIC CONDITIONS
VOLUME 11
SYMPOSIUM ON NOISE AND MARINE MAMMALS
Edited by Symposium Organizers and Editors
W.M. SACKINGER. Ph. D.. P.E. J.L. IMM M.O. JEFFRIES. Ph. D. S.D. TREACY The Geophysical Institute Minerals Management Service University of Alaska Fairbanks U.S. Department of the Interior
Anchorage, Alaska
The Geophysical Institute University of Alaska Fairbanks
Fairbanks, Alaska

Beluga whale (Delphinapterus leucas) in new ice. Photo Credit: Naval Ocean Systems Center
Copyright @ 1988 by the Geophysical Institute, University of Alaska Fairbanks. All rights
reserved. No part of this publication may be reproduced, stored in a retrieval system, or
transmitted in any form or by any means, electronic, mechanical, photocopying, recording, or otherwise, without the prior written permission of the publisher, the Geophysical
Institute, University of Alaska Fairbanks, Fairbanks, Alaska 99775-0800, U.S.A.
ISBN 0 - 915360 - 06 - 3

PREFACE The series of conferences on Port and Ocean Engineering under Arctic
Conditions (POAC) is organized biennially by national POAC committees under the long-term policy direction of the POAC International Committee. Previous POAC conferences have been held in Norway (21, Canada (21, Iceland, Finland, Greenland and Alaska. The Ninth Conference (POAC-87) in the POAC series was held at the University of Alaska Fairbanks, Alaska, USA from August 17-2 1, 1987. This multi- volume book, entitled "Port and Ocean Engineering Under Arctic Conditions", is a compilation of the papers written for and presented at POAC-87.
A total of 224 people registered for POAC-87 and 122 papers were presented during 14 sessions. The sessions were: Arctic Database; Ice Properties; Icebreaking Vessels; Ice Modelling; Arctic Port Design; Geotechnical; Ice-structure Interaction; Ice Morphology; Ice Dynamics; Ice, Climate and Forecasting; Spray Ice; Remote Sensing; and two special symposia on Noise and Marine Mammals, and SteelIConcrete Composite Structural Systems.
Papers submitted to POAC-87 were reviewed and edited prior to publication. All the papers in this book have been refereed by two, three, or more reviewers, and then edited, to try to ensure a consistent and high standard for technical content, style and format for publication. Once accepted for publication, authors submitted a camera-ready copy of their papers. The majority of papers in this book were verbally presented at POAC-87; a few authors were unable to attend the conference, but their papers have been published since they met the necessary review and editorial standards.


ACKNOWLEDGEMENTS Many individuals and organizations contributed to the success of POAC-87 and to
the publication of this book.
The conference SPONSORS were:
University of Alaska Fairbanks
Geophysical Institute, University of Alaska Fairbanks
Minerals Management Service, Technology Assessment and Research Program
National Science Foundation
Minerals Management Service, Environmental Studies Branch, Alaska OCS Region
Alaska Oil and Gas Association, Lease Planning and Research
Committee, Member Companies:
Amoco Production Company
ARC0 Alaska, Inc.
BP Alaska Exploration Inc.
Chevron USA, Inc.
Conoco, Inc.
Elf Aquitaine Petroleum
Exxon Company, USA
Marathon Oil Company
Mobil Oil Corporation
Shell Western E & P, Inc.
Standard Alaska Petroleum Company
Unocal Corporations
and the CO-SPONSORS were:
American Society of Civil Engineers
Alaska Academy of Engineering and Science
Centre for Frontier Engineering Research (C-FER)
Le Comite Arctique International
The long-term policy of the conferences on Port and Ocean Engineering under Arctic Conditions is directed by the POAC INTERNATIONAL COMMITTEE (1987):
Prof. Per Tryde
Technical University of Denmark (President)

Mr. Alf Engelbrektson
VBB-SWECO Engineers, Stockholm, Sweden (Vice President)
Prof. Per Bruun
The Norwegian Institute of Technology. Trondheim, Norway
(Secretary General)
Prof. William M. Sackinger
University of Alaska Fairbanks, Fairbanks, Alaska, USA
(Past President)
Dr. Pauli Jumppanen
Oy Wartsila Ab. Helsinki, Finland (Past President)
Prof. Bernard Michel
Lava1 University, Quebec, Canada (Past President)
Mr. K.R. Croasdale
Esso Resources Canada, Calgary, Alberta, Canada
Prof. G.R. Peters
Memorial University of Newfoundland, St. John's,
Newfoundland, Canada
Dr. K. Takekuma
Nagasaki Technical Institute/Mitsubishi Heavy
Industries, Nagasaki, Japan
Dr. -1ng. Joachim Schwarz
Hamburgische Schiffbau-Versuchsanstalt, Hamburg, Germany
Mr. G. Viggoson
Vita og Hafnamala Stjarinn, Reykjavik, Iceland Dr. E. Enkvist
Wartsila Arctic Research Centre, Helsinki, Finland
Dr. T. Carstens
Norwegian Hydrodynamics Labs, Trondheim, Norway
Prof. Xu Ji-zu
Tianjin University, Tianjin, China
Dr. W.F. Weeks
University of Alaska Fairbanks, Fairbanks, Alaska, USA

POAC-87 was organized by the U.S. NATIONAL ORGANIZING COMMITTEE:
Prof. W.M. Sackinger, Chairman; University of Alaska Fairbanks, Fairbanks, Alaska
Mr. Muhammed A. Ali
Chevron Corporation, San Francisco, California
Prof. F. Lawrence Bennett
University of Alaska Fairbanks, Fairbanks, Alaska
Mr. Chris Birch
State of Alaska Department of Transportation, Fairbanks, Alaska
Mr. Irving Boaz
Shell Oil Company, Houston, Texas
Comdr. Lawson W. Brigharn
U.S. Coast Guard, Boston, Massachusetts
Mr. David Chiang
Science Applications International Corp., McLean, Virginia
Prof. Jin S. Chung
Colorado School of Mines, Golden, Colorado
Mr. Roger Colony
University of Washington, Seattle, Washington
Dr. M.J. Feifarek
Marathon Oil Company, Houston, Texas
Mr. Joseph Galate
Enertech Engineering & Research Company, Houston, Texas
Prof. Ben. C. Gerwick, Jr .
University of California-Berkeley, Berkeley, California
Mr. H. Glenzer, Jr .
State of Alaska Department of Transportation, Fairbanks, Alaska
Mr. Roger Herrera
Standard Alaska Production Company, Anchorage, Alaska
Mr. Malcolm W. Howard
BP Petroleum Development Ltd., London, United Kingdom
Mr. Jerry Imm
Minerals Management Service, Anchorage, Alaska
vii

Dr. Martin 0. Jeffries
University of Alaska Fairbanks, Fairbanks, Alaska
Dr. Jerome B. Johnson
USA CRREL, Ft. Wainwright, Alaska
Mr. Austin Kovacs
USA CRREL, Hanover, New Hampshire
Dr. Thomas Kozo
US Naval Academy, Annapolis, Maryland
Prof. Charles Ladd
Massachusetts Institute of Technology, Cambridge, Massachusetts
Dr. Malcolm Mellor
USA CRREL, Hanover, New Hampshire
Dr. Thomas Osterkamp
University of Alaska Fairbanks, Fairbanks, Alaska
Mr. Dennis Padron
Han-Padron Associates, New York. New York
Dr. Robert S. Pritchard
Ice Casting, Inc., Seattle, Washington
Prof. Louis Rey
Le Comite Arctique International, Monte Carlo, Monaco
Ms. Patricia Sackinger
Fairbanks, Alaska
Mr. Terry Setchfield
Exxon Production Research Company, Houston, Texas
Prof. Lewis Shapiro
University of Alaska Fairbanks, Fairbanks, Alaska
Dr. Harold Shoemaker
US Department of Energy, Morgantown, West Virginia
Dr. Charles E. Smith
Minerals Management Service, Reston, Virginia
Mr. Rodney Smith
Minerals Management Service, Anchorage, Alaska
Dr. Walter Spring
Mobil Research and Development Corporation, Dallas, Texas

Prof. William Stringer
University of Alaska Fairbanks, Fairbanks, Alaska
Mr. Larry Sweet
University of Alaska Fairbanks, Fairbanks, Alaska
Prof. Shyam Sunder
Massachusetts Institute of Technology, Cambridge,
Massachusetts
Mr. Stephen D. Treacy
Minerals Management Service, Anchorage, Alaska
Mr. Michael Utt
Unocal Corporation, Brea, California
Dr. Ken Vaudrey
Vaudrey & Associates, San Luis Obispo, California
Mr. Robert Visser
Belrnar Engineering and Management Service Co., Redondo Beach, California
Dr. Vitoon Vivatrat
Engineering Science Inc., Houston, Texas
Dr. W.F. Weeks
University of Alaska Fairbanks, Fairbanks, Alaska
Prof. Gunter Weller
University of Alaska Fairbanks, Fairbanks, Alaska
Dr. J. Patrick Welsh
Naval Ocean Research and Development Activity, Hanover, New Hampshire
Mr. Jonathan Widdis
State of Alaska Department of Transportation, Fairbanks, Alaska
Dr. Jay Wiedler
Brown and Root USA, Houston, Texas
An important and vital task in the organization of POAC-87 and preparation of papers for publication was the review and evaluation of abstracts and papers. In
addition to all members of the International Committee and the U.S. National Organiz- ing Committee, the reviewers included:
Dr. H. Burcharth, University of Aalborg, Denmark
Dr. A. Chen, Exxon Production Research Company, Houston, Texas

Mr. Li Fu-cheng , University of Alaska Fairbanks, Fairbanks, Alaska
Dr. James U. Kordenbrock. David Taylor Research Center, U.S. Navy
Mr. Donald Kover, David Taylor Research Center, U.S. Navy
Dr. C.-H. Luk, Exxon Production Research Company, Houston, Texas
Dr. Lasse Makkonen, Technical Research Centre of Finland
Dr. A. L. Mindich, Mirza Engineering Inc., Chicago, Illinois
Mr. J. Poplin, Exxon Production Research Company, Houston, Texas
Dr. T. D. Ralston, Exxon Production Research Company, Houston, Texas
Dr. Philip A. Sackinger, Massachusetts Institute of Technology, Cambridge,
Massachusetts
Dr. A. Wang. Exxon Production Research Comp,any, Houston, Texas
Also helping with conference organization and the preparation of this book were Kathryn Coffer, Nancy Smoyer, Jan Dalrymple and Kim Morris. Day-to-day conference administration and co-ordination was by the Conferences and Institutes Office, University of Alaska-Fairbanks (Nancy Bachner and staff). Special thanks are due to Dr. S.-I. Akasofu, Director, Geophysical Institute, and to Dr. P.J. O'Rourke, Chancellor, University of Alaska-Fairbanks, for their encouragement and financial support; the encouragement of Dr. Harold D. Shoemaker of the U.S. Department of Energy was also appreciated.
To our sponsors and co-sponsors, the International and National Organizing Committees, and all those individuals who helped make POAC-87 and the publication of this book possible, our grateful thanks.
William M. Sackinger Martin 0. Jeffries Fairbanks January 1988

F O R E W O R D Many marine mammal species found in arctic waters have important
relationships with ice. Many are pagophilic, using ice as a platform to haul out (ringed, spotted, bearded, ribbon, and harp seals; and walrus) or to hunt and scavenge (polar bear and arctic fox). Some marine mammals relate to ice as a floating barrier around, through, and under which their seasonal migrations proceed (bowhead whales, beluga, and narwhal) or as an encroaching northern border that may ultimately prompt an annual migration to warmer waters (gray whale).
Marine mammals in ice-covered waters are subject to continual auditory input from a highly active acoustic environment. Some input is airborne, such as that which occurs at or above the water's surface (e.g., on land or ice as experienced by pinnipeds and polar bears). However, marine mammals mostly hear sounds that are generated, transmitted, and/or received underwater. Acoustic input may derive from natural sources including wave active, seismic activity, ice movement and breakage, as well as sounds produced by the above species and other biota. In addition, noise produced by various human activities contYibutes to overall loading of the acoustic environment. These anthropogenic noises are essentially a by-product of shipping, oil and gas exploration and development, fishing vessels, various activities of coastal communities, and activities of other marine industries.
Ice movement and breakage produce pervasive,and at times explosive,noise in arctic waters. The presence of sea ice also partially controls the underwater acoustic environment by providing a rough reverberative ceiling for local sound waves. Even when ice recedes, it continues to affect the underwater acoustic environment as surface layers warm up differentially in the water column, causing sound waves to refract downward. This refraction results in higher propagation loss in shallow water through increased contact of sound waves with bottom topography.
Depending on the pattern, sound frequency, and intensity of the sound source in combination with ambient oceanographic features (e.g., water depth, salinity, presence of ice, underwater substrate), various sounds may be discernible to these species above ambient-noise conditions, thereby potentially influencing individual animals to some degree. Such

influences on marine mammals may include changes in behavior such as curious attraction or avoidance reactions, changes in physiological rates, and interference with communicative or echolocative efforts.
These topics were the focus of the "Symposium on Noise and Marine Mammals in Ice-Covered Waters." The symposium, held August 18, 1987 a t the University of Alaska Fairbanks, was coordinated by the Minerals Management Service and was part of the 9th International Conference on Port and Ocean Engineering Under Arctic Conditions. The concept of this Symposium was originally suggested by Dr. Louis Rey, and the Symposium was co-sponsored by Le Comite Arctique International.
The titles and authors of scientific papers presented at the symposium are as listed in the Table of Contents which follows, with the exception of the paper "Possible effects of ambient noise on the ability of the Bowhead Whale, Balaena mysticetus, to discern under-ice reverberations from their calls" (William T. Ellison and Christopher Clark). This paper was presented by Mr. Charles I. Malme at the request of the authors, but is not included in this volume.
A panel discussion on the subject of potential directions for research was held immediately following presentation of the submitted papers. Two addi- tional papers, entitled "Evidence of Glacial Seismic Events in the Acoustic Environment of Humpback Whales" (Paul R. Miles and Charles I. Malme) and "Review of Studies on the Effects of Man-Induced Noise on Marine Mammals of the Bering, Chukchi, and Beaufort Seas and How the Results Have Been Applied to Federal Oil and Gas Management Decisions" (Cleveland J . Cowles and Jerry L. Imm), although not presented at the symposium, are included in this volume as useful background information.
The authors of these papers are to be commended for their contributions to the Symposium and to this volume.
Jerry Imm Stephen D. Treacy Minerals and Management Service Anchorage March 1988
xu

TABLE OF CONTENTS
VOLUME I1
. . . . . . . . . . . . . . . . . . . . . . . . . . . . . . . . . . . . . . . . . . . . . . . . . . . . . . . . . . . . . . Preface iii
Acknowledgements . . . . . . . . . . . . . . . . . . . . . . . . . . . . . . . . . . . . . . . . . . . . . . . . . . . . . . v
. . . . . . . . . . . . . . . . . . . . . . . . . . . . . . . . . . . . . . . . . . . . . . . . . . . . . . . . . . . . . . Foreword xi
REVIEW OF STUDIES ON THE EFFECTS OF MAN-INDUCED NOISE ON MARINE MAMMALS OF THE BERING, CHUKCHI, AND BEAUFORT SEAS AND HOW THE RESULTS HAVE BEEN APPLIED TO FEDERAL OFFSHORE OIL AND GAS MANAGEMENT DECISIONS
. . . . . . . . . . . . . . . . . . . . . . . . . . . . . . . . . . . . . . . . Cleveland J . Cowles a n d Je r ry L. I m m . 1
UNRESOLVED ASPECTS CONCERNING THE INFLUENCE OF NOISE ON MARINE MAMMALS J . M . T e r h u n e . . . . . . . . . . . . . . . . . . . . . . . . . . . . . . . . . . . . . . . . . . . . . . . . . . . . . . . . . . . . 9
EFFECTS OF INDUSTRIAL ACTIVITIES ON RINGED SEALS IN ALASKA. AS INDICATED BY AERIAL SURVEYS Kathryn J . Frost a n d Lloyd E. Lowry. . . . . . . . . . . . . . . . . . . . . . . . . . . . . . . . . . . . . . 1 5
RESPONSES OF RINGED SEALS (Phoca hispida) TO NOISE DISTURBANCE Brendan P. Kelley, J o h n J. Burns a n d Lori T. Quakenbush . . . . . . . . . . . . . . . . . . 27
RESPONSES OF MIGRATING NARWHAL AND BELUGA TO ICEBREAKER TRAFFIC AT THE ADMIRALTY INLET ICE-EDGE, N.W.T. IN 1986 Susan E. Cosens and Larry P. Dueck . . . . . . . . . . . . . . . . . . . . . . . . . . . . . . . . . . . . . . . . 39
OBSERVATIONS OF FEEDING GRAY WHALE RESPONSES TO CONTROLLED INDUSTRIAL NOISE EXPOSURE Charles I. Malme, Bernd Wursig, J a m e s E. Bird and Peter Tyack . . . . . . . . . . . . . . . . . . . . . . . . 5 5
INDUSTRY OBSERVATIONS OF BOWHEAD WHALES IN THE CANADIAN BEAUFORT SEA, 1976-1985 J o h n G . W a r d a n d E . P e s s a h . . . . . . . . . . . . . . . . . . . . . . . . . . . . . . . . . . . . . . . . . . . . 7 5
MASKEDDETECTIONTHRESHOLDSFORTHEBELUGAANDBOTTLENOSEDOLPHIN Charles W. Turl, Ralph H. Penner a n d W.W.L. Au . . . . . . . . . . . . . . . . . . . . 89
EVIDENCE OF GLACIAL SEISMIC EVENTS IN THE ACOUSTIC ENVIRONMENT OF HUMPBACK WHALES Paul R. Miles a n d Charles I. Malme . . . . . . . . . . . . . . . . . . . . . . . . . . . . . . . . . . . . . . . . . . 9 5
PANEL DISCUSSION Stephen D. Treacy .
Author List . . . . . . . . . . . . . . . . . . . . . . . . . . . . . . . . . . . . . . . . . . . . . . . . . . . . I l l


REVIEW OF STUDIES ON THE EFFECTS OF MAN-INDUCED NOISE ON MARINE MAMMALS OF THE BERING, CHUKCHI, AND BEAUFORT SEAS AND HOW THE
RESULTS HAVE BEEN APPLIED TO FEDERAL OFFSHORE OIL AND GAS MANAGEMENT DECISIONS
Cleveland J. Cowles Jerry L. Imm
Minerals Management Service, Anchorage, Alaska, USA
Abstract
Since 1980, the U. S. Minerals Management Service has managed and funded a variety of studies of the potential effects of man-induced noise on marine mammals of the Bering, Chukchi, and Beaufort Seas. The purpose of such studies is to provide information needed for informed decisionmaking pertaining to environ- mentally sound leasing and management of offshore oil and gas development on the Alaska Outer Continental Shelf (OCS). Many of the noise/ marine mammal-interaction studies have been used in establishing lease specifica- tions or regulations for offshore operations in Federal lease areas. Results also have been important in the resolution of litigation pertaining to OCS oil and gas leasing and explora- tion. Specific examples of how results have been applied are presented and future Alaska information needs in this discipline are discussed.
Introduction
Since 1980 the Minerals Management
This is a reviewed and edited version of apaper submit- ted to the Ninth International Conference on Port and Ocean Engineering Under Arctic Conditions, Fairbanks, Alaska, USA. August 17-22, 1987.
Service (MMS) has funded a variety of studies of man-induced noise effects on marine mammals of the Alaska Outer Continental Shelf (OCS). Within the context of pertinent legislation, MMS identified the various sources of noise associated with offshore oil and gas activities and designed studies to examine potential effects. One under- lying basis for selection of research topics to date has been application of a key- species approach (described in Cowles and Im, 1980). In many cases, the results of these studies have been used in management decisions such as formation of regulations or mitigating measures. This has affected the way industry has been permitted to operate in the Bering, Chukchi, and Beaufort Seas. We briefly review study efforts and link significant findings with management decisions.
General Review of Past MMS Noise- Effects Studies
Of the several noise sources from offshore oil and gas activities, some of the most common ones are ships (icebreakers, drillships, geophysical ships, conventional and icebreaking ships), work boats, aircraft (fixed wing and rotary wing), dredges, drill- ing rigs, production rigs, and pipelines--used either directly in drilling and production activities or

indirectly in support of such opera- tions. For clarity of discussion, the studies and respective marine mammal species are discussed below by noise- source categories.
Aircraft: Starting in 1980, bowhead whales (Balaena mysticetus) were studied in the presence and absence of industrial stimuli; as a part of this research, bowhead whale behavior in response to fixed-wing and helicopter noise was studied under different operating conditions. Overt reactions to the fixed- wing observation aircraft were sometimes conspicuous when the aircraft was below 457 m a.s.1.. uncommon at 457 m, and generally undetectable at 610 m (Richardson, 1983, 1985).
With helicopters, no overt responses at approximately 153 m a.s.1. were noted during two field experiments and three opportunistic observations from 1981 through 1984. No significant changes in blow intervals were found; thus, there is no conclusive evidence that single helicopter passes (at greater than 153 m a.s.1.) disturb bowhead whales that are below the surf ace.
Malme et al. (1983, 1984) per- formed systematic studies of whale responses to aircraft and reported that gray whales (Eschrichtius robustus) tended to avoid a location where recorded helicopter noise was played back into the water. However, the playback rate of one simulated pass every 10 s to 2 min greatly exceeded typical helicopter-traffic rates along routes to offshore industrial sites (Richardson, 1985).
Boats: Vessel traffic is a major source of potential disturbance to bowhead whales near areas being explored or developed by the petroleum industry. In general, of all the stimuli presented to bowheads in our studies, "small"-boat traffic elicited the greatest variety of responses (Richardson, 1985). The studies showed that bowheads demonstrated a strong or frequent reaction to boats at a dis- tance of 1 to 2 km. Other baleen whales have shown considerable toler- ance of boats but often have avoided
rapidly or erratically moving vessels. Baker et al. (1982) found changes in the respiration rates and diving behavior of humpback whales (Megaptera novaeangliae) when boats were within about 900 m; vessels that approached closely and moved erratically had the greatest effects. Sorenson et al. (1984) found evidence that "squid- eating" toothed and beaked whales were less common near boats than elsewhere; no such effect was found for "fish- eating" cetaceans, including some baleen whales (Richardson, 1985).
The long-term effects of boat disturbance on whales are especially difficult to assess. The MMS hopes to develop some behavioral information regarding bowhead whalelicebreaker interaction as part of future research that is mentioned below.
Dredging: Pertinent research has included both actual noise from dredge operations and playback of dredging noise. For actual dredging, the noise was detectable for at least several kilometers; and bowheads seemed to behave normally within the ensonified zone. For playbacks, bowheads responded to strong dredge noise even when the noise level was increased gradually over time.
Drilling: Bowheads have been studied near operating drillships, well within the zone where drillship noise is clearly detectable. General activities of these animals seemed normal; and there was no conclusive evidence that the noise affected surfacing, respira- tion, or dive cycles.
The sightings near drillships showed tolerance of drilling but did not prove that bowheads are unaffected by drillships. Playback experiments showed that some bowheads reacted, although not strongly, to drillship noise at intensities equivalent to several kilometers from a real drillship (Richardson, 1985). The results for summering bowheads were generally consistent with reactions of migrating gray whales to the same drillship noise (Malme et al., 1983, 1984). Migratory gray whales approaching the sound source tended to change speed and course only slightly.

Migratory gray whales were exposed to drillship-noise levels in the 50- to 315-Hz band at levels of 110, 117 and 122 dB re 1 uPa, respectively. Play- back exposure of feeding gray whales did not produce clear evidence of disturbance or avoidance behavior at received levels below 110 dB. Thus, at a conservative 120-dB threshold, a typical drillship would affect feeding gray whales at a range of about 300 m. Other observations indicate that reaction thresholds of bowhead and gray whales to playbacks of drilling noise are similar (Richardson, 1985).
Observations of beluga whale (Delphinapterus leucas) responses to playbacks of oil-drilling sounds indicate that the direction of whale movement and general activity (feeding, traveling) are not greatly affected by these sounds, especially if the sound source is constant. Whales continued to move in the direction they were travelling before playbacks began. On several occasions, beluga whales within 2 km of the sound source appeared to feed during playback experiments. Whales also approached and quickly passed closely by the underwater speaker while sounds were being pro- jected (Stewart, Aubrey, and Evans, 1983).
Now that data are available, the MMS' approach has evolved from the field-experiment phase to the site- specific, predictive modeling of whale response to drilling operations. These studies (discussed later) for post-sale analyses have addressed a diversity of technology actually used in drilling operations in arctic waters.
Production and Pipelines: The MMS has not directly studied these two noise producers but hopes to in the near future by using controlled-playback experiments in the spring lead system near Point Barrow. Research work would be conducted "downstream" of the whale hunting and censusing locations to avoid any disturbance to the whales and subsistence whaling activities. The MMS anticipates that coordination with local organizations will be as impor- tant a component of this study as is the technical work.
Seismic Boats: Studies of endangered whale and seismic boat interactions have been a particularly crucial aspect of the MMS studies program. Actual and potential litigation, seismic- exploration prohibition (e.g., eastern Alaskan Beaufort Sea in 1981), and indirect human effects (e.g., conflicts with aboriginal whaling) have led to complex studies spanning three species (bowhead, gray, and humpback whales) and as many oceanic provinces (Pacific, Bering, and Arctic).
In general, considering the source-level intensity (245-250 dB re 1 uPa) of most airgun impulses, the avoidance responses of the latter species are relatively near-field phenomena. As a result of cooperative studies by MMS-sponsored researchers and geophysical operators, we have found that bowheads in Alaskan waters will not avoid operating seismic boats at ranges farther than 3.5 to 5.0 tan and at received levels less than 160 to 170 dB re 1 uPa (Ljungblad et al., 1985; Richardson, 1985). Migratory gray whale avoidance of operating seismic boats will occur at a received peak pressure level of 164 dB re 1 uPa and at a range of about 2.5 km (Malme et al., 1984). Because this latter gray whale study may have affected sea otters in the study area (USDOI, FWS, 1982), sea otters also were studied. It was found that sea otters displayed little, if any, reaction to a wide array of sound sources, including seismic boats at ranges of 900 m to 1.6 tan. Other studies with smaller airgun experiments showed no clear evidence of avoidance by feeding humpbacks exposed at effective pulse- pressure levels of 172 dB re 1 'uPa (Malme et al., 1985). Feeding gray whales near St. Lawrence Island, Alaska, avoided a single-airgun exposure when average pulse levels reached 173 dB re 1 uPa. In specific ''typical" locations that were analyzed, gray whale avoidance would occur at a range of about 3 km (Malme et al., 1986).
The work summarized above repre- sents the primary information base of past and future decision processes pertaining to offshore seismic
exploration/endangered whale issues.
On-Ice Seismic Exploration: In the late 1970's and early 1980's. analyses of biological data suggested that spring distribution and reproduction of ringed seals may have been affected by on-ice seismic exploration that was conducted primarily by "Vibroseis" methodology. Beginning in 1981, MMS sponsored a series of field experiments and other studies that examined change in ringed seal behavior, ice-lair use, distribution, and the affected acoustic environment. The overall results of these efforts (see Burns and Kelly, 1983; Frost, Burns, and Lowry, 1985) showed that abandonment or altered use of seal lairs occurred mainly within 150 m of seismic lines. Comparison of seal densities, based on aerial or ground surveys, in "seismic" and "control" areas produced mixed results. Detailed radio-telemetry studies of seal behavior (Kelly, Quackenbush, and Rose, 1986) in Kotzebue Sound, Alaska, and further acoustical analyses there (Cummings, Holiday, and Lee, 1984) enhanced our understanding of potential effects on ringed seals. Monitoring studies that addressed regional abun- dance and distribution offshore Alaska were ongoing through spring 1987.
Pre-Lease Decisions Utilizing Noise- Effects Studies
Endangered Species Act Section 7 Consultation: One of the most impor- tant applications of the noise-ef f ects studies has been their relevance to Endangered Species Act (ESA) section 7 compliance, particularly to the evolu- tion of Biological Opinions on proposed lease sales provided to MMS by the National Marine Fisheries Service (NMFS). Early NMFS opinions on pro- posed lease sales in the Beaufort Sea concluded that, "There is too little information to determine whether the lease sale and all resulting activities are likely to jeopardize the continued existence of the bowhead" (USDOC, NOAA, NMFS, 1980). Thus, NMFS asserted that in the face of insufficient information on oil-spill and noise effects, MMS could not clearly avoid jeopardy of the bowhead population. Recently, however, a Biological Opinion on activities in
the same region concluded, "The leasing and exploration phases of Lease Sale 97 are not likely to jeopardize the continued existence of any endangered or threatened marine species" (USDOC, NOAA, NMFS, 1987). In supporting comments pertaining to their assessment of noise effects in the Sale 97 area, NMFS stated, "This opinion is based on the best available information includ- ing noise effects studies on bowhead whales summering in the Canadian Beaufort Sea" (USDOC, NOAA, NMFS, 1987).
In addition to enhancing these generalized analyses, other ESA-related operational consultations have bene- fited. Study recommendations, conser- vation measures, and reasonable and prudent alternatives expressed in Biological Opinions also must take new information into account.
Seismic-Vessel Exploration-Permit Requirements: As mentioned previously, after concern for seismic-vessel effects on the fall migration of bowhead whales reached unprecedented levels in the early 19801s, entire offshore areas of the Beaufort Sea were closed to seismic exploration if whales were known to be present. This approach to seismic-vessel management lowered profit expectations consider- ably, and vessel owners sought relief. Essentially they questioned closures on the basis of presence when effects on whales had not been demon- strated. Subsequently, and with improved information in hand on bowhead responses to seismic boats--especially data determined by acoustically oriented field experiments (Ljungblad et al., 1985; Richardson, 1 9 8 5 ) ~ permits for Beaufort Sea seismic operations were revised under terms that allow exploration beyond known whale-response distances. For example, a seismic permit for Beaufort Sea exploration now typically requires special precautions of the vessel operator during bowhead migrations:
"After the beginning of the whale migration, seismic vessels can operate their high energy sources only when visibility exceeds 3 miles. During periods of fog, darkness, or weather conditions which limit visibility to

less than 3 miles, the seismic sound sources must be shut down. Operations cannot be initiated or resumed until an area with a radius of 5 miles from the vessel is clear of whales. This may require the use of aircraft."
The specific distances referred to are derived primarily from the result of MMS studies that established thres- hold distances related to bowhead whale disturbance.
Probably one of the most publi- cized applications of noise-effects studies in resolving seismic vessel1 endangered whale conflicts was their use in litigation decisions on proposed St. George Basin Lease Sale 70. This area, just north of Unimak Pass in the southern Bering Sea, is suspected habitat of right whales (Balaena glacialis) and is adjacent to the spring and fall primary migration route of gray whales. Following a suit filed to block the sale (Village of False Pass v. Watt, D. Alaska, Cir. No. A83-176) the U. S. District Court, Alaska, ruled (aspects of this ruling were later overturned) that the Secre- tary of the Interior could not execute leases until:
(1) A "Worst-case" analysis of seismic effects on gray and right whales or a supplementary Environmental Impact Statement (EIS) evaluating effects of preliminary seismic exploration was prepared.
(2) The Final Notice of Sale or other order must include restrictions implementing reasonable and prudent alternatives contained in the relevant Biological Opinion or justification that such restrictions are not necessary.
Subsequently, MMS issued a supple- mental EIS that focused heavily on recent studies results and revised restrictions on seismic operations. In obtaining NOAA concurrence on the adequacy of a draft "Notice to Lessees" (NTL) for protecting whales from potential seismic effects, Good (1983) wrote :
"The Minerals Management Service believes these restrictions are more
than adequate to protect gray and right whales. Deep seismic surveys have been conducted in the Bering Sea since the early 1970's. The National Marine Fisheries Service routinely allows deep seismic surveys to come within 20 miles of Unimak Pass during the gray whale
--
d a deep-seismic system, far more powerful than a high resolution system. The whales came as close as three miles to the airguns before 'some possible changes in the swimming patterns of cow-calf pairs were observed. . . ' (Emphasis added .)
As is evident above, important information obtained from a noise- effects study was assimilated directly into the OCS management-decision process. The preliminary results referred to were later reported in Malme et al. (1984). Following the issuance of the NTL and the supple- mental EIS, the case was closed.
On-Ice Seismic Exploration: Similarly, studies results have affected the decision process regarding permits and regulations of on-ice seismic explorations. At first, in the face of substantial uncertainty about the extent of potential effects on ringed seals, conservative management approaches (such as seasonal termina- tion of all seismic activities) were implemented by regulatory agencies. Industry groups were, of course, concerned and sought changes through legislative processes. In 1982, regulations governing the small take of marine mammals incidental to specified activities under section 101(a)(5) of the Marine Mammals Protection Act were proposed to deal specifically with the ringed seal issue. Among information considered (Federal Register, 1982a), NMFS cited the findings of "Burns et al., (1981)" and other results of MMS-sponsored, June 1981 studies. These studies were instrumental in showing that although on-ice seismic activities may affect a small number (less than 1,000) of seals in the area covered by seismic activities, the "taking" would have a negligible impact on the 2.5 million-animal population.

Subsequently, a final rule on the matter (Federal Register, 1982b) was issued to allow "small takes" of ringed seals. This action provided a new framework by which MMS could structure permits for on-ice seismic exploration, and which ultimately enhanced seismic- exploration opportunities while providing appropriate protection for this valued species. We believe that environmental-studies results pertain- ing to the acoustic environment and this issue were particularly instru- mental in resolving this issue.
Mitigating Measures: Much of the various types of information obtained from noise-effects studies has an important but difficult-to-quantify influence on environmental assessment and, ultimately, the lease conditions related to offshore oil and gas development. Many noise-effects issues are now better understood; therefore, environmental analyses (in ESA section 7 consultation, EIS's, and exploration plan reviews) are better supported with scientific results. Almost all Alaska lease sales are now accompanied by NTL's formulated on the basis of noise-effects-studies results.
Post-Lease Decisions Utilizing Noise-Effects Studies
ESA Section 7 Consultation: Biological Opinions on pre- and post- lease operations--issued by NMFS after consultation with MMS--are phased and, as such, have been recognized by the Federal courts. Prior to any approval of post-lease development plans, consultation between MMS and NMFS will have occurred and the resulting Biolog- ical Opinion, which takes into account noise studies available up to that time, will have been prepared.
Monitoring: For several years industry has been required to have in place a whale-observation program while conducting exploration-drilling activi- ties during the bowhead migration. Seasonal drilling restrictions have been waived if appropriate studies are ongoing and if industry has met other requirements. The determination of Zones of Influence (21) around opera- tions within which bowhead whales are
considered likely to react to acoustic stimuli has provided a frame of refer- ence for these observation programs. These are challenging studies to design and carry out, since there are many uncontrolled variables, i.e., the changing acoustic environment, the changing chemical and physical environ- ments, and the changes in whale behavior due to factors that cannot be differentiated from man-induced changes. McLaren et al. (1986) is an example of an industry-sponsored monitoring study; other studies are in progress. The MMS continues to provide regionwide aerial monitoring that shares data with site-specific studies.
Mitigating Measures: There have been several mitigating measures utilized on the Alaska OCS that are directly related to the potential for acoustic disturbance of whales, other marine mammals, and birds. These studies usually involve reconmending horizontal and vertical separation of operations from individual animals or aggregations, as well as cessation of activities until the animals have departed a 21.
Post-Sale Environmental Assess- ment: One study designed for post-sale - application is "Prediction of Drilling Site-Specific Interaction of ~ndustriai Acoustic Stimuli and Endangered Whales in the Alaskan Beaufort Sea." In order to enhance environmental assessment predictive techniques and accuracy, this study measured sound character- istics at drilling sites and used models derived from previous studies to predict response zones. Results will be useful in future exploration-plan reviews and other post-sale applications.
The MMS recently contracted to study the Davis Strait bowhead stock, which is relatively pristine and free from man-induced noise disturbance, with the goal to compare the "normal" behavior of those whales to the "normal" behavior of the Western Arctic stock. The latter stock has been exposed to human activities in both Canadian and U.S. Beaufort Seas over 10 years. We may be able determine if cumulative human disturbance effects are evident in
the for to
and the
Western Arctic bowhead stock.
Future Needs and Applications
The MMS is presently preparing to perform a study on the "Effects of Production Activities on Bowhead Whales" in the Chukchi and Beaufort Seas to determine if bowhead whales will be affected by noise in their spring migration along the Chukchi coast (near Point Barrow) and into the Beaufort Sea. This study will help us to find another answer to the long list of acoustic-stimuli questions associ- ated with the spectrum of oil and gas operations. These studies usually require more than 1 year to arrive at satisfactory findings.
Even with the completion of this study, there are other noise-effects studies that may be required in the future. One of the compelling reasons for this lack of specificity is that many results are not derived from easily controlled experiments. The MMS generally is working on wild, protected species in a harsh environment--not capturing and lab testing large marine mammals or other protected species. Instead, reliance on field observations by trained experts who also can measure acoustic parameters is required. Team approaches will continue to be used to establish the degree of relationship between offshore operations and wildlife . Conclusion
Over the past several years, MMS has commissioned an array of stuuies dealing with noise disturbance. Results from many of these studies have influenced important decision processes to protect marine mammal and bird populations while simultaneously fostering orderly oil and gas resource development.
Literature Cited
Baker, C.S., L.M. Herman, B.G. Bays, and W.F. Stifel. 1982. The Impact of Vessel Traffic on the Behavior of Humpback Whales in Southeast Alaska. Unpublished report prepared by Kewalo Basin Marine Mammals Lab. , Honolulu, HI, for USDOC, NOAA, National Marine
Mammals Laboratory, Seattle, WA. 39 PP . Burns, J.J. and B.P. Kelly. 1983. Studies of Ringed Seals in the Alaskan Beaufort Sea During Winter: Impacts of Seismic Exploration. Annual Report, Outer Contimental Shelf Environmental Assessment Region (OCSEAP) Research Unit (RU) 232.
Cowles, C. J. and J.L. Imm. 1980. Endangered Species Research: A Rationale for the Selection of a Research Strategy. In: Proceedings of the Interagency ~ e e t i n ~ to Review, Coordinate, and Plan Bowhead Whale Research, other Cetacean Research, and Related Research Bearing Upon the Con- servation and Protection of Endangered Marine Species in Alaska and Elsewhere. USDOI, Bureau of Land Management. pp. 69-79.
Cummings, W.C., D.V. Holliday, and B.J. Lee. 1984. Potential Impacts of Man-Made Noise on Ringed Seals: Vocalizations and Reactions. Environ- mental Assessment of the Alaskan Continental Shelf. Final Report of Principal Investigators, RU 636. Tracer Doc. No. T-84-06-008-U. 124 pp.
Federal Register. 1982a. Regulations Governing Small Takes of Marine Mammals Incidental to Specified Activi- ties, 47(42):9027-9030 (March 3, 1982).
Federal Register. 1982b. Regulations Governing Small Takes of Marine Mammals Incidental to Specified Activi- ties, 47(96):21248-21259 (May 18, 1982).
Frost, K.J., J.J. Burns, and L.F. Lowry. 1985. Distribution, Relative Abundance, and Potential Displacement of Ringed Seals in Alaska. Abstract from the Proceedings of the Sixth Biennial Conference on the Biology of Marine Mammals.
Good, A.H. 1983. Letter from A.H. Good, Associate Solicitor, Energy and Resources, USDOI, to Dr. Anthony J. Calio, Deputy Administrator, USDOC, NOAA; dated May 13, 1983.

Kelly, B.P., L.T. Quakenbush, and J.R. Rose. 1986. Ringed Seal Winter Ecology and Effects of Noise Disturb- ance. Environmental Assessment of the Alaskan Continental Shelf. Final Report of Principal Investigators, Part 2, RU 232. 83 pp.
Ljungblad, D.K., B. Wursig, S.L. Swartz, and J.M. Keene. 1985. Obser- vations of the Behavior of Bowhead Whales (Balaena mysticetus) in the Presence of Operating Seismic Explora- tion Vessels in the Alaskan Beaufort Sea. OCS Study MMS 85-0076. Report prepared by SEACO, Inc. Anchorage, AK: USDOI, MMS, Alaska OCS Region. 51 pp.
Malrne, C.I., P.R. Miles, C.W. Clark, P. Tyack, and J.E. Bird. 1983. Investi- gations of the Potential Effects of Underwater Noise from Petroleum Indus- try Activities on Migrating Gray Whale Behavior. Report No. 5366 prepared by Bolt, Beranek, and Newman, Inc., Cambridge, MA, for USDOI, MMS, Alaska OCS Region, Anchorage, AK. 134 pp.
Malme, C.I., P.R. Miles, C.W. Clark, P. Tyack, and J.E. Bird. 1984. Investi- gation of the Potential Effects of Underwater Noise from Petroleum Indus- try Activities on Migrating Gray Whale Behavior, Phase 11. January 1984 Migration. Report No. 5586 prepared by Bolt, Beranek, and Newman, Inc., for USDOI, MMS, Alaska OCS Region, Anchorage, AK. 185 pp.
Malme, C.I., P.R. Miles, P. Tyack, C.W. Clark, and J.E. Bird. 1985. Investi- gation of the Potential Effects of Underwater Noise from Petroleum Indus- try Activities on Feeding Humpback Whale Behavior. Report No. 5851 prepared by Bolt, Beranek, and Newman, Inc., for USDOI, MMS, Alaska OCS Region, Anchorage, AK. 100 pp.
Malme, C.I., B. Wursig, J.E. Bird, and P. Tyack. 1986. Behavioral Responses of Gray Whales to Industrial Noise: Feeding Observations and Predictive Modeling. Environmental Assessment of the Alaskan Continental Shelf. Final Report of Principal Investigators, RU 675. BBN Report No. 6265. 164 pp.
McLaren, P.L., C.R. Greene, W.J. Richardson, and R.A. Davis. 1986.
Bowhead Whales and Under-Water Noise Near a Drillship Operation in the Alaskan Beaufort Sea, 1985. Report prepared by LGL Limited and Greenridge Sciences for UNOCAL Corp. 137 pp.
Richardson, W.J., ed. 1983. Behavior, Disturbance Responses, and Distribution of Bowhead Whales, Balaena mysticetus, in the Eastern Beaufort Sea. 1982. Unpublished report prepared by LGL Ecological Research Associates, Inc., Bryan, TX, for USDOI, MMS, Reston, VA. 357 pp.
Richardson, W.J., ed. 1985. Behavior, Disturbance Responses, and Distribution of Bowhead Whales, Balaena mysticetus, in the Eastern Beaufort Sea. 1980-84. OCS Study MMS 85-0034. Prepared by LGL Ecological Research Associates, Inc., for USDOI, MMS. 306 pp.
Sorensen, P.W., R.J. Medved, M.A.M. Hyman, and H.E. Winn. 1984. Distribu- tion and Abundance of Cetaceans in the Vicinity of Human Activities Along the Continental Shelf of the Northwestern Atlantic. Marine Environmental Research 12:69-81.
Stewart, B.S., F.T. Awbrey, and W.E. Evans. 1983. Beluga Whale, Delphinapterus leucas, Responses to Industrial Noise in Nushagak Bay, Alaska: 1983. Environmental Assessment of the Alaskan Continental Shelf. Final Report of Principal Investigators, RU 629. Hubbs-Sea World Research Institute, Technical Report No. 83-161. 9 pp.
USDOI, FWS, 1982. Section 7 Consulta- tion (1-1-83-F-1). Studies on Southern Sea Otter Response to Acoustic Stimuli. December 14, 1982. 6 pp.
USDOC , NOAA, NMFS. 1980. Endangered Species Act Section 7 Consultation - Biological Opinion for Proposed Outer Continental Shelf Oil and Gas Lease Sale in the Nearshore Beaufort Sea and All Resulting Activities (Sale BF). June 24. 1980. 19 pp.
USDOC, NOAA, NMFS. 1987. Endangered Species Act Section 7 Consultation and Biological Opinion for Oil and Gas Leasing and Exploration - Beaufort Sea Sale 97. May 20, 1987. 22 pp.
UNRESOLVED ASPECTS CONCERNING THE INFLUENCE OF NOISE ON MARINE MAMMALS
J . M . Terhune University of New Brunswick, Saint John, New Brunswick, CANADA
Abstract
The importance and utilization of underwater sounds in the lives of marine manuals varies greatly. Some species are virtually silent and inhabit areas where sound transmission is possible over only short distances. Other species vocalize year round and inhabit areas where sounds can be detected at great distances. The detection of purposefully produced vocalizations and natural "noises" can, in theory, be measured or predicted using current knowledge and technology. The influence of man-made sounds on the detection of "natural" sounds can be determined. While noise exposure models can be constructed, these models will be restricted to the detection of sounds. The myriad of possible consequences of industrial noises masking natural sounds anchor introducing frightening acoustic stimuli is largely unknown. Until the role of sound in a natural setting is known for a species, it will be difficult to predict (or measure) the in luence of a perturbed situation. Efforts must be made to link short and
This is a reviewed and edited version of apaperpresented at the Ninth International Conference on Port and Ocean Engineering Under Arctic Conditions, Fairbanks, Alaska, USA, August 17-22, 1987. Q The Geophysical Institute, University of Alaska, 1987.
long- term life history factors with noise exposure models. This will require the development of new approaches and technologies as well as utilization of available techniques.
Introduction
There is great variability in the prevalence and nature of underwater vocalizations of marine mammals. The very long range calls of some cetaceans (Payne and Webb, 1971) contrast markedly with the echo-location pulses of others. Presumed communicative vocalizations of seals exhibit much variability. Weddell seals (Leptonychotes weddelli) call throughout the year, over long distances and have a wide variety of call types (Thomas and Kuechle, 1982) . The harbor seal (Phoca vitulina), however, is almost silent. Fig. 1 illustrates the variable nature of the vocal behavior of a few phocids. Using the nature of the vocal activities as an index, it would follow that the importance of underwater comnunication to the species also varies greatly. To seme extent, this diversity may reflect the acoustical properties of the areas which the various species inhabit. For example, harbor seals frequent coastal areas which are characterized by very shallow water, irregular bottom features, islands, turbidity, upright vegetation in the
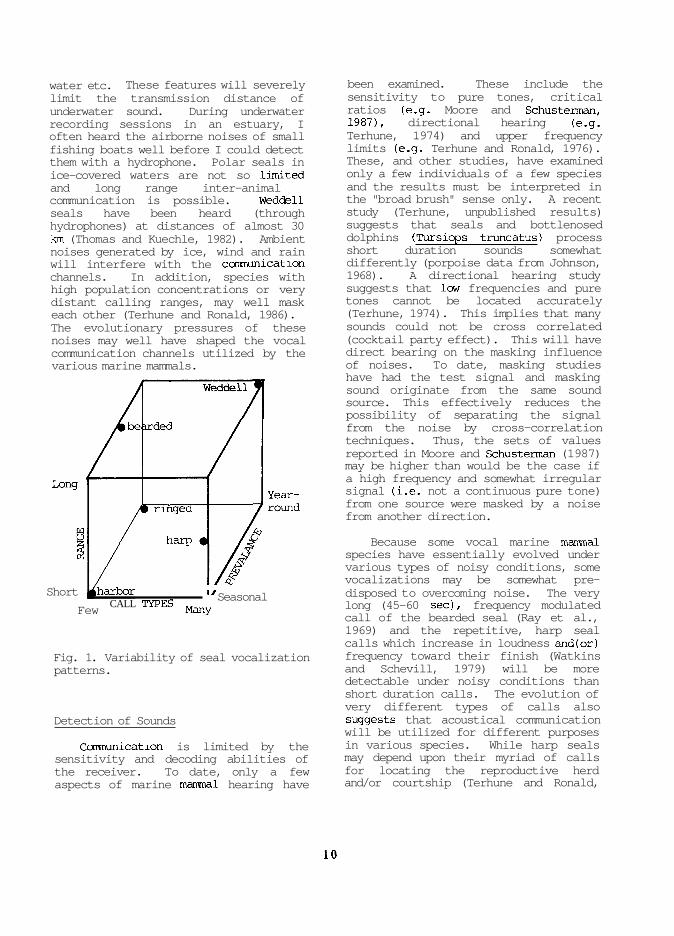
water etc. These features will severely limit the transmission distance of underwater sound. During underwater recording sessions in an estuary, I often heard the airborne noises of small fishing boats well before I could detect them with a hydrophone. Polar seals in ice-covered waters are not so limited and long range inter-animal communication is possible. Weddell seals have been heard (through hydrophones) at distances of almost 30 km (Thomas and Kuechle, 1982). Ambient noises generated by ice, wind and rain will interfere with the cmunication channels. In addition, species with high population concentrations or very distant calling ranges, may well mask each other (Terhune and Ronald, 1986). The evolutionary pressures of these noises may well have shaped the vocal communication channels utilized by the various marine mammals.
Weddell
Ñ
Short bharbor w
Few CALL TYTnP
Seasonal "ria
Many
Fig. 1. Variability of seal vocalization patterns.
Detection of Sounds
Cmunication is limited by the sensitivity and decoding abilities of the receiver. To date, only a few aspects of marine mama1 hearing have
been examined. These include the sensitivity to pure tones, critical ratios (e.g. Moore and Schusterman, 1987), directional hearing (e.g. Terhune, 1974) and upper frequency limits (e-g. Terhune and Ronald, 1976). These, and other studies, have examined only a few individuals of a few species and the results must be interpreted in the "broad brush" sense only. A recent study (Terhune, unpublished results) suggests that seals and bottlenosed dolphins (Tursiops truncatus) process short duration sounds somewhat differently (porpoise data from Johnson, 1968). A directional hearing study suggests that lew frequencies and pure tones cannot be located accurately (Terhune, 1974). This implies that many sounds could not be cross correlated (cocktail party effect). This will have direct bearing on the masking influence of noises. To date, masking studies have had the test signal and masking sound originate from the same sound source. This effectively reduces the possibility of separating the signal from the noise by cross-correlation techniques. Thus, the sets of values reported in Moore and Schustennan (1987) may be higher than would be the case if a high frequency and somewhat irregular signal (i.e. not a continuous pure tone) from one source were masked by a noise from another direction.
Because some vocal marine mama1 species have essentially evolved under various types of noisy conditions, some vocalizations may be somewhat pre- disposed to overcoming noise. The very long (45-60 sec), frequency modulated call of the bearded seal (Ray et al., 1969) and the repetitive, harp seal calls which increase in loudness and(or) frequency toward their finish (Watkins and Schevill, 1979) will be more detectable under noisy conditions than short duration calls. The evolution of very different types of calls also suggests that acoustical communication will be utilized for different purposes in various species. While harp seals may depend upon their myriad of calls for locating the reproductive herd and/or courtship (Terhune and Ronald,

1986), ringed seals may utilize sounds in association with territorial defense (Stirling, 1973).
There are many unanswered questions concerning the capabilities of marine manmals to detect and recognize various sounds. Until further information can be obtained, we can only utilize extrapolations from other species or assume that the various systems are noise limited and thus may be inferred from an examination of ambient noises. Sound detection thresholds of baleen whales clearly must be dealt with in this latter manner. Many technically difficult problems could be investigated and reasonable approximations on the limits of detectability or recognition generated. For example, equal loudness curves would permit the establishment of "weighting curves" similar to the "A, B, and C" curves established for humans. This would be inportant in assessing perceived levels of sounds. Because high frequencies are absorbed to a greater extent than low frequencies, the spectrum of vocalizations will change with distance. Thus, Weddell seal vocalizations of 30 km distance will sound appreciably different than the same calls at close range. This is analogous to the human situation of hearing someone speaking on the telephone. In the Weddell seal case, the researchers could identify the calls of seals 30 krn away. We do not know at what distance the sounds would be detectable, and still recognizable, to the seals however. The question of which statistical level to use when considering the influence of ambient noises must also be addressed. If the sound levels can be accurately described, it should be possible to consider the various proportions of noise and quiet periods. In some instances, the term "ambient signal" may better describe the ambient "noise" as the marine mammal may be obtaining some information relating to navigation, location of open water etc. by listening to specific sounds. Although many experiments examining these and similar questions would be costly and time consuming to perform, they are
technically possible and will likely be completed in due time.
Situation of the Listener
The problem of assessing possible consequences of industrial noises is made particularly difficult because it not only requires information on the noise but also on the situation of the listener. In the human case, public protests concerning airport noises are ccinmon and have resulted in the initiation of a number of mitigative measures specifically aimed at reducing the absolute noise levels and timing of the noises. Many humans, however, are kncwn to actively seek out or voluntarily tolerate dangerously loud sounds. Persons attending "rock concerts" or patronizing a bar that has entertainment, tolerate noise levels that are known to cause permanent hearing loss. The disturbing noises generated by a late night party may depend upon whether or not you were invited!
High frequency acoustic scaring devices have been employed to protect fish or crops from mammalian and avian pests. These devices have generally been found to be ineffectual against rodents and rabbits (Wilson and McKillop, 1986) and harbor seals (Geiger, 1985) . Although these devices shew some initial success, the mammals in question may habituate to the sound, have different initial tolerance levels and/or the intensity involved does not cause unconditioned aural pain (Geiger , 1985). In the case of using a sound deterrent device to protect salmon caught in gill nets, the sound may frighten the seals and sea lions away initially but, without further negative reinforcement, may come to serve as a dinner bell. Harbor seals that haul out onto offshore rocks in the Bay of Fundy, Canada, have habituated to traffic noises from a road a half kilometer away. The seals remained on the haul-out site when large transport trucks went by but raced to the water when a researcher inadvertently s l m d a car door. These seals have a regular

haul-out cycle and will tend to return to the rocks if a disturbance occurs early in the cycle, but will remain in the water if they are disturbed late in the cycle. Thus sounds which will frighten marine mamnals in the short term are variable and the context in which the sound important.
Frightening Sounds
Some sounds (and can generate extreme Very loud noises may
is detected is
related activities) fear in a manmal. terrorize an animal
and result in long-lasting behavioral changes. For example, many dogs and other domestic animals are known to be frightened of thunderstorms or to become "gun-shy". I have observed instances in which harbor seals have been shot at and subsequently vacated a haul-out ledge for a month or so. Overall, however, seals in the Bay of F'undy have cone to tolerate much human-related disturbance. During daylight, they are constantly vigilant when hauled-out , while (protected) harbor seals in California are thought to sleep (Terhune, 1985). Harbor seals return to the Bay of F'undy each spring following an annual migration to the United States (where they are legally protected). In spite of being purposefully harassed, these seals remain in the area and don't swim back to the U.S.A. (which they could do in a day or two). Over time, through genetic selection, a marine mammal population may become more tolerant of disturbance than their ancestors. Through more active selection, a similar situation has occurred with domestic animals.
Life History Linkage with Noise Exposure
The role of acoustical communication (both active and passive) in the lives of marine manmals must be known to properly utilize a noise exposure model. The variability of marine mama1 vocalizations suggest that it would be necessary to construct species specific noise exposure models. Once the normal situation is properly determined and the noise model constructed, the final step
(and probably most difficult) will be to assess the situation with regard to various life history parameters. That is, the receiver end of the noise exposure model must be calibrated. Various studies have noted short-term behavioral responses. Will the noise exposure be reflected in long term recruitment, mortality, longevity and/or distribution of the species? Life history studies will, more likely, reflect the influence of a number of perturbatinq factors simultaneously. It may not be possible to detect an influence resulting frcm a single mode of disturbance. Another unknown is the cumulative effect of stresses (Geraci and St. Aubin, 1980 ) . A multi-faceted increase in human activity in an area could possibly result in a greater overall impact than would be predicted by the sum of all the impacts of individual factors. The myriad of caplex interactions may mask all but the most extreme problems.
Life history studies of all marine manual species are far from complete. There is still controversy over the population estimates of harp seals (Holt, 1987) even though this is probably one of the best known of all marine mama1 populations. Technical problems of locating the animals and the wide range of variation associated with food, ice conditions, weather, age structures, etc. result in population assessment with large standard errors. Marine manmal studies are occasionally confounded by the secrecy associated with naval operations and studies. The routes and noises produced by many vessels (e.g. nuclear submarines) are known but not available to the public. Assessment of a noise disturbance model would begin with an unknown amount of disturbance already occurring.
In spite of all of the problems noted above, it should be possible to relate sane life history factors to a noise exposure model. This would require a long term set of species by species studies conducted by a stable, experienced workforce. Until such studies link biological consequences to

noise exposures, the value of noise exposure models will be marginal at best.
References
Geiger, A.C. 1985. Evaluation of seal harassment devices to protect salmon in gillnet fisheries. Abstract. "Sixth - Biennial Conference on the Biology of Marine ~ammals,"Vancouver, B.C.
Geraci, J.R., and D.J. St. Aubin. 1980. Offshore petroleum resource development and marine mammals: a review and research recommend- ations. Mar. Fish. Rev. 42: 1-12.
Holt, S.J. 1987. Letter to the editor. Bulletin, Can. Soc. Zool. 18: 9.
Johnson, C.S. 1968. Relation between absolute threshold and duration-of tone pulses in the bottlenosed porpoise. J. Acoust. Soc. Amer. 43: 757-763.
Sterlinq, I. 1973. Vocalization in the ringed seal (Phcca hispida). J. Fish. Res. Bd. Can. 30: 1592-1594.
Ray, C., W.A. Watkins and J. J. Burns. 1969. The underwater sonq of Erignathus (bearded seal ). Zoologia 54: 79-83.
Terhune, J.M. 1974. Directional hearinq of a harbor seal in air and water. J. Acoust. Scc. Amer. 56: 1862-1865.
Terhune, J.M. 1985. Scanning behavior of harbor seals on haul-out sites. J. Mammal. 66: 392-395.
Terhune, J.M. and K. Ronald. 1976. The upper frequency limit of ringed seal hearing. can. J. Zool. 54: 1226-1229.
Terhune, J.M. and K. Ronald. 1976. Distant and near range functions of harp seal underwater calls. Can. J. Zool. 64: 1065-1070.
Thomas, J.A. and V.B. Kuechle. 1982. Guantitative analvsis of Weddell seal (Leptonych;tes weddelli) underwater vocalizations at
breeding season. J. Acoust. Soc. Amer. 66: 983-988.
Wilson, C.J. and I.G. McKillop. 1986. An acoustinq scaring device tested against European rabbits. Wildl. Soc. Bull. 14: 409-411.
Discuss ion
B. MORRIS: Would you s p e c u l a t e on t h e purpose of bearded s e a l v o c a l i z a t i o n s ? You s t a t e d t h a t bearded s e a l s have o n l y one t y p e of c a l l t h a t t h e y u s e yea r- round.
J. TERHUNE: Watkins and Burns (Zoologica 54:79-83, 1969) b e l i e v e t h a t t h e males c a l l c u r i n g t h e b reed ing season t o p roc la im t e r r i t o r y and ( o r ) b r e e d i n g c o n d i t i o n . At o t h e r t imes of t h e y e a r t h e s e a l s a r e a p p a r e n t l y s o l i t a r y . C a l l s may t h e n a c t a s a means by which t h e s e a l s can space themselves and n o t i n a d v e r t e n t l y c l u s t e r i n a n a r e a . The c a l l s might a l s o pe rmi t t h e an imals t o s t a y i n c o n t a c t (an a c o u s t i c h e r d ) even though d i s p e r s e d .
S. TREACY: Do h a r b o r s e a l s echo- loca te?
J. TERHUNE: I d o n ' t t h i n k s o . The s e a l s do n o t emi t t r a i n s o f c l i c k s which would enhance t h e amount o f i n f o r m a t i o n t h e y cou ld g a t h e r . I d o n ' t b e l i e v e t h a t e m i t t i n g a s i n g l e c l i c k would work, e s p e c i a l l y on a moving t a r g e t .
McMurdo Sound, Antarctica. J. Acoust. Soc. Amer. 72: 1730-1738.
Watkins, W.A. and W.E. Schevill. 1979. Distinctive characteristics of underwater calls of the harp seal, Phoca groenlandica, during the


EFFECTS OF INDUSTRIAL ACTIVITIES ON RINGED SEALS IN ALASKA, AS INDICATED BY AERIAL SURVEYS
Kathryn J. Frost Lloyd F. Lowry
Alaska Department of Fish and Game, Fairbanks, Alaska, USA
Abstract
The preferred pupping habitat of ringed seals (Phoca hispida) is the stable shorefast ice which also provides a convenient platform for some types of industrial activity. Concern for the possible effects of on-ice industrial activities on ringed seals has resulted in restrictions on industry and in research to evaluate the problem. Aerial surveys were conducted in 1970, 1975-77, and 1981-82, and the data were used to compare ringed seal abundance in "industrial" and "control" areas. Results were equivocal and sometimes contradictory.
In 1985-87 a major program of aerial surveys was conducted to monitor the ringed seal population off Alaska and to continue investigating possible effects of industrial activities. Studies around artificial islands in the central Beaufort Sea suggest some displacement of seals within 2 nm (nautical miles) of the islands. Comparisons of industrial and control blocks indicated that seals were more
This is a reviewed and edited version of apaper presen ted at the Ninth International Conference on Port and Ocean Engineering Under Arctic Conditions, Fairbanks, Alaska, USA, August 17-22, 1987.
abundant in the industrial block whether or not industrial activity had occurred. Historical data indicate that seal density in the Beaufort Sea was high in 1975, decreased greatly by 1977, and has subsequently increased. Although these trends correlate with levels of industrial activity (high in the late 1970's and early 1980ts, then decreasing greatly in 1985-87), the changes occurred in areas both with and without activity and are, therefore, probably due to some other cause. Other studies in addition to aerial surveys are needed in order to understand ringed seals and how they may be affected by human activities.
Introduction and Background
Ringed seals (Phoca hispida) are the most abundant marine mammals found in seasonally ice-covered waters of northern Alaska. These seals are an important subsistence species for coastal residents of northern Alaska and are a major ecological component of the arctic and subarctic marine fauna. They prey on small fishes and crustaceans (Lowry et al. 1980) and are the major prey of polar bears (Ursus maritimus) (Smith 1980). Ringed seals compete for food with other pinnipeds, as well as seabirds, arctic cod (Boreogadus saida),

and bowhead whales (Balaena mysticetus) (Lowry et al. 1978-t and Lowry 1984).
Ringed seals normally spend winter and spring on and under extensive unbroken shorefast ice. They maintain breathing holes through the shorefast ice, and in spring bear their young in subnivean lairs on top of the ice (Smith and Stirling 1975). The shorefast ice also provides a convenient platform on which various aspects of petroleum development can be conducted, including construction and maintenance of winter ice roads and airstrips, and seismic exploration. Areas most suitable for industrial activity may also support relatively high densities of ringed seals.
In June 1970, Burns and Harbo (1972) conducted the first extensive aerial surveys of ringed seals in shorefast ice areas of the Chukchi and Beaufort seas. The principal objectives of the research were to develop survey techniques and to gather baseline information on ringed seal distribution and density. However, since seismic exploratory activities were ongoing in the study area, an attempt was made to determine whether the surveys could detect any effect of seismic activities on seal distribution. (Profiling was conducted using dynamite charges - maximum charge of 50 pounds - buried a minimum of 1 foot per pound, with a minimum burial of 20 feet to generate seismic waves which were used to determine subsurface geological profiles. In waters deeper than 3 fathoms, activities were terminated on 15 March.) Locations of seismic lines were plotted and "undisturbed" and "disturbed" areas in the central Beaufort Sea were chosen for analysis. Comparisons based on surveys flown on 9 June showed a slightly higher density in the disturbed area while the reverse was true on 13 June. Based on their data, the authors concluded that seismic operations such as were being conducted under state regulations had not appreciably displaced ringed seals.
From 1971 to 1974, ringed seal surveys were not conducted. During that time development of alternative seismic
energy sources other than explosives was encouraged. Surveys conducted using air-guns and vibroseis equipment were allowed to operate in water deeper than 3 fathoms after the 15 March cutoff date.
Extensive aerial surveys were again conducted in June of 1975, 1976, and 1977, principally to investigate the possible magnitude of annual fluctuations in ringed seal abundance along the Beaufort Sea coast (Burns and Eley 1978). Specific tests of the effects of on-ice human activities were not included in the survey design since the objective was an extensive, broad-scale assessment of abundance. However, a substantial increase in on-ice seismic activity was evident both to permitting agencies and to ringed seal survey personnel, and a request was therefore made to use these data to compare seal densities in areas with and without extensive seismic survey activity. The comparisons consistently showed a lower density of seals in "seismic areas" than in adjacent "controls." The magnitude of this difference ranged from 227 to 88% with an average difference of 51% for the 3 years (Burns and Kelly 1982). Therefore, the best available data indicated that displacement was occurring, and beginning in 1979 a cutoff date of 20 March was imposed on operations in water deeper than 3 fathoms. The cutoff date was intended to avoid disturbance of ringed seals during the primary pupping period. However, it had a severe impact on industry by restricting the potential duration of their operations and eliminating the optimum working period in terms of daylight, weather, and ice conditions. Therefore, in 1981 a program began as part of the Outer Continental Shelf Environmental Assessment Program to clarify and quantify the possible impacts of on-ice seismic exploration on ringed seals. Intensive aerial surveys were one component of that program.
From 2 to 9 June 1981, 12 aerial survey flights were conducted in the Beaufort Sea with emphasis on areas of intense seismic activity (Burns et al. 1981). On 3 days, surveys were flown
directly along seismic shot lines and on "control" lines which were parallel to and midway between the seismic lines. On 2 days, seal density was higher on the control lines, while on the third, density was higher on the seismic lines. Comparisons similar to those previously done for 1975-77 data were also made between 2 sets of seismic and adjacent control blocks. In both cases, seal densities were virtually identical in the seismic and control blocks.
From 26 May to 4 June 1982, aerial surveys were again flown along seismic lines and on control lines midway between the seismic lines (Burns and Kelly 1982). Statistical comparisons were made of the density of seals on seismic and control lines for 8 flights made on 7 days. A significant difference was found in only 1 comparison, and in that case seal density was higher on the seismic transects than on the controls. There were no significant differences when data for all flights were combined.
While the results were sometimes equivocal or even contradictory, these studies, in aggregate, indicated that on-ice seismic activity of the type and intensity conducted at that time did not result in large-scale displacement of ringed seals in the central Beaufort Sea. However, the fact remained that ringed seals are abundant and ecologically important along the Chukchi and Beaufort sea coasts, and that their preferred pupping habitat, the shorefast ice, also provides a convenient platform for industrial activities. There was a clear need to develop accurate and repeatable techniques for assessing ringed seal abundance, as well as to determine what factors influence ringed seal distribution. Therefore, beginning in 1985, the Minerals Management Service through the National Oceanic and Atmospheric Administration Outer Continental Shelf Environmental Assessment Program funded a 3-year study to monitor the ringed seal population off Alaska and to continue investigating the possible effects of industrial activities on ringed seals. The results of that study are presented in this paper.
Methods
Aerial survey design
In order to gather the type of baseline data needed for a monitoring program, we chose to conduct an extensive survey covering all of the shorefast ice between Kotzebue Sound and Barter Island. The study area was divided into 11 sample units that corresponded to sectors used in previous surveys (Burns and Harbo 1972; ADF&G unpubl.). Sector boundaries were marked by identifiable landmarks such as capes, points, villages, or radar installations (Figure 1). Surveys were conducted over the shorefast ice between 20 May and 16 June, beginning in Kotzebue Sound and proceeding north and east to Barter Island. The Chukchi Sea was surveyed from 20 to 31 May, and the Beaufort Sea from 27 May to 16 June, to coincide with ice conditions which were optimal for sighting seals and with the peak period of seal haul-out.
The surveys were flown between 1000 and 1600 hours true local time, the time of day when maximum numbers of seals are known to haul out (Burns and Harbo 1972; Smith and Hammill 1981). The obser- vation platform was a Twin Otter aircraft equipped with oversize bubble windows, radar altimeter, and Omega-GNS 500 Global Navigation System, flown at a true ground speed of 110-130 knots. Survey altitude was usually 500 ft in the Chukchi Sea and 300 ft in the Beaufort Sea.
Strip width varied according to altitude and was determined by pre-calculated inclinometer angles which were marked on the windows. At 500 ft, the transects began 0.125 nm out from the centerline and extended out to 0.5 nm for a net width of 0.375 nm (2,250 ft). At 300 ft, the inclinometer angles remained the same and the effective strip width was reduced to 0.225 nm (1,350 ft). Two observers sat on either side of the aircraft just forward of the wings. A third person recorded beginning and ending points of transects, ice conditions, and weather. Each observer counted the seals in the strip on his or her side of the aircraft and also made note of industrial

BEAUFORT SEA t CHUKCHI SEA
ALASKA
Kolfbuf Sound FAST ICE / PACK ICE
EDGE
activity such as artificial islands, ice roads, seismic lines, and airstrips. All data were recorded by 1-minute intervals.
The survey was flown according to a stratified random strip transact design, with transects spaced 2 nm between centerlines. Transects were flown along lines of latitude in the Chukchi Sea and lines of longitude in the Beaufort Sea, from shore to the approximate seaward edge of the shorefast ice. Within each sector, 60% of the possible transects were randomly selected and flown; in some sectors all or some of the selected lines were replicated for comparative purposes.
Data analysis
Counts of seals at cracks and at holes were added separately for each 1-minute interval. The lengths of transects were calculated from beginning and ending GNS positions and divided by total elapsed time to obtain ground speed. The area surveyed per minute interval was calculated by multiplying speed by strip width. Each minute interval, therefore, was assigned data on latitude and longitude (of the beginning point), area (nm2), local
Figure 1. Map of northern Alaska showing sectors used for design and analysis of ringed seal aerial surveys, and an example of lines flown during a survey.
time, counts of seals at holes and at cracks, and ice and weather conditions.
Densities were calculated by dividing the number of seals counted by the area surveyed (Cochran 1977). Variance of the density was calculated by using the model unbiased o-stimator (Cochran 1977, formula 6.27), modified to account for total sampling area (Estes and Gilbert 1978).
The possible effects of industrial activity were examined by comparing densities of seals in areas with and without activity such as ice roads, seismic trails, or artificial islands. The shortest straight-line distances from artificial islands to each minute sighting block were determined by comparing positions for each interval to position for the islands. Densities were then calculated for 2-nm concentric circles centered at the artificial islands, out to a distance of 10 nm. Since the islands were less than 10 nm apart and interactive effects were possible, a density in relation to all islands was also calculated using the minimum distance from any of the 3 islands for each 1-minute sighting block.

Densities were calculated for an Table 1. The density of ringed seals at industrial and 2 adjacent control holes in relation to distance from 3 blocks. All sightings within 10 nm of artificial islands in the Beaufort Sea, land were used in this comparison. June 1985-1987. "Industrial" blocks were areas which included artificial islands, ice roads, and seismic trails. "Control" blocks of
1985 similar size were delineated to the east Distance (am) and west of the industrial area. Island Survey 0- 2 2-4 4-6 6-8 8-10
Results and Discussion
Data were obtained for 3 artificial islands : Seal, Northstar, and Sandpiper, for all 3 years of the survey (Table 1). In 1985, all 3 of the islands were active: Seal was engaged in drilling operations and Northstar and Sandpiper were under construction. During the 1985 surveys, the central Beaufort Sea adjacent to the artificial islands was surveyed twice, on 7 and 11 June. Analysis of density with distance from the islands indicated that for all comparisons the density of seals at holes was 20%-80% lower within 2 nm of the islands than it was 2-4 nm away.
During the 1986 surveys Seal Island was inactive and had been so all winter: Northstar was inactive at the time of survey but had been in operation through late spring; and Sandpiper was currently active. The area was surveyed before break-up on 6 June, and after break-up had commenced on 13-16 June. Unlike 1985, there was no clear trend in density with distance from the islands for either survey; results for individual islands were contradictory. Near Northstar (active until April) the density for both surveys was slightly lower (3%-15%) within 2 nm of the island than between 2-4 nm. Near Sandpiper the density was higher within 2 nm of the island on one survey, and lower on the other.
During winter and spring of 1986-87, all 3 artificial islands were inactive. As in previous years, the islands were surveyed twice in 1987, on 6 and 11 June. There was no consistent trend in seal density with distance from the 3 non-operational islands. Seals were more numerous near Seal Island, less numerous near Northstar, and differed between the 2 surveys at Sandpiper.
Seal 8 5- 1 0.7 1.2 1.1 1.7 1.3 85-2 - 1.9 1.0 3.3 2.2
Northstar 8 5- 1 0.8 1.6 2.2 1.4 0.9 85-2 0.8 1.0 5.8 1.5 1.5
Sandpiper 8 5 - 1 0.6 3.1 1.0 1.0 1.1 85-2 2.6 4.4 1.8 1.9 1.6
1986 Distance (nm)
Island Survey 0-2 2-4 4-6 6- 8 8-10
Seal 8 6- 1 6.1 5.8 4.6 2.3 5 .1 86-2 - 4.6 6.5 5.0 5.6
Northstar 8 6- 1 5.0 5.2 6.8 4.2 2.1 86-2 5.0 5.9 5.7 8.8 5.3
Sandpiper 8 6- 1 8.3 3.3 6.5 3.2 3.6 86-2 5.2 6.2 6.8 9.1 9.1
1987 Distance (nm)
Island Survey 0- 2 2-4 4-6 6-8 8-10
Seal 8 7- 1 - 1.1 2.9 2.7 5.5 87-2 14.4 9.5 10.4 5.9 4.8
Northstar 8 7- 1 1.1 3.3 5.6 4.1 5.2 87-2 3.8 8.4 14.2 6.3 6.1
Sandpiper 8 7- 1 7.1 7.6 2.2 4.2 3.9 87-2 6.8 5.5 6.6 5.2 11.9
Interpretation of the data regarding trends in density around individual islands was complicated and the utility of such data limited by several factors: sample sizes were small (17-80 nm2 total per survey), particularly within 2 nm of the islands where the sample for a survey usually consisted of 1-3 minutes (1-6 nm2) of data; the islands were close enough together (particularly Seal and

Northstar islands which were only 4 nm apart) for interactive effects to occur; and not all islands were in similar operational status either within or between years. Consequently, the data set shown in Table 1 could not be treated as 18 replicate tests of the effect of an artificial island on seal density.
To address the first two of these problems we determined the minimum distance from any island in the data set from each survey (Table 2). In 5 of the 6 comparisons, the density of seals at holes was 12%-72% lower within 2 nm of any island than it was 2-4 nm away. Inspection of the raw data indicated that for the single exception (survey 86-1) the higher density at 0-2 nm was probably an artifact of the way position was assigned to the minute survey interval. Although the density of seals was lower near the islands in both 1985 when all islands were active and 1987 when none were active, the magnitude of the difference was much greater during activity (50%-70%) than in its absence (12%-30%).
approximately 60 nm across. In 1986, the only obvious activities were the artificial islands and associated ice roads, resulting in an industrial block which was only 16 nm across (Figure 2). During 1987 surveys there was no offshore industrial activity; however, data were analyzed according to the 1986 industrial and control blocks for comparative purposes.
150 148
Table 2. The density of ringed seals at
70 45 "
holes in relation to distance from any of 3 artificial islands in the Beaufort Sea, June 1985-1987.
BEAUFORT SEA WEST CONTROL
Figure 2. Map showing locations of artificial islands in sector B3 of the Beaufort Sea and the 1986 industrial and control blocks.
r----- -- .--. EAST CONTROL
70 15 .,
Distance from any island (nm) Survey nm2 0-2 2-4 4-6 6-8 8-10
A block comparison of industrial and adjacent control areas was also done for all 3 years. In 1985, industrial activity, including seismic lines, ice roads, and islands, was widespread, resulting in an industrial block
In both 1985 and 1986 the density of total seals was significantly higher in the industrial block than in the control blocks (Figure 3). In 1987, in the absence of any offshore industrial activity, density in the "industrial" block was also higher than either control, suggesting that some characteristics other than the presence or absence of activity were responsible for the difference.
Aerial surveys of ringed seals in 1985-1987 were the most extensive and systematic ever conducted in Alaska, and the first for which between-year statistical comparisons were possible. Data from those years demonstrated substantial year-to-year variability in ringed seal densities (Table 3).

0 WEST CONTROL
0 EASTCONTROL
Figure 3. Density of ringed seals (total seals/nm2) in industrial and control blocks in the central Beaufort Sea, June 1985-1987.
Table 3. Comparison of ringed seal densities (total seals/nm2) on the shorefast ice of the Chukchi and Beaufort seas based on surveys conducted in 1985-1987. Data from the Chukchi Sea in 1987 are not yet analyzed.
Density Sector 1985 1986 1987*
* Preliminary data.
Between 1985 and 1986, observed density of total seals hauled out on the Chukchi Sea shorefast ice increased 607 from 2.9 to 4.7 seals/nm2. Increases in individual sectors ranged from 307-907.. In the Beaufort Sea, the overall increase was 12%, from 3.0 to 3.3 seals/nm2, with the westernmost sector near Barrow decreasing 77 and the central sectors increasing 20%-30%. The
causes for such inter-annual variation are unknown. While relationships between seal abundance and physical parameters such as ice deformation and extent of shorefast ice do exist and may explain small-scale differences in the distribution and abundance of seals (Frost et al. 1985, 1987), they cannot account for the large observed inter- annual differences . We have no measure of biological parameters such as prey availability, which may be a major factor in determining overall ringed seal distribution and abundance in a given year.
Historical data also indicate substantial year-to-year variability in the occupancy of nearshore areas by ringed seals. Data are available for the Alaskan Beaufort Sea since 1970 (Burns and Harbo 1972; Burns and Eley 1978; Burns et al. 1981; Burns and Kelly 1982; Frost et al. 1985). During that period, the density of ringed seals on the shorefast ice of the Beaufort Sea, as a whole, dropped from a high of 3.3 seals/nm2 in 1975, to a low of 1.1 seals/nm2 in 1977, and subsequently increased steadily to 3.3 seals/nm2 by 1986. The density in any particular year ranged from 507 below to 40% above the mean density for 8 years of surveys. In the Canadian Beaufort Sea near Tuktoyaktuk, ringed seal densities have fluctuated from 557 above to 70% below the long-term mean in a far less regular manner than the Alaskan Beauf ort Sea (Stirling et al. 1981; Kingsley 1986).
Such annual and long-term variability demonstrate the need for regular and relatively extensive coverage of areas in which smaller-scale comparisons are being made. For example, the density of ringed seals in the central Beaufort Sea (sectors B2 and B3) decreased in the mid- to late 1970's and subsequently increased in the mid-1980's (Figure 4). This could be attributed to changes in industrial activity, which intensified in the late 1970's and early 19801s, then gradually decreased. However, the western Beaufort Sea (sector Bl), which experienced little or no seismic or other industry activity, showed the same fluctuations in density during this time period. Furthermore, the major decline

in density which occurred in the study area between 1975 and 1977 also occurred in the Canadian Beaufort Sea (Stirling et al. 1981).
0 0 J 70 72 74 76 78 80 82 34 86
YEAR
Figure 4. Density of ringed seals in 3 sectors of the Beaufort Sea based on aerial surveys conducted in 1970-1986. (Data from Burns and Harbo 1972; Burns and Eley 1978; Burns et al. 1981; Burns and Kelly 1982; Frost et al. 1986.)
While aerial surveys are useful in monitoring long-term trends in abundance over large areas, they are not well- suited to detecting small-scale differences in geographically restricted areas. In this study, aerial survey data indicated a possible local effect of artificial islands on the density of ringed seals. However, interpretation was complicated by the fact that the minimum sighting unit was 1 minute or 2 nm; land and the edge of shorefast ice, which may both affect seal densities, were variable distances from the 3 islands; and the precision of navigational equipment sometimes varied by  1 nm. In analyses of industrial and control blocks, the greatest difficulties were in obtaining an accurate measure of industrial activity and in designating comparable control blocks. There is considerable east-west variability in the Beaufort Sea in ice topography, extent of shorefast ice, and bathymetry. Control and industrial blocks were not necessarily comparable simply because they were adjacent, as is indicated by higher densities in the "industrial" blocks with or without industrial activity.
In aggregate, analyses of histori- cal and recent aerial survey data emphasize the importance of matching research technique to the question at hand. Our data indicate that in 1985-86 there were no apparent broad-scale effects of industrial activity on the density of ringed seals as measured by aerial surveys. The data do not discount local effects which would be more appropriately detected by other techniques, nor do they discount the possibility that regional effects could occur at different levels of industrial activity. Most aerial surveys conducted during peak years of industrial activity in the central Beaufort Sea did not have sampling effort or design suitable for statistical analyses of differences between relatively small areas. By conducting on-ice studies, Burns and Kelly (1982) found that although aerial surveys showed no significant difference in densities along seismic and control lines, the rate of alteration or refreezing of lairs and breathing holes within 150 m of seismic lines was approximately double the rate at distances greater than 150 m. Kelly et al. (1986) also reported results of on-ice studies which indicated that ringed seals do respond to disturbance.
Conclusions
1. Based on aerial surveys conducted in 1985-87, the density of ringed seals was lower within 2 nm of artificial islands in the central Beaufort Sea than it was 2-4 nm away. Although this was true in years with and without activity on the islands, the difference was greatest when they were all active. Interpretation of data was complicated by possible interactive effects of distance from the islands, from land, and from the shorefast ice edge; the accuracy of navigational equipment; and other biological or physical parameters that could affect densities but which were unknown to us.
2. Comparisons of industrial and adjacent control blocks in 1985 and 1986 indicated that the density of ringed seals was significantly higher in the industrial blocks in both years. A similar comparison of the same blocks in 1987 when there was no industrial

activity also showed that seals were more numerous in the industrial block, which indicates that factors other than the presence or absence of industrial. activity caused the difference.
3. There was a steady increase in the density of ringed seals in the central Beaufort Sea from 1985-87 which occurred concurrently with a decrease in industrial activity. In our opinion, the two are probably not related, since a similar increase in density occurred in the western Beaufort Sea where no industrial activity took place.
4. While our studies do not show any broad-scale effect of industrial activities on ringed seal abundance and distribution in the Beaufort Sea, that does not imply that such effects cannot occur. Our data relate only to the types and levels of activities that occurred during the study period. Continued monitoring of ringed seal populations is warranted. Studies of ringed seal ecology are needed in order to explain the causes of the "natural" fluctuations in density that have been documented.
5. Aerial surveys are a useful means of detecting long-term trends in ringed seal abundance and comparing regional trends in abundance over large areas. However, aerial surveys alone are not adequate for determining the effects of industrial activity. Such studies should combine aerial surveys with on-ice studies that monitor the use and fate of breathing holes and lairs on a finer scale.
Acknowledgements
This study was funded by the Minerals Management Service, Department of the Interior, through an Interagency Agreement with the National Oceanic and Atmospheric Administration, Department of Commerce, as part of the Alaska Outer Continental Shelf Environmental Assessment Program, contract numbers 02-5-022-53, 03-5-022-69 (RU #232), NA-81-RAC-00045, and 84-ABC-00210.
The authors especially want to acknowledge the logistic support provided by the NOAA Office of Aircraft
Operations in the form of the NOAA Twin Otter and its excellent flight crews, particularly Commander Dan Eilers who served not only as Chief Pilot all 3 years, but as a valuable member of the scientific team. Thanks go to Jim Gilbert, Howard Golden, Sue Hills, Dawn Hughes, and Val Uhler for their many hours as observers, recorders, and idea generators; to George Lapiene for taking care of sometimes complicated logistics planning; and to Jesse Venable for helping to translate hours of survey data into analyzed results. Special thanks to John Burns who, for better or worse, got us started surveying ringed seals and laid the ground work for this project over 15 years ago.
References
Burns, J. J. and T. J. Eley. 1978. The natural history and ecology of the bearded seal (Erignathus barbatus) and the ringed seal (Phoca hispida). Paces 99-162 in Environmental Assessment ofthe ~laskan~ontinental Shelf, Annual Reports, Vol. 1, Outer Continental Shelf Environmental Assessment Program, Boulder, CO.
Burns, J. J. and S. J. Harbo, Jr. 1972. An aerial census of ringed seals, northern coast of Alaska. Arctic 25:279-290.
Burns, J. J. and B. P. Kelly. 1982. Studies of ringed seals in the Alaskan Beaufort Sea during winter: impacts of seismic exploration. Annual report RU #232 to Outer Continental Shelf Environmental Assessment Program, Juneau, AK. 57 pp.
Burns, J. J., L. F. Lowry, and K. J. Frost. 1981. Trophic relationships, habitat use, and winter ecology of ice-inhabiting phocid seals and functionally related marine mammals in the Arctic. Annual report RU #232 to Outer Continental Shelf Environmental Assessment Program, Juneau, AK. 81 pp.
Cochran, W. G. 1977. Sampling techniques, John Wiley & Sons, Inc., NY. 428pp.
Estes, J. A. and J. R. Gilbert. 1978. Evaluation of an aerial survey of

Pacific walruses (Odobenus rosmarus divergens). J. Fish. Res. Bd. Can. 35:1130-1140.
Frost, K. J. and L. F. Lowry. 1984. Trophic relationships of vertebrate consumers in the Alaskan Beaufort Sea. Pages 381-401 & P. W. Barnes, D. M. Schell, and E. Reimnitz, eds. The Alaskan Beaufort Sea - Ecosystems and Environments. Academic Press, NY.
Frost, K. J., L. F. Lowry, and J . J. Burns. 1985. Ringed seal monitoring: relationships o f distribution, abundance, and reproductive success to habitat attributes and industrial activities. Interim report 1985 - RU #667 to Outer Continental Shelf Environmental Assessment Program, Juneau, AK. 85 pp.
Frost, K. J., L. F. Lowry, and J. R. Gilbert. 1987. Ringed seal monitoring: relationships o f distribution, abundance, and reproductive success to habitat attributes and industrial activities. Interim report 1986 - RU #667 to Outer Continental Shelf Environmental Assessment Program, Juneau, AK. 53 pp.
Kelly, B. P., L. T. Quakenbush, and J . R. Rose. 1986. Ringed seal winter ecology and effects of noise disturbance. Final report (Part 2) RU #232 to Outer Continental Shelf Environmental Assessment Program, Juneau, AK. 83 pp.
Kingsley, M. C. S. 1986. Distribution and abundance of seals in the Beaufort Sea, Amundsen Gulf, and Prince Albert Sound, 1984. Environmental Studies Revolving Funds Report No. 025. 16 pp.
Lowry, L. F., K. J. Frost, and J. J. Burns. 1978. Food of ringed seals and bowhead whales near Point Barrow, Alaska. Can. Field-Nat. 92:67-70.
Lowry, L. F., K. J. Frost, and J. J. Burns. 1980. Variability in the diet of ringed seals, Phoca hispida, in Alaska. Can. J. Fish. Aquat. Sci. 37:2254-2261.
Smith, T. G. 1980. Polar bear predation of ringed and bearded seals in the land-fast sea ice habitat. Can. J. 2001. 58:2201-2209.
Smith T. G. and M. 0. Hammill. 1981. Ecology of the ringed seal, Phoca hispida, in its fast ice breeding habitat. Can. J. 2001. 59:966-981.
Smith, T. G. and I. Stirling. 1975. The breeding habitat of the ringed seal (Phoca hispida). The birth lair and associated structures. Can. J. Zool. 53:1297-1305.
Stirling, I., M. C. S. Kingsley, and W. Calvert. 1981. Seals in the Beaufort Sea 1974-1979. Report prepared for Dome Petroleum Limited, Esso Resources Canada Limited, and the Department of Indian and Northern Affairs. Can. Wildl. Serv., Edmonton, Alberta. 70 pp.
Discussion
B. KELLEY: Given the great annual variability in ice and snow conditions that appear to affect the proportion of basking seals, how useful do you feel aerial survey data are for examining year-to-year changes in seal density?
K. FROST: Although annual variability in ice and snow conditions can be considerable, that variability is generally apparent to survey observers. As long as surveys are conducted not only during the same general time period, but also under similar ice conditions (e.g., before extensive snow melt and cracking of the fast ice occur), year-to-year comparisons should be useful. However, relatively large geographic areas should be included in comparisons in order to avoid apparent differences caused by small-scale local variability. Data should be screened to ensure that surveys have not been conducted under post-breakup conditions, which result in extremely high densities. The best indicators of these conditions are a large percentage (greater than 30%) of seals at cracks and a high incidence of groups of more than 2 seals at holes. Within a year, surveys of some part of
the study area should be replicated several times at 3 to 5 day intervals to ensure that surveys are conducted under suitable conditions and before haul-out patterns have begun to change with the onset of breakup.
T. NEWBURY: You described data on the number of seals around drill sites, and you implied that there might be a direct effect on these seals due to activity. Won't there also be an indirect effect due to the influence of activity on seal predators, primarily polar bears?
K. FROST: Indirect effects on predators are possible, but it is difficult to predict what they might be. Any effects would depend on the characteristics of the activities and the specifics of predator and prey populations in the area (including density, age, and sex composition, or other factors). In 300 hours of surveys over the fast and pack ice of northern Alaska, no polar bear kill sites were seen in the very nearshore region where drill sites were located.
V. R. NERALLA: Did you conduct any studies on the appearance of ringed seals and environmental conditions (e.g., air temperature, wind speed and wind direction, etc.)?
K. FROST: Most investigators who have surveyed ringed seals have considered the effects of environmental conditions. The survey protocol which specified that surveys be conducted between 10 a.m. and 4 p.m. (sun time) and when wind speed was less than 20 knots incorporated what this and other studies have found about ringed seal behavior relative to weather. In order for a study to specifically test the effects of weather, surveys would have to be conducted under poor as well as good weather conditions.
Data obtained in our study are presented in Frost et al. 1985 and 1987. It should be noted that it is difficult to make specific correlations between environmental conditions and seal haul- out patterns for two major reasons: ( 1) environmental variables are interactive and do not always produce the same results (for example, strong winds on bright, sunny days may not inhibit haul-
out, whereas more moderate winds on cold days may greatly reduce the number of seals hauling out); and, (2) it is extremely difficult to obtain on-ice measurements of temperature and wind speed or direction during surveys. Conditions at shore-based weather stations or those at survey altitude may be considerably different than conditions over the ice at ground level.


RESPONSES OF RINGED SEALS (Phoca hispida) TO NOISE DISTURBANCE
Brendan P. Kelly Institute of Marine Science, University of Alaska Fairbanks, Alaska, USA
John J. Burns Living Resources Inc., Fairbanks, Alaska, USA
Lori T. Quakenbush Institute of Marine Science, University of Alaska Fairbanks, Alaska, USA
Abstract
The effects of on-ice industrial noises on ringed seals (Phoca hispida) were investigated to determine the extent to which such disturbance increases the rates a t which seals abandon breathing holes and lairs. In the spring of 1982, breathing holes and lairs were abandoned three times as often within 150 m of recent seismic survey lines as were structures a t greater distances from the same lines. Subnivean structures were abandoned a t equal rates within and beyond 150 m of control lines. Aerial surveys of ringed seals conducted in the Beaufort Sea in 1981 and 1982, however, showed no consistent differences in the densi ty of basking sea ls i n t ransec ts centered over seismic survey lines and in intervening transects.
The rate of abandonment of subnivean seal structures was compared over six years. In undisturbed areas, the abandonment rate was 4.0% in shore-fast ice and 12.9% in d r i f t i ng ice. Among sea l s t ruc tu re s subjected to industrial noise in the shore-fast ice, the ra te was 13.5%, and with the addition of repea ted examinat ions of structures by investigators the rate was 32.5%.
This is a reviewed and edited version of a paper presented at the Ninth International Conference on Port and Ocean Engineering Under Arctic Conditions, Fairbanks, Alaska, USA, August 17-22, 1987. @ The Geophysical Institute, University of Alaska, 1987.
Radio-tagged seals departed their lairs in response to snow machines within 2.8 km, human footfalls as far away as 600 m, a skier as far away as 400 m, and in response to a helicopter flying 5 km from the lair a t an altitude of 152 m, and during helicopter landings or takeoffs as far away as 3 km.
Ringed seals abandon breathing holes and lairs in response to naturally occurring conditions such a s minimal snow cover, shifting ice, and the activities of predators. They abandon those sites a t higher rates in response to anthropogenic noises. Seals would be most adversely affected by noise disturbance in late March through J u n e when the amount of time they spend out of the water is increasing and movements, especially of females and their dependent young, are limited to small areas.
Introduction
Potential effects on marine mammals of anthropogenic noises include physical h a r m from e x t r e m e l y loud no i se s , interference with vocal communication, increased levels of stress, and displacement from local areas (Rausch 1973; Geraci and St. Aubin 1980; Schusterman and Moore 1980; Norris 1981; Stewart 1981; Ronald and Dougan 1982; Mansfield 1983; Kelly et al. 1986). Displacement has the most potential for widespread and long-term effects and has been a focus of our investigations. Ringed
seals (Phoca hispida) are the most adapted of northern pinnipeds to inhabiting thick, relatively stable sea ice, and their ability to maintain holes through the ice permits them to occupy areas of complete ice cover year- round. That adaptation allows ringed seals to exploit resources from which other pinnipeds are largely excluded during winter , bu t i t also makes them more vulnerable to predation by polar bears (Ursus maritimus) and arctic foxes (Alopex lagopus). Mortality of ringed seal pups can be substantial due to that predation (Smith 1976; Smi th 1987; Kelly e t al. 1987). Occupation of areas of extensive ice cover, especially shore-fast ice, also makes ringed seals more vulnerable to human activities; for thousands of years the species was a major resource for coastal Eskimos and i t remains important in modern Eskimo culture and economy (Hall 1866; Boas 1888; Stefansson 1913; Manning 1944; McLaren 1958a; Cox and Spiess 1980; Wenzel 1984; Smith 1987). In recent times, petroleum exploration and development activities have taken place in ringed seal habitat. Gravel island construction and exploration for oil using seismic profiling have overlapped spatially and temporally with ringed seal whelping and breeding areas. Both gravel island construction and seismic profiling involve opera t ing heavy t r u c k s and bulldozers on the shore-fast ice. Seismic p ro f i l i ng f u r t h e r e n t a i l s i m p a r t i n g substantial amounts of low frequency sound e n e r g y i n t o t h e oceanic c r u s t ( a n d incidentally the water column and overlying ice) and recording the reflected signals.
Concern a b o u t t h e e f f ec t s of disturbance in Alaskan waters was first expressed by subsistence hunters on the Seward Peninsula. They reported decreased harvests of ringed seals in an area subjected to offshore gold exploration in the 1960's (Burns and Kelly 1982). More recently, seismic profiling during oil exploration has presented a greater potential for disturbance since i t involves considerable noise energy and affects extensive areas. Explosives were the main signal sources until their offshore use w a s b a n n e d i n 1977 b a n r Adminis t ra t ive Order of t h e A a s k a D e p a r t m e n t of N a t u r a l Resources . Subsequently, "air guns," "water guns," and Vibroseis machines have been used to generate source signals.
When we began this study in 1981, the only data available with which to examine the hunters' suggestion that ringed seals
were displaced by noise disturbances were the results of aerial surveys conducted between 1970 and 1977 (Burns and Harbo 1972; Burns and Eley 1978). In those surveys, lower densities of seals were observed i n t h e v i c in i ty of c o a s t a l settlements than in adjacent near-shore areas. They believed that those differences were greater than could be accounted for by removal of seals, since hunting of ringed seals was greatly reduced compared to earlier times. They speculated that human activity, especially snow machine travel, was displacing seals from those areas. Examination of the aerial data from the Beaufort Sea for indications of differences in seal densities inside and outside of areas affected by seismic exploration has yielded conflicting results. Burns and Harbo (1972) reported similar densities of seals in both areas during the 1970 survey, but Burns et al. (1981) re-examined the data from 1975- 1977 and concluded that densities of seals in "seismic" areas were consistently lower than in undisturbed areas. None of those surveys were designed to test for indications of d i sp l acemen t , however , a n d t h e retrospective partitioning of the data into disturbed and undisturbed a r e a s was unsatisfactory.
For the present study, we combined on- ice surveys of subnivean seal structures (breathing holes and lairs) using trained Labrador retrievers, aerial surveys of basking seals, and radio telemetr to f quantify the reactions of ringed sea s to seismic profi l ing t h a t employed t h e Vibrose is me thod a n d t o o t h e r anthropogenic noises. Our objectives were to (1) determine the effect of seismic profiling activities on ringed seal distribution, (2) determine the behavioral responses of r inged s e a l s occupying l a i r s t o anthropogenic noise, (3) compare the rates of abandonment of subnivean structures in disturbed and undisturbed areas, and (4) assess the significance of abandonment of subnivean s t ruc tures i n t e rms of t h e numbers and distribution of alternative structures available to individual seals. Our primary measures of disturbance were the relative densities of basking seals along and immediately adjacent to seismic "shot lines," the rate of abandonment of subnivean structures as a function of distance from seismic lines, and changes in haulout frequency and duration in areas subjected to seismic profiling. Rates of short-term and long-term displacement resulting from noise disturbance were assessed re la t ive to

natural rates established using surveys and telemetric studies conducted between 1981 and 1987.
Methods
Aerial surveys
Aerial surveys were conducted along the Beaufort Sea coast of Alaska (Figure 1) between 2 and 9 June 1981 and between 25 May and 4 June 1982. The 1981 surveys were conducted from a twin engine fixed- wing aircraft (Grumman Goose) equipped with a Global Navigation System (GNS). A Bell 204 helicopter, also with GNS, was used for the 1982 surveys. Two observers counted all seals visible within 0.5 nm of each side of the aircraft while flying a t an altitude of 500 ft.
Between 2 and 9 J u n e 1981, we surveyed 2,880 nm of transect lines divided into three groups; those parallel to the coast between Smith Bay (70°55'N 154O20W) and Barter Island (70°08'N 143'40'W), those centered over seismic lines that had been surveyed during the previous few months, and control lines centered between those seismic l ine t ransec ts . In 1982, we conducted aerial surveys between 25 May and 4 June. The total length of those transects was 1,083 nm, again divided into those along seismic trai ls , those along control transects, and a series duplicating some of the transects surveyed in June 1981.
Subnivean seal structure surveys
Trained Labrador retrievers were used to find seal-made structures (subnivean lairs and breathing holes) in 10 surveys between
so"
50Â
Figure 1. Map of Alaska showing locations mentioned in text.
2 9

1982 and 1987. The method was similar to the way Eskimo hunters used sled dogs to locate seal holes (Hall 1866). Canadian workers adapted the method for biological sampling (Smith and Stirling 1975) and one of us (BPK) learned the method from them in 1981. The dogs ran in front of a snow machine a t the direction of the dog handler. When they detected seal odor, they followed the scent to its source and indicated the location of the seal structure by digging in the snow above it. Generally, the dogs were directed to run perpendicular to the wind direction to maximize the area of detection.
The search pattern varied de ending on the objectives of work during the different field efforts. The dogs generally searched either along lines established by heavy equipment and snow machines or a t random within pre-selected areas, usually near field camps or stations established to monitor radio-tagged seals. An exception was in a drift ice survey in 1987 when the dogs searched along tracks of polar bears.
Seal structure surveys in 1982 were limited to the shore-fast ice of the Beaufort Sea, primarily in the vicinity of Reindeer Island and Seal Island, a man-made gravel island (Figure 2). In that effort, searches were primarily along seismic lines or control lines delineated by snow machine tracks. Surveys in 1983 were conducted again in the Reindeer Island area and a t numerous shore-fast ice locations from Norton Sound in the Bering Sea north to Point Barrow in the Chukchi Sea (Figure 1). In 1984, shore- fast ice was surveyed in Kotzebue Sound and drifting ice was surveyed elsewhere in the Chukchi Sea. Shore-fast ice was surveyed in the vicinity of Point Barrow in 1985, 1986, and 1987. The 1987 surveys also included efforts in the Beaufort Sea east of Point Barrow; on shore-fast ice between the man- made gravel island, Tern Island (70°17'N 147O28'W) and Narwhal Island (70°24'N 147'30'W) and a t several locations in drifting ice.
At a minimum, each structure was probed with an aluminum rod, 1 cm in diameter. Most structures were partially uncovered to permit examination and measurements a f te r which they were carefully re-covered. When examined, structures were classified a s breathing holes, simple resting lairs, multi-chambered lairs, or birth lairs, and notations were made of the dimensions, physical setting, and indications of predator activity. The status
of each structure was recorded as open, if the hole through the ice was maintained by the seal to its maximal diameter; frozen, if the entire hole was refrozen; or, in the case of lairs as altered, if access to the lair was obstructed by partial freezing of the access hole or by a collapsing ceiling. Structures t h a t were classif ied a s frozen were considered to have been abandoned by the seals.
In most instances, structures were examined when first located. In 1982, however, many structures were probed when first located, but they were not examined further until a subsequent revisit. In that year, approximately 72% of the structures were visited two or more times.
The examination of a structure was considered to constitute a disturbance, thus all examinations subsequent to the initial one were of structures previously exposed to anthropogenic d is turbance a n d were categorized as such.
Monitoring of haulout activity
Fourteen ringed sea ls were live- captured a t breathing holes in the shore-fast ice; three in the Beaufort Sea in 1982, six in the Beaufort Sea in 1983, and five i n Kotzebue Sound in 1984 (Kelly et al. 1986). The weight, sex, and minimal age, a s determined by claw annu l i (McLaren 1958b), of each seal was recorded. VHF radio transmitters were glued to the pelage of the dorsum, midway between the base of the tail and the region of maximal girth, before each seal was released a t its capture site.
The unique frequency of each deployed transmitter was monitored from a nearby camp every half-hour in 1982 and every hour in 1983 and 1984 for up to 2.5 months between March and early June. Signals could be received only when the transmitters were above the ice surface, thus indicating tha t the seals were out of the water . Haulout bouts of 13 of the radio-tagged seals were monitored after their release; no signals were received from one of the seals tagged in 1983. Whenever feasible, the exact location of t he s ignal sources, indicating the location of lairs or other haulout sites, was determined. Those determinations were accomplished by skiing or walking around the signal source while monitoring the signal with a hand-held, directional antenna.

SEISMIC SURVEY LINES, /
0 1000 2000 3000 4000 METERS - Seismic survey lines p Subnivean seal structures
I
Figure 2. Subnivean structures used by radio-tagged ringed seals and seismic survey lines in 1982 (north of Reindeer Island) and 1983 (south of Reindeer Island). (After Kelly et al. 1986.)
When radio-tagged seals were in their lairs and subjected to anthropogenic sounds, notations were made of their behavioral responses (departed or remained in lair). In April 1983, a simulated seismic survey was conducted near Reindeer Island in an area occupied by radio-tagged seals. The survey consisted of four seismic lines; A, B, C, and D depicted i n Figure 2. Four machines travelled over each seismic line. A drill truck used a power auger to bore holes through the ice, generally every 67 m along t h e s u r v e y l ines . A bulldozer (D6 Caterpillar) then leveled the ice along the survey lines. Every 67 m, the ice surface was vibrated ten times in 16 second sweeps from 10 to 70 Hz by a Vibroseis machine. A fuel truck followed a t the end of the convoy. Lines A and B were vibrated on 21 April, lines C and D were vibrated on 22 April, and line A was vibrated a second time on 27 Apri l . Addit ional ly, t he behaviora l responses of seals in lairs to the sounds of
helicopters, snow machines and o the r equipment operating on the ice, and people wa lk ing or s k i i n g on t h e i ce were documented opportunistically.
Results
Aerial surveys
Results of our aerial surve s were ^ conflicting with regard to the e fects of seismic s u r v e y a c t i v i t i e s on s e a l distribution. In 1981, we observed a n average of 1.3-1.4 ringed seals per nm2 on the shore-fast ice between Point Barrow (71°23.2'N 156'27.2W) and Oliktok Point (70°30.0'N 14g052.6W) and an average of 1.1 ringed seals per nm2 between Oliktok Poin t and Bar t e r I s l a n d (70°08.1'N 142O24.7'W), s imi lar to t he dens i t ies observed in four surveys conducted between 1970 and 1978 (Burns et al. 1981).
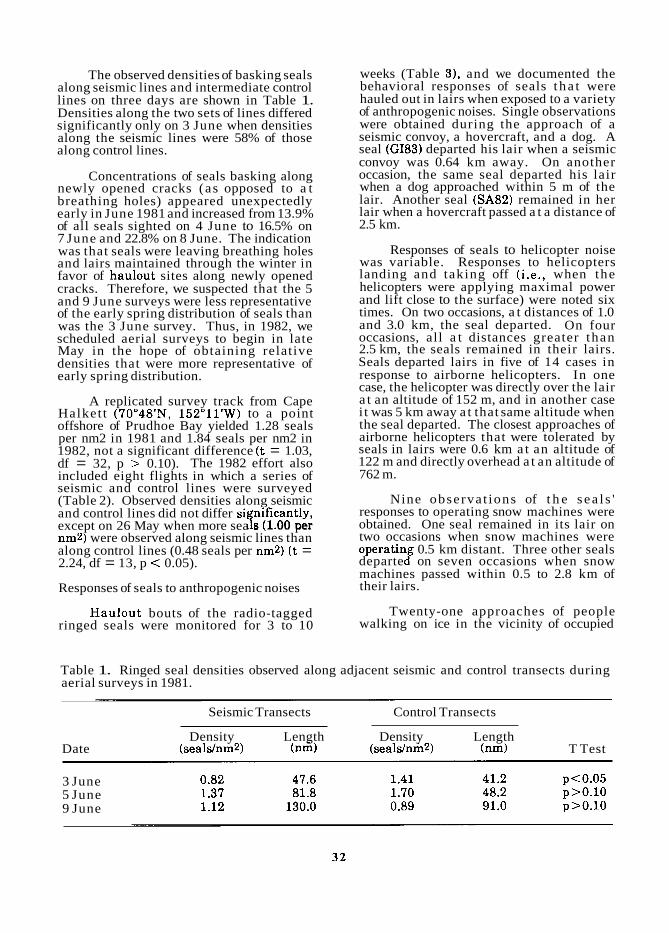
The observed densities of basking seals along seismic lines and intermediate control lines on three days are shown in Table 1. Densities along the two sets of lines differed significantly only on 3 June when densities along the seismic lines were 58% of those along control lines.
Concentrations of seals basking along newly opened cracks (as opposed to a t breathing holes) appeared unexpectedly early in June 1981 and increased from 13.9% of all seals sighted on 4 June to 16.5% on 7 June and 22.8% on 8 June. The indication was that seals were leaving breathing holes and lairs maintained through the winter in favor of haulout sites along newly opened cracks. Therefore, we suspected that the 5 and 9 June surveys were less representative of the early spring distribution of seals than was the 3 June survey. Thus, in 1982, we scheduled aerial surveys to begin in late May in the hope of obtaining relative densities that were more representative of early spring distribution.
A replicated survey track from Cape Halket t (70°48'N 152Oll'W) to a point offshore of Prudhoe Bay yielded 1.28 seals per nm2 in 1981 and 1.84 seals per nm2 in 1982, not a significant difference ( t = 1.03, df = 32, p > 0.10). The 1982 effort also included eight flights in which a series of seismic and control lines were surveyed (Table 2). Observed densities along seismic and control lines did not differ si except on 26 May when more sea l i f i ~ t l y , s (1 00 per nm2) were observed along seismic lines than along control lines (0.48 seals per nm2) ( t = 2.24, df = 13, p < 0.05).
Responses of seals to anthropogenic noises
Haulout bouts of the radio-tagged ringed seals were monitored for 3 to 10
weeks (Table 31, and we documented the behavioral responses of seals t ha t were hauled out in lairs when exposed to a variety of anthropogenic noises. Single observations were obtained during the approach of a seismic convoy, a hovercraft, and a dog. A seal (GI83) departed his lair when a seismic convoy was 0.64 km away. On another occasion, the same seal departed his lair when a dog approached within 5 m of the lair. Another seal (SA82) remained in her lair when a hovercraft passed a t a distance of 2.5 km.
Responses of seals to helicopter noise was variable. Responses to helicopters landing and taking off (i.e., when the helicopters were applying maximal power and lift close to the surface) were noted six times. On two occasions, a t distances of 1.0 and 3.0 km, the seal departed. On four occasions, all a t distances greater than 2.5 km, the seals remained in their lairs. Seals departed lairs in five of 14 cases in response to airborne helicopters. In one case, the helicopter was directly over the lair a t an altitude of 152 m, and in another case i t was 5 km away a t that same altitude when the seal departed. The closest approaches of airborne helicopters that were tolerated by seals in lairs were 0.6 km a t an altitude of 122 m and directly overhead a t an altitude of 762 m.
Nine observa t ions of t h e sea l s ' responses to operating snow machines were obtained. One seal remained in its lair on two occasions when snow machines were operatin 0.5 km distant. Three other seals departe <f on seven occasions when snow machines passed within 0.5 to 2.8 km of their lairs.
Twenty-one approaches of people walking on ice in the vicinity of occupied
Table 1. Ringed seal densities observed along adjacent seismic and control transects during aerial surveys in 1981.
Seismic Transects Control Transects
Density Length Density Length Date (sealdnm2) (nm) (sealdnm2) (nm) T Test
3 June 5 June 9 June
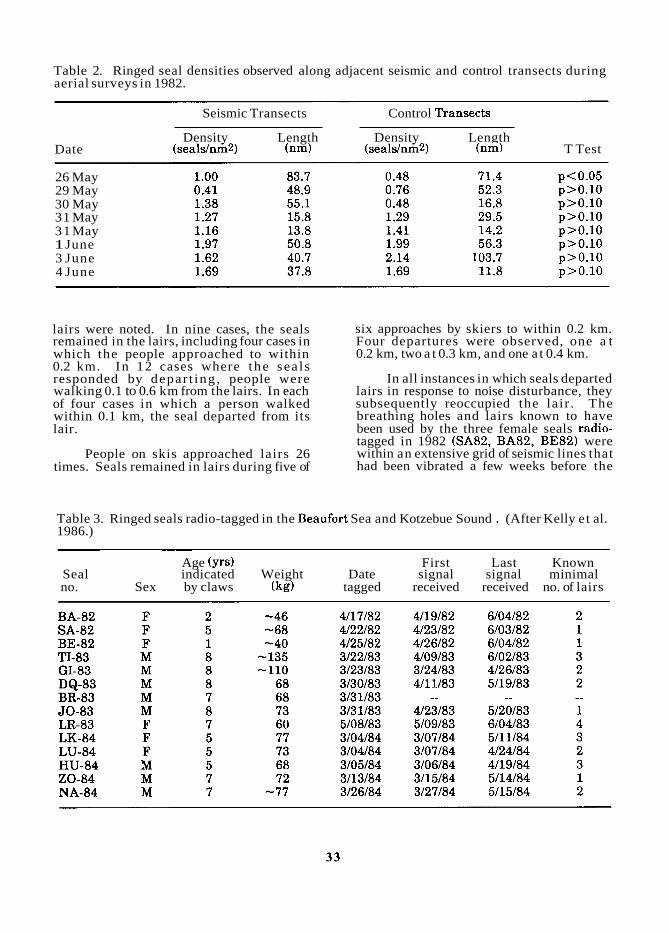
Table 2. Ringed seal densities observed along adjacent seismic and control transects during aerial surveys in 1982.
Date
Seismic Transects Control Transects
Density Length Density Length (sealslnm2) (nm) (sealslnm2) (nm) T Test
26 May 29 May 30 May 31 May 31 May 1 June 3 June 4 June
lairs were noted. In nine cases, the seals remained in the lairs, including four cases in which the people approached to within 0.2 km. In 12 cases where the sea ls responded by depar t ing , people were walking 0.1 to 0.6 km from the lairs. In each of four cases in which a person walked within 0.1 km, the seal departed from its lair.
People on skis approached lairs 26 times. Seals remained in lairs during five of
six approaches by skiers to within 0.2 km. Four departures were observed, one a t 0.2 km, two a t 0.3 km, and one a t 0.4 km.
In all instances in which seals departed lairs in response to noise disturbance, they subsequently reoccupied the lair . The breathing holes and lairs known to have been used by the three female seals radio- tagged in 1982 (SA82, BA82, BE821 were within an extensive grid of seismic lines that had been vibrated a few weeks before the
Table 3. Ringed seals radio-tagged in the Beaufort Sea and Kotzebue Sound . (After Kelly et al. 1986.) - --
Age (yrs) First Last Known Seal indicated Weight Date signal signal minimal no. Sex by claws (kg) tagged received received no. of lairs

seals were tagged (Figure 2). Each seal main ta ined a t least one la i r and one breathing hole within the grid of seismic lines. The breathing holes and lair access holes passed through 2 m of ice and presumably had been maintained since freeze up, or short ly thereafter. The breathing holes ranged from 19 to 129 m from the nearest seismic line; the lairs ranged from 250 to 700 m from the nearest seismic line. All of those s t ruc tures remained in active use until a t least early June, approximately two months after the seismic convoy had left the area.
Of the seals radio-tagged in 1983, three (two males and one female) occupied lairs within the grid of simulated seismic survey lines (Figure 2). One of the males (TI83) tended to haul out late a t night in April and was never in his lair during the daytime hours t ha t the seismic convoy operated (Kelly e t al. 1986). The frequency and duration of his haulout bouts and their locations showed no significant changes in relation to the seismic operation.
The second male (GI83) was in his lair when the seismic equipment approached on 21 April and his departure, when the convoy was 0.64 km distant, was mentioned earlier. The next signal from him was heard on 23 April when he briefly hauled out a t a different site than the one he departed two days earlier. Thereafter, five additional haulout bouts by that seal were recorded, a t least two of them from the lair he departed in response to the convoy. No signals were received from his transmitter after 26 April when he hauled out briefly (less than one hour). On 17 May, examination of the lair he had occupied during the seismic survey indicated its continuing use a s a haulout site, bu t we were unable to ascertain whether he or some other seal was using the lair a t that time.
The female (LR83) using the 1983 seismic area was t a ged after the survey F was completed. Her our haulout sites were within the seismic line grid, and her birth lair probably was in use prior to the seismic survey (Figure 2). She continued to use that lair a s late a s 4 June, more than one month after the survey.
Fate of seal structures in areas of industrial activity
While lair use by the radio-tagged seals appeared to be interrupted only briefly
by anthropogenic disturbance, we did observe cases of abandonment i n ou r examination of other structures. We found evidence t h a t t h e e x a m i n a t i o n by investigators and the activities associated with seismic profiling and gravel island cons t ruc t ion increased t h e r a t e s of abandonment. Data on these points were obtained in 1982 on the shore-fast ice of the Beaufort Sea.
Of 37 structures that were opened and examined when first found, 46% were frozen or altered when revisited. Another 59 structures were only probed when f irs t found, and 22% of those structures were frozen or altered when revisited. The difference in the proportion of structures frozen or altered was significant (G = 6.35, df = 2, p < 0.05).
The f a t e of 110 s t r u c t u r e s was investigated as a function of their distance from seismic lines and a gravel island under construction. Within 150 m of the seismic l ines, 14/48 (29.2%) s t r u c t u r e s were abandoned, compared to 4/37 (10.0%) of the structures beyond 150 m of the same lines. The difference was statistically significant (G = 5.53, df = 1,O.Ol < p < 0.025).
With in 8 km of t he Sea l I s land cons t ruc t ion s i t e , t h e i n c i d e n c e of abandonment was 8/25 (32.0%), similar to the rates close to seismic lines. Near the island construction site, no differences were detected in abandonment rates within and beyond 150 m of the search lines.
We observed v a r y i n g r a t e s of abandonment in over 700 seal structures examined between 1982 and 1987. Our samples were grouped according to ice type, the amount of anthropogenic disturbance, and the number of examinations by the investigators. That breakdown resulted in the four samples shown in Table 4. They are; (1) 93 structures from the drifting ice, not subjec ted to u n n a t u r a l no i se disturbance; (2) 471 structures from shore- f a s t ice a n d n o t s u b j e c t t o h u m a n disturbance; (3) 148 structures from shore- fast ice and subjected to "on-ice" industrial activity; and (4) 107 of the above 148 structures after being subjected to two or more investigator examinations as well a s industrial activities.
On t h e s h o r e - f a s t ice w i t h no significant anthropogenic disturbances (sample 2), only 4.0% of the structures were
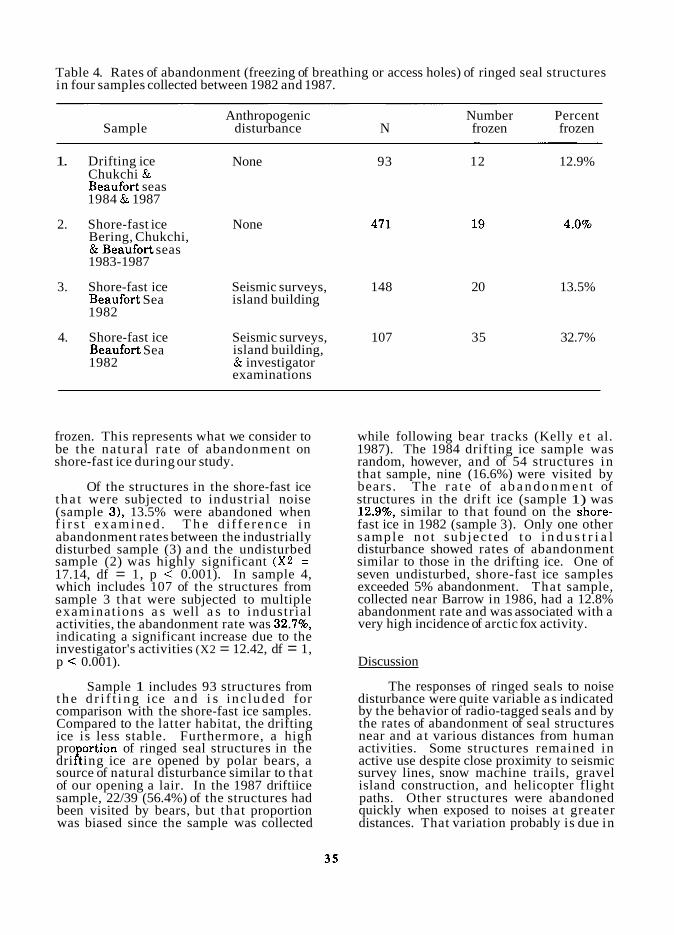
Table 4. Rates of abandonment (freezing of breathing or access holes) of ringed seal structures in four samples collected between 1982 and 1987.
Anthropogenic Number Percent Sample disturbance N frozen frozen
1. Drifting ice Chukchi & Beaufort seas 1984 & 1987
2. Shore-fast ice Bering, Chukchi, & Beaufort seas 1983-1987
3. Shore-fast ice Beaufort Sea 1982
4. Shore-fast ice Beaufort Sea 1982
None 93 12 12.9%
None
Seismic surveys, 148 20 13.5% island building
Seismic surveys, 107 35 32.7% island building, & investigator examinations
frozen. This represents what we consider to be the natural rate of abandonment on shore-fast ice during our study.
Of the structures in the shore-fast ice t ha t were subjected to industrial noise (sample 31, 13.5% were abandoned when f i r s t examined . T h e d i f ference i n abandonment rates between the industrially disturbed sample (3) and the undisturbed sample (2) was highly significant (X2 = 17.14, df = 1, p < 0.001). In sample 4, which includes 107 of the structures from sample 3 that were subjected to multiple examinations a s well a s to industr ial activities, the abandonment rate was 32.7%, indicating a significant increase due to the investigator's activities (X2 = 12.42, df = 1, p < 0.001).
Sample 1 includes 93 structures from t h e d r i f t i ng ice a n d i s inc luded for comparison with the shore-fast ice samples. Compared to the latter habitat, the drifting ice is less stable. Furthermore, a high pro ortion of ringed seal structures in the ? dri ting ice are opened by polar bears, a source of natural disturbance similar to that of our opening a lair. In the 1987 driftiice sample, 22/39 (56.4%) of the structures had been visited by bears, but that proportion was biased since the sample was collected
while following bear tracks (Kelly e t al. 1987). The 1984 drifting ice sample was random, however, and of 54 structures in that sample, nine (16.6%) were visited by bears. The r a t e of a b a n d o n m e n t of structures in the drift ice (sample 1) was 12.9%, similar to that found on the shore- fast ice in 1982 (sample 3). Only one other sample not subjec ted to i n d u s t r i a l disturbance showed rates of abandonment similar to those in the drifting ice. One of seven undisturbed, shore-fast ice samples exceeded 5% abandonment. That sample, collected near Barrow in 1986, had a 12.8% abandonment rate and was associated with a very high incidence of arctic fox activity.
Discussion
The responses of ringed seals to noise disturbance were quite variable a s indicated by the behavior of radio-tagged seals and by the rates of abandonment of seal structures near and a t various distances from human activities. Some structures remained in active use despite close proximity to seismic survey lines, snow machine trails, gravel island construction, and helicopter flight paths. Other structures were abandoned quickly when exposed to noises a t greater distances. That variation probably is due in

part to differences in the noise environment that are difficult to measure. For example, helicopter noise is muffled on warm, cloudy, snowy, or windy days and is loudest in clear, calm, cold conditions. A snow machine, or person on foot or skis, produces different kinds and levels of noise when the snow is very cold and hard or windblown compared to newly fallen, relatively warm or soft snow. Snow machines t ravel l ing over smooth ice sound different than those over rough ice. Also, the seals' sensitivity to anthropogenic noise may lessen when background noise, such a s from wind-driven snow or ice movement is high.
In spite of an array of variables not accounted for, i t is apparent that ringed seals in lairs are aware of sound intrusions, and they generally react to mechanical conveyances a t greater distances than they do to eople on foot or on skis. The indivi I ual variation in their reactions, however, makes i t difficult to define "critical" distances for noise disturbances. Although we found fewer act ive sea l structures within 150 m of seismic lines than beyond that distance, we cannot say how the rate of abandonment changed within that range, which was chosen on the basis of sample size, rather than distance se. -
Gravel island construction appeared to result in displacement of ringed seals a t rates similar to those observed close to seismic survey lines. Our data suggested that the radius of disturbance was greater around Seal Island when i t was under construction than was the radius around seismic exploration, bu t the da t a a r e insufficient for determining the distance from the island a t which the incidence of abandonment began to decrease.
The displacement of some seals within two hundred me te r s of seismic l ines probably results in little, if any, increased mortality since, as we reported elsewhere (Kelly 1985; Kelly et al. 1986), individual seals use more than a single lair and a s many a s four or five la i r s each. Our telemetric s tud ie s indicated t h a t the distances between lairs used by individual seals averaged 572 m for females and 2,018 m for males (Kelly et al. 1986). We do not know if mortality would be likely to occur if individual seals were displaced completely from the areas containing all of their lairs. At the very least, such an event would be likely to increase intra-specific strife by
forcing displaced seals to use structures maintained by other seals.
That ringed seals respond to noise disturbances by fleeing into the water probably is the result of their subjection to predation by polar bears and arctic foxes. Weddell seals (Levtonychotes weddelli), which breed on the shore-fas t ice of Antarctica, have evolved in the absence of surface predators and are much less readily disturbed (Stirling 1977; Kooyman 1981). The r a t e s of r i n g e d s e a l s t r u c t u r e abandonment that we observed in areas of noise disturbance were more than three times greater than the overall rates in undisturbed areas but similar to the rates in areas of frequent predator activity.
Increasing the frequency with which ringed seals flee lairs may increase stress levels and energy demands a t times when rest is important to their well-being. Lair occupation becomes increasingly frequent and longer in duration throu hout t h e f? s p r i n g mon ths (Ke l ly e t a . 1 9 8 6 ) , apparently due to the seals' need to maintain h igh ep ide rma l t e m p e r a t u r e s w h i l e replacing their pelage (Feltz and Fay 1966).
Of potentially greater importance are the effects of disturbances t h a t cause structures to be completely abandoned. That occurrence would be deleterious especially for nursing pups. Furthermore, females with nursing young are more susceptible to disturbance in lairs by virtue of their more frequent and extended haulout bouts (Kelly et al. 1986). Short of abandoning a pup, female seals can take them through the water to alternate lairs (Smith and Stirling 1975; Taugbd 1982). If a newborn pup is forced into the water, however, i t may not survive the resultant heat loss. At birth, ringed seal pups do not have the insulating blubber layer that protects older seals from excessive heat loss when submerged. Pups that do survive swimming through the water to an alternate lair would have to expend significant amounts of their energy reserves in order to maintain core temperature while drying (Taugbd 1982). Those pups would be easier prey for polar bears and arctic foxes and would be less able to withstand other stresses.
Our investigation focused on the effects of noise disturbance on the seals' use of lairs and breathing holes. From our telemetric studies, we know tha t seals spend the majority of the time in the water under the

ice (Kelly et al. 1986). Little is known about their activities under the ice, although much of i t must involve feeding and, perhaps, terr i torial defense. Sound i s readily conducted throu h the ice into the water, f and the effects o noise disturbance on seals under the ice remains unknown. Recent experiments with captive ringed seals suggest t h a t ambient noise provides a critical navigational cue to seals swimming under ice in total darkness (Wartzok et al. 1987).
Acknowledgements
Much of this work was funded by the Minerals Management Service, Department of the Interior through an Interagency Agreement with the National Oceanic and Atmospheric Administration, Department of Commerce, as ar t of the Alaskan Outer C o n t i n e n t a l S h e l f E n v i r o n m e n t a l Assessment Program. Additional support was provided by the Department of Wildlife Managemen t , Nor th Slope Borough, Barrow, Alaska, and the U. S. Fish and Wildlife Service. We are grateful to those organizations and to a great many people who assisted in the field work and provided logistic support. We learned a great deal about ringed seals and the use of trained dogs for locating their subnivean structures from T. Smith and M. Hammill of the Arctic Biological Station, Ste. Anne de Bellevue, Quebec and J. Memorana, Holman, N. W. T. Personnel of Shell Western E & P, Inc., Geophysical Serv ices , Inc., Western Geophysical Co., Sefel Geophysical Co., NANA Regional Corporation, U. S. Coast Guard - Port Clarence LORAN Station, 711th Aircraft and Warning Squadron Radar Site - Cape Lisburne, Telonics, Inc., and the NOAA Helicopter Corps were extremely helpful to our efforts.
References
Boas, F. 1888. The central Eskimo. Bur. Amer. Ethnology, 399-699.
Burns, J. J. and Eley, T. J. 1978. The natural history and ecolow of the bearded seal ( ~ r i g n a t h u s barbatus) and the ringed seal (Phoca h i s p i d m . Dep. Commer., N O M X S E A P Environ. Assess. Alaskan Continental Shelf, Ann. Rep. Year Ending March 1978,l: 99-162.
Burns, J. J. and Harbo, S. J. 1972. An aerial census of ringed seals, northern coast of Alaska. Arctic 25: 279-290.
Burns, J. J. and Kelly, B. P. 1982. Studies of ringed seals in the Alaskan Beaufort Sea d u r i n g win te r : i m p a c t s of s e i s m i c exploration. Unpubl. ann. rep., OCSEAP Res. Unit 232, to U.S. Dep. Commer., NOAA, Off. Mar. Pollut. Assess., Juneau, Alaska, 57 pp.
Burns, J. J., Kelly, B. P. and Frost, K. J. 1981. Studies of ringed seals in the Beaufort Sea during winter. Executive Summay, 31 October 1981. OCSEAP Res. Unit 232, to U.S. Dep. Commer., NOAA, Off. Mar. Pollut. Assess., Juneau, Alaska. 81 pp.
Cox, S. L. and Spiess, A. 1980. Dorset settlement and subsistence in northern Labrador. Arctic 33: 659-669.
Feltz, E. T. and Fay, F. H. 1966. Thermal requirements in of epidermal cells from seals. CryobioT3: 261-264.
Geraci, J. R. and St. Aubin, D. J. 1980. Offshore petroleum resource development and mar ine mammals: a review a n d research recommendations. Mar. Fish. Rev. 42: 1-12.
Hall, C. F. 1866. Arctic researches and life among the Esquimaux: being the narrative of an expedition in search of S i r John Franklin, in the years 1860,1861, and 1862. Harper and Bros. Publ., N. Y., 595 pp.
Kelly, B. P. 1985. Dependence by ringed seals on subnivean lairs. Sixth Biennial Conference on the Biology of Mar ine Mammals. (Abstract).
Kelly, B. P., Quakenbush, L. and. Rose, J. R. 1986. Ringed seal winter ecology and effects of noise disturbance. Final rep., OCSEAP Res. Unit 232, Part 2, to U.S. Dep. Commer., NOAA, Natl. Ocean Serv., Ocean Assess. Div., Alaska Office, Anchorage, Alaska, 91 PP.
Kelly, B. P., Amstrup, S. C., Gardner, C. and Quakenbush, L. T. 1987. Predation on ringed seals in the western Beaufort Sea. Seventh Biennial Conference on the Biology of Marine Mammals, 5-9 December 1987, Miami, Florida. (Abstract).
Kooyman, G. L. 1981. Weddell sea l (Leptonychotes weddelli Lesson, 1826). 12

"Handbook of marine mammals" (S. H. Ridgway and R. J. Harrison F.R.S., eds.). Vol. 2: Seals. Academic Press, London, 275- 296.
Manning, T. H. 1944. Hunting implements and methods of the present-day Eskimos of north-west Hudson Bay, Melville Peninsula, and south-west Baffin Island. Geom. J. 103: 10-152.
Mansfield, A. W. 1983. The effects of vessel traffic in the arctic on marine mammals and recommendations for future research. Can. Tech. Rep. Fish. and Aquatic Sci. No. 1186. Ste-Anne-de-Bellevue, Quebec, 97 pp.
McLaren, I. A. 1958a. The economics of seals in the eastern Canadian arctic. Fish. Res. Board Can. Circ. 1,93 pp.
McLaren, I. A. 1958b. The biology of the ringed seal (Phoca hispida Schreber) in the eastern Canadian arctic. Fish. Res. Board Can. Bull. 118: 97 pp.
Norris, K. S. 1981. Marine mammals of the arctic, their sounds and their relation to alterations in the acoustic environment by man-made noise. In "The question of sound from icebreaker operations: the proceedings of a workshop February 23-24, 1981", Toronto, Ontario (N. M. Peterson, ed.). Arctic Pilot Proj., Petro-Canada, Calgary, Alberta, 304-309.
Rausch, R. L. 1973. Post mortem findings in some marine mammals following the Cannikin test on Amchitka Island. Ms. Atomic Energy Comm., Las Vegas, Nev. 86 PP.
Ronald, K. and Dougan, J. L. 1982. The ice lover: biology of the harp seal (Phoca groenlandica). Science 215: 928-933.
Schusterman, R. J. and Moore, P. W. B. 1980. Noise disturbance and audibility in
innipeds. J. Acoust. Soc. Am. 70, Suppl. 1, 583.
Smith, T. G . 1976. Predation of ringed seal pups (Phoca his ida) by the arctic fox (Alopex lagopu*n. J. Zool. 54: 1610- 1616.
Smith, T. G. and Stirling, I. 1975. The breeding habitat of the ringed seal (Phoca hispida). The birth lair and associated structures. Can. J. Zool. 53: 1297-1305.
Stefansson, V. 1913. My life with the Eskimos. MacMillan Co., New York, 538 pp.
Stewart, B. S. 1981. Behavioral response of northern elephant seals and California sea lions on San Nicolas Island. California. to loud impulse noise. J. ~ c b u s t . Soc. Am. Suppl. 1, Vol. 70, S84.
Stirling, I. 1977. Adaptations of Weddell and ringed seals to exploit the polar fast ice habitat in the absence or presence of surface predators. In "Adaptations within antarctic ecos stems" (G. A. Llano, ed.). Proceedings of the Third Symposium on Antarctic Biology. Gulf Publishing Co., Houston, Texas, 741-748. 1252 pp.
Taugb01, G. 1982 . R i n g e d s e a l thermoregulation, energy balance and development in early life, a study on P s hispida in Kongsfj., Svalbard. Unpubl. thesis, 102 pp. (Transl. from Norwegian by Can. Fish. Aquat. Sci., No. 5090, 1984, 109 pp.)
Wartzok, D., Elsner, R., Kelly, B. P., Mimken, G. and Quakenbush, L. T.. 1987. Visual, acoustic, and vibrissal contributions to under-ice navigation by ringed seals, Phoca his ida. Seventh Biennial Conference
of Marine Mammals, 5-9 December 1987, Miami, Florida. (Abstract).
Wenzel, G. 1984. Archaeological evidence for prehistoric Inuit use of the sea-ice environment. In "Sikumiut: the people who use sea ice" (A. Cooke and E. V. Alstine, eds.). C a n a d i a n Arc t i c Resources Committee, Ottawa, 41-59. 153 pp.
Smith, T. G . 1987. The ringed seal, Phoca his ida, of the Canadian western Arctic.
an. Bull. Fish. and Aquat. Sci. 216. + Ottawa, 81 pp.

RESPONSES OF MIGRATING NARWHAL AND BELUGA TO ICEBREAKER TRAFFIC AT THE ADMIRALTY INLET ICE-EDGE,
N.W.T. IN 1986
Susan E. Cosens Larry P. Dueck
Fisheries and Oceans, Winnipeg, Manitoba, CANADA
Abstract
A mobile ice-based camp was maintained at the mouth of Admiralty Inlet from 22 May to 10 July 1986. Aerial surveys of migrating whales were flown, using a Bell 206 Jet Ranger helicopter, both when ships were absent from the ice-edge and whales were presumed to be undisturbed and when ships were in the vicinity of the ice-edge. Numbers, distribution and behaviour of both narwhal and beluga were recorded. Data indicated that day-to-day variation in numbers and distribution of both species was substantial, making assessment of the effects of ship traffic and assocl-.zed noise on numbers difficult. Observa- tion of undisturbed whales indicated that migratory patterns, group size and general activity of narwhal dif- fered significantly from those of bel- uga. In the presence of ship traffic beluga showed an increase in non- directed movement, a decline in directed movement and a decline in inactivity. Narwhal showed no change in non-directed movement, an increase in slow directed movement and a slight
This is a reviewed and edited version of a paper presented at the Ninth International Conference on Port and Ocean Engineering Under Arctic Conditions, Fair- banks, Alaska, USA, August 17-22, 1987.
decline in inactivity. Changes in group structure and orientation in re- sponse to ship traffic also differed between the two species. Overall, re- actions of both species appeared to be less pronounced than was described in a previous study. This difference may be attributable to differences in ice conditions.
Introduction
As a result of recent interest in developing resources in the Arctic, there is concern that disturbance by shipping traffic and other industrial activity may have detrimental effects on marine mammal populations (see Mansfield 1983). Both industry and government have directed effort to ad- dress these concerns. Most of the re- search has taken place in the Beaufort Sea area where exploration for hydro- carbons, including seismic and drill- ing operations, has been most inten- sive. Research has focussed on large cetaceans, such as the bowhead whale (Balaena mysticetus) (eg. Ljungblad et al. 1985; Richardson 1985; Richardson et al. 1985). The beluga whale (Delphinapterus leucas) has also been the subject of similar studies in the western Arctic (see Ford 1977; Fraker 1983).

E x p l o r a t i o n f o r hydrocarbons i n t h e e a s t e r n A r c t i c h a s been l i m i t e d b u t o t h e r i n d u s t r i a l a c t i v i t i e s , in- c l u d i n g mining, have r e q u i r e d t h e u s e o f i c e b r e a k e r s and t a n k e r s i n t h e Northwest Passage. The Arvik and Nan- a s i v i k mines, f o r example, send sh ip- ments of o r e t o Europe each summer. Government and i n d u s t r y have coopera t- ed i n e f f o r t s t o ex tend t h e s h i p p i n g s e a s o n i n t h e e a s t e r n A r c t i c by b r ing- ing t h e i c e b r e a k i n g t a n k e r MV A r c t i c t o Nanasivik a t t h e n o r t h end of B a f f i n I s l a n d , Northwest T e r r i t o r i e s , d u r i n g t h e f a s t i c e season. More e f f o r t h a s been d i r e c t e d toward b r ing- i n g t h e s h i p i n b e f o r e break-up r a t h e r than d u r i n g t h e w i n t e r f reeze- up per- iod .
E a r l y s h i p p i n g raises p o t e n t i a l problems of i n t e r f e r e n c e w i t h c e t a c e a n m i g r a t i o n s through Lancas te r Sound. I n 1982, a s t u d y of r esponses of na r- whal (Monodon monoceros) and be luga t o i c e b r e a k e r t r a f f i c was begun by LGL a t t h e Admiral ty I n l e t ice edge. At t h a t t ime , t h e MV- A r c t i c , acco ipan ied by a Canadian Coastguard i c e b r e a k e r , was making one round t r i p through t h e f a s t i c e of Admiral ty I n l e t a t t h e end of June , abou t t h e t ime t h a t t h e odonto- c e t e m i g r a t i o n b e g i n s t o peak. Re- s u l t s from t h i s s t u d y i n d i c a t e d t h a t ( 1 ) o d o n t o c e t e s moved away from loca- t i o n s where i c e b r e a k e r s were g e n e r a t- i n g n o i s e , ( 2 ) i n i t i a l avoidance re- sponses occur red when s h i p s were over 40 km from t h e i c e edge and (3) be luga and narwhal were b e h a v i o u r a l l y d i f f e r - e n t i n t h e i r r e s p o n s e s t o i c e b r e a k e r d i s t u r b a n c e .
I n t e n d i n g t o expand t h e work t h a t LGL conducted, we began our s tudy i n 1986. We in tended t o moni to r odon- t o c e t e m i g r a t i o n p a t t e r n s over a long- e r p e r i o d of t ime t h a n had been done p r e v i o u s l y , and t o compare non- d i s t u r b a n c e w i t h d i s t u r b a n c e pat- t e r n s . We wanted t o q u a n t i f y be- hav iour p a t t e r n s of bo th be luga and narwhal such t h a t s t a t i s t i c a l compari- sons of behav iour between s p e c i e s and between d i s t u r b a n c e c o n d i t i o n s cou ld be made. We conducted 27 h e l i c o p t e r su rveys between 22 May and 6 J u l y and c o l l e c t e d d a t a on t h e behaviour of be luga and narwhal dur ing two passages
of a s i n g l e s h i p and one passage of two s h i p s through t h e f a s t i c e . T h i s paper summarizes t h e d a t a on numbers, d i s t r i b u t i o n , a c t i v i t y and o r i e n t a t i o n c o l l e c t e d d u r i n g t h e s e su rveys .
M a t e r i a l s and Methods
We e s t a b l i s h e d a mobi le i ce - based camp a t t h e mouth of Admiral ty I n l e t (73O45'N 84'05'W) on 22 May and conducted a e r i a l su rveys from 24 May t o 6 J u l y . Our s u r v e y s inc luded t h r e e o b s e r v e r s i n a B e l l 206 J e t Ranger h e l i c o p t e r t h a t f l e w a t a n a l t i t u d e of abou t 230 m and a speed of about 1 6 0 km/hour. We planned t o proceed e a s t from o u r camp a l o n g t h e f l o e edge t o Navy Board I n l e t , n o r t h u n t i l we were s e v e r a l k i l o m e t r e s from t h e f l o e edge, west t o Cape Crauford, t h e n r e t u r n t o camp. Th i s f l i g h t p a t h would have covered t h e mouth of Admiral ty I n l e t bo th c l o s e t o and s e v e r a l k i l o m e t e r s from t h e s h e a r l i n e . Ac tua l f l i g h t p a t h s were v a r i a b l e (F ig . 1 ) . Pack i c e was heavy, and our su rvey r o u t e u s u a l l y fol lowed open l e a d s which were i r r e g u l a r i n d i s t r i b u t i o n . We f r e- q u e n t l y made r e t u r n f l i g h t s halfway o r more a c r o s s L a n c a s t e r Sound, f o l l o w i n g t h e edge of t h e pack i c e . Occasional- l y , Lancas te r Sound was comple te ly covered i n pack i c e s o l a r g e a r e a s of open wa te r were i n f r e q u e n t l y encount- e r e d . There was no l a n d- f a s t i c e edge a c r o s s Lancas te r Sound i n 1986, t h u s o u r w e s t e r l y f l i g h t s were l i m i t e d o n l y by f u e l r equ i rements .
Whales observed w i t h i n a 250 m s t r i p on e i t h e r s i d e of t h e h e l i c o p t e r were i d e n t i f i e d t o s p e c i e s , counted and, when p o s s i b l e , c l a s s e d t o s e x and g r o s s age ( a d u l t , sub- adul t , new- born) . T h e i r ongoing behav iour , o r i e n t a t i o n and g e n e r a l movement speed was noted. We a l s o recorded i c e con- d i t i o n s by e s t i m a t i n g % i c e cover w i t h i n t h e 500 m su rvey s t r i p . Chang- e s i n i c e c o n d i t i o n s , h e l i c o p t e r a l t i - t u d e , f l i g h t speed and b e a r i n g were recorded on c a s s e t t e r e c o r d e r s .
Ongoing behaviour was c l a s s i f i e d i n t o f o u r c a t e g o r i e s : (1) d i r e c t e d movement - whales main ta ined c o n s t a n t

hanging - body t o t a l l y submersed below t h e wa te r s u r f a c e .
Lancaster
Sound
F i g u r e 1. a ) A su rvey made on 1 0 June t h a t fol lowed o u r p r e f e r r e d f l i g h t path . b ) A su rvey made on 25 May t h a t d e v i a t e d from o u r p r e f e r r e d f l i g h t path . Hatched a r e a s r e p r e s e n t l and f a s t i c e .
d i r e c t i o n d u r i n g swimming movements, ( 2 ) c i r c l i n g - whales changed t h e d i - r e c t i o n i n which t h e y were swimming, (3) deep d i v e - whales d i s a p p e a r e d from view a f t e r a d i v e , 4) r e s t i n g - whales remained s t a t i o n a r y showing no locomotory behaviour . The l a t t e r c a t- egory was f u r t h e r c l a s s i f i e d by n o t i n g l o c a t i o n of whales r e l a t i v e t o t h e wa te r s u r f a c e : (1) back exposed - backs b reak ing t h e wa te r s u r f a c e , ( 2 )
We e s t i m a t e d t h e b e a r i n g o f s i g h t e d whales r e l a t i v e t o t r u e nor th . O r i e n t a t i o n r e l a t i v e t o s h i p s p r e s e n t i n t h e su rvey a r e a d u r i n g d i s- t u r b a n c e su rveys were c a l c u l a t e d l a t e r i n t h e l a b o r a t o r y . Movement speed of whales was c l a s s i f i e d e i t h e r a s s low o r moderate t o f a s t . Fast-moving whales e x h i b i t e d more v i g o r o u s f l u k e s t r o k e s and r a i s e d more of t h e i r backs above t h e wa te r than d i d slow-moving whales. F a s t movement was a lways d i- r e c t e d and o f t e n synchronous w i t h i n t h e group.
We conducted su rveys d u r i n g non- d i s t u r b a n c e p e r i o d s a t v a r i o u s t imes of day t o de te rmine whether t h e r e was any ev idence of d i u r n a l v a r i a t i o n i n behav iour and t o c o n t r o l f o r d i f f e r e n- c e s i n t i m e of day between d i s t u r b a n c e and non- dis turbance su rveys (Tab le 1 ) . We could no t p r e d i c t when s h i p s would a r r i v e a t t h e i c e edge, bu t were a b l e t o i n c r e a s e t h e chances t h a t con- t r o l and d i s t u r b a n c e su rveys would be done a t comparable t imes of day.
We used t h e Canadian T ide and C u r r e n t Tab les , w i t h Dundas Harbour on Devon I s l a n d (F ig . 1 ) a s o u r p o i n t of
Table 1. D i s t r i b u t i o n of c o n t r o l and d i s t u r b a n c e su rveys r e l a t i v e t o t ime of day.
Time Number of Surveys
Cont ro l Dis tu rbance (no s h i p ) ( s h i p )

r e f e r e n c e , t o determine t h e t i d e s t a t e f o r each survey (Table 2 ) .
Table 2. Number of surveys conducted dur ing d i f f e r e n t types of t i d a l a c t i v- i t y . Note t h a t more c o n t r o l than d i s- turbance surveys were conducted d u r i n g ebb t i d e s .
Weather c o n d i t i o n s were recorded a t l e a s t twice d a i l y . We used a hand he ld anemometer t o record wind speed and a s l i n g psychrometer t o record d r y bu lb temperature. During surveys we noted o b s t r u c t i o n s t o v i s i b i l i t y of whales inc lud ing fog , l i g h t snow and sea s t a t e c o n d i t i o n s .
Ris ing High Ebb Low
Nondist. 2 3 7 4
D i s t . 3 4 2 2 We used a r a t h e r broad d e f i n i-
t i o n of d i s t u r b a n c e by inc lud ing s h i p s w i t h i n 130 km of t h e f l o e edge. Given t h a t whales were expected t o occur throughout Lancas te r Sound dur ing a s h i p passage, we d i d not want t o ex- c l u d e t h e p o s s i b i l i t y t h a t d i s t u r b e d whales might move ahead of t h e s h i p a s i t t r a v e l l e d eastward toward Admiralty I n l e t . We conducted 16 c o n t r o l s u r- veys where s h i p s were not a c t i v e i n t h e v i c i n i t y of t h e Admiralty I n l e t i c e edge and 11 d i s t u r b a n c e surveys
when s h i p s were e i t h e r moving through Lancas te r Sound o r t h e f a s t i c e of Admiralty I n l e t (Table 3 ) . We main- t a i n e d r a d i o c o n t a c t w i t h both t h e = des G r o s s e l i e r s and t h e MV A r c t i c and - were a b l e t o o b t a i n updates of s h i p p o s i t i o n s a t t h e t ime of our surveys .
Table 3 . Approximate s h i p p o s i t i o n s dur ing d i s t u r b a n c e surveys conducted a t Admiralty I n l e t dur ing 1986.
Survey Date I d e n t i f i c a t i o n Ship Locat ion A c t i v i t y
1 1 3 June MV A r c t i c moving west moving icebreak ing through f l o e edge icebreak ing moving sou th s t a t i o n a r y r e t u r n i n g - moving n o r t h along s h i p t r a c k moving west i cebreak ing through f l o e edge fo l lowing icebreak ing moving sou th fo l lowing moving e a s t i cebreak ing through f l o e edge r e t u r n i n g - moving n o r t h through f l o e edge
-- CCG des G r o s s e l i e r s -- MV A r c t i c 12 4 June
13 6 June MV A r c t i c --
1 4 8 June 17 11 June
CCG des G r o s s e l i e r s -- MV A r c t i c --
18* 12 June 2 3 25 June
CCG des G r o s s e l i e r s -- CCG d e s G r o s s e l i e r s -- Lady F r a n k l i n CCG des G r o s s e l i e r s -- Lady F r a n k l i n CCG des G r o s s e l i e r s -- MV A r c t i c --
24 27 June 73'19'N 85'24'W a s above
74O26'N 82O38'W 73'42'N 84'43'W
2 5 2 J u l y 26 3 J u l y
27 6 J u l y MV A r c t i c -- - - - - - --
*MV A r c t i c a t mouth of Lancaster Sound.

Results
Aerial survey conditions
Weather conditions were similar for both control and disturbance sur- veys. No significant differences occurred in dry bulb air temperature, wind speed, wind direction or minimum visibility (Table 4). Sea state, estimated on the Beaufort Scale, 70
ranged from5 to 4 during control sur- veys and 0-3 during disturbance sur- veys. One possible source of differ-
Table 4. Summary of weather condi- tions during 16 control and 11 non- disturbance surveys. -
(0 * Survey Type i2 I,
were done. All non-disturbance sur- veys were completed by 23 June. Of 11 disturbance surveys, 5 were not comp- leted until after this date, when break-up began to occur.
- Control Disturbance 0
70
Temperature ( OC) -1.6 3.8 +0.8 2.1
Wind dirO 220 89.4 243 124.0
Wind speed (kn) 7.5 5.5 4.1 3.3
Minimum visibility (km) 20.7 8.2 16.2 5.8
ence between control and disturbance surveys was the relatively larger num- ber of non-disturbance surveys (Table 2) done during ebb tides. Control and disturbance surveys also differed sig- nif icantly (x =904.6, df=4, p<0.001) in ice coverage. During non- disturbance surveys, we encountered 80-100% ice more frequently (Fig. 2a) than any other single category. In contrast, during disturbance surveys 0-20% ice was most frequently encoun- tered (Fig. 2b). The disparity in ice coverage likely is a reflection of differences in the dates when surveys
narwhal
beluga
Percent Ice Cover
Figure 2. Relative frequency of ice types and associated narwhal and belu- ga during a) control surveys and b) disturbance surveys.
Narwhal and beluga abundance
Numbers of narwhal seen during surveys varied from i C to 714 (Fig 3). The peak in numbers occurred on the last survey day. Throughout the last week of May and the month of June, we saw no more than 88 narwhal during a single survey. Abundance increased dramatically in July. A total of 538 narwhal were seen during control sur-

veys compared to 1182 during disturb- ance surveys. This was equivalent to averages of 32 (SD=32.1) and 107 (SD=211.1) narwhal/survey seen during control and disturbance periods re- spectively.
May June July
Survey Date
Figure 3. Abundance of migrating nar- whal seen during control surveys (c) and disturbance surveys (d).
Beluga were seen less regularly and occurred in fewer numbers than did narwhal (Fig. 4). The largest number of beluga found during any given sur- vey was 109, seen on 9 June, when the peak in numbers was recorded. We saw 259 beluga in total during non- disturbance and 198 during disturbance surveys, or averages of 16 (SD=27.5) and 18 (SD=30.2) beluga/survey respec- tively.
Narwhal were absent from only two surveys, neither of which were disturbance surveys. Beluga were ab- sent during 5 of 16 non-disturbance surveys and during 7 of 11 disturbance surveys. T is difference was not sig- 9 nificant (x = 2.74, df=l, p>.05). On
five of the seven disturbance surveys when beluga were absent, the ship was <50 km away from the ice edge.
June July
Survey Date
Figure 4. Abundance of migrating bel- uga seen during control surveys (c) and disburbance surveys (d).
Narwhal and beluga distribution
During control surveys a dispro- portionately large number of narwhal were located in 80-100% ice cover (Fig. 2a) as compared to other ice types (x = 73.2, df=4, p<.001). Bel- uga, in contrast, showed a strong pre- fe ence for less than 60% ice cover 5 (X = 346.2, df=4, p<.001).
During disturbance surveys, both species showed a shift in distribution relative to ice. Narwhal were bimodal in their preferences. A dispropor- tionate number of narwhal were seen in 10-20% and 60-80% ice cover (Fig. 2b). Their distribution differed signifi- cantly (x = 868.2, df=4, p<.001) from the relative frequency of ice types recorded during disturbance surveys.

Narwhal were seen i n more open water dur ing d i s t u rbance than dur ing non- d i s t u rbance surveys.
Beluga d i s t r i b u on a l s o d i f - - f e r ed s i g n i f i c a n t l y ( x = 46.4, d e 4 , p<.001) from expec t a t i ons based on i c e cover. However they were found i n d i sp ropo r t i ona t e ly l a r g e numbers i n i c e cover of 40-60% (Fig. 2b). This p a t t e r n c o n t r a s t s wi th t he non-distur- bance p a t t e r n where they were l i k e l y a l s o t o be found i n more open water.
Group s t r u c t u r e
During non-disturbance surveys 53% of t he narwhal groups observed c ons i s t ed of s i n g l e i nd iv idua l s (Table 5 ) . The remainder occurred i n groups ranging i n s i z e from 2 t o 11 indiv id- ua l s . Average group s i z e was 2.2 (SD=1.9). Beluga groups ranged i n s i z e from 1 t o 32 i nd iv idua l s with 62% of t he groups being made up of one i nd iv idua l . Average group s i z e was 3.0 (SDx5.6). Beluga d i f f e r e d s i gn i- f i c a n t l y from narwhal i n t h a t s i n g l e beluga occurred more f r equen t l y than s i n g l e narwhals, whereas groups of 2-3
Table 5. Percent of narwhal and belu- ga groups i n seven s i z e c a t e g o r i e s dur ing c o n t r o l and d is turbance sur- veys.
% Narwhal % Beluga Groups Groups
*Group S i ze Cont. Disturb. Cont. Dis turb .
T o t a l groups 233
* For s t a t i s t i c a l comparison of nar- whal and beluga, group s i z e s were c l a s s ed a s 1, 2-3, 4-5 and 6+.
beluga occurred l e s s f r uen t l y than e groups of 2-3 narwhal ( x = 23.64, df = 3, p<.OOl).
During d i s t u rbance surveys , nar- whal group s i z e averaged 3.3 (SD=2.8) i nd iv idua l s . Group s i z e s of one oc- cur red s i g n i f i c a n t l y l e s s o f t e n dur ing d i s t u rbance surveys t n dur ing non- v dis turbance surveys ( x = 38.9, df=6, p<.001). During d i s t u rbance per iods , up t o 15 narwhal were seen i n a s i n g l e group. Beluga groups averaged 2.8 (SD=6.2) when sh ip s were i n t he s tudy a r ea . Group s i z e d id no t change s ig- n i f i c a n t l y from what i t had been dur- ing c o n t r o l surveys. We d id f i nd one group of 50 i nd iv idua l s so t he range of group s i z e was l a r g e r i n beluga than narwhal both dur ing c o n t r o l and d i s t u rbance surveys.
Narwhal and beluga a c t i v i t y
Half t he narwhal observed dur ing non-disturbance surveys (Table 6) were engaged i n d i r e c t e d movement. The re- mainder were most ly involved i n back exposed behaviours , hanging and c i r c l - ing. Undisturbed behaviour of beluga (Table 6 ) d i f f e r e d s i g n i f i c a n t l y from t h a t of narwhal (x = 190.4, d f=6 , p<.001). Beluga were more f r equen t l y engaged i n slow d i r e c t e d movement than were narwhal. Overa l l , 73% of beluga showed d i r e c t movement compared t o 51% of narwhal, and conversely only 19% of beluga were c l a s s ed a s i n a c t i v e com- pared t o 41% of t he narwhal. I nac t i v- i t y by beluga was u sua l l y c l a s s i f i e d a s hanging where whales were submerg- ed, but not showing locomotory behav- lour . They were r a r e l y seen a s back exposed. Narwhal, however, were r a r e - l y seen hanging; i n a c t i v i t y i n t h i s spec i e s u sua l l y involved back exposed behaviour.
When sh ips were presen t i n the v i c i n i t y of the ice- edge, narwhal 5 e: haved s i g n i f i c a n t l y d i f f e r e n t l y ( x - 146.9, dfÈ6 p<.001) than they d i d i n t h e absence of sh ip s . Fewer narwhal were engaged i n back exposed and c i r - c l i n g movements dur ing d i s t u rbance surveys. More were showing slow d i r e c t e d movement than dur ing non- d i s t u rbance surveys. Beluga a l s o changed t h e i r behaviour dur ing d i s t u r -

Table 6. Percentages of migra t ing narwhal and beluga involved i n d i f f e r e n t a c t i v i t i e s dur ing c o n t r o l and d i s t u rbance surveys.
% Narwhal % Beluga Ac t i v i t y*
Control Disturbance Control Disturbance
Di rec ted movement 34 30 3 6 2 1 Slow d i r e c t e d movement 16 2 6 38 39 Back exposed 2 4 25 2 <1 Back exposed - moving 10 5 2 2 Hanging 7 5 15 1 Ci r c l i ng 3 <1 < 1 1 0 Deep d ive 9 <1 0 0 Unknown 5 8 7 26 To t a l 538 1182 259 198
*Chi square va lues were ca l cu l a t ed us ing whales of known behaviour. Analysis comparing beluga a c t i v i t y dur ing c o n t r o l and d is turbance surveys combined 'back exposed' and 'back exposed - movement' c a t ego r i e s .
bance surveys ( x 2 = 390.8, df=4, p<.001). There was a major change i n non-directed behaviour. Fewer beluga were engaged i n hanging behaviour than had been the case i n non-disturbance surveys , and t he r e was a s u b s t a n t i a l i nc r ea se i n the propor t ion of beluga engaged i n c i r c l i n g behaviour (Table 6 ) -
During d i s t u rbance surveys, bel- uga and narwhal continued t o d i f f e r s i g n i f i c a n t l y ( x = 73.9, df=4, p<.001) i n t h e i r a c t i v i t y pa t t e rn s . (For purposes of t h i s a n a l y s i s c l a s s e s inc lud ing hanging, c i r c l i n g and deep d ive were combined.) As was t he case dur ing non-disturbance surveys r e l a- t i v e l y more beluga than narwhal were engaged i n slow d i r e c t e d movement and fewer beluga than narwhal were engaged i n back exposed behaviour. I n con- t r a s t t o non-disturbance surveys, the two spec i e s d id no t d i f f e r substan- t i a l l y i n the propor t ion of ind iv id- u a l s involved i n back exposed move- ment. C i r c l i ng was a l s o more common i n beluga than i n narwhal dur ing d i s- turbance surveys. It had been l e s s common i n beluga dur ing non- d i s t u rbance surveys.
Or i en t a t i on
When sh ip s were absent from the s tudy a r e a , 39% of narwhal were seen fac ing a wes te r ly d i r e c t i o n (Table 7) . The remainder were d i s t r i b u t e d
Table 7. Or i en t a t i on of narwhal and beluga dur ing con t ro l and d is turbance surveys. Whales f o r which headings were unce r t a in o r unknown a r e no t considered here.
D i r ec t i on Z Narwhal % Beluga
Cont. Disturb. Cont. Disturb.
Tota l 391 584 253 132

fairly evenly among other directions. Orientation differed significantly from random (x = 278.6, df=6, p<.001). About 25% of the beluga were facing west, another 28% were seen 28% facing northwest and about 39% were seen facing east. Beluga orientation also d ffered significantly from ran- \ dom (x = 138.0, df=6, p<.001).
When ships were present, narwhal showed a significant increase in th$ number of individuals heading east (x = 170.7, df=7, p<.001). Numbers head- ing west remained about the same, but numbers moving in other directions, eg. northwest, northeast, southeast were reduced. Beluga appeared to re- act differently than did narwhal. More beluga were seen moving west dur- ing disturbance surveys than during control surveys. In general, numbers moving in other directions were reduc- ed. Orientations of beluga during non-disturbance and disturbance sur- veys were significantly different ( x 2 = 88.9, df=7, p<.001).
To determine how changes in orientation were related to ship traf- fic, direction relative to ship loca- tion was calculated in the lab. Of narwhal observed during disturbance periods 268 individuals faced away from the ship, 167 individuals faced toward the ship and 147 faced a neu- tral direction. A random distribution would predict an equal number facing all directions. The observed distri- bution differed significantly from random (x = 43.4, df = 2, p<.01) with more narwhal facing away from the ship than would be expected by chance.
Beluga were encountered too in- frequently during disturbance surveys to accurately determine the effects of vessel traffic on orientation. About equal numbers were seen moving toward and away from the ship (67 and 65 re- spectively). These values come mainly from two surveys, one where the ship was still >50 km away and 57 out of 71 beluga were oriented toward the ship. In the second survey the ship was <50 km away, and 49 out of 52 beluga were oriented away from it. This apparent effect of ship distance was also ob- served in narwhal. When the ship was
<SO km from the floe edge, 226 narwhal were oriented away from the ship, and 125 were oriented toward it. At >50 km about 42 were directed toward and 42 were directed away from the ship. In the latter case there were more narwhal in a neutral (95 or 53%) pos- ition compared to when the ship was close (52 or 13%).
Alternate hypotheses
The null hypothesis states for each dependent variable that there will be no measureable difference in behaviour between the non-disturbance and disturbance surveys. Rejecting the null, given that all other potent- ially confounding variables have been controlled, indicates that behavioural changes can be attributed to disturb- ance by ship traffic. Failing to re- ject the null indicates that behaviour either did not change when ships were present, or that behavioural changes can be attributed to some other fac- tor.
In this study, variation in the numbers of narwhal seen could not be attributed to ship traffic. Similar- ly, mean group size of migrating bel- uga did not vary between non- disturbance and disturbance surveys. Significant differences between non- disturbance and disturbance surveys were found in : 1) mean group size of narwhal, 2) distribution of observed whales of both species relative to ice cover, 3) activity patterns of indi- viduals of both species, and 4) orien- tation of individuals of both species.
Although we attempted to control confounding sources of variation, there were five factors that we felt could contribute to the observed dif- ferences between the control and dis- turbance surveys: 1) date, 2) rela- tive abundance, 3) ice cover, 4) time of day, and 5) tide state. The first factor was survey date. Twelve of 16 non-disturbance surveys were conducted before the median survey date of 14 June. Only 4 of 11 disturbance sur- veys had been conducted on or before this date. Biases in survey timing could perhaps explain results as ef- fectively as the presence or absence
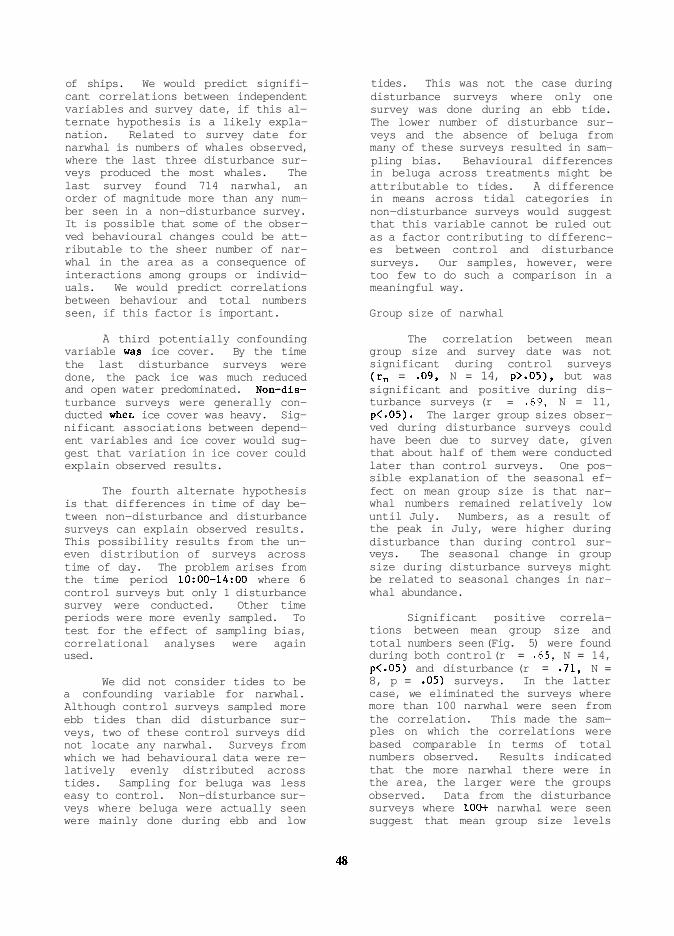
of ships. We would predict signifi- cant correlations between independent variables and survey date, if this al- ternate hypothesis is a likely expla- nation. Related to survey date for narwhal is numbers of whales observed, where the last three disturbance sur- veys produced the most whales. The last survey found 714 narwhal, an order of magnitude more than any num- ber seen in a non-disturbance survey. It is possible that some of the obser- ved behavioural changes could be att- ributable to the sheer number of nar- whal in the area as a consequence of interactions among groups or individ- uals. We would predict correlations between behaviour and total numbers seen, if this factor is important.
A third potentially confounding variable wa.s ice cover. By the time the last disturbance surveys were done, the pack ice was much reduced and open water predominated. Non-dis- turbance surveys were generally con- ducted wher. ice cover was heavy. Sig- nificant associations between depend- ent variables and ice cover would sug- gest that variation in ice cover could explain observed results.
The fourth alternate hypothesis is that differences in time of day be- tween non-disturbance and disturbance surveys can explain observed results. This possibility results from the un- even distribution of surveys across time of day. The problem arises from the time period 10:OO-14:OO where 6 control surveys but only 1 disturbance survey were conducted. Other time periods were more evenly sampled. To test for the effect of sampling bias, correlational analyses were again used.
We did not consider tides to be a confounding variable for narwhal. Although control surveys sampled more ebb tides than did disturbance sur- veys, two of these control surveys did not locate any narwhal. Surveys from which we had behavioural data were re- latively evenly distributed across tides. Sampling for beluga was less easy to control. Non-disturbance sur- veys where beluga were actually seen were mainly done during ebb and low
tides. This was not the case during disturbance surveys where only one survey was done during an ebb tide. The lower number of disturbance sur- veys and the absence of beluga from many of these surveys resulted in sam- pling bias. Behavioural differences in beluga across treatments might be attributable to tides. A difference in means across tidal categories in non-disturbance surveys would suggest that this variable cannot be ruled out as a factor contributing to differenc- es between control and disturbance surveys. Our samples, however, were too few to do such a comparison in a meaningful way.
Group size of narwhal
The correlation between mean group size and survey date was not significant during control surveys (r,, = .09, N = 14, p>.05), but was significant and positive during dis- turbance surveys (r = .69, N = 11, p<.05). The larger group sizes obser- ved during disturbance surveys could have been due to survey date, given that about half of them were conducted later than control surveys. One pos- sible explanation of the seasonal ef- fect on mean group size is that nar- whal numbers remained relatively low until July. Numbers, as a result of the peak in July, were higher during disturbance than during control sur- veys. The seasonal change in group size during disturbance surveys might be related to seasonal changes in nar- whal abundance.
Significant positive correla- tions between mean group size and total numbers seen (Fig. 5) were found during both control (r = .65, N = 14, p<.05) and disturbance (r = .71, N = 8, p = .05) surveys. In the latter case, we eliminated the surveys where more than 100 narwhal were seen from the correlation. This made the sam- ples on which the correlations were based comparable in terms of total numbers observed. Results indicated that the more narwhal there were in the area, the larger were the groups observed. Data from the disturbance surveys where LOO+ narwhal were seen suggest that mean group size levels

off at 4 whales (Fig. 5). We do not know whether this trend also occurs during non-disturbance conditions. Total numbers cannot, therefore, be ruled out as a factor contributing to differences in mean group size between control and disturbance surveys.
Total Narwhal
Figure 5. Relationship between mean group size and total numbers of nar- whal during control (c) and distur- bance (d) surveys.
Mean group size did not vary with time of day, thus time of day ef- fects did not contribute to observed differences in mean group size between treatment groups. We also compared group size in different categories of ice cover and found no significant as- sociation between group size and % ice cover. Variation in ice cover was therefore not a contributing factor to variation in mean group size across treatments.
Distribution relative to ice cover
Significant differences in dis- tribution of both narwhal and beluga relative to ice cover were found be- tween control and disturbance sur- veys. These changes in distribution
resulted in narwhal being found in more open water and beluga in less open water during disturbance than during control surveys. Seasonal changes in ice alone do not explain observed variation in whale distribu- tion because the distribution of whales was not random relative to ice cover. Whales may change their habi- tat preferences during the course of the migratory period, but this hypo- thesis cannot be tested with the pre- sent data.
General activity
Both narwhal and beluga showed behavioural differences between con- trol and disturbance surveys. Narwhal activity did not vary significantly with survey date nor time of day in either treatment category. There is no indication that behaviour varied with ice type during non-disturbance surveys, but during disturbance sur- veys, the proportion of narwhal engag- ed in directed movement is somewhat lower than predicted and back exposed is somewhat higher than predicted in 40 to 80% ice than in other ice types (Table 8). The percentage of narwhal for which behaviour was unknown was also higher for these categories. Data are really too limited to indi- cate anything stronger than a trend at this time.
Table 8. Percent of narwhal showing directed movement (all DM) and back exposed (BE) behaviour relative to ice type.
Ice Class Control Disturbance
All DM BE Unkn. All DM BE Unkn.
* During disturbance surveys, no nar- whal were seen in 20-40% ice cover.

Behavioural activity of narwhal was compared with total numbers of in- dividuals seen. For slow directed movement, there was a significant pos- itive correlation (r=.65, N=14, p<.05) found during control surveys, but not during disturbance surveys either when total numbers of less than 100 were used r=-.23, N=8) or when all surveys were included (r=-.37, N=11) in the analysis. Correlations of other be- havioural activities with total num- bers were not significant. These re- sults suggest that narwhal behaviour was affected by the presence of ships.
Beluga numbers were really too small to analyze for effects of poten- tially confounding variables. Data that we do have suggest that beluga activity does not vary with survey date, numbers of animals seen or time of day. Further data collection is needed to test for effects of tides and ice on behaviour patterns.
Orientation
That whales orient away from ships that are in close proximity to them suggests that it is the ship rather than some extraneous factor af- fecting orientation. That this pat- tern becomes more pronounced as the distance to incoming ships declines further supports rejection of the null hypothesis, that ship traffic has no effect on orientation.
Discussion
We examined disturbance effects of ship traffic on four aspects of odontocete migratory behaviour: rela- tive abundance, distribution, activity and orientation. Data were collected over a period of about six weeks. Being able to conduct replicate sur- veys enabled us to evaluate day to day variation in abundance and behaviour and to examine environmental factors that may influence migration patterns of odontocetes. Although we attempted to control for factors, unrelated to disturbance, that might affect behav- lour and abundance we found that sur- vey date, numbers of narwhal seen, ice
cover, time of day and tidal cycles were not evenly distributed across treatments. In the case of some de- pendent variables we were able to ex- amine the effects of confounding fac- tors, but in the case of others more data are required to determine whether the apparent disturbance effects are real.
Variation in narwhal abundance and mean group size could not be at- tributed solely to disturbance ef- fects. The season was unusual in that heavy pack ice occurred in Lancaster Sound and elsewhere. We saw few nar- whal until 6 July when a large influx of migrants occurred. Our sightings of large numbers of narwhal were about 2 weeks later in the season than were those made by Finley et al. (1984) and Miller and Davis (1984). This differ- ence may have been due to 1) the nearly continuous ship traffic into Admiralty Inlet in 1986 delaying the migration or 2) the very different ice conditions experienced by the two studies. Finley et al. (1984) and Miller and Davis (1984) examined the effects of one round trip involving the MV Arctic and one coastguard ice- breaker at the end of June or first week in July. By the time we surveyed during the July passage of the Arctic, there had been two passages involving four ships already made, thus there Is the possibility that vessel activity in 1986 may have de- layed the migration. Alternatively, the previous studies experienced more severe ice conditions than did we. There was land fast ice across Lancaster Sound west of Admiralty Inlet in 1982 and east of Admiralty Inlet in 1983 and 1984. During our study there was no fast ice across Lancaster Sound. Migrating whales were able to continue moving past Admiralty Inlet, thus there were no large concentrations of whales waiting for break-up. Our relatively low num- bers toward the end of June may have been an apparent rather than real de- lay in migration. There is also the possibility that the pack ice itself slowed down the migration. Kingsley (pers. comm.) indicated on 13 June that narwhal were absent and the pack ice heavy at the Pond Inlet ice edge.

Although our d a t a were not suf- f i c i e n t t o be conc lus ive , they do sug- g e s t t h a t beluga abundance on t h e s t u d y a r e a depended on s h i p t r a f f i c . The i r absence dur ing most of t h e d i s- turbance surveys would i n d i c a t e t h e beluga a r e more l i k e l y than a r e nar- ance. F i n l e y and Davis (1984) s t a t e t h a t beluga moved f u r t h e r away and re- mained away from t h e d i s t u r b a n c e a r e a longer than d i d narwhal. Our r e s u l t s a r e c o n s i s t e n t w i t h t h e s e observa- t i o n s .
Beluga showed no s i g n i f i c a n t v a r i a t i o n i n mean group s i z e between c o n t r o l and d i s t u r b a n c e surveys. Of course , t h e low numbers seen d u r i n g d i s t u r b a n c e surveys makes comparison d i f f i c u l t bu t we cannot , a t t h e pre- s e n t t ime, sugges t t h a t group s i z e was a f f e c t e d by d i s t u r b a n c e from v e s s e l a c t i v i t y . Barber and Hochheim (1986) conducted a photographic survey from a Twin O t t e r a i r c r a f t a long t h e Admiralty I n l e t f l o e edge dur ing a d i s t u r b a n c e per iod . They l o c a t e d 5 groups of beluga c o n t a i n i n g 3-6 an i- mals. Only 8% of beluga were seen a s s o l i t a r y i n d i v i d u a l s . Although t h i s percentage was much smal le r than o u r s , t h e upper l i m i t of 38 beluga i n one group was s i m i l a r t o our va lue of 32. They a l s o found, c o n s i s t e n t with our o b s e r v a t i o n s , t h a t narwhal g r ups ty- p i c a l l y d i d not c o n t a i n l a rge lnumbers of i n d i v i d u a l s . They recorde a maxi- m of 7 narwhal i n one group?
From photographs, ~ a r b e r and Hochheim (1986) were a b l e t o measure group d e n s i t i e s (number of whaleslm ) and found t h a t narwhal tend d t o form ? more compact (.09 whaleslm , SD=.06, N=6 groups) than d i d beluga ( - 0 5 whaleslm , SD=.09, N=9 groups) . More d a t a a r e needed t o v e r i f y t h a t d i f f e r - ences between s p e c i e s a r e s t a t i s t i c a l - l y s i g n i f i c a n t and t o determine whe- t h e r group cohes iveness v a r i e s with d i s t u r b a n c e l e v e l .
Changes i n mean group s i z e of narwhal were c l e a r l y c o r r e l a t e d with changes i n t o t a l numbers of narwhal seen. Although we do no t c laim t o have seen every narwhal i n t h e s tudy a r e a , we expect t h a t our d a t a a r e in- d i c a t i v e of r e l a t i v e numbers. The
c o r r e l a t i o n between group s i z e and numbers sugges t s t h a t narwhal may be aggrega t ing when they can l o c a t e o t h e r narwhal. It would be va luab le t o com- p l e t e t h e d a t a s e t on undis tu rbed nar- whal t o s e e i f t h e curve reaches t h e same p l a t e a u a t 4 i n d i v i d u a l s . I f sh ipp ing n o i s e reduces t h e a b i l i t y of narwhal t o l o c a t e one another , then we would expect t h e c o n t r o l group t o pro- duce a l a r g e r mean group s i z e when l a r g e numbers of narwhal a r e p r e s e n t , than does t h e t rea tment group. I n e- f f e c t , we would expect t h e maximum mean group s i z e t o be g r e a t e r than f o u r . A l t e r n a t i v e l y , i n t h e f a c e of a reduced s i g n a l l n o i s e r a t i o , narwhal might tend t o clump more c l o s e l y , t o c o u n t e r a c t t h e e f f e c t of a reduced s i g n a l range. We cannot p r e s e n t l y re- j e c t t h e n u l l hypothes i s , t h a t ship- ping t r a f f i c has no e f f e c t on mean group s i z e .
Our d a t a on a c t i v i t y p a t t e r n s dur ing non-disturbance per iods gener- a l l y a g r e e with o b s e r v a t i o n s made by F i n l e y e t a l . (1984). They found t h a t 90% of beluga i n pre- disturbance sur- veys were engaged i n d i r e c t e d move- ment, and t h a t narwhal tended t o be more o f t e n engaged (19%) i n o t h e r types of a c t i v i t i e s . Our propor t ions were not a s high, but we did f i n d t h a t more beluga (76%) were involved i n d i r e c t e d movement than were narwhal (50%).
Because of poor weather , F in ley e t a l . (1984) were unable t o c o l l e c t e q u i v a l e n t a e r i a l survey d a t a on be- hav iour dur ing t h e approach of t h e sh ip . They d id do observa t ions from t h e i c e but d id not q u a n t i f y behaviour dur ing d i s t u r b a n c e periods. Their ob- s e r v a t i o n s sugges t t h a t beluga re- sponded t o s h i p a c t i v i t y by r a p i d d i r e c t e d movement whereas narwhal tended t o s i n k beneath t h e water sur- f a c e , l i e q u i e t l y near t h e f l o e edge, moving out of t h e a r e a only s lowly. Our r e s u l t s from d i s t u r b a n c e p e r i o d s do no t a g r e e w i t h those of F in ley e t a l . However, t h e comparison is l i m i t - ed by t h e d i f f e r e n t methods of d a t a c o l l e c t i o n and our small sample of d i s t u r b e d beluga. Our d a t a suggest t h a t d i r e c t e d movement by beluga de- c l i n e d , t h a t c i r c l i n g increased ; and
t h a t s low d i r e c t e d movement by narwhal t h e h a b i t u a t i o n h y p o t h e s i s . However, i n c r e a s e d . t h e c r i t i c a l t e s t , a s d e s c r i b e d e a r-
H e r , h a s y e t t o be made. Our r e s u l t s do, however, conf i rm
t h a t be luga and narwhal behave d i f f e r - e n t l y under normal c o n d i t i o n s and r e- spond d i f f e r e n t l y t o d i s t u r b a n c e by s h i p t r a f f i c . Our o b s e r v a t i o n s sug- g e s t t h a t r e sponses were l e s s i n t e n s e i n 1986 t h a n they were i n 1982 t o 1984. Again, t h e r e a r e s e v e r a l possi- b l e e x p l a n a t i o n s : 1 ) bo th narwhal and be luga have been exposed t o s h i p p i n g i n L a n c a s t e r Sound, and a r e beg inn ing t o h a b i t u a t e , 2) t h e p resence of heavy pack i c e provided cover and t h e l a c k of l a n d f a s t i c e a c r o s s Lancas te r Sound enab led e a s y e s c a p e by d i s t u r b e d whales , t h u s responses t o s h i p approach were less i n t e n s e t h a n when whales were t r apped a g a i n s t i c e i n r e l a t i v e l y open wa te r . I c e c o n d i t i o n s might a l s o e x p l a i n apparen t d i f f e r e n c- e s i n non- dis turbance behaviour pa t- t e r n s between t h e two s t u d i e s . These hypo theses cou ld e a s i l y be t e s t e d by moni to r ing responses t o s h i p passage under i c e c o n d i t i o n s more t y p i c a l of 1982-84 t h a n 1986.
The d i f f e r e n c e s i n d i s t r i b u t i o n by i c e t y p e between c o n t r o l and d i s- t u r b a n c e su rveys may o r may n o t be re- l a t e d t o d i s t u r b a n c e by s h i p t r a f f i c . It i s p o s s i b l e t h a t h a b i t a t p re fe renc- e s change over t h e m i g r a t o r y p e r i o d . F u r t h e r o b s e r v a t i o n s of u n d i s t u r b e d whales a r e n e c e s s a r y t o c l a r i f y t h i s q u e s t i o n .
Our d a t a on o r i e n t a t i o n a r e con- s i s t e n t w i t h t h o s e of F i n l e y e t a l . (1983, 1984) and M i l l e r and Davis (1984) i n t h a t most whales avoided t h e s h i p . Our r e s u l t s a l s o suppor t t h e i r o b s e r v a t i o n t h a t r e sponses t o s h i p s beg in t o occur when v e s s e l s a r e 45 t o 60 km away. Narwhal and p o s s i b l y be l- uga showed l a r g e changes i n o r i e n t a- t i o n r e l a t i v e t o t h e s h i p when i t was n e a r e r t h a n 50 km. Th i s s u g g e s t s t h a t h a b i t u a t i o n may n o t be o c c u r r i n g . One would e x p e c t whales t o r e a c t a t a c l o s e r p rox imi ty i f t h e y were g e t t i n g used t o v e s s e l a c t i v i t y . Th i s does n o t appear t o be t h e c a s e , a l t h o u g h r e a c t i o n s seem t o be less i n t e n s e t h a n have been p r e v i o u s l y observed. The o r i e n t a t i o n d a t a favour r e j e c t i o n of
Barber and Hochheim (1986) re- corded o r i e n t a t i o n s of photographed whales r e l a t i v e t o a s h i p and found t h a t be luga were l e s s v a r i a b l e i n t h e i r o r i e n t a t i o n , and appeared t o be more d i r e c t e d i n t h e i r movements away from t h e s h i p than were narwhal . These r e s u l t s a r e a g a i n c o n s i s t e n t w i t h F i n l e y and Davis (1984) . Thus, i t a p p e a r s t h a t be luga a r e more i n- c l i n e d than narwhal t o v a c a t e an a r e a of d i s t u r b a n c e . Th i s does n o t sug- g e s t , however, t h a t narwhal a r e l e s s d i s t u r b e d by v e s s e l a c t i v i t y . The two s p e c i e s a r e b e h a v i o u r a l l y d i f - f e r e n t , even d u r i n g t h e s p r i n g migra- t o r y p e r i o d , and i n t e r s p e c i f i c d i f f e r - ences i n c l u d e r e a c t i o n s t o d i s t u r b a n c e by v e s s e l t r a f f i c .
Acknowledgements
Research funds were provided through t h e Northern O i l and Gas Ac t ion Program (NOGAP). A d d i t i o n a l , much a p p r e c i a t e d f i e l d s u p p o r t was provided by t h e P o l a r C o n t i n e n t a l Shelf Program i n Reso lu te Bay, N.W.T. We a l s o thank Glenn Wil l iams, t h e G.N.W.T. Na tura l Resources O f f i c e r i n A r c t i c Bay, N.W.T. , f o r h i s a d v i c e and generous d o n a t i o n of s t o r a g e s p a c e d u r i n g t h e f i e l d p o r t i o n of t h e s t u- d ~ . I p i l e e Koonoo and Timothy Sangoyak were our gu ides and f i e l d as- s i s t a n t s d u r i n g our s t a y on t h e i c e . Val Churney and Dave Yablecki a l s o as- s i s t e d w i t h d a t a c o l l e c t i o n and camp maintenance. We thank t h e f i e l d crew f o r m a i n t a i n i n g c h e e r f u l d i s p o s i t i o n s i n s p i t e of t h e o f t e n long working hours and f r e q u e n t camp moves and we thank o u r h e l i c o p t e r p i l o t s f o r t h e i r c a p a b l e f l y i n g s k i l l s . We a l s o appre- c i a t e d t h e warm welcome we r e c e i v e d i n A r c t i c Bay and t h e suppor t provided by t h e community. F i n a l l y , we thank t h e Canadian Coastguard, i n p a r t i c u l a r Cap ta in Dave Johns , f o r t h e i r coopera- t i o n and s u p p o r t d u r i n g t h e s t u d y , and A l l a n Sneyd of C a n a r c t i c Shipping f o r h i s a s s i s t a n c e and i n f o r m a t i o n provid- ed d u r i n g t h e p lann ing phase of t h e p r o j e c t .

References
Barber. D. and Hochheim. K. 1986. Results of aerial photographic surveys for disturbance reactions of ceta- ceans: Admiralty Inlet, N.W.T. Re- port prepared by E.M.S.I. for Canada Department of Fisheries and Oceans, Central and Arctic Region, 30 p.
Finlev. K . J . and Davis. R.A. 1984. - . Reactions of beluga whales and nar- whals to shin traffic and ice-breaking ., alone ice-edges in the eastern Cana-
- ed, King City, Ontario, for Cana-
da Department of Indian Affairs and Northern Development, 42 p .
Finlev. K . J . . Greene. C.R. and Davis. - . R.A. 1983. A study of ambient noise, ship noise, and the reactions of nar- whals and belugas to the MV Arctic breaking ice in Admiralty Inlet, N.W.T. - 1982. Report by L.G.L. Lim- i ted, Toronto, for Canada Department of Indian Affairs and Northern Devel- opment, 108 p.
Finley, K.J.. Miller. G.W.. Davis. - . R.A. and Greene, C.R. 1984. Respon- ses of narwhals (Monodon monoceros) and belugas (Delphinapterus leucas) to ice-breaking ships in Lancaster Sound - 1983. Report by L.G.L. Limited, King City, Ontario, for Canada Depart- ment of Indian ~ffairs and ~orthern Development, 117 p.
Ford, J. 1977. White whale offshore exploration acoustic study. Report by F.F. Slaney & Co. for Imperial Oil Ltd.
Fraker, P.M. 1983. The white whale monitoring program, Mackenzie Estu- ary. Part I. Migration, distribution and abundance of whales and effects of industry activities on whales. Report by L.G.L., Sidney, B.C. for Esso Resources Canada Limited, Dome Petro- leum and Gulf Canada Resource, Inc.
Ljungblad, D.K., Wursig, B., Swartz, S.L. and Keene, J.M. 1985. Observa- tions on the behaviour of bowhead whales (Balaena mysticetus) in the presence of operating seismic explora- tion vessels in the Alaskan Beaufort Sea. Report by SEACO, Inc. for United - States Minerals Management Service, 53
Mansfield, A.W. 1983. The effects of vessel traffic in the Arctic on marine mammals and recommendations for future research. Can. Tech. Rept. of Fish Aq. Sci. No. 1186, 97 p.
Miller, G.W. and Davis, R.A. 1984. Distribution and movements of narwhals and beluga whales in response to ship traffic at the Lancaster Sound ice edge - 1984. Report by L.G.L. Limit- ed,King City, Ontario, for Canada De- partment of Indian Affairs andNorthern Development, 34 p.
Richardson, W.J. 1985. Behaviour, disturbance responses and distribution of bowhead whales Balaena mysticetus in the Eastern Beaufort Sea, 1980-84. Report by L.G.L. Ecological Research Associates, Inc. for U.S. Minerals Management Service, 306 p.
Richardson, W.J., Fraker, M.A., Wursig, B. and Wells, R.S. 1985. Be- haviour of bowhead whales Balaena mys- ticetus summering in the Beaufort Sea: Reactions to industrial Activities. Biological Conservation, 32: 195-230.
Discussion
T. ALBERT: How do you define "critical distance?" What distance does it occur in beluga and narwhal and under what conditions? For example, do beluga respond at say 30 km from an icebreaker?
S. COSENS: Finley et al. (1984) indi- cated that narwhal and beluga in Lan- caster Sound began showing avoidance reactions to ships that were about 50 km

away from them. To assess whether there extreme responses in 1986 may be related was any evidence for habituation we to both the absence of an ice edge compared the orientation of narwhal and blocking westward movement, and the beluga to ships greater than 50 km away presence of pack ice providing cover. to those less than 50 km away. Alterna- tive methods, such as correlation analysis of the relationship between orientation and ship distance, could also be used.
To address your example, beluga do show avoidance responses at 30 km from an icebreaker. Ironically, one of our problems in assessing beluga behaviour was the general absence of beluga in our surveys when ships were active at the ice edge.
K. FROST: Did you note any obvious response by belugas or narwhals to your survey aircraft? In Alaska, in 1987 surveys, we noticed some apparent behav- ioural changes when our aircraft circled at 1000 ft.
S. COSENS: We flew our surveys at 700 ft, an altitude that Larry Dueck found, from previous work, to be non-disruptive. We did initially attempt to circle groups of whales to obtain more detailed behav- ioural observations than were possible with straight-line passes. We found, however, that whales reacted to the circling helicopter, so we discontinued our attempts to collect data in this way.
C. MALME: Did you determine the noise levels at which whales began to show avoidance behaviour in response to ships?
S. COSENS: We did record both underwater ambient and ship noise. When we complete analysis of these recordings we should be able to estimate noise levels to which narwhal and beluga react.
J. WARD: In 1982 when Finley started his work and first saw the extreme escape responses, the ice edge was just to the west of Admiralty Inlet. Where was the ice edge during your study?
S. COSENS: There was no landfast ice across Lancaster Sound in our vicinity in 1986. Whales were free to continue migrations westward at all times during our study. There was, however, extensive pack ice present during late May and early June. I think that the absence of

OBSERVATIONS OF FEEDING GRAY WHALE RESPONSES TO CONTROLLED INDUSTRIAL NOISE EXPOSURE
Charles I. Malme BEN Laboratories Inc., Cambridge, Massachusetts, USA
Bernd Wursig Moss Landing Marine Laboratories, Moss Landing, California, USA
James E. Bird University of Maryland, College Park, Maryland, USA
Peter Tyack Woods Hole Oceanographic Institution, Woods Hole, Massachusetts, USA
A b s t r a c t
A f i e l d s t u d y was conducted on t h e p o t e n t i a l e f f e c t s of underwater n o i s e from petroleum i n d u s t r y a c t i v i t i e s on feed ing and summering g r a y whales. This s t u d y was performed n e a r Southeast Cape, S t . Lawrence I s l a n d , Alaska, i n August 1985, u s i n g a 100 cu. i n . a i r gun source and an underwater p r o j e c t o r f o r playback of d r i l l s h i p no ise . Sound source l e v e l s and a c o u s t i c p ropaga t ion l o s s e s were measured t o permi t e s t i m a t i o n of t h e sound exposure l e v e l s a t whale s i g h t i n g p o s i t i o n s . The sur face- dive p a t t e r n s and blow r a t e s of whales were determined by o b s e r v a t i o n of f o c a l groups. A computer-aided a n a l y s i s of whale s i g h t i n g d a t a was performed t o determine p a t t e r n s under pre- exposure, exposure, and post- exposure c o n d i t i o n s . For t h e a i r gun source t h e r e was an 0.5 p r o b a b i l i t y t h a t t h e whales would s t o p feed ing and move away from t h e a r e a when t h e average p u l s e l e v e l s reached 173 dtf ( r e 1 microPasca1). The 0.1 p r o b a b i l i t y of f e e d i n g i n t e r r u p t i o n was e s t i m a t e d t o
This is a reviewed and edited version of a paper presented at the Ninth International Conference on Port and Ocean Engineering Under Arctic Conditions, Fairbanks, Alaska, USA, August 17-22, 1987. @ The Geophysical Institute, University of Alaska, 1987.
occur a t 163 dB, but whale responses were h i g h l y v a r i a b l e . Most whales r e t u r n e d and resumed f e e d i n g a f t e r t h e a i r gun v e s s e l had moved on. Playback of d r i l l s h i p n o i s e d i d not produce c l e a r evidence of d i s t u r b a n c e o r avoidance behavior f o r l e v e l s below 110 dB. Pos- s i b l e avoidance occurred f o r exposure l e v e l s approaching 119 dB.
Background
The e x p l o r a t i o n and development of energy resources i n t h e o u t e r con t in- e n t a l s h e l f (OCS) reg ions of t h e con- t i n e n t a l U.S. and Alaska i s i n t r o d u c i n g t h e f a c t o r of man-made n o i s e i n t o t h i s environment. S ince gray whales ( E s c h r i c h t i u s robus tus ) migra te and feed throughout t h e western OCS r e g i o n s of t h e U.S. and Alaska, t h e i r a c t i v i t i e s may p o t e n t i a l l y be a f f e c t e d by i n c r e a s e d l e v e l s of i n d u s t r i a l no ise . The objec- t i v e of t h i s s tudy was t o determine t h e c h a r a c t e r and degree of response of feed ing gray whales t o playback of i n d u s t r i a l n o i s e ( d r i l l s h i p sounds) and t o sound from an a i r gun s e i s m i c e x p l o r a t i o n source . A complete descr ip- t i o n of t h i s s tudy can be found i n Malrne e t a l . (1986).

Previous s t u d i e s
There have been v e r y few c o n t r o l l e d experiments involv ing d r i l l s h i p play- backs t o non-migrating baleen whales. Richardson et a l . (1985a) and Richardson e t a l . (1985b) found some evidence f o r bowhead whale (Balaena m y s t i c e t u s ) avoidance a t d i s t a n c e s of 4 t o 5 ton from t h e playback v e s s e l , w i t h t h e rece ived sound l e v e l (RSL) a t t h e c l o s e s t whales ranging from approximately 100 dB t o 113 dB. They n o t e , however, t h a t because of t h e l i m i t e d number and s h o r t d u r a t i o n of t h e playbacks, more experiments a r e needed and t h a t t h e i r r e s u l t s "...must be considered pre l iminary ." (Richardson e t a l . 1985a, p. 222.) Malme e t a l . (1985) conducted two d r i l l s h i p playback experiments on f e e d i n g humpback whales (Megaptera novaeangl iae ) i n Freder ick Sound, Alaska. There were no c o n s i s t e n t responses of whales a t ranges t o t h e sound source of >0.5 km wi th RSL >116 dB.
Richardson e t a l . (1986) conducted a i r gun experiments on non-migrat ing bowhead whales us ing a s i n g l e 0.66-1 Bolt a i r gun. During t h r e e experiments i n 1981 and 1983, involv ing a moving source , they found no evidence of avoidance a t d i s t a n c e s from 3 t o 5 km w i t h RSL near t h e whales > 118 t o 133 dB. I n 1984, two experiments were conducted us ing a s t a t i o n a r y source . R e s u l t s showed t h a t a t 0.2 t o 1.2 km and 2 t o 4.5 km w i t h RSL descr ibed a s " in tense" ( n o t measured because of sonobuoy over load) and 124 t o 131 dB, r e s p e c t i v e l y , whales moved away from t h e source v e s s e l . Malme e t a l . (1985) conducted s i n g l e a i r gun (100 cu. in . ) experiments on f e e d i n g humpback whales i n Freder ick Sound, Alaska. They found no o v e r a l l p a t t e r n of avoidance, w i t h RSL up t o 172 dB. However, observers d i d no te s t a r t l e responses by whales a t a i r gun o n s e t on t h r e e occas ions wi th RSL a t 150 dB t o 169 dB a t ranges up t o 3.2 km.
Migrat ing whale s t u d i e s
Malme e t al. (1983) found t h a t dur- i n g playbacks of a v a r i e t y of i n d u s t r i a l n o i s e s t i m u l i t o southbound migran ts , each sound s t i m u l u s caused a s t a t i s t i c - a l l y s i g n i f i c a n t response and t h a t each of t h e s e responses was d i f f e r e n t when
compared t o c o n t r o l c o n d i t i o n s . P a t t e r n s of response appeared t o vary p r e d i c t a b l y a s a f u n c t i o n of rece ived sound l e v e l . Responses g e n e r a l l y involved avoidance of t h e sound s o u r c e , based on t r a c k d e f l e c t i o n s c o r e s f o r whales exposed t o playbacks of d r i l l i n g p l a t f o r m , h e l i c o p t e r and produc t ion p l a t f o r m sounds and a drop i n speed f o r whales exposed t o d r i l l i n g p l a t f o r m , d r i l l s h i p , semisubmersible and h e l i- c o p t e r sounds. During d r i l l i n g p l a t f o r m and h e l i c o p t e r sound playbacks, apparen t avoidance of t h e source a r e a o u t t o about 250 m was noted w i t h sound l e v e l s a t t h i s range approximately 111 t o 118 dB.
During January 1984, s i m i l a r i n d u s t r i a l n o i s e playbacks were con- ducted on southbound migra t ing g r a y whales o f f t h e c o a s t of C a l i f o r n i a (Malme e t a l . 1984). An a n a l y s i s pro- cedure was developed which permi t ted d e t e r m i n a t i o n of t h e p r o b a b i l i t y of avoidance of t h e r e g i o n near t h e play- back source. This measure showed t h a t avoidance behavior began a t sound exposure l e v e l s of around 110 dB f o r t h e o v e r a l l s i g n a l and was g r e a t e r t h a n 80% f o r r e g i o n s wi th s i g n a l l e v e l s h igher than 130 dB. Some v a r i a t i o n among t h e v a r i o u s playback s t i m u l i was observed , w i t h t h e d r i l l s h i p producing t h e g r e a t- e s t avoidance and t h e produc t ion p l a t- form t h e l o w e s t , f o r l e v e l s between 110 and 125 dB. However, f o r l e v e l s between 125 and 130 dB, t h e r e a c t i o n s t o a l l playback s t i m u l i were comparable.
Malme e t a l . (1983) conducted experiments with se i smic e x p l o r a t i o n s o u r c e s on northward m i g r a t i n g mother/ c a l f p a i r s dur ing A p r i l and May 1983 us ing a s t a t i o n a r y and towed s i n g l e a i r gun and a 40 gun towed a r r a y . O v e r a l l , r e s u l t s showed t h a t t h e most p r e d i c t a b l e responses of t h e whales t o a i r gun a c t i v i t y occurred a t rece ived l e v e l s >160 dB r e 1 pPa when t h e a i r gun source was w i t h i n 2 km of t h e animals .
Small sample s i z e s prevented d e f i n i t e q u a n t i f i c a t i o n of response f o r average p u l s e p r e s s u r e l e v e l s between 140 and 160 dB, but a n a l y s i s showed t h a t some behaviora l changes d i d occur a t t h e s e l e v e l s . In g e n e r a l , whales would slow down and t u r n away from t h e source . In s e v e r a l c a s e s , groups were seen s w i m -

ming i n t o t h e s u r f zone and a l s o posi- t i o n i n g themselves i n t h e sound shadow of a rock , i s l a n d , o r outcropping. There were s i g n i f i c a n t d i f f e r e n c e s , independent of range o r l e v e l of exposure, i n m i l l i n g i n d i c e s ,* speed i n d i c e s f o r groups p r i o r t o exposure and those same groups d u r i n g exposure t o t h e a i r gun no ise . There were a l s o s i g n i f i - c a n t d i f f e r e n c e s i n m i l l i n g i n d i c e s and speed i n d i c e s f o r groups dur ing exposure and a f t e r exposure t o a i r gun no ise .
During t h e southbound January 1984 m i g r a t i o n , se i smic experiments were conducted us ing both a s t a t i o n a r y s i n g l e a i r gun and a towed s i n g l e a i r gun. During s t a t i o n a r y a i r gun experiments , whales avoided t h e sound source a r e a by moving f u r t h e r o f f s h o r e o r i n s h o r e of t h e a i r gun v e s s e l . This avoidance response was f i r s t d e t e c t e d 2 km n o r t h of t h e v e s s e l and p e r s i s t e d u n t i l t h e whales were a t l e a s t 2 km s o u t h of t h e v e s s e l . No i d e n t i f i a b l e avoidance response was observed dur ing moving a i r gun experiments. However, t h e s e experiments were of s h o r t d u r a t i o n and sample s i z e s were low.
The p r o b a b i l i t y of avoidance a n a l y s i s f o r t h e s t a t i o n a r y a i r gun source showed t h a t t h e t h r e s h o l d of avoidance behavior occurred f o r average p u l s e p r e s s u r e l e v e l s of approximately 164 dB. This was somewhat h igher than t h e l e v e l of 160 dB which was observed t o produce changes i n t h e migra t ion behavior of mother/calf p a i r s dur ing t h e A p r i l and May 1983 f i e l d experiments .
I n t r o d u c t i o n
Based on a review of r e c e n t l i t e r a - t u r e and d i s c u s s i o n s wi th r e s e a r c h e r s working on feed ing g r a y whales i n t h e n o r t h e r n Bering Sea (Wursig, e t a l . 1983, 1986; Thomson 1984), we decided t o conduct o u r s t u d i e s i n t h e nearshore wate rs o f f Southeast Cape, St . Lawrence I s l a n d , Alaska. The p r o j e c t was con-
*Mil l ing index i s a measure of t h e d i r e c t - n e s s o r l i n e a r i t y of t h e r o u t e t aken by t h e whale from p o i n t ( x i , y l ) t o (xn, yn) and i s c a l c u l a t e d by d i v i d i n g n e t speed by cumulat ive speed.
ducted i n t h e l a t t e r h a l f of August, 1985.
The s t u d y concent ra ted on t h e a r e a around S t . Lawrence I s l a n d , e s p e c i a l l y n e a r Southeas t Cape (F ig . 1). Gray whales , a p p a r e n t l y f e e d i n g , a s evidenced by mud plumes, were l o c a t e d i n t h e a r e a of Kialegak P o i n t , Southeas<. Cap:; i n t h e same l o c a t i o n where Wursig, a l . (1983, 1986) conducted a s t u d y on t h e behavior of f e e d i n g g r a y whales i n 1982.
Methods
Acous t ic exper imenta l procedure
The a c o u s t i c environment of t h e t e s t a r e a was measured by de te rmin ing t h e propaga t ion l o s s and ambient n o i s e l e v e l s . The ou tpu t source l e v e l s of t h e playback source and t h e a i r gun were c a l i b r a t e d . These measurements per- m i t t e d c a l c u l a t i o n of t h e t e s t s t i m u l u s l e v e l a t s i g h t e d whale p o s i t i o n s . Transmission l o s s measurements were performed c o n c u r r e n t l y wi th t h e whale behavior t e s t s . The a i r gun was opera ted a t a dep th of 10 m which was
Figure 1. Study s i t e l o c a t i o n s .

genera l ly below o r near t he bottom of t he su r f ace l a y e r of warmer, l e s s s a l i n e water.
Playback procedure
The acous t i c playback system was designed t o provide sound l e v e l s and frequency response capable of r e a l i s t i c - a l l y s imula t ing a broad range of petroleum indus t ry a c t i v i t i e s . In order t o boost t h e low frequency response of the p ro j ec to r system, two USN/USRD Type J-13 p ro j ec to r s were used t o provide response down t o 32 Hz. In add i t i on t o the two low frequency p ro j ec to r s , a USN/USRD Type F-40 p ro j ec to r was used t o provide high frequency sound above 2 kHz. E l e c t r i c a l equa l i za t ion and cross- over networks were used t o enable a l l of t he p ro j ec to r s t o be d r iven from a 300- watt power ampl i f ie r . A s a r e s u l t of t he use of two low frequency p ro j ec to r s and t h e e l e c t r o n i c equa l i za t ion network, t he u se fu l response of t he system extended from 32 Hz t o 20 kHz. The playback system and i t s response curve a r e shown i n Fig. 2.
During a playback sequence, a pre- recorded, 15-min. du ra t ion , i n d u s t r i a l noise st imulus on a c a s s e t t e tape was used t o genera te a t e s t s i gna l . Two c a s s e t t e recorders coupled t o a fader con t ro l permitted unin ter rupted continuous sound f o r a s long a s des i red . Playback periods of 30 min t o 1 h r were gene ra l ly used.
A i r gun source c h a r a c t e r i s t i c s
The a i r gun used f o r t he seismic s igna l t e s t s was a 100 cu. i n . Western Geophysical gun operated a t 4500 p s i . The peak source l e v e l was 226 dB r e luPa a t 1 m (125 Hz bandwidth). A t y p i c a l pressure s igna tu re and spectrum a r e shown i n Fig. 3. The f i r i n g r a t e used was 6 pu l se s per min. This gun was operated from t h e NANCY-H, an 80-ft (24 m) o i l- indus t ry cargo/supply vesse l .
Since the peak pressure of t he s i g n a l from the a i r gun i s influenced s t rong ly by mult ipath propagation condi t ions , we have found the average
160 ,
E COMBINED PROJECTOR RESPONSE WITH EQUALIZATION
el (CONSTANT RMS 113 OCTAVE BAND LEVEL INTO EQUALIZER. REF. DRIVE LEVEL. 1A RMS I N 200 Hz 113 OCTAVE BAND)
.... - - 9 - - -
FREQUENCY (Hz)
Deuda Power C ~ w t t o Lmd Amplifier
Clou-Over
Circuit
l lydropho~
PROJECTOR Hvdrophoni INSTRUMENTATION
Figure 2. Playback instrumentat ion.

a
. ft. *
a
: O ft.
- 1.1
9 320 T i m e . m f c .
Figure 3. Air gun s i g n a t u r e and spectrum, 100 cu. i n . , 4000 p s i , range 200 m, d e p t h 10 m.
p u l s e p r e s s u r e l e v e l t o be a u s e f u l measure of t h e rece ived l e v e l of t h e t r a n s i e n t s i g n a l s from an a i r gun.This q u a n t i t y i s a measure of t h e e f f e c t i v e energy of a n o i s e p u l s e i n terms of an average p r e s s u r e l e v e l def ined a s (Urick 1983, Sec. 4.4)
where
pc = t h e s p e c i f i c a c o u s t i c impedance of water
p ( t ) = t h e o r i g i n a l p u l s e p r e s s u r e waveform
- p = t h e average p u l s e p r e s s u r e
T = t h e average p u l s e d u r a t i o n ( t h e t ime r e q u i r e d f o r p 2 ( t ) t o decay t o l e s s t h a n 13.5% of t h e i n i t i a l v a l u e ) .
Genera l ly , i t i s more convenient t o e x p r e s s a c o u s t i c p r e s s u r e i n l o g a r i t h m i c terms. Consequently, t h e average p u l s e p r e s s u r e l e v e l is def ined a s
where
Transmission l o s s a n a l y s i s
The t ransmiss ion l o s s d a t a ob ta ined us ing t h e a i r gun were analyzed us ing a computer-implemented l e a s t- s q u a r e s technique which de te rmines t h e b e s t- f i t v a l u e s f o r two parameters i n t h e rece ived l e v e l model (Eq. 3, Table 1 ) . The va lues of Ls' and Ar a r e determined by t h i s technique us ing measured d a t a . When t h e source l e v e l i s c a l i b r a t e d , t h e e f f e c t of t h e l o c a l bottom and s u r f a c e c o n d i t i o n s on sound propaga t ion can be determined a s a l o c a l "anomaly" where:
LSt = Ls + \l (dB) ( 4 )
Here, Ls i s t h e p r e s s u r e l e v e l measured a t 1 m from t h e source and A i s t h e l o c a l anomaly r e s u l t i n g from bottom and s u r f a c e r e f l e c t i o n e f f e c t s .
Whale behavior o b s e r v a t i o n
Whale behavior d a t a were ob ta ined by c l o s e o b s e r v a t i o n of f o c a l whale groups, record ing s u r f a c i n g , d i v e and blow information. In a d d i t i o n , t r a c k i n g of t h e f o c a l groups was performed us ing a two-vessel t r i a n g u l a t i o n procedure o r a land-based t h e o d o l i t e when weather permi t ted . The exper imenta l procedure involved l o c a t i o n of feed ing whales , o b s e r v a t i o n of behavior dur ing a c o n t r o l p e r i o d wi th t h e suppor t v e s s e l s p r e s e n t , o b s e r v a t i o n of behavior dur ing a n experiment per iod wi th t h e sound s t i m u l u s on, and o b s e r v a t i o n of behavior d u r i n g a post- experiment c o n t r o l per iod . Genera l ly , s e v e r a l of t h e s e sequences were performed each day.
Whales were cons idered t o be un- d i s t u r b e d dur ing non-experimental days
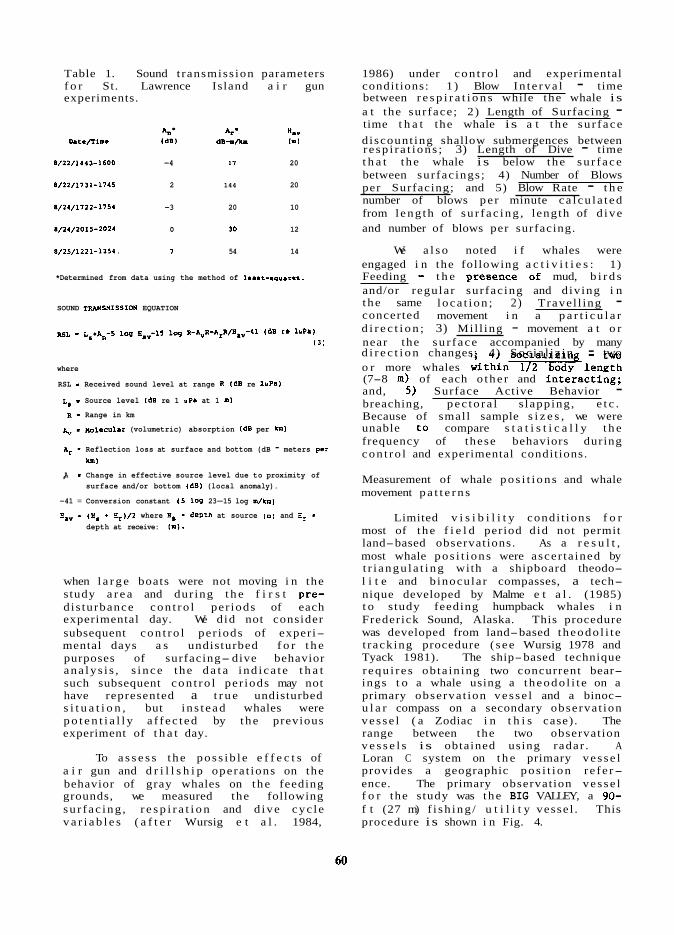
Table 1. Sound t ransmiss ion parameters 1986) under con t ro l and experimental f o r St. Lawrence Island a i r gun condit ions: 1 ) Blow In t e rva l - time experiments. between r e s p i r a t i o n s while the whale i s
a t the sur face ; 2) Length of Surfacing - *B
time t h a t the whale is a t t he su r f ace *re **a v
Dtte/Time I ~ B ) M-.A. I ~ I discount ing shallow submergences between r e sp i r a t i ons ; 3) Length of Dive - time
8/22/1443-1600 -4 17 20 t h a t t he whale i s below the su r f ace between sur fac ings ; 4) Number of Blows
a/22/1731-1745 2 144 20 per Surfacing; and 5) Blow Rate - t h e
8/24/1722-1754 -3 20 10 number of blows pe r minute ca l cu l a t ed from l eng th of su r f ac ing , length of d ive
8/24/2015-2024 o 30 12 and number of blows per surfacing.
8/25/1221-1254. 7 54 14 We a l s o noted i f whales were engaged i n the fol lowing a c t i v i t i e s : 1)
*Determined from data using the method of least-sauares. Feeding - t h e presence of mud, b i r d s and/or regular sur fac ing and d iv ing i n
SOUND TRANSHISSION EQUATION t he same loca t ion ; 2) Travel l ing - concerted movement i n a p a r t i c u l a r
RSL - L^+A^-s log E -1s log R - A ~ R - A ~ R / B ^ - ~ ~ ( d ~ re lu?a) d i r e c t i o n ; 3) Mi l l ing - movement a t o r ( 3 1 near the su r f ace accompanied by many
d i r e c t i o n changes; 4) Soc i a l i z in - two where o r more whales w i t h i n d l e n g t h -~ ~
RSL - Received sound level at range R (dB re luPa) Ls - Source level [dB re 1 "Pa at 1 m) R - Range in km
(7-8 m) of each o the r and i n t e r a c t i n g ; and, 5) Surface Active Behavior - breaching, pec to ra l s lapping , e t c . Because of small sample s i z e s , we were
~ y . mlecular (volumetric) absorption ( d ~ per km) unable t o compare s t a t i s t i c a l l y t h e frequency of these behaviors during
Ar - Reflection loss at surface and bottom (dB - meters per con t ro l and experimental condit ions. km)
A,, - Change in effective source level due to proximity of surface and/or bottom (dB) (local anomaly).
Measurement of whale pos i t i ons and whale movement p a t t e r n s
-41 = Conversion constant (5 log 23-15 log m/km)
E - ( H + H:)/2 where Hs - fieptf. at source (n) and H: - depth at receive: la).
when l a r g e boats were not moving i n the study a r e a and dur ing t h e f i r s t pre- d is turbance con t ro l per iods of each experimental day. We did not consider subsequent con t ro l per iods of experi- mental days a s undisturbed f o r t h e purposes of surfacing- dive behavior ana lys i s , s i nce t he d a t a i nd i ca t e t h a t such subsequent con t ro l per iods may not have represented a t r u e undisturbed s i t u a t i o n , but i n s t ead whales were p o t e n t i a l l y a f f ec t ed by the previous experiment of t h a t day.
To a s s e s s t he poss ib l e e f f e c t s of a i r gun and d r i l l s h i p opera t ions on the behavior of gray whales on the feeding grounds, we measured the following su r f ac ing , r e s p i r a t i o n and d ive cyc l e v a r i a b l e s ( a f t e r Wursig e t a l . 1984,
Limited v i s i b i l i t y condi t ions f o r most of t he f i e l d period d id not permit land-based observations. As a r e s u l t , most whale pos i t i ons were ascer ta ined by t r i angu la t ing with a shipboard theodo- l i t e and b inocular compasses, a tech- nique developed by Malme e t a l . (1985) t o study feeding humpback whales i n Frederick Sound, Alaska. This procedure was developed from land-based theodo l i t e t racking procedure ( s ee Wursig 1978 and Tyack 1981). The ship-based technique r equ i r e s obta in ing two concurrent bear- ings t o a whale using a t heodo l i t e on a primary observat ion ves se l and a binoc- u l a r compass on a secondary observat ion ves se l ( a Zodiac i n t h i s case) . The range between the two observation v e s s e l s is obtained using radar . A Loran C system on t h e primary ves se l provides a geographic pos i t i on r e f e r- ence. The primary observation ves se l f o r the study was the BIG VALLEY, a 90- f t (27 m) f i sh ing / u t i l i t y vesse l . This procedure i s shown i n Fig. 4.

Acoustic exposure e s t ima t ion
Since some v a r i a t i o n i n sound
CHALE OR VESSEL
9
PRIMARY OBSERVATION VESSEL SECONDARY OBSERVATION VESSEL LORANC ff.1 BINOCULAR-COMPASS I#,.#, 1 RADAR fro) RADIO THEODOLITE W, I RADIO
CALCULATE rw È
Figure 4. Whale t racking using observa- t i o n s from two ves se l s .
Resul t s
Acoust ic da t a
Ambient noise i n t h e t e s t a r e a was gene ra l l y low and con t ro l l ed by wind- generated s e a noise. Sound transmission was found t o be more e f f i c i e n t than i s usua l f o r shal low water a r e a s with a s a n d l s i l t bottom because of the probable presence of a sub-bottom rock l aye r . Measurements of received l e v e l a t s e v e r a l depths and ranges d id not show t h e depth dependence expected t o be produced by t he observed s t rong downward r e f r a c t i n g gradients . This was probably a r e s u l t of t he shal low water which ranged from 15 t o 25 m i n depth. Ref lec t ions and gene ra l s c a t t e r i n g from t h e bottom and probable sub-bottom l a y e r s produced gene ra l l y reverberant received s igna l s . While no s p e c i f i c sub-bottom information has been obtained f o r the St. Lawrence t e s t a r e a , MacKensie (1973) repor ted underlying l a y e r s of g r a n i t i c and b a s a l t i c rock a t depths of 3 t o 10 m f o r an a r e a l y i n g t o t he e a s t of t he i s l and .
t ransmiss ion was observed f o r the s eve ra l t e s t a r ea s used, s p e c i f i c d a t a from each t e s t a r e a were used i n p r e d i c t i o n of the sound exposure l e v e l s f o r whale s i gh t ings .
The r e s u l t s of a n a l y s i s of t he t ransmiss ion l o s s measurements a r e summarized i n Table 1. The va lues of and Ar shown i n t h e t a b l e were used t oge the r wi th E q . ( 3 ) t o e s t ima te t he exposure l e v e l s a t t he whale s i g h t i n g p o s i t i o n s f o r the a i r gun experiments. A comparison of measured d a t a with t h e rece ived average pu l se p r e s su re l e v e l versus range c h a r a c t e r i s t i c p r ed i c t ed by E q . ( 3 ) i s shown i n Fig. 5A.
Figure 5. Comparison of average pu l se p r e s su re d a t a with p r ed i c t i ons of empir ica l propagation propagation model. (Source - 100 cu. i n . a i r gun a t 4500 p s i ) .

Surfacing- dive behavior , o b s e r v a t i o n r e s u l t s
The frequency d i s t r i b u t i o n s of t h e f i v e s u r f a c i n g , d i v e and r e s p i r a t i o n c h a r a c t e r i s t i c s used i n t h e a n a l y s i s a r e shown i n Fig. 6. Blow i n t e r v a l and blow r a t e approximate a normal d i s t r i b u t i o n , while t h e d i s t r i b u t i o n s of t h e o t h e r t h r e e c h a r a c t e r i s t i c s a r e h i g h l y skewed. Consequently, blow i n t e r v a l and blow r a t e were analyzed wi th paramet r ic t e s t i n g procedures (by a n a l y s i s of v a r i a n c e and Student-Newman-Keuls m u l t i p l e comparisons t e s t s ) , while l e n g t h of s u r f a c i n g , l e n g t h of d i v e , and number of blows p e r s u r f a c i n g were analyzed wi th non- parametric methods (by Kruskal-Wallis , Mann-Whitney-U and non- p a r a m e t r i c m u l t i p l e comparisons; Zar 1974, Sokal and Rohlf 1969).
There were s i g n i f i c a n t d i f f e r e n c e s i n sur fac ing- dive c h a r a c t e r i s t i c s between t h e c o n d i t i o n of no known d i s t u r b a n c e and t h e p o t e n t i a l d i s t u r b- ances of d r i l l s h i p playbacks and a i r gun experiments (Table 2 and Fig. 6) . During d r i l l s h i p p laybacks , blow i n t e r v a l decreased and l e n g t h of s u r f a c- i n g , l e n g t h of d i v e and number of blows p e r s u r f a c i n g a l l increased . For a i r gun sounds, t h e response was o p p o s i t e t o t h a t of d r i l l s h i p , w i t h blow i n t e r v a l i n c r e a s i n g and t h e o t h e r t h r e e primary c h a r a c t e r i s t i c s decreas ing . I n t e r e s t i n g l y , blow r a t e d i d not change from t h e undis tu rbed c o n d i t i o n , because i n c r e a s e s o r d e c r e a s e s i n blow i n t e r v a l t ime made up f o r s h i f t s i n l e n g t h s of s u r f a c i n g s and d i v e s .
F igures 7 and 8 show t h e s e summary d a t a i n more d e t a i l . For d r i l l s h i p playback exper iments , t h e sur fac ing- dive c h a r a c t e r i s t i c s s t a y a t a "d is tu rbed" l e v e l w i t h i n a one-half hour p e r i o d a f t e r exposure of whales t o d r i l l s h i p sounds. Whales s h i f t t h e i r sur fac ing- d i v e c h a r a c t e r i s t i c s c l o s e t o t h e pre- d i s t u r b a n c e l e v e l i n t h e 30 t o 60 minute per iod a f t e r exposure. They even appear t o overshoot t h e presumed undis tu rbed l e v e l , w i t h blow i n t e r v a l h igher and t h e o t h e r t h r e e pr imary c h a r a c t e r i s t i c s lower , t h a n dur ing t h e presumed un- d i s t u r b e d s i t u a t i o n (Fig. 7) . Responses of whales t o a i r gun do no t tend t o go back t o t h e presumably undis tu rbed c o n d i t i o n w i t h i n one hour of a i r gun
sounds, e s p e c i a l l y f o r blow i n t e r v a l s and l e n g t h of d ives . These d a t a i n d i c a t e t h a t a i r gun sounds have a longer- term e f f e c t on t h e behavior of p r i m a r i l y f e e d i n g g r a y whales t h a n do d r i l l s h i p sounds (Fig. 8 ) . A c a u t i o n i s necessary , however: d r i l l s h i p sounds were made by playbacks which may have some d i f f e r e n c e s i n sound c h a r a c t e r- i s t i c s from r e a l d r i l l s h i p s and a i r gun sounds were suppl ied by o n l y one a i r gun i n s t e a d of t h e many o f t e n used d u r i n g s e i s m i c mapping a c t i v i t i e s .
Although r e l a t i v e l y few s u r f a c i n g- d i v e d a t a were c o l l e c t e d d u r i n g t h e s h o r t f i e l d season , some i n t e r e s t i n g t r e n d s have emerged. In g e n e r a l , blow i n t e r v a l s decreased dur ing d r i l l s h i p sounds and l e n g t h of s u r f a c i n g , l e n g t h of d i v e and number of blows p e r s u r f a c- i n g increased . This t r e n d i n d i c a t e s t h a t whales a r e c y c l i n g through t h e i r b a s i c sur fac ing- dive p a t t e r n s more s lowly while s u b j e c t e d t o d r i l l s h i p sounds. They re turned t o a pre- d i s t u r b a n c e l e v e l r e l a t i v e l y q u i c k l y , u s u a l l y a f t e r about one-half hour p o s t d i s tu rbance . Blow r a t e a l t e r e d l i t t l e . Kesponses t o t h e a i r gun were d i f f e r e n t . Whales increased blow i n t e r v a l s and tended t o d e c r e a s e l e n g t h of s u r f a c i n g , l e n g t h of d i v e and number of blows p e r s u r f a c i n g . They were more l i k e l y t o a l t e r n a t e feed ing with t r a v e l , o r t r a v e l away from t h e sound source. This t r e n d was e s p e c i a l l y s t r o n g on s e v e r a l occas ions when we n o t i c e d a d e f i n i t e c e s s a t i o n of feed ing and movement away from t h e sound source. Recovery t o "normal" l e v e l s was l e s s r a p i d than f o r d r i l l s h i p sounds, but tended t o occur about one hour a f t e r d i s t u r b a n c e .
Summary of movement p a t t e r n s
D r i l l s h i p playback
Two playback t e s t s f o r which whale movement d a t a a r e a v a i l a b l e sugges t t h a t t h e whales d i d not a l t e r t h e i r movement p a t t e r n s wi th RSL a t 103 t o 110 dB and t h e BIG VALLEY a s c l o s e a s 1.1 km. In one c a s e , a whale cont inued t o feed i n t h e same g e n e r a l a r e a dur ing both con- t r o l and exper imenta l per iods . However, d u r i n g one pre- cont ro l p e r i o d , whales appeared t o respond t o t h e presence of t h e BIG VALLEY, t h u s complicat ing

15 30 45 Blow Interval (a)
T - 2 4
s e - ? 6 8
N - 489
- 7
-
L r
2 4 6 8 10 12
Number of Blows per Surfacing
Length of Dive (min)
240
Blow Rote (number/min)
Figure 6. Frequency distribution of surfacing-dive data on undisturbed whales. See
text for definition of undisturbed.
- IB
I I 1 , l ~ l I l ~ ~ ~ ~ ~
' d - o w 2 46 0 0 L l -
192
,. 0 144
0 -1 tT
L ¥^ 96
x - 0..
- 48 -
1
0 l l l l l l ~ ~
0 1 2 3 4
Length of Surfacing (mm) 72
-
-
-
-
N - 486
-

Table 2. Summary s t a t i s t i c s f o r undisturbed whales and whales during d r i l l s h i p playbacks and a i r gun experiments.
Experironfcal No. of Blows/ length of Surfacing length of D i v e Blew Rate Situation Blew Interval (8) Surfacing (rain) (mini (No./Min. 1
Undisturbed 14.2 6.44 811 2.4 1.68 409 0.44 0.442 406 1.80 1.158 494 1.17 0.530 480
Airgun 16.5 6.01 147 2.0 1.40 135 0.38 0.430 135 1.54 1.081 134 1.20 0.570 131
i n t e r p r e t a t i o n of r e s u l t s . During two o ther playback t e s t s , whales i n t h e v i c i n i t y of the B I G VALLEY did move out of t h e genera l a r e a , but we were unable t o ob ta in t r ack d a t a on indiv idual whales and, t he re fo re , KSL f o r s p e c i f i c f o c a l animals a r e not ava i l ab l e . However, f o r one of these l a t t e r two experiments, KSL a t the whales moving out of the a r ea was est imated a t 108 t o 119 dfl a t d i s t ances of approximately 1 km t o 0.3 km, respect ive ly . Results of d r i l l s h i p playbacks during the present s tudy appear cons i s t en t with our e a r l i e r f indings . A i r gun
Al t e r a t i ons i n whale movement pat- t e r n s and/or feeding behavior were noted during each of t he s i x a i r gun experi- ments. Table 3 summarizes t he behavior of e i g h t of t he n ine f o c a l whales under observation during the experiments. Responses were noted a t RSL ranging from 149 dB t o 176 dB a t d i s t ances up t o approximately 4 km. However, i n one case , RSL reached a peak of 165 db with the NANCY H 0.7 km d i s t a n t with very l i t t l e , i f any, response observed. We did observe the ce s sa t ion of feeding with apparent movement away from t h e experimental v e s s e l during a i r gun sound exposure on f i v e occasions. However, i n t h r ee of these cases , the whales resumed feeding e i t h e r during t h e experiment (one case) o r dur ing the post- control period (two cases ) . In t he remaining two cases , one whale stopped feeding with apparent movement away from t h e
experimental ve s se l (Whale A, AG 3) and continued t o move out of t he a r ea during the post- control period; the o the r whale (Whale L) stopped feeding during AG 5, but we do not have information on i t s pre- control movement pa t t e rn .
Most of the responses involved e i t h e r an abrupt change i n d i r e c t i o n o r an increase i n speed with apparent movement away from the experimental vesse l . On one occasion a whale spyhopped* seve ra l times i n apparent response t o increas ing RSL. We did note t h a t i n t h r ee and poss ib ly fou r cases (marked with an a s t e r i s k i n Table 3) whales showed a response t o t h e opera t ing a i r gun a t a time coinc id ing with t he NANCY H moving pas t the whale's p o s i t i o n , a t which po in t t he whales were experiencing peak RSL.
In order t o der ive a genera l guide- l i n e f o r es t imat ing the probable behavioral response of summering and feeding gray whales t o a i r gun noise , i t i s necessary t o examine the summary of indiv idual whale responses presented previous ly i n Table 3. On t he b a s i s of the information presented i n t h i s t a b l e , t he summary cumulative d i s t r i b u t i o n funct ion shown i n Fig. 9 was developed. It inc ludes only those whales f o r which a d e f i n i t e i n t e r r u p t i o n of feeding a c t i v i t y was observed. If a whale
*Raising the a n t e r i o r po r t i on of t h e body so t h a t the eyes a r e above t h e water.

* * n s *** 8 * , , I ,
a,,- w- UMXST ALL OS POST OS
UNOIST ALL OS POST OS
ns , ns , ns a,,- w-
ALL 0 s POST 0s
Figure 7. Summary statistics for undisturbed whales, and whales during and after drillship playbacks. Center bars denote means, boxes denote 95% confidence intervals, bars denote 1 standard deviation above and below the mean, and numbers denote sample size. Asterisks show significance levels of probability: * = 0.05, ** = 0.01, *** = 0.001, ns = not significant.

I *** ns 0
I ns - 3 0 nun -0 fnin
UNDIST ALL AG POST AG
UNOIST ALL AQ POST AG
6 I I I I I
UNOIST ALL AG POST AG
UNDIST ALL AG POST AG
Iff
T 1 ns , ns n s
I -30 -on 10.0 "."
UNDIST ALL AG POST AG
Figure 8. Summary statistics for undisturbed whales, and whales during and after air gun experiments.
66

Table 3. 1985.
Summary of f o c a l whale response t o a i r gun experiments , 22, 24, 25 August
Focal Pre-Control Mute Activity
Feeding Movement away, steeped novament as AS acproadied, m feeding
Feeding Direction change, nave towards and then away E m N.H. feeding before and after move
Feeding, Group split at KG onset, A move joined Mule E mrth 6 east offshore, feeding
to 1731
Feeding Feeding with inshore movement as N.H. noved past (possibly feeding related)
Feeding Feeding, turn, speed increase, dive, fluke out, reeume feeding
Feeding, m Joined by Mule N, BOIB feeding, track plot royhcpe, wtheast movement
Unknown Joined Mula L, feeding
feeding Feeding to 1605, novamerot parallel to N.H. then offshore
Return to Pre- Control area, feeding
Feeding, Movement possibly affected by 6.V.
Continued offshore m n t
feeding sane general area
Feeding u n ~ general area
Group aplit, L increase speed m i n g southeast out of area, no feeding
Feeding, group split
Offshore to 1715, then back to original loca- tion and feeding
*Itesponse when N.H. broadside to whale.
1H/V Nancy I. 21^/V ~ i g Valley
resumed f e e d i n g a f t e r t h e a i r gun v e s s e l had moved away o r s topped f i r i n g , t h e corresponding o r i g i n a l response exposure z l e v e l is marked "F". u o . r s . , . v - - u * q , .
I- 3 " -
The r e s u l t i n g cumulat ive d i s t r i b u t i o n .a - can be seen t o be somewhat skewed, having a: ., a n i n t e r p o l a t e d median va lue of 173 dB and "1
a c a l c u l a t e d mean v a l u e of 169.6 dB. I f 3 - 6 -
t h e d a t a v a l u e s shown a r e cons idered t o be u "
2 r e p r e s e n t a t i v e samples of t h e t r u e 1-1 . 4 - a c o u s t i c response s t a t i s t i c s which might . 3 - be ob ta ined wi th more e x t e n s i v e t e s t i n g , . 2 - p i t i s u s e f u l t o c a l c u l a t e t h e confidence l i m i t s of t h e a c o u s t i c response measures . - 1 -
determined by t h e p r e s e n t d a t a . We need 3 170 160 IS0 t o e s t i m a t e how wel l t h e d a t a r e p r e s e n t t h e range of expected feed ing g r a y whale RVERRGE PULSE LEVEL, dB r e 1 uPa responses t o a i r gun n o i s e d i s t u r b a n c e .
A d i s t r i b u t i o n- f r e e confidence i n t e r v a l t e s t f o r t h e median was developed by Thompson (19361. This t e s t p rov ides a F igure 9. Cumulative d i s t r i b u t i o n f o r means of c a l c u l a t i n g t h e conf idence l e v e l observed f e e d i n g d i s t u r b a n c e . (Data from of a median e s t i m a t e based on a number of Table 3. F - whale r e t u r n e d and resumed samples from a paren t popula t ion having a n f e e d i n g .)

unknown d i s t r i b u t i o n form. The r e s u l t s of app ly ing t h i s t e s t t o t h e d a t a shown i n Fig. 9 g i v e a conf idence e s t i m a t e of 68% t h a t t h e t r u e median (0.5) response l e v e l l i e s between 170 and 175 dB and a 94% confidence e s t i m a t e t h a t i t l i e s w i t h i n t h e i n t e r v a l of 163 dB t o 177 dB.
Discussion
Acoust ic d a t a
The t ransmiss ion l o s s measured i n t h e St . Lawrence I s l a n d a r e a was lower t h a n t h a t measured o f f t h e C a l i f o r n i a c o a s t dur ing a p rev ious s t u d y of migra t ing g r a y whales (Malme e t a l . 1983, 1984). A comparison of t h e c h a r a c t e r i s t i c s of t h e two a r e a s f o r average p u l s e p r e s s u r e p ropaga t ion can be made by examining Fig. 5A and Fig. 5B. A sha l low sub-bottom l a y e r of rock probably causes t h e con- s i d e r a b l y b e t t e r sound propaga t ion c o n d i t i o n s observed o f f St . Lawrence I s l a n d s i n c e t h e bottom composition accord ing t o c h a r t in format ion i s s a n d / s i l t f o r bo th a r e a s .
Behavioral d a t a
For bo th t y p e s of experimental s t i m u l i , subsequent experiments of a day appeared t o be a f f e c t e d by t h e e a r l i e r experiments. This took both t h e form of sur fac ing- dive d a t a no t always going back t o a p re- dis tu rbance l e v e l a f t e r t h e f i r s t experiment of t h e day, and whales a t t imes r e a c t i n g l e s s s t r o n g l y t o a subsequent experiment . This i s n o t a f i r m con- c l u s i o n , however, because many o t h e r f a c t o r s such a s t ime of day, p resence of one o r two boa ts i n t h e a r e a , and g e n e r a l behavior of t h e whales may have served a s confounding f a c t o r s . I n t e r e s t i n g l y , number of blows p e r s u r f a c i n g , l e n g t h of s u r f a c i n g s , and l e n g t h of d i v e s were a l l lower dur ing t h e p r e s e n t s tudy than f o r presumed undis tu rbed g r a y whales s t u d i e d i n J u l y a n d September 1982 i n t h e same a r e a (Wursig e t a l . 1986). We wonder whether our p r e s e n t r e s u l t s may have been a f f e c t e d by t h e presence of a t l e a s t one l a r g e v e s s e l near t h e whales a t a lmost a l l t imes , u n l i k e t h e s i t u a t i o n i n 1982, when o b s e r v a t i o n s were g e n e r a l l y made from a smal l s k i f f > 1 km d i s t a n t from t h e mother s h i p . This p o s s i b i l i t y of a l e v e l of d i s t u r b a n c e even dur ing presumed "undisturbed" s i t u a t i o n s does n o t negate our r e s u l t s , however, s i n c e i n d u s t r i a l
d i s t u r b a n c e is l i k e l y t o be accompanied by t h e presence of l a r g e r v e s s e l s i n r e a l s i t u a t i o n s .
Disturbance r e a c t i o n s d u r i n g a i r gun playbacks were very s i m i l a r t o t h e reac- t i o n s found f o r sur fac ing- dive c h a r a c t e r- i s t i c s of bowhead whales when s u b j e c t e d t o a i r gun sounds (Richardson e t a l . 1985a, Ljungblad e t a l . 1985, Richardson e t a l . 198b). In bowheads, blow i n t e r v a l s in- creased and l e n g t h of s u r f a c i n g , l e n g t h of d i v e and number of blows p e r s u r f a c i n g a l l decreased dur ing a i r gun f i r i n g . The same b a s i c behaviora l s h i f t from f e e d i n g o r m i l l i n g p r i o r t o a i r gun sounds t o t r a v e l- i n g away from t h e sound source was noted f o r bowheads dur ing s e v e r a l experiments with f u l l- s c a l e se i smic v e s s e l s (Ljungblad e t a l . 1985).
A p o s s i b l e b i a s e x i s t s i n our d a t a . We used number of s u r f a c i n g- d i v e v a r i a b l e s encountered t o c a l c u l a t e degrees of f r e e- dom f o r s t a t i s t i c a l a n a l y s e s , wi thout regard f o r p o s s i b l e dependence of d a t a i n sur fac ing- dive sequences of i n d i v i d u a l animals . I f such dependence is s t r o n g , our degrees of freedom used t o c a l c u l a t e s t a t i s t i c s a r e o v e r e s t i m a t e s of a c t u a l a l lowable degrees of freedom. We have no t been a b l e t o determine amount of depend- ence w i t h i n p a r t s of our s e r i a l d a t a , however, and we t h e r e f o r e p r e s e n t degrees of freedom a s d i r e c t l y r e l a t e d t o sample s i z e s of s u r f a c i n g and d i v e v a r i a b l e s . Future work may help c l a r i f y p o t e n t i a l dependence of our t ime- ser ies d a t a .
Movement o b s e r v a t i o n s
The number of wnales observed under exper imenta l c o n d i t i o n s was low throughout t h e f i e l d season. This was due mainly t o t h e l a t e s t a r t i n g d a t e of t h e p r o j e c t , which r e s u l t e d i n a low number of whales p r e s e n t i n t h e s t u d y a r e a coupled wi th adverse viewing condi t ions . Because many whale groups were f a r o f f s h o r e d u r i n g much of t h e f i e l d p e r i o d , i t was g e n e r a l l y not p o s s i b l e t o use land-based t h e o d o l i t e t r a c k i n g of i n d i v i d u a l whales i n combina- t i o n wi th smal l b o a t observa t ions a s was accomplished by Wursig e t a l . (1983, 1986). The use of t h i s method would have i n c r e a s e d t h e number of whale groups t r a c k e d , s i n c e land-based observers cou ld have concent ra ted on 3 t o 4 groups s imul taneous ly , whereas t h e two-boat method most o f t e n employed r e q u i r e d B I G

VALLEY o b s e r v e r s t o focus o n l y on t h e one t o two groups under o b s e r v a t i o n by Zodiac personne l i n o r d e r t o o b t a i n whale move- ment da ta . Movement d a t a were ob ta ined dur ing two d r i l l s h i p playback experiments but t h e whale numbers were low. During s e v e r a l a i r gun experiments , we have extended d e t a i l e d o b s e r v a t i o n s , inc lud ing bo th s u r f a c i n g / r e s p i r a t i o n d a t a and t r a c k p l o t s . As examples we d e s c r i b e two a i r gun experiments (AG1 and AG4) f o r which o v e r a l l behaviora l p a t t e r n s a r e f a i r l y complete i n Appendix A.
Conclusions
It is d i f f i c u l t t o compare exper i- mental r e s u l t s concerning migra t ing gray whales w i t h t h o s e of f e e d i n g g r a y whales. D i f f e r e n t behaviora l responses were measured i n feed ing and migra t ing g r a y whales. The p a t t e r n of g r a y whale respon- s e s may s c a l e not on ly wi th KSL, but a l s o r a t e of change of RSL o r movement of t h e sound source. Both of t h e s e parameters v a r i e d wi th moving vs. s t a t i o n a r y a i r gun sources . A p r i o r i one may expec t t h e response of g r a y whales t o n o i s e s t i m u l i t o be a f u n c t i o n of behaviora l s t a t e a s has been po in ted o u t by Brodie (1981) and Richardson e t a l . (1985). However, t h e r e s u l t s of our s t u d i e s on t h e behaviora l responses of m i g r a t i n g and feed ing gray whales t o d r i l l s h i p sound playback and a i r gun o p e r a t i o n s i n d i c a t e measurable responses a t s i m i l a r exposure l e v e l s .
D r i l l s h i p playback
Analys i s of t h e s i g h t i n g d a t a f o r t h e combined d r i l l s h i p playback experiments showed t h a t a number of whales were exposed t o l e v e l s t h a t produced avuiaance behavior f o r migra t ing g r a y whales (110 t o 120 dB). No d e f i n i t e p a t t e r n of avoidance of t h e source a r e a was observed. However, u n t i l more t e s t i n g i s performed a t h igher exposure l e v e l s , we b e l i e v e t h a t the a p p l i c a t i o n of t h e p r o b a b i l i t y of avoid- ance r e s u l t s f o r m i g r a t i o n a c t i v i t y would provide a c o n s e r v a t i v e response e s t i m a t e f o r feed ing a c t i v i t y . For t h e purpose of e s t i m a t i n g zones of i n f l u e n c e , we w i l l cons ider t h a t exposure of f e e d i n g g r a y whales t o n o i s e l e v e l s of 110 dB o r more (from a cont inuous s t a t i o n a r y s o u r c e , such a s from a d r i l l s h i p ) would r e s u l t i n pos- s i b l e avoidance of t h e r e g i o n near t h e source and exposure t o l e v e l s of 120 dB o r more would probably cause avoidance of t h e
a r e a by more t h a n one-half of t h e g r a y whales.
Air gun n o i s e
More d a t a on f o c a l whales under c o n t r o l and exper imenta l c o n d i t i o n s a r e needed before f i r m conc lus ions regard ing t h e e f f e c t s of a i r gun o p e r a t i o n s on f e e d i n g g r a y whales can be made. The p r e s e n t d a t a s e t shows t h a t f e e d i n g g r a y whales can respond i n a v a r i e t y of ways t o a moving, s i n g l e a i r gun and t h a t t h e s e responses can occur a t RSL ranging from 149 dB t o 176 dB, with whale d i s t a n c e up t o 4 km from t h e source .
The cumulat ive d i s t r i b u t i o n of whales observed t o i n t e r r u p t feed ing a c t i v i t y a s a f u n c t i o n of average p u l s e p r e s s u r e l e v e l shown p r e v i o u s l y i n Fig. 9 was somewhat skewed. For skewed d i s t r i b u t i o n s , t h e median i s a b e t t e r e s t i m a t o r f o r t h e expected va lue than i s t h e mean (Zar 1974, p. 24). Thus, a n average peak p r e s s u r e l e v e l of 173 dB w i l l be considered a s t h e l e v e l of a i r gun n o i s e a t which 50% of feed ing gray whales w i l l probably i n t e r - r u p t feed ing a c t i v i t y . Based on t h e d a t a shown i n Fig. 9 and on t h e conf idence l i m i t c a l c u l a t i o n , 163 dA w i l l be con- s i d e r e d a s t h e a i r gun n o i s e l e v e l which w i l l probably cause 10% of f e e d i n g g r a y whales t o i n t e r r u p t feed ing a c t i v i t y .
Comparing t h e s e v a l u e s wi th t h e prob- a b i l i t y of avoidance v a l u e s ob ta ined f o r migra t ing g r a y whales, we f i n d t h a t a 0.1 p r o b a b i l i t y of avoidance occurred f o r a n a i r gun n o i s e l e v e l of 164 dB and a 0.5 p r o b a b i l i t y of avoidance occurred f o r a l e v e l of 170 dB. The a c o u s t i c s e n s i t i v i t y of g r a y whales t o a i r gun n o i s e when f e e d i n g i s t h u s a p p a r e n t l y no t g r e a t l y d i f f e r e n t from t h e i r s e n s i t i v i t y while migra t ing .
Acknowledgement
This s tudy was funded by t h e Minerals Management Serv ice through a n i n t e r a g e n c y agreement wi th t h e National Oceanic and Atmospheric Adminis t ra t ion , a s p a r t of t h e Outer Cont inen ta l Shelf finvironmental Assessment Program.

References
Baker , C.S., L.M. Herman, B.G. Bays, and G.B. Bauer 1983. The impact of v e s s e l t r a f f i c on t h e behav io r of humpback whales i n Sou theas t Alaska: 1982 season. Report from t h e Kewalo Basin Marine Mammal Labora to ry , U n i v e r s i t y of Hawaii, Honolulu f o r U.S. Na t iona l Marine F i s h e r i e s S e r v i c e , S e a t t l e , WA. 30 p. and t a b l e s and f i g u r e s .
Brod ie , P.F. 1981. E n e r g e t i c and b e h a v i o u r a l c o n s i d e r a t i o n s w i t h r e s p e c t t o marine mammals and d i s t u r b a n c e s from underwater no i se . p. 287-290 In: N.M. P e t e r s o n (ed . ) , The q u e s t i o n of sound from i c e b r e a k e r o p e r a t i o n s : P roceed ings of a workshop. February 22-23, 1981, Toronto. A r c t i c P i l o t P r o j e c t , Petro-Canada, C a l g a r y , A l b e r t a . 350 p.
Dean, F.C., C.M. J u r a s z , V.P. Palmer, C.H. Curby, and D.L. Thomas 1985. A n a l y s i s of humpback whale (Megaptera novaeang l iae ) blow i n t e r v a l d a t a G l a c i e r Bay, Alaska, 1976-1979. Report from t h e U n i v e r s i t y of Alaska , F a i r b a n k s , f o r U.S. Na t iona l Park S e r v i c e , Anchorage, AK. 224 p. and second volume of f i g u r e s .
Harvey, J.T. and B.R. Mate 1984. Dive c h a r a c t e r i s t i c s and movements of r ad io - tagged g r a y whales i n San I g n a c i o Lagoon, Baja C a l i f o r n i a S u r , Mexico. p. 561-575 In : M.L. J o n e s , S.L. Swartz , and S. Leatherwood ( e d s .) , The g r a y whale E s c h r i c h t i u s r o b u s t u s . Academic P r e s s , Orlando, FL. 600 p.
Ljungblad, D.K. tf. wUrsig, S.L. Swartz , and J .M. Keene 1985. Observa t ions on t h e b e h a v i o r of bowhead whales (Balaena m y s t i c e t u s ) i n t h e p r e s e n c e of o p e r a t i n g s e i s m i c e x p l o r a t i o n v e s s e l s i n t h e Alaskan Beaufor t Sea. Report from SEACO, Inc . , San Diego f o r t h e Minera l s Management S e r v i c e , Anchorage, AK. 53 p. and append ices .
Mackensie, K.V., 1973. Long-range p r o p a g a t i o n i n t h e s h a l l o w Bering Sea, J. Acoust. Soc. Am. 54(4):1066-1080.
Malme, C.I., P.R. Miles, C.W. C l a r k , P. Tyack, and J.E. Bird 1983. I n v e s t i g a t i o n s of t h e p o t e n t i a l e f f e c t s of underwater n o i s e from pe t ro leum i n d u s t r y a c t i v i t i e s on m i g r a t i n g g r a y whale behavior . Report No. 5366, r e p o r t p repared by t fol t Beranek
and Newman Inc . , Cambridge, MA, f o r t h e Minera l s Management S e r v i c e , Anchorage, AK. Various paging.
Malme, C.I., P.R. Mi les , C.W. C l a r k , P. Tyack, and J.E. Bird 1984. I n v e s t i g a t i o n s of t h e p o t e n t i a l e f f e c t s of underwater n o i s e f rom pe t ro leum i n d u s t r y a c t i v i t i e s on m i g r a t i n g g r a y whale behav io r - Phase 11: January 1984 migra t ion . Report No. 5586, r e p o r t p repared by B o l t Beranehc and Newman Inc., Cambridge, MA, f o r t n e Minera l s Management S e r v i c e , Anchorage, AK. Various paging.
Malme, C.I., P.R. Mi les , P. Tyack, C.W. C l a r k , and J.E. Bird 1985. I n v e s t i g a t i o n of t h e p o t e n t i a l e f f e c t s of underwate r n o i s e from pe t ro leum i n d u s t r y a c t i v i t i e s on f e e d i n g humpback whale behav io r . Report No. 5851, r e p o r t p r e p a r e d by BBN L a b o r a t o r i e s Inc . , Cambridge, MA, f o r t h e Minera l s Management S e r v i c e , Anchorage, AK. Various paging.
Malme, C . I . , B. w;rsig, J.E. B i r d , and P. Tyack 1986. Behav iora l r e sponses of g r a y whales t o i n d u s t r i a l n o i s e : f e e d i n g o b s e r v a t i o n s and p r e d i c t i v e modeling. Report No. 6265, r e p o r t p repared by BBN L a b o r a t o r i e s Inc . , Cambridge, MA, f o r NUAA, Anchorage AK. Various paging.
Richardson, W . J . , B. w;rsig, and C . K . Greene, Jr. 1986. Reac t ions of bowhead whales , Balaena m y s t i c e t u s , t o s e i s m i c e x p l o r a t i o n i n t h e Canadian Beaufor t Sea. J. Acoust. Soc. Am. 79(4):1117-1128.
Kichardson, W . J . , M.A. F r a k e r , B. w;rsig, and R.S. Wells 1985. Behaviour of bowhead whales Balaena m y s t i c e t u s summering i n t h e Beaufor t Sea: Reac t ions t o i n d u s t r i a l a c t i v i t i e s . B io l . Conserv. 32(3):195-230.
Richardson, W . J . , R.S. Wells, and B. Wursig 1985. Dis tu rbance r e s p o n s e s of bowheads, 1980-84. p. 89-196 In : W . J . Richardson (ed . ) , Behavior , d i s t u r b a n c e r e s p o n s e s and d i s t r i b u t i o n o f bowhead whales Balaena m y s t i c e t u s i n t h e e a s t e r n Beaufor t Sea, 1980-84. Report from LGL Ecol. Res. Assoc., Inc . , Bryan, TX, f o r t h e Minera l s Management S e r v i c e , Res ton , VA. 306 p.
S o k a l , R.R. and F.J. Rohlf 1969. Biometry - The p r i n c i p l e s and p r a c t i c e o f s tatist ics i n b i o l o g i c a l r e s e a r c h . W.H. Freeman & Co., San F r a n c i s c o , CA. 776 p.

Thompson, W.R. 1936. On conf idence ranges f o r t h e median and o t h e r e x p e c t a t i o n d i s t r i b u t i o n s f o r p o p u l a t i o n s of unknown d i s t r i b u t i o n form. Ann. Math. S t a t i s t . 7: 122.
Thomson, D.H. (ed.) 1984. Feeding eco logy of g r a y whales ( E s c h r i c h t i u s r o b u s t u s ) i n t h e Chi r ikof Bas in , summer 1982. Report from LGL Alaska Research A s s o c i a t e s , Inc . , Anchorage, AK f o r NOAA, Juneau, AK. 222 p.
Tyack, P. 1981. I n t e r a c t i o n s between s i n g i n g humpback whales and c o n s p e c i f i c s nearby. Behav. Ecol. Soc iob io l . 8(1):105- 116.
~~~~~
Urick , K.J. 1983. P r i n c i p l e s o f under- wate r sound f o r e n g i n e e r s , 3 rd e d i t i o n , McGraw-Hill, New York. 423 p.
w;rsig, B. 1978. On t h e behav io r and eco logy of b o t t l e n o s e and dusky d o l p h i n s . Ph.0. D i s s e r t a t i o n , S t a t e U n i v e r s i t y of New York a t Stony firook. 326 p.
wurs ig , B., E.M. Dorsey, M.A. F r a k e r , K.S. Payne, W . J . Kichardson, and K.S. Wells 1984. Behavior of bowhead whales , Balaena m y s t i c e t u s , summering i n t h e Beaufor t Sea: s u r f a c i n g , r e s p i r a t i o n , and d i v e char- a c t e r i s t i c s . Can. J. Zool. 62(10):1910- 1921.
w<rsig, B., R.S. Wells, and D.A. C r o l l 1983. Behavior of summering g r a y whales. p. 109-144. In: D.H. Thomson (ed.) , Feeding eco logy of g r a y whales ( E s c h r i c h t i u s r o b u s t u s ) i n t h e Chi r ikof Bas in , summer 1982. Report from LGL Alaska Research A s s o c i a t e s , .c., Anchorage, AK, f o r NOAA, Juneau , AK. 222 p.
~ i r s i g , 6., K.S. Wel l s , and D.A. C r o l l 1986. Behavior of g r a y whales summering near St. Lawrence I s l a n d , Bering Sea. Can. J. 2001. 64(3):611-021.
Zar , J . H . 1974. B i o s t a t i s t i c a l a n a l y s i s . P ren t i ce- Hal l , Englewood C l i f f s , N J . 629 p.
Appendix A - A i r Gun Experiment Examples
AG 1, 22 August, 1440-1600
Whale E was fol lowed by Zodiac p e r s o n n e l from 1141-1852, a t o t a l of 7.2 h r , t h e l o n g e s t p e r i o d t h a t a whale
was kep t under con t inuous o b s e r v a t i o n d u r i n g t h e f i e l d season. Movement "-'-a
were c o l l e c t e d on t h i s whale from 1327- 1832. F i g u r e 10 shows t h e movement of Whale E d u r i n g pre-AG 1 c o n t r o l . Although mud was o n l y observed a s s o c i a t e d w i t h Whale E once d u r i n g t h i s c o n t r o l p e r i o d , (obse rvance of mud was hampered by poor v i s i b i l i t y between approx imate ly 1400- 1632), t h e many d i r e c t i o n changes and t h e f a c t t h a t t h e whale s t a y e d i n t h e same g e n e r a l l o c a t i o n d u r i n g much o f t h e t i m e , l e d o b s e r v e r s t o conc lude t h a t t h i s whale was f e e d i n g . We canno t e x p l a i n t h e nor th- ward movement p a t t e r n between 1411-1438 as shown i n Fig. 10. At 1446, 6 minu tes a f t e r t h e o n s e t of AG I , p e r s o n n e l on t h e BIG VALLEY no ted t h a t t h e 5 t o 7 whales under o b s e r v a t i o n , i n c l u d i n g Whale E, were moving o f f s h o r e . The r e c e i v e d sound l e v e l (RSL) a t t h e whales was approx imate ly 149 dB, w i t h t h e NANCY H 3 .9 km d i s t a n t . The Zodiac p e r s o n n e l a l s o no ted t h e whales moving o f f s h o r e a t 1503, a t which t ime t h e NANCY tl was 3.63 km d i s t a n t from Whale E and RSL was 150 dB. Throughout bo th con- t r o l and exper imenta l p e r i o d s , Whale E was t h e o n l y whale under con t inuous observa- t i o n . F i g u r e 11 shows t h e movement pa t- t e r n of Whale E i n r e l a t i o n t o t h e NANCY H, which was moving s o u t h towards t h e g e n e r a l area o f t h e whale. At 1504, Whale E was j o i n e d by 1 o r 2 wha les , and t h e whales moved s o u t h , t h e n s o u t h e a s t and o f f s h o r e . RSL i n c r e a s e d at Whale E th roughout AG 1 , w i t h a peak l e v e l of 172 dB reached a t 1559, w i t h NANCY H 0.19 km d i s t a n t . No i n d i c a t i o n s of f e e d i n g by Whale E o r by o t h e r whales i n t h e a r e a were noted d u r i n g t h e exper iment .
Examinat ion o f t h e t r a c k p l o t o f Whale E i n r e l a t i o n t o t h e southward- moving NANCY H i n d i c a t e s t h a t t h i s whale was a c t i v e l y moving away from t h e v e s s e l , p o s s i b l y a t t e m p t i n g t o move o f f s h o r e . However, t h e l a s t t h r e e r e a d i n g s on Whale E d u r i n g AG 1 i n d i c a t e t h a t i t d i d n o t c o n t i n u e t o move s o u t h e a s t , but s t a y e d i n t h e same a r e a as t h e NANCY H approached i t s p o s i t i o n . During t h i s p e r i o d (1549- 1558) , RSL a t Whale E i n c r e a s e d from 160 dB t o 172 dB.
Our nex t r e a d i n g of Whale E ( s e e F i g u r e 12) a t 1606, a lmos t 6 minu tes a f t e r t h e end of AG 1, shows t h a t between 1558 and t h i s t i m e , t h e whale moved back t o t h e n o r t h and by 1633 was f e e d i n g , as e v i- denced by mud plumes. (Time 1633 co-

START TIME: U4000 STOP TIME : 160000 LEGEND
A =big
22 Aug 1985 AG 1 = non n = e
START TIME: 73000 STOP TIME : U4000 LEGEND
b =big
22 Aug 1985 Pre-AG 1 Control =
6 ( -I.
I 3.0 4 0 5.0 6 0
Kilometers Eost
Figure 10. Track p l o t of whale E dur ing pre-AGI c o n t r o l on 22 August.
i n c i d e s w i t h t h e f i r s t appearance of t h e sun a l l day , thereby making mud a t t h e w a t e r ' s s u r f a c e more e a s i l y v i s i b l e t o observers ) . A t t h i s t ime , t h e whale was approximately 0.5 km n o r t h e a s t of i t s pre- AG 1 c o n t r o l p o s i t i o n . The whale s t a y e d i n t h i s same g e n e r a l a r e a , f e e d i n g , through t h e post-AG 1 c o n t r o l per iod . Zodiac personne l noted t h a t a f t e r t h e end of AG 1, o t h e r whales were a l s o moving i n s h o r e t o t h e g e n e r a l a r e a of Whale E.
AG 4, 24 August, 1929-2026
Whale B was observed t o be feed ing dur ing t h e c o n t r o l per iod between AG 3 and AG 4. F igure 13 shows t h e movement pa t- t e r n of t h i s whale r e l a t i v e t o t h e NANCY H d u r i n g AG 4. At t h e o n s e t of AG 4, RSL a t Whale B was 159 dB wi th t h e NANCY H 1.75 km t o t h e nor th . Whale B cont inued t o feed and between 1942-1954 was moving s lowly t o t h e n o r t h , toward t h e NANCY H, which was motoring southward. During t h i s p e r i o d , RSL was i n c r e a s i n g and a t 1957 i t
2.0 3.0 4 0 5 0
Kilometer; Eost
Figure 11. Track p l o t of whale E dur ing A G l on 22 August.
had reached 176 dM w i t h t h e NANCY H 0.18 Km d i r e c t l y o f f s h o r e of Whale B. At t h i s p o i n t , o b s e r v e r s noted t h a t t h e whale had tu rned and was moving r a p i d l y t o t h e s o u t h , d i v i n g w i t h f l u k e s o u t . This was t h e f i r s t t ime dur ing t h e e n t i r e per iod of o b s e r v a t i o n t h a t Whale B d i s p l a y e d a f u l l f l u k e out upon d i v i n g , and t h i s a c t i o n was unusual s i n c e t h e whale was i n sha l low water (dep th < 9 m) i n which f l u k e o u t s do no t normally occur . The whale cont inued t o move s o u t h , and a t 2002 another f u l l f l u k e o u t was noted. A t t h i s p o i n t , RSL had reached a peak of 177 dB with t h e NANCY H 0.17 km d i s t a n t . Mud was observed w i t h t h i s d i v e , and Whale B was presumed t o be feed ing . The whale cont inued moving s lowly t o t h e s o u t h u n t i l approximately 2011, a t which t ime i t began t o m i l l . By 2015, mud was a g a i n a s s o c i a t e d with Whale B , and t h e whale cont inued t o feed throughout t h e remainder of AG 4, s t a y i n g i n t h e same g e n e r a l l o c a t i o n . RSL a t Whale B was d e c r e a s i n g dur ing t h i s per iod and by t h e end of t h e experiment was 159 dB, w i t h t h e NANCY H 1.80 tan t o t h e south- e a s t of t h e whale 's l o c a t i o n . Whale B cont inued t o f e e d dur ing t h e p o s t AG 4 c o n t r o l and was l a s t observed a t 2042.

START TIME: 160000 STOP TIME : 171000
LEGEND
= non x =
22 Aug 1985 Post-AG 1 Control 3.0 4.0 & 0 I
I 1.0 4.0 5 0 Kilometers East-
Figure 12. Track p l o t o f whale E during post-AGI on 22 August.
START TIME: 192900 STOP TIME : 202600
LEGEND A = non * = b
24 Aug 1985 AG 4
Figure 13. Track p l o t of whale B during AG4 on 24 August.


INDUSTRY OBSERVATIONS OF BOWHEAD WHALES IN THE CANADIAN BEAUFORT SEA, 1976-1985
John G. Ward E. Pessah
Dome Petroleum Limited, Calgary, Alberta, CANADA
Abstract
In 1976 Canadian Marine Drilling Ltd. (Canmar) began exploratory drilling in the deeper offshore waters of the Canadian Beaufort Sea using drillships supported by icebreaking supply boats and icebreakers. As part of the terms and conditions of the approval for this activity, Canmar personnel were requested to record incidental sightings of wildlife in general and of marine mammals in particular during the course of their offshore exploration activities. This paper summarizes all bowhead whale sightings recorded by Canmar personnel since 1976 and discusses these sightings with respect to the bowhead whale issue in the Canadian Beaufort Sea. Namely, it has been suggested that exploration activities in the Canadian Beaufort have caused bowheads to decrease their use of the area where the exploration activity has occurred. An alternative suggestion is that the distribution of bowheads in the Canadian Beaufort
This is a reviewed and edited version of a paper presented at the Ninth International Conference on Port and Ocean Engineering Under Arctic Conditions, Fairbanks, Alaska, USA, August 17-22, 1987. @ The Geophysical Institute, University of Alaska, 1987.
Sea has varied from year to year because of a varying distribution of the zooplankton on which bowheads feed. The Canmar incidental sightings are examined in relation to the first of these hypotheses and to the various other studies that have been carried out on bowheads in the Canadian Beaufort Sea. It is concluded that the incidental sightings, together with the results of other studies, do not support the suggestion of a trend to decreasing use of the exploration area by bowheads.
Introduction
In 1976, Canadian Marine Drilling Ltd. (Canmar) began exploratory drilling in the deeper (20-65 m) offshore waters of the Canadian Beaufort Sea region (Figure 1) using drillships supported by icebreaking supply boats and icebreakers. Prior to 1976, all exploratory drilling activity in the region had been located onshore or in nearshore waters adjacent to the Mackenzie Delta and Tuktoyaktuk Peninsula. The nearshore drilling activity had been carried out from artificial islands constructed in waters less than 15 m deep.

Figure 1. The Canadian Beaufort Sea.
As part of the terms and conditions of the government approval of offshore drilling with drillships, Canmar was requested to have their personnel record incidental sightings of wildlife during the course of the exploration activities in the Beaufort Sea. This activity was initiated in 1976 and has been continued each year since that time.
One species of wildlife that occurs in the eastern Canadian Beaufort Sea and that is of articular interest is the bowhead whale (Balaena mysticetus). It is classified as an endangered species in both Canada and the U.S. The western Arctic population of this species is the largest remaining stock and is estimated to number approximately 4,400 individuals (IWC
1986). This stock of bowheads winters in the Bering Sea and summers in the eastern Beaufort Sea. During the spring and fall migration through the Chukchi and western Beaufort seas adjacent to Alaska, the whales are subject to a subsistence hunt by Alaska Eskimos.
Since 1980, systematic aerial surveys of bowhead whale distribution have been carried out annually in the southeastern Beaufort Sea during the last half of August and first half of September (e.g. Davis et al. 1982; Duval et al. 1986). Also, beginning in 1980 and continuing until 1984, a major bowhead whale behaviour study was carried out in the southeasteri Beaufort Sea to examine the behavioural responses of bowheads to oil exploration activities

(Richardson 1985). The latter study raised a concern about exploration activities in the Canadian Beaufort Sea.
The issue as it presently exists for summering bowheads in the Canadian Beaufort Sea has been described by Duval et al. (1986) as follows. "Two hypotheses have been formulated as part of the Beaufort Environmental Monitoring Project (BEMP) to explain the annual variability in the distribution of bowhead whales observed in the southeastern Beaufort Sea since systematic aerial surveys were initiated in 1980 (INAC and Environment Canada 1984, 1985). One hypothesis suggests that activities of the oil and gas industry have caused, or contributed to, the exclusion of bowheads from the industrial zone (the lexclusion hypothesis1). The other hypothesis suggests that the distribution of bowheads is determined by physical and biological oceanographic factors, particularly those influencing the distribution and abundance of zooplankton (the 'food hypothesis1). During the most recent [I9861 BEMP workshop addressing the bowhead whale (INAC and Environment Canada 1987), it was concluded that testing of these hypotheses is unlikely to be possible within a sound statistical framework and, therefore, must rely on the lweight-of-evidencel from past and future research and monitoring efforts directed at this species.''
The purpose of this paper is to examine the Canmar incidental sightings of bowhead whales in relation to the exclusion hypothesis and to the various studies that have been carried out on bowheads in the eastern Beaufort Sea.
Methods
The recording of wildlife sightings by Canmar has varied to some extent between years and types of vessels. Prior to 1980, only drillship personnel were involved in the recording of sightings of wildlife, whereas in 1980 and
subsequent years, personnel on both drillships and support vessels recorded sightings of wildlife.
Most observation activity by personnel both on the drillships and on the support vessels was opportunistic in nature. However, on the drillships, limited systematic observations were also carried out. Ice observers on the drillships carried out a 10 minute wildlife watch every four hours during a 12 hour shift, if work, weather and light conditions permitted. When two ice observers were on board each drillship to provide 24 hour ice reporting coverage, up to six watches per day could be conducted. Generally, only three or four such watches were undertaken each day. Since 1981, ice observers have carried out either 10 or 15 minute long watches, with the length of watch used on each drillship being the same throughout the drilling season each year.
As summarized in the next section, most whale sightings resulted from opportunistic observations. Because the actual level of observational effort expended by personnel on various vessels in making these sightings is unknown, there is no good comparative measure of overall effort on a year-to-year basis. However, it is suggested that the number of Canmar vessels operating in the offshore waters each year can serve as an approximate indicator of observational effort made each year. The number of vessels are shown in Table 1.
Results
The Canmar sightings of bowhead and unidentified whales since 1976 are summarized in Table 2 according to whether they were reported by personnel on the drillships or on the various support vessels. The sightings of unidentified whales have been included because it is felt the majority of these will be bowhead rather than beluga whales. The distinctive white or cream colour of

TABLE 1
Number of Canmar Vessels in Offshore Waters of the Eastern Beaufort Sea
VESSEL TYPE 1976 1977 1978 1979 1980 1981 1982 1983 1984 1985 - - - - - - - - - - Drillships 1* 3** 3 4 4 4 4 4 4 4 SupplylStandby*** - - - - 17 22 18 17 17 18 DredgesIBarge Tugs 0 0 0 0 0 4 3 5 1 0
* Three drillships were present but only one was involved in recording wildlife observations. ** Three drillships recorded sightingsy but records were available only for one ship. *** Personnel on these vessels did not record sightings prior to 1980.
TABLE 2
Summary of Number of Sightings (and Total Numbers seen1) of Bowhead and Unidentified Whales Reported by Canmar Personnel during the Period August 1 - September 10 for the
Years 1976 - 1985.
Drillships Support vessels2
Bowhead Unidentified
~ o t a l ~ Supply
Drillships Vessels
1 Numbers in parentheses are total number of whales seen for all sightings. Data from ~ome/Canmar (1978Â 1979, l98Oy 1982Â 1984ay 1984b, 1985) and Marex (1977).
2 Includes supply/standby vessels and dredgeslbarge tugs shown in Table 1. 3 Bowhead and unidentified whales. 4 Four sightings of bowheads in 1980 and one sighting in 1981 were made during
the systematic watches. All other sightings of both bowhead and unidentified whales resulted from opportunistic observations.

adult beluga whales would make them relatively easy to identify at close range* but their comparatively small size would make them difficult to detect at greater distances (Norton and Harwood 1986; Duval et al. 1986). Hence it is probable that belugas* if seen* would generally be identified to species. The much larger bowheads would be easier to detect at greater distancesy but their black colouration would probably create doubt as to species for some observers if the whale was a long distance away. Hence bowheads are more likely to be seen at greater distances from the vessel than beluga whales* but such whales may be classed often as unidentified whales.
Only sightings made during the period August 1 to September 10 have been included in Table 2. This time frame was selected because it corresponds to the one selected by Richardson et al. (1985) to show the zones of industrial activity in the southeastern Beaufort Sea and the qualitative depictions of the abundance and distribution of bowheads in this region for the years 1980 - 1984.
With the exception of 19773 1980 and l98ly drillship personnel reported very few sightings of whales each year (Table 2). On the other hand* personnel on support vessels reported the majority of the whale sightings in all years since 1980 when they began reporting sightings. However* when the differences in numbers of drillships versus numbers of support vessels is considered* then the numbers of sightings are more similar for the two types of vessels. Like the drill ship^^ support vessels reported largest numbers in 1980 and l98ly and lower numbers in 1982 - 1985. However* unlike the drill~hips~ the numbers of sightings recorded by support vessels in 1982-85 as compared to 1980-81 did not show as large a decrease as that which occurred for drillships.
Discussion
The Canmar incidental sightings
data provide a reasonable indication of the relative abundance of bowhead whales within the overall industrial zone and contribute to the "weight-of-evidence'' with respect to the validity of the 'exclusion hypothesis'. Before considering these two aspectsy we review the results of studies conducted during the two bowhead research initiatives started in 1980 and previously mentioned in the Introduction.
Bowhead Research Studies
The two bowhead research programs that were started in the eastern Beaufort Sea in 1980 have provided a substantive systematic data base on the relative abundance and distribution of bowheads in the Canadian Beaufort Sea in August and early Septembery from 1980 to the present. Richardson et al. (1985) summarized the data from these research studies in the form of maps that showed all sightings of bowheads in the southeastern Beaufort Sea during 10-day periods from August 1 to September loy for the years 1980 - 1984. They also summarized the zones of industrial activity on these maps for the same periods.
Figure 2 contains composite maps adapted from Richardson et al. (1985) that show the zones of industrial activity and the relative abundances and distributions of bowheads seen during the entire period August 1 - September 10 for the years 1980 - 1985. They also include the locations of drillship activity. The map that is included for 1985 is based on the results presented by hval et al. (1986). The maps are based on the technique used by Richardson et al. (1985) to summarize the relative abundance and distribution of bowheads during individual 10-day periods for the years 1980-84. Areas of abundance that are designated on these maps as few* moderate and many are those with3 respectively3 widely separated sightings of 1-3 whales* many sightings of 1-3 whales* and large groups of whales (Richardson et al. 1985). The technique is highly qualitative and is presented here

Bowhead Abundance
Many Moderate Few None
--- Industrial Zone Boundary A Canrnar Drillship Location
August 1 - September 10, 1981- -"''' ,,w ,W' we' ,>.
Beeufo,! -.
August 1 - September 10, 1982 '=' ,,? >w
Beaufort sea 8
August 1 - September 10, 1983 '"" UP' >w 82.' ,
8ea"rorf sea 8
Figure 2. Relative Abundances and Distributions of Bowheads in the Eastern Beaufort Sea, 1980 - 1985.

primarily to provide the reader with an overall impression of where bowheads were seen in general in the years 1980-85 and where concentrations (I. e. "many "1 occurred specifically, relative to the location of industry activity.
Richardson et al. (1985) described the relative abundances and distributions indicated by the survey data from 1980 - 1984 as follows. "Over the 1980 - 1982 period, bowhead distribution overlapped progressively less with the area of offshore dredging, construction and drilling. Bowheads were abundant within the main industrial area in 1980, much less abundant there in 1981, and virtually absent in 1982. Maximum numbers in the main industrial area in 1983 were slightly greater than in 1982, and there was some further increase in 1984". Richardson et al. (1987) concluded that "utilization of the main industrial area decreased markedly from 1980 to 1982 and then increased slightly from 1982 to 1983-84." On the basis of an apparent overall downward trend from 1980 to 1984, Richardson et al. (1985, 1987) suggested that industry activity may be affecting utilization of the industrial zone by bowheads. A significant assumption of this apparent trend is that 1980 and 1981 are representative of the historical "normal" bowhead distribution in the Canadian Beaufort.
Although Figure 2 indicates that in the years 1982 - 1985 most bowheads occurred outside the industrial zone, localized concentrations did occur within the zone in 1983 and 1984. In both years, these localized concentrations occurred in the offshore area of east-central Mackenzie Bay, approximately along the 20 m depth contour line.
Prior to 1980, limited aerial surveys north of Kugmallit Bay in 1978 and 1979, and incidental sightings by biologists and industry personnel (non-Canmar) in that area in 1976 - 1977, provide less detailed but useful additional data. According to Richardson et al.
(19851, "The fragmentary data from 1976 - 1979 indicate that many bowheads were seen in the middle of the main industrial area [i.e., north of Kugmallit Bay] in early August of 1976 and 1977, but not in 1978 or 1979. Bowheads apparently entered the industrial area in early September of 1978, but in 1979 there were very few sightings at any time." Richardson et al. (1985, 1987) concluded that "the presence of many whales in 1980, after a period of apparent scarcity in 1978 - 1979, casts doubt on the suggestion that there is a trend for decreasing utilization of the main industrial area." As discussed below, the evidence indicates that the apparent trend is likely an artifact of the data initially used to suggest the trend.
Canmar Incidental Sightings
A comparison of the incidental sightings results (Table 2) and the systematic aerial survey results show that the Canmar incidental sightings for the years 1980 - 1985 provide an indication of the relative abundance of bowheads in the industrial zone that is reasonably similar to that shown by the aerial surveys (Table 3 ) . Namely, bowheads were abundant in the industry zone in 1980 and 1981, and relatively scarce there in 1982 - 1985. Even if the unidentified whales, which are suspected to be largely bowheads, were added to Table 3, the trend does not change. The similarity between these two data sources provides the confidence to use the 1976 - 1979 Canmar incidental sightings data to make statements about the presence of bowheads in the industrial zone in those years (Figure 3).
The small numbers of bowhead sightings by Canmar personnel in 1978 and 1979 (Table 2) indicate that bowheads were not abundant in the industrial zone during the August 1 - September 10 period in those two years. Richardson et al. (1985) made the same suggestion based on other incidental sightings and limited survey coverage in the area immediately north of Kugmallit Bay in

TABLE 3
Comparison of the Canmar Incidental Sightings and the Systematic Aerial Surveys of Bowhead Whales
Year - 1980 1981 1982 1983 1984 1985
Support August Aerial survey2 September Aerial survey2 Drillship Vessel Industry Industry sightingsl sightingsl zone3 Entire Area zone3 Entire Area
1 Numbers in parentheses indicate total number of bowhead whales seen for all sightings. (Values from Table 2).
2 Numbers include both bowheads seen on the transects and those seen beyond the transects. Data taken from Renaud and Davis (19811, Davis et al. (19821, Harwood and Ford (1983), McLaren and Davis (19851, Harwood and Borstad (19851, and Duval et al. (1986).
3 Industry zone for each year same as one shown on Figure 2. 4 1980 survey area mostly in the industry zone.
those two years. It is expected that drillships would have recorded more whale sightings during the August 1 - September 10 period in those two years as was experienced in 1980 and 1981 if the whales had been relatively abundant in the industrial zone. For example, in 1979, Explorer IV personnel recorded five sightings of approximately 30 bowheads in total at the Natsek site west of Herschel Island after September 10. In that same year and month Ljungblad (1981), who was carrying out bowhead surveys for the U.S. Eernment, also recorded significant numbers of bowheads 56 km west of Natsek. A drillship was present at Natsek in 1978 also, from September 3 to October 14, but no whale sightings were reported. In 1978, the four sightings of bowheads and unidentified whales by Canmar personnel (Table 2) consisted of one sighting from the Tarsiut site and three sightings from the Ukalerk site. Only beluga sightings were recorded at the Nerlerk and Kopanoar sites (Dome/Canmar 1978). The sightings in the Ukalerk area were immediately offshore of Kugmallit Bay
where Fraker (1978) also reported bowhead sightings in early September 1978. Thus the drillship sightings in 1978 and 1979 agree with the results of other studies in those two years and provide additional evidence of the relative absence of bowheads in the industrial zone in those two years.
It is suggested that in 1977, bowheads were also relatively scarce in the overall industry zone, although unlike 1978 and 1979, bowheads were locally abundant in the area north of Kugmallit Bay and Toker Point. ~ome/Canmar (1979) reported that most whale sightings in 1977 occurred at the Ukalerk drill site located NNE of Kugmallit Bay, and unpublished information indicated that bowheads were sighted in the Ukalerk area by Canmar personnel from August 20 to September 20. All of this is consistent with the findings summarized by Richardson et al. (1985). Drillships were also located at the Nektoralik and Kopanoar sites in 1977 (Figure 3).
The relatively large number of

Auaust 1 - September 10.1976
9 ACanmar Dnllsh#p Location Beauloff Sea k
Yukon \ .~tl\' L\
iugust 1 - September tu, i y r f
kcanmar Dnllship Location Beaulort sea 8
1 2 4
August 1 - September 10,1978 8W inr' ***
ACanmar Dnllship Location Beaufort S M
August 1 - September 10, 1979 '*' 1M"' IMC' lie ,
A Canmar Dnllship Location Beauloft sea i
Figure 3. Offshore Industrial Area, 1976 - 1979. sightirigs of bowheads and unidentified whales recorded in 1977 differed from those in 1980 and 1981 in that the sightings apparently occurred mostly or entirely at one site, while in 1980 and 1981 the sightings were distributed among three and four drillships, respectively (Dome/Canmar 1980, 1982). This suggests that the distribution in 1980 and 1981 was relatively widespread in the industrial area, while in 1977 it was localized in the eastern corner of the exploration area in the vicinity of outer Kugmallit Bay and Ukalerk. It is possible that the concentration of bowheads in 1977 was in fact widespread off the Tuktoyaktuk Peninsula and that only the western edge of the concentration overlapped the exploration area.
In 1976, there was only one
report of 50+ unidentified whales in two pods seen 29 km SE of Kopanoar on August 18 by Canmar personnel travelling on a helicopter (Marex 1977). In view of the number of whales seen, it is possible this sighting was of belugas rather than bowheads. No whales were reported from the Tingmiark location between July 20 and August 5, which is located immediately north of Kugmallit Bay where Fraker (1977) first reported bowheads on August 3. Fraker (1977) also noted that 1976 was the first time in five years of beluga whale studies that bowheads had been observed within his study area. Although less certain, it seems likely that within the industrial zone, bowheads were only locally abundant in the area north of Kugmallit Bay and Toker Point.
The reason for the relatively

large numbers of sightings by support vessels in 1982-85 compared to 1980-81 is unknown and cannot be explained by differences in numbers of such vessels (Table 1). Possibly because the support vessels move about within the industry zone, personnel have a greater opportunity to encounter either small localized concentrations of whales or transient whales that may be present in the industry zone for only a very brief time.
In summary, the Canmar incidental sightings of bowhead whales indicate that bowhead whales were relatively abundant and widely distributed in the industrial zone in 1980 and 1981, and relatively scarce in the years 1982 - 1985 and 1977 - 1979. Localized concentrations occurred in the industrial zone in 1983 and 1984, and probably in 1977. The situation is less clear for 1976, but bowheads also may have been relatively scarce in the overall industrial zone in that year except for a localized concentration in the Kugmallit Bay area. The above interpretation differs from that of
August
Richardson et al. (1985, 1987) who equated the bowhead sightings north of Kugmallit in 1976 and 1977 to the widespread abundance observed in the industrial zone in 1980. In view of the results of the Canmar incidental sightings, this seems unlikely.
Historical Whaling Records
Studies of whaling records from the late 1800's and early 1900's also provide useful information on the distribution of bowheads relative to the "industry zone". Townsend (1935 in Dalheim et al. 1980) summarized - the locations where bowheads were taken by Yankee whalers in the eastern Beaufort in August and September 1848 - 1919. That summary shown in Figure 4 indicates that most bowheads were taken in areas approxi- mately west of longitude 138OOO'W and east of 131°00'W A few whales (6%) were taken in the intervening area which now encompasses the primary exploration area.
Fraker and Bockstoce (1980) analyzed the locations of both sightings and captures of bowheads by
September
I 'LÑ. U.S.A. 1 Canada
Figure 4. Locations where bowheads were harvested by Yankee whalers in the Eastern (Canadian) Beaufort Sea in August and September, 1848 - 1919 (adapted from Townsend 1935).

commercial whalers in the period 1891 - 1906. Prior to 1900, August sightings or captures of bowheads were mainly in areas east of longitude 131°00' or west of 138°00' as reported by Townsend (1935). Approximately 16% of the sightings or captures in August occurred in what is now the main industrial zone. After 1900, when the stock was presumably substantially depleted, all of the relatively few August sightings or captures were in the eastern Beaufort east of 13Z0W longitude or in Amundsen Gulf.
Thus it is interesting that the approximate area known as the main Industrial zone today coincides with an area in which few bowheads were taken in the period 1848 - 1919. It is generally assumed that the Yankee whalers concentrated their hunt for bowheads in areas where they were most likely to encounter the whales. This then strongly suggests that historically bowheads were also not present in the zone in large numbers. In light of this information, it seems even less likely that the exclusion hypothesis is a valid explanation of the bowhead distribution observed in recent years.
Conclusions
The Canmar incidental sightings data provide further evidence towards determination of the relative abundance or absence of bowheads within the industrial zone. During the period from 1976 to 1985 the incidental sightings data, together with the results of other studies, suggest that bowheads were widely abundant in the exploration zone only in 1980 and 1981, that localized concentrations occurred in the industrial zone in 1976, 1977, 1983, and 1984, and that bowheads were largely absent from this zone in 1978, 1979, 1982 and 1985. Historical whaling records indicate that in the late 1800's and early 1900's bowheads were also not abundant in the area now known as the main industrial area.
It is concluded, therefore, that the available information from 1976 to 1985 and the historical whaling information do not support the suggestion of a trend for decreasing utilization of the industrial zone by bowheads as a result of oil and gas exploration activities. As a result, the "weight-of-evidence" suggests that the exclusion hypothesis is likely invalid.
References
Dalheim, M., T. Bray and H. Braham. 1980. Vessel survey for bowhead whales in the Bering and Chukchi Seas, June-July 1978. Marine Fisheries Review 42:51-57.
Davis, R.A., W.R. Koski, W.J. Richardson, C.R. Evans and W.G. Alliston. 1982. Distribution, numbers and productivity of the western Arctic stock of bowhead whales in the eastern Beaufort Sea and Amundsen Gulf, summer 1981. Prep. by LGL Limited, Toronto, Ontario. Prep. for Dome Petroleum Limited, Calgary, Alberta, and Sohio Alaska Petroleum Company, Anchorage, Alaska. 135 p.
Dome/Canmar. 1978. Canmar wildlife observation program, Beaufort Sea - 1978 season. Unpublished Dome/Canmar Technical Report, Dome Petroleum Ltd., Calgary.
Dome/Canmar. 1979. Environmental observations in the Beaufort Sea, 1979 season. Wildlife Report. Unpublished Dome/Canmar Technical Report, Dome Petroleum Ltd., Calgary.
Dome/Canmar. 1980. Environmental observations in the Beaufort Sea, 1980 season. Wildlife Report. Unpublished Dome/Canmar Technical Report, Dome Petroleum Ltd., Calgary. 71p.
Dome /Canmar. 1982. Wildlife observations in the Beaufort Sea, 1981 season. Unpublished Dome/Canmar Technical Report, Dome Petroleum Ltd., Calgary. 77p.
Dome/Canmar. 1984a. Wildlife
observations in the Beaufort Sea, 1982 season. Unpublished ~omefCanmar Technical Report, Dome Petroleum Ltd., Calgary. 72p.~ome/Canmar. 1984b. Wildlife observations in the Beauf ort Sea, 1983 season. Unpublished DomefCanmar Technical Report, Dome Petroleum Ltd., Calgary. 70p.
Dome / Canmar. 1985. Wildlife observations In the Beaufort Sea, 1984 season. Unpublished DomefCanmar Technical Report, Dome Petroleum Ltd., Calgary. 70p.
Duval, W.S. (ed.), L. W. Harwood, P. Norton, J. Cubbage, J. Calambokidis, G.A. Borstad, J.C. Chemiawsky and R. Kerr. 1986. Distribution, abundance and age segregation of bowhead whales relative to industry activities and oceanographic features in the southeast Beaufort Sea, August - September 1985. Environmental Studies Revolving Funds Report 057, Ottawa.
Fraker, M.A. 1977. The 1977 whale monitoring program, Mackenzie estuary, N.W.T. Unpublished report by F.F. Slaney and Company Ltd., Vancouver, B.C., for Imperial Oil Ltd., Calgary.
Fraker, M.A. 1978. The 1978 whale monitoring program, Mackenzie Estuary, N.W.T. Unpubl. Rep. by F.F. Slaney & Co., Vancouver, for Esso Resources Canada Ltd., Calgary. 28 p.
Fraker, M.A. and J.R. Bockstoce. 1980. Summer distribution of bowhead whales in the eastern Beaufort Sea. Marine Fisheries Review 42:57-64.
Harwood, L. and G.A. Borstad. 1985. 1984 Beaufort bowhead whale monitoring study. Unpublished report by ESL Environmental Sciences Limited and G.A. Borstad Ltd. for the Environmental Studies Revolving Fund and Indian and Northern Affairs Canada. ESRF 192-14-02.
Harwood, L.A. and J.K.B. Ford. 1983. Systematic aerial surveys of
bowhead whales and other marine mammals in the southeastern Beaufort Sea, August-September 1982. Unpublished report by ESL Environmental Sciences Ltd. for Dome Petroleum Ltd. and Gulf Canada Resources Inc.
Indian and Northern Affairs Canada (INAC) and Environment Canada. 1984. Beaufort Sea Environmental Monitoring Project, 1983 - 1984. Final Report. Prepared by LGL Ltd., ESL Environmental Sciences Ltd. and ESSA Ltd. 292p.
Indian and Northern Affairs Canada (INAC) and Environment Canada. 1985. Beauf ort Environmental Monitoring Project, 1984-1985. Final Report. Prepared by ESL Environmental Sciences Ltd., LGL Ltd., ESSA Ltd., Arctic Laboratories Ltd. and Arctic Sciences Ltd. 162p.
Indian and Northern Affairs Canada (INAC) and Environment Canada. 1987. Beauf ort Environmental Monitoring Project, 1985 - 1986 Final Report. Environmental Studies No. 40. Prepared by LGL Ltd., ESL Environmental Services Ltd., ESSA Ltd., Arctic Laboratories Ltd., and Arctic Sciences Ltd. 199p.
IWC (International Whaling Commission). 1986. Report of the Sub-committee on protected species and aboriginal subsistence whaling. Report of the International Whaling Commission Annex H. Vol. 36: 95-111.
Ljungblad, D.K. 1981. Aerial surveys of endangered whales in the Beaufort Sea, Chukchi Sea and northern Bering Sea. NOSC Technical Document 449, Naval Ocean Systems Center, San Diego, California. 302p.
Marex. 1977. Environmental Observations - Beaufort Sea 1976. Appendix 5. Wildlife Observations. Unpublished report prepared by Marex for Canadian Marine Drilling Ltd., Calgary.
McLaren, P.L. and R.A. Davis. 1985. Distribution of bowhead whales and other marine mammals in

the southeast Beaufort Sea, August-September 1983. Prep. by LGL Limited, Toronto, Ontario. Prep. for Environmental Studies Revolving Funds. COGLA-ESRF-001. 62 p. Norton, P. and L.A. Harwood. 1986. Distribution, abundance and behaviour of white whales in the Mackenzie Estuary. Environmental Studies Revolving Funds, Report No. 036. Ottawa. 73p.
Renaud, W.E. and R.A. Davis. 1981. Aerial surveys of bowhead whales and other the Tuktoyaktuk August- September Limited, Toronto, Dome Petroleum Alberta. 55 p.
Richardson, W.J.
marine mammals off Peninsula, N.W.T., 1980. Prep. by LGL Ontario. Prep. for Limited, Calgary,
Behavior, disturbance responses and distribution of bowhead whales Balaena mysticetus in the eastern Beaufort Sea, 1980-84. Unpubl. Rep. from LGL Ecol. Res. Assoc., Inc., Bryan, Texas for U. S. Minerals Management Service, Reston, VA. 306p.
Richardson, W.J., R.A. Davis, C.R. Evans and P. Norton. 1985. Distribution . of bowheads and industrial activity, 1980-84. p. 255-306 In: W. J. Richardson (ed. 1, Behavior, disturbance responses and distribution of bowhead whales Balaena mysticetus in the eastern Beaufort Sea, 1980-84. Unpublished Report from LGL Ecological Research Associates, Inc. for U.S. Minerals Management Service, Reston, VA. 306p.
Richardson, W.J., R.A. Davis, C.R. Evans, D.K. Ljungblad and P. Norton. 1987. Surimer distribution of bowhead whales, Balaena mysticetus, relative to oil industry activities in the Canadian Beaufort Sea, 1980 - 84. Arctic 40(2): 93 - 104.
Townsend, C.H. 1935. The distribution of certain whales as shown by logbook records of American whaleships. Zoologica (N.Y.119, 50p.
Discussion
T. ALBERT: Is it appropriate to infer bowhead distribution from catch location data if there is no indication of the level of effort? For example, were the various areas "searched" in a similar manner? Using catch per unit of effort (CPUE) seems OK but just using catch location data does not seem appropriate.
J. WARD: Yes, I believe it is appro- priate to infer bowhead distribution from catch location data with the appropriate qualifiers. As we indicated in the paper, we have made the assumption that commerical whalers would have concen- trated their efforts in areas where they were most likely to encounter bowheads. During the commercial whaling period, I would be surprised if whalers did not look for whales in the area now known as the industrial zone as well as the other areas where they did take many whales. The fact that relatively few whales were taken from the area off the Mackenzie Delta suggests to me that even then few whales used the "industrial zone" area.
D. DICKENS: I am interested to know whether you have attempted to correlate your observations with ice severity both in terms of the extent of open water in the so-called "Industrial Zone" as we11 as the availability of relatively clear passage via leads and shore openings along the Alaskan coast.
J. WARD: The short answer is "no." Such an analysis would not be useful because of the limited nature of the incidental sightings. Other studies provide some information on the subject of ice condi- tions and bowhead whale distribution. These include the whale surveys carried out for Minera1.s Management Service in the Alaska Beaufort Sea, the whale survey carried out in the Canadian Beaufort Sea for government and industry, and a 1985 study of the effects of oceanographic features on bowheads carried out for the Canadian Environmental Studies Revolving Fund.
T. NEWBURY: You have described inciden- tal sightings from vessels. The data is important because it shows that some whales come close to vessels. However, your extrapolation with the incidental sightings to statements about broad-scale bowhead distribution is not correct. The main reason is that you have made no comparable effort to collect incidental sightings away from vessels. You do compare the number of incidental sight- ings with the number of sightings during broad-scale aerial surveys, but the correlation is very weak. Further, there are no estimates of effort for the aerial surveys, so the correlation between incidental sightings and aerial sightings may be simply due to changing levels of effort. To summarize, the incidental sightings show that whales come close to vessels, but the incidental sightings are not useful for analyses of changes in broad-scale distribution.
J. WARD: I belive the incidental sight- ings do provide useful information on changes in distribution of bowheads within the industrial zone, as I have described in this paper. Your use of the term "broad-scale bowhead distribution" I assume means bowhead distribution within the entire southeast Beaufort Sea. We have not used the ship-based incidental sightings to extrapolate beyond the industrial zone as suggested by your question. With respect to your comment on level of effort, aerial survey effort for the surveys used in the comparisons has been relatively similar from year to year with the exception of 1980 when the area surveyed was quite limited. Inciden- tal observation effort will have varied with the level of exploration activity and the location of wellsites. Neverthe- less, there is an apparent correlation between the two types of observations in year-to-year relative numbers of bow- heads. The results of the incidental sightings parallel those of the aerial surveys. Perhaps more importantly, the incidental sightings provide additional information on the distribution of bowheads in the industrial zone in the years prior to 1980 when broader scale offshore aerial surveys were first carried out.
In summary, I agree that the incidental sightings show that some whales come close to vessels, but I disagree with your comment that they are not useful for analyses of changes in distribution. When combined with the results of other studies, the incidental sightings do assist in providing qualitative insights into bowhead distribution.

MASKED DETECTION THRESHOLDS FOR THE BELUGA AND BOTTLENOSE DOLPHIN
Charles W. Turl Ralph H. Penner
W. W. L. Au Naval Ocean System Center, Kailua, Hawaii, USA
A b s t r a c t
A b e l u g a and an A t l a n t i c b o t t l e n o s e d o l p h i n were t r a i n e d t o d e t e c t a sphere t a r g e t w i t h v a r y i n g amounts o f mask ing n o i s e a t t h r e e d i s t a n c e s . T a r g e t d e t e c t i o n p e r f o r m a n c e a s a f u n c t i o n o f mask ing n o i s e l e v e l was d e t e r m i n e d a t each t a r g e t range f o r bo th spec ies . The Echo- to- Noise r a t i o (Ee/No)max f o r t h e b e l u g a was a p p r o x i m a t e l y 10 dB b e t t e r t h a n t h e d o l p h i n f o r a l l r a n g e s . The d i f f e r e n c e i n p e r f o r m a n c e be tween t h e two s p e c i e s may be due t o c r i t i c a l bandwidth, s i g n a l p rocess ing c a p a b i l i t y , o r a d i f f e r e n t e c h o l o c a t i o n s t r a t e g y . V a r i a t i o n s i n t h e a n i m a l d e t e c t i o n performance a c r o s s t h e t h r e e ranges were c o n s i s t e n t w i t h t a r g e t s t r e n g t h and t ransmiss ion l o s s d i f f e r e n c e s .
I n t r o d u c t i o n
T h e r e h a s been l i t t l e e f f o r t t o compare t h e e c h o l o c a t i o n c a p a b i l i t i e s of d i f f e r e n t c e t a c e a n s p e c i e s i n t h e same t a s k ( N a c h t i g a l l , 1980). D i f f e r e n c e s i n procedures and exper imenta l d e s i g n have m a d e c r o s s - s p e c i e s c o m p a r i s o n s
This is a reviewed and edited version of apaperpresented at the Ninth International Conference on Port and Ocean Engineering Under Arctic Conditions, Fairbanks, Alaska, USA, August 17-22, 1987.
d i f f i c u l t . Au e t a l . (1986) r e p o r t e d t h a t t h e r e a r e some d i f f e r e n c e s i n t h e e c h o l o c a t i o n s y s t e m s of t h e b e l u g a and T u r s i o p s . T h e y r e p o r t e d t h a t t h e t r a n s m i t t e d beam o f t h e b e l u g a i s n a r r o w e r t h a n t h e d o l p h i n , b u t t h a t t h e i r e c h o l o c a t i o n s i g n a l s had s i m i l a r wave-shapes and frequency s p e c t r a (Au e t a l . , 1985). The b e l u g a e m i t t e d h i g h e r peak f r e q u e n c i e s and h i g h e r i n t e n s i t y s i g n a l s i n Kaneohe Bay than i n San Diego Bay. Au e t a l . (1974) s u g g e s t e d t h a t b o t t l e n o s e d o l p h i n s c h a n g e d t h e i r s i g n a l s i n o r d e r t o compensa te f o r t h e h i g h e r a m b i e n t n o i s e i n Kaneohe Bay. P e n n e r e t a l . (1986) s u g g e s t e d t h a t t h e be luga used a narrower beam t o minimize t h e e f f e c t s o f a n o i s e m a s k e r by r e c e i v i n g t a r g e t e c h o e s v i a a s u r f a c e r e f l e c t e d pa th w h i l e echoloca t ing . The o b j e c t i v e of t h i s s tudy was t o d i r e c t l y c o m p a r e a b e l u g a a n d a b o t t l e n o s e d o l p h i n u s i n g t h e same e x p e r i m e n t a l a p p a r a t u s , p r o c e d u r e , t a r g e t s a n d masking noise.
Methods
The e x p e r i m e n t was c o n d u c t e d i n Kaneohe Bay, Hawaii us ing an a d u l t male b e l u g a ( D l 5 7 5 ) a n d a n a d u l t m a l e b o t t l e n o s e d o l p h i n ( T t 8). The e x p e r i - mental c o n f i g u r a t i o n and procedure used were s i m i l a r t o t h o s e of Au and P e n n e r (1981). The be luga , s t a t i o n e d i n a 40 cm

TARGET NOISE
CLICK HYDROPHONE
I . - ' t
F i g u r e 1. E x p e r i m e n t a l c o n f i g u r a t i o n w i t h t h e b e l u g a i n t h e hoop s t a t i o n . (The r u b b e r mat i s n o t shown i n t h e f i g u r e ) . d i a h o o p , i s d e p i c t e d i n F i g u r e 1. T a r g e t s were t h i n - w a l l e d s t a i n l e s s s t e e l , w a t e r - f i l l e d s p h e r e s w i t h d iameters of 7.62 cm ( t a r g e t s t r e n g t h -28.3 dB) and 22.86 cm ( t a r g e t s t r e n g t h -17.4 dB). T a r g e t r a n g e s of 16.5 and 40 m were used w i t h t h e 7.62 cm s p h e r e and 80 m w i t h t h e 22.86 cm. The c e n t e r o f t h e hoop s t a t i o n and t h e t a r g e t d e p t h were b o t h a t 1 m.
Masking n o i s e was p r o j e c t e d from an Edo-Western 6166 s p h e r i c a l t r a n s d u c e r i n i t i a l l y l o c a t e d , i n l i n e w i t h t h e t a r g e t , 4 m f rom t h e hoop f o r t h e 16.5 m t a r g e t range . F o r t h e 40 m and 80 m t a r g e t ranges, t h e n o i s e hydrophone was l o c a t e d 5 m from t h e hoop. The spectrum of t h e mask ing n o i s e measured a t t h e hoop was r e l a t i v e l y f l a t from 40 t o 160 kHz ( F i g u r e 2). A r u b b e r mat e x t e n d e d a p p r o x i m a t e l y 0.3 m i n t o t h e w a t e r and a t t a c h e d t o t h e end of t h e pen d i r e c t l y between t h e hoop and t h e n o i s e p r o j e c t o r t o b l o c k s u r f a c e - r e f l e c t e d p a t h s ( s e e f i g u r e 3 of P e n n e r e t a l . , 1986).
E c h o l o c a t i o n s i g n a l s o f b o t h an imals were measured wi th and Apple I1 microprocessor system descr ibed by Au e t a l . (1982). A c l i c k hydrophone (Edo- Western 6166), l o c a t e d 2 m from t h e hoop s t a t i o n , was used t o d e t e c t e a c h c l i c k . The r e s u l t s of t h e e c h o l o c a t i o n s i g n a l measurements ob ta ined i n t h i s experiment a r e p resen ted i n T u r l e t a l . (1987).
A t r i a l s t a r t e d when t h e a n i m a l w a s s t a t i o n e d i n f r o n t o f t h e e x p e r i m e n t e r , w i t h t h e a c o u s t i c s c r e e n i n t h e r a i s e d p o s i t i o n , t h e t a r g e t o u t o f t h e w a t e r , and t h e mask ing n o i s e t u r n e d o f f . An u n d e r w a t e r s i g n a l cued t h e a n i m a l t o t u r n and s w i m a c r o s s t h e p e n a n d i n s e r t i t s h e a d i n t o t h e s t a t i o n i n g hoop. The t a r g e t was e i t h e r g e n t l y l o w e r e d i n t o t h e w a t e r o r l e f t o u t , t h e masking n o i s e was turned on and t h e a c o u s t i c s c r e e n was l o w e r e d . The animal cou ld e c h o l o c a t e f o r a s long a s i t d e s i r e d . When t h e a n i m a l f i n i s h e d e c h o l o c a t i n g , i t backed o u t of t h e hoop and r e s p o n d e d by s t r i k i n g one of two response p a d d l e s t o i n d i c a t e whether o r no t i t d e t e c t e d t h e t a r g e t .
S i x t e n- t r i a l b l o c k s w i t h an e q u a l number of randomized t a r g e t p resen t and absen t t r i a l s comprised a session. F i v e

0 100 200
FREQUENCY (kHz)
F i g u r e 2. F r e q u e n c y s p e c t r u m of t h e masking no ise used i n t h i s experiment.
n o i s e l e v e l s (No) i n 3 dB i n c r e m e n t s were used dur ing t e s t i n g . The r e c e i v e d masking n o i s e l e v e l s a t t h e hoop s t a t i o n a r e shown i n F i g u r e 2. The f i r s t and l a s t 1 0 - t r i a l b l o c k s w e r e a l w a y s c o n d u c t e d a t t h e minimum n o i s e l e v e l . The n o i s e l e v e l s o f t h e o t h e r b l o c k s were randomized f o r each session. Each a n i m a l p a r t i c i p a t e d i n o n e s e s s i o n p e r d a y ; t h e a n i m a l which p a r t i c i p a t e d i n t h e f i r s t s e s s i o n would be used i n t h e second s e s s i o n of t h e f o l l o w i n g day and v i c e versa .
R e s u l t s
The t a r g e t d e t e c t i o n performance of e a c h a n i m a l , a s a f u n c t i o n o f t h e mask ing n o i s e l e v e l f o r each d i s t a n c e , i s shown i n F i g u r e 3. The b e l u g a ' s p e r f o r m a n c e e x c e e d e d t h e b o t t l e n o s e d o l p h i n by 8 t o 13 dB a t a l l t h r e e t e s t d i s t a n c e s . The b e l u g a ' s 75% c o r r e c t r e s p o n s e t h r e s h o l d s o c c u r r e d a t n i s e 5 l e v e l s o f 8 5 , 72 and 63 dB r e 1 Pa /Hz f o r t a r g e t r a n g e s of 16.5, 40 and 80 m , r e s p e c t i v e l y . The d o l p h i n ' s correspond- i n g 75% c o r r e c t r e s p o n s e t h r e s h o l d o c c u r r e d a t 72 , 59 and 55 dB, r e s p e c- t i v e l y . F o r b o t h a n i m a l s , r e s p o n s e a c c u r a c y d e c r e a s e d a s t h e n o i s e l e v e l increased .
Large f l u c t u a t i o n s i n t h e animal 's emi t ted source l e v e l s u s u a l l y occurred
 BELUGA BOTTLENOSE DOLPHIN
- 40 50 60 70
MASKING NOISE SPECTRUM LEVEL (dB re 1 pPa2/Hz)
F i g u r e 3. B e l u g a a n d b o t t l e n o s e do lph in ' s performance d a t a a s a f u n c t i o n o f t h e mask ing n o i s e l e v e l a t 16.5, 40 and 80 meters. The t a r g e t range (R) and spher s i z e a t each d i s t a n c e is shown i n each f i g u r e .

@ 16.5 M
40.0 M
@ 80.0 M
 AU & PENNER
BELUGA BOTTLENOSED DOLPHIN
F i g u r e 4 . B e l u g a and b o t t l e n o s e d o l p h i n ' s per formance d a t a a t t h r e e d i s t a n c e s p l o t t e d a s a f u n c t i o n of t h e echo signal- to- noise r a t i o .
i n most c l i c k t r a i n s w i t h t y p i c a l v a r i a t i o n s of 15 dB between t h e minimum and maximum s i g n a l l e v e l s . Since it i s not known what s i g n a l l e v e l s t h e animal used t o d e t e c t t a r g e t s , we used t h e maximum l e v e l of e a c h s i g n a l i n t h e t r i a l i n o r d e r t o c a l c u l a t e t h e echo ene rgy f l u x d e n s i t y (Ee) r e t u r n i n g t o t h e an ima l (e.g. Au and Penner , 1981). Such a technique w i l l provide the upper l i m i t of t h e E / N , o r t h e maximum E ~ / No a v a i l a b l e t o t he animal.
The performance d a t a from Figure 3 i s r e p l o t t e d ( F i g u r e 4 ) a s t h e echo- s i g n a l - t o - n o i s e r a t i o ((Ee/No)max). A l s o shown a r e t h e two T u r s i o p s measurements of Au and Penner (1981 ). A t t h e 75% c o r r e c t r e s p o n s e t h r e s h o l d
the (Ee/NOlmax was approxi-
m a t e l y 1.0 dB f o r t h e b e l u g a a t t h e t h r e e t a r g e t d i s t a n c e s . F o r t h e b o t t l e n o s e d o l p h i n , (Ee/No)max was approximate 10 dB.
Discussion and conclusions
Our r e s u l t s c l e a r l y i n d i c a t e t h a t t h e b e l u g a ' s d e t e c t i o n per formance i n masking n o i s e was s u p e r i o r t o t h a t of t h e d o l p h i n . D i f f e r e n c e s i n t h e a n i m a l s ' p r o j e c t e d s i g n a l a m p l i t u d e s c a n n o t e x p l a i n t h e p e r f o r m a n c e d i f f e r ences , s i nce t h e r e l a t i v e emission s i g n a l ampli tudes of both animals were s i m i l a r . I f t h e b e l u g a had a nar rower c r i t i c a l b a n d w i d t h a t f r e q u e n c i e s between 100 and 120 kHz, t h e amount of n o i s e i t r e c e i v e d would be l e s s t h a n t h a t of t h e d o l p h i n and t h i s c o u l d p o s s i b l y e x p l a i n t h e d i f f e r e n c e i n comparative de t ec t ion performance.
Another p o s s i b i l i t y which might a f f e c t t h e d i f f e r e n c e i n d e t e c t i o n per formance c o u l d be t h e e c h o l o c a t i o n

e m i s s i o n r a t e s t r a t e g i e s u s e d by e a c h a n i m a l ( T u r l e t a l . , 1987). The b e l u g a e m i t t e d more c l i c k s p e r t r i a l t h a n t h e d o l p h i n and e m i t t e d c l i c k s a t a h i g h e r r a t e . This i n d i c a t e s t h a t t h e number of echoes a v a i l a b l e f o r p rocess ing t o t h e b e l u g a e x c e e d e d t h a t a v a i l a b l e t o t h e d o l p h i n by a f a c t o r f r o m 1.25 t o 2 and s u g g e s t s t h a t t h e b e l u g a may b e p r o c e s s i n g more i n f o r m a t i o n p e r u n i t t i m e t h a n t h e d o l p h i n . S i n c e t h e a n i m a l s w e r e n o t c o n s t r a i n e d t o e c h o l o c a t e i n any p a r t i c u l a r manner, one must wonder why t h e d o l p h i n d i d no t a l s o i n c r e a s e i t s r e p e t i t i o n r a t e and u s e more c l i c k s i f t h a t would be t o i t s a d v a n t a g e . G i v e n d i f f e r e n c e s i n h a b i t a t s and p r e y i t i s l i k e l y t h a t d i f f e r e n t s p e c i e s of too thed whales have e v o l v e d d i f f e r e n t c a p a b i l i t i e s and u s e d i f f e r e n t s t r a t e g i e s d e p e n d i n g o n envi ronmenta l d i f f e r e n c e s .
I n t h i s s tudy m a s k e d d e t e c t i o n t h r e s h o l d s of a b e l u g a were 8 t o 13 dB b e t t e r t h a n t h a t o f a b o t t l e n o s e dolphin. P o s s i b l e e x p l a n a t i o n s f o r t h e d i f f e r e n c e i n t h e d e t e c t i o n s e n s i t i v i t y b e t w e e n t h e b e l u g a a n d b o t t l e n o s e d o l p h i n may i n c l u d e d i f f e r e n c e s o f c r i t i c a l b a n d w i d t h , e c h o l o c a t i o n e m i s s i o n r a t e s t r a t e g i e s and s i g n a l p r o c e s s i n g c a p a b i l i t i e s . We b e l i e v e t h a t i t i s u n l i k e l y t h a t a n y o n e o f t h e s e reasons c o u l d s i n g l y a c c o u n t f o r t h e d i f f e r e n c e s i n p e r f o r m a n c e ; more l i k e l y , a c o m b i n a t i o n o f f a c t o r s a r e i n v o l v e d . The b e l u g a l i v e s i n a n a r c t i c- s u b a r c t i c e n v i r o n m e n t w h i l e t h e b o t t l e n o s e d o l p h i n i n h a b i t s m o r e t e m p e r a t e - t r o p i c a l w a t e r s , b u t b o t h s p e c i e s tend t o i n h a b i t s h a l l o w c o a s t a l water and both feed on a v a r i e t y of prey organisms. Maybe the beluga 's s u p e r i o r performance i n t h e descr ibed experiment r e p r e s e n t s a n a d a p t a t i o n t o a n a r c t i c ice- covered environment w i t h o c c a s i o n a l h i g h n o i s e l e v e l s . F u r t h e r i n v e s t i - g a t i o n s a r e r e q u i r e d i n o r d e r t o i s o l a t e which mechanisms a r e r e l e v a n t t o t h e b e l u g a ' s e n h a n c e d p e r f o r m a n c e a s compared t o t h e d o l p h i n i n a h igh n o i s e e c h o l o c a t i o n d e t e c t i o n task.
References
measurements of e c h o l o c a t i o n s i g n a l s of t h e A t l a n t i c b o t t l e n o s e d o l p h i n , T u r s i o p s t r u n c a t u s Montagu, i n open w a t e r . J. Acous t . g. &. 56:1180- 1290.
Au, W.W.L., F l o y d , R.W. and Haun, J.E. 1978. Propaga t ion o f A t l a n t i c b o t t l e - n o s e d o l p h i n e c h o l o c a t i o n s i g n a l s . J. Acous t . SOC. Amer. 64:411-422. --- Au, W.W.L. 1980. E c h o l o c a t i o n s i g n a l s o f t h e A t l a n t i c b o t t l e n o s e d o l p h i n ( T u r s i o p s t r u n c a t u s ) i n open w a t e r s . In : "Animal Sonar Systems" (R.G. Busnel - and J.F. F i s h , eds.). Plenum P r e s s , New York, 251-282.
Au, W.W.L. a n d P e n n e r , R.H. 1981 . T a r g e t d e t e c t i o n i n n o i s e bv A t l a n t i c b o t t l e n o s e d o l p h i n s . L. Acoust . g. Amer. 70:687-693.
Au, W.W.L., P e n n e r , R.H. and Kadane, J. 1982. Acous t ic behavior of e c h o l o c a t i n g A t l a n t i c b o t t l e n o s e dolphin. L. Acoust. SOC. Amer. 71:1269-1275. -- Au, W.W.L., P e n n e r , R.H. and T u r l , C.W. 1987. P r o p a g a t i o n o f b e l u g a w h a l e e c h o l o c a t i o n s i g n a l s . L. Acous t . x. &. ( i n p r e s s ) .
Au, W.W.L., C a r d e r , D.A., P e n n e r , R.H. and S c r o n c e , B.L. 1985. D e m o n s t r a t i o n o f a d a p t a t i o n i n b e l u g a w h a l e e c h o l o c a t i o n s i g n a l s . J. Acous t . z. Amer. 77:726-730. -
N a c h t i g a l l , P.E. 1980. O d o n t o c e t e e c h o l o c a t i o n performance on o b j e c t s i z e , s h a p e and m a t e r i a l . I n "Animal Sonar Sys tems" (R.G. ~ u s n e l a n d J.F. F i s h , eds.). Plenum press , New York, 71-95.
P e n n e r , R.H., T u r l , C.W. and Au, W.W.L. 1985. T a r g e t d e t e c t i o n by t h e b e l u g a u s i n g a s u r f a c e - r e f l e c t e d p a t h . J. Acoust . SOC. Amer. 80(6): 1842-1843. --- T u r l , C.W., P e n n e r , R.H. and Au, Whi t low W. L. 1987. C o m p a r i s o n o f t a r g e t d e t e c t i o n c a p a b i l i t i e s of t h e belutra and " b o t t l e n o s e d o l p h i n . J. Acous t . g. e. ( i n p r e s s ) .
Au, W.W.L., F l o y d , R.W., P e n n e r , R.H., and Murch ison , A.E. 1974. P r o p a g a t i o n

Discussion
T. ALBERT: Have any other dolphins or toothed whales been looked at which receive and send at the same time?
W. TURL: The other dolphins which have been tested behave similarly to the bottlenose dolphin.

EVIDENCE OF GLACIAL SEISMIC EVENTS IN THE ACOUSTIC ENVIRONMENT OF HUMPBACK WHALES
Paul R. Miles Charles I. Maime
BBN Laboratories Inc., Cambridge, Massachusetts, USA
A b s t r a c t
High l e v e l impulses of underwater sound o c c u r r i n g a s f r e q u e n t l y a s 3-4 t i m e s p e r minute were d e t e c t e d i n G l a c i e r Bay, Alaska d u r i n g a measurement p r o j e c t t o d e f i n e t h e underwater a c o u s t i c environment i n t h a t r eg ion . A n a l y s i s of t h e s e impulses demons t ra tes s igna l- to- noise r a t i o s a s h i g h a s 40 dB, s i g n i f i c a n t broadband energy from below 20 Hz t o above 2 kHz and t h e p resence of pure t o n e components. The c h a r a c t e r of t h e impulses i s r e l a t i v e l y i n v a r i a n t w i t h i n t h e Bay a rea .
We h y p o t h e s i z e t h a t t h e s e e v e n t s a r e a s s o c i a t e d w i t h t h e many a c t i v e g l a c i e r s i n t h e r e g i o n and a r e t h e r e s u l t of s t i c k - s l i p a c t i o n g e n e r a t i n g s e i s m i c energy a t t h e i ce- rock i n t e r - face . That energy i s t h e n p ropaga ted through t h e bedrock and r a d i a t e d a s sound i n t o t h e wa te r through t h e w a l l s and /o r bottom of t h e f j o r d s . Acous t i c i n s t r u m e n t a t i o n i n c l u d e d a sonobuoy and a hydrophone s e p a r a t e d by abou t 3.2 km. A n a l y s i s of s i m u l t a n e o u s l y recorded d a t a p r o v i d e s d i r e c t i o n a l i n f o r m a t i o n r e l a t - i n g t o t h e s o u r c e of t h e e v e n t s . Data
This is a reviewed and edited version of a paper submit- ted to the Ninth International Conference on Port and Ocean Engineering Under Arctic Conditions, Fairbanks, Alaska, USA, August 17-22, 1987.
a r e p r e s e n t e d f o r t h i s phenomenon, r e l a t i n g i t t o f i n d i n g s of o t h e r s who used geophones on and n e a r g l a c i e r s i n o t h e r r eg ions .
Background and Hypothesis
T h i s paper r e s u l t e d from a l a r g e r s t u d y , a d m i n i s t e r e d by t h e Marine Mammal Labora to ry of t h e Na t iona l Marine F i s h e r i e s S e r v i c e , t o measure and d e f i n e t h e underwater a c o u s t i c environment of G l a c i e r Bay Na t iona l Park i n S o u t h e a s t Alaska d u r i n g t h e summer of 1981. Major fund ing f o r t h e o v e r a l l s t u d y (Malme, e t a l . 1982) o r i g i n a t e d w i t h t h e N a t i o n a l Park S e r v i c e which had become concerned r e g a r d i n g f l u c t u a t i o n s i n t h e p o p u l a t i o n of f e e d i n g humpback whales i n t h e a r e a . P o t e n t i a l d e t r i m e n t a l i n f l u e n c e on hump- back whales of man-made n o i s e i n G l a c i e r Bay, e s p e c i a l l y n o i s e due t o i n c r e a s e d t r a f f i c from c r u i s e s h i p s , s m a l l b o a t s and a i r c r a f t , was one d r i v i n g f o r c e i n e s t a b l i s h m e n t of t h e p r o j e c t .
The purposes of t h e a c o u s t i c s t u d y , t h e r e f o r e , were t o :
1 ) de te rmine t h e n a t u r a l and man- made c o n t r i b u t i o n s t o t h e ambient n o i s e , w i t h emphasis on a r e a s f r e q u e n t e d by humpback whales ,
2 ) examine sound p r o p a g a t i o n and r e v e r b e r a t i o n p r o p e r t i e s of r e p r e s e n t a -

t i v e a r e a s , such a s Freder ick Sound/ Stephens Passage f o r comparison t o c o n d i t i o n s i n G l a c i e r Bay,
3) o b t a i n r a d i a t e d n o i s e s p e c t r a from s h i p s , smal l b o a t s , and a i r c r a f t o p e r a t i n g i n t h e s e a r e a s ,
4 ) examine any unusual a c o u s t i c d i f f e r e n c e s which may e x i s t between t h e two f i e l d l o c a t i o n s .
With r e s p e c t t o t h e l a t t e r element of t h e s tudy , two n a t u r a l phenomena were observed i n G l a c i e r Bay which were not d e t e c t e d i n t h e Freder ick Sound/Stephens Passage a r e a :
1 ) f requency high- level a c o u s t i c impulsive even ts were recorded which had s t r o n g low-frequency components and which were varying i n event r a t e from day-to-day, p o s s i b l y on a d i u r n a l b a s i s ,
2) very high l e v e l e f f e r v e s c e n t sound l e v e l s were measured i n t h e v i c i n i t y of t i d e w a t e r g l a c i e r s and f l o a t i n g g l a c i a l i c e .
The f i r s t phenomenon is t h e s u b j e c t of t h i s paper , a l though a b r i e f commentary on t h e e f fe rvescence phenomenon w i l l a l s o be included.
We hypothesize t h a t t h e h igh- leve l impulsive underwater sound e v e n t s , which occur a s f r e q u e n t l y a s 3-4 t imes per minute, a r e a s s o c i a t e d with t h e many g l a c i e r s i n t h e region and a r e t h e r e s u l t of s t i c k- s l i p a c t i o n g e n e r a t i n g s e i s m i c energy a t t h e i c e l r o c k i n t e r f a c e .
P h y s i c a l Environment
The c h a r a c t e r i z a t i o n of t h e a c o u s t i c environment of G l a c i e r Bay r e q u i r e d s p e c i f i c measurements t o be made throughout t h e region a s wel l a s r e f e r e n c e t o h i s t o r i c a l da ta . F igure 1 summarizes t h e 38 s t a t i o n s which were occupied i n J u l y and e a r l y August 1981 and provides in format ion regard ing t h e G l a c i e r Bay r e g i o n a l c h a r a c t e r i s t i c s . The a c o u s t i c d a t a repor ted h e r e were acqui red a t S t a t i o n 27-27A and i n Queen I n l e t ( S t a t i o n 36).
The dynamic glaciological a s p e c t s of G l a c i e r Bay a r e r e a d i l y e v i d e n t when observ ing t h e many a c t i v e g l a c i e r s and i c e f i e l d s of t h e reg ion and t h e f j o r d s making up t h e var ious i n l e t s . Depths i n t h e s teep-wal led f j o r d s vary from about 50 meters t o 430 meters . The e n t i r e region of t h e p r e s e n t Park was covered with i c e a s r e c e n t l y a s 1794 when Vancouver s a i l e d by t h e mouth of t h e bay. The r e t r e a t of t h e g l a c i e r s s i n c e t h a t time has been r a p i d wi th t h e r a t e vary ing somewhat over t h e l a s t 200 y e a r s . R e t r e a t r a t e s of 400 meters / y e a r , and g r e a t e r have been recorded (Muir G l a c i e r has r e c e n t l y shown r e t r e a t r a t e s a s high a s about 2 k m l ~ e a r ! ) . Some advancing has a l s o been observed a s wel l a s some r e l a t i v e i n a c t i v i t y a s a g l a c i e r s t a l l s on a s i l l . The r e l e a s e of t h e weight of t h e i c e from t h e land mass has r e s u l t e d i n i s o s t a t i c rebound r a t e s a s high a s about 4 cm per year i n t h e B a r t l e t t Cove a r e a and an o v e r a l l average of about 2 cm/year f o r t h e Park a r e a (Hale and Wright, 1979).
The r e g i o n a l geology of t h e a r e a i s complex and has been summarized by MacKevett e t a l . (1971). Bedrock s t r a t i g r a p h i c age v a r i e s from Ear ly S i l u r i a n through Late T e r t i a r y with g r a n i t i c i n t r u s i v e s and metamorphic formations. F o l i a t e d g r a n i t i c bedrock such a s d i o r i t e and g r a n o d i o r i t e and d e t r i t a l c l a s t i c rocks such a s gray- whacke and s h a l e a r e major rock types with common zones of l imestone and v o l c a n i c rocks. F a u l t i n g t r e n d s t o t h e northwest with t h e Fa i rwea ther F a u l t being t h e major f a u l t zone l o c a t e d a long t h e coas t west of t h e Fairweather moun- t a i n s . Other f a u l t zones a r e l o c a t e d along t h e West A r m of G l a c i e r Bay, a long t h e e a s t shore of t h e Park and with some c r o s s- f a u l t i n g i n t h e T l i n g i t Point- T i d a l I n l e t a r e a .
The U.S. Geological Survey com- p l e t e d an e x t e n s i v e s e i s m i c survey of t h e bottom and subbottom topography of Glac ie r Bay (B. Molnia, persona l com- municat ion) . The USGS records r e v e a l t h e presence of a s e r i e s of s i l l s and b a s i n s throughout t h e arms and i n l e t s . The te rmina l moraine of t h e o r i g i n a l g l a c i e r a t t h e en t rance t o t h e Park provides a hard rocky botto'm t h a t i s c o n t i n u a l l y swept c l e a n of s i l t by t i d a l

F i g u r e
c u r r e n t s ( a s h igh a s 7 k n o t s i n t h e narrows) . The bottom t h e r e and over o t h e r s i l l s is a c o u s t i c a l l y r e f l e c t i v e . The b a s i n s , on t h e o t h e r hand, have been f i l l e d w i t h f i n e s i l t y d e p o s i t s v a r y i n g i n t h i c k n e s s from 50 t o 150 m. F i g u r e 2 prov ides s k e t c h e s of t h e sediment l a y e r s a t s e v e r a l p o s i t i o n s w i t h i n t h e bay. I n t h e s e a r e a s , t h e bottom i s a c o u s t i c a l l y a b s o r p t i v e . The s i d e s of t h e arms and i n l e t s a r e s t e e p and rocky w i t h no a c o u s t i c a l l y impor tan t sediments .
Water t empera tu re and s a l i n i t y a s a f u n c t i o n of dep th and a r e a w i t h i n t h e bay a r e a were measured p r i m a r i l y because t h e s e d a t a a r e r e q u i r e d i n t h e d e r i v a- t i o n of sound speed p r o f i l e s t o p rov ide i n s i g h t i n t o sound p ropaga t ion char- a c t e r i s t i c s . I n c r e a s e d s u r f a c e tempera- t u r e s due t o h i g h i n s o l a t i o n r a t e s and reduced s a l i n i t y due t o m e l t i n g g l a c i a l i c e were observed. Temperature and s a l i n i t y p r o f i l e s up-bay s t a b i l i z e a t dep ths g r e a t e r t h a n about 30 mete r s . A t t h e s o u t h e r n a r e a of t h e bay where con- s i d e r a b l e mixing o c c u r s , t h e p r o f i l e s

(WEST1 (EAST! 0 1 2 3 n m t
i
ISWI INEI
ICr0.s - Chtnnell
UPPER WEST ARM NEAR QUEEN AND RENDU INLETS
Ref: B. Molnia. USGS. U n o u b l i s h e d
LOWER MUIR INLETQADAMS INLET
Reflector 1
Reflector 2
APPROX 3 MILESNORTH OF WILLOUGHBV ISLAND
ISWI INEI
Note: There is an approximate 30: 1 EAST OF WILLOUGHBV ISLAND
wrtical/horizontal display d i s t o r t i o n .
Figure 2. Rough sketches of sediment thicknesses in Glacier Bay.
are stable to the surface. Sound speed profiles resulting from Wilson's Equation,
(where T is water temperature (OC) and S is salinity in parts per thousand) are shown in Figure 3, demonstrating the stability of the physical characteris- tics of the water column below 30 meters, in particular. The measurement system used on this project did not permit measurements deeper than 50 meters although historical data demon- strate a repeatable profile with a slightly negative gradient of 0.06 m/sec per meter of depth down to 200 m depth. Sound generated from a source located at a depth greater than 30 meters will be propagated with a slightly downward refracting ray path angle.
directional general purpose hydrophone system located at the research vessel and an SSQ57A sonobuoy system with the radio receiver located on the research vessel.
The general purpose system was bat- tery operated permitting complete shut- down of the research vessel propul- sion system and accessories to minimize the possibility of self-contamination of acoustic data. The H56 hydrophone, owned and calibrated by the U.S. Navy, has a frequency range of from 10 Hz to 65 kHz and is flat from 10 Hz to 20 kHz. The data recorder used was a two channel NAGRA IV SJ stereo recorder with an additional channel for voice annotation. The frequency response was flat from 0.02 to 20 kHz. The system was used for acquisition of vessel radiated noise signatures and for obtaining short term background noise measurements.
Instrumentation The synoptic ambient noise measure- ment system used an SSQ57A sonobuoy.
Two acoustic measurement systems This permitted the acquisition of 8 were used as shown in Figure 4; an omni- hours of continuous ambient noise data
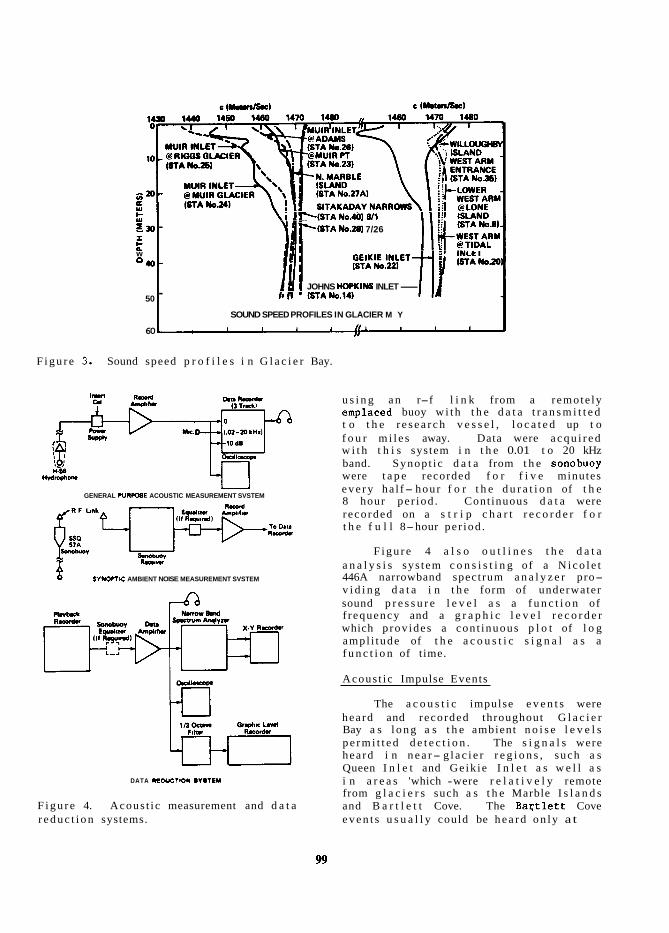
-(STA N0.461811 ?30 - -(SA No.28) 7/26 I fc w '40-
JOHNS HOPKINS INLET- 50 -
SOUND SPEED PROFILES IN GLACIER M Y
60 I I I 1 I / .
F i g u r e 3. Sound speed p r o f i l e s i n G l a c i e r Bay.
u GENERAL PURPOSE ACOUSTIC MEASUREMENT SVSTEM
-v RÇouw
SYMOTTIC AMBIENT NOISE MEASUREMENT SVSTEM
DATA KDUCTKMI BYBTEM
F i g u r e 4. Acous t i c measurement and d a t a r e d u c t i o n systems.
u s i n g a n r-f l i n k from a remote ly emplaced buoy w i t h t h e d a t a t r a n s m i t t e d t o t h e r e s e a r c h v e s s e l , l o c a t e d up t o f o u r m i l e s away. Data were a c q u i r e d w i t h t h i s system i n t h e 0.01 t o 20 kHz band. Synopt ic d a t a from t h e sonobuoy were t a p e recorded f o r f i v e minutes e v e r y ha l f- hour f o r t h e d u r a t i o n of t h e 8 hour pe r iod . Cont inuous d a t a were recorded on a s t r i p c h a r t r e c o r d e r f o r t h e f u l l 8-hour pe r iod .
F i g u r e 4 a l s o o u t l i n e s t h e d a t a a n a l y s i s sys tem c o n s i s t i n g of a N i c o l e t 446A narrowband spectrum a n a l y z e r pro- v i d i n g d a t a i n t h e form of underwater sound p r e s s u r e l e v e l a s a f u n c t i o n of f r equency and a g r a p h i c l e v e l r e c o r d e r which p rov ides a con t inuous p l o t of l o g ampl i tude of t h e a c o u s t i c s i g n a l a s a f u n c t i o n of t ime.
Acous t i c Impulse Events
The a c o u s t i c impulse e v e n t s were hea rd and recorded throughout G l a c i e r Bay a s l o n g a s t h e ambient n o i s e l e v e l s p e r m i t t e d d e t e c t i o n . The s i g n a l s were hea rd i n n e a r- g l a c i e r r e g i o n s , such a s Queen I n l e t and Ge ik ie I n l e t a s w e l l a s i n a r e a s 'which -were r e l a t i v e l y remote from g l a c i e r s such a s t h e Marble I s l a n d s and B a r t l e t t Cove. The B a r t l e t t Cove e v e n t s u s u a l l y could be h e a r d o n l y a t
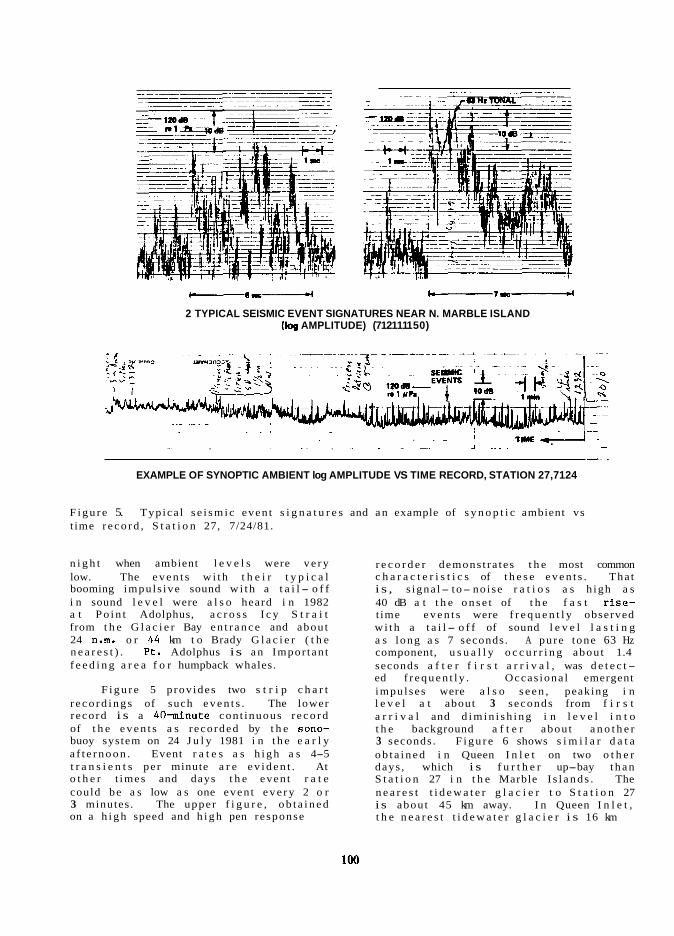
2 TYPICAL SEISMIC EVENT SIGNATURES NEAR N. MARBLE ISLAND (log AMPLITUDE) (712111 150)
I - . - ~ . ~-
-. - . - 4 .. ~ - - . ~. ~ . -. _1 ... - -~
-- .
EXAMPLE OF SYNOPTIC AMBIENT log AMPLITUDE VS TIME RECORD, STATION 27,7124
F i g u r e 5. Typ ica l s e i s m i c even t s i g n a t u r e s and a n example of s y n o p t i c ambient vs t ime r e c o r d , S t a t i o n 27, 7/24/81.
n i g h t when ambient l e v e l s were v e r y low. The e v e n t s w i t h t h e i r t y p i c a l booming impuls ive sound w i t h a t a i l - o f f i n sound l e v e l were a l s o heard i n 1982 a t P o i n t Adolphus, a c r o s s I c y S t r a i t from t h e G l a c i e r Bay e n t r a n c e and abou t 24 n.m. o r 44 km t o Brady G l a c i e r ( t h e n e a r e s t ) . Pt . Adolphus is a n Impor tan t f e e d i n g a r e a f o r humpback whales.
F i g u r e 5 p rov ides two s t r i p c h a r t r e c o r d i n g s of such e v e n t s . The lower record i s a 401n inu te con t inuous r e c o r d of t h e e v e n t s a s r ecorded by t h e sono- buoy system on 24 J u l y 1981 i n t h e e a r l y a f t e r n o o n . Event r a t e s a s h i g h a s 4-5 t r a n s i e n t s pe r minute a r e e v i d e n t . At o t h e r t imes and days t h e even t r a t e could be a s low a s one even t e v e r y 2 o r 3 minutes . The upper f i g u r e , o b t a i n e d on a h i g h speed and h i g h pen response
r e c o r d e r demons t ra tes t h e most common c h a r a c t e r i s t i c s of t h e s e e v e n t s . Tha t i s , s igna l- to- noise r a t i o s a s h igh a s 40 dB a t t h e o n s e t of t h e f a s t r i s e - t ime e v e n t s were f r e q u e n t l y observed w i t h a t a i l - o f f of sound l e v e l l a s t i n g a s long a s 7 seconds. A pure tone 63 Hz component, u s u a l l y o c c u r r i n g abou t 1.4 seconds a f t e r f i r s t a r r i v a l , was d e t e c t- ed f r e q u e n t l y . Occas iona l emergent impulses were a l s o s e e n , peaking i n l e v e l a t about 3 seconds from f i r s t a r r i v a l and d i m i n i s h i n g i n l e v e l i n t o t h e background a f t e r abou t a n o t h e r 3 seconds. F i g u r e 6 shows s i m i l a r d a t a o b t a i n e d i n Queen I n l e t on two o t h e r days , which i s f u r t h e r up-bay t h a n S t a t i o n 27 i n t h e Marble I s l a n d s . The n e a r e s t t i d e w a t e r g l a c i e r t o S t a t i o n 27 i s abou t 45 km away. I n Queen I n l e t , t h e n e a r e s t t i d e w a t e r g l a c i e r i s 16 km

QUEEN INLET, 7/16/1935, FREQUENT HIGH LEVEL EVENTS
QUEEN INLET, 7/29/1130, SPORADIC EVENTS WITH TONALS
Figure 6. Sporadic impulsive events with tonals recorded in Queen Inlet, 7/29/81 at 1130.
away and the closest valley glacier is 9 km away. Notice in particular that the peak levels of the impulses received at the two sites are very similar and in the order of 115 dB//uPa and that the general character of the signatures is the same. Also note the pure tone com- ponent in the Queen Inlet data and the similarity of the overall signature with that obtained at Station 27, 18 miles or 33 km down-bay. One difference between the signatures from the two sites is the duration of the signatures. The more distant site (Figure 5) showed 6-7 sec. event duration and the Queen Inlet events in Figure 6 are 4-4.5 sec. long. These differences possibly may be due to
reverberation but also probably relate to differences in travel time of differ- ent seismic wave types and dispersion effects. One common qualitative element in all of these events is that immedi- ately following reception of peak sound pressure level, there is a "roll- ing thunder" type sound which varies in intensity but reduces in level until it is lost in the ambient background.
Figure 7 presents three ambient noise spectra measured in different areas of the bay. One signature of an impulsive event is shown (Queen Inlet). The upper curve (STA 24) demonstrates the loudness of the effervescent noise

STA. 24 MUIR GLACIER
@-----",e~
-- STA %QUEEN INLET 1
1 0 0 2 0 0 3 0 0 4 < 1 0 5 0 0 à ‡ O O T O O a h à ˆ 0 0 FREQUENCY IHzl
Figure 7. Upper Glacier Bay ambient noise (low frequency).
r e f e r r ed t o e a r l i e r . Levels a r e a s much a s 10 dB n o i s i e r than the broadband sound typ ica l ly experienced i n t he open ocean f o r a sea s t a t e 6 condit ion. SS6 corresponds t o sus ta ined 28-33 knot winds and 17 t o 26 f t wave heights . Clear ly , the broadband i c e sound has t he c a p a b i l i t y of masking s i g n i f i c a n t o the r sources of acous t ic energy, except a t f requencies below about 150 Hz. We es tabl i shed through observation and o the r s have e s t ab l i shed , such a s Dewart (1968), t h a t the sound is due t o multi- tudes of small bubbles frozen i n t o t he g l a c i a l i c e t h a t have been compressed over time and then re leased with a popping or f ry ing sound a s t he water melts away the sur face of t he i ce . The lowest curve i n the f i gu re shows a t y p i c a l spectrum under t he q u i e t e s t condit ion obtained.
Figures 8 and 9 a r e narrowband spec t r a of two impulsive events obtained near North Marble I s land (near S ta 27) and i n Queen I n l e t , respect ive ly . Notice i n p a r t i c u l a r the low frequency tona l components a t about 63, 126, and 189 Hz and good s i g n a l- t o n o i s e r a t i o beyond 1 kHz (Fig. 8) and out t o 2 kHz i n Fig. 10. The cause of t he pure tone
components i n t he t r a n s i e n t s is unknown although, we f e e l i t may be a resonance e f f e c t associa ted with t h e generat ion of shear energy a t t he i c e / rock in t e r f ace .
One br ie f experiment was performed a t S t a t i on 27 with t he hope of providing some in s igh t regarding the source of t he impulsive events. The H56 hydrophone was deployed t o a 25 meter depth a t t he research ves se l , loca ted approximately 3.2 km away from the sonobuoy and the impulsive events recorded simultaneously with t he sonobuoy da t a on a 2-channel tape recorder. Range t o the sonobuoy was determined acous t i ca l ly by dropping a weighted l i g h t bulb over t he s i d e of t he research vesse l where i t sank u n t i l hyd ros t a t i c pressure caused the bulb t o implode. The r e s u l t i n g sharp sound t r a n s i e n t was recorded from both the H56 hydrophone and the sonobuoy. Measuring the time d i f f e r ence and knowing the speed of sound permits determination of range between the two sensors. Figure 10 sketches t h e arrangement showing t h a t a time d i f f e r ence of 2.2 seconds was r ea l i zed , corresponding t o a sensor spacing of 3234 meters (using a sound speed of 1470 m/sec). S imi lar ly , s i n g l e impulsive events a r e recorded

100 - 2 . "isa 3 Ã
80 w
? E 70 h 'g m a E g so a BACKGROUND
0 0.2 0.4 0.8 0.8 1.0 1.2 1.4 1.6 1.8 2.0
FREQUENCY (kHz1
Figure 8. Narrowband spectrum analysis of an underwater impulsive event at N. Marble Island, Glacier Bay.
loo
- s 3 2 ? - -i m > w ¥
8 " h w
^ so
40 0 0.2 0.4 0.6 0.8 1.0 1.2 1.4 1.8 1.8 2.0
FREQUENCY IkHzl
Figure 9. Narrowband spectrum analysis of an underwater impulsive event in Queen Inlet, Glacier Bay.
103

an e x t r a ambiguity f o r broadside a r r i v a l s .
la1 HYDROPHONE SEPARATION CALIBRATION Based on t h e a r r i v a l d i r e c t i o n s 1 (BULB SOURCE)
I (bl IMPULSIVE EVENT FIRST ARRIVALS I SONOBUOY
-At- 1.4m-
H 56
L ~ ~ ~ ~ ~ ~ ~ ~ ~ g ~ ~ a ~ l ~ ~ ~ ~ l ~ ~ ~ ~ l ~ ~ ' ~ l I 0 0 5 1.0 1.5 2 0 2.5 3 0
ARRIVAL TIME DIFFERENCE (SECONDS)
1cl GEOMETRY
LINEARIZED IMPULSE
F igure 10. Determinat ion of d i r e c t i o n of a r r i v a l f o r impulsive even ts .
s imultaneously. Also sketched i n F igure 10 is t h e f i r s t a r r i v a l of such an e v e n t , demonstrat ing t h a t t h e sonobuoy r e g i s t e r e d the event f i r s t . The c o s i n e of t h e wavefront a r r i v a l ang le (with an ambigui ty) is t h e r a t i o of t h e a r r i v a l t imes . Figure 11 i l l u s t r a t e s t h a t ambiguity and inc ludes wi th i t a poten- t i a l angula r e r r o r of about 5' due t o imprec i se information on t h e azimuthal o r i e n t a t i o n of t h e research v e s s e l / sonobuoy l i n e of s i g h t , and t o some f l u c t u a t i o n i n t h e time d i f f e r e n c e s i n t h e f i r s t a r r i v a l s of t h e impulsive even ts a t t h e two hydrophones. Of t h e even ts measured i n t h i s way, a l l showed a r r i v a l t ime d i f f e r e n c e s t o be w i t h i n 1 .3 t o 1.4 seconds. I f se i smic impulses were r a d i a t i n g from t h e bottom of t h e f j o r d , a r r i v a l s a t t h e two hydrophones would be n e a r l y s imultaneous, providing
shown i n Fig. 11, we f e e l t h a t t h e most l i k e l y source of t h e s e even ts i s a s s o c i a t e d wi th t h e g l a c i e r s i n t h e Brady I c e F i e l d complex t o t h e west of t h e measurement s i t e . However, we cannot t o t a l l y r u l e out White G l a c i e r and Casement G l a c i e r t o t h e n o r t h e a s t because of t h e smal l sample of da ta .
Discussion
We have s t a t e d t h a t we f e e l t h a t t h e s e even ts a r e r e l a t e d t o s e i s m i c energy being generated a t t h e i c e l r o c k i n t e r f a c e beneath a c t i v e g l a c i e r s of t h e region. We do not have in format ion regard ing t h e var ious degrees of a c t i v i t y of t h e many g l a c i e r s , only t h a t a l l of t h e t i d e w a t e r g l a c i e r s were demonstrat ing a c t i v i t y . In t h e West A r m a r e a , Reid, Lamplugh, and Johns Hopkins g l a c i e r s a r e a l l f ed by t h e Brady I c e F i e l d . Charpent ie r and Geike, which a r e now v a l l e y g l a c i e r s , a r e l o c a t e d c l o s e t o t h e f j o r d s . In the v i c i n i t y of S t a t i o n 27 , a l l t h e nearby p o t e n t i a l se i smic sources a r e v a l l e y g l a c i e r s ; White, Adams and Morse, and Casement t o t h e n o r t h and n o r t h e a s t .
Dewart (1968) has measured impulsive even ts us ing seismometers on and near t h e i c e of Kaskawulsh G l a c i e r i n t h e Yukon. Impulse r a t e s vary ing from 1 t o 62 per hour were measured and were q u i t e s h o r t i n d u r a t i o n (0.5 t o 2 seconds) . F u r t h e r , he noted a d i u r n a l v a r i a t i o n i n event r a t e with changes i n numbers of even ts per hour s i m i l a r t o what we observed. While he d id no t mention observing pure tones i n assoc ia- t i o n with t h e s e e v e n t s , he does r e f e r t o work by Oelsner on t h e Lovenbreen G l a c i e r i n West Spi tzbergen where he observed impulses (which he c a l l s -eigenimpulses") having a dominant f r e - quency around 60 Hz. He a l s o r e l a t e s t h e event r a t e t o temperature f l u c t u a- t i o n s , which c o r r e l a t e with run of f f l u c t u a t i o n s ( l u b r i c a t i o n ) .
Weaver and Malone (1979) d i s c u s s e x t e n s i v e seismometer measurements made i n t h e immediate v i c i n i t y of , g l a c i e r s i n t h e North Cascade mountains of

 SHORT AMBIENT. SVP,
Figure 11. Approximate angle of a r r i v a l of impulsive events a t S t a t i on 27.
Washington. They measured many impulsive events having a 1-2 Hz dominant f r e- quency and event r a t e s which varied from thee per day t o t h ree per minute depend- ing on the p a r t i c u l a r g l a c i e r being monitored. A t one s t a t i o n (Longmire) on M t . Ra in ier , they reported t h a t through a 10-year period, cons is ten t co r r e l a t i on ex i s t ed between event r a t e and time of year; low r a t e s i n winter and high r a t e s I n t he summer when more run-off occurs, permi t t ing more g l a c i a l motion through lubr ica t ion . Magnitudes of t he events
based on the earthquake energy r e l a t i on- sh ip developed by Gutenberg and Richter i n Richter (1958), var ied from 1.2 t o 2.4 represent ing se ismic energies a t t h source of these events of 1 0 t o 10 5 Joules. They repor t f u r t h e r t h a t only t h e very l a r g e s t sur face avalanches produced a r e l a t i v e l y small response a t s t a t i o n s a few hundred meters away. Crevassing impulses, a s referenced by Weaver and Malone (1979) and reported by Neave and Savage (1970) generate i n t h e order of 1 Joule of seismic energy.

Based on their extensive study, Weaver and Malone conclude that the impulses which they monitored were due to stick- slip action through a shear sliding mechanism at the ice/rock interface.
Van Wormer and Berg (1973) report that weak P phases and well developed monochromatic non-dispersive shear-wave trains are often recorded at University of Alaska's seismological station SCM in southern Alaska. They conclude that these events probably originate at or near tidewater glaciers, in Prince William Sound. Frequencies of the shear wave trains in this case were in the order of 1 to 2 Hz. Earthquake magni- tudes of 1.6 to 3.0 were recorded and event rates at the remote measurement facility were in the 2.5 to 3 per hour range. They hypothesize that these events are associated with release of seismic energy at the ice/rock interface in the order of 107.5 Joules. The authors compute that a stick-slip motion of about 3 mm of a glacial section hav- ing an area of 1 km2 is sufficient to generate the earthquake magnitudes observed.
If we assume that the pure tone elements of the impulsive events measured in Glacier Bay are due to shear-wave energy generated at the ice/rock interface we have a means for estimating the focal distance to the events. Shear waves do not propagate in water, but they can be converted to compressional waves at major changes in impedance or at major discontinuities. Measuring the time difference between the first arrival and the pure tone component of the signatures in Figure 5 provides a P-S arrival difference of approximately 1.3 seconds. Jeffreys and Bullen (1958) provide a table of seismic wave arrival times for surf ace focus, near earthquake events. Their data for compressional and shear wave arrivals in granite bedrock, demonstrate that the distance to a seismic event, through the rock medium, for a time difference of 1.3 seconds is approximately 11.1 km or 6.0 n.m. Referring back to Figure 11 and assuming that the radiating rock/water interface of a fjord wall is where the shear-to-compressional energy conversion takes place and that the radiating face is approximately at the
bar mark on the 50Â angle of arrival line, a 6 n.m. distance to the originat- ing seismic event is at the end of the arrow shown. In this estimate, there- fore, it appears that the source of the impulsive events measured at Station 27 is associated with the Reid Glacier, near Its eastern edge. Similarly, for the ambiguous arrival angle to the northeast, the range vector indicates that any source in that direction could not be associated with a glacier. While we do not have directivity information for the Queen Inlet events, we do have a P-S At estimate from Figure 6 (at the bottom) of approximately 1.1 seconds which translates, according to Jeffreys and Bullen, to a distance of 9.4 km or about 5 n.m. A probable source of the Queen Inlet events, theref ore, is Carroll Glacier, immediately to the north of the measurement site.
With the knowledge of mean sound pressure levels of these events as received at Station 27, it is possible to develop a rough estimate of the seismic energy released at the source. Our sound transmission loss measurements demonstrated a 15 log (range) dependency for spreading loss in water and Ewing, Jardetsky and Press (1957) indicate a similar dependency for body waves (shear and compressional) propagating over short distances for surface focus events.
Sound pressure is related to radiated acoustic power (W) by the relationship,
where r is the distance from the source in meters, p is the r.m.s. acoustic sound pressure in pascals, and p and c are the density and sound speed of water. Radiated acoustic power at the water/rock interface for a sound pressure at the research vessel of 100 dB//uPa 18 0.17 watts based on computing the sound pressure at the radiating rock face 13 n.m. away and using the above relationship. Sound pressure at the water/rock interface is estimated from

where po research pressure
is the sound pressure at the vessel and p is the predicted at the rock face r meters away.
For 110 dB//pPa, the acoustic power at the rock face is 1.7 watts. Predicted energy at the source of the seismic event is:
w Eb = 10 log(;) + 15 log R,
(dB//l watt), (for body waves)
where 11 is the rock-to-water energy con- version efficiency and R is the distance in meters through the rock material to the source. Converting these dB values to power and multiplying by the seismic impulse duration in seconds provides the watt-sec impulse power at the source. Energy in the more conventional seismic units (joules or ergs) is obtained by application of standard unit conversion factors. We have assumed that solid friction losses in rock for this case are small compared to spreading losses. Further, if we assume a 5% seismic energy-to-underwater sound energy con- version efficiency and that the 6 n.m. rock transmission path length is reason- able, we compute the event energies and earthquake magnitudes shown in the following table. The earthquake energy/ magnitude relationship used for shallow focus local events and body waves is that provided by Richter (19581,
log E = 9.9 + 1.92 M -0.024M L L
where E is energy in ergs and ML is local earthquake magnitude.
Source Energy Estimates*
Mean SPL at Hydrophone (Initial Impulse for 1 second duration) 100 dB//pPa 110 dB//pPa
Body Waves:
Energy 4 x 1 0 Joules 4 x 1 0 Joules
Earthquake Magnitude M = 1.9 M = 2.5
*See text for glacially related seismic event magnitude estimates by others.
Conclusions
Seismic events (primarily body waves) due to stick-slip action at the ice/rock interface in glaciers in Glacier Bay probably are the cause of underwater acoustic impulsive events which often occur as frequently as 3 to 4 times per minute and may have a diurnal and seasonal variation in event rate.
The question regarding the possi- bility of a microseismic cause of these impulsive events due to isostatic rebound and resulting fracturing and slippage in existing fault zones is not resolved. A wintertime measurement period may help to answer this question since it is expected that stick-slip action of glaciers would tend to be suppressed in the winter and rebound rate would remain relatively unchanged.
More synoptic measurements should be performed using both a hydrophone array and a seismometer array with simultaneous recording to help remove assumptions and ambiguities which were used in this analysis.
References
Dewart, G. 1968, "Seismic Investigation of Ice Properties and Bedrock Topography at the Confluence of Two Glaciers, Kaskawulsh Glacier, Yukon Territory, Canada," Institute of Polar Studies, Report No. 27.
Ewing, W.M., W.S. Jardetsky, and F. Press. 1957, Elastic Waves in Layered Media, McGraw Hill.
Hale, L.Z. and R.G. Wright. 1979, "The Glacier Bay Marine Ecosystem; A Conceptual ecological Model," National Park Service.
Jeffreys, H. and K.E. Bullen. 1958, Seismological Tables, British Association for Advancement of Science.
MacKevett, E.M., Jr., D.A. Brew, C.C. Hawley, L.C. Huff, J.G. Smith. 1971, "Mineral Resources Glacier Bay National Monument, Alaska," Geological Survey

P r o f e s s i o n a l Paper #632, U.S. Geo log ica l Survey.
Malme, C . I . , P.R. M i l e s , P.T. McElroy. 1982, "The A c o u s t i c Environment of Humpback Whales i n G l a c i e r Bay and F r e d e r i c k SoundIStephens Passage , Alaska ," BBN Report No. 4848.
Neave, K.G. and J . C . Savage. 1970, " Icequakes on t h e Athabasca G l a c i e r , " Jour . Geoph. Res. (75) , No. 8, pp. 1351- 1362.
R i c h t e r , C.F. 1958, Elementary Seismology, W.H. Freeman Co.
Vanwormer, D. and E. Berg. 1973, "Seismic Evidence f o r G l a c i e r Motion," J o u r n a l of Glac io logy ( 1 2 ) , No. 65, pp. 259-265.
Weaver, C.S. and S.D. Malone. 1979, "Seismic ev idence f o r D i s c r e t e G l a c i e r Motion a t t h e Rock-Ice I n t e r f a c e , " J o u r n a l of Glac io logy ( 2 3 ) , No. 89, pp. 171-184.

PANEL DISCUSSION
Stephen D. Treacy Minerals Management Services, Anchorage, Alaska, USA
Following presentation of the technical papers, symposium speakers participated in a panel discussion on potential directions for research rela- tive to noise and marine mammals. Suggested topics for additional research (and the name of the panelist or audience member initiating each topic) are summarized as follows:
1. Investigation of the hearing and vocalization of seals and small ceta- ceans relative to frequency thresholds and band widths (J. Terhune) ;
2. Selection of a particular species (e.g., ringed seals) from which data on ecological effects may be extrapolated to other species (B. Kelly);
3. Tracking of a large whale species (e.g., humpback whale) to test acoustic responses in a manner similar to work performed by Sam Ridgeway (W. Turl);
4. Further analysis of bowhead whale distribution data to test the theory that whales may be excluded from particular industrial zones (Tom Newbury, Minerals Management Service (MMS) ) ;
5. Use of synoptic monitoring systems (without observers) to collect data on the physical acoustics of particular areas (C. Malme);
6. Consideration of the basic behav- ioral responses of marine mammals to long-term noise ( S . Cosens); and
7. Radio-tagging large cetaceans to the extent that this is feasible (Tom Albert, North Slope Borough (NSB)).
The merits of selecting a particular key species for extrapolation of certain results to other species (suggestion 2 above) were discussed further. Major points made during this discussion were the following:
a. A scientific benefit derives from long-term research continuity with a single species (K. Frost).
b. Key species should be select- ed based to some extent on the ease by which information can be collected and on their wide geographic distribution (S. Cosens). Key species should be selected based, in part, on the extent of existing good data (Tom Newbury, MMS). Existing data, however, may be poor and may require a great amount of initial attention (B. Kelly).
c. An overall problem with the key species approach is that, at least in the case of Tursiops sp. where long-term data exist over 20 years, the data would not extrapolate to other species (W. Turl).
d. The key species approach may reflect economic reality . In marine mammal science (B. Kelly).
e. Any key species had better be highly similar for data extrapolation to apply (W. Turl). Extrapolation is difficult even from area to area for the same species CJ. Ward).
One qualifying statement on the topic of bowhead whale exclusionary zones (suggestion 4 above) was that analyses of bowhead distribution data showing areas where impact (or lack of impact) occurred should indicate the degree of variability. The accuracy of statis- tical tests used will determine the use of such results (Tom Albert, NSB).
Major points made about radio-tagging of marine mammals (suggestion 7 above) were:
a. Radio-tagging is an excellent approach: it provides reams of data quickly on difficult management and scientific issues (J. Terhune).

b. Radio-tagging is expensive and provides a small sample of individ- u a l animals tagged (B. Kelly) .
c. Radio-tagging of po l a r bears has helped g r e a t l y i n determining of f- shore denning of po l a r bears (J. Ward). This i s because the po la r bear i s one spec ies t h a t does have a l a r g e percent- age of tagged ind iv idua l s (B. Kelly) .

AUTHOR LIST
Au.W.W.L . . . . . . . . . . . . . . . . . . . . . . . . 89 Bird . J . E . . . . . . . . . . . . . . . . . . . . . . . . . 55 Burns. J . J . . . . . . . . . . . . . . . . . . . . . . . . 27 Cosens. S . . . . . . . . . . . . . . . . . . . . . . . . . 39 Cowles. C . J . . . . . . . . . . . . . . . . . . . . . . . 1 Dueck. L . P . . . . . . . . . . . . . . . . . . . . . . . . 39 Frost. K . J . . . . . . . . . . . . . . . . . . . . . . . . . 15 Imm. J . L . . . . . . . . . . . . . . . . . . . . . . . . . 1 Kelley. B . P . . . . . . . . . . . . . . . . . . . . . . . . 27 Lowry. L . F . . . . . . . . . . . . . . . . . . . . . . . . 15 Malme. C . I . . . . . . . . . . . . . . . . . . . . . . . . 55:95 Miles. P . R . . . . . . . . . . . . . . . . . . . . . . . . 95 Penner.R.H . . . . . . . . . . . . . . . . . . . . . . . 89 Pessah . E . . . . . . . . . . . . . . . . . . . . . . . . . 75 Quakenbush. L . T . . . . . . . . . . . . . . . . . 27 Terhune. J . M . . . . . . . . . . . . . . . . . . . . . . 9 Treacy. S . D . . . . . . . . . . . . . . . . . . . . 109 Turl. C . W . . . . . . . . . . . . . . . . . . . . . . . . 89 Tyack. P . . . . . . . . . . . . . . . . . . . . . . . . . . 55 Ward. J . G . . . . . . . . . . . . . . . . . . . . . . . . 75 Wursig. B . . . . . . . . . . . . . . . . . . . . . . 55
I l l


