population vector algorithm journal club 01. 07. 08
TRANSCRIPT

Population vector algorithm
Journal club 01. 07. 08


Each panel illustrates wrist position, the instantaneous firing rate and a raster display of the response of the neuron in individual trials.
Response of a M1 neuron to mechanical perturbations in different contexts
Evarts and Fromm, 1978
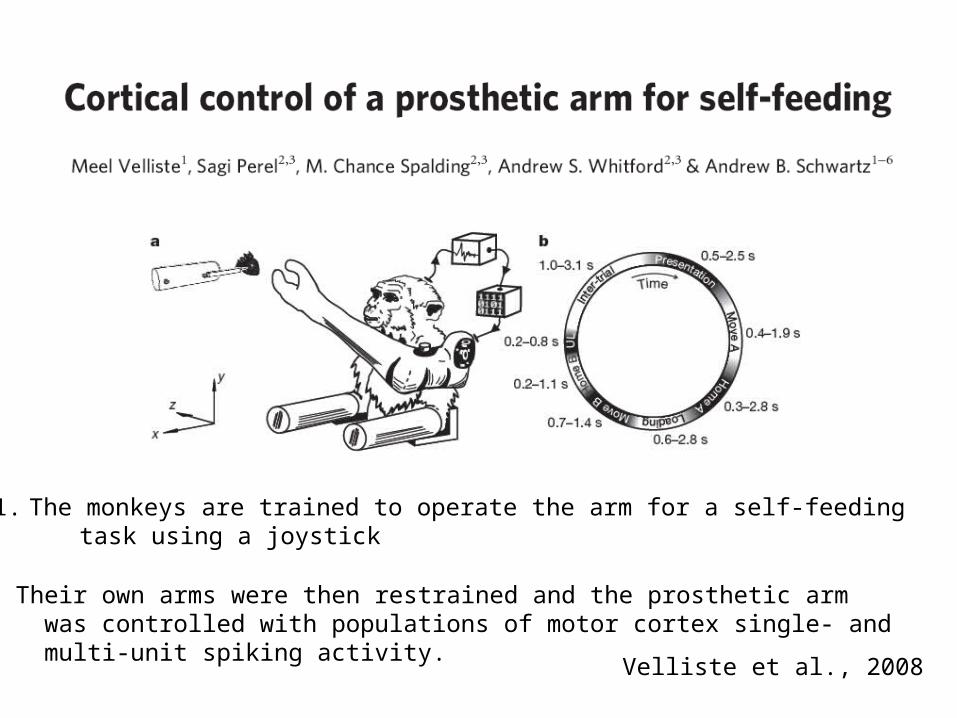
1. The monkeys are trained to operate the arm for a self-feeding task using a joystick
2. Their own arms were then restrained and the prosthetic arm was controlled with populations of motor cortex single- and multi-unit spiking activity.
Velliste et al., 2008


Endpoint trajectory variability
Semi-transparent coloured regions represent trajectory standard deviation (over all sessions) around average trajectories (grey lines) to each target.
Velliste et al., 2008

Spike occurrences for each unit, grouped by major tuning component (red, x; green, y; blue, z; purple, gripper)
Distribution of the four-dimensional preferred directions of the 116 units used. Arrow direction indicates x, y, z components, colour indicates gripper component (blue, negative; purple,zero; red, positive).

Spike rasters of a single unit during six movements in each of 8 directions.
This unit (with {x,y,z} components of its preferred direction, fired maximallyin the backward-up-right direction (B,U,R) and fired least in the forward-downleft direction (F,D,L).
Velliste et al., 2008


Keeping the gripper closed during retrieval.
Gripper aperture as continuously varying colour from blue (closed) to purple(part-way open) to red (open).
Velliste et al., 2008

Population vector algorithm

Discharge rate versus movement direction.
Tuning function in three-dimensional Cartesian coordinate frame.
relies on the directional tuning of each unit, characterized by a single preferred direction in which the unit fires maximally.
is a vector sum of the preferred directions of the units in the recorded population, weighted by the firing rates of the units.
Population vector algorithm:
The solid vertical lines denotethe preferred direction (PD) of each cell.
The vector sum of all cells defines a population vector.

Mean hand trajectory is shown in the central panel for movementsto each of eight spatial targets. The large black arrow denotes thepreferred direction (PD) of the neuron.
Vector sum of all cells defines a population vector

Population vector, P, which points in the predicted direction of movement:
The ith contribution, Ci, to the population output is represented as a unitvector pointing in its preferred direction, and weighted by some function of its firing rate, Wi = f (D).
D is the cell’s discharge rate, bo is its mean discharge rate, mx, my andmz are the x, y and z components of a unit vector pointing in the direction of movement, and bx, by and bz are regression coefficients.
Schwartz et al., 2001
Population vector algorithm:

For an assembly (Hebb 1949) or population of motor neurons {1 ≤ i ≤ N} with momentary firing rate νi the weighted vector sum, the so-calledpopulation vector n:
encodes the direction e of movement resulting from an assembly of motorneurons while ν, the length of the population vector n, is proportional to the instantaneous speed of the drawing motion.
each neuron with label i its preferred direction ei - a unit vector.
Hemmen and Schwartz, 2008
Population vector algorithm:

B - a vector pointing in the cell’s preferred direction (the direction where thecell fires maximally).
M - a unit vector in the movement direction (consisting of mx, my and mz).
This linear relation can also be expressed in terms of a cosine-tuning equation:
where θ is defined as the angle betweenthe preferred and movement directions.
Each dot denotes the preferred direction of an individual neuron.


Direction vector algorithm

Bayesian maximum likelihood methodto reconstruct positions, based on the following formula:
P(x|n) is the probability of the rat occupying bin x given the cell activity in the window
fi(x) is the probability of the cell i firing in map bin x, which equates with the average firing rate of the cell in that bin.
P(x) is the mean probability of the rat occupying position x.
ni is the number of spikes from cell i in the sliding window, and τ is the size of the sliding window.
C(τ, n) is a normalization factor calculated so that the sum of the probabilities for each bin = 1.
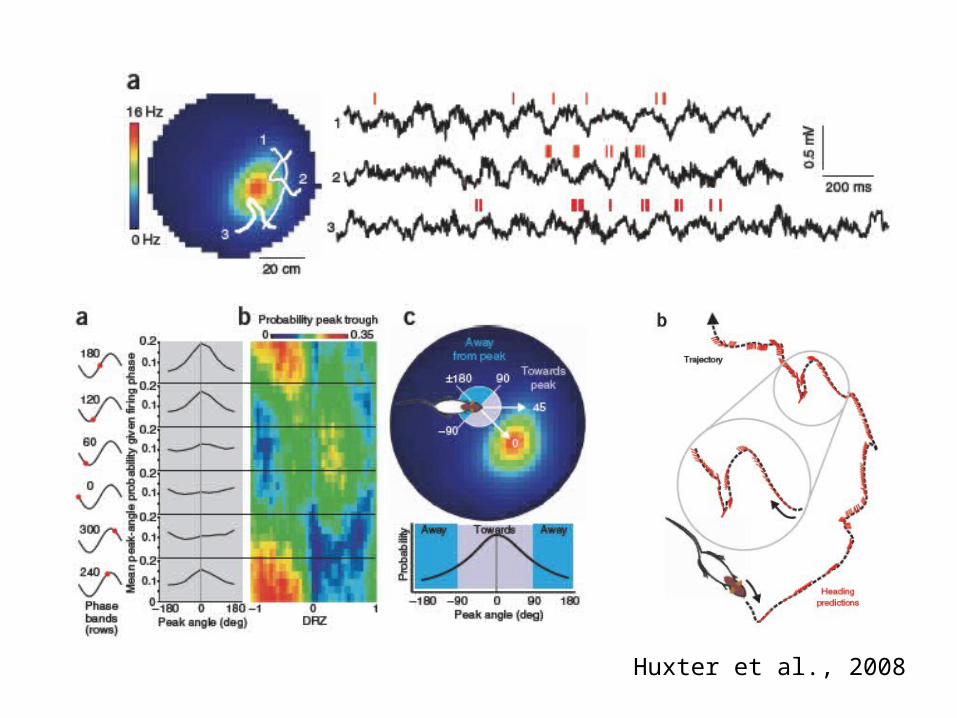
Huxter et al., 2008

…plasticity vector algorithm

Thank you for your attention