population growth and its impact on the provision of
TRANSCRIPT
a POPULATION GROWTH AND ITS IMPACT ON THE PROVISION OF PRIMARY EDUCATION
IN NYAMIRA DISTRICT S
BY
JULIUS NYONG’A SEGERAvUniversity cl NAIROBI Library
''0472991 9
UNIVERSITY OF NAIROB,£AS7 AFRICANA COLLECTION
THESIS SUBMITTED IIS PARTIAL FULFILMENT OF THE REQUIREMENT FOR THE DEGREE OF MASTERS OF ARTS IN
POPULATION GEOGRAPHY, IN THE FACULTY OF ARTS, UNIVERSITY OF NAIROBI
d rn /Q l e v y A I T & MLMtJRIAL

D E C L A R A T IO N
This is my original work and has never been presented for a degree in any other university.
Sign:
JULIUS NYONG’A SEGERA
DEPARTMENT OF GEOGRAPHY
This thesis has been submitted for examination with my approval as the University
supervisor.
DEPARTMENT OF GEOGRAPHY
UNIVERSITY OF NAIROBI
n

D E D IC A T IO N
To my parents Segera and Keremensia, my wife Justina, my sons Collins andMerlivin, my
brothers Jones, Samuel, Joseck, James, Jared, my sisters Joyce and Priscah. Finally to my
friends Charles and John.
m

ABSTRACT
The main objective o f this study was to investigate the impact o f demographic levels
and trends on the provision o f primary education in Nyamira district. The district under study
is characterized by high population growth rate o f 3.1% hence a lot o f co on its social
services. The research therefore aimed at examining demographic levels and trends in terms
o f fertility, mortality, migration, growth rates and age structure. Analysis was also made of
the demands for and supply of primary education in terms o f educational facilities such as the
number o f classrooms per school, teachers and teaching material.
The study used both primary and secondary data. The raw data was obtained through
a questionnaire which was administered by the researcher himself. A sample size o f 160
primary schools was taken from 360 primary schools in the District. Proportionate stratified
random sampling was applied, which ensued that each unit of the working population has an
equal chance o f being selected. In analyzing the data both demographic and statistical
techniques were applied e.g population on pyramidal peaks, population growth rate method,
the use o f age specific fertility rates, the total fertility rates and crude death rates, other
demographic method used included the use o f teacher-pupil ratio, population tables and
graphs. The researcher also utilized the following statistical techniques: Descriptive
statistics were useful in analyzing the enrolment rate, here tables and graphs were used.
Inferential statistics was useful in explaining the relationship between population growth and
educational facilities; here regression and correlation analysis were used. It is important to
note that all the methods were used to test the hypotheses o f the research.
The research, indicated that Nyamira has been experiencing fast population growth
rates of 3.1 per cent per annum. This is as a result of rising fertility and declining mortality in
IV

Nyamira. In addition, Nyamira population appears to be more youthful, with an increasing
proportion o f children aged 0-14 years due to increased births o f the reproductive women in
the age group 15-49 years. This has seriously affected the demand for primary education in
Nyamira and the capacity o f the district education board to cope with it.
Correlation and Regression analysis shows a significant relationship between
enrolment and the number of teachers and classroom, which had R o f 0.54514 and 0.47868
respectively. This shows that as the number of pupils increases the number o f teachers and
classrooms are likely to increase. However, the coefficient o f determination explains a small
variance which means that although there is a positive relationship between enrolment and
education facilities; the facilities are not enough. The testing of the hypothesis showed a
weak relationship between pupil enrolment and educational facilities. It was generally
concluded that pupil enrolment outweighs the supply o f educational facilities in Nyamira.
The major recommendation from this study is that the rapid increase in school age
population should be seen as a serious problem and therefore, it is important for the
government to increase family planning method in the district. It is also important to increase
the age of marriage and increase the opportunity o f more female in the working sector.
v

ACKNOWLEDGEMENT
I am grateful to several people for their intellectual and financial help while I was
working on this thesis. They are too many to be mentioned, but their contribution are
nevertheless valuable. First, I thank the University of Nairobi for granting me the
opportunity to do a masters course and in financing me with the initial capital for the course.
I wish also to thank the current Departmental Chairman, Dr. Mungai, for the smooth running
of the department which makes the place conducive for learning. I am grateful to my thesis
supervisor, Prof. E.H.O. Ayiemba, whose unflagging support and advice have been a great
asset in completing this thesis. I acknowledge the advice o f Messrs Ndolo and Nyandega.
I cannot also forget to sincerely thank particularly Nyakundi, Kirema and Kaburi for
their skilful cartographic services. Thanks goes to Mr. Mwangi the Technologist in-charge of
the computer room for his unfailing and instant assistance in perfecting my thesis. I am also
thankful to my brothers Samuel, Jones and James for their financial and moral support, and to
my parents whom I owe a lot of thanks for their devotion and determination to make sure that
I got all that I needed for the course, especially financial needs.
I cannot forget my fine cousins John and Masanya, the fine college mate ladies
Florence and Winnie for their constructive ideas.
vi
TABLE OF CONTENTS
Declaration.................................................................................................................. ii
Dedication.................................................................................................................... iii
Abstract........................................................................................................................ iv
Acknowledgement.................................................................................................... vi
Table o f C ontents................................................................................................ vii
List o f Figures............................................................................................................. x
List o f T ables.............................................................................................................. xii
CHAPTER ONE
1.1 Introduction............................................................................................. 1
1.2 Statem ent................................................................................................... 1
1.3 Objectives............................................................................................... 3
1.3.1 General O bjectives................................................................... 4
1.3.2 Specific Objectives................................................................... 4
1.4 Literature R eview ..................................................................................... 5
1.5 Theoretical and Conceptual Framework............................................. 15
1.6 Operational Hypotheses....................................................................... 21
1.7 Justification............................................................................................. 22
1.8 Scope and Lim itations.......................................................................... 23
1.9 Definition o f Important C oncepts........................................................ 24
CHAPTER TW O: THE STUDY AREA
2.1 Introduction............................................................................................ 27
2.2 Location and S iz e .................................................................................. 27
2.3 Administration and Political U n its .................................................... 29
2.4 The impact o f Relief Features on Population D istribution............. 30
2.4.1 Physiography................................................................................ 30
2.4.2 D rainage........................................................................................ 32
Page
vii
2 5 Soil in Relation to Population D istribution........................................... 32
2.5.1 S o il................................................................................................ 32
2 6 Climate in Relation to Population......................................................... 35
2.6.1 R ain fa ll.................................................................................. 35
2.6.2 Tem perature................................................................................ 38
2.7 Demographic and Settlement Patterns................................................ 39
2.7.1 Population S iz e .......................................................................... 39
2.7.2 population Structure................................................................. 40
2.7.3 Population Distribution and D ensity...................................... 41
2.7.4 Urban Population...................................................................... 42
2.7.5 M igration................................................................................... 43
2.7.6 Infant Mortality R ates ............................................................. 43
2.8 Socio-economic Infrastructure............................................................ 44
2.8.1 Health Status in the D istrict................................................... 44
2.8.2 Transport System in N yam ira................................................ 47
2.8.3 Education................................................................................... 47
2.8.3.1 The Current Education Policy in Kenya (Nyamira) 47
2.8.3.2 Educational Facilities................................................ 50
2.8.4 Pupil-Teacher Ratio in the D istrict....................................... 52
CHAPTER THREE: METHODOLOGY
3.1 Introduction........................................................................................... 53
3.2 Sampling Fram ework.......................................................................... 53
3.3 The Nature o f the Data R equired....................................................... 53
3.4 Sources of D a ta .................................................................................... 56
3.4.1 Sources of Demographic trends in the D istrict................. 56
3.5 Data Collection..................................................................................... 58
3.5.1 Questionnaire........................................................................... 58
3.5.2 Personnel Interview ................................................................ 59
3.5.3 Secondary D a ta ....................................................................... 59
3.6 Data A nalysis...................................................................................... 60
vm
3.6.1 Demographic Techniques...................................................... 60
3.6.2 Statistical M ethods................................................................ 62
3.6.3 Multiple Regression Analysis (Stepw ise).......................... 64
3.6.4 Analysis o f Variance.............................................................. 65
3.7 Limitation of Research M ethodology............................................. 67
3.7.1 Solution to the Problem Faced ............................................ 68
CHAPTER FOUR: DEMOGRAPHIC LEVELS AND TRENDS
4.0 Introduction........................................................................................ 69
4.1 Population Characteristics in the District (Population Size and
Growth R ate)...................................................................................... 69
4.1.1 Population Structure............................................................. 70
4.2 Fertility Levels in K enya................................................................... 71
4.3 The State of Family Planning in the D istrict.................................. 77
4.4 Education and Fertility ...................................................................... 80
4.5 Education and Fertility Levels in N yam ira.................................... 81
4.6 Fertility and Women’s Employment in N yam ira......................... 83
4.7 Mortality Levels in Nyamira ........................................................... 84
4.8 HIV/AIDS Situation, Its Implication on Fertility and Mortality
in N yam ira......................................................................................... 88
4.8.1 The Implementation o f HIV& AIDS................................ 91
4.9 Migration in N yam ira...................................................................... 92
4.9.1 Rural-Rural M igration........................................................ 92
4.9.2 Rural-Urban M igration....................................................... 93
4.9.3 The Migration o f School Age Population in Nyamira ... 94
4.10 Chapter Sum m ary............................................................................ 94
CHAPTER FIVE: THE IMPACT OF POPULATION ON THE DISTRIBUTION
OF EDUCATIONAL FACILITIES
5.0 Introduction......................................................................................... 96
5.1 Development o f Enrolm ent.............................................................. 96
5.2 Distribution o f Primary Educational Facilities in N yam ira......... 98
IX
5.2.1 Average Distribution of Primary School Teachers............ 101
5.2.2 Average Distribution o f Classroom ..................................... 102
5.2.3 Textbooks................................................................................ 105
5.2.4 Maps, Charts and other Related Facilities.......................... 107
5.3 Analysis of the Related Relationship Between Pupil Enrolment
And Educational Facilities................................................................ 110
5.3.1 Simple Regression A nalysis................................................. 110
5.3.2 Analysis of Teachers.............................................................. 113
5.3.3 Analysis of Textbooks, Maps and C harts.......................... 114
5.4 Correlation A nalysis......................................................................... 116
5.5 Multiple Regression Analysis (Stepw ise)..................................... 117
5.6 Analysis o f V ariance......................................................................... 119
5.7 Conclusion........................................................................................... 121
CHAPTER SIX: SUMMARY, CONCLUSION AND RECOMMENDATIONS
6.0 Summary and Conclusion.................................................................. 123
6.1 Policy Recommendations.................................................................. 127
6.2 Recommendations for Future Research.......................................... 130
Bibliography....................................................................................... 131
APPENDICES
Appendix ( i ) ........................................................................................ 136
Appendix ( i i ) ....................................................................................... 140
Questionnaire...................................................................................... 143
x
L IST O F F IG U R E S
1 Operational Framework..................................................................................... 20
2 The Location of Nyamira in Kenya.................................................................. 28
3. The Administrative Units in Nyamira.............................................................. 31
4. The Location of the Agro-Ecological Zones in the D istrict........................... 36
5. Distribution of Health Facilities in Nyamira................................................... 46
6. The Road Structure and the Distribution of Primary Schools on Nyamira ... 48
7. Age and Sex Structure in Nyam ira................................................................... 72
8. Total Fertility Rate in Each Division (1990-1995)......................................... 76
9. Percentage of the Accepted Family Planning Method in the Year 1995
in Nyamira.......................................................................................................... 78
10. Total Deaths for a Grace Period of Five Years in Nyam ira............................ 84
11. Estimates of the Proportion of Children Dying in the First Five Years of
Life per Division in Nyam ira........................................................................... 89
12. The Development of Pupils’ Enrolment from 1969-1996 in Nyamira by Sex 98
13. Average Distribution of Pupil Enrolment in Each Division in Nyamira
1990-1996 i n ‘00’ ..................... ....................................................................... 100
14. Spatial Average Distribution of Teachers per a Classroom for the Years
1992-1996 in ‘00’ ............................................................................................ 102
15. Divisional Average Variation in the Number of Classrooms for the Years
1992-1994 i n ‘00’ ............................................................................................ 104
16. Divisional Average Distribution of Textbooks Nyamira for the years
1989-1994 in ‘00’ ........................................................................................... 107
17. Spatial Average Distribution of Geographical M aps.................................. 109
18. Divisional Average Distribution of Teaching C harts................................. 109
19. The Relationship Between Pupil Enrolment and the Number o f Classrooms 112
20. Regression Plot on Pupil Enrolment and Teachers..................................... 113
21. Regression Plot on Pupil Enrolment with Textbooks................................. 114
Page

Regression Plot on Pupil Enrolment with M aps........................................ 115
Regression Plot of School Age Population with charts............................ 116
Regression Plot on Pupil Enrolment with Charts ...................................... 121
Xll
L IST O F T A B L E S
2 1 Area of the District Per Division.................................................................... 29
2 2 Political and Administrative U nits ................................................................. 29
2 3 Agro-Ecological Zone Available by Division and Household................... 34
2.4 Mean Monthly Rainfall (mm) for 1989-1992 period.................................. 37
2.5 Long-term Mean Temperatures 1982-1992 ................................................. 39
2.6 Population Projections................................................................................... 40
2.7 Population of Selected Age Group and S e x ................................................. 41
2.8 Population Distribution Per D ivision........................................................... 42
2.10 Health Facilities and Agents which Maintain them ..................................... 45
2.11 Pre-Primary...................................................................................................... 50
2.12 Primary Schools in Nyam ira.......................................................................... 52
3.1 Number of Primary Schools Sampled in Each D ivision............................ 54
4.1 Population of the District from 1979-1996 ................................................. 70
4.2 Total Fertility Rate and Crude Birth Rate for Selected Years in Nyamira 73
4.3 Age Specific Fertility Rates for Selected Years in Nyam ira..................... 74
4.4 Total Fertility Rate in Each Division in Nyamira since 1990-1996 ........ 77
4.5 Mean Number of Children Desired by the Current Married Women Aged
15-49 by Education (1994-1995)................................................................. 82
4.6 Estimates of the Proportion of Children Dying in the First Five Years of
Life per Division in Nyam ira........................................................................ 87
4.7 HIV/AIDS Cases from 1989-1993 in Nyamira............................................ 90
5.1 Correlation M atrix......................................................................................... 117
5.2 Analysis of Variance ( i ) ................................................................................. 120
5.3 Analysis of Variance ( i i ) ................................................................................. 120
5.4 Analysis of Variance ( ii i) ................................................................................ 121
Page
xm

CHAPTER ONE
1.1 Introduction
World population growth rates vary with time and space, in which case different regions have
different growth. The global population growth rate is currently 1.7 per annum (I.C.P.D Cairo
1994:24). This means that with the current rate, the yearly increment is 90 million persons
worldwide. Most of the increment occurs in developing countries (about 78%), whose growth
rate is 2.7 per annum. Africa has one of the highest growth rates in the world (2.8 percent per
annum). This rate has remained almost constant since 1989; although there is possibility of
changing given that most people are responding positively to family planning programmes
consequently, fertility is bound to decline (I.C.P.D Cairo 1994:24)
Kenya, being an African country also suffers from high population growth rates. The
country experiences demographic trends that are characterized by slow declining high fertility
and declining mortality rates. The population census of 1969, 1979 and 1989 indicates that the
population grew from 10 million in 1969 to 21 million in 1989. This indicates that there has
been a 40% increment every decade. Today, Kenya’s growth rate of 3.1% per annum is still
high.
The above growth rate tells us that Kenya suffers from high population growth rate which
shows little signs of improving. The high fertility rate of the country is also replicated in some
provinces and districts. However, some of the provinces and districts have even higher growth
rates. For instance, Nyanza has a fertility rate of 5.8 which is higher than that of the whole
country (5.4 according to the K.D.H.S 1983). Nyamira district, the study area in Nyanza
Province has a growth rate of 3.1 per annum, which is one of the highest in the country. This
rate has been almost constant since 1989.
1

High population growth rate is therefore a phenomenon of developing countries and it
needs to be checked closely. It should be noted that the above history of high fertility in the third
world has been influential in shaping the youthful broad-based age pyramid (Coale 1978),
therefore indicating an unbalanced age-structure between the young and adults as the young are
more than the adults. In fact, it is widely known that in developing countries most of the
population is in the pre-school and primary school-age cohorts. This age structure is believed to
be a problem in many regions of the world.
In Kenya, 50.5% of the population is under 15 years of age (Moti 1981). The high
fertility in Kenya has really affected the provision of social services like health, education, etc.
in most cases, Kenya has never achieved its aims of universal education because of the high
fertility rates which constrains the educational facilities leading to high drop-outs. For instance,
the primary school enrolment rate is 85.7% (Development Plan 1994). The above rate is
considered high, therefore, implying that the educational facilities, among other social services,
are constrained. The more the constraints in education facilities, the higher the number of drop
outs. For instance, 40% of those who enroll in primary schools do not complete their primary
education in Kenya (Kenya, Development Plan 1994-1996). Therefore one wonders if Kenya
will ever attain its universal aim of primary educational development given the above drop-outs.
Nyamira district, the study area, has a problem of high fertility, the school-age population
occupies 53.1% of the total population. The district suffers from increased pressure on its social
services particularly educational facilities arising from a large number of school-age population.
Therefore it is clear that Nyamira district suffers from high fertility which needs to be
checked as it is now a threat to the existing social services. The government is unable to provide
schooling facilities, including school buildings, teaching materials, trained teachers, etc., for the
2
ever increasing number o f children (Ominde 1984). It is thus hard for Kenya to realize its aim of
universal primary education; more so in Nyamira because of the high increase in school-age
population. It is therefore important for one to analyze the extent to which this high fertility
affects the provision of primary education in the country. In this case Nyamira District was
chosen as the case study.
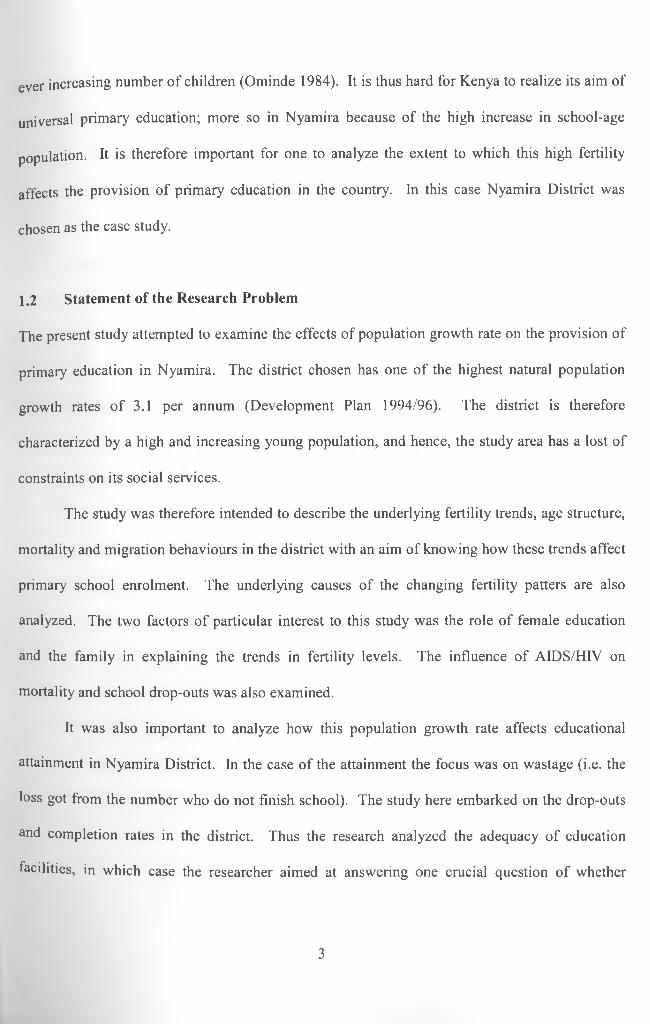
1.2 Statement of the Research Problem
The present study attempted to examine the effects of population growth rate on the provision of
primary education in Nyamira. The district chosen has one of the highest natural population
growth rates of 3.1 per annum (Development Plan 1994/96). The district is therefore
characterized by a high and increasing young population, and hence, the study area has a lost of
constraints on its social services.
The study was therefore intended to describe the underlying fertility trends, age structure,
mortality and migration behaviours in the district with an aim of knowing how these trends affect
primary school enrolment. The underlying causes of the changing fertility patters are also
analyzed. The two factors of particular interest to this study was the role of female education
and the family in explaining the trends in fertility levels. The influence of AIDS/HIV on
mortality and school drop-outs was also examined.
It was also important to analyze how this population growth rate affects educational
attainment in Nyamira District. In the case of the attainment the focus was on wastage (i.e. the
loss got from the number who do not finish school). The study here embarked on the drop-outs
and completion rates in the district. Thus the research analyzed the adequacy of education
facilities, in which case the researcher aimed at answering one crucial question of whether
3
To complete the research, it was important for one to recommend appropriate ways of
improving the situation for future planning programmes and for research priority.
1.3 Objectives
The following were the objectives of the study divided into two i.e. the general and the specific
objectives.
1.3.1 General Objective
To evaluate the impact of population growth rate at various space and time scales on the
provision of primary education in Nyamira.
1.3.2 Specific Objectives
The specific objective of the study thus will be to:
(a) Examine the population levels trends in Nyamira District in terms of fertility,
mortality, migration and age-sex structure.
(b) Analyze the relationship between primary school-age population versus primary
school going pupils.
(c) Relate the demand for educational facilities to the supply of such facilities. The
facilities which will be analyzed include:
i) school buildings
ii) trained teachers
Nyamira has adequate educational facilities (teachers, classrooms, textbooks, maps, charts etc).
The research also examined the pupil-teacher ratio in the district.
4
iii) teaching materials (maps, textbooks, charts, etc)
iv) teacher-pupil ratio
(d) To recommend appropriate policies to the government to enable future planning
processes.
1.4 Literature Review
A number of scholars in most cases relate the population problem in the developing countries to
social services such as health, food, education and shelter. But it is too surprising to note that a
few scholars have really focuses their attention on the effect of the population on education,
more so most of these studies that have been carried out are either based on global, regional or
some in urban areas which makes them fall short of an intensive analysis of the effect of
population growth rate on the provision of primary education in a rural society.
Bernard (1969) talked of population and education on a global scale. He addressed the
effect of population in developing countries where he indicated that rapid population growth rate
retards social and economical development. Bernard was then not specific on which social
aspect is more affected by rapid population growth rate.
Mehat et al (1970) relates the population problem with the educational decline in
developing countries. His argument is relevant to this study though it is not specific to any given
region. He covered a large frame hence making his argument too general when he said that
education’s viability is threatened by population pressure which can be realized in the
unprecedented expansion of facilities at all levels and in all branches of education in developing
countries. He further says that the educational budget in schools and colleges doubles with high
5

Abela (1971) argues that there is need for planning for provision of educational
institutions inorder to reverse space (cited in Cantrelle 1971:383). He focused his idea on the
expected school-age population size, density in different areas within a region and the expected
number of classes and class size. He concludes that the growth rate of urban population is very
fast and has inescapable consequences for the distribution of schools. In his argument he only
bases his study in urban areas and does not talk about rural areas meaning that there is a need for
a research in a rural place in order to note the problems of population growth on the distribution
of schools.
Jones (1971, 1975) indicates the problem in expanding education and relates it with
demographic problems. He argues that fertility decline results in educational attainment. He
therefore asserts that high rates of population growth are barriers to the attainment of the goals
set for quantitative and qualitative expansion of education. Jones however cites poor physical
facilities, poor trained teachers and irrelevant courses as a common feature of less developed
country schools. He argues that to raise educational facilities and quality means: the increasing
of the cost per student. This is because of the upgrading of the pay scales for teachers; increase
the proportion of teachers who are fully qualified; supply more and better teaching aids and
laboratory equipments. Jones appears to be more concerned with the improvement of
educational facilities and fails to explain how demographic trends relate to the provision of
primary education.
Eduardo (cited in Population Basic orientation 1972:254) in his survey done in Latin
America assessed the effect of demographic characteristics on educational development. In his
enrolment in developing countries. This has made it hard for most countries to cope with the
ever swelling numbers of children and young people waiting to be educated.
6

he foresaw a situation where Latin America countries, despite their effort to reduce
fertility will have a problem of attaining educational development before the year 2000.
Eduard’s arugment relates to the current survey. However, he does not outline the plans that will
be used to curb the problem. Furthermore, his findings might be irrelevant to the present study
area.
Chau (1972) emphasized the importance of population expansion in contributing towards
increased educational costs. In a study done in Ceylon, Columbia, Tanzania and Tunisia, Chau
noted that considerable efforts will have to be made in order to improve education under
conditions of rapid population growth. He further argues that a slow-down in the growth rate of
the young population and an increase in population of working age could diminish the economic
crisis faced by many schools in developing countries and will also encourage the establishment
of universal primary education.
Stamper (1973) looks at the changing age distribution as affecting both the demand for
education and the capacity of a society. He argues that developing countries are characterized by
high levels of fertility and infant mortality is drastically declining hence a very young age
structure that is very powerful. He therefore asserts that under the above situation, the size and
proportion of the population in the school age groups are increasing rapidly. He further sees a
situation being chaotic in the future if proper planning will not take place. Thus he concludes
that in order to maintain satisfactory standards of education the number of teachers and schools
must be tripled. Stamper has explained the general problem but he has not shown how different
levels of education are affected by the demographic trends. Furthermore, he is not specific to
any region; he covers a wide frame of references and hence lacks comprehensive results.
projection
7
Hallack (1977) and Gould (1978) talk only on the distribution of population in relation to
the distribution of schools. They do not evaluate the effect of rapid population growth on
education. Their argument is geared towards achieving a closer merger between school
distribution which can only be realized in the equality of access to education, particularly where
there is no universal enrolment in which priority should be given to satisfying the educational
needs for the poor as a fundamental approach to development planning.
World Bank Educational Sector Policy Paper (1974) emphasizes the appropriate location
of educational facilities which is noted as a simple but effective particularly for lower levels of
education where physical proximity is a major factor for determining enrolment. This paper has
not shown the relationship between demographic trends and school enrolment. Instead, it only
evaluates the ways to equalize educational facilities.
Nepal (cited in Population and Planning 1981:35) noted the projected number of children
at the primary level is very worrying. He therefore stated that if the estimated growth of
population were to take place, it would be more difficult to fulfill the increasing needs in the
field of education. Nepal’s argument is similar to the current study. However, he covered a
wider geographical area.
Richard and Farooq (1984) noted the size and growth of the school age population which
ranges from 6-15 has been the most obvious factor determining educational requirements. They
argue that the size of the school-age population actually enrolled in school is an indicator on how
serious the problem of out of school drop-outs are. This means the actual population age 0-6
years determines the potential school enrollment. They argue that fertility changes either put
pressure on potential educational facilities or reduces it. To them the spatial distribution of
population is an important factor in determining the location, concentration and the type of
8

educational facility to be provided. They thus conclude that educational planners should for their
part be aware of the role of education in affecting demographic changes. Thus in planning for
primary education an effort should be made to ensure that enough teachers are available to
accommodate an upward trend in school enrolment. This literature appears relevant to the current
study but would be even more relevant if the research would have referred to a small
geographical area.
Charles (1984) argues that the size of population is an important factor in determining the
form of the educational system. Some societies have not been able to provide more educators for
the greater numbers of children in each generation. He further argues that the three measures of
educational attainment shown include; school enrolment by sex, educational attainment and
literacy. He notifies us that the measures are not easy to achieve given high population growth
rate. Charles concludes that in developing world erratic growth increases the educational cost.
He thus argues that population size is not the major problem. The idea is the rate at which this
population grows. Charles’ argument is not comprehensive enough.
The above argument has the right direction on the present study in which case they have
shown out the problems of providing social service facilities in an area of high population
growth. However their literature focused only on developing countries in general and thus fails
to discuss the problem in particular countries. Some scholars are mainly concerned with the
economics of education and not population growth and its impact on education.
In Kenya the work which has been done has been concerned with making descriptions of
many kinds. In most cases people have been describing the structure of education (i.e. before
and after independence) so as to enable them make projections for future population trends in
9
order to plan for educational requirements. Several scholars have linked population processes
with education facilities but their analysis have loopholes that need to be discussed.
Ominde (cited in Shielfied 1966: 288-229) noted the structure of education in Kenya and
cautioned the educational planners on the continued burden of illiteracy resulting from raising
birth rates which leads to many problems in achieving the universal primary education. He
finally indicated that the quality of primary education is likely to fall especially in the rural areas
where there is lack of enough adequate staff.
In another contribution, Ominde (1971) analyzed the expected trend in primary school
population based on the then rates of population growth and educational expenditure. He noted
that educational planning in Kenya cannot be based on the need to provide places, to meet
demand with a rapid growth rate. Educational planners are then faced with the serious problem
of decline in education. He further said that educational planning should be supported by a
programme for moderation of the country’s high rate of population increase because the
accelerated growth rate would result in greater difficulties in providing free primary education.
In a later contribution which is more relevant to the present study but differs in scope and
approach Ominde (1984) analyzed the effect of population growth on economic development.
He said that rapid population growth rate results in the shortage of schools in Kenya and Africa
in general. He elaborated further and gave the tremendous importance attached to education in
which his major concern was on the impact of population growth on the provision of educational
facilities. He foresaw the changing age distribution or the dominance of youths in the population
as a hindrance to the capacity of a nation to meet the demand of educational needs. The rapid
population increase creates pressure on education leading to escalation of education expenditure.
10

Ominde’s argument is similar and can be applied in the current study but it is not specific and
lacks detailed analysis.
Meek (1971) studies the enrolment rates in both primary and secondary schools in the
mid 1960’s and asserts that the enrolment has been growing gradually because of high proportion
in the school age population. As indicated in his argument, 85% of the children who have
reached school age are likely to be enrolled in the next two decades despite the government of
Kenya’s efforts to improve education. Meek’s argument is not exploitative on the relationship
between population dynamics and school facilities.
Raju (1973) looks at the problem of high population growth rate as related to a lot of
wastage. She then emphasized the importance of educational planning to avoid wastage in terms
of high drop-outs, repetitions and poor educational content. She further noted a general
behaviour in Kenya in which the projected enrolment also exceeds the actual enrolment because
of the fast rate of population growth. Raju’s argument is particularly based on population growth
on educational facilities and this shares some similarities to the current study but she has
analyzed different areas and furthermore never gave any specific example.
Kinyanjui (1974) noted that equality of educational opportunity is an important social
goal and contributes significantly to the overall process of development. He therefore indicated
that the existing educational resources and opportunities should be distributed as equitably as
possible to all the people in the country irrespective of where they reside. There is a desire for
equitable distribution of educational facilities among the Kenyans but surprisingly the desire is
not achieved more so when the equal distribution is not accompanied by the perception that an
equal important change is needed in the quality and content of education to be shared.
11

Kinyanju’s *dea appears too pressing to many educators in Kenya. He continued to emphasize
on the disparities seen on the provision o f education in Kenya in terms o f teachers distribution
between urban areas and rural areas where he noted that the uneven distribution in terms
qualified teachers have a significance in terms o f quality o f education provided in urban and
rural areas. This can be portrayed by the number o f pupils who pass the certificate o f primary
education exams.
In a later contribution, Kinyanjui (1977) gave almost a similar argument as that of 1974
in which he discussed about the inequalities of education facilities but went further to give the
causes of inequalities which he attributed to the colonial era. He therefore identified and
discussed the causes of educational inequalities in the provision of education resources and
opportunity at the primary school level. His argument was based on types of schools and
teachers qualification in different districts and major urban centres of Nairobi, Mombasa,
Kisumu and Nakuru. Kinyanjui’s arguments fail to show us the contribution of the rapid
population growth rate in affecting educational facilities in rural areas.
Masavivu (1981) noted that education in Nairobi is faced with problems in spite of all
efforts to improve the situation. She links the problem in Nairobi as those associated with high
population growth. She argued that the demand for primary education will continue to increase
during the next one or two decades if the population of Nairobi will not slow down, that no more
than 86% of the children aged 6-12 years in Nairobi will be enrolled in school if the situation
will not change. The proportion may even decline given the problem of resource constraints in
terms of space and funds. Much more would be achieved in coverage if birth rates were to be
reduced and effective measures taken to curb the influx of migrants. The future growth of school
enrolment ration will therefore be determined by the government policy regarding population
12

increase and the means of financing primary education in large areas such as Nairobi. Her work
is similar to the current problem because it deals with population growth rate and its effect on the
provision of primary school education. Her study differs with the current one in terms of the
scope and region.
Oucho et al. (1986) argues that planning for primary education in Kenya is hard because
of the rapid influx of school-age population into primary schools. He notes that most people are
caught unprepared in terms of building equipments, school places and teachers. He links the
problem to the current education system (8.4.4) which he argues will not meet its objectives
because of shortage of educational facilities. He concludes that pressure is exerted on the
existing facilities and hence education in Kenya has ended up consuming much of the
governments budget. Oucho’s argument looks logical but has a bigger frame of reference and
hence lacks specific detailed analysis.
Juha (1989) has analyzed the interrelationship between demographic factors and the
provision of primary education in Kenya. He has noted the problem of rapid population growth
and the expansion of primary education. He realized that population growth outpaces the
possibilities of further expansion in primary education; that with the current economy there Are
insufficient resources to cater for the educational requirements of the rapidly increasing numbers
of school-age children. He further identified the inequalities existing between regions in Kenya
in terms of teachers and facilities. He noted that the better off centrally located areas of the
country and areas in the vicinity of the large town would be able to cope with the situation
because of better facilities. He concludes that to have quality and quantity education in future
the country must adopt an integrated approach to the problem. Accordingly it is also important
for Kenyans to mix family planning and societal factors in order to reduce fertility. His
13
argument appears similar to the current study. However, Juha dealt with a wide scope and made
a lot of generalizations.
Nyaora, W. (1990) in his dissertation argues that the distribution of educational facilities
corresponds with that of population which is uneven. He thus says that the use of educational
facilities differs accordingly from one region to another depending on such factors as regional
monthly household levels, population density of school age children, human perception of the
concept of education and the prevailing economic activities. Nyaora has only touched on
population distribution and its relationship on the educational facilities, he does not explain the
impact of population growth rate on education facilities which is the essence of this study.
In the most recent comment on educational facilities in the district, it is revealed that
Nyamira’s educational facilities are over-utilized (district development Plan, 1994), the plan
attributes the over-utilization of such facilities to population density of the area. The
development plan seems to have a positive relationship to the present study, but it lacks a
detailed analysis of the whole impact of population growth rate on educational facilities in the
District. Further, the scope of this study differs from the one given in the development plan.
The above literature shows that scholars dwell more on the economic aspect as related to
education and fail to link the problem with the demographic trends. In cases where demographic
factors are mentioned, emphasis is laid on the whole country or urban areas. Few studies have
been conducted in the rural areas. The current study has taken a scope and a frame of reference
that is somewhat different from those (scopes and references) of other studies.
14
1.5 Theoretical and Conceptual Framework
This section attempts to provide a conceptual model for this study. The model is based on
population theories formulated by the classicists and neoclassicists. Such theories include the
Malthusian theory of population growth rate on resources and the neoclassicist theories of Enke
(19600, Easterlin (1969, 1975, 1978, 1980), Mandishona (1987), Repetto (1987) and Sai (1988).
Economists have also tried to come up with theories which explain fertility and resources,
for instance, Enke (1960) shares with Malthus a belief that there are inherent limitations on the
resources that a nation or a family can marshall for its economic well being. Given these
constraints, any rational family will want to limit the number of children to the number that is
consistent with maintaining a reasonable standard of living in the face of these constraints (Enke,
1960). Within this framework, children can be a source of poverty if they dilute a fixed or
relatively inelastic income. The neo-malthusian differs from Malthus in believing that
contraception and not delayed marriage is a possible way to reconcile a family life with limited
resources. Enke’s theory actually relevant to the present study and can be applied because it
essentially talks about high population affecting the economy, however, Enker only fails when
he talks about population growth rate with the economy in a general way and he appears not
specific.
Another possible theory that can apply here include Easterlin theory. Easterlin (1969,
1975, 1978, 1980) developed a micro economic theory of fertility. In this theory, Easterlin gives
a number of factors involved in fertility decisions as being biological factors, differences in
tastes, and in his specification he gave the relationship between the demand for children and the
supply of children. Easterlin argues, then in his theory that parents face a budget constraint and
children are assumed to have a price. Central to his concern is the integration of the “biological”
15
constraints on fertility (supply) and the choice constraint families face (demand), i.e. economy
that determines the natural fertility of the population and defines the upper limit of family size.
Easterlin used these two concepts o f supply and demand to explore a number o f different
equilibrium solutions for the individual family and for the society as it moves from the situation
of excess demand to that o f restricted fertility. Thus, his model is quite consistent to the current
situation in terms of the demand and not very clear on the supply.
One major problem of the theory is that Easterlin does not address himself to the issue of
preference. Preference in most cases incorporates socio-economic characteristics such as the
origin and education. The two variables are therefore essential in determining family size. This
alone makes us disqualify Easterlin from the centre of my framework. Furthermore, Easterlin
does not give the influence of fertility on the educational attainment.
Educationalist also have theories which explain population and human resources.
Education is one of the most persuasive factor influencing fertility control behaviour (Cochrane,
1979, 1983). Formerly, education tends to reduce the demand for children by shifting tastes in a
manner unfavourable to children and decreasing the price of goods relative to children (Lindert,
1983). With regard to the relative price of children, if better education improves the income
earning possibilities of women, then the alternative cost of the mother’s time required in child
bearing is increased while some offset to these may be available, for example through the help of
other members or domestic workers, there is probably some net positive effects on the cost of
children and thus a tendency towards a reduction in the demand for children. In addition,
compulsory education may increase the relative cost of children by reducing the possible
contribution to income.
16
In all countries and all areas, fertility follows changes in the demand for children by
consideration of both economics and tastes. Fertility fails to fall in the earlier phases of most
country’s development, and falls thereafter for a straightforward reason. The relative costliness
of extra children fails to rise until advanced stage in development. Therefore it appears that the
fertility transition parallels the long-term pattern of children and benefits (Lindert, 1983, pp. 495-
496).
Lindert therefore gives the taste for children as being the intensity of the desire to have
children relative to goods which is affected negatively by education of the parents because
children, and the life style associated with them are essentially an ‘old’ good, while education
presents an image of new life style competitive with children. The theory appears relevant to the
current study but cannot be applied because it does not give a detailed analysis on the impact of
population on educational attainment.
The father of population theory Thomas Malthus produced his theory in the 18th century.
In the theory he stated the effects of unchecked population on resources. He foresaw a situation
where rapid population growth will out space resources and hence leads to disaster. Since the
days of Malthus, there has been disagreement on the consequences of population growth on the
society as a whole. This is partly on ideological grounds but increasingly it has been dependent
on the analytical methods used in approaching the problem (Harvey 1975, McNicoll 1984).
Some scholars claim that a dense populations creates the conditions for technological
developments (Boserup 1965 and 1981, Clark 1967). Accordingly an increasing population
within a limited area provides incentive to replace natural resources by labour and capital, thus
stimulating innovations. The scholars use the overall population density of Africa as a partial
explanation to the continents underdevelopment.
17
On the other there are those theories which show population increase as a resource and
they then indicate that population increase can be seen as a resource only if is well trained,
healthy and in productive employment, thus satisfying its basic needs such as health and
education. Hence scholars argue that rapid population growth may make the resources limited
and in such a situation population becomes a burden.
Malthus’ theory holds water despite criticisms especially from the socialist scholars that
the population growth rate will not hamper resources and development. Several scholars have
however improved the Malthusian Theory.
One obvious effect of the rapid population growth rate is the resulting age-structure. This
affects schooling in two contradicting ways. First as the ratio of the dependants to workers
increases the total savings in the economy decreases thus hampering the investment in education
and in physical capital. Secondly, the number of children of school age increases rapidly
requiring more investment in educational facilities. Studies on the effect of population growth
on educational expenditures in developing countries verify clearly these effects.
Scholars like Jones (1975) gave a model which shows the effect of population growth
rate on education. He noted that with lower fertility there is a relatively fast effect on
educational system reducing wastage and drop-outs because it necessitates quality facilities and
hence quality education. He goes further by saying that high fertility affects the expansion of
education and hence lowers development. He argues that to raise education facilities means
increasing the per student cost and this cannot be realized in high population growth. However,
his model is not sufficient hence needs a small modification.
18

The above theories of population growth rate indicates that there is need to modify them
in order to have a concrete theory which can apply in a specific place. Jones’ model and Malthus
theory are relevant and can be used after a few modifications. Thus the theory in our reference is
that of Malthus and the model to used in this study is modified from Jones (1975). The model is
shown below.
19
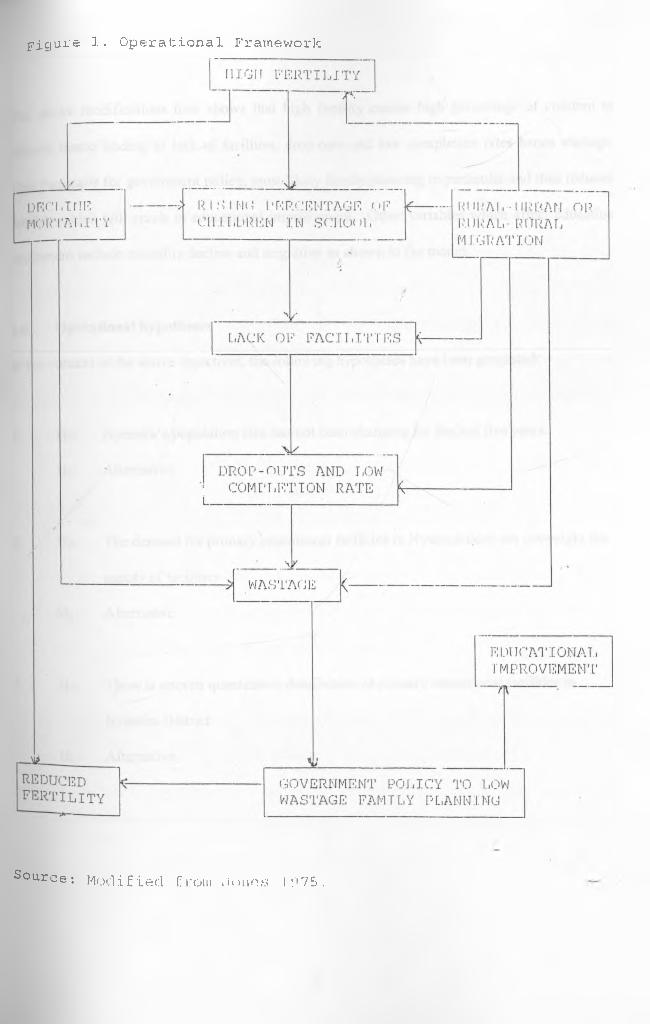
F i g u r e 1 . O p e r a t i o n a l F ram e w o rk
S o u rc e : M o d i f ie d from «ioun» I ;'i75 .
The above modifications then shows that high fertility causes high percentage of children in
schools hence leading to lack of facilities, drop-outs and low completion rates hence wastage.
This then calls for government policy, most likely family planning in particular and thus reduced
fertility which will result in educational improvement. Other variables which affect education
attainment include mortality decline and migration as shown in the model.
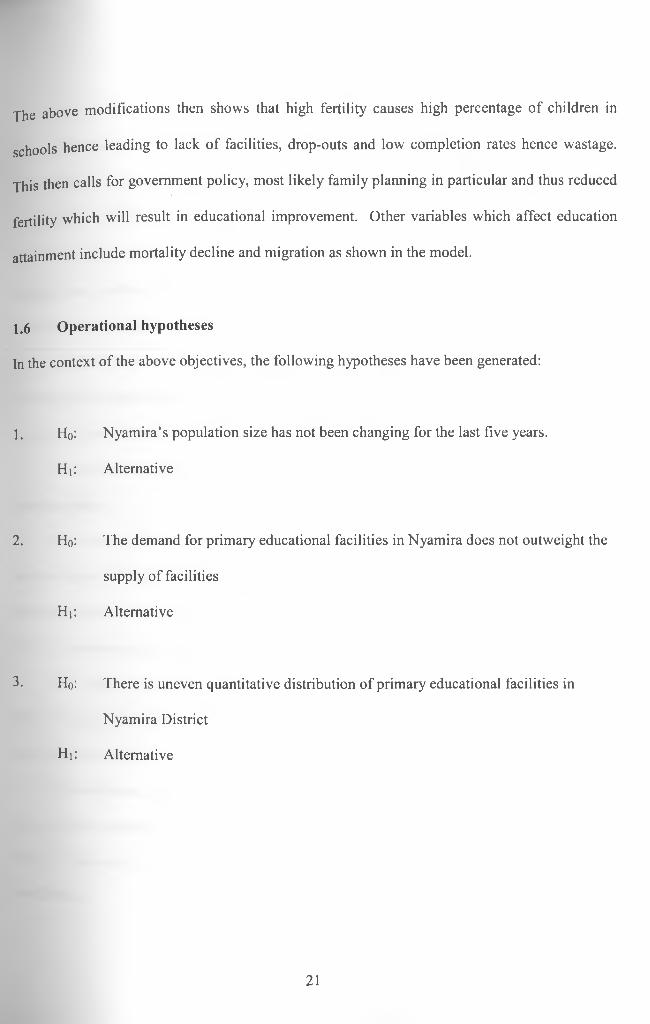
1.6 Operational hypotheses
In the context of the above objectives, the following hypotheses have been generated:
1. H0: Nyamira’s population size has not been changing for the last five years.
H,: Alternative
2. H0: The demand for primary educational facilities in Nyamira does not outweight the
supply of facilities
H,: Alternative
3. H0: There is uneven quantitative distribution of primary educational facilities in
Nyamira District
Hi: Alternative
21

17 Justification of the Study
The subject of the present study bears certain relationships to other studies conducted in Kenya
and elsewhere. However, few scholars deal with the effect of population on particular services
such as educational facilities. For instance Kinyanjui 1977, Ominde 1984 and Narman 1984
focused their analysis on the regional disparities in the point of political economy and policy
without taking into account demographic aspects and socio-cultural hindrances to education.
Some of the studies have wide frames of reference. They cover wider geographic regions
as compared to this study (Juha 1989, Oucho et al. 1986, Kinyanjui 1974). This study covers a
small geographic region for purposes of detailed analysis.
Other studies (Masavivu 1981) have been conducted in the urban areas hence differing
from this study.
The works of western scholars (Mehta et al. 1970, Jones 1975, Charles 1984) suffer from
the limitation of being irrelevant to the demographic background(s) of developing countries,
especially Kenya. Hence their findings and conclusions are neither representative nor conclusive
of the circumstances in Kenya and Nyamira district in particular.
The study area chosen (Nyamira district) is relevant on account of the fact that it is a
region of high population growth (3.1% per annum) which has put pressure on its social services
especially education.
In conclusion, it is noted that though the existing literature bears resemblance to this
study, other researchers’ frames of reference, scopes and approaches differ with those of this
study. This study addresses itself to a specified and unique geographic region and hence its
justification.
22
1.8 Scope and Limitations
The focus of this study is to identify the impact of population growth on the provision of primary
education in Nyamira district. The study covered 160 primary schools out of the 364 schools in
the district. This coverage was almost a half of the total schools in the study area. All the
schools would have been covered in the area but because of time and resource constraints, it was
not possible.
Financial constraints also limited the data collection because the study covered the whole
district. This means that many schools were not visited more than once for justification and
clarification. This occurred because of high transport cost and in some cases the research had to
walk long distances to reach some schools which was time consuming and tedious.
There was also the problem of cooperation from some heads of certain primary schools,
who made it very difficult to hold interviews with the researcher. This at times necessitated
visiting some schools a number of times to get the data. Some heads would not honour the
appointment and hence one would bounce them severally, this indicated time consuming and
resources hence it was hard to collect all the intended data.
There was also inadequate background materials that could be used for this study. In fact
very little research has been conducted in connection with the title and little literature existed.
Whatever has been written so far on this subject has tended to embrace a unit larger than or has
also tended to involve only urban areas. Thus in most cases secondary data was missing and the
one which was available lacked detailed analysis.
23

Data collection on AIDS/HIV proved the hardest because even the district medical officer
0f health (MOH) could not give the figures after even he was given the research permit. Much
of the data he provided were heresy, he did not have the records to extract the actual data on
AIDS/HIV in the district. Some data on fertility and mortality from the district office was
lacking. The only excuse given was that Nyamira is a new district and most of records remained
in Kisii district when the district was created in 1989. The data which was available dated back
to 1990.
Lastly, I thus intend to limit myself to the analysis of population growth on the provision
of primary education hence leaving out some factors. I find it necessary because today
population growth is a root cause of many problems related to social services in many
developing countries like Kenya.
Despite the above arguments it is believed that the findings of this study were enough to
give a comprehensive analysis in the case study and contribute positively in solving the problems
that face educational development in the district.
1.9 Definition of important Concepts
Concepts have been defined according to their usage in this study.
Primary education - is the lowest form of formal education in Kenya and refers to classes I -
VIII
Primary school-age population - refers to the numbers in the age-group 6 - 1 2 which is
regarded normal for primary education.
24

p„pil/rlass ratio - refers to the number of pupils per class.
pupil/teacher ratio - refers to the number of pupils per teacher.
Wpnva Certificate of Primary Education (K.C.P.E) - is examination sat for by pupils at the
end of class eight.
Enrolment ratio - is defined in the context of primary school-going in relation to school-age
population enrolled in various schools.
Drop-outs - refers to the pupils who leave school before completing the expected terminal level.
In this study it refers to a pupil who leaves primary school before completing the expected eight
years education.
Crude Birth Rate - is a ratio of total registered births to the total population in a specified year.
It is normally expressed as;
B-KP
Where:
B is the total number of live births registered during the year
P is the mid-year population of women in the age-group between 15-49
K is a constant, normally 1000
25
^gp-specific fertility rate - is the average number of births occurring to women in a given age
group. It is normally expressed as:
bi_KPi
Where:
bi is the total annual registered births in the age interval
Pi is the mid-year population of the women in the same age-group
K is the constant, normally 100
Total Fertility Rate - is the mean number of births occurring to a woman who lives to the end
of her reproductive life (15-49 years).
Crude Death Rate - is the ratio of the total registered deaths to the total population in some
specified year. It is normally expressed as:
D___ KP-
Where:
D is the total number of registered deaths
P is the total population
K is a constant
26
CHAPTER TWO
THE STUDY AREA
2.1 Introduction
This chapter examines various relevant aspects of the study area (Nyamira District). These
aspects relate to physical, economic, socio-infrastructure and population characteristics of the
study area. Regions, owing to their location and physical character seem to support certain ways
of life. The physical landscape and economical response exist always with man and his
particular abilities, desires, caprice which together determine the level of development in a
particular region (Anderson 1966, cited in Kenya Statistical Abstract 1974). An evaluation of
these characteristics is essential because they (the characteristics) have a lot of influence on this
study which is on. The given characteristics serve as background information which necessitates
a comprehensive analysis of the research.
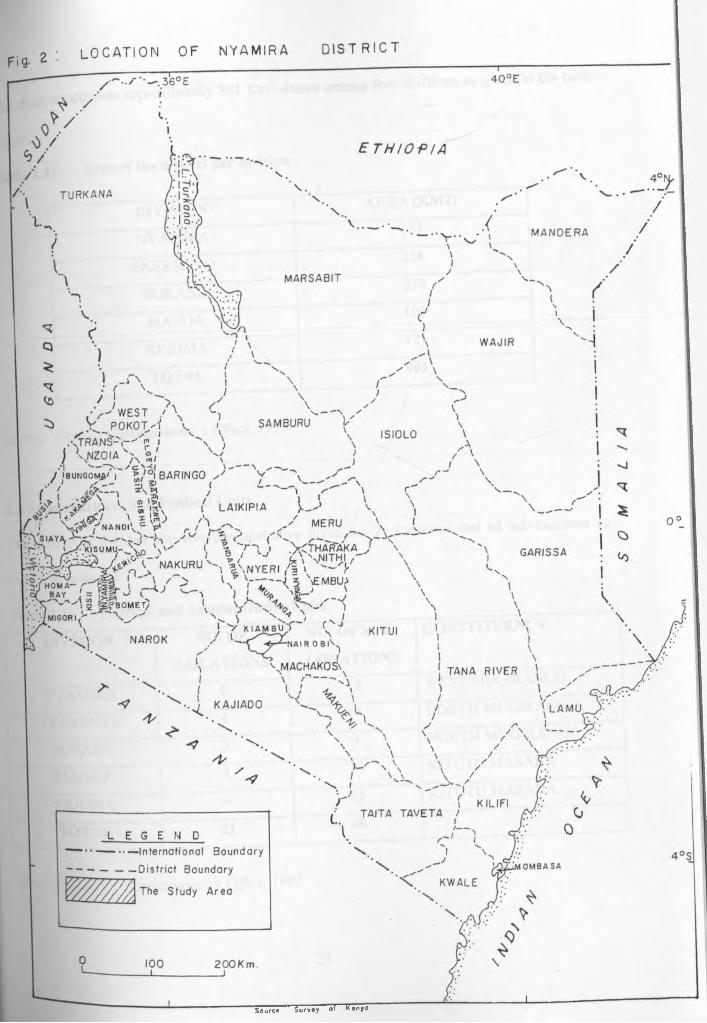
2.2. Location and Size
Nyamira District is one of the districts that make up Nyanza Province. It is a new district curved
from Kisii District in 1989. It borders Homa Bay to the north, Narok to the south, Kericho to the
east, Kisii to the west and Bomet to the south-east. The district lies between latitudes 0°45’ and
35°00’E (figure 2).
27
Source Survey ol Kenya
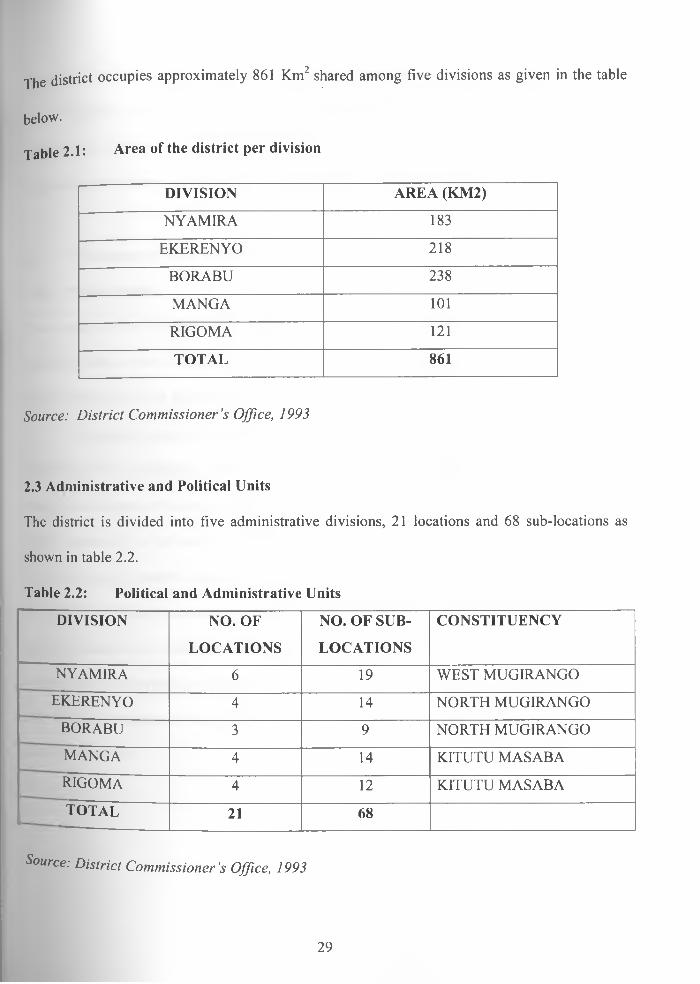
Table 2.1: Area of the district per division
The district occupies approximately 861 Km2 shared among five divisions as given in the table
below.
DIVISION AREA (KM2)
NYAMIRA 183
EKERENYO 218
BORABU 238
MANGA 101
RIGOMA 121
TOTAL 861
Source: D is tr ic t C o m m iss io n e r 's O ffice , 1993
2.3 Administrative and Political Units
The district is divided into five administrative divisions, 21 locations and 68 sub-locations as
shown in table 2.2.
Table 2.2: Political and Administrative Units
DIVISION NO. OF NO. OF SUB- CONSTITUENCY
LOCATIONS LOCATIONS
NYAMIRA 6 19 WEST MUGIRANGO
EKERENYO 4 14 NORTH MUGIRANGO
BORABU 3 9 NORTH MUGIRANGO
MANGA 4 14 KITUTU MASABA
RIGOMA 4 12 KITUTU MASABA
t o t a l 21 68
Source: D is tr ic t C o m m is s io n e r ’s O ffice , 1993
29
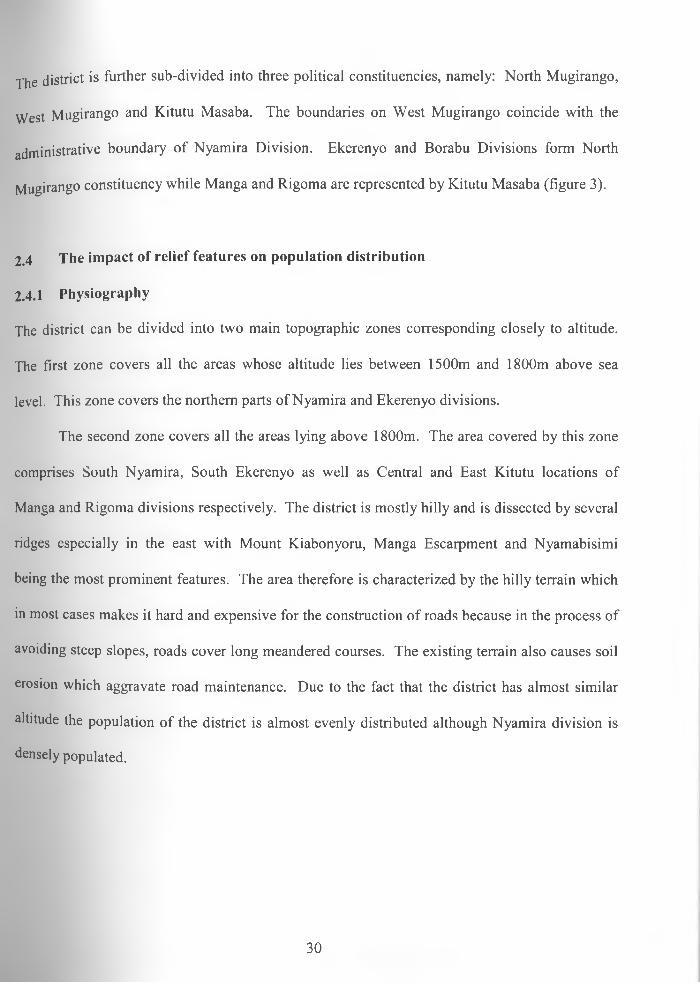
The district is further sub-divided into three political constituencies, namely: North Mugirango,
West Mugirango and Kitutu Masaba. The boundaries on West Mugirango coincide with the
administrative boundary of Nyamira Division. Ekerenyo and Borabu Divisions form North
Mugirango constituency while Manga and Rigoma are represented by Kitutu Masaba (figure 3).
2,4 The impact of relief features on population distribution
2.4.1 Physiography
The district can be divided into two main topographic zones corresponding closely to altitude.
The first zone covers all the areas whose altitude lies between 1500m and 1800m above sea
level. This zone covers the northern parts of Nyamira and Ekerenyo divisions.
The second zone covers all the areas lying above 1800m. The area covered by this zone
comprises South Nyamira, South Ekerenyo as well as Central and East Kitutu locations of
Manga and Rigoma divisions respectively. The district is mostly hilly and is dissected by several
ridges especially in the east with Mount Kiabonyoru, Manga Escarpment and Nyamabisimi
being the most prominent features. The area therefore is characterized by the hilly terrain which
in most cases makes it hard and expensive for the construction of roads because in the process of
avoiding steep slopes, roads cover long meandered courses. The existing terrain also causes soil
erosion which aggravate road maintenance. Due to the fact that the district has almost similar
altitude the population of the district is almost evenly distributed although Nyamira division is
densely populated.
30
F ig . 3 N Y A M I R A D I S T R I C T A D M I N I S T R A T I V E B O U N D A R I E S
HOMA B A Y
rl
s '
\ 'x\
)\\
(
\ NYAMIRA
(
Cy
/it\
MANGA
EKERENYO
"V
\
___i
Av
)
jl
f’
)
\ K E R I C H O
X(
\
I
\
• xl
" \
X RIGOMA
K I S I I XV
X .V
10 Km—i
BORABU
\\
\
\
\\
s
\
\
\/
//
r n ./
\ I
\ r
•jB O M E T
Source A dop te d f ro m 0 . 0 . P ( 1 9 9 4 — 9 6 )
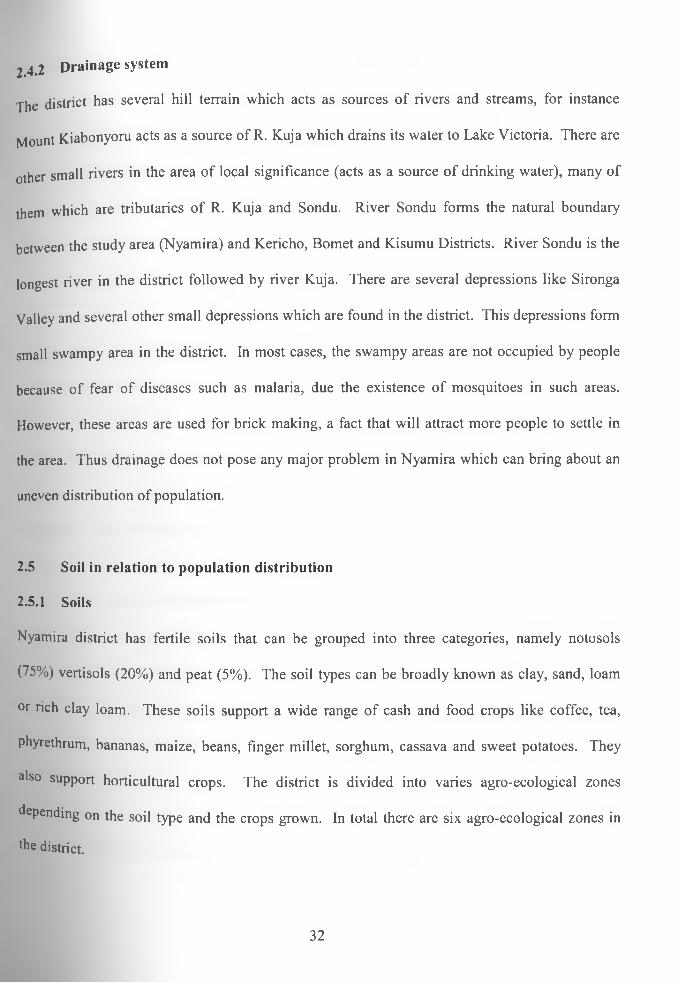
2.4.2 Drainage system
The district has several hill terrain which acts as sources of rivers and streams, for instance
Mount Kiabonyoru acts as a source of R. Kuja which drains its water to Lake Victoria. There are
other small rivers in the area of local significance (acts as a source of drinking water), many of
them which are tributaries of R. Kuja and Sondu. River Sondu forms the natural boundary
between the study area (Nyamira) and Kericho, Bomet and Kisumu Districts. River Sondu is the
longest river in the district followed by river Kuja. There are several depressions like Sironga
Valley and several other small depressions which are found in the district. This depressions form
small swampy area in the district. In most cases, the swampy areas are not occupied by people
because of fear of diseases such as malaria, due the existence of mosquitoes in such areas.
However, these areas are used for brick making, a fact that will attract more people to settle in
the area. Thus drainage does not pose any major problem in Nyamira which can bring about an
uneven distribution of population.
2.5 Soil in relation to population distribution
2.5.1 Soils
Nyamira district has fertile soils that can be grouped into three categories, namely notosols
(75%) vertisols (20%) and peat (5%). The soil types can be broadly known as clay, sand, loam
or rich clay loam. These soils support a wide range of cash and food crops like coffee, tea,
phyrethrum, bananas, maize, beans, finger millet, sorghum, cassava and sweet potatoes. They
also support horticultural crops. The district is divided into varies agro-ecological zones
depending on the soil type and the crops grown. In total there are six agro-ecological zones in
lhe district.
32

There is a Lower Highland Tea-dairy zone (LHI) which has well deep drained reddish
brown friable clay which has thick humic topsoil. The soil support tea growing and rearing of
cattle The Lower Highland maize-wheat/pyrethrum zone (LH2) has deep well drained soil
which range from dark red to reddish brown friable sand clays, these soils support growing of
wheat, maize and pyrethrum. The Lower Middle Sugar zone (LM1) has well drained dark red
friable clay which has thick humic topsoil, it has high potential for growing sugarcane. Lower
Marginal Sugar Zone (LM2), has shallow reddish brown loam gravel clay soils which support
the growing of soya beans, groundnuts and sugarcane. The upper middle zone (UMI) and the
upper midland zone (UM2-3) have soil ranging from dark red friable clay reddish brown, coffee
is mainly grown in UM2-3 while UMI supports the growing of both tea and coffee. It is
estimated that 30% of the total land is devoted to maize production and more than 60% of the
land is under food and cash crop production. Thus indicating that Nyamira’s land is very utilized
and hence there is possibility that population density can be high. Table 2.3 shows agro-
ecological zones available by division and by household. Figure 4 also shows the Agro-
ecological zones in the district.
Of the total 86100 hectares of land, 81800 is suitable for agricultural and dairy farming.
There are approximately 58670 small holdings with farm sizes ranging from 1.4 ha. to 2.2 ha.
The average size of holdings is generally around 1.8 ha. Due to fertile soils that favour a lot of
food and cash crop production, Nyamira district has a high growth rate which is 3.3% per
annum. This growth rate has made the area to be densely populated in which case the density is
515 persons per Km2.
Nyamira District is therefore composed of fertile soils which are evenly distributed in the
area hence giving almost a uniform distribution and density of population in the area.
33

T a b l e 2 . 3 : A g r o - e c o l o g i c a l z o n e a v a i l a b l e b y d i v i s i o n a n d h o u s e h o l d
In ‘000’ ha = sq Km In hectares
cation T.A S F O.R A.L Area in Agro-ecological zone Area per H
LH1 LH2 UM1 UM2 LM1 LM2 H P
Kitutu 43 3 - 8 32 11 ” 21 " “ 0.6 .1
Kitutu 92 - - 18 74 68 2 4 “ ” 1.3 .2
Dnge 87 - “ 18 69 20 “ 49 ■ ” “ 1.1 .2
irabu 238 2 2 24 212 43 ” ” ” “ “ 4.6 .6
Mugirango 183 “ 36 147 104 3 40 “ " ” 1.2 .2
Mugirango 218 3 44 171 60'
92'
2.5 .3
Source: F a rm M a n a g e m e n t H a n d b o o k o f K e n y a vol. 2 P a r t A, W estern K e n y a 1985
Notes:
S is steep slopes
F is Forest, Lakes and Swamps
OR is others; roads
AL is agricultural land
LHlis Lower Highland tea-dairy zone
LH2 is Lower Midland maize-wheat/pyrethrum
UM1 is Upper Midland coffee-tea zone
UM2 is Upper coffee zone
LM1 is Lower Midland sugar zone
LM2 is Marginal sugar zone
34

2 6 Climate in relation to population
2.6.1 Rainfall
The district receives high and reliable rainfall which is well distributed throughout the year. The
rain is received in the long and short rain seasons. The long season starts in March to June while
the short rains are received in October to December. The dry season is experienced in December
and January. Most of the rainfall is received in April when over 300 mm is recorded while least
precipitation is received in January and August (100 mm). On average the district receives an
annual rainfall of 2000 mm (see Table 2.6).
UNIVERSITY OF NAIROBI EAST AFRICANA COLLECTION
35
i-iU t/Q M EMORI ALL I & H a R V

(K-.

Table 2.4: Mean Monthly Rainfall (mm) for 1989-1992 period
^Month 1986 1987 1988 1989 1990 1991 1992
"January 48.0 227.7 176.8 05.9 98.9 149.8 62.3
February 72.4 145.5 91.6 118.6 192.3 136.6 104.3
March 171.5 90.1 251.3 251.3 242.8 98.3 127.3
April 366.9 109.2 312.0 233.0 286.1 166.3 192.9
May 210.6 199.6 63.8 239.0 147.4 121.7 118.7
June 74.4 252.6 189.5 108.6 93.8 201.0 170.9
July 120.2 240.1 76.5 59.7 172.6 64.1 150.1
August 55.7 172.2 182.1 266.4 157.8 129.1 96.2
September 105.9 167.6 218.8 192.2 113.5 141.6 154.4
October 160.1 206.1 120.0 163.4 78.8 111.8 188.3
November 120.1 267.7 165.3 226.5 111.8 84.6 86.1
December 181.7 41.2 09.4 75.3 139.7 53.1 123.7
Total 11672.5 1329.0 1987.0 1986.7 1926.7 1926.7 1575.2
Source: D is tr ic t A g r ic u ltu ra l O ffic e - N y a m ira ; S ta tis tic a l A b s tra c t 1 9 8 9 -1 9 9 0 issu es
Though the district receives high rainfall, the actual amount received in the long rain
season has been declining as shown in Table 2.4, however, the amount received is adequate for
fanning activities.
Therefore the rain season are extended to a more or less continued period of water
availability. Annual rainfall is not only high, averaging 1200-2100 mm but also reliable (1100 —
1750 mm reached in at least six out of ten years). The rainy seasons of the year are not easy to
distinguish because there are no real dry seasons in between. The first rain starts at about middle
°f February and the second one starts in August (Nyamira District Office 1989).
37
The high and reliable rainfall received promotes a wide range of agricultural activities
which has made the district agricultural producer in the country. It also enables good health to
the inhabitants who are well fed through the agricultural produce and thus favouring high fertility
rates in the study area.
2.6.2 Temperature
The district does not experience extreme temperature variation largely due to its altitude. The
minimum temperature are 10.1 °C while the average daily temperatures are 19.4HC. Table 2.5
shows mean long term monthly temperatures in the district for 1985 - 1992.
The table indicates that high mean maximum temperatures recorded in 1985-1992 was
27.1°C, while the lowest was 24.3°C. The lowest mean minimum monthly temperatures
recorded over the same period was 9.7°C. The variation in both mean monthly maximum
temperatures was therefore minimal and ranged from 2.2°C to 2.7°C in the same period. The
cool temperatures promote the growing of cash crops, like tea, coffee, pyrethrum as well as food
crops like maize, beans and millet. Such temperatures, in most cases, does not favour mosquito
existence, however this does not mean that they are non-existence in the district. The presence
of moderate temperatures has made many people in Nyamira to have a permanent settlement in
the area, the fact that has promoted less out migrations in the area. Therefore there is high
population growth experienced in the area. This is because less migration promotes traditional
norms and the inhabitants are only exposed to their traditions which in most cases favour high
fertility.
38
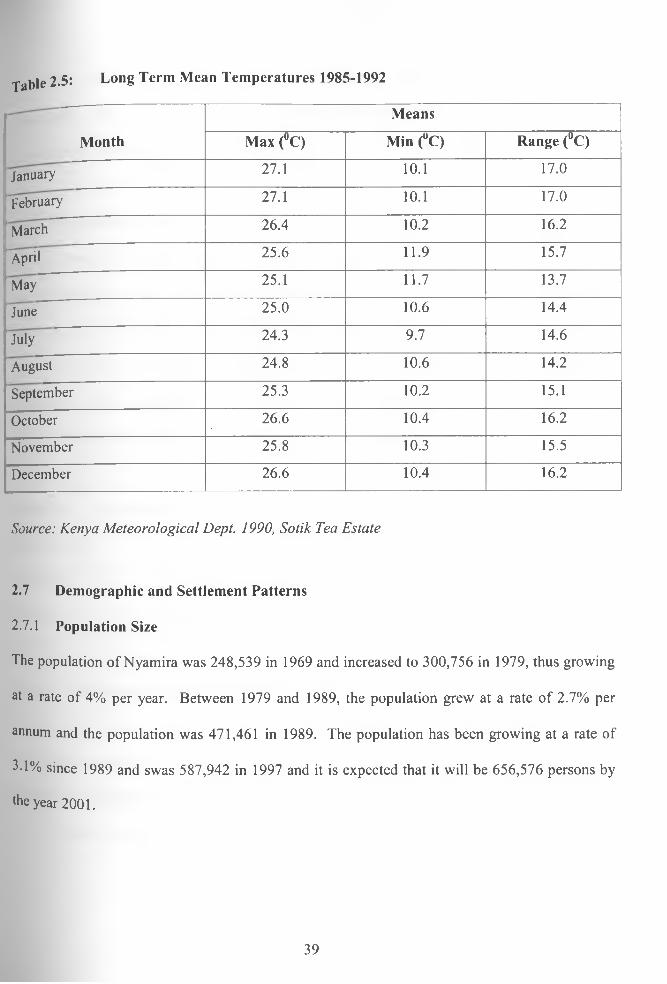
fable 2.5: Long Term Mean Temperatures 1985-1992
Month
Means
Max (°C) Min (°C) Range (°C)
January 27.1 10.1 17.0
'February 27.1 10.1 17.0
March 26.4 10.2 16.2
"April 25.6 11.9 15.7
May 25.1 11.7 13.7
June 25.0 10.6 14.4
July 24.3 9.7 14.6
August 24.8 10.6 14.2
September 25.3 10.2 15.1
October 26.6 10.4 16.2
November 25.8 10.3 15.5
December 26.6 10.4 16.2
Source: K en ya M e te o ro lo g ic a l D ep t. 1990, S o tik Tea E s ta te
2.7 Demographic and Settlement Patterns
2.7.1 Population Size
The population of Nyamira was 248,539 in 1969 and increased to 300,756 in 1979, thus growing
at a rate of 4% per year. Between 1979 and 1989, the population grew at a rate of 2.7% per
annum and the population was 471,461 in 1989. The population has been growing at a rate of
Ll% since 1989 and swas 587,942 in 1997 and it is expected that it will be 656,576 persons by
the year 2001.
39
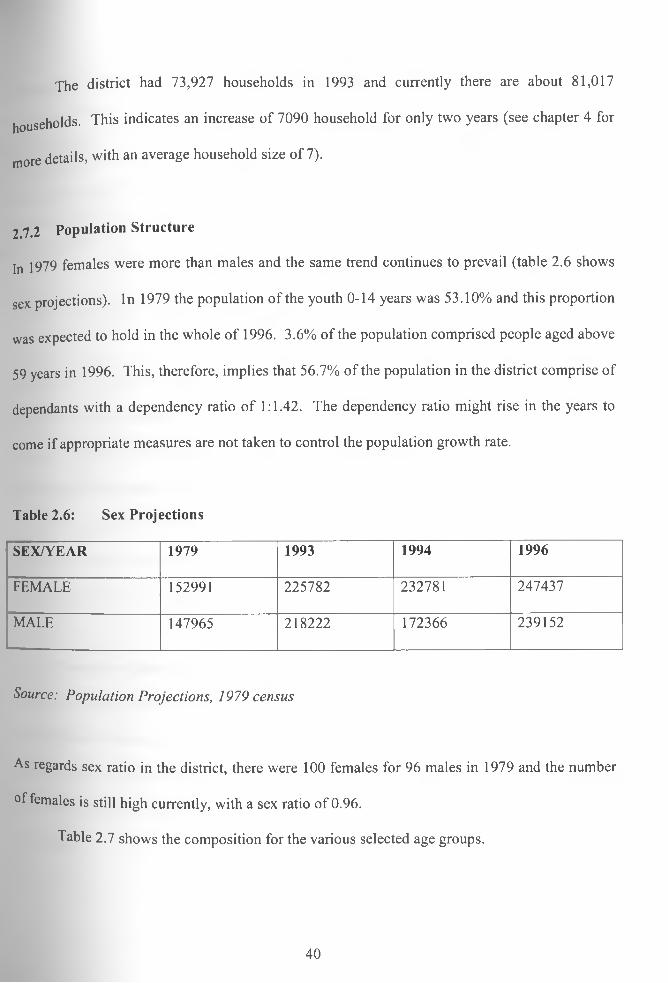
The district had 73,927 households in 1993 and currently there are about 81,017
households. This indicates an increase of 7090 household for only two years (see chapter 4 for
more details, with an average household size of 7).
2 . 7 . 2 P o p u l a t i o n Structure
In 1979 females were more than males and the same trend continues to prevail (table 2.6 shows
sex projections). In 1979 the population of the youth 0-14 years was 53.10% and this proportion
was expected to hold in the whole of 1996. 3.6% of the population comprised people aged above
59 years in 1996. This, therefore, implies that 56.7% of the population in the district comprise of
dependants with a dependency ratio of 1:1.42. The dependency ratio might rise in the years to
come if appropriate measures are not taken to control the population growth rate.
Table 2.6: Sex Projections
SEX/YEAR 1979 1993 1994 1996
FEMALE 152991 225782 232781 247437
MALE 147965 218222 172366 239152
Source: P o p u la tio n P ro jec tio n s , 19 7 9 c en su s
As regards sex ratio in the district, there were 100 females for 96 males in 1979 and the number
°f females is still high currently, with a sex ratio of 0.96.
Table 2.7 shows the composition for the various selected age groups.
40

Table 2.7: Population of selected age groups and sex
Xgegroup/sex
l4:r7(SECONDARY)
1979
M
49602
19033
48658
20740
1994 1996
M
79954
22172
105523
31536
M
110933
30763
112166
33122
j54f(FEMALE) 64687 98359 104554
labourforce 120144 182174 193466
Source: P o p u la tio n P ro jec tio n s , 1 9 7 9 c en su s
As indicated in table 2.7, the primary school going population has been increasing in the past and
the same trend is expected to increase to 146,633 by the year 2001. This calls for increased
primary, secondary and post-primary training institutions. Over the years primary school age
population will continue to rise thereby requiring more facilities.
The expected increase in the number of women of reproductive age (15-49 years) in the
1994-1996 period created pressure on existing infrastructure and increased dependency burdens
on parents and the working population.
2.7.3 Population Distribution and Density
Nyamira division had the highest totoal population by 1979. It was followed by the Ekerenyo
and Rigoma divisions respectively. By 1993, Nyamira division had about 30% of the district’s
total population while the least populated division (Borabu) had about 11%. Borabu division had
the least population because it is a settlement area with large farms which have not been
subdivided.
41
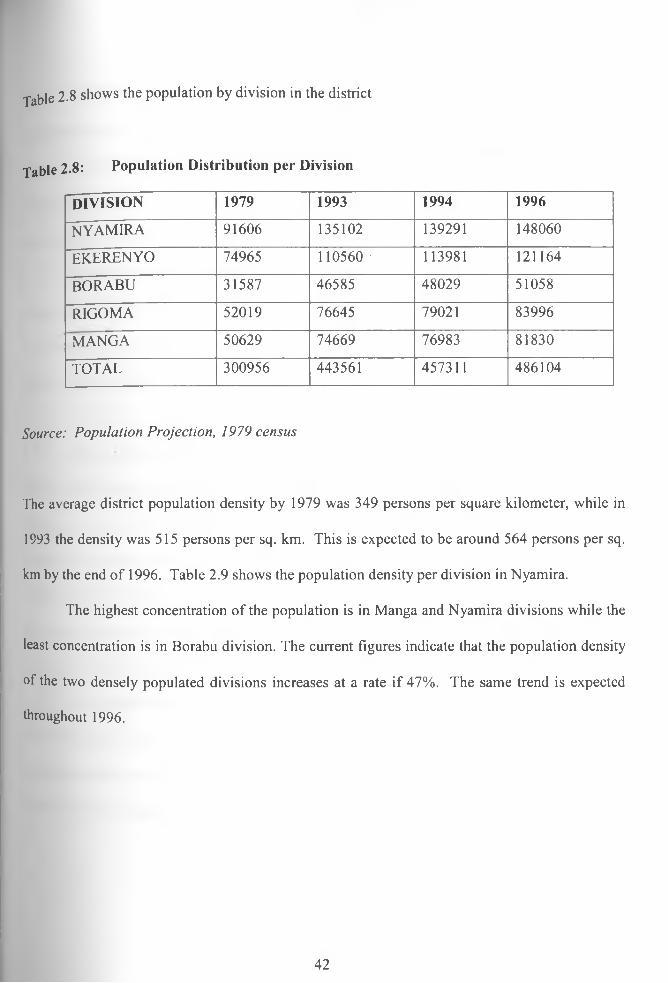
Table 2.8 shows the population by division in the district
Table 2.8: Population Distribution per Division
d i v is io n 1979 1993 1994 1996
n y a m ir a 91606 135102 139291 148060
EKERENYO 74965 110560 113981 121164
BORABU 31587 46585 48029 51058
RIGOMA 52019 76645 79021 83996
MANGA 50629 74669 76983 81830
TOTAL 300956 443561 457311 486104
Source: P o p u la tio n P ro jec tio n , 19 7 9 cen su s
The average district population density by 1979 was 349 persons per square kilometer, while in
1993 the density was 515 persons per sq. km. This is expected to be around 564 persons per sq.
km by the end of 1996. Table 2.9 shows the population density per division in Nyamira.
The highest concentration of the population is in Manga and Nyamira divisions while the
least concentration is in Borabu division. The current figures indicate that the population density
of the two densely populated divisions increases at a rate if 47%. The same trend is expected
throughout 1996.
42
2 7.4 M i g r a t i o n
population movements do not feature very prominent in Nyamira district. The high population
rowth rate has mainly been due to natural increase. The rural to rural movement within the&
district have been to the settlement area in Borabu division. The people who bought land and
have settled in the area were from Kisii and Nyamira Districts.
Occupational movement are common in the area. People migrate to other districts in the
country or to urban areas in search of employment and business opportunities. Quite a number
have bought property and have settled in places like Molo, Narok, Kitale, Migori and many other
places in the country.
2.7.5 Infant Mortality Rates
The infant mortality rates has been declining and this is expected to continue in 1996. The
decline is attributed to improved health care and immunization against the killer diseases.
Before the creation of the district in 1992, Kisii district had infant deaths of about 4,573 in 1988
which declined slightly to about 4,564 in 1989. The decline in mortality rate was 71.4 to 69.6
per cent respectively. Since Nyamira was curved out of Kisii district the figures can be taken to
represent Nyamira district.
The original Kisii district has a large proportion of stunted children due to low intake of
nutritious food. Low nutrition levels in the district is partly due to lack of balanced diet due to
■gnorance among the mothers. The nutrition aspect in the district is a major concern and most
mothers require education in order to encourage balanced diet.
43

, o S o c i o - e c o n o m i c I n f r a s t r u c t u r e2.o
welfare of the people is greatly influenced by the existence, access, distribution and
utilization of the socio-economic infrastructure in the district. Among the infrastructure,
educational facilities are most constrained and need more emphasis.
2.8.1 Health Status in the District
There are several health facilities in the district with one district hospital in Nyamira town, the
hospital has a modem facility which serves the whole of Nyamira district and some parts of Kisii
and Homa Bay districts. The hospital is over utilized because there are very few health centres
in the district which could ease the congestion at the hospital.
A number of health facilities such as Nyamusi, Manga, Amaterio, Igena, Itambe are
under utilized. This is mainly because these health centres lack essential components such as
staff, water, electricity, maternity wings and essential equipments. The problem is worsened by
poor roads which make the accessibility to these health facilities hard.
Most of the health facilities in the district are government owned. Nyamira district has
the highest concentration of health centres where a hospital and a maternity home is found.
Ekerenyo division has three health centres while Manga and Rigoma have one health centre
each. Borabu division has only dispensaries with five of the being under NGOs. Table 2.10
shows the health units and agents which maintain them. Fig. 5 also shows the distribution of
health facilities in the district. The Kenyan government maintains about 51% of the health
facilities in the district. 29% is under the NGOs while private facilities account for 21% in the
district.
44
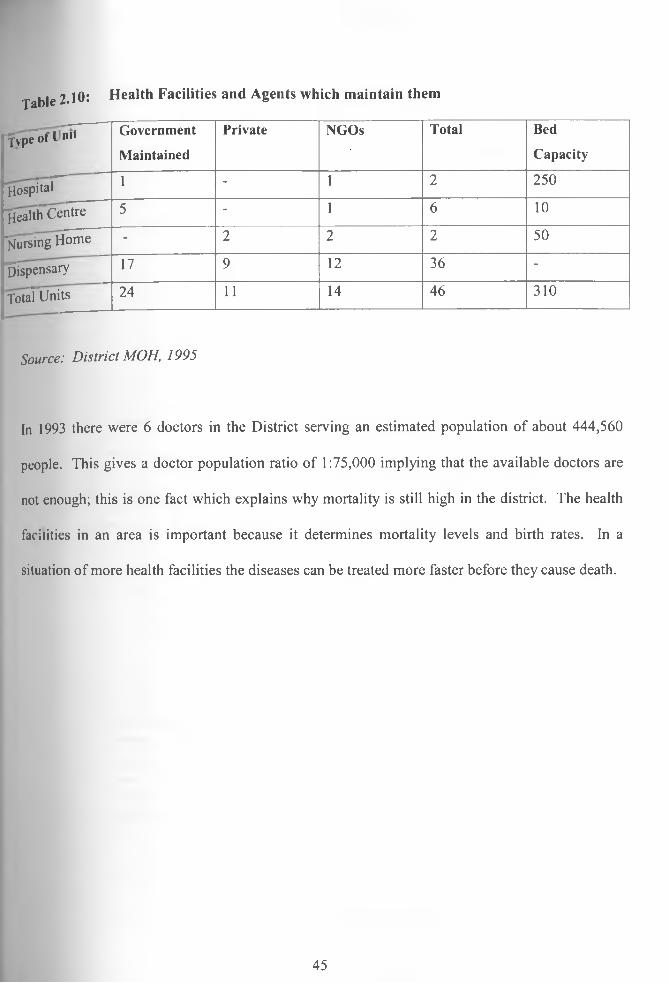
2.10: Health Facilities and Agents which maintain themTable
fypTofl n't Government
Maintained
Private NGOs Total Bed
Capacity
Hospital 1 - 1 2 250
'fleahlTCentre 5 - 1 6 10
’fjuiiingflorne - 2 2 2 50
dispensary 17 9 12 36 -
TotafUnits 24 11 14 46 310
Source: D is tr ic t M O H , 1995
In 1993 there were 6 doctors in the District serving an estimated population of about 444,560
people. This gives a doctor population ratio of 1:75,000 implying that the available doctors are
not enough; this is one fact which explains why mortality is still high in the district. The health
facilities in an area is important because it determines mortality levels and birth rates. In a
situation of more health facilities the diseases can be treated more faster before they cause death.
45
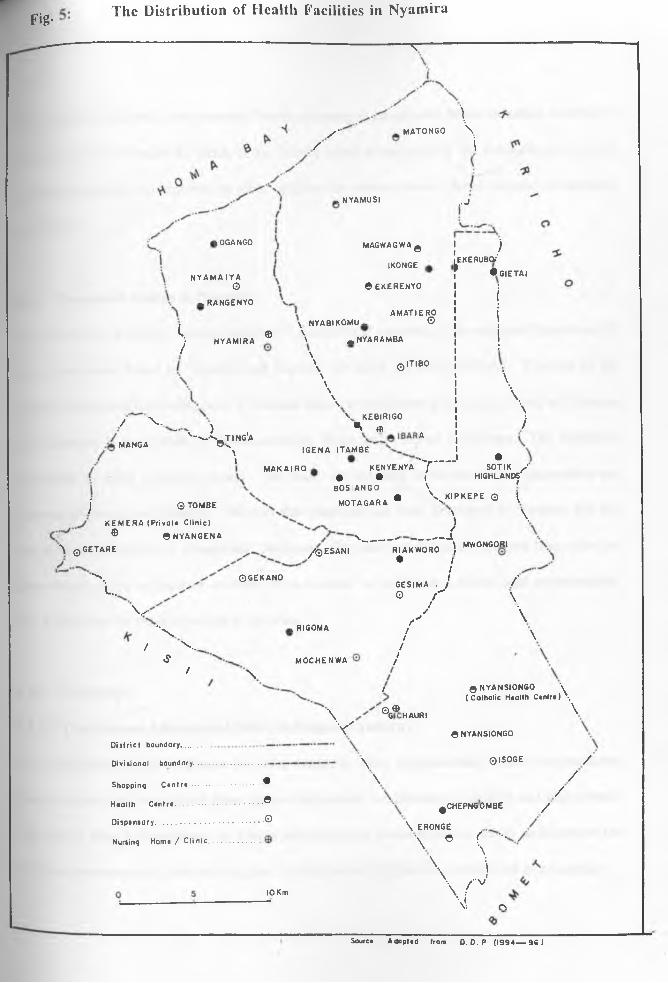
Fig-
<s-------
The Distribution of Health Facilities in Nyamira
/ ■/
\matongo \
i
IOGANGO
NYAMAIYA©
- RANGENYO
. NYAMUSI ..J
MAGWAGWA £
IKONGE (
© EKERENYO
EKERUBa'
c./'
NYAMIRA ©
/
MANGA
V— ) I
V-----•v.^TING'a
v \\
\ NYABIKOMU- \\ m NYARAMBA
\\\
\\
\\\
>■ KE8IRIG0 •>. ffi
AMATIERO©
q ITIBO
IGENA ITAMBE
)
• gietai
MAKAIRO
j ©TOMBE
KEMERA (Private Clinic)® ©NYANGENA
KENYENYA • •BOS I AN G 0
MOTAGARA *
^ q GETARE
'-si..
N------ -----------1
11 \11 \1 \11 j
A
•‘v — / SOT IK /
1 HIGHLANDS\ 1
\_K IP K E P E © ^
\}
\/
_______K/0 E S A N I
©GEKANO
V" \
/ v .>?
/
, RIGOMA
MOCHENWA
RIAKWORO j • I
IIGESIMA . J© r
/✓
r "/
//
//
\ MWONGORI
/ '
\
\
\/
\ ®G® HAURI
V
\
Q NYANSIONGO \ (Catholic Health Centre) \
\
District boundary,.............
Divisional boundary........
Shopping Centre
Health Centre................
Dispensary.........................
Nursing Home / Clinic.
\
© NYANSIONGO
QISOGE /
. •
. .©
. .©
\/
/
\
10 Km
^CHEPNGOMBE
\ ERONGE9 ( '''
\PV O
/
Source Adopted from D. D. P (1994— 96)
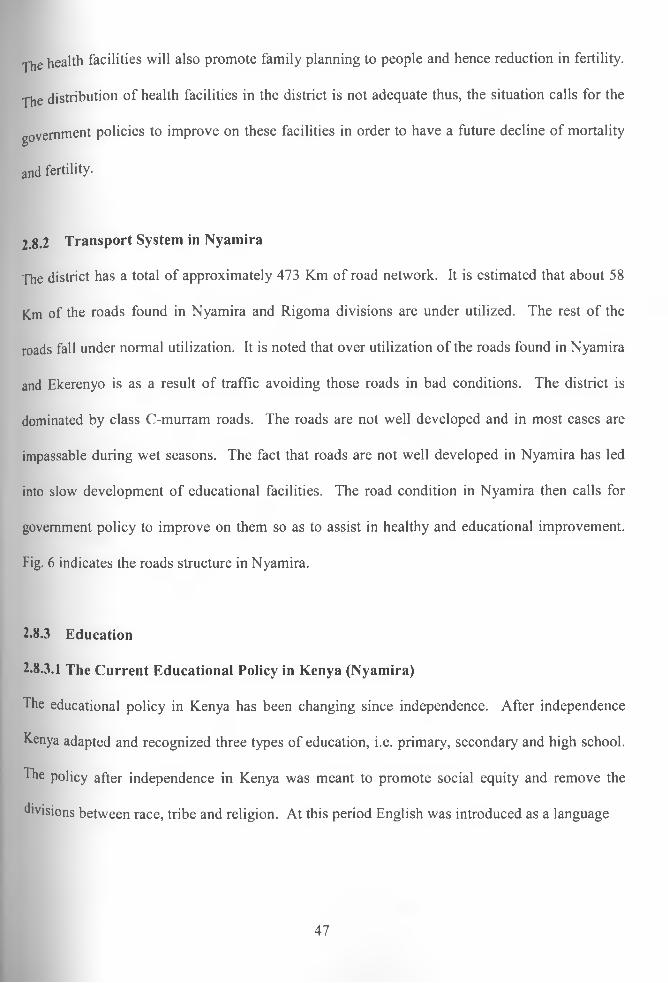
The health facilities will also promote family planning to people and hence reduction in fertility.
The distribution of health facilities in the district is not adequate thus, the situation calls for the
government policies to improve on these facilities in order to have a future decline of mortalityD
and fertility.
2.8.2 Transport System in Nyamira
The district has a total of approximately 473 Km of road network. It is estimated that about 58
Km of the roads found in Nyamira and Rigoma divisions are under utilized. The rest of the
roads fall under normal utilization. It is noted that over utilization of the roads found in Nyamira
and Ekerenyo is as a result of traffic avoiding those roads in bad conditions. The district is
dominated by class C-murram roads. The roads are not well developed and in most cases are
impassable during wet seasons. The fact that roads are not well developed in Nyamira has led
into slow development of educational facilities. The road condition in Nyamira then calls for
government policy to improve on them so as to assist in healthy and educational improvement.
Fig. 6 indicates the roads structure in Nyamira.
2.8.3 Education
2.8.3.1 The Current Educational Policy in Kenya (Nyamira)
The educational policy in Kenya has been changing since independence. After independence
Kenya adapted and recognized three types of education, i.e. primary, secondary and high school.
The policy after independence in Kenya was meant to promote social equity and remove the
divisions between race, tribe and religion. At this period English was introduced as a language
47
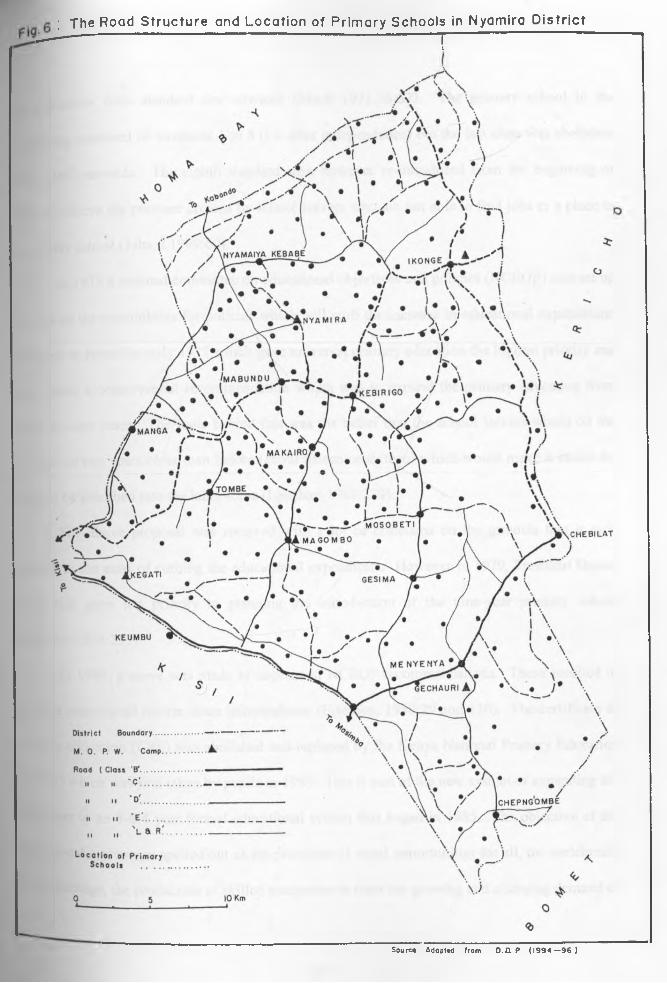
— ------------------------------------------------------------------------------------it; The Road Structure and Location of Primary Schools in Nyamira District
Sourco Adopted from D.D. P (1 9 9 4 — 9 6 )

0f instruction from standard one onwards (Meek 1971.36-37). The primary school in the
beginning consisted of standards 1 to 8 (i.e. after independence) but the last class was abolished
from 1967 onwards. The eighth standard was, however re-introduced from the beginning of
1985 to relieve the pressure created by school leavers who are not able to find jobs or a place in
secondary school (Juha, 1.1989:60).
In 1975 a national committee on educational objectives and policies (NCEOP) was set up
to explore the possibilities for policies which will curb the increase in educational expenditure.
It issued its report in early 1977 which gave universal primary education the highest priority and
even made a controversial recommendation which was to expand the primary education from
seven to nine years. The logic behind this was the belief that the school leavers would on the
average be two years older than before (about fifteen or sixteen) which would make it easier for
them to be absorbed into the labor force (Louchart 1981:279).
The above proposal was received with a lot of criticisms on the grounds that it runs
counter to the aims of curbing the educational expenditure. However in 1979, President Daniel
Arap Moi gave top priority to planning the introduction of the nine-year primary school
education (Ibid:285).
In 1984, a move was made to implement NCEOP recommendations. These resulted in
the first educational reform since independence (Eisemon, 1988:29 and 130). The certificate of
primary education (CPE) was abolished and replaced by the Kenya National Primary Education
(K.NPE) which was first taken by pupils in 1985. This is part of the new system of expanding the
education to an 8-4-4 year formal educational system that began in 1985. The objective of the
educational system are spelled out as the provision of equal opportunities for all, the enrichment
°f the heritage, the production of skilled manpower to meet the growing and changing demand of
49
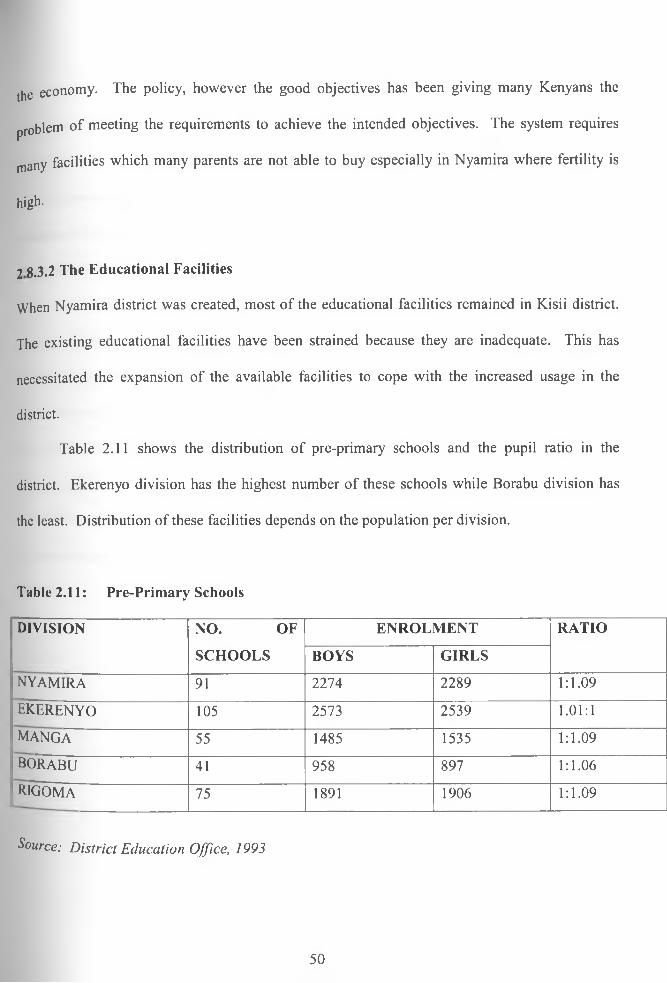
the economy. The policy, however the good objectives has been giving many Kenyans the
problem of meeting the requirements to achieve the intended objectives. The system requires
many facilities which many parents are not able to buy especially in Nyamira where fertility is
high-
2 8.3.2 The Educational Facilities
When Nyamira district was created, most of the educational facilities remained in Kisii district.
The existing educational facilities have been strained because they are inadequate. This has
necessitated the expansion of the available facilities to cope with the increased usage in the
district.
Table 2.11 shows the distribution of pre-primary schools and the pupil ratio in the
district. Ekerenyo division has the highest number of these schools while Borabu division has
the least. Distribution of these facilities depends on the population per division.
Table 2.11: Pre-Primary Schools
DIVISION NO. OF
SCHOOLS
ENROLMENT RATIO
BOYS GIRLS
n y a m ir a 91 2274 2289 1:1.09
e k e r e n y o 105 2573 2539 1.01:1
m a n g a 55 1485 1535 1:1.09
b o r a b u 41 958 897 1:1.06
k ig o m a 75 1891 1906 1:1.09
Source: D is tr ic t E d u ca tio n O ffice , 1993
50

There are a total of 364 primary schools in Nyamira. Ekerenyo and Nyamira divisions have
niore than 100 primary schools each. The distribution of primary school facilities shows a
similar scenario to that pre-primary schools. Other facilities such as workshops and home
science laboratories are distributed in the district according to the available schools. Table 2.12
indicates the number of classroom, workshops which are completed and the ones which are not
completed in the district.
Although the educational facilities are evenly distributed there are cases of inadequate
physical facilities such as workshops, labs, classrooms, etc. This is reflected in Table 2.12 above
which appears in terms of the number of these facilities required and those available. The
inadequacy of these facilities within some schools imply over-utilization of the existing facilities.
If is important to note that high population pressure on land renders future expansion of the same
facilities to be impossible. Many of the classroom in the district are not permanent classroom.
40% of the total classrooms are not permanent, 60% of the classrooms are permanent but not all
of them are complete. (A detailed analysis on population and educational facilities is given in
Chapter 5)
51
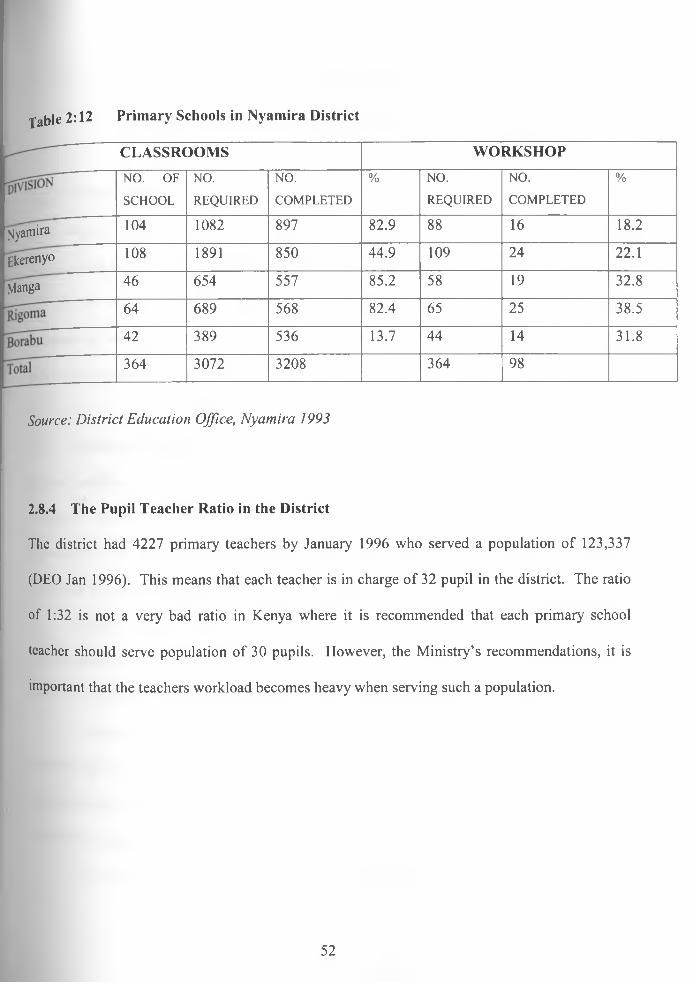
fable 2:12 Primary Schools in Nyamira District
CLASSROOMS WORKSHOP
NO. OF
SCHOOL
NO.
REQUIRED
NO.
COMPLETED
% NO.
REQUIRED
NO.
COMPLETED
%
fjyamira
Ekerenyo
Manga
104
108
46
1082
1891
654
897 82.9 88
850 44.9 109
557 85.2 58
16
24
19
18.2
22.1
32.8
64 689 568 82.4 65 25 38.5
42 389 536 13.7 44 14 31.8
364 3072 3208 364 98
Source: D is tr ic t E d u c a tio n O ffice , N y a m ira 1993
2.8.4 The Pupil Teacher Ratio in the District
The district had 4227 primary teachers by January 1996 who served a population of 123,337
(DEO Jan 1996). This means that each teacher is in charge of 32 pupil in the district. The ratio
of 1:32 is not a very bad ratio in Kenya where it is recommended that each primary school
teacher should serve population of 30 pupils. However, the Ministry’s recommendations, it is
important that the teachers workload becomes heavy when serving such a population.
52
CHAPTER THREE
METHODS OF DATA COLLECTION AND ANALYSIS
3 1 introduction
This chapter analyses various methodological aspects namely, experimental design, data
requirements for the study, and data collection as well as data analysis techniques.
It is important to note that research methodology is very essential in any research
undertaking because it explains how one conducts research (Prewitt 1974). Methodology also
guides one against self-deception.
3.2 Sampling Framework
In many studies it is very hard for a researcher to enumerate or examine the objects of the whole
universe. What is required in this case is the use of a sample frame. In this study the frame
consisted of all primary schools in Nyamira district. The sampling frame or population
contained all the divisions of the district from which the sample was drawn.
In order to get the sample from the population there was need to apply the principle of
'randomization’. The principle helps to average out the extraneous and bias factors that are
likely to be present in the working populatin (Clark and Hosking 1986).
A sample from all primary schools in each division in the district was drawn after
considering the divisions with high proportion of schools. It was thus important to have a
Proportionate number which was relative to each division’s total number of schools, there was a
big need for applying proportionate stratified random sampling.
All primary schools in the divisions were numbered randomly and using a table of
53

_cjoin numbers the schools were randomly chosen. The division with more schools had more
chances of being chosen so as to facilitate the element of proportions. The sample consisted of
j60 schools among the 370 schools in the district. This sample covered almost half of the total
number of schools in the district. Proportionate stratified random sampling is appropriate here
for it ensures that each unit of the working population has an equal chance of being picked or
selected. Therefore a random stratified proportionate sample frame of 160 schools was samples
(on the basis of administrative units) as a representative of the universe population (See Table
3.1)
Table 3.1: Number of Primary School sampled in each Division
Division Total Number Number
of School Sampled
Nyamira 92 40
Ekerenyo 105 45
Manga 55 24
Borabu 43 19
Rigoma 75 32
Total 370 160
S o u rce : F ie ld W ork R e se a rc h 19 9 6
^ pilot survey (a reconnaissance trip) was conducted in the study area by the researcher. This
Was meant to pre-test the methods that were used particularly the questionnaires so as to see
whether they could be mis-interpreted.
The education officers who were chosen came from each division in the district. Some
54
officers were also chosen from the district education office who included: Deputy District
Education Officer who provided information on the number of primary schools, the streams and
the staff. The District Staffing Officer was also interviewed. The District Sports Officer also
gave information on the extra curriculum activities in the district. In general, the education
officers provided information on: the enrolment, staffing and distribution of schools in each
division.
3.3 The nature of the data required
There are two types of data required for this study. These are primary and secondary data.
Primary data is essential as it makes one have original ideas because it is normally collected from
the field directly by the researcher, hence it is called raw data. Secondary data, unlike primary
data, is normally collected from published and unpublished sources i.e. from other peoples
findings.
The present study thus relied on both primary and secondary data. In summary the kind
of data collected included the following among others: a brief historical background on fertility,
mortality and migration; population density and distribution in the district, spatial distribution of
schools, the number of school age population (5-14 years) in each division: the number of pupils
in each school, the average distribution of teachers, text books, maps, charts etc. The average
size of each classroom in each particular school was also enumerated. The data on repeaters and
dropouts was collected with an aim of identifying the problem facing each school and each
individual pupil in the area. Data on the school enrolment over a time period of six years i.e.
1990-1996 in case of standard one enrolment was collected which also involved the total number
pupils in a school. The above data was required in order to obtain the intended objectives.
55
•j-he secondary data sources used include:
3 4 1 Source of demographic trends in the District
There are three main sources of demographic trends (Births, deaths and migration) occurring
vvithin the District. Records for these events are kept by various institutions as indicated below.
(a) Health Institutions: For all events taking place within the health institutions. These
events are registered and the registers are then kept both in the hospital and the
district registration office.
(b) Chiefs office: For events occurring at the sub-locational level within the district.
These are registered by the Assistant Chiefs in the areas of their jurisdiction before
the expiry of the six months period. An exception is made for deaths occurring under
unusual circumstances where officers of the police force or health institutions do the
registration.
(c) District Registration office: For all events which have not been registered within six
months from the date of occurrence. These events are registered by the District
Registration when reported by the individuals concerned. These events are only
registered by the District registrar if they occur within the District. They are normally
referred to as Late Registration.
Sources of Data
56

Demographic data sources and related data was found in the following publications amongOther
others:
Kenya Population Census of 1969, 1979 and 1989
Kenya Fertility Survey (KFS) 1977-88
Population Projections for Kenya 1980-2000 (published by the government in
collaboration with UNICEF)
Kenya Demographic Health Survey (KDHS 1989, 1993)
Economic and general data was another source o f data in the present study. The actual data
came from the following publications, among others:
The Development Plans
Sessional Papers
Statistical Abstracts and Statistical Digests
Economic Surveys
Educational data was obtained from the Ministry of Education annual reports and other relevant
publications.
It should be noted however that secondary data suffers from certain limitations. The data
may be out of date. Furthermore, one needs to know the purpose for which the data was
originally compiled (Harper 1977:16). Hence secondary data should be supplemented with
Primary data from the field.
57

The methods which were used in data collection were the combination of various social science
techniques for data collection. These techniques are shown below.
3.5.1 Questionnaires
The collection of primary data was done through a designed structured interview schedules i.e.
questionnaires. The questionnaires were laid out before the actual field, with an help of the
supervisor. The interviews were carried out using questionnaires which were of two types:
(i) for Primary Headmasters
(ii) for Education Officers in the district
In total 160 Headmasters were interviewed and 10 Education Officers were interviewed. The
questions which were asked focused on the adequacy of facilities such as number of classrooms,
number of teachers, text books, distribution of maps and charts, the number of dropouts and
repeaters, the extra-curriculum activities, etc (see appendix ii). In most cases the researcher and
his assistants never encountered problems in the administering questions to the respondents, this
followed the advantage that all those who were interviewed were literate and could interpret
questions easily. Most of the questions were closed, making the respondents to give the answers
that were within the limits. However, some questions were open ended to enable the respondents
to give answers that were accurately represented by their feelings, the questions were simplified
for easy interpretation. At one stage an attempt was made to make use of postal questionnaires
to cut transport cost, but this failed to function satisfactory because most respondents considered
j § Data Collection
58
;0nal preliminary introduction as essential. Therefore, the questionnaires were selfpers
^nhnistered by the researcher and his assistants.
3 5 . 2 P e r s o n n e l Interview
This method was used for interviewing persons for whom the structured questionnaires were not
intended. The people interviewed were mainly government officials for instance, the Health
Officers, District Officers, Registration Officers from whom such data on; population dynamics
i.e. fertility trends, mortality and migration trends were gathered. The method was not sufficient
because those who were giving the data were not accurate because they were giving their general
observation. Hence, there was need to supplement primary data with secondary data.
3.5.3 Secondary data
This study also relied a lot on data from secondary sources, some of which was hard to get.
These data included both unpublished and published literature. The method supplemented the
primary data so a to show a clear and complete picture of the study. In particular data from
official government documents such as census reports and statistical abstracts enabled the
researcher to obtain data on population dynamics. Secondary data also enabled the researcher to
secure the number of educational facilities in the area, their quality in terms of training available
■n each school, population served and the distribution of these facilities. Data on climate and
land use was also collected through the use of secondary method. In most cases the data was
obtained from headmaster’s office, Ministry of Education, Ministry of Planning and National
Development (Nairobi), Survey of Kenya (Nairobi), Nyamira District Offices (Registration
59
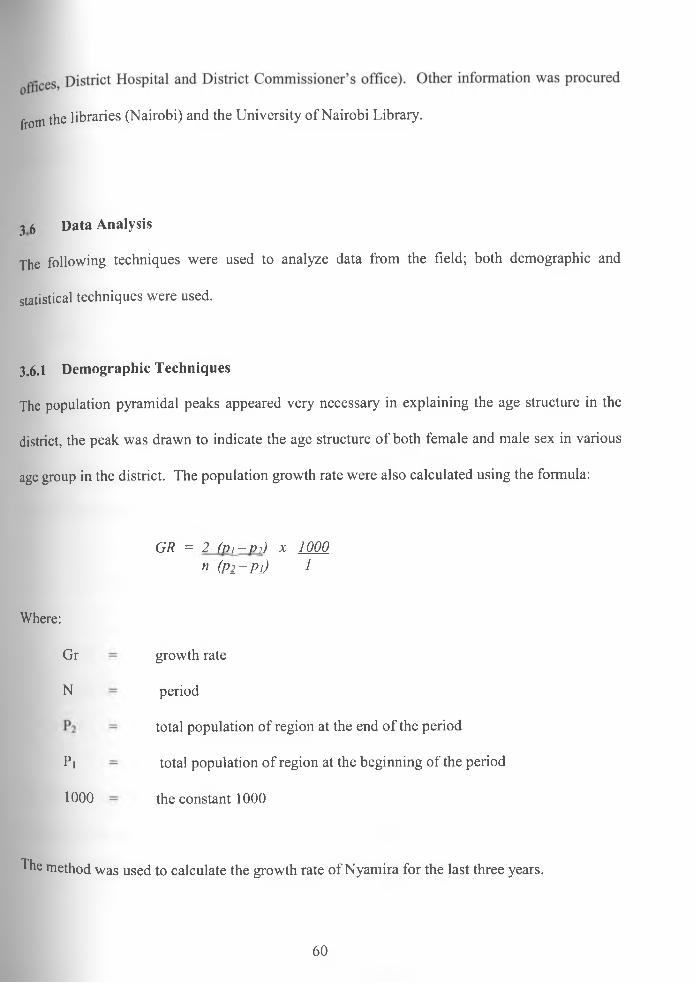
from the libraries (Nairobi) and the University of Nairobi Library.
3 6 Data Analysis
The following techniques were used to analyze data from the field; both demographic and
statistical techniques were used.
3.6.1 Demographic Techniques
The population pyramidal peaks appeared very necessary in explaining the age structure in the
district, the peak was drawn to indicate the age structure of both female and male sex in various
age group in the district. The population growth rate were also calculated using the formula:
G R = 2 (,v , - p 7) x 10 0 0
n (pz ~ P i) 1
Where:
Gr growth rate
N period
total population of region at the end of the period
P. total population of region at the beginning of the period
1000 the constant 1000
The method was used to calculate the growth rate of Nyamira for the last three years.
60

Other demographic techniques used include: the use of age specific fertility rates, the total
fertility rates and crude death rate. Age specific fertility rate was calculated using the following
formula:
A .S .F .R = b i_ K PI
Where:
A.S.F.R. Age specific fertility rate
Bi Total annual registered births in the age interval
PI The median population of the women of the same age-group
K Constant
Total fertility was also applied. The method used for computation of the total fertility employed
the following formula:
T.F.R. = (A.S.F.R.)5
Where:
T.F.R. Total fertility rate
A.S.F.R. Age specific fertility rate
5 Denotes age interval
The two methods were very important as they showed the series of levels of fertility in Nyamira
district for the last five years. This in conjuction with crude birth rates justified the hypothesis
thatNyamira’s population has been experiencing changes for the last five years.
61

Crude death rates was also applied to indicate the level of mortality in the area. The
method was used through the help of the following formula:
C.D.R. = (D) K P
Where:
C.D.R. = Crude death rate
D - Total death registered
P - Total population
K = Constant normally 100
Other methods used for analysis of population in the are included the teacher-pupil ratio, tables
and graphs which described the series and trends of population. The demographic techniques in
this aspect were important because they enabled the researcher to test his first hypothesis which
was on population dynamics in the district.
3.6.2 Statistical Methods
In addition to demographic techniques statistical techniques was also used in analyzing the data.
The techniques includes the application of descriptive statistics and inferential statistics.
62

Inferential statistics was very useful in analyzing the relationship between school
enrolment rate and school facilities. Regression and correlation analysis were useful in
explaining the relationship between population growth and education facilities (classrooms,
teachers, textbooks etc) in the study area.
Regression analysis was used to determine whether there exists a relationship between
school enrolment and school facilities allocated to each school. This method requires one to
observe the independent variable and dependent variable, in this case population and school
facilities respectively.
In order to fit the regression line, a regression model was used to get regression
coefficients. The model is outlined below:
Y = a + bx + e or Y = b0 +b i Xj +c
Descriptive statistics was useful in analyzing the population dynamics and primary school
enrolment- In analyzing population dynamics over years there was need for tables and bar
Tables and graphs were also used in showing school enrolment in time.
Where
Y is the independent variable or predictor variable
b0 is the constant
bi is the intercept
Xi is the independent variable
e is the error term

In order to determine the strength of the relationship, a correlation coefficient was used. The
linear correlation coefficient (r) relates the variance in the dependent (Y) to the reduction in that
variance when an independent variable (x) is used to estimate values of Y (Johnston 1978:29).
To determine the correlation coefficient the (R2) was applied. Thus
R2 1 - Z (v, - v)2s(yi-y)2
Where:
R2 is the coefficient of determination between y and x
yi-y(hat) is the explained variance in y according to regression
yi-y is the total variance in y
3.6.3 Multiple Regression Analysis (Stepwise)
Multiple regression analysis was also used in this study; this was meant to show the relationship
between enrolment and such variables as teachers, numbers of classrooms, textbooks, charts etc.
This was geared towards identifying the variable which has a significant relationship. The
relationship between yj (enrolment) and xi, X2, X3....xp was formulated as a linear model.
Yj = B0 + BjX, + B 2X2....... BpXp +Uj
64

\Vhere:
v = the dependant variableI i
n are constant referred to as the model regression coefficients (or the regressionDo* U1" y
coefficients).
X ,..XP are independent (explanatory variables)
y. js random disturbance or error term
The computation of B’s and Uj was easy to arrive at given that the compute facilities were
available. The statistical package for social scientist (SPSS) was used to arrive at the result. For
the result see
It was important to test the specification of the model used and also test whether there is
any violation of the assumption.
3.6.4 Analysis of Variance
The analysis of variance was used to test the stated hypotheses. The hypotheses such as, The
demand for educational facilities does not out weight the supply of such facilities was tested
using the analysis of variance. The Snedecor’s F-test was used. In the first case in the analysis
of “F” the variance of estimate accounted for by the regression was inferred using the formula N-
1 where N is the sample size. The second step was to calculate for the variance unaccounted for.
The F-ratio formula is shown below; the computation of F was done through the help of the
SPSS compute package.
65

Conventional tables of F-distribution were used to establish the F-critical which helped the
researcher to draw conclusions on the hypotheses.
F R - f N - 2 ) 1-R 2
Where:
F is the statistical test
R2 is the coefficient o f determination
N is the sample size
OR
F = Estimate of the variance accounted for
Estimate of the variance unaccounted for
The student t-test was also used to test the correlation between two variables such as enrolment
verses teachers and classrooms. The test was done at a given degree of freedom depending on
the sample size taken and at 0.025 significance level. Also here using conventional tables of the
t-distribution, t-critical was established which helped in giving conclusions. The formula
employed was:
66

Where:
t= r Qk2X
t is the t-test statistic
r is the coefficient of correlation
n is the sample size
r2 is the coefficient of determination
3.7 Limitation of Research Methodology
The quality and reliability of statistical sources and analysis varies somewhat depending on the
type of information and the period of time. It is often difficult to assess the qualities accurately.
This is especially true in relation to population and demographic data.
There was also inadequate background materials that could be used for this study. Infact
very little research as been conducted in connection with the title and little literature existed.
Whatever that has been written so far on the subject has tended to embrace a unit larger that a
district or has also tended to involve only urban areas. Thus in most cases secondary data was
missing and the one which was available lacked detailed analysis. There was also the problem of
cooperation from some heads of certain primary schools, who made it very difficult to hold
interviews with the researcher. This at times necessitated visiting some schools a number of
times to get the data. Some heads would not honour the appointment and hence one would
bounce them severally, this indicated time consuming and resources hence it was hard to collect
all intended data.
67

7 i Solution to Problem Faced
The main problem as mentioned above was time limit. Time was a problem because of the wide
^nge of the study area. This problem was taken care of by adding another research assistant
despite the extra cost that was realized.
68
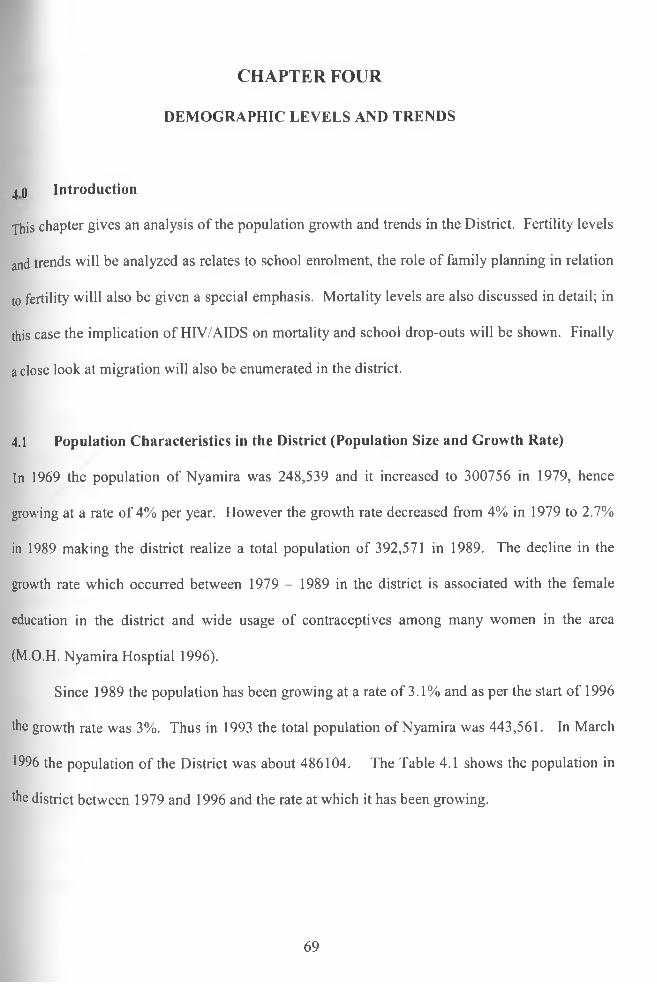
CHAPTER FOUR
DEMOGRAPHIC LEVELS AND TRENDS
jQ Introduction
This chapter gives an analysis of the population growth and trends in the District. Fertility levels
and trends will be analyzed as relates to school enrolment, the role of family planning in relation
to fertility willl also be given a special emphasis. Mortality levels are also discussed in detail; in
this case the implication of HIV/AIDS on mortality and school drop-outs will be shown. Finally
a close look at migration will also be enumerated in the district.
4.1 Population Characteristics in the District (Population Size and Growth Rate)
In 1969 the population of Nyamira was 248,539 and it increased to 300756 in 1979, hence
growing at a rate of 4% per year. However the growth rate decreased from 4% in 1979 to 2.7%
in 1989 making the district realize a total population of 392,571 in 1989. The decline in the
growth rate which occurred between 1979 - 1989 in the district is associated with the female
education in the district and wide usage of contraceptives among many women in the area
(M.O.H. Nyamira Hosptial 1996).
Since 1989 the population has been growing at a rate of 3.1% and as per the start of 1996
the growth rate was 3%. Thus in 1993 the total population of Nyamira was 443,561. In March
1996 the population of the District was about 486104. The Table 4.1 shows the population in
the district between 1979 and 1996 and the rate at which it has been growing.
69
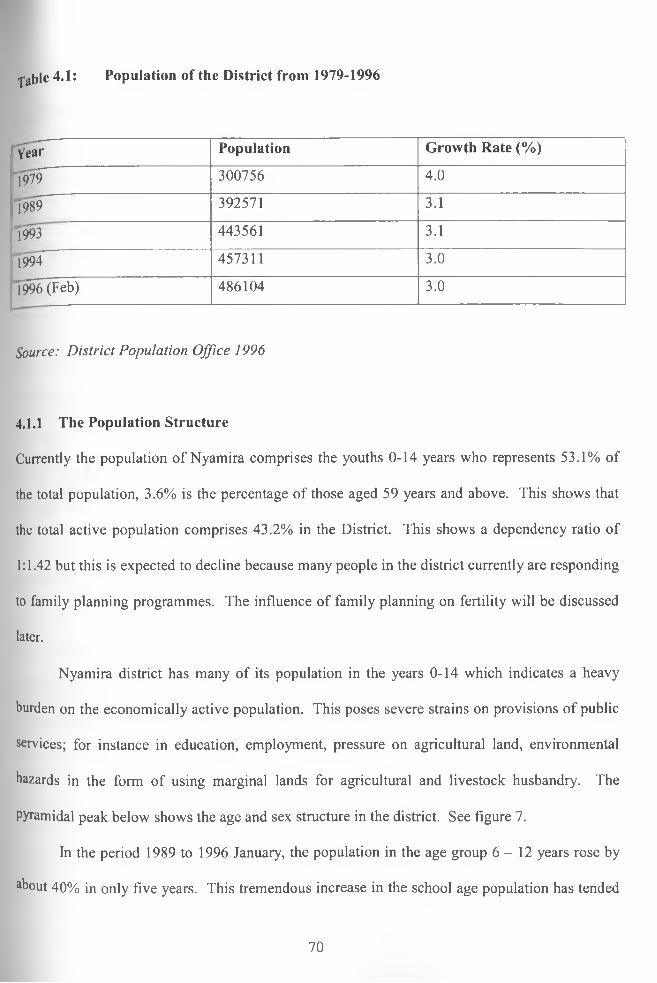
fable 4.1: Population of the District from 1979-1996
Year Population Growth Rate (%)
*1979 300756 4.0
1989 392571 3.1
1993 443561 3.1
1994 457311 3.0
1996 (Feb) 486104 3.0
Source: D is tr ic t P o p u la tio n O ffice 19 9 6
4.1.1 The Population Structure
Currently the population of Nyamira comprises the youths 0-14 years who represents 53.1% of
the total population, 3.6% is the percentage of those aged 59 years and above. This shows that
the total active population comprises 43.2% in the District. This shows a dependency ratio of
1:1.42 but this is expected to decline because many people in the district currently are responding
to family planning programmes. The influence of family planning on fertility will be discussed
later.
Nyamira district has many of its population in the years 0-14 which indicates a heavy
burden on the economically active population. This poses severe strains on provisions of public
services; for instance in education, employment, pressure on agricultural land, environmental
hazards in the form of using marginal lands for agricultural and livestock husbandry. The
Pyramidal peak below shows the age and sex structure in the district. See figure 7.
In the period 1989 to 1996 January, the population in the age group 6 - 1 2 years rose by
about 40% in only five years. This tremendous increase in the school age population has tended
70

t0 increase the absolute numbers in enrolment; in the year 1989 to 1996 January the number of
pupils enrolled in the district primary school rose by 46.3% whereas enrolment ratio was 86.3%;
jj,e fact that has resulted in a lot of congestion in many of the primary schools hence resulting
jnto lack of classrooms and the teaching materials. Such structure shown above indicates a trend
where most of the population are dependants; the ratio of those aged 6-14 years in the district is
1:3. It then means that most of the population are youths aged 0-15 years meaning that the
primary school enrolment is very high in the district.
4.2 Fertility Levels in Nyamira
Nyamira district has one of the highest growth rate in Nyanza Province and Kenya as a whole.
The rate of 3.1% is one of the highest in the country. It is even higher than that of the country
which is 2.8%. The reason behind this high population growth in the District is mainly high
fertility and declining mortality in the area.
The district has a total fertility rate of 5.0. This indicates that women in the area are
capable of getting 5 children at the end of their reproductive period.
A significant feature in the District is that the trend seems to have been constantly rising
over the last decade and there appears a small decline in the 1990s. This then explains the
increasing population growth rate in the district. This rise in fertility has been connected to the
overall breakdown of the traditional social structure through penetration of western values and
habits to the African society (Hopkins Valentine & Revson, 1979:455-464).
71

Age and Sex S tructure of the N yam ira’s Populationfigure 7:
Male
— i— i----------r ~
II 10 9 8 7-r—6
-1-------1------- 1 T
5 4 3 2
Age 70 +
55-69
60-64
55-59
50-54
45-49
40-44
35-39
30-34
25-29
20-24
15-19
10-19
5 - 9
0 - 4
IFemale
0 I1 i i2 3 4
1-----i-----1------1------1 I5 6 7 8 9 10
Source! Computed from the District Development Plan, Nyamira 1994—1996
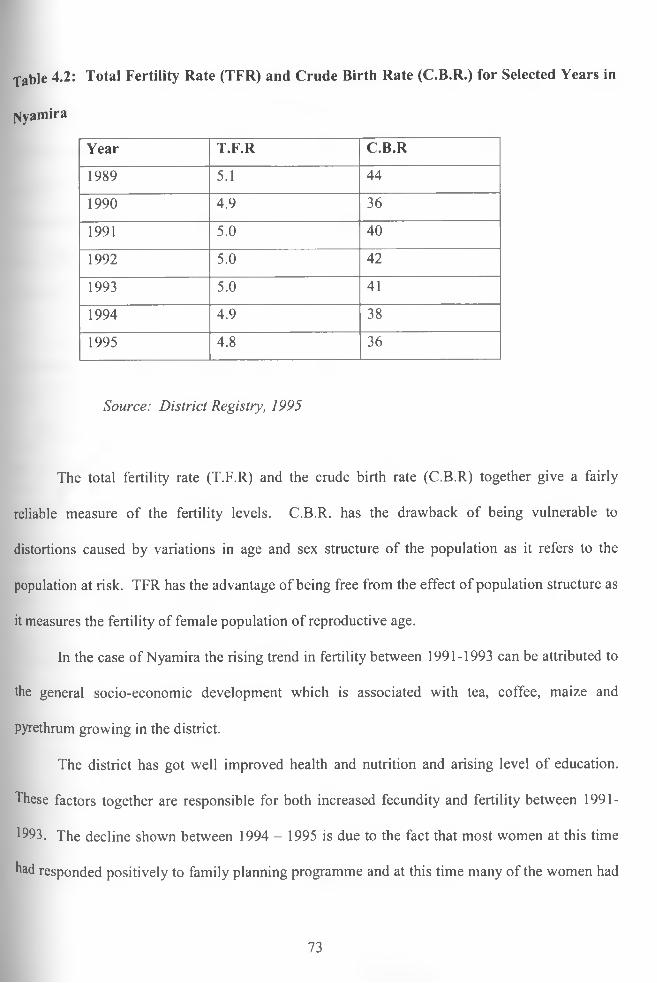
jVyamira
Table 4.2: Total Fertility Rate (TFR) and Crude Birth Rate (C.B.R.) for Selected Years in
Year T.F.R C.B.R
1989 5.1 44
1990 4.9 36
1991 5.0 40
1992 5.0 42
1993 5.0 41
1994 4.9 38
1995 4.8 36
S o u rc e : D is tr ic t R eg istry , 1995
The total fertility rate (T.F.R) and the crude birth rate (C.B.R) together give a fairly
reliable measure of the fertility levels. C.B.R. has the drawback of being vulnerable to
distortions caused by variations in age and sex structure of the population as it refers to the
population at risk. TFR has the advantage of being free from the effect of population structure as
it measures the fertility of female population of reproductive age.
In the case of Nyamira the rising trend in fertility between 1991-1993 can be attributed to
the general socio-economic development which is associated with tea, coffee, maize and
pyrethrum growing in the district.
The district has got well improved health and nutrition and arising level of education.
These factors together are responsible for both increased fecundity and fertility between 1991-
1993. The decline shown between 1994 - 1995 is due to the fact that most women at this time
had responded positively to family planning programme and at this time many of the women had
73

got about 9 years of education. The trend shows that fertility in the area is expected to decline
pore by the year 2000. The shorter the duration of breast-feeding and the marriage pattern
largely explain the decrease in fertility (Bongaarts, 1987). In Nyamira the breast feeding is
between (12-24) months; this is shorter than the 1989 duration of (14-18) months. Its thus
important to note that although breastfeeding is being overcomed by female education in the
recent year. However, it is still a determinant factor of fertility decline for some women in the
district.
Table 4.3: Age Specific Fertility Rates for Selected Years in Nyamira
Y e a r
A g e 1 9 9 0 1991 1 9 9 2 1 9 9 3 1 9 9 4 1 9 9 5
15-19 0.0922 0.0811 0.0844 0.0797 0.0636 0.0752
20-24 0.1759 0.1875 0.1820 0.1864 0.1794 0.7111
25-29 0.2420 0.2243 0.2307 0.2237 0.2370 0.2092
30-34 0.2695 0.2879 0.2892 0.2916 0.2995 0.2609
35-39 0.1695 0.1678 0.1721 0.1688 0.1773 0.2299
40-44 0.0420 0.1357 0.0346 0.0342 0.0351 0.02914
45+ 0.0085 0.0169 0.0067 0.0156 0.0069 0.02364
Total 4.449 5.0025 4.9985 5.0001 4.996 4.8
Source: D is tr ic t R e g is tra tio n O ffice (1996)
74
The age specific fertility rates shows a slow rising trend between 1990 to 1992 but
indicates a decline between 1992 - 1995. This indicates a change in fertility trends in Nyamira.
Generally the fertility of Nyamira women is not very high in all age groups but it is higher in the
age groups 20-34 years while the lowest is in the age group 40 - 49. Thus women in Nyamira
continue conceiving throughout their reproductive period. The age specific fertility rate for the
years 1990-1995 is shown above in Table 4.3.
In the analysis of fertility levels of the district it is evident therefore that Nyamira’s
fertility has been experiencing a declining change since 1990. The reduction of fertility in the
recent years is due to the fact that many people in the area are accepting family planning
programmes. Divisional variation of fertility indicates that Nyamira division has been leading in
fertility rates followed by Ekerenyo, Manga and Rigoma in that order. See table 4.4 and Fig 8
for the divisional variation of T.F.R for the years 1990-1995. The fertility trends per division
shows that there has been fertility decline in each division. The low fertility in Borabu division
is a result of high educational level in the division as compared to other divisions in Borabu over
the female who have received over 9 years of education.
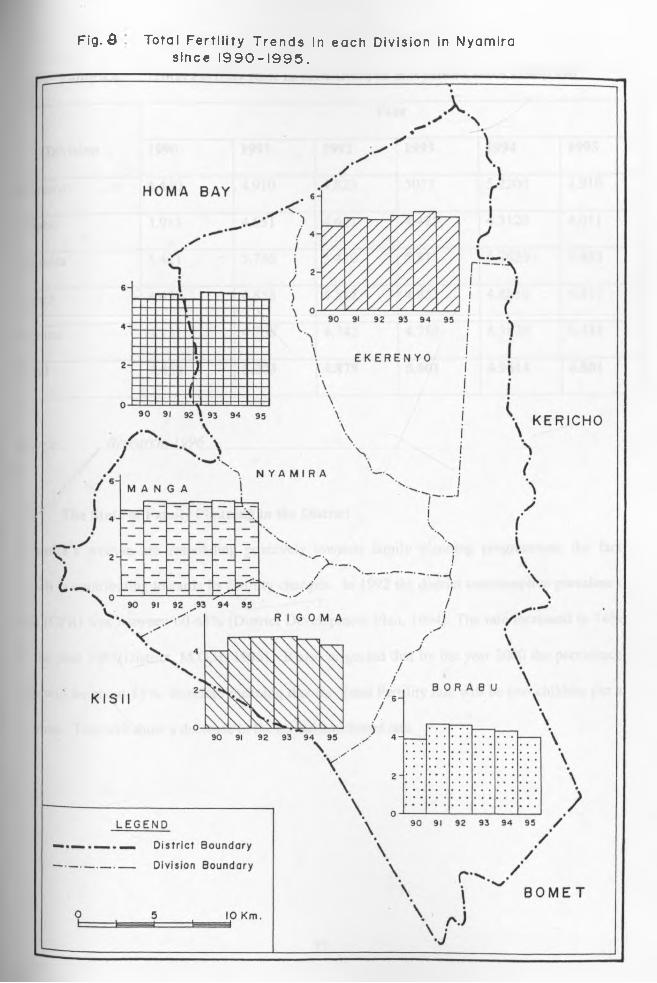
Fig. 8 Total Fertility Trends in each Division in Nyamira since 1990-1995.
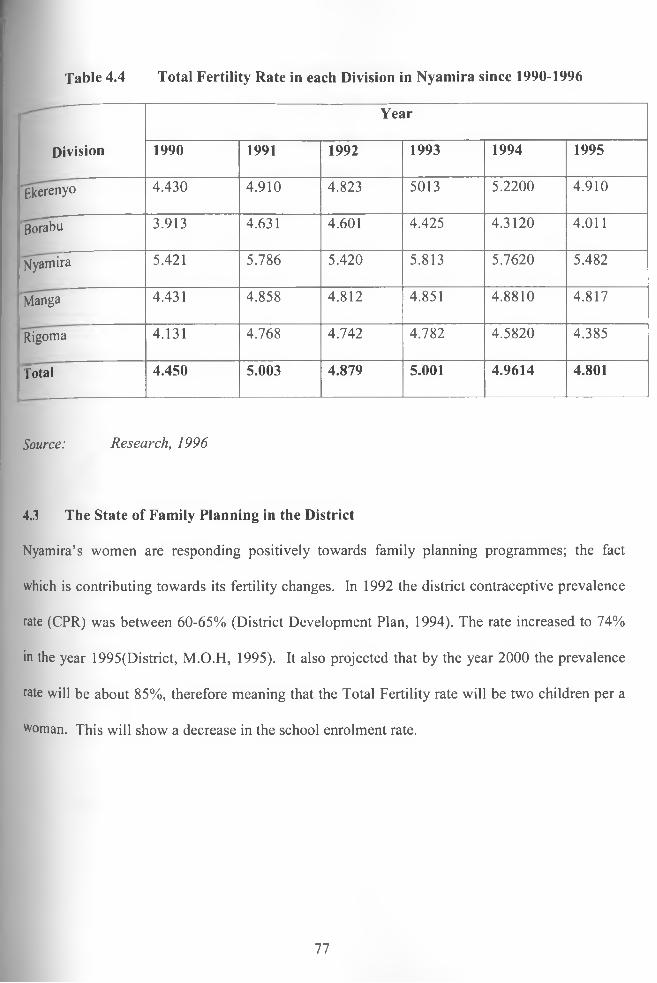
Table 4.4 Total Fertility Rate in each Division in Nyamira since 1990-1996
Division
Year
1990 1991 1992 1993 1994 1995
'Ekereny0 4.430 4.910 4.823 5013 5.2200 4.910
rBorabu 3.913 4.631 4.601 4.425 4.3120 4.011
Nyamira 5.421 5.786 5.420 5.813 5.7620 5.482
"Manga 4.431 4.858 4.812 4.851 4.8810 4.817
Rigoma 4.131 4.768 4.742 4.782 4.5820 4.385
Total 4.450 5.003 4.879 5.001 4.9614 4.801
Source: R esea rch , 1 9 9 6
4.3 The State of Family Planning in the District
Nyamira’s women are responding positively towards family planning programmes; the fact
which is contributing towards its fertility changes. In 1992 the district contraceptive prevalence
rate (CPR) was between 60-65% (District Development Plan, 1994). The rate increased to 74%
in the year 1995(District, M.O.H, 1995). It also projected that by the year 2000 the prevalence
rate will be about 85%, therefore meaning that the Total Fertility rate will be two children per a
woman. This will show a decrease in the school enrolment rate.
77
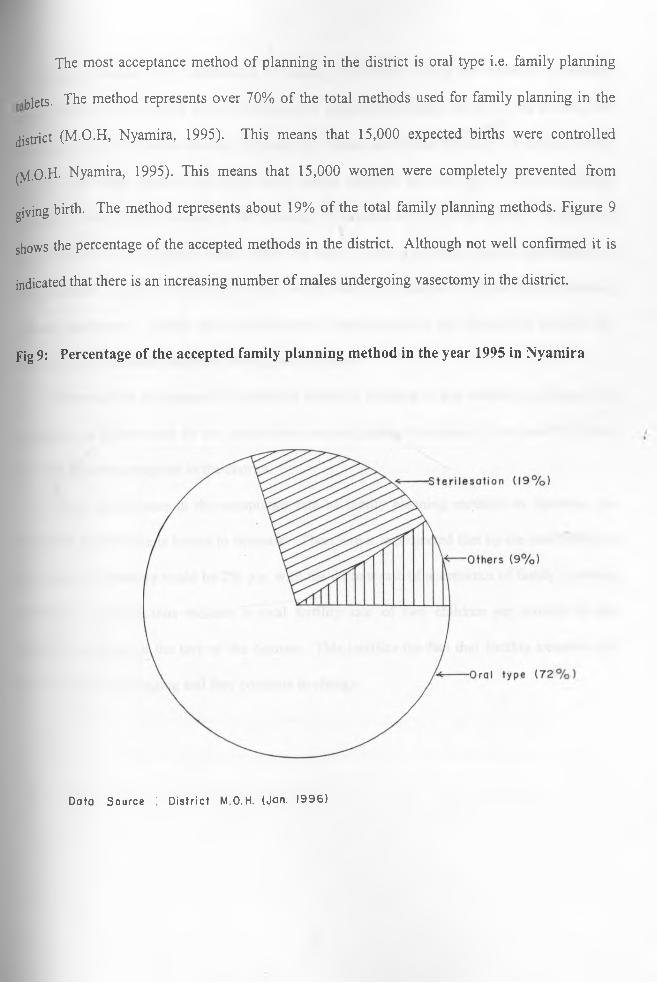
The most acceptance method of planning in the district is oral type i.e. family planning
blets. The method represents over 70% of the total methods used for family planning in the
district (M.O.H, Nyamira, 1995). This means that 15,000 expected births were controlled
(M -O .H . Nyamira, 1995). This means that 15,000 women were completely prevented from
giving birth. The method represents about 19% of the total family planning methods. Figure 9
shows the percentage of the accepted methods in the district. Although not well confirmed it is
indicated that there is an increasing number of males undergoing vasectomy in the district.
Fig 9: Percentage of the accepted family planning method in the year 1995 in Nyamira
Data Source ! District M.O.H. (Jan. 1996)

Literacy classes have contributed to raising awareness among the learners concerning
family planning. By 1992 a total of 2080 people enrolled for literacy classes. Out of the 2080
enrolled learners 87% were females (Ministry of Culture and Social Services - Nyamira, 1993).
The fect that many women enroll for adult classes signifies that the rate of family planning
acceptance could be the increase in the coverage of outreach clinics in the district. In Nyamira
contraceptives are at village levels, there are about 1400 community based distributors of
contraceptives. Almost every health centre in the district is equipped with the family planning
methods equipment. Finally the socio-economic improvement in the district has enabled the
eradication of traditional beliefs of having many children.
However the acceptance of the family planning methods in the district is still low, the
programme is undermined by the youths who are not getting this policy, there are very many
girls who becomes pregnant in the district.
With the increase in the acceptance rate of family planning methods in Nyamira, the
population growth rate is bound to decrease. Therefore it is projected that by the year 2000 the
growth rate of Nyamira could be 2% p.a. with the current rate of acceptance of family planning
methods. This will thus indicate a total fertility rate of two children per women in the
reproductive period at the turn of the century. This justifies the fact that fertility trends in the
district have been changing and they continue to change.
79

■ 4 Education and Fertility
Education, especially female education, seems to be the single factor that is more closely linked
with decreasing fertility (Cleland and Rodriguez 1988). Education acts as an intermediate
variable and works together with other variables through a variety of channels. Generally,
education has a clearly inverse relationship with fertility. However, it seems that the relationship
takes the form of an inverted 'U ’ where at the early stages of development when the general
education and literacy levels are low, initially Fertility tends to increase (Cleland and Rodriguez
1988). At higher levels of socio-economic development the effects of education on fertility
appears to be monotonically negative (United Nations, 1987). The reasons for the fertility
decreasing effect of education are manifold; one of the most important conclusions is that
education has a clear tendency to raise the woman’s age at first marriage (Ohlsson, 1984: United
Nations, 1987). This is mainly because of the schooling process itself and also because educated
women are more likely to work than their uneducated women. It is also arguable that educated
women take time to find a partner. The delay in marriage shortens the reproductive period and
the educated women who marry later do not tend to make up for the lost time afterwards. Also it
is very clear that education increases the possibilities of female sex to participate in the labour
market. The opportunity lost in having children thus becomes higher (Rodriguez & Cleland,
1988).
Arguably education has a socio-psychological dimension because it widens the horizons
of the parents resulting in a different perception of children and subsequently lower ideal family
s,ze. It is therefore true that educated parents will thus plan their family and are more likely to
have the knowledge about and ability to use modem contraception. The relationship between
80
jucation and contraceptives use in the developing countries is monotically positive in the light
f the results from the World Fertility Survey (United Nations, 1987).
Education has also the tendency of promoting western values and habits which may have
bearing on the fertility levels. Education is associated with shorter duration of breast-feeding
with a resulting reduction in birth intervals. It has been claimed that breast-feeding hinders more
pregnancies in developing countries than all modem contraceptives put together (Bongaarts,
1987). Similarly, the habit of post-partum abstinence, which has been a wide-spread tradition, is
gradually being eroded, especially among the educated couples (Valentine and Revson, 1979).
Also polygamous unions tend to have a lower average number of children per wife than
monogamous unions, but the prevalence of polygamy is reduced by female education (Monsted
& Walji, 1978).'
The effect of each of the above factors may be marginal but together they can produce an
observable rise in fertility which can offset the effect of increasing usage of contraception
(Bongaarts, 1987). Most of these effects are however transitional and are likely to be reverted
when modernization including (female) education increases. It seems most plausible that there is
a threshold level in each population’s educational attainment which produces a fertility decline.
4.5 Education and Fertility Levels in Nyamira
Nyamira provides no exception to the general fertility trend experienced in the whole country.
Fertility levels are clearly linked with the levels of education of the mother (see Table 4.5
below).
81
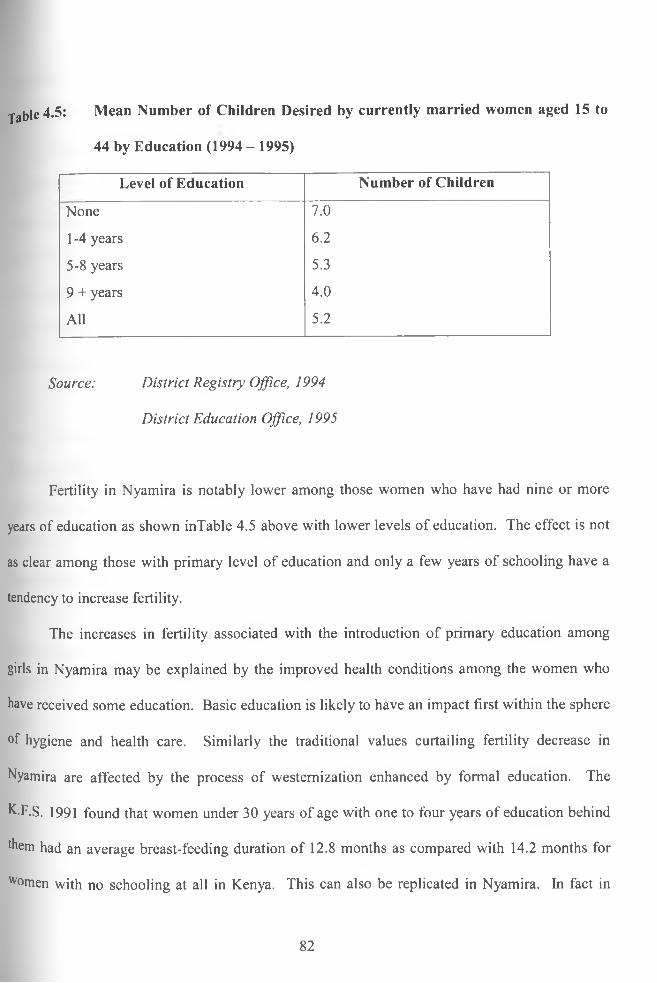
Table 4.5: Mean Number of Children Desired by currently married women aged 15 to
44 by Education (1994- 1995)
Level of Education Number of Children
None 7.0
1-4 years 6.2
5-8 years 5.3
9 + years 4.0
All 5.2
S o u rce: D is tr ic t R e g is try O ffice , 1994
D is tr ic t E d u c a tio n O ffice, 1995
Fertility in Nyamira is notably lower among those women who have had nine or more
years of education as shown inTable 4.5 above with lower levels of education. The effect is not
as clear among those with primary level of education and only a few years of schooling have a
tendency to increase fertility.
The increases in fertility associated with the introduction of primary education among
girls in Nyamira may be explained by the improved health conditions among the women who
have received some education. Basic education is likely to have an impact first within the sphere
of hygiene and health care. Similarly the traditional values curtailing fertility decrease in
Nyamira are affected by the process of westernization enhanced by formal education. The
K.F.S. 1991 found that women under 30 years of age with one to four years of education behind
them had an average breast-feeding duration of 12.8 months as compared with 14.2 months for
women with no schooling at all in Kenya. This can also be replicated in Nyamira. In fact in
82

pjyaffiira the breast-feeding duration of educated women is about 12.6 as compared to
uneducated duration of 14.8 (District Hospital, 1993).
Education of the mother has an impact on the attitudes towards the family and children
and the perceptions of life as whole. This results in lower aspirations regarding family size of
which the lower fertility levels of educated women are an expression. This is well explained in
Table 4.5. A conclusion drawn from the female education in Nyamira, indicates an expansion
of the sex’s education in future which will reduce fertility in Nyamira. By the year 2000,
Nyamira fertility is expected to stand at 1.8% to 2% p.a. given the fact that the present situation
of female education will continue to improve at the same base it is growing now.
4.6 Fertility and Women’s Employment in Nyamira
Women’s employment outside the shamba for pay and profit has in the light of numerous studies
shown an inverse relationship with fertility (United Nations, 1985). Paid employment in
Nyamira increases the woman’s possibilities for gaining esteem in her own right and reduces her
dependency on the children. Currently the number of women employed in the modem sector is
still very small and those employed are mainly well educated ones in the District. In general two
factors that is formal employment and education in Nyamira appear closely interrelated and is
very hard to separate the impact of the two factors on Nyamira’s fertility level for the last 5
years.
83

4,7 Mortality levels in the District
The decline is mortality in Nyamira as experienced over the past decades has had a major impact
on the rate of population growth. The crude death rate also reflects changes in the age-structure
and does not thus give a fully reliable picture of the historical development of mortality. In total
the number of people who died from 1990-1995 in Nyamira District are indicated in
Figure 10 below.
F i g 1 0 : T o t a l d e a t h s f o r a g r a c e p e r i o d o f 5 y e a r s i n N y a m i r a
Data Source : District Registration Office.
84
fhe crude death rate for instance in the years 1 9 9 3 and 1 9 9 4 was 1 4 /1 ,0 0 0 population and
17 /1 ,00 0 population meaning that in 1 9 9 4 out of 1 0 0 0 people the expected death was 17 people.
The above crude death rate as compared to 1 9 7 9 when the crude death rate was 2 4 is quite low
and thus shows a rapid decline between 1 9 7 9 and the year 1 9 9 4 . the rise in the number of deaths
jn 199 4 from 1 9 9 3 (i.e 1 4 -1 7 ) can be attributed to highland malaria which occurred in the whole
of Kisii and Nyamira district.
Similarly, there has been a drop in infant mortality from 4,573 in 1988 to 4,564; the rapid
decline was realized in 1993 and 1995 in which case the total infant deaths were 3268 (1993) and
in 1995 was 2817. This was almost 13.8% decline. If the same decline is maintained then total
infant deaths in the district will be 1915 by the year 2000 (District M.O.H. 1995). Despite the
above decline it is important to note that in 1994 and 1995 infant mortality rate accounted for
26% of the total deaths. The major attribute to infant deaths, is that fact that Nyamira has a large0
proportion of stunted children due to low intake of nutritious food. Low nutrition levels in the
district is partly due to lack of a balanced diet due to the ignorance among the mothers. The
nutrition aspect in the district is a major concern and most mothers require education in order to
encourage a balanced (District M.O.H., 1994).
The above decline in mortality has increased life expectancy at birth. Life expectancy at
birth varies by sex. As in most other district in Nyamira the females have a longer life
expectancy than men. According to the 1989 provision census report life expectancy was 57.2
for females and 54.3 for males.
Infant mortality especially post-natal mortality is a good development indicator. In the
Post-neonatal period deaths increases proportional to the environment facts and those which are
connected with pregnancy and incidents directly after birth; therefore the post-neonatal mortality
85

reflects the overall nutritional and health conditions of the district. In Nyamira most of the infant
mortality occur in the post-neonatal period. According to the district hospital the proportion of
post-neonatal deaths of infants for the year 1992 was 38 percent (District Hospital, 1992). In
1994 the children who were dying in their first five year in Nyamira were 104 out of 1000 births;
this is quite high and hence calls for proper attention. The malnutrition level in Nyamira district
is 12.8% (Mott, 1996). Most of the children who are malnourished are those children who
belong to school girls and the unmarried women (District Reg. Office, 1995; District Hospital,
1994).
There is no much regional difference in infant mortality in Nyamira because much of the
area covered by the district has almost a uniform climatic conditions and the socio-economic
conditions are similar. Divisional differential in infant mortality is caused by differences in the
accessibility to health facilities and transportation. Nyamira division has the lowest infant
mortality because the division has well developed health centre and it has the advantage of being
near the district hospital. Borabu division follows Nyamira division. The division also enjoys a
good socio-economic climate where virtually almost every settler in the area belongs to a middle
class level. Other divisions particularly Ekerenyo have the highest infant mortality rate about
133 per 1000 because of the lower socio-economic development; many of the population of
Ekerenyo division is virtually very poor. See Table 4.6 and Figure 11 below.
86
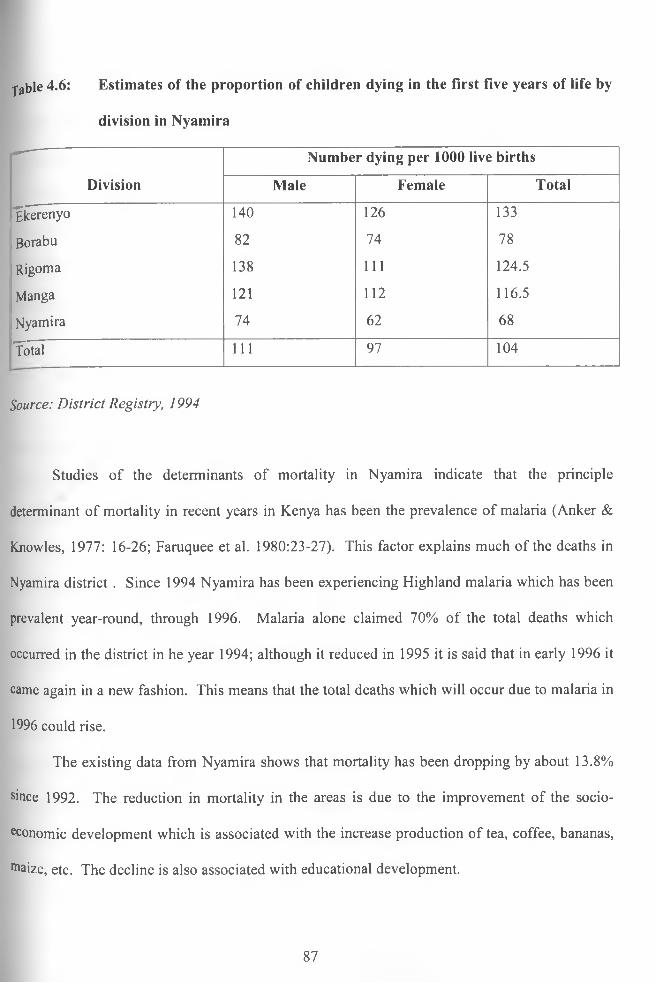
fable 4.6: Estimates of the proportion of children dying in the first five years of life by
division in Nyamira
—
Division
Number dying per 1000 live births
Male Female Total
"§kerenyo 140 126 133
Borabu 82 74 78
Rigoma 138 111 124.5
Manga 121 112 116.5
Nyamira 74 62 68
Total 111 97 104
Source: D is tr ic t R eg is try , 1994
Studies of the determinants of mortality in Nyamira indicate that the principle
determinant of mortality in recent years in Kenya has been the prevalence of malaria (Anker &
Knowles, 1977: 16-26; Faruquee et al. 1980:23-27). This factor explains much of the deaths in
Nyamira district . Since 1994 Nyamira has been experiencing Highland malaria which has been
prevalent year-round, through 1996. Malaria alone claimed 70% of the total deaths which
occurred in the district in he year 1994; although it reduced in 1995 it is said that in early 1996 it
came again in a new fashion. This means that the total deaths which will occur due to malaria in
1996 could rise.
The existing data from Nyamira shows that mortality has been dropping by about 13.8%
since 1992. The reduction in mortality in the areas is due to the improvement of the socio
economic development which is associated with the increase production of tea, coffee, bananas,
maize, etc. The decline is also associated with educational development.
87

■jlie study of mortality is crucial in this study because it contributes a lot to the drop-outs from
school- Infant mortality is important because it enables one to know the number who are likely
(o join standard one (from here one can know the school-age population). For instance the
decline in infant mortality since 1992 has marked an enrolment of 93% in 1996 an increase of
8% from 85.7% of 1990. The drop-out rate due to deaths are still low in the district. But the low
mortality of the infants rises enrolment which leads to congestion in standard one, hence
resulting into lack of facilities.
4.8 HIV/AIDS Situation, its implication of Fertility and Mortality in Nyamira
Acquired Deficiency Syndrome (AIDS) is the name given to the fatal clinical condition
that results from long-term infection with HIV (Human Immunodeficiency Virus). Being
infected with HIV does not automatically mean that a person has AIDS or is ill. It does, however
mean that a person has AIDS or is ill. It does, however, mean that a person can transmit it (HIV)
to someone else. HIV gradually disables an important part of the body’s immune system. Its
main target are cells in the blood called “T - helper cells” which HIV invades and eventually
destroys. These cells normally help protect the body from attack by infection. As the immune
system is progressively damaged a person becomes increasingly vulnerable to a range of
infections. The average time of progression from infection with HIV to the onset of AIDS (as
defined by WHO and US centre for disease control, 1987) - the incubation period - is
aPproximately 10 years. Some people stay healthy for a much shorter period than this, but few
develop AIDS within the first three years of infection. Research has shown an estimate that
°thers may be infected with HIV for up to 20 years before the onset of serious illness.
88

f i g . 19 Estimates of the Proportion of Children dying in the first five yearsof life by Division in Nyamira per IOOO live births.
v
10 15 Km.
H O M A B A Y
A Lr
A
.A
EKERENYO
N Y A M I R A
NHJ.
N vts \
M A N G A
SI
K I S I I
-a:
TXT.
E Bi--------1
IU7
-1
t = j|-------- \ K E R I C H O
— s
1
3r
-N-
"RTS 0 M A
X
■Kt3b- A
.777
■B 0 R A B U'
L E G E N D----------- District Boundary_____________ Division Boundary
No. dying per'OOO live births
60 — 100
101 -12 0
12 1—140
VV
V/
vV v
VV
J ^ 7
: i B O M E T
\ f'\JV
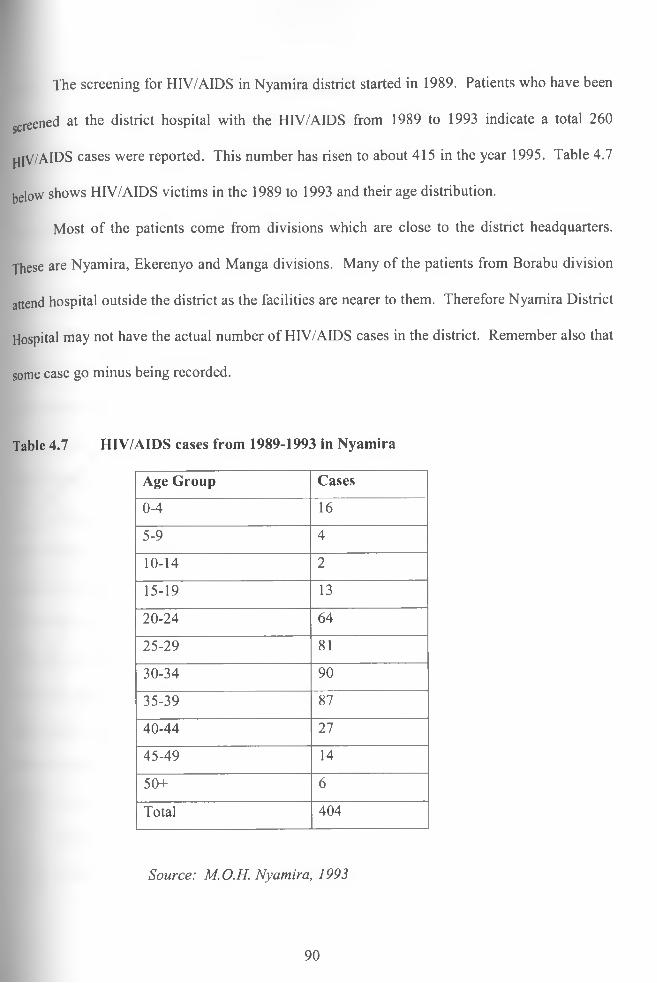
The screening for HIV/AIDS in Nyamira district started in 1989. Patients who have been
screened at the district hospital with the HIV/AIDS from 1989 to 1993 indicate a total 260
pjlV/AlDS cases were reported. This number has risen to about 415 in the year 1995. Table 4.7
below shows HIV/AIDS victims in the 1989 to 1993 and their age distribution.
Most of the patients come from divisions which are close to the district headquarters.
These are Nyamira, Ekerenyo and Manga divisions. Many of the patients from Borabu division
attend hospital outside the district as the facilities are nearer to them. Therefore Nyamira District
Hospital may not have the actual number of HIV/AIDS cases in the district. Remember also that
some case go minus being recorded.
Table 4.7 HIV/AIDS cases from 1989-1993 in Nyamira
Age Group Cases
0-4 16
5-9 4
10-14 2
15-19 13
20-24 64
25-29 81
30-34 90
35-39 87
40-44 27
45-49 14
50+ 6
Total 404
S o u rce : M .O .H . N ya m ira , 1993
90
4 8.1 The Implication of HIV/AIDS on demography
Given a relatively severe AIDS epidemc (eg 25 percent is sexually active adults infected)
reaching into both urban and rural areas of a country total population growth rates may decrease
by only 1 percentage point (Way and Stanecki, 1993). In Nyamira the disease has only got room
into about 0.2% of total sexually active adults; this therefore tells that the disease so far has not
found room to alter the population growth rate. Given also the growth rate of 3.1% p.a. it
appears hard for the disease to make any meaningful changes in the growth rate. This is in view
of (John Kwasi A. 1994) who said that it is hard for AIDS to have a negative population growth
in Africa given the current high rate of population growth (about 3 percent per year). As
indicated from the previous work Nyamira’s growth rate is strictly affected by the influence of
family planning programme but with the current rate, in future AIDS will have a major influence
on growth rate.
The fact that AIDS doesn’t have an upper hand in influencing fertility or population
growth rate in Nyamira district does not mean that it will not influence mortality. AIDS has the
capacity to alter the pattern of age-specific mortality rate in Africa (John K.A., 1994). It is
known that new HIV infections among adults are contracted in the ages of peak sexual activity -
from the late teens to about 30 to 35. Thus in the absence of AIDS, the rate of mortality among
these age groups is one of the lowest. Therefore AIDS can increase the mortality rates in these
age groups many times over. In Nyamira although cases are not very rampant it is
approximately that about 1% of the total deaths in the district is due to AIDS particularly deaths
which occur to people of ages 20-39 years.
AIDS does not affect only the sexually active population. It is estimated that about 30%
°f the children bom to women who are HIV positive will become HIV positive themselves.
91
Uost of these children will die before reaching the age of five. AIDS in Nyamira is projected to
taise death rate for children under five to a high level if prevention measures will not be adapted.
In essence the influence of HIV/AIDS and demographic changes in the district is minimal
aS the disease is not very much rampant in the area. There is no vital changes on population
growth rate and mortality rate which is attributed to AIDS.
4.9 Migration in the District
There is no significant migration movement either from or into the district. The high population
growth has mainly been due to the natural increase. The rural to rural movement within the
district have been to the settlement area in Borabu division. The people who bought land and
settled in the area were from Kisii and Nyamira districts.
4.9.1 Rural-Rural Migration
Rural migration is the main type of migration that the district is experiencing. A number of
people have been moving from various parts of Kisii and Homa Bay to Borabu divisions which
was a former White Settlement area. Major movement to Borabu occurred in 1969 when the
Kenyan government in conjunction with the former settler sold land to various people who were
willing to buy at that time. In 1979 the number of people who shifted from Ekerenyo, Nyamira,
Rigoma and Manga division to Borabu were 2,200, 4,800, 3,234 and 2,822 respectively.
92

The rest of the people who shifted to Borabu in the same year came from various parts of
jtyanza with the majority coming from Kisii district. By 1995 the number of migrants to Borabu
had increased to 38,210 from 31,589 of 1979. Otherwise rural-rural migration has been limited
in the districts like Nakuru, Kericho and Trans Nzoia. For instance it was examined that over
18,000 migrants from Nyamira are in Nakuru (Molo) and Trans Nzoia (Cherangani).
4.9.2 Rural-Urban Migration
A noticeable movement is by job seekers and business people moving from rural to urban areas
in search of employment and business opportunities. Rural-urban migration is quite low
although some migrations were noted taking place to Nyamira town and to Keroka urban centre.
It was hard to measure the magnitude because most of the migrants were seasonal. It was
noticed that the number of migrants to Nyamira town as from 1989 when the town was upgraded
to a district headquarters were about 10,000. Those who had bought land settled in Nyamira and
Keroka between 1989 and 1996 were 4,800 and 8,215 respectively.
The records available revealed that the rest of the population were the occupants of the
area and seasonal traders. Several migrants moved towards other towns like Nairobi, Mombasa,
Kisumu and Kitale. For instance the migrants from Nyamira to Nairobi since 1989 to 1995 were
16,820. However, cases of rural-urban migration is meant to pick up as many young school
leavers are attracted by job opportunities and the idea of releasing tension from scarcity of land
in the area.
Nyamira town being a district headquarters is expected to boost high migration rate
because it now attracts business people and has job opportunities available. This will mean that
93
jsfyamira urban centre’s population is expected to grow as more people move in from rurual areas
in search of jobs.
The fact that migration is less in Nyamira implies that people will remain with their
beliefs of getting more children and hence fertility rates may take time to change.
4,9.3 The migration of the School Age Population in the District
There are no significant migration of young age population (6-14) years in the district. However
a notable migration was realized in the late 1960s and earlier 1970s to Boarabu division when
most old people migrated with their families from various parts of Nyanza to the division.
Between 1989 and 1996 the number of migrants aged 6-14 to the district were 235 children.
This flow was mainly to Nyamira urban centre after Nyamira was pronounced the district
headquarters. The migration to Nyamira town therefore explains why Nyamira township
primary school is over-enroled.
4.10 Chapter Summary
From the above observation it is noted that Nyamira’s population is increasing at a place of 3%
per annum. This is one of the highest in the country; due to improved health conditions and
nutritional situation, mortality has declined. The decline in mortality is the major reason for
increasing high population growth rate. However, evidence also show a clear rise in fertility
rate. The reason for the rising fertility is connected with the modernization process. The fallen
mortality itself has also an effect on fertility rise through improved fecundity of marital life.
However, high fertility is being reduced by the high rate of accepting the family planning
Programmes in the district.
94
The rapid population growth rate has led to an increasing young age structure and high
dependency ratio in the district. This puts severe strains on the provision of social services such
as education. Fertility rate vary between different divisions according to socio-economical
development, but these variations are not very large. The rise in fertility and the decline in
mortality has lead into the dramatic increase of the youthful population thereby affecting the
demand of primary education and the capacity of the society to supply the demand. A detailed
examination of the primary school age (6-14) years versus school going population revealed that
it is becoming extremely difficult for the district educational authorities to cope with the bulging
numbers in this age.
95
CHAPTER FIVE
THE IMPACT OF POPULATION ON THE DISTRIBUTIONAL OF EDUCATION
FACILITIES
5.0 Introduction
This chapter analyses population growth rate vis-a-vis the primary school enrolment and its
relationship with school facilities i.e. number of classrooms, teachers, teaching materials
(textbooks, maps, charts etc). Various hypothesis are tested in this section based on the relation
of population growth rates and primary school facilities. The distribution of the primary
educational facilities is also shown and finally the chapter gives a correlation and regression
analysis together with the analysis of variance.
/
5.1 Development of enrolment in Nyamira
The enrolment in primary school in Nyamira has increased dramatically for both boys and girls
since independence. There were significant increases in primary school enrolment in 1974 when
school fees for the first four years were abolished in the whole of Kenya. The remaining fees
were abolished in 1979 and a free school milk programme was launched which motivated more
young people to join primary school. However, attending primary school is still far from free,
the compulsory expenditures for a household include school uniform, books and contributions to
the building funds. In Nyamira, school expenses rank number one for each household with
children at school; the expense also take up to half of the farmers income, the largest occurs
when children enter secondary school.
96
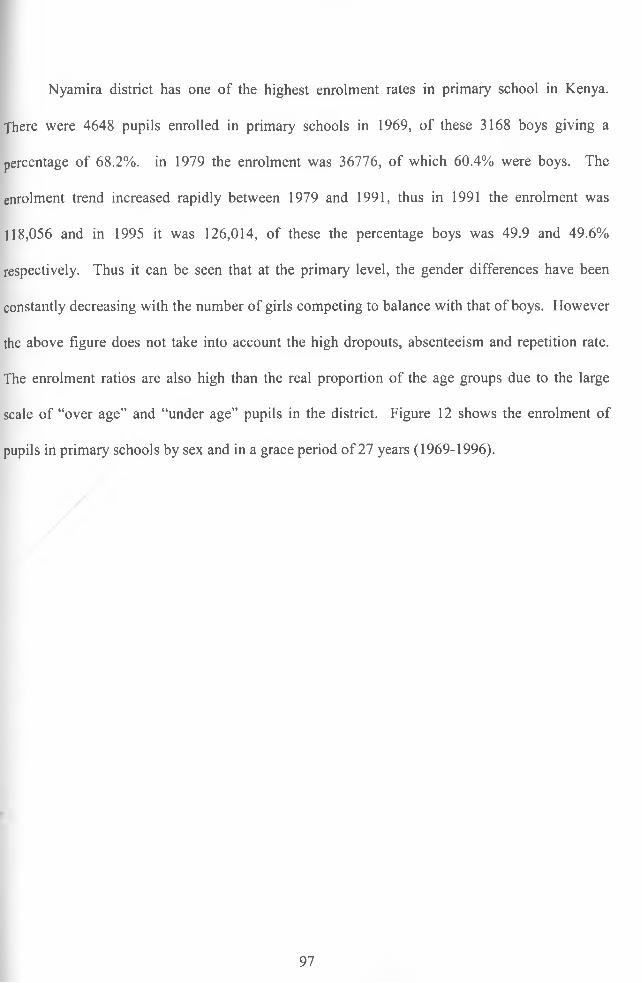
Nyamira district has one of the highest enrolment rates in primary school in Kenya.
There were 4648 pupils enrolled in primary schools in 1969, of these 3168 boys giving a
percentage of 68.2%. in 1979 the enrolment was 36776, of which 60.4% were boys. The
enrolment trend increased rapidly between 1979 and 1991, thus in 1991 the enrolment was
118,056 and in 1995 it was 126,014, of these the percentage boys was 49.9 and 49.6%
respectively. Thus it can be seen that at the primary level, the gender differences have been
constantly decreasing with the number of girls competing to balance with that of boys. However
the above figure does not take into account the high dropouts, absenteeism and repetition rate.
The enrolment ratios are also high than the real proportion of the age groups due to the large
scale of “over age” and “under age” pupils in the district. Figure 12 shows the enrolment of
pupils in primary schools by sex and in a grace period of 27 years (1969-1996).
97
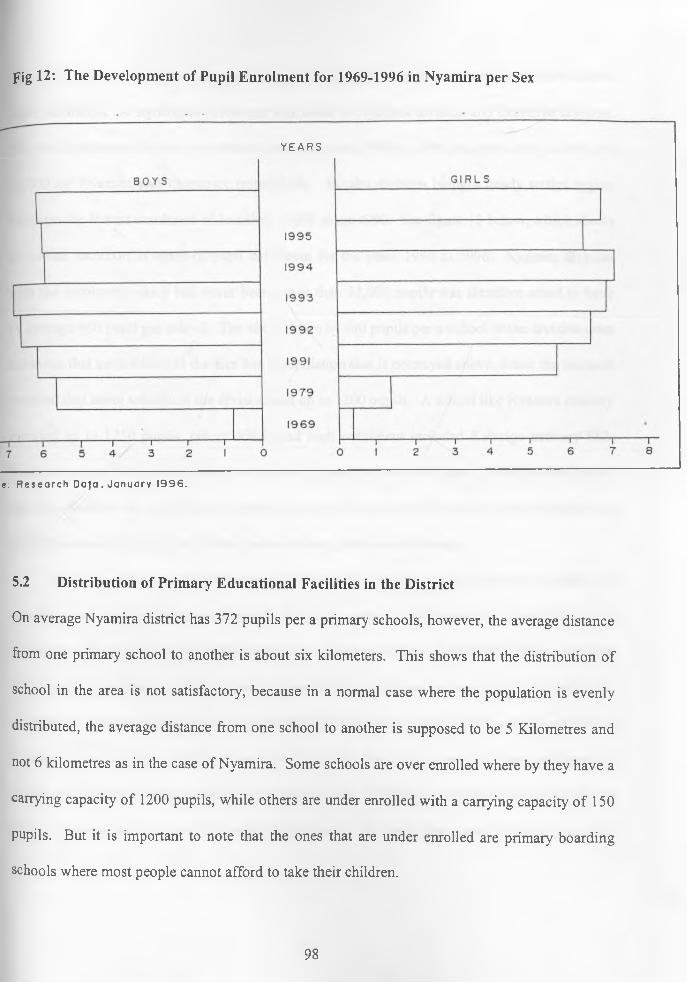
pig 12: The Development of Pupil Enrolment for 1969-1996 in Nyamira per Sex
Y EA R S
e: Research Daja. January 1996.
5.2 Distribution of Primary Educational Facilities in the District
On average Nyamira district has 372 pupils per a primary schools, however, the average distance
from one primary school to another is about six kilometers. This shows that the distribution of
school in the area is not satisfactory, because in a normal case where the population is evenly
distributed, the average distance from one school to another is supposed to be 5 Kilometres and
not 6 kilometres as in the case of Nyamira. Some schools are over enrolled where by they have a
carrying capacity of 1200 pupils, while others are under enrolled with a carrying capacity of 150
pupils. But it is important to note that the ones that are under enrolled are primary boarding
schools where most people cannot afford to take their children.
98

It is also important to note that there is Divisional variation in terms of primary school
pupil enrolment. A significant enrolment was noted in Nyamira division and Ekerenyo division.
The total enrolment for the two divisions for the years 1990 to 1996 has been over 32,000 and
31,000 for Nyamira and Ekerenyo, respectively. Borabu division being a newly settled region
indicates the lowest enrolment of less than 11000 since 1990. See figure 13 below, which shows
divisional variation in terms of pupil enrolment for the years 1990 to 1996. Nyamira division
with the enrolment which has never been lower than 32,000 pupils was therefore noted to have
by average 480 pupil per school. The above fiture of 480 pupils per a school in the division does
not mean that each school in the area has a population that is portrayed above, infact the research
revealed that some schools in the division had up to 1200 pupils. A school like Nyamira primary
enrolled up to 1250 pupils, others which had high enrolment included Kebirigo primary 882,
Makairo primary 722 among others, the picture is just of a few cited cases. Therefore this shows
that the enrolment in such school is higher than the Ministry of Education recommendation of
having less than 500 pupil per primary school in any given area in Kenya.
Similar variations were also noted in Ekerenyo division, in this division a number of
schools were noted to have more pupils than the number recommended by the Ministry of
Education. The schools which were found to be victims included: Kiabonyoru Primary School
with a pupil enrolment of 742, Kebabe Primary School with an enrolment of 820 pupils and
Nyamiranga Primary School with an enrolment of 692 pupils among the many schools in the
division. The remaining divisions were fair although there were cases of over enrolment in
Manga and Rigoma where schools had exceeded the Ministry’s recommendation of 500 in
Manga division had 621 and 589 pupils respectively. At least there were 10 schools in each
99

division where the enrolment was higher than the Ministry of Education recommendation of 500
pupils per each primary school in Kenya.
The high enrolment that was noted in various divisions is due to variations in the
distribution of the primary educational facilities in the divisions. There were variations in the
distribution of classrooms, teachers and teaching materials in the district. The fact of uneven
distribution of educational facilities has resulted into pupils clustering in schools with enough
facilities. Some schools were located far away in terms of distance from others, for instance,
Kiabonyoru primary school is about 6 Km from the surrounding school. The factor of distance
also explains why the school had more pupils than recommended. Other schools experience over
enrolment purely because of high population growth rates associated with declining mortality in
the district.
Fig 13: Average Distribution of Pupils Enrolment in each Division in Nyamira (1990-*
1996) in ‘00’ (aged 6-15 years)
p-oo o
EkerenyoBorabu
Mang a
Rigoma
Nyamira
GO -p-- onO O <oO O o
—^ N J |NJ ro uu KJUCO o p- CO N J CNo o o o o oo <o . o o o o Average
a
XTNI
Source: Research work 1996.

5.2.1 Average Distribution of Primary School Teachers
The average distribution of teachers in the district are 12 teachers per school in the district. A
total of 1917 teachers were counted in a research done on 160 primary schools in the district.
The number counted thus gives an average distribution of 12 teachers in each school in the
district. An average of 12 teachers in a school of between 500-700 pupils is quite a small
number. The distribution of teachers therefore tells us that every teacher in the district handles
between 30 and 60 pupils. Handling 60 pupils is not an easy work for one teacher. In a closer
examination on the distribution of teachers in the district it was discovered that some schools had
about 8 teachers while others had about 11 teachers.
Divisional distribution of teachers vary as per the number of pupils enrolled in each
school. Nyamira division which has a pupil enrolment of 34,989 as per 1996 has a total teaching
force of 1084, Ekerenyo division had a pupil population of 33,419 and a teaching staff of 978.
Borabu division is the one which is well served by the teaching staff. In Borabu an average
distribution of teachers is 15 teachers per school, while the average distribution in Ekerenyo
division is 9 teachers per school. Therefore it is clear that in Borabu each teacher handles a
population of 20 pupils while in Ekerenyo a teacher handles 35 pupils. In Ekerenyo teachers are
less than what the Teachers Service Commission recommends; there are some cases in the
division where a teacher serves a population of 40 to 60 pupils. See figure 14.
In general Nyamira district has a shortage of teachers. For instance Ekerenyo division
has about 8 classes going minus a teacher at any given teaching season because of the shortage
of teachers. For the district to have enough teachers there is a need for the government to
allocate the district with over 120 teachers.
101
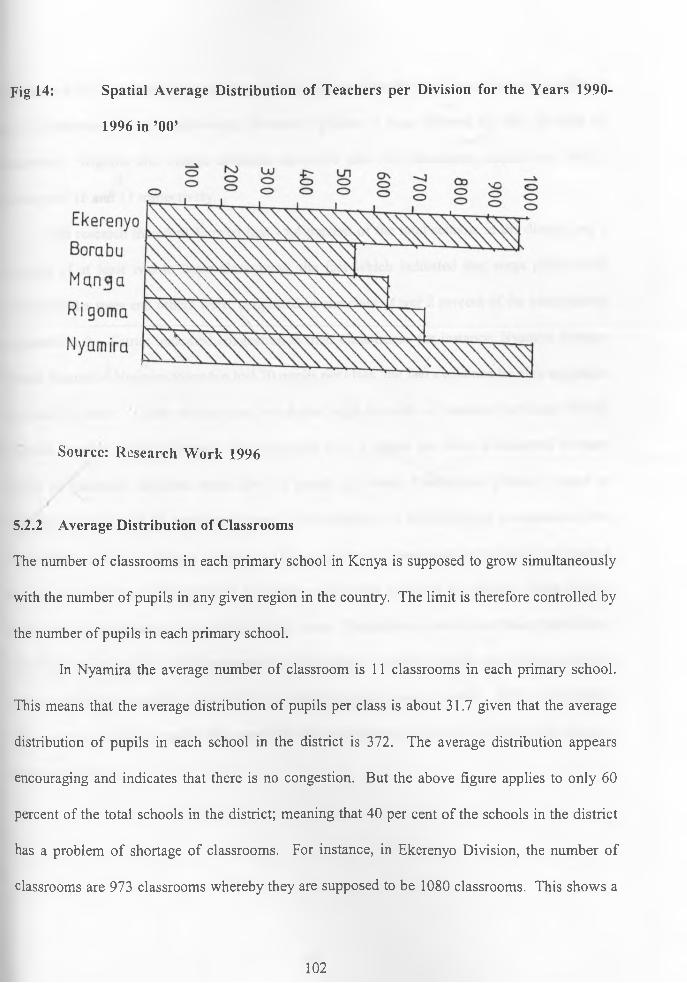
Fig 14: Spatial Average Distribution of Teachers per Division for the Years 1990-
1996 in ’00’
Source: Research Work 1996
5.2.2 Average Distribution of Classrooms
The number of classrooms in each primary school in Kenya is supposed to grow simultaneously
with the number of pupils in any given region in the country. The limit is therefore controlled by
the number of pupils in each primary school.
In Nyamira the average number of classroom is 11 classrooms in each primary school.
This means that the average distribution of pupils per class is about 31.7 given that the average
distribution of pupils in each school in the district is 372. The average distribution appears
encouraging and indicates that there is no congestion. But the above figure applies to only 60
percent of the total schools in the district; meaning that 40 per cent of the schools in the district
has a problem of shortage of classrooms. For instance, in Ekerenyo Division, the number of
classrooms are 973 classrooms whereby they are supposed to be 1080 classrooms. This shows a
102
shortage of 107 classrooms, 66 percent of the schools in the division have also not completed
their workshops. The neighbouring division Nyamira is also affected by the shortage of
classroom. Rigoma and Manga divisions have 670 and 742 classrooms respectively with a
shortage of 16 and 17 respectively.
The research therefore showed that 15.4 percent of the total schools in the district had a
shortage of at least two to three classrooms, the fact which indicated that some pupils were
learning under trees and others were congested in one class. Over 2 percent of the total schools
examined in the district indicated congestion in their classrooms, for instance, Nyamira Primary
School located in Nyamira township had 70 pupils per class, the fact explained by high migration
rate into the town. Other schools also which had high numbers of students per class include
Kiogutu Primary school in Manga division which had 72 pupils per class, Kiabonyoru Primary
school in Ekerenyo division which had 72 pupils per class, Kiabonyoru primary school in
Ekerenyo division had 68 pupils per class. The congestion in these schools is associated with
high fertility rate and declining mortality. The congestion in classrooms and schools has resulted
in high repetition rate, high dropouts and poor examination results in the district. Most student
dropout of school because of repeating several times. Repetition in most cases make pupils have
little hope in education, it also increases the age of stay in school whereby the young ones who
mature very fast, especially girls seek for marriage and dropout of school. Most headmasters
who were interviewed revealed that repetition alone contribute to about 2 percent of the dropout
rates in the district.
103

Fig 15: Divisional Average Variation in the Numbers of Classroom for the Years
1992-1996 in ‘00’
Ekerenyo
Borabu
Manga
RigomaNyamira
x
Source: Re search Work 1996
1200

5.2.3 Textbooks
fhe essential textbooks recommended by the Ministry of Education that will go in line with the
current educational system (8.4.4 system of education) are at least 8 textbooks per pupil. The
recommended books includes at least one English book, Kiswahili, Maths, Science and
Agriculture, G.H.C. (Geography History and Christian religious book), Music, Art and Craft, and
a Business textbook. The above recommendation was made in 1986 when the current 8.4.4
system of education started in Kenya. Any 8.4.4 pupil in Kenya is therefore required to have a
copy of all the books indicated above plus any other related textbook. The above books are
supposed to be products of the Kenya Institute of Education.
The average distribution of textbooks per pupil in the district is 2.78 books. There are
some cases where a pupil does not possess even a single textbook like in North Mugirango
Chache location where over 70 percent of the pupils had one or no textbook at all. Ekerenyo
division in which the location is found appears to be the worst hit in the aspect of textbook. The
average distribution of textbook in the division is 1.1 books per pupil. In Nyamira division the
average distribution of textbooks are 1.6 textbooks per pupil. The division is followed by
Rigoma division with an average distribution of 2.7 books per pupil, Nyamira 2.9 books per
pupil, Manga 3.3 books per pupil, and Borabu division had an average distribution of 3.4
textbooks per pupil. This shows that the average distribution of the textbooks is 2.78 books per
pupil. This average of 2.78 books in the district when compared with the Ministry of
Education’s recommendation of 8 textbooks per pupil is quite low. See the divisional variation
of textbook for the years 1994-1995 in figure 16. The reason attributed to this low distribution of
textbooks was associated with the high fertility rate in the study area.
105

The issue of textbooks is very crucial affecting many parents in the district. In fact 20 per
cent of the pupils who drop out of school in the district are affected by the lack of textbooks.
Most pupils are compelled to purchase their own textbooks and when they fail to meet the
condition most of them end up being put out of school and they opt never to come back. The
problem here is not that most parents are too poor to afford to the purchase of textbook for each
child, but the problem is associated with high fertility. Here is the case where a headmaster of
Kenyoro primary school was quoted saying:
“C o n s id e r a c a se w h e re o n e p a r e n t h a s e ig h t c h ild re n in o n e s c h o o l a n d is re q u ire d to
b u y a t lea s t seven tex t b o o ks f o r ea ch c h ild to g e th e r w ith b u y in g s c h o o l un ifo rm , e x erc ise
books, p a y in g f o r b u ild in g f u n d a n d m a n y o th er s c h o o l d em a n d s; w ill h e b e a b le to m ee t
a ll th e r e q u ire m e n t? T h ere fo re th e a fte rm a th o f a ll th is is, th e p a r e n t tr ie s to c o m p e l
so m e p u p i l to lea v e s c h o o l a t th e e x p en se o f th e o thers. ”
The problem of textbooks is therefore associated in most cases with high population growth rate
and the only solution is by reducing the population growth rate.
106

Fig 16: Divisional Average Distribution of Textbooks in Nyamira for the Years 1989-
1994 in ‘00’
-
Source: Research Work 1996
5.2.4 Maps, Charts and Other Related Facilities
The Ministry of Education requires that each primary school should have reading charts
especially wall charts having numbers or diagrams, geographical charts, health charts, etc for
illustration purposes. The charts are supposed to be over 4 per a class in normal circumstances
meaning that each school is supposed to have at least 16 charts. Geographical maps are the ones
recommended in each primary school. The well accepted maps for use here include a map of the
107

world, Africa, East Africa, Kenya and maps of various provinces and districts. Each class in
each primary school is supposed to have at least 4 of each of the above named maps. These
maps help pupils in locating features. These maps are supposed to be accompanied by the
leading Atlas.
The distribution of maps and charts in Nyamira district is quite uneven where in most
cases some schools have 10 to 15 maps and charts while others have as less as 3 maps and charts.
The average distribution of maps in the district is five maps in each school while the distribution
of charts is 7 charts in each school. It appears that the distribution is not adequate the fact which
has affected the education performance in the area. As it can be seen by average 6 pupils share 1
map while 4 pupils share one chart. Such a situation does not give a pupil the freedom of
reading through a map of his or herself.
There are divisional variation in the distribution of Geographical and Reading charts.
Nyamira division had high numbers of Geographical maps o 201 while Borabu division had the
highest number of charts of 344. This indicates that the average distribution of maps in Nyamira
is too low where about one map could be shared by 170 pupil. The rest of the divisions had a
meager number of maps and charts, to the extend that 250 pupil could share one map. See
figures 17 and 18 which shows the average divisional distribution of maps and charts for the
years 1990-1996. In most cases those who were interviewed attributed the scarcity of maps to
poverty in the area and also to high population growth rates.
108

Fig 17: Spatial Average Distribution of Geographical Maps in each of the Five Divisions in
the District (1989-1995)
Ekerenyo
BorabuM a n g a
RigomaNyuinira
Fig 18: Divisional Average Distribution of Teaching Charts (1989-1993) in ‘00’
Ekerenyo
Borabu
M a n g a
Rigoma
Nyam ira
e
Source: Research work | ‘>%.
109
The distribution of other facilities such as rackets and projectors prove to be in short supply in
the whole district. Over 60 percent of the schools visited in the district had no rackets and
projectors. This was a horrible situation given that the current educational system advocates for
practical skills at primary level. The shortage of such facilities has in most cases affected the
performance in such subjects as woodwork in most primary school in the district. The average
distribution of 0.63 projectors per school and 1.5 distribution of rackets per school is infact quite
low. The fact that calls for the government to intervene.
In short the educational facilities in the district are inadequate and they are unevenly
distributed. Of the 160 schools interviewed, 76.4 percent did not have sufficient facilities. Many
of these schools lacked teachers, textbooks, classrooms, maps and etc. Most of these schools
were faced with a problem of over enrolment which was due to high fertility rate in the area and
declining mortality.
5.3 Analysis of the Relationship Between Pupil Enrolment and Educational Facilities
5.3.1 Simple Linear Regression Analysis
In determining the relationship between pupil enrolment and educational facilities, simple linear
regression analysis (SLRA) was vital. The method uses the least square approach which has the
following advantages; it provides a unique solution, it is relatively simple to apply and it possess
certain desirable statistical properties. The SLRA was used in this case to establish the
functional relationship that exists between pupil enrolment and the number of teachers,
classrooms, charts and maps. The scatter plots were drawn to show the direction of the
relationships, using the model shown below.
110
y - B 0 + B x i+ e /
In this case the aim was to determine whether the relationship is either positive or negative. In
each parameter that was regressed the correlation coefficients (R) for each was identified and
each of them tested separately for the true significance. In the plot on pupil enrolment against
the number of classrooms in the district the regression coefficient which came out after the
analysis indicate an intercept of 25.90989 and a slope of 2.1815 as indicated on the regression
line in figure 19. The correlation coefficient established was 0.7333 which showed a strong
relationship between enrolment and classrooms and the coefficient of determination, R is 0.5377
which shows that 53.8 percent is the proportion accounted for by the regression.
I l l
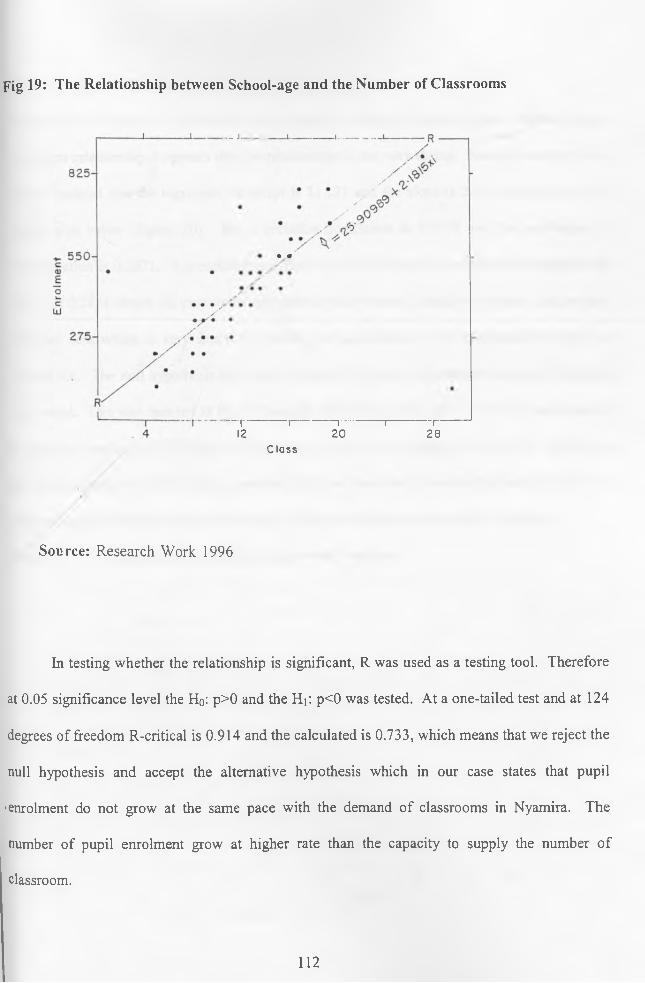
Fig 19: The Relationship between School-age and the Number of Classrooms
... a.
• •
— [---------- 1----------- 1----------1---------- r-12 20 28
Class
Source: Research Work 1996
In testing whether the relationship is significant, R was used as a testing tool. Therefore
at 0.05 significance level the Ho: p>0 and the Hi: p<0 was tested. At a one-tailed test and at 124
degrees of freedom R-critical is 0.914 and the calculated is 0.733, which means that we reject the
null hypothesis and accept the alternative hypothesis which in our case states that pupil
■enrolment do not grow at the same pace with the demand of classrooms in Nyamira. The
number of pupil enrolment grow at higher rate than the capacity to supply the number of
classroom.
112
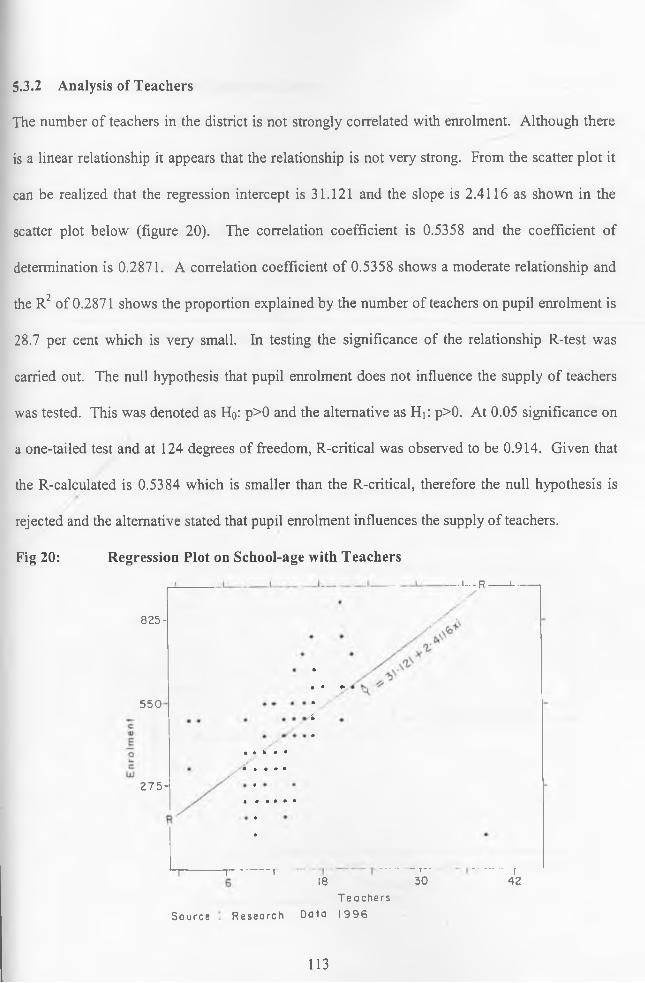
The number of teachers in the district is not strongly correlated with enrolment. Although there
is a linear relationship it appears that the relationship is not very strong. From the scatter plot it
can be realized that the regression intercept is 31.121 and the slope is 2.4116 as shown in the
scatter plot below (figure 20). The correlation coefficient is 0.5358 and the coefficient of
determination is 0.2871. A correlation coefficient of 0.5358 shows a moderate relationship and
the R2 of 0.2871 shows the proportion explained by the number of teachers on pupil enrolment is
28.7 per cent which is very small. In testing the significance of the relationship R-test was
carried out. The null hypothesis that pupil enrolment does not influence the supply of teachers
was tested. This was denoted as Ho: p>0 and the alternative as Hi: p>0. At 0.05 significance on
a one-tailed test and at 124 degrees of freedom, R-critical was observed to be 0.914. Given that
the R-calculated is 0.5384 which is smaller than the R-critical, therefore the null hypothesis is
rejected and the alternative stated that pupil enrolment influences the supply of teachers.
Fig 20: Regression Plot on School-age with Teachers
5.3.2 Analysis of Teachers
825-
550
--------I - . - R --------------1----------------
• *
275-
1-------- r
Source Research
18Teachers
Data 1996
- T“30
r42
113
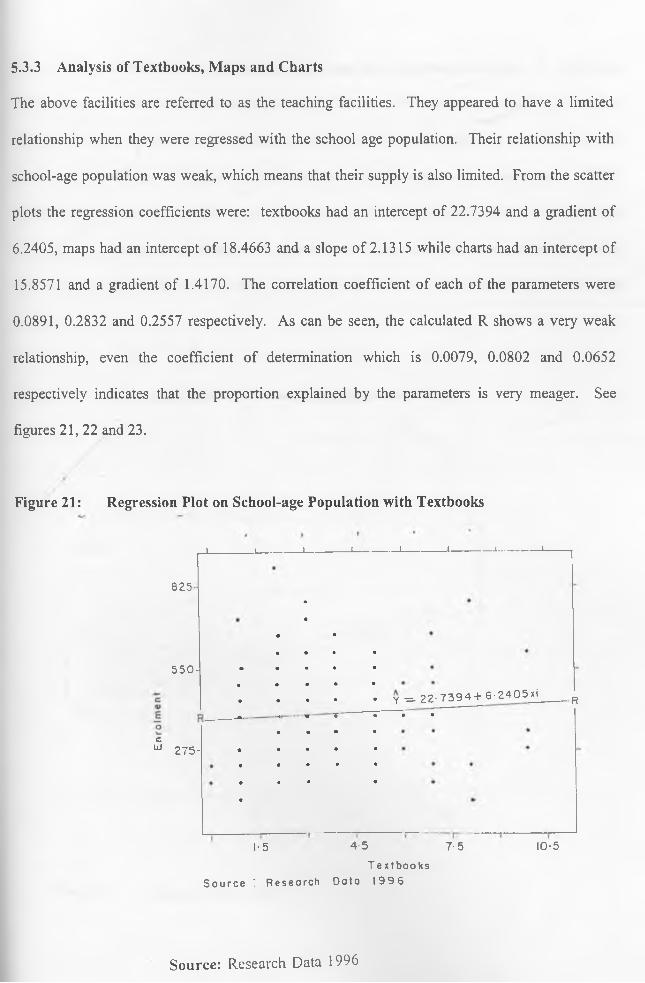
The above facilities are referred to as the teaching facilities. They appeared to have a limited
relationship when they were regressed with the school age population. Their relationship with
school-age population was weak, which means that their supply is also limited. From the scatter
plots the regression coefficients were: textbooks had an intercept of 2 2 .7 3 9 4 and a gradient of
6 .2 4 0 5 , maps had an intercept of 1 8 .4 6 6 3 and a slope of 2 .1 3 1 5 while charts had an intercept of
1 5 .8 5 7 1 and a gradient of 1 .4 1 7 0 . The correlation coefficient of each of the parameters were
0 .0 8 9 1 , 0 .2 8 3 2 and 0 .2 5 5 7 respectively. As can be seen, the calculated R shows a very weak
relationship, even the coefficient of determination which is 0 .0 0 7 9 , 0 .0 8 0 2 and 0 .0 6 5 2
respectively indicates that the proportion explained by the parameters is very meager. See
figures 2 1 , 2 2 and 2 3 .
5.3.3 Analysis of Textbooks, Maps and Charts
Figure 21: Regression Plot on School-age Population with Textbooks
825-
550-
j ___________ i___________ l___________ i------------------1----------------- 1-----------------1-----------------1—
cUJ 275-
■ •
1-5 4-5 7'5T extbooks
Source ! Research Data 1996
Y = 22-7394+ 6-2405^_____p
10-5
Source: Research Data 1996

The true significance here was tested using the correlation coefficient, R. The null
hypothesis tested in this case stated that the school does not out number the supply of textbooks,
maps and charts in Nyamira. Using Ho:p>0 and Hi:p<0 the null hypothesis was tested at 0.05
significance level and 156 degrees of freedom for each parameter on a one-tailed test. The R-
critical for each of the parameter was 0.914. Since the R-critical is greater than the R-calculated
for each of the parameters, therefore we reject the null hypothesis and state the alternative that
the school age population out number the supply of textbooks, maps and charts in Nyamira
district.
Fig 22: Regression Plot of School-age Population with Maps
Sou rce: Research Data 1996
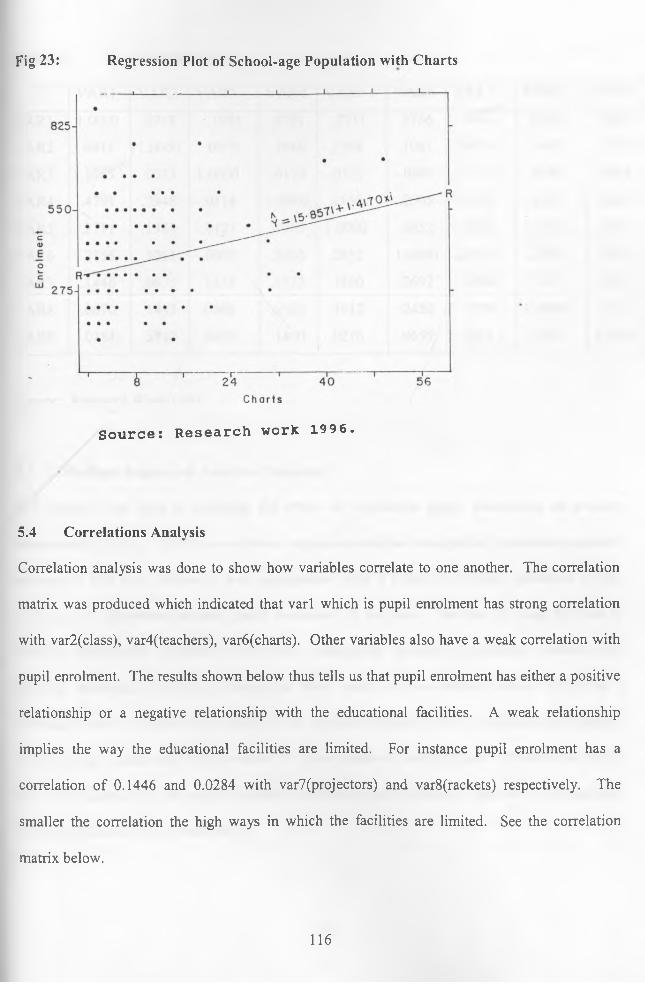
Fig 23: Regression Plot of School-age Population with Charts
Source: Research work 1996.
5.4 Correlations Analysis
Correlation analysis was done to show how variables correlate to one another. The correlation
matrix was produced which indicated that varl which is pupil enrolment has strong correlation
with var2(class), var4(teachers), var6(charts). Other variables also have a weak correlation with
pupil enrolment. The results shown below thus tells us that pupil enrolment has either a positive
relationship or a negative relationship with the educational facilities. A weak relationship
implies the way the educational facilities are limited. For instance pupil enrolment has a
correlation of 0.1446 and 0.0284 with var7(projectors) and var8(rackets) respectively. The
smaller the correlation the high ways in which the facilities are limited. See the correlation
matrix below.
116

Table 5.1 Correlation Matrix
VAR1 VAR2 VAR3 VAR4 VAR5 VAR6 VAR7 VAR8 VAR9
VAR1 1.0000 .6918 .1085 .4791 .2711 .2756 .1446 .0670 .0284
VAR2 .6918 1.0000 .0075 .7948 .1384 .1061 .0876 .1445 .1240
VAR3 .1085 .0075 1.0000 -.0114 -.0121 -.0095 .1534 .0080 .0429
VAR4 .4791 .7948 -.0114 1.0000 .1155 .2005 .1533 .2323 .1400
VAR5 .2711 .1384 -.0121 .1155 1.0000 .2852 .1860 .1612 .0276
VAR6 .2756 .1061 -.0095 .2005 .2852 1.0000 .2692 .2458 .0659
VAR7 .1446 .0876 .1534 .1533 .1860 .2692 1.0000 .3770 .2468
VAR8 .0670 .1445 .0080 .2323 .1612 .2458 .3770 1.0000 .1346
VAR9 .0284 .1240 .0429 .1400 .0276 .0659 .2468 .1346 1.0000
S o u rce: R e se a rc h W ork 19 9 6
5.5 Multiple Regression Analysis (Stepwise)
The method was used to establish the effect of population (pupil enrolment) on primary
educational facilities. In this case stepwise regression analysis was applied, the method appeared
relevant in this case because it was necessary to have a number of causal influences on the
variance in a dependent variable (pupil enrolment) in this case. The aim of using this was to
identify independent variables in this case educational facilities (classrooms, teachers and
teaching materials); isolating in particular those which do have critical causal effects (in a
statistical sense) and should be retained in an equation required either to describe the variance.
To test a true significance in this matter “t” value appeared unsatisfactory. Therefore in testing
the “true’ significance the partial regression coefficient and its standard error were used to show
a true significance of the relationship.
117
In this research the aim was to establish the casual effect of population growth on
primary educational facilities (classroom, teachers and teaching materials). The major aim was
to indicate the spatial variations in population growth in Nyamira district using the following
variables var2(classroom), var3 (textbooks), var4(teachers), var5(maps), var6(charts),
var7(projectors) and var8(rackets). Multiple regression analysis shows that population growth
rate (pupil enrolment) has causal influence on all the educational facilities but it has major
relationships with the number of classrooms, teachers and charts. The above of coefficient of
determination (R2) than other variables which therefore means that the portion that the variables
explain on pupil enrolment is high as can be seen below. The analysis showed the partial
correlation coefficient (R) of 0.69183, 0.7211 and 0.73833 for classrooms, charts and teachers
respectively with pupil enrolment. Stepwise regression therefore indicated that the above
facilities appeared to have a critical causal effect when regressed with pupil enrolment./
• • 2The analysis also indicated the coefficient of determination (R ) of 0.47815, 0.5198 and
0.53395 for classrooms, charts and teachers respectively with pupil enrolment. The coefficient
of determination thus tells us that the portion explained by classrooms, charts, and teachers on
pupil enrolment is 47.8%, 51.9% and 53.3% respectively. As it can be seen the portion that can
be accounted for is an average portion, which therefore tells us that the relationship that exist
between the educational facilities as was extracted by stepwise method is a moderate type of
relationship.
The nature of relationship although, has a positive link it can be seen that the pupil
enrolment in the district in most cases outweighs the supply of the educational facilities.
Actually the coefficient of 0.48815, 0.5198 and 0.5335 for the number of classrooms, charts and
teachers leaves out a variance of 52.2 percent, 48.1 percent proportion an unaccounted for. This
118
5.6 Analysis of Variance
In order to establish the truth about the population growth (pupil enrolment) and their influence
on school facilities and whether the influence is significant a null hypothesis; that pupil
enrolment in most cases does not outweigh the demand for such facilities in Nyamira district was
tested using the partial F-test. Remember similar tests were done above using the correlation
coefficient (R) and the results that were tabulated indicated that pupil enrolment in most cases
outweigh the supply of educational facilities. Hence the same hypothesis has been tested here to
verify the findings that were seen above. The partial F-test was used in order to identify each
educational facility separately in testing whether pupil enrolment does not outweigh the supply
of teachers. A F-test done at a two-tailed test on 0.001 significance level at degrees of freedom
of 1 and 22 indicated a F-critical of 5.42 (see results below). Since the F-computed is 48.7378
and is greater than the F-critical, it is therefore important to reject the null hypothesis and state
the alternative hypothesis which indicates that pupil enrolment outweighs the supply of teachers
in Nyamira district.
variation which is an unaccounted for means that the pupil enrolment grows at a rapid rate than
the supply of the facilities mentioned above.
119
5.6 Analysis of Variance
In order to establish the truth about the population growth (pupil enrolment) and their influence
on school facilities and whether the influence is significant a null hypothesis; that pupil
enrolment in most cases does not outweigh the demand for such facilities in Nyamira district was
tested using the partial F-test. Remember similar tests were done above using the correlation
coefficient (R) and the results that were tabulated indicated that pupil enrolment in most cases
outweigh the supply of educational facilities. Hence the same hypothesis has been tested here to
verify the findings that were seen above. The partial F-test was used in order to identify each
educational facility separately in testing whether pupil enrolment does not outweigh the supply/
of teachers. A F-test done at a two-tailed test on 0.001 significance level at degrees of freedom
of 1 and 22 indicated a F-critical of 5.42 (see results below). Since the F-computed is 48.7378
and is greater than the F-critical, it is therefore important to reject the null hypothesis and state
the alternative hypothesis which indicates that pupil enrolment outweighs the supply of teachers
in Nyamira district.
variation which is an unaccounted for means that the pupil enrolment grows at a rapid rate than
the supply of the facilities mentioned above.
119

Table 5.2 Analysis of Variance (i)
DF Sum of Squares Mean Square F
Regression 3 1447727.60780 482575.86927 48.73783
Residual 122 1207978.71760 9901.46490
S o u rce : R e se a rc h W ork 1 9 9 6
Likewise similar tests were carried to test whether pupil enrolment outweighs the supply of the
number of classes and charts in the district. The results indicated that F-computed for the
number of classrooms was 66,72037 and 113.834 for charts. At a two-tailed test and a
significance level of 0.001, and at 2 and 123 degrees of freedom for the number of classrooms;
and 1 and 124 degrees of freedom for the charts, the F-critical were 7.32 and 10.83 respectively
(see the results below). Since the F-calculated is greater than the F-critical the null hypothesis
that pupil enrolment does not outweigh the supply of classrooms and charts can be rejected and
the alternative which states that the pupil enrolment in the district outweighs the supply of such
facilities be accepted.
Table 5.3: Analysis of Variance (ii)
DF Sum of Squares Mean Square F
Regression 2 1380921.24415 690460.62208 66.62037
Residual 123 1274785.08124 10364.08124
S o u rce : R e se a rc h W ork 1996
UNIVERSITY OF NAIRORi EAST AFRiCANA COLLECTION
120pI C I WO T rA MFLMORtflt.
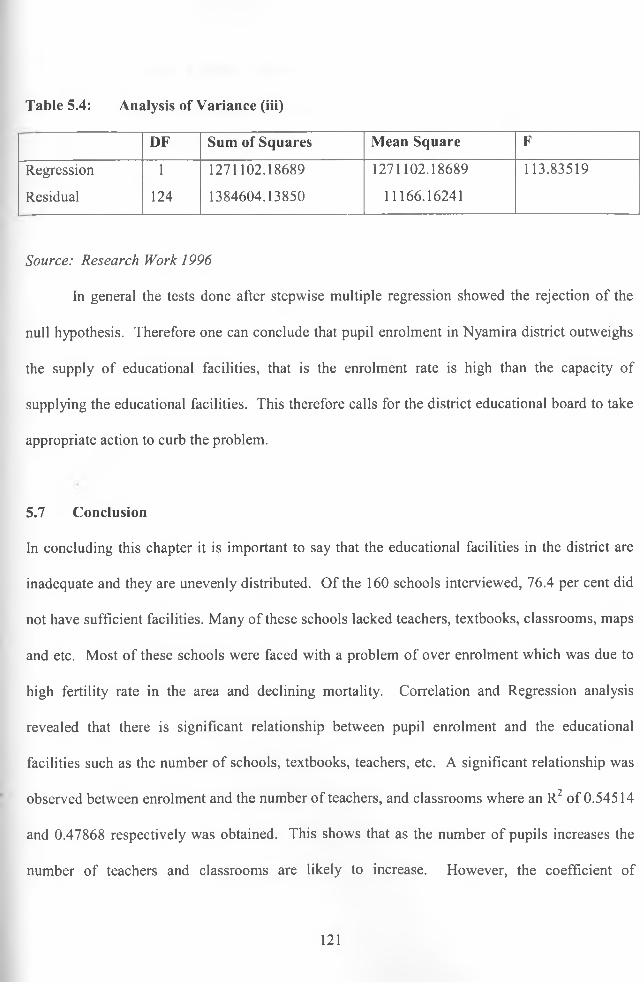
Table 5.4: Analysis of Variance (iii)
DF Sum of Squares Mean Square F
Regression 1 1271102.18689 1271102.18689 113.83519
Residual 124 1384604.13850 11166.16241
S o u rce : R e se a rc h W ork 19 9 6
In general the tests done after stepwise multiple regression showed the rejection of the
null hypothesis. Therefore one can conclude that pupil enrolment in Nyamira district outweighs
the supply of educational facilities, that is the enrolment rate is high than the capacity of
supplying the educational facilities. This therefore calls for the district educational board to take
appropriate action to curb the problem.
5.7 Conclusion
In concluding this chapter it is important to say that the educational facilities in the district are
inadequate and they are unevenly distributed. Of the 160 schools interviewed, 76.4 per cent did
not have sufficient facilities. Many of these schools lacked teachers, textbooks, classrooms, maps
and etc. Most of these schools were faced with a problem of over enrolment which was due to
high fertility rate in the area and declining mortality. Correlation and Regression analysis
revealed that there is significant relationship between pupil enrolment and the educational
facilities such as the number of schools, textbooks, teachers, etc. A significant relationship was
observed between enrolment and the number of teachers, and classrooms where an R2 of 0.54514
and 0.47868 respectively was obtained. This shows that as the number of pupils increases the
number of teachers and classrooms are likely to increase. However, the coefficient of
121

determination explains a small variance which means that although there is a positive
relationship between enrolment and educational facilities; the facilities are not enough.
Therefore one can conclude that pupil enrolment in Nyamira district outweighs the supply of
educational facilities, that is the enrolment rate is high than the capacity of supplying the
educational facilities.
122

CHAPTER SIX
SUMMARY, CONCLUSIONS AND RECOMMENDATIONS
6.0 Summary and Conclusions
The primary objective of this concluding chapter is to summarize the major findings of he study
and spell out the implications of this to planning. First, a brief summary of the findings and
conclusion of the research is given. Second, a recommendation regarding primary educational
planning are outlined.
This study has paid special attention to the back and forward linkages of population
growth and a specific field of social services; education. The working hypotheses implied a
changing demographic trend in Nyamira i.e. fertility in Nyamira has been experiencing high
growth and mortality has been declining. Other hypotheses include that the distribution of0
education facilities is uneven and the population growth does not outweigh the supply of
education facilities. The approach taken for analysis has utilized a regional perspective; both
demographic processes and educational issues have a clear dimension.
Nyamira’s population is increasing at a pace of 3% per annum. This is one of the highest
in the country; due to improved health condition and nutritional situation, mortality has been
declining. The decline in mortality is the major reason for increasing high population growth
rate. However, evidence also shows a clear rise in fertility rate. The reason for the rising
fertility is connected with the modernization process. The fallen mortality itself has also an
effect through improved fecundity of marital life. However, high fertility as it is discussed
currently is being reduced by the high rate of accepting the family planning programmes in the
district.
123

The rapid population growth rate has led to an increasing young age structure and high
dependency ratio in the district. This puts severe strains on the provision of social services such
as education. Fertility rate vary between divisions according to the source of socio-economical
development, but these variations are not very large.
In light of the evidence, the most important single determinant of fertility decline seems
to be female education in the district. Rising levels of female education increase fertility in
several ways: the age at first marriage tends to rise with increasing education; the knowledge
and use of family planning programme is more widespread among educated women than among
their uneducated sisters as is the knowledge of hygiene and child care. Initially, these factors
may have contradicting effects on fertility levels. The major drop comes after a woman has
received nine or more years of education. The norm of large family size is so universally
accepted in Nyamira that abandoning this norm will require a major attitude change. However,
the result of the last survey show a slight downward trend indicating that the period of fertility
increase might be over and promising eventually an acceptance of small families in the district.
The trend also indicate a certain gap in the fertility expectation and the use of family
planning among women in Nyamira. Use of family planning method is still effectively confined
to the fairly narrow Strathmore of well-educated women. This poses a specific challenge to the
family planning programme which is the oldest in Kenya but which has so far largely failed to
reach the majority of women even when there ha been a potential demand.
In addition to the rise in fertility, mortality declined significantly in the period under
consideration. Crude death rate and infant mortality rates declined from 13 and 109 respectively
in 1989 to 9 and 82 respectively in 1995. All the natural factors have acted together to reinforce
124

population growth in Nyamira. However the influence of AIDS is likely to influence mortality
in the future if steps are not taken to curb the spread at which it is spreading now.
Migration has not played any significant role in population growth in the district as there
are no major regulations in the area, but in future with, the growing of Nyamira town it is likely
to have a major role in population growth rate.
Under the demographic conditions, the population of youth has been increasing
dramatically, thereby affecting the demand of primary education and the capacity of the society
to supply the demand. A detailed examination of the primary school age (6-12) years versus
school going population revealed that it is becoming extremely difficult for the district
educational authorities to cope with the bulging numbers in this age. In the period 1989 to 1996
January, the population in the age group 6-12 years rose by about 40% in only five years. This
tremendous increase in the school age population has tended to increase the absolute numbers in
enrolment; in the year 1989 to 1996 January the number of pupils enrolled in the district primary
school rose by 46.3% whereas enrolment ration was 86.3%; the fact that has resulted in a lot of
congestion in the area in many of the primary schools hence resulting into lack of classrooms
plus other teaching materials. It is therefore seen that there is need to expand on the number of
classrooms in the district.
An analysis of the distribution of teachers, number of classrooms, textbooks and other
facilities indicated a skewed nature of trend. Some division like Nyamira and Rigoma have more
teachers than divisions like Ekerenyo and Manga.
Nyamira division had a fair distributions of teachers, textbooks and schools followed by
Borabu and Rigoma, while the least in terms of distribution of facilities was Ekerenyo and
Manga. This can be explained on the basis of differential socio-economic setting as portrayed in
125

the district. In terms of teachers grade, almost all teachers were SI, PI and P2 holders and were
fairly distributed in the district. Generally, Nyamira is fairly provided with qualified teachers.
By 1996 January, 99.1% of the total number of teachers were professionally qualified and there
was an overall pupil-teacher ratio of 36. But whether the same standard will continue in the
prevailing circumstances of limitless increase in the school age population, faced with limited
resources, is a question we cannot venture to answer at this juncture.
Correlation and Regression analysis revealed that there is significant relationship between
pupil enrolment and the educational facilities such as the number of schools, textbooks, teachers,
etc. A significant relationship was observed between enrolment and the number of teachers and
classrooms where R2 of 0.54514 and 0.47868 respectively were obtained. This shows that as the
number of pupils increases the number of teachers and classrooms are likely to increase.
However, the coefficient of determination explains a small variance which means that although
there is a positive relationship between enrolment and education facilities; the facilities are not
enough. The testing of the hypothesis also showed a weak relationship between pupil enrolment
and educational faculties.
From the analysis it is clear that Nyamira will be facing problems in educating its young
and rapidly growing population. Now, the population growth rate is out spacing further
expansion of primary education. In the current economic situation sufficient resources will be no
longer available to devote the educational requirement of the rapidly increasing numbers of
school age children. Even if the provision of education for the future is and must be one of the
highest priority objectives of any district in Kenya, a balance must be found between the
resource and used between and other sectors. It is clear that efforts have been made towards
satisfying a yearly demand for education in Nyamira. This demand is likely to continue to
126

increase during the next decade. If population increase does not slow down no more than 90.3
percent of children aged 6 to 12 years in Nyamira will be enrolled in schools by the year 2000.
The proportion may even decline given the concept of resource constraints and funds. Much
more could be achieved in terms of coverage if birth rates were to be reduced. The future growth
of school enrolment ratio will therefore be determined to a great extent by governmental policy
regarding to population increase and means of financing primary education in rural areas.
6.1 Policy Recommendations
The above major findings as well as others cited in the analytical chapters shows that it will be
extremely difficult to provide any simple straight forward solution to this dilemma. It is this
dilemma that has induced the author to hazard some worthwhile recommendations regarding
population and the provision of education in Nyamira. Such recommendations will of course not
determine the most acceptable policy, but could help to eliminate wasteful measures bringing
onto view a greater knowledge of the realities with which policies must be formulated.
Since the present population growth is largely due to individual behaviour of the parents
which is basically rational in their particular socio-economic context and; changing socio
economic condition in society generate a certain family size and in turn a certain family level.
This is however, provided that the means of reaching the desired family size are available and
that the knowledge of them exist. Western influence has significantly affected the traditional
methods of fertility control. An effective programme promoting modem family planning
services may be valuable in compensating for this.
127
In the meantime, it seem that the only feasible way of coping with the situation would be
do adopt an integrated approach to tackling the problem complex. A family planning
programme alone can not be effective in limiting the population growth without societal factors
contributing to the creation of pre-condition to lower the desired family size i.e increasing the
age at marriage, providing at least nine years of education to all women in the district and
increasing the opportunity of more female in the working sector.
Primary education is a basic human right and prerequisite for socio-economic
development, it is necessary for the nation to ensure that all those in their appropriate ages have
access to the necessary educational facilities. This can be done through expansion of the
facilities in conjunction with a suitable population programme to ensure that the demand for the
facilities does not outweigh the capacity of the society to supply them. Most likely family
planning programme and the education fund programme would be the most likely policy to be
taken.
More school places should be available yearly to cater for the increasing school age
population. Short term measure to ensure this could include: extension of the already existing
schools particularly where there is ample space for expansion, in this case schools like Kerema,
Ekerubo, Nyamusi, Kiogutwa, among others which appear to have space needs large expansion
so as to accommodate more students.
In order to plan for primary education in a rural region like Nyamira it is also important
to make long term forecasted concerning the school age population so that the required facilities
in terms of land, classrooms, teachers and teaching materials can be prepared well in advance. It
is therefore necessary to make projections of the population based on the prevailing demographic
situation. Such projections should incorporate alternative population trends in order to allow for
128

variations. Plans can then be made for the required educational facilities and the cost calculated
in advance to see the available means of raising the funds. New schools should be designed to
cater for a minimum of four streams large classes which will hold forty to fifty pupils per class
and allowance made for future expansion since it is easier to extend the facilities than start on
new ones.
If Nyamira education board is to base pupil intake on divisions, there should be frequent
counts of school age population in different areas within the district, so that planned expansion
goes along with this and efforts made to ensure that there is a positive correlation between pupil
intake and the available educational facilities.
It is also important to recognize that equal opportunity is not an easily obtainable goal,
but all efforts should be made to ensure that there is a fair distribution of all the educational
facilities in the public schools in the district. This will require a strong political commitment and0
associated policies which the government may use to influence the distribution of schools in the
district.
The other options available for educational planners are few. If the quality and the
coverage of education is not to be sacrificed, there are basically two possibilities of either
reducing the cost per enrolled pupil or finding alternative modes of financing education in the
district. The latter opinion would in the present mean, moving a larger part of the costs to the
users i.e. the parents. This has the obvious disadvantage of putting additional strains on the
poorer parents whose possibilities of financing their children’s schooling would be curbed. From
an equality point of view, the measure would not be recommendable. Furthermore the parents
who are already currently forced to contribute significantly to their children’s educational cost in
the form of building funds, school uniforms and books need to be relieved.
129
It should be noted that in dealing with Nyamira primary education sector, an accurate
grasp of the current conditions as well as a comprehensive knowledge of the patterns of change
and the conditions responsible for the change is necessary for the adoption of effective measures.
Therefore research and evaluation of policy issues may help planners allocate scarce resources
more effectively.
6.2 Recommendations for Future Research
The present study has dealt with the interrelationship of demographic factors and the provision of
primary education in Nyamira district. It is clear that the problem is much wider and many
faceted than presented here. This study therefore concentrated more on the distribution of
educational facilities and no attention was paid on the curriculum and content of education. It is
therefore clear that:
1. Aspects of utmost importance for educational planning, especially in the view of the
relevance of the education and returns from it in relation to the labour market and
employment.
2. Aspect of the relative importance of population growth in increasing educational costs.
All these issues have been outside the scope of the present study and would each deserve
a study of their own.
130
BIBLIOGRAPHY
Abela (1971) Urbanisation and the Distribution of Schools in Cambrelle P.(ed.) Population in African Development.
Anarfi, J. K. (1994) HIV/AIDS in Sub-Saharan Africa: Its Demographic Implications: African Population, Paper No. 3.
Ayiemba, H.O and Oucho (1992) Population Growth in the Sub-Saharan Africa.
Ayiemba, H.O and Oucho (1988) The Kenya Family and Attitudes Towards Family Formation: In Kenya Population Growth to the Year 2000 A.D; pp. 48-56.
Ayiemba, H.O (1985) Determinants of Fertility in Kenya. A case study of Western Kenya. A Phd Thesis. University of Nairobi, 1985.
Becker, G.S. (196) An Economic Analysis of Fertility: In Demographic and Economic Change in Developing Countries, pp. 209-240, National Bureau of Economic Research Princeton University Press.
Birdsall, N. (1980) Population and Poverty in the Developing World, World Bank Staff,Working Paper No. 404, Washington, D.C.
Bos, E. and Bulatao, R (1992) The Relationship Demographic Impact of AIDS in Sub-Saharan African: Short and Long-term Projections. International Journal of Forecasting, No. 8, pp. 367-384.
Boserup, E. (1981) Population and Technology, Basil Blackwell, Oxford
Boserup, E. (1985) Economic and Demographic interrelationship in Sub-Saharan and Development, review, Vol. 11 No. 3. pp. 383-397.
Cadwell, J.C. (1976) Towards a pestatement of Demographic Transition Theory, in Population and Development Review, Vol.2 Nos. 3-4 pp. 321-366.
Cadwell et al. (1985) Educational Transition in South India, in Population and Development ReyiewVol.il No. 1.
Callaway, (1973) Educating African Youths for Development, Vanleer Foundation, Netherlands.
Cameron, J. (1987) The Development of Education in East Africa. Centre for Education in Africa Institute of International Studies Teachers College Columbia, New York.
131
Chorley, R.J. and Hagget, P (1967) Models in Geography, Methuen, London
Clark, C. (1967) Population Growth and Land Use, Macmillan, London
Clark, W.A. and Hosking, P.L. (1986) Statistical Methods for Geographers, John Wiley and Sons
Court, D. and Kinyanjui, K. (1980) Development Policy and Educational Opportunity: The experience of Kenya and Tanzania: In Occasional Papers No. 33, IDS, University of Nairobi.
Dabbeldam L.F.P ( ) The Primary and the Community in Mwanza District, Tanzania.
Draper, N. and Smith, H. (1981) Applied Regression Analysis. John Wiley and Sons.
Gavin, W.J. and Jones G.W. (1975) Education Planning and Population Growth in Robinson W. Population and Development Planning, pp. 66-79, The Population Council, New York.
Gomez, M. (19840 Family Size and Educational attainment in Kenya in Population and Development Review Vol.10 No. 4. pp 647-660.
Gould, W.S. (1978) Guidelines for School location planning in the World Bank Staff Working Paper No. 308.
Henin, R.A. (1981) The characteristics and development implications of fast growing population in Tony Killick (ed.) Papers on the Kenya Economy Performance Problems and Policies, pp. 193-207, Heineman, Nairobi.
ICPD (1994) Population and Development. Dept, for Economic and Social Information and Policy Analysis, U.N. Vol. 1.
Igun, A. (1972) Social and Economic Effects of Rapid Growth Rates and Economic Development in Africa in Ominde, S.H. and Ejogu, C.N. (eds)
Jones, G.W. (1975) Population Growth and Education Planning in Developing Countries, Irvington Publishers, New York.
King, K. (1974) Primary Schools in Kenya: Some Critical Constraints in David, C. and Pharam, G. (eds) Education. Society and Development: New Perspective for Kenya pp. 123-127, Oxford University Press, Nairobi.
Kenya, Republic of (1989) Development Plan 1989-1993, Government Printer.
Kenya, Republic of (1994) Development Plan 1994-1996, Government Printer.
132
Kenya, Republic of (1994) Nvamira District Development Plan 1994-1996, Government Printer.
Kinyanjui, K. (1974) The distribution of educational resources and opportunities in Kenya in IDS Discussion Paper No. 208, University of Nairobi.
Kinyanjui, K. (1977) Regional and class inequalities in the provision of primary education in Kenya, 1968-1973: A historical and socio-economic background. Qualifying paper submitted to Harvard Graduate School of Education.December.
Kipkorir, B.E. (1975) Primary School in Kenya: Some critical constraints on their effectiveness in Manzo, et ah (eds) Education for Rural Development: Case study for planners, pp. 175-216, Praeger Publishers, New York.
Lesthaeghe, R. and Johan, S. (1988) Cultural Dynamics and Economic Theories of Fertility Change. Population and Development Review, Vol.14. N o.l,pp . 1-45.
Loachart, L. (1981) The Economics of Nine Years Education for all in Killick, T. (ed.) Papers on the Kenya Economy Performance: Problems and Policies, pp. 279-286 Heinmann,Kenya.
Mandishona, G.M. (1987) Population and Development in Africa, Vol. 2, No. 2, pp. 69-77.
Mauldin,- W. and Bernard, B. (1978) Condition of Fertility Decline in Developing Countries 1965-1975 in Studies in Family Planning Vol. 9, No. 5, pp. 90-147.
McNoil, G. (1984) Consequences of Rapid Population Growth: Overview and Assessment in Population and Development Review, Vol. 10, No. 2, pp. 177-240.
Meek, M. (1971) Problems and Prospects of Social Services in Kenya, Welforum Verlag Muchen.
Mehta, T.S. et al (1969) Readings in Population and Education in National Council of Educational Research and Training.
Mott, F.L. and Susan, H.M. (1980) Kenya’s Record population Growth: A Dilemma of Development in Population Bulletin, Vol.35, No. 3, pp. 1-43.
Miller, N. (1984) Kenya: Quest for Prosperity Westview Press, der, London
Muga. G.J. (19731 Family Planning in Kenya Program and Problems. Discussion Paper No. 175, Institute for Development Studies, U.O.N.
Narman, A. (1984) Regional Distribution of Educational Facilities in Kenya with specialreference to Secondary School Teachers, Chorus 2, 1984, Dept of Human and Economic Geography, University of Gothenburg.
133

Mutua, R.W. (1964) Development of Education in Kenya: Some Administrative Aspects, 1916- 1963, East African Literature Bureau, Nairobi.
Obudho, R.A. (1984) National, Urban and Regional Planning Policy in Kenya. Third World Planning Review, vol. 11, No. 1, pp. 75-77.
Ominde, S.H. (1964) Education Commission Report, Government Printer, Nairobi
Ominde, S.H. (1966) The Structure of Education in Kenya and some Planning Problems in Education Employment in Sheffied, R.J.(ed.) Report of the Kericho Conference.
Ominde, S.H. (1971) The Demographic Transition and Educational Planning in Kenya in The Demographic Transition in Tropical Africa. Proceedings of an expert Group Meeting, Paris.
Ominde, S.H. (1975) Regional Patterns of Fertility in Kenya: In The Kenya Geographer, Vol.l, No.l.
Ominde, S.H. (1980) Population Change and Development Challenge in Mati and Bui (ed.) Population Growth and its relevance to socio-economic Development, pp. 6-12.
Oucho, J.O. (1970) Population and its implication for Resources Development in the Lake Victoria Basin in Working Paper No. 339, IDS, University of Nairobi
Oucho, J.O. (1989) The Impact of Population on the Universal Primary Education.
Masavivu, (1981) Population Trends on the Provision of Primary Education in Nairobi: An implication for educational planning. Unpublished M.A. Thesis.
Papi, G.U. (1966) General problems of Economics of Education in Vaizey, J.E. and Robinson, E.A.G. (eds.) The Economics of Education, Proceedings of a conference held by the International Economic Association, St. Martin’s Press, New York, pp. 3-23.
Pradip, K.G. (1984) Population and Environment, UN and 3rd World Development.
Prewitt, K. (1974) Introductory Research Methodology, East African Applications in Occasional Paper, No. 10, IDS, University of Nairobi.
Repotto, R. (1987) Population, Resources and Environment: An uncertain future in Population Bulletin Vol.42, No. 2, pp 1-43.
Sai, F.T. (1988) Changing Perspective of Population in Africa and International responses. African Affairs, Vol. 87, No. 347, pp. 276-276.
Stamper, B.M. (1973) Population and Planning in Developing Nations Review of the Sixty Development Plans for the 1970’s. The Population Council, New York.
134

Simon, O. (1988) Population Change and Development in Mati, J.K.G. and Buigutt, K.A.Population Growth and its Relevance to Socio-economic Development, 6, 21 KNAAS, Nairobi
Sudaprasent, K. and Richai, T.C. (1980) Regional Disparities in the Development of Education in Thailand in Gabriel C. Ta N.C. Regional Disparities in the Development of Educational Development: Diagnosis and Policies for reduction, pp. 197-323.
Ta, N.C. (1972) Population Growth and the costs of Education in Developing Countries in UNESCO: International Institute for Educational Planning. Paris.
Ta, N.C. (1972b) Tanzania, a case study in Ta, N.C. Population Growth and Cost of Education in Developing Countries, pp. 175-226, Paris.
Todaro, M. (1981) Education and National Economic Development in Killick, T. (ed.) Papers on Kenya Economy Performance. Problems and Policies, pp. 269-278, Heinmann, Nairobi.
Uitto, J.I. (1989) The Kenya Conudrum: A regional analysis of Population and Primary School Education in Kenya, printed in Sweeden.
Westoff, C. (1988) is the KAP gap real? In Population and Development Review Vol.14, No. 2, pp 225-232.
World Bank (1974) Educational Sector Working Paper.
World Bank (1988) Education in Sub-Saharan Africa: Policies for Adjustment, Revitalization and Expansion, a World Bank Policy Study, Washington D.C.
135

APPENDICESAppendix I
Table 4.2 Age and Sex-Structure of the Nyamira Population (1994)
Age Group Male (%) Female (%)
0-4 36519 21.7 45694 19.6
5-9 30607 17.8 39558 17.1
10-14 27175 15.6 34129 14.7
15-19 22172 12.9 31536 13.5
20-24 13936 8.1 21075 ' 9.1
25-29 9335 5.4 14433 6.2
30-34 6815 4.1 10148 4.4
35-39 4896 2.8 8279 3.6
40-44 4667 2.7 7022 3.0
45-49 4141 2.4 5866 2.5
50-54 2976 1.8 4089 1.8
55-59 2434 1.4 2965 1.3
60-64 1757 1.0 2469 1.1
65-69 1561 0.9 1739 0.7
70-74 852 0.5 1241 0.5
75-79 2279 1.3 1743 0.7
80+ 249 0.1 404 0.2
Total 172366 100 232781 100
S o u rce : D is tr ic t R e g is try O ffice , 1995
136

Table 4.3: Percentage of the accepted Family Planning Method in the Year 1995
Method %
Oral type (Tablets) 71
Sterilization 19
Others 9
S o u rces: R e se a rc h D a ta
Table 4.4: Total Deaths for a Grace Period of 5 years in Nyamira
Year Number Died
1990 1508
1991 2270
1992 2025
1993 2073
1994 3814
1995 2348
D a ta S o u rc e : D is tr ic t R e g is tra tio n O ffice
137
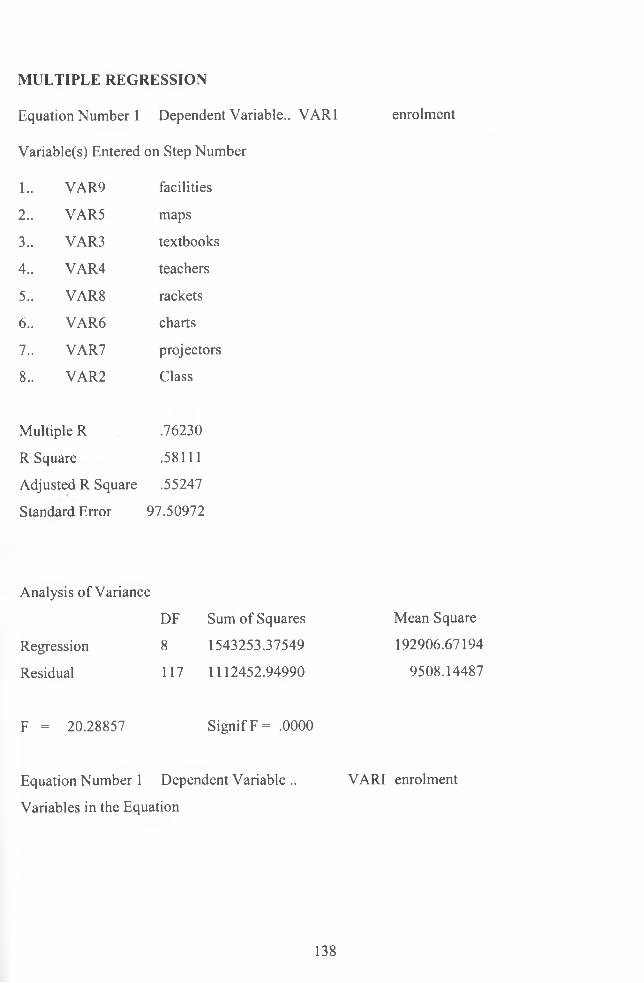
MULTIPLE REGRESSION
Equation Number 1 Dependent Variable.. VAR1 enrolment
Variable(s) Entered on Step Number
L. VAR9 facilities
2.. VAR5 maps
3.. VAR3 textbooks
4.. VAR4 teachers
5.. VAR8 rackets
6.. VAR6 charts
7.. VAR7 projectors
8.. VAR2 Class
Multiple R .76230
R Square .58111
Adjusted R Square .55247
Standard Error 97.50972
Analysis of Variance
DF Sum of Squares Mean Square
Regression 8 1543253.37549 192906.67194
Residual 117 1112452.94990 9508.14487
F = 20.28857 Signif F = .0000
Equation Number 1 Dependent Variable .. VARI enrolment
Variables in the Equation
138
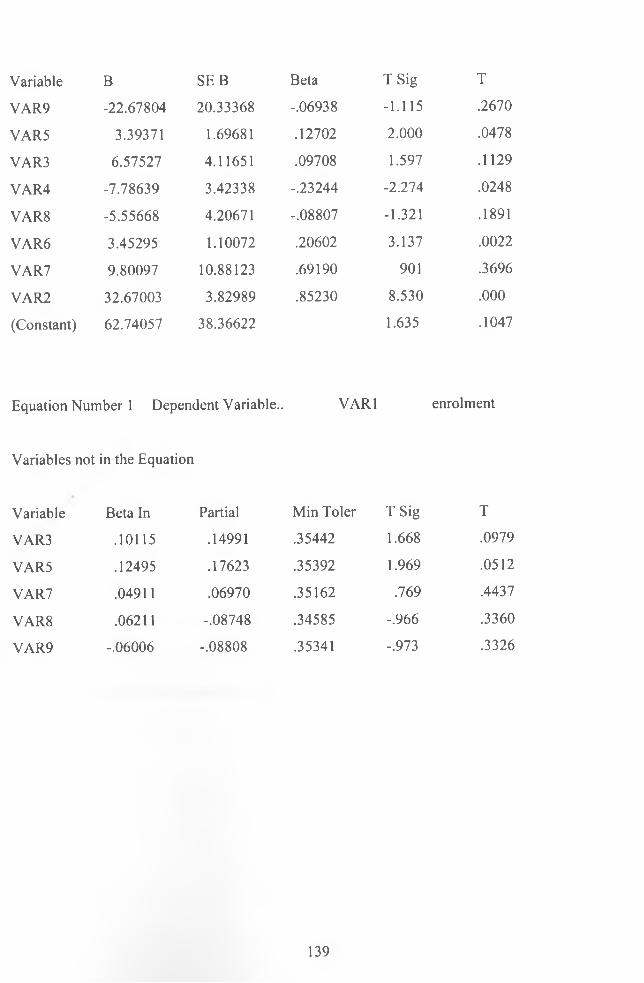
Variable B
VAR9 -22.67804
VAR5 3.39371
VAR3 6.57527
VAR4 -7.78639
VAR8 -5.55668
VAR6 3.45295
VAR7 9.80097
VAR2 32.67003
(Constant) 62.74057
SEB Beta
20.33368 -.06938
1.69681 .12702
4.11651 .09708
3.42338 -.23244
4.20671 -.08807
1.10072 .20602
10.88123 .69190
3.82989 .85230
38.36622
TSig T
-1.115 .2670
2.000 .0478
1.597 .1129
-2.274 .0248
-1.321 .1891
3.137 .0022
901 .3696
8.530 .000
1.635 .1047
Equation Number 1 Dependent Variable.. VAR1 enrolment
Variables not in the Equation
Variable Beta In Partial Min Toler TSig T
VAR3 .10115 .14991 .35442 1.668 .0979
VAR5 .12495 .17623 .35392 1.969 .0512
VAR7 .04911 .06970 .35162 .769 .4437
VAR8 .06211 -.08748 .34585 -.966 .3360
VAR9 -.06006 -.08808 .35341 -.973 .3326
139

Appendix ii
Questionnaire
This form which is presented to you seeks your assistance regarding your acceptance to fill in.
The form will be useful in my research. The information you will give will be used only for
research purposes.
Personal Details
N am e.................................................................
A g e ....................................................................
Marital S tatus...................................................
Nationality....... ...............................................
S e x .....................................................................
Details of the School
Name of the School.........................................
Location............................................................
D ivision...........................................................
Sponsor of the school [government, mission, others (specify]
140
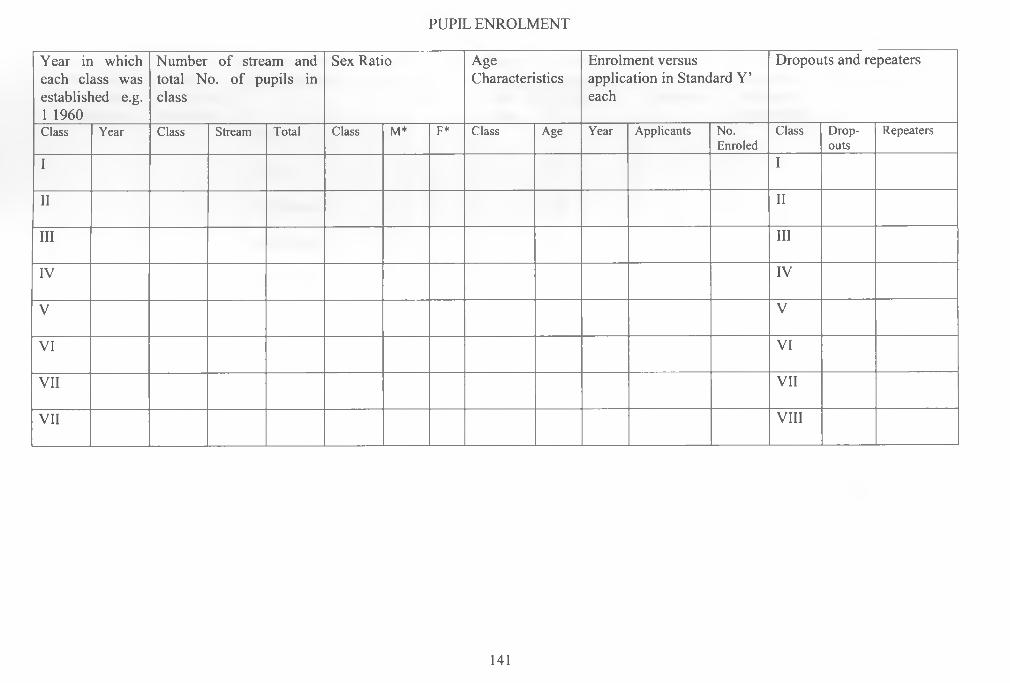
PUPIL ENROLMENT
Year in which each class was established e.g. 1 1960
Number of stream and total No. of pupils in class
Sex Ratio AgeCharacteristics
Enrolment versus application in Standard Y’ each
Dropouts and repeaters
Class Year Class Stream Total Class M* F* Class Age Year Applicants No.Enroled
Class Dropouts
Repeaters
I I
II II
III III
IV IV
V V
VI VI
VII VII
VII VIII
141

SCHOOL EQUIPMENT AND FACILITIES
Total No. of AverageWhich of the following does the school have? Tick and specify No. and class
Average distribution of textbooks
Are the facilities
Who provides the facilities
classrooms/workshops
size of each classroom
No. ClassUsing
Class Textbook adequate (yes or no)
Maps I
Charts II
Blackboards III
Radio Sets IV
Television V
Clocks VI
Adding machines VII
Duplicating machines VIII
Projectors
Sewing machines
Rackets
Jembes and Pangas
Any other
142

TEACHERS CHARACTERISTICS
Name of teacher Sex Age Grade( e , g ,P l )
Year of entry
Classestaught
No. ofteacherstransferred
Reasons for transfer Replacement (yes/no) and when and which grade
143

Extra Curriculum Activities
Games/Sports Level reached e.g. district level Year Prize(s) Won
144

RAISING SCHOOL FUNDS
Please answer the following questions (related to the above):
1. How many fund raising have been conducted?..........................
2. When did you conduct the last one?...........................................
3. How much did you raise? Kshs...................................................
4. What was the purpose of the fund raising?
(a) Construct more classes
(b) Buy books/stationery
(c) Payment of the staff
(d) Others (specify)..................................................
5. Do you plan for any other fund raising? Y e s .................. No
If yes, when and of what purpose...............................................
'JO h'n>yA 7 T A
mEHQR!Al
l*$TAFR i c a n a
145