6 socio-economic environment 6.1 …€¦ · eastern cape provinces. rapid population growth has...
TRANSCRIPT

ENVIRONMENTAL RESOURCES MANAGEMENT GAMSBERG ESIA REPORT
6-1
6 SOCIO-ECONOMIC ENVIRONMENT
6.1 INTRODUCTION
The socio-economic baseline report provides a demographic, cultural and economic overview of the Project area and also describes the physical infrastructure and services available in the communities visited. The purpose of collecting this information is to provide a basis upon which the impact assessment can be conducted, and to enable the monitoring and measurement of changes over time.
6.1.1 Methodology
This socio-economic baseline is primarily based on a previous socio-economic baseline report undertaken in 2009/2010 for the Project. Where possible, the statistics have been updated along with any material changes to the socio-economic context. Preliminary statistics from the 2011 Census are only available at the Provincial, District and Local Municipal levels. Data for individual towns was not available at the time of the study. The latest available statistics for the individual towns are from the 2007 Community Survey and 2011 Labour Force Survey, from Statistics South Africa. Key secondary sources used were Municipal documents such as the District Municipality’s Local Economic Development Framework (2010) and the 2011 and 2012 Integrated Development Planning documents from the Khai Ma Local Municipality (LM). Two previous baseline studies for the Project Area have been completed in 2000 and 2010. In addition, BMM undertook a Social Closure Plan (SCP) in 2009 for their current operation. The objective of the SCP was to: • determine the demographic characteristics of employees;
• determine the profiles of employee households in the labour sending
areas; and • assess BMM’s interaction with its surrounding regional socio-economic
structure (including affected communities). In addition to these studies, a number of focus group meetings and key informant interviews were conducted to verify the available secondary data. The focus group discussions (FGD) and key informant interviews (KII) are shown in Table 6.1.

ENVIRONMENTAL RESOURCES MANAGEMENT GAMSBERG ESIA REPORT
6-2
Table 6.1 Key Informant Interviews and Focus Group Discussions
Interviewee Designation Place Date Key Informant Interviews (KII) Nursing Sister Pofadder Clinic, Pofadder 10 September 2012 Namakwa District Municipality Official
Pofadder 11 September 2012
School Principal Boesmanland High School, Pofadder
11 September 2012
South African Social Security Agency (SASSA) Official
Pofadder 12 September 2012
Khai Ma LM Official Pofadder 12 September 2012 Aggeneys Councillor Aggeneys 12 September 2012 Khai Ma Municipal Official Pofadder 13 September 2012 Small Business Owner Pofadder 13 September 2012 Black Mountain Mining Human Resource Manager
Aggeneys 13 September 2012
Black Mountain Mining Community Liaison Officer)
Aggeneys 13 September 2012
Chairperson – Pella Water Board
Aggeneys 13 September 2012
Focus Group Discussions Emerging Farmers (10) Pofadder 10 September 2012 Pofadder Councillors (8) Pofadder 11 September 2012 Hope for Life (4) Pofadder 11 September 2012 Pofadder Women (12) Pofadder 11 September 2012 Pofadder Youth (19) Pofadder 11 September 2012 Aggeneys Women (16) Aggeneys 12 September 2012 Aggeneys Youth (3) Aggeneys 12 September 2012 Police (6) Pella 12 September 2012 Pella Women (17) Pella 13 September 2012 Pella Youth (15) Pella 13 September 2012
6.1.2 Overview
Since the original study in 2000 there has not been any significant economic growth in the broader area. The Northern Cape is characterised by an extreme disparity in wealth, with 44.7 % of the population earning less than 9.8 % of the income. The unequal income distribution has severely hampered development (1). Migration patterns suggest that there has been economic decline in the area, as people have been leaving the area in search of opportunities in other Provinces such as the Western Cape, Gauteng and Eastern Cape Provinces. Rapid population growth has given rise to a very young population structure (see Section 6.4 for further demographic details). Rising levels of unemployment and the increase in the economically inactive population has resulted in increased pressure on the diminishing employed population and a high dependency on the State for support. The mining sector continues to be the dominant economic sector although recent trends in the sector show the sector to be in decline. This is evident from the mine closures in the District (eg Kleinsee and Steinkopf). Provision of services and
(1) Northern Cape Provincial Growth and Development Strategy (NCPGDS), July 2011.

ENVIRONMENTAL RESOURCES MANAGEMENT GAMSBERG ESIA REPORT
6-3
infrastructure continues to be a challenge. This is exacerbated by the highly dispersed distribution of settlements.
6.2 ADMINISTRATIVE STRUCTURE
This section outlines the administrative structure and spatially contextualises the Project. Figure 6.1 depicts the relationship between the various spheres of government relevant to the Project. Further detail on each sphere of government is provided below.
Figure 6.1 Administrative Structure
6.2.1 Northern Cape Province
The Northern Cape Province covers the largest area of the nine provinces in the Republic of South Africa. The Northern Cape has five District Municipalities (DMs) comprising Pixley Ka Seme, Frances Baard, Namakwa, Siyanda and Kgalagadi. These five DMs are made up of twenty-six local municipalities. The major towns in these DMs are De Aar, Kimberley, Upington, Springbok, and Kuruman. The executive authority of the Northern Cape rests with the Premier. The Northern Cape Provincial Growth and Development Strategy (NCPGDS) provide the framework for development in the Province. The Province is governed by the following Departments: • Office of the Premier; • Department of Agriculture and Land Reform; • Department of Education; • Department of Environmental Affairs and Nature Conservation; • Department of Finance, Economic Development and Tourism; • Department of Health;
Northern Cape Province
Namakwa District Municipality
Nama Koi Local Municipality
Khai Ma Local Municipality

ENVIRONMENTAL RESOURCES MANAGEMENT GAMSBERG ESIA REPORT
6-4
• Department of Cooperative Governance, Human Settlement and Traditional Affairs;
• Department of Roads and Public Works; • Department of Transport, Safety and Liaison; • Department of Sport, Arts & Culture; and • Department of Social Development. Most pertinent to the Project is the DENC which is the approving authority for the ESIA.
6.2.2 Namakwa District Municipality
The Namakwa District Municipality (NDM) is the largest DM in South Africa. The NDM comprises six local municipalities, which include Nama Khoi, Khai-Ma (in which the Mine is located), Richtersveld, Kamiesberg, Hantam and Karoo Hoogland. Prior to the 2011 municipal elections large portions of the NDM were managed as District Management Areas (1) (DMA). The Namakwa DMA has been subsumed by five of the six local municipalities since the local government elections in 2011. Only the Richtersveld LM was not affected by changes to its municipal boundaries (2). The executive authority of the NDM rests with the Executive Mayor. The regional centre of the NDM is Springbok. Strategic development within the NDM is aligned with the NCPGDS and other national development initiatives. Despite this, the District suffers from a lack of resources and a backlog of service delivery. The developmental focus of the NDM has shifted from the provision of infrastructure and basic services to socio-economic development and the spatial identification of areas with development potential (3).
6.2.3 Local Municipalities
Khai Ma Local Municipality
Gamsberg falls into the Khai-Ma Local Municipality (LM). The main town in the Khai-Ma LM is Pofadder, which is both an economic hub and the seat of local government. The Khai-Ma LM is broken up into four wards, with the Mine falling within Ward 4. The role of the LM is to monitor and manage service delivery to settlements within its jurisdiction, implement plans and policies of the NDM and to carry out the development objectives outlined within the LED.
(1) DMA are defined by the Municipal Systems Act (1998), as areas that forms part of a District Municipality and is governed by a District Municipality alone. DMA are areas of special interest such as state protected areas or special economic areas. (2) Ministry of Cooperative Governance and Traditional Affairs, 2011, ' Circular to Provinces and Municipalities on Transitional Arrangements for Pre and Post 18 May 2011 Local Government Elections' (www.cogta.gov.za -accessed 8 August 2012). (3) Namakwa District Municipality, IDP 2006-2011(third revision).

ENVIRONMENTAL RESOURCES MANAGEMENT GAMSBERG ESIA REPORT
6-5
The strategic objectives of the LM are to: • provide sustainable services to the inhabitants and to maintain existing
resources;
• develop the LM as an institution through transformation and capacity building;
• promote local economic development through poverty alleviation, job creation, empowerment of the previous disadvantage people with capacity building in business skills and establish a climate for investment; and
• promote sound financial management and viability (1). Key priorities for the LM between 2012 and 2017 include: • services delivery; • institutional development and transformation; • local economic development; • financial management and viability; and • good governance and public participation.
The total budget for LM for the 2012/2013 financial year was R55,730,000 (2). The various income streams and the contribution to the total budget of the LM are shown below: • property rates (five percent); • service charges (21 percent); • external interest investments (zero percent); • interest from outstanding debtors (one percent); • grants and subsidies (70 percent); and • other income (three percent). Local government is represented in the communities by seven ward councillors. The number of councillors per area has increased to two since the local government elections in 2011. The exception is Aggeneys which only has one councillor. Pella and Witbank share two councillors who are responsible for both areas. These councillors represent local government in the various towns and work closely with local government departments. The role of the councillors is to monitor and maintain existing service delivery such as water, sanitation and refuse removal and to initiate new projects within the communities.
(1) Khai Ma, Integrated Development Plan, 2012 -2017. (2) Final Budget of the Khai Ma Local Municipality, 2012/2013 to 2014/2015 Medium Term Revenue Expenditure and Forecasting, May 2012. Available at: http://mfma.treasury.gov.za/Documents/02.%20Budget%20Documentation/2012-13/Adopted%20budgets/02.%20Local%20munic.

ENVIRONMENTAL RESOURCES MANAGEMENT GAMSBERG ESIA REPORT
6-6
Councillors work closely with the Community Development Workers (CDWs). These are local people employed by the Department of Housing and Local Government. There are six CDWs assisting councillors across the LM. The role of these CDWs is to represent their communities at the local and district government level and to identify potential development opportunities and needs. Once a month all CDWs meet with the municipal officials in Pofadder to discuss common issues. Nama Koi Local Municipality
The Nama Koi LM is the largest of the six local municipalities in the NDM. Springbok is the seat of administration and an important economic hub for the mining industry in the NDM. This town is important to the Project as it will serve as an important labour pool and procurement centre. The mining settlements of Steinkopf and Nababeep may be of relevance to the Project as potential labour sending areas as a result of recent mine closures. The Nama Khoi LM is the largest contributor to the GDP of the NDM, contributing 41.7 % to the District’s GDP. Its key sectors are mining and agriculture. The governance structure of Nama Khoi LM is similar to what has been described for the Khai Ma LM above.
6.2.4 Political Administration
The ANC has the majority vote in the municipality, but Cope and the DA have a strong following. According to the results of stakeholder consultations, much of the development in the area is highly politicised. In addition, it was reported that this can affect the role of councillors who allegedly make decisions based on the political mandate of their parties, allegedly affecting levels of information shared and employment opportunities (1).
6.3 PROJECT AREA OF INFLUENCE
The Project is located within the Northern Cape Province and the NDM, along the N14 national road (2) which bisects BMM’s (3) mining licence area. The Project is situated wholly in the Khai Ma LM, approximately 45 km to the west of Pofadder and 120 km to the east of Springbok (see Figure 1.1). The Gamsberg Inselberg itself is located approximately 33 km south of the Orange River, South Africa’s longest river and an important river in the Northern Cape Province. The Project Area of Influence is defined as the area that is significantly impacted by the Project and associated infrastructure and facilities. The geographic extent of the Area of Influence varies depending on the receptor of the impact being discussed. The Project and associated infrastructure is
(1) Focus group meeting with Pofadder women, 11 September 2012. (2) The N14 national road connects Upington and Springbok, both of which are important economic centres in the Northern Cape. (3) BMM is the existing mining right's holder and is a subsidiary of Vedanta Resources Plc.

ENVIRONMENTAL RESOURCES MANAGEMENT GAMSBERG ESIA REPORT
6-7
isolated and located on BMM owned land and is surrounded by private commercial farming land. This has bearing on the way the Area of Influence is subdivided (see Figure 6.2). The Area of Influence is sub-divided as follows: • immediate Area of Influence; • direct Area of Influence; and • indirect Area of Influence. Immediate Area of Influence
The immediate Area of Influence is the Project footprint and a two kilometre buffer around the Project footprint to include any fence areas and receptors that will be impacted by Project activities. Direct Area of Influence
The direct Area of Influence is defined in terms of the MPRDA which stipulates that a Project’s Area of Influence extends to a 50 km radius from the Project site. The settlements within the Project’s direct area of influence include Aggeneys, Pella and Pofadder. Indirect Area of Influence
The indirect Area of Influence extends to all areas that will be indirectly affected by the Project. Based on this definition the indirect Area of Influence extends to the Port of Saldanha Bay where the zinc will be shipped from. Witbank, Onseepkans and Springbok form part of the Project’s area of indirect influence as potential labour sending areas and in the case of Springbok as a regional economic centre.

ENVIRONMENTAL RESOURCES MANAGEMENT GAMSBERG ESIA REPORT
6-8
Figure 6.2 Project Area of Influence

ENVIRONMENTAL RESOURCES MANAGEMENT GAMSBERG ESIA REPORT
6-9
Table 6.2 below lists the settlements located in the direct and indirect area of influence and their proximity to the Project site.
Table 6.2 List of Settlements Included in the Social Impact Assessment
Settlement Proximity from the Project Site Aggeneys 20 km Pella 33 km Pofadder 45 km Witbank 84 km Onseepkans 95 km Springbok 120 km
6.3.2 Settlements in the Project’s Area of Influence
A brief description of each settlement in the Project Area of Influence is outlined in Table 6.3 below.
Table 6.3 Brief Description of Settlements in the Project Area of Influence
Town Description Aggeneys (Rural, Formal)
• Aggeneys is situated 20 km from the project location. It originated as a mining town owned by BMM, to house employees working at BMMs mining operation. The town has recently been incorporated as an official town within the Khai Ma LM.
• Aggeneys is the largest concentration of people in close proximity to the project location with an estimated population of 2,500 (1) of whom approximately 750 are permanently employed at the mine. The rest of the population include the immediate relatives of those permanently employed as well as people indirectly employed to service the mine.
• The key livelihood activity is employment at the mine; however, Aggeneys boasts a small commercial centre which supplies services to the community of Aggeneys. These services include plumbing, electrical, postal and banking services as well as convenience stores amongst others.
• BMM supplies the town with the majority of infrastructure and services required including water and electricity, which it procures directly from Eskom for its mining operations.
(1) Black Mountain Mining, 2010, Gamsberg Zinc Project: Final Socio-Economic Baseline Report, Report no.:396036/5 (prepared by SRK Consulting).

ENVIRONMENTAL RESOURCES MANAGEMENT GAMSBERG ESIA REPORT
6-10
Town Description Pella (Rural, Formal)
• Pella is 33 km from the project site and 13 km from the N14 national road. Pella was originally a mission station providing refuge for Khoisan people driven out of Namibia. The Cathedral in Pella is a tourist attraction in the town.
• According to Stats SA, 2001, the population of Pella is 1,425 (1) although more recent estimates suggest a population of 4,000 people (2) and an estimated 685 households (3).
• The key livelihood activities in Pella are in the agricultural sector. People engage in subsistence farming on the banks of the Orange River. There are a number of projects in the area, these include Hoodia and Geranium farming projects, date orchards for export as well as a brick making project which is funded by BMM.
• Services and infrastructure are underdeveloped in Pella. The water supply in Pella is drawn directly from the Orange River. This supply is managed by the Pella water board which is in turn managed predominantly by BMM representatives. According to the Khai Ma IDP (2010-2011), Pella has a service backlog of 463 houses, 48 water connections, and 103 sanitation connections with 106 households still using the bucket system.
Pofadder (Rural, Formal)
• Pofadder is the administrative seat of the Khai Ma LM and has developed as an agricultural service centre for the surrounding farming community. It is approximately 45 km from the Project site on the N14.
• Pofadder has an estimated 808 households (4) and an estimated population of 6,500 (5).
• The key economic activity in Pofadder entails services to the farming community. A number of people are employed as casual workers on surrounding farms and work only when there is demand.
• The town is fairly developed with the exception of electricity reticulation. This has been identified as one of the basic service delivery priorities in the area because the system is old and needs to be expanded and upgraded (6).
Witbank (Rural, Formal)
• Witbank is situated on the Orange River and is isolated from other towns in Khai Ma. It is approximately 110 km from Pofadder and only accessed by a gravel road. It is registered in the name of Witbank Development Trust.
• The settlement consists of 77 households. • The key livelihood activity is farming along the Orange River. • Services and infrastructure are underdeveloped and limited. Witbank has no
electricity reticulation and 17 households have no access to water or sanitation. The settlement has a crèche, clinic and police station. The gravel road used to access Witbank is in a poor condition.
(1) StatsSA, 2001, Population Census. This is the most recent official population estimate for Pella. (2) Black Mountain Mining, 2010, Gamsberg Zinc Project: Final Socio-Economic Baseline Report, Report no.:396036/5 (prepared by SRK Consulting). (3) Khai Ma IDP 2010-2011. (4) Khai Ma IDP 2010-2011. (5) Black Mountain Mining, 2010, Gamsberg Zinc Project: Final Socio-Economic Baseline Report, Report no.:396036/5 (prepared by SRK Consulting). (6) Khai Ma IDP 2010-2011.

ENVIRONMENTAL RESOURCES MANAGEMENT GAMSBERG ESIA REPORT
6-11
Town Description Onseepkans (Rural, Formal)
• Onseepkans is a small border post settlement situated 95 km from the mine, en-route to Namibia. Onseepkans has three settlements namely Melkbosrand, Viljoensdraai and Sending.
• Onseepkans has approximately 345 households (1) with a population of approximately 2,000.
• The key livelihood activity is farming which is reliant on the Orange River for irrigation. The agricultural crop Hoodia has recently been introduced in the area.
• The services and infrastructure are limited and in poor condition. Onseepkans has a housing backlog of 196 houses. According to the Khai Ma IDP (2010-2011), the number of houses without water, sanitation and electricity are 40, 45 and 53, respectively (2).
Springbok • Springbok is the major economic centre of the area and is the seat of the
Namakwa DM. It is situated approximately 120 km from the site. Springbok forms part of one of four development/transport corridors in the Northern Cape Province identified in the Provincial Government Development Strategy.
• The population of Springbok is estimated at 8,400 people (3). • Springbok has been identified as an emerging growth centre and the Local
Development focus is currently placed on diversifying the local economy and supporting SMMEs. Springbok provides services to the surrounding mining and farming sectors and it serves as the tourism gateway to Namaqualand. A key issue is to sustain growth in the face of the downscaling of mining in the Springbok area.
• Services and infrastructure in Springbok are well developed, although there is growing pressure on services due to increasing population. The main district hospital is found in Springbok and due to the dispersed nature of settlements people come from great distances to visit the sick in hospital. The District Growth and Development Strategy (DGDS) (2008) make provision for housing for families visiting the hospital in Springbok (4).
6.4 POPULATION STATISTICS
The Northern Cape covers 372 889 km2 and has a population of 1,145,861 people (5). Despite having the largest surface area of South Africa’s nine provinces, the population of the Northern Cape represents only 2.2 % of the national population. According to the census 2011 data, the Northern Cape experienced out-migration of 69,527 and in-migration of 62,792 resulting in a net loss of 6,735 (6). People mostly migrated to the Western Cape, Gauteng, and Limpopo Provinces in search of employment opportunities. By means of comparison, migration to the Eastern Cape Province increased significantly between 2006 and 2011.
(1) Khai Ma IDP 2010-2011. (2) Khai Ma IDP 2010-2011. (3) Black Mountain Mining, 2010, Gamsberg Zinc Project: Final Socio-Economic Baseline Report, Report no.:396036/5 (prepared by SRK Consulting). (4) Namakwa District Municipality, 2009, 'Local Economic Development', Project Khuli's Unmotho (prepared by UrbanEcon Development Planners). (5) StatsSA, 2012. (6) Stats SA, 2012, Digital Census Atlas: Overview Maps, StatsSA online, Available at: <http://geoinfo.statssa.gov.za/censusdigitalatlas/DigitalCensusOverviewMapsTestPage.aspx>, Accessed: 06 January 2013.

ENVIRONMENTAL RESOURCES MANAGEMENT GAMSBERG ESIA REPORT
6-12
Despite the large area covered by the NDM (126,747 km2), it has a small and dispersed population. The total population is estimated at over 115,842 with a population density of 0.91 people/km (1). The population distribution for the NDM is shown in Table 6.4. The LM has had a modest population growth but has seen a marginal increase in the proportion it represents of the DMs population. In 2011 it was home to 10.7 % of the District’s population compared to 10.6 in 2001. The Nama Khoi LM is home to 40.6 % of the District’s population and has had a steady increase since 1996
Table 6.4 Namakwa District Population Distribution
Municipality 1996 Population 2001 Population 2011 Population Number % Number % Number % Richtersveld LM 12,819 11.7 10,125 9.4 11,982 10.3 Karoo Hoogland LM 12,387 11.3 10,512 9.7 12,588 10.9 Kamiesberg LM 11,064 10.1 10,754 9.9 10,187 10.2 Khai Ma LM 9,550 8.7 11,469 10.6 12,465 10.7 Hantam LM 19,942 18.2 20,351 18.8 21,578 18.6 Nama Khoi LM 43,841 40 44,900 41.5 47,041 40.6 Namakwa DM 109,603 100 108,111 100 115,842 100
Source: Sats SA, 2012 (2). Figure 6.3 shows the growth rates for the LMs in the NDM. Since 2001 all LMs except Kamiesberg LM experienced positive growth. The Khai Ma LM had a growth rate of 0.8 % over the past 10 years, down from 3.7 % between 1996 and 2001.
(1) StatsSA, 2012, 'Census 2011 Northern Cape Municipal Report', Report No. 03-01-51. (2) Sats SA, 2012, 'Census 2011 Northern Cape Municipal Report', Report No. 03-01-51.

ENVIRONMENTAL RESOURCES MANAGEMENT GAMSBERG ESIA REPORT
6-13
Figure 6.3 Growth Rates of Local Municipalities in the Namakwa DM from 1996 to 2011
Source: Stats SA, 2012 (1). The population numbers and trends for Aggeneys, Pella, Witbank, Onseepkans, Pofadder and Springbok are provided in Table 6.5.
Table 6.5 Population Trends for the Affected Towns
Town Population (Urban)
Estimated Population (urban)**
Population trend
Pella 1425* 1436 Remained the same Witbank 300“ 248 Decline Aggeneys 2,500^ 2520 Remained the same Onseepkans 1500“ 2016 Growth Pofadder 6,500* 6552 Remained the same Springbok 8,400 8442 Remained the same * Based on 2001 census figures, ^ Based on the Institute of Natural Resources Household Survey “ Based on the 2009 pre-feasibility socio-economic baseline study **Based on a 0.8 percent growth rate
Source: Black Mountain Mining, 2010 (2).
6.4.1 Age
Figure 6.4 shows that the proportion of the population under the age of 15 has decreased and the proportion of the population between the ages of 19 and 40 increased for the Khai Ma LM between 2001 and 2011. Over the same period,
(1) Sats SA, 2012, 'Census 2011 Northern Cape Municipal Report', Report No. 03-01-51. (2) Black Mountain Mining, 2010, Gamsberg Final Baseline Socio-economic Report. Report no.: 396036/5.

ENVIRONMENTAL RESOURCES MANAGEMENT GAMSBERG ESIA REPORT
6-14
the proportion of the population above the age of 65 has grown, resulting in a higher dependency on the diminishing population that is economically active, this is exacerbated by the low levels of employment (see Sections 6.8.4 and 6.8.6 for further details on employment and household income). The reason for the increase in the proportion of the population over 65 years is not apparent. This increase is however in accordance with the increase in national life expectancy from 56 years in 2005 to 60 years in 2011 (1).
Figure 6.4 Age Trend of Khai Ma Local Municipality for 2001 and 2011
Source: Stats SA, 2012 (2). Approximately 68 % of the population is in the 15-64 age group and is able to contribute to the economic base of the Municipality, provided that the skills base is matched to available employment. This is however not the case, Section 6.8.5 provides further detail on why there continues to be a high dependency on State support and continued pressure on infrastructure and services.
6.4.2 Gender
The gender distribution for the Northern Cape is fairly even with 49.31 % being male and 50.69 % being female. Table 6.6 shows that there is a slight difference between the Namakwa District and Khai-Ma Municipalities in terms of the gender distribution. Khai-Ma has a greater percentage of males
(1) David Smith, 2012, "Aids drugs increase South African life expectancy by five years", The Guardian (online), 3 December 2012, Available at: http://www.guardian.co.uk/world/2012/dec/03/aids-drugs-south-african-life (accessed: 4 January 2013). (2) Stats SA, 2012, 'Census 2011 Northern Cape Municipal Report', Report No. 03-01-51.

ENVIRONMENTAL RESOURCES MANAGEMENT GAMSBERG ESIA REPORT
6-15
(52.63 %) than females (47.37 %) compared to Namakwa DM which has a relatively even distribution of males to females. A possible reason for this disparity in the LM is that mining is the biggest employer in the area which, in general, attracts more male workers.
Table 6.6 Gender Profile of Namakwa DM and Khai Ma LM in 2011
Gender Namakwa DM Khai Ma LM Number Percentage (%) Number Percentage (%)
Female 57,568 50.30 5,905 47.37 Male 58,274 49.70 6,560 52.63 Total 115,842 100 12,465 100
Source: Stats SA, 2012 (1).
6.5 RACE, ETHNICITY AND LANGUAGE
The racial profile of the Namakwa District and Khai-Ma LM is shown in Figure 6.5. The NDM and LM predominantly comprise Coloured South Africans. In the NDM, the White population (13.9 %) is larger than the other minority population groups, while in the LM there are significantly more Black people than White people (2). It is important to note that many of the people who would normally be defined as Coloured are of Nama decent; they are well integrated into the communities, however there are attempts made by members of the community to reaffirm their Nama culture and heritage (3).
Figure 6.5 Population Distribution by Race According to Census 2011
Source: Stats SA, 2012 (4). Afrikaans is the most widely spoken language with 90.4 % and 81.3 % of Afrikaans speaking inhabitants in NDM and the LM, respectively (see Table
(1) Sats SA, 2012, 'Census 2011 Northern Cape Municipal Report', Report No. 03-01-51. (2) Sats SA, 2012, 'Census 2011 Northern Cape Municipal Report', Report No. 03-01-51. (3) Stefanus April, Pella Councillor, 20 June 2012 (Personal Communication). (4) Stats SA, 2012, 'Census 2011 Northern Cape Municipal Report', Report No. 03-01-51.

ENVIRONMENTAL RESOURCES MANAGEMENT GAMSBERG ESIA REPORT
6-16
6.7). The other widely-spoken language in the LM is Setswana (10.7 %). Nama is spoken in the area but only the older generation still speaks the language. The precise percentage of people speaking Nama cannot be confirmed. Population numbers for the wider study area are provided in below.
Table 6.7 Language Groups of the Namakwa DM and Khai Ma LM
Language Namakwa DM Khai Ma LM Number Percentage (%) Number Percentage (%)
Afrikaans 104,772 90.4 10,131 81.3 English 1,365 1.2 144 1.2 isiNdebele 140 0.1 22 0.2 isiXhosa 1,725 1.5 270 2.1 isiZulu 193 1.2 35 0.3 Sepedi 100 0.1 30 0.2 Sesotho 350 0.3 84 0.7 Setswana 1,906 1.6 1,332 10.7 Siswati 55 0.04 21 0.2 Tshivenda 69 0.05 12 0.1 Xitsonga 34 0.03 1 0.01 Sign Language 343 0.3 26 0.2 Other 526 0.5 61 0.5 Not Applicable 4,268 3.7 296 2.3 Total 115,842 100 12,465 100
Source: Stats SA, 2012 (1).
6.6 EDUCATION
In 2001 there were 268,591 learners aged between five and 24 years enrolled at school, compared to 289,812 learners (2) enrolled in 2011, an increase of 7.9 %. The 2011 census data shows that 11.3 % of the Northern Cape population aged 20 years and above has no education, 17.1 % has some primary education and approximately 35 % has some secondary education. Only 7.6 % were reported to have higher education in 2011 (3). In the NDM 39.4 % of the population aged 20 years and above has received some level of secondary education, while a relatively small number (6.6 %) have not received any form of formal education (see Table 6.8). Of the communities in the LM 1.2 % of the population aged 20 years and above have no schooling, 8.4 % have completed primary school, 18.1 % have completed Grade 12 and 5.8 % have some form of post-matric qualification (4). In summary the levels of education and thus the skills base is low and it suggests that only 23.8 % of the population aged 20 years and above would be eligible for employment opportunities that require Grade 12.
(1) Stats SA, 2012, Census 2011 Interactive Data Online, Available at: http://interactive.statssa.gov.za/superweb/loadDatabase.do?db=Language11_wd, Accessed: 06 January 2013. (2) Sats SA, 2012, 'Census 2011 Northern Cape Municipal Report', Report No. 03-01-51. (3)Sats SA, 2012, 'Census 2011 Northern Cape Municipal Report', Report No. 03-01-51. (4)Sats SA, 2012, 'Census 2011 Northern Cape Municipal Report', Report No. 03-01-51.

ENVIRONMENTAL RESOURCES MANAGEMENT GAMSBERG ESIA REPORT
6-17
Table 6.8 Education Levels Attained by the Population Aged 20 years and above in the Namakwa DM and Khai Ma LM
Level of Education Namakwa DM Khai Ma LM Number Percentage (%) Number Percentage (%)
No schooling 4,794 6.6 314 1.2 Some primary 12,928 17.7 1,404 17.5 Complete primary 7,332 10.0 672 8.4 Some secondary 28,743 39.4 3,712 46.3 Std 10/Grade 12 13,737 18.8 1,449 18.1 Higher 5,396 7.4 462 5.8 Total 72,930 100 8,013 100
Source: Stats SA, 2012 (1). A list of schools in Pella, Witbank, Aggeneys and Onseepkans is provided in Table 6.9. Pella, Witbank and Onseepkans do not have secondary schools; most of the children living in these settlements attend secondary school in Pofadder and Aggeneys with few attending secondary school in Springbok. Box 6.1 describes one of the Secondary schools in the area.
Table 6.9 The Number of Schools in the Areas of Influence
Settlement Pre-primary School Primary School Secondary/ High School Direct Area of Influence
Pella 1 1 0 Pofadder 0 2 1 Aggeneys 2 1 1
Indirect Area of Influence Onseepkans 1 2 0 Witbank 1 1 0 Springbok not known 11 4 Source: Black Mountain Mining, 2010, Gamsberg Final Baseline Socio-economic Report. Report no.: 396036/5.
(1) Stats SA, 2012, 'Census 2011 Northern Cape Municipal Report', Report No. 03-01-51.

ENVIRONMENTAL RESOURCES MANAGEMENT GAMSBERG ESIA REPORT
6-18
Box 6.1 Boesmanland High School in Pofadder
Figure 6.6 Boesmanland High School
The high school services the communities of Pofadder, Pella, Witbank, and Onseepkans (see Figure 6.7). It has two boarding houses for learners that do not reside in Pofadder which is highly subsidised by the Department of Education. Learners are required to pay school fees of R180 per year and those that are in boarding school are required to pay an additional R600 per year. The high school has 518 learners and 16 academic staff members. This translates to a learner-teacher ratio of 32:1. At the time of the study the school was considered as an underperforming school. The Grade 12 pass-rate dropped from 87.8 % in 2005 to 64 % in 2011. It is believed that the decline can be attributed to high staff turn-over and instability in the school governance system, as well as unqualified personnel. According to the school principal, a key factor in the learners’ success at school is commitment from parents. The school has initiated a program that involves both parents and learners as a means of supporting the learners. On average, 180 leaners are enrolled into high school from the feeder primary schools but this compares to 65 Grade 12 learners. This suggests that approximately 70 % high school learners do not complete Grade 12. The school principal believes that the primary reason learners leave school is because of the limited post-school opportunities. Learners from Onseepkans comprise the largest proportion of school dropouts; they are leaving to pursue agricultural job opportunities.

ENVIRONMENTAL RESOURCES MANAGEMENT GAMSBERG ESIA REPORT
6-19
6.6.1 Education Bursaries
There are two education bursaries available for learners in the LM, the BMM Bursary Fund as well as the Namakwa Diamond Trust (NDT). In addition to these bursary funds, the Department of Education support learners through subsidisation for boarding facilities and school fees at State schools such as Boesmanland High School. The BMM Bursary Fund is perceived to be strictly for students who wish to enter the field of mining engineering. BMM also offers a work-exposure programme for high school learners in Aggeneys and Pofadder annually for 10 learners. Due to the lack of accommodation in Aggeneys and public transport, it means that only learners from Aggeneys high school can benefit from the work exposure programme. According to the Boesmanland High School Principal, the BMM bursary fund is underutilised as many of the learners do not attain the minimum admission requirements for Universities in the fields of science and engineering. The NDT derives its funding from royalties from State-owned mining company Alexkor for the people of the Namakwa area. This funding is aimed at poverty alleviation projects as well as bursaries to support learners. The NDT bursary fund, provided through the schools, provides support for learners from Onseepkans and Witbank to attend high school. The NDT bursary fund pays for transport, boarding school fees, school uniform as well as school fees. These fees are paid directly to the schools. Some of the youth claim that access to information on the bursaries is restricted and although they are aware that these bursaries exist they do not know specific details to apply in time in order to benefit from the bursary schemes. The Northern Cape Department of Education also provides support to learners through State subsidies for school fees and boarding school fees as well as bursaries for learners. For example, those students that benefit from the state bursary only have pay R600 per annum for boarding school, which would not normally cost R5,000 per annum (1).
6.6.2 Options for Post-School Study
There are significant barriers to further education; including financial, logistical and skills level barriers. Despite the bursaries available, only learners with exceptional school results and those who have maths and science as subjects can apply. As such the bursaries are underutilised. Those students that can afford it attend Further Education and Training (FET) Colleges in Springbok. Alternatively learners leave the area in search of work.
(1) Ms Van Rooyen, School Principal, 11 September 2012, personal communication.

ENVIRONMENTAL RESOURCES MANAGEMENT GAMSBERG ESIA REPORT
6-20
6.6.3 Skills
The skills base in the local communities are low, perpetuating the cycle of poverty and disempowerment and deepening dependency on the state. The low skills base is recognised by the NDM who have plans underway to establish an FET college and Artisan training centre in Aggeneys. According to the Local Economic Development Manager of the NDM, the education system does not equip learners to become active in the key economic sectors of the Province, which include mining and agriculture. Another concern is the skills drain to other Provinces due to the down-scaling of mines in the NDM. Skilled labour is migrating to other areas of the Northern Cape Province, as well as the Western Cape, Gauteng, and Eastern Cape Provinces.
6.7 HEALTH
6.7.1 Health Facilities
In the Northern Cape Province the provincial hospitals are located in Springbok and Upington. Most settlements in the LM have primary healthcare clinics or mobile clinics (1) which regularly visit communities (2). In Aggeneys, Pella, Pofadder and Springbok the primary healthcare clinics are functional (see Figure 6.7). Where the doctor is unable to assist patients, they are referred to Springbok Hospital. According to women interviewed in Aggeneys, Pella and Pofadder, the health care service provided is inadequate. Their key complaints relate to: • generally poor quality of service and infrastructure and a lack of
appropriate equipment;
• slow referral system leading to further deterioration of health; • long waiting periods, it is not uncommon for a visit to the clinic to take an
entire day waiting in cramped and unhygienic conditions; and • shortage of medicine and qualified personnel.
(1) The mobile clinics visit the rural communities of Khai Ma LM, such as farm workers who live on farms that would have no access to medical services otherwise. (2) Black Mountain Mining, 2010, Gamsberg Zinc Project: Final Socio-Economic Baseline Report, Report no.:396036/5 (prepared by SRK Consulting).

ENVIRONMENTAL RESOURCES MANAGEMENT GAMSBERG ESIA REPORT
6-21
Figure 6.7 Pofadder Community Centre which Houses the Clinic and Library
The older members of the communities tend to use medicinal plants to help with chronic illnesses such as high blood pressure and diabetes as they do not completely trust the health care provided. More detail on the various plants utilised is provided in Section 6.8.7. Below is a more detailed description of the health care facilities at the LM. Pofadder Health Care Services and Facilities
Pofadder has a 12-bed Community Health Centre with a maximum capacity of 18 beds which is in the process of being renovated. A doctor is permanently present at the Community Health Centre. The maternity ward has two beds. There were 44 births from January to September 2012. The mobile clinic provides health care services to the surrounding farms. However, it does not operate as often as it should because of limited health care professionals, thus placing additional burden on the Pofadder clinic. There are currently two nurses and one doctor that services Pofadder. The doctor visits the clinic once a week. The Community Health Centre in Pofadder has two ambulances, which collect patients from Pella, Aggeneys, Witbank and Onseepkans, however these ambulances are old and often breakdown (1). Currently only one ambulance is in operation and it only transports patients to Springbok Hospital (see Figure
(1) Black Mountain Mining, 2010, Gamsberg Zinc Project: Final Socio-Economic Baseline Report, Report no.:396036/5 (prepared by SRK Consulting).

ENVIRONMENTAL RESOURCES MANAGEMENT GAMSBERG ESIA REPORT
6-22
6.8). Due to the high demand, the ambulance transports multiple patients simultaneously. Once patients have received the necessary medical care at the Springbok Hospital, they have to find their own transport to get back home.
Figure 6.8 One of Two Ambulances Servicing Khai Ma LM
Aggeneys Medical Services and Facilities
Aggeneys has one state clinic and one private clinic. The state clinic does not charge patients a consultation fee nor does it charge for medication, while the private clinic charges patients R180.00 for a consultation and patients have to purchase their medicine from a private pharmacy. There have been complaints that the pharmacy does not always stock medication that is prescribed (1). The state owned clinic in Aggeneys does not receive adequate government support. The clinic is not equipped with a telephone nor does it have cleaning staff. It is also known to run out of basic necessities like toilet paper and stationary, which staff report having to purchase at their own expense. Due to limited government support, the clinic is currently receiving assistance from BMM and the private clinic in Aggeneys (2). Pella Medical Services and Facilities
The clinic at Pella was recently expanded and upgraded. The clinic has two trained nurses who are paid by the Department of Health. All healthcare services are free of charge including the provision of medicine. Every Thursday between 14:00 to 18:00 a doctor from Pofadder Community Health Centre visits the clinic and attends to an average of 30 patients a day (3). This suggests that each consultation with the doctor lasts for 8 minutes.
(1) Aggeneys Women’s Focus Group Meeting (Pers. Comm., 12 September 2012). (2) Black Mountain Mining, 2010, Gamsberg Zinc Project: Final Socio-Economic Baseline Report, Report no.:396036/5 (prepared by SRK Consulting). (3) Black Mountain Mining, 2010, Gamsberg Zinc Project: Final Socio-Economic Baseline Report, Report no.:396036/5 (prepared by SRK Consulting).

ENVIRONMENTAL RESOURCES MANAGEMENT GAMSBERG ESIA REPORT
6-23
The clinic at Pella is open from 08:00 to 16:00 and closed during the weekends and public holidays. After hours patients either phone the nurse on call or go to Pofadder Community Health Centre. Pella clinic does not have a maternity ward and women resident in Pella give birth at the Pofadder Community Health Centre. On average there are five births per month at the Pofadder Community Health Centre. Onseepkans Medical Services and Facilities
The clinic at Onseepkans operates in the same fashion as the clinic at Pella, which is visited by the doctor once per week and has the same opening times. Similarly, women from Onseepkans do not have access to a maternity facility locally and have to give birth at the Pofadder Community Health Centre. For any emergencies the community of Onseepkans have to go to Pofadder to seek medical assistance, which is approximately 50 km away via a gravel road. Witbank Medical Services and Facilities
The clinic at Witbank is only open twice a month by a visiting nurse from Pofadder Clinic. This is usually on the last Tuesday and Thursday of every month.
6.7.2 State of Health
The Northern Cape Province is affected by a number of health conditions and infectious diseases, which are primarily caused by poverty, poor nutrition and generally unhygienic living conditions. Some of the key health challenges faced by the Province include malnutrition and Foetal Alcohol Syndrome (FAS), tuberculosis (TB), chronic diseases such as hypertension and diabetes (of which the incidence rate has increased over the past five years), and HIV/AIDS. Health problems reported to be prevalent in the Project’s direct Area of Influence were, hypertension, diabetes, tuberculosis, HIV/AIDS, liver problems, stomach problems (bacterial infections, dysentery), headaches, arthritis and cancer (1). For women in particular, high blood pressure was identified and anecdotal accounts suggest an increase in cervical and breast cancer. The most prevalent illnesses in children included diarrhoea, flu and measles. Key health issues prevalent in men were high blood pressure, liver problems and diabetes (2). The primary causes of death in the Northern Cape include HIV/AIDS, hypertensive disorders, obstetric haemorrhage, pregnancy related sepsis and pre-existing medical disorders (3). The proportion of men receiving treatment for hypertension in the Northern Cape is double that of the national average
(1) Based on information gathered in focus group interviews from the 2010 Gamsberg Socio-economic Baseline Report and the 2012 focus group interviews. (2) Black Mountain Mining, 2010, Gamsberg Zinc Project: Final Socio-Economic Baseline Report, Report no.:396036/5 (prepared by SRK Consulting). (3) Northern Cape Provincial Government, 2004.

ENVIRONMENTAL RESOURCES MANAGEMENT GAMSBERG ESIA REPORT
6-24
(21.5 % compared to 10.7 %), while the proportion of women receiving treatment for hypertension is 35 % compared to 27.7 % nationally (1). The infant mortality rate in the Northern Cape increased from 55.6 per 1,000 in 1996 to 58.8 per 1,000 in 2002 and then decreased to 33,4 per 1000 in 2007 (2). (). These rates are comparable to the national figures; in 2007 the national rate for the country was 70.9 per 1,000. Both the national and provincial rates for infant mortality are higher than the national targets for infant mortality, which is currently set at 15 per 1,000 (3).
6.7.3 Communicable Diseases (HIV/AIDS, TB)
HIV/AIDS
Official HIV/AIDS statistics for the NDM and the LM are inferred from the Provincial statistics. Since 1997 HIV/AIDS has been amongst the ten leading underlying causes of death among individuals aged 15-49 years in the Province. The prevalence rates of HIV/AIDS for the country have increased from 9.4 % in 2001 to 10.6 % in 2011. The prevalence rate for women aged between 15 and 49 is 19.4 %, which suggests that one in five women in South Africa is HIV positive (4). The prevalence rate for men is 13.3 %, which has been deduced from the prevalence rate of 10.6 % for adult males (aged 15 to 19). Although the Northern Cape has followed a similar trend over the same period, the prevalence rates for the Province is now much lower than the national rates (5). Figure 6.9 illustrates the incidence of HIV/AIDS in the Northern Cape Province according to District Municipalities. The incidence in the NDM increased from eight % in 2004/2005 to 10.7 % in 2006/2007. The incidence of HIV/AIDS in the NDM is lower than other municipalities and the Province.
(1) Northern Cape Department of Health, 2006. (2) Northern Cape Province Fifteen Year Review 2009. (3) Northern Cape Department of Health, 2006. (4) Stats SA, 2011, Mid-year Population Estimates', Statistical Release P0302, Pretoria. (5) Black Mountain Mining, 2010, Gamsberg Zinc Project: Final Socio-Economic Baseline Report, Report no.:396036/5 (prepared by SRK Consulting).

ENVIRONMENTAL RESOURCES MANAGEMENT GAMSBERG ESIA REPORT
6-25
Figure 6.9 HIV/AIDS Incidence Rate in the Northern Cape Province (According to Voluntary Counselling and Testing data)
Source: Black Mountain Mining, 2010, Gamsberg Final Baseline Socio-economic Report. Report no.: 396036/5. In 2004, as one of the preventative measures against HIV/AIDS, the Department provided 154 facilities with Voluntary Counselling and Testing (VCT) services. Hope for Life, a Community Base Organisation (CBO) assisting people in Aggeneys, Pella, Witbank and Onseepkans with HIV/AIDS awareness and training, argues that the number of people with HIV/AIDS is much higher than the statistics show. Hope for Life provides home based care for HIV/AIDS patients that are bed-ridden; they also provide care for disabled people and work closely with the Department of Social Services and Population Development. Each of the four Hope for Life workers in Pofadder had six patients at the time of consultation and can have up to 10 patients. None of the state clinics in Pella, Aggeneys, Witbank and Onseepkans provide antiretroviral treatment (ARVs). Patients are referred to Pofadder Community Health Centre for HIV treatment. It is estimated that 38 people die from HIV/AIDS in NDM per month based on Provincial statistics of 11 deaths daily. It is estimated that four people die of HIV/AIDS in the Khai Ma LM (1). Tuberculosis (TB)
TB is recognised as a key health concern for the District and Local Municipality. The Department of Health has a TB project underway, but details of this project and the infection rate cannot be confirmed. The nurse at
(1) Khai Ma LM, 2010, Rural Spatial Development Framework/Land Development Plan (prepared by Umsebe Development Planners).
0
5
10
15
20
25
30
35
40
45
FrancesBaard
Pixley KaSeme
Kgalagadi Namakwa Siyanda NorthernCape
2004/2005
2005/2006
2006/2007

ENVIRONMENTAL RESOURCES MANAGEMENT GAMSBERG ESIA REPORT
6-26
the Pofadder clinic reported that they have cases of multi-drug resistant TB. Discontinuation of TB patient’s treatment remains a challenge. It is reported that patients discontinue treatment after three months, by which time they generally feel healthy. They then begin to consume alcohol again.
Figure 6.10 Sign on Clinic Door Raising Awareness about the Spread of TB
6.8 DESCRIPTION OF THE BASELINE ECONOMIC ENVIRONMENT
The significance of impacts is often highly dependent on the economic environment or context within which they occur. For example, job creation in a small local community with a stagnating economy will be far more significant than it would be in a larger community with a healthy economy. With this in mind, this section describes the economic environment focusing on the local area and sub-region where the majority of impacts are likely to be felt. The main information sources used were Census 2001 and 2011 data, 2007 Community Survey data, Integrated Development Plans (IDPs), Locals Economic Development (LED) Strategies and Spatial Development Frameworks (SDFs). Given the scale of the project, the economic context includes information on the Northern Cape, the Namakwa District, the Khai-Ma Local Municipal areas as well as, where available, the key local areas within the local municipality (eg Aggeneys, Pofadder, Pella, etc.). Note that the currently available Census 2011 data presented in this section only provides data for the four wards within the Khai-Ma Local Municipality and not necessarily for individual towns. The key towns and areas included in these wards are as follows:
• Ward 1: Pella, Onseekkans and surrounds. • Ward 2: Pofadder and immediate surrounds. • Ward 3: Klein Pella, Witbank and the nearby areas along the Orange
River.

ENVIRONMENTAL RESOURCES MANAGEMENT GAMSBERG ESIA REPORT
6-27
• Ward 4: Aggeneys and the rural area to the south and south east of Aggeneys.
Data is also provided for the neighbouring Nama Khoi Local Municipality area which includes the town of Springbok.
6.8.1 Economic Output, Growth and Development Trends
Figure 6.11 shows that the Northern Cape Province recorded the lowest average annual growth rate between 2001 and 2011. This figure relates to approximately 2.4 %, compared to the national growth rate of 4.0 % over the same period (1). Despite this, the contribution of the Northern Cape economy to the national GDP has remained constant at between 2 and 2.2 %, throughout the period 1996 to 2011. This indicates that the province has kept pace with economic growth in general but has not experienced accelerated economic development.
Figure 6.11 Average Real Annual Economic Growth Rate per Region: 2001 - 2011
Source: Stats SA, 2012, ‘ Gross Domestic Product: Annual Estimates 2002-2011, Regional Estimates 2002-2011 - Third Quarter 2012', Statistical Release P0441, Pretoria. Figure 6.12 provides an illustration of the sectors that contributed to the Province’s Gross Geographic Product (GGP) in 2011. Mining was the largest sector with a 27 % contribution to GGP. To illustrate the national importance of the Northern Cape mining sector, in 1998 the Province produced around 37 % of South Africa’s diamond output, 44 % of its zinc, 70 % of its silver, 84 %
(1)Stats SA, 2012, ' Gross Domestic Product: Annual Estimates 2002-2011, Regional Estimates 2002-2011 - Third Quarter 2012', Statistical Release P0441, Pretoria.
WC EC NC FS KZN NW GP MP LPGDPR 2001 - 2011 4.1 3.5 2.4 3.2 4.0 3.1 4.6 3.2 3.2SA 2001 - 2011 4.0 4.0 4.0 4.0 4.0 4.0 4.0 4.0 4.0
0.0
0.5
1.0
1.5
2.0
2.5
3.0
3.5
4.0
4.5
5.0

ENVIRONMENTAL RESOURCES MANAGEMENT GAMSBERG ESIA REPORT
6-28
of its iron-ore, 93 % of its lead and 99 % of its manganese (1). Mining is followed by general government services at 13 %; finance, real estate and business services at 12 %; and wholesale, retail and motor trade including catering and accommodation at 10 %. Tourism is of growing importance in the NDM with the main attraction being the wild flower displays which occur from August to October annually (2). Activity in secondary industries in 2011 (such as manufacturing) is low (6.7 %), when compared to other provinces (ie 18.2 % in the Western Cape and 20.2 % in Gauteng), with limited manufacturing and construction occurring in the Province (3).
Figure 6.12 GGP Contribution by Industry of the Northern Cape Province in 2011
Source: Stats SA, 2012. The Namakwa District Municipality’s regional gross domestic product (GDP) amounted to R3.77 billion in 2007. The Khai-Ma Local Municipality was responsible for roughly 10.3 % of this GDP with mining operations in Aggeneys making the most significant contribution (Urban-Econ, 2009). With regard to the rate of economic growth, Figure 6.13 presents the GDP growth rates of the Namakwa District municipal area in comparison to the Northern Cape and country for the period 1996 to 2007. It shows that the Namakwa District’s economy grew modestly at an annual average rate of 2 % over the
(1) Black Mountain Mining, 2010, Gamsberg Zinc Project: Final Social-Economic Baseline Report, Report no.:396036/5 (prepared by SRK Consulting). (2) Stats SA, 2012, ' Gross Domestic Product: Annual Estimates 2002-2011, Regional Estimates 2002-2011 - Third Quarter 2012', Statistical Release P0441, Pretoria. (3) Stats SA, 2012, ' Gross Domestic Product: Annual Estimates 2002-2011, Regional Estimates 2002-2011 - Third Quarter 2012', Statistical Release P0441, Pretoria.

ENVIRONMENTAL RESOURCES MANAGEMENT GAMSBERG ESIA REPORT
6-29
period, whilst the provincial average was 2.4 % and the national average was 4 %.
Figure 6.13 Economic Growth Rates in the Northern Cape and Namakwa District (1996 - 2007)
Source: Quantec data in Urban-Econ, 2009. Table 6.10 shows each LM contribution to the NDM’s GDP in 2007 (1). The largest contributor was Nama Khoi with 41.7 % followed by the Richtersveld LM with 17.3 %. The Khai Ma contribution was relatively low at 10.3 %.
Table 6.10 Contribution of Local Municipalities to Namakwa DM GGP
Municipality GDP (2007) Percentage of District GGP (%)
Richtersveld LM R 652,467.04 17.3 Nama Khoi LM R 1,573,543.68 41.7 Kamiesberg LM R 389,601.93 10.3 Hantam LM R 444,112.48 11.8 Karoo Hoogland LM R 341,288.30 8.3 Khai Ma LM R 388,427.06 10.3 Namakwa DMA R 10,682.84 0.3 Namakwa DM R 3,773,123.32 100 Source: Namakwa LED, 2009. Looking to future development trends, in its consideration for areas of economic opportunity, the Northern Cape Provincial Growth and Development Strategy (PGNC) was revised in 2011, with a view to sharpening its focus. The Strategy emphasises the need for growth, diversification and transformation of the provincial economy and poverty eradication through social development (PGNC, 2011). At the Namakwa District level, the IDP raises concern regarding low economic growth and calls for the establishment of a development – oriented and economically viable region to ensure sustainable growth (NDM, 2006). The 2009 District Municipality Local Economic Development (LED) Strategy also identifies a number of key opportunities including:
(1) The 2011 data is not yet available.

ENVIRONMENTAL RESOURCES MANAGEMENT GAMSBERG ESIA REPORT
6-30
• Institutional Development for Investor Readiness. • SMME Development. • Agricultural Sector Development. • Mining Sector Development (including the beneficiation projects, One-
Stop Mining Centre and the implementation of new technologies). • Industrial Development. • Renewable Energy Development (including wind, wave, solar, and
biogas energy). • Space Research and Development Spin-offs. • Tourism Development. • Quality of Life Improvement. In a similar vein, the local Khai-Ma Municipality LED strategy has a vision, ‘To improve the living standards and conditions of residents through fully utilising its limited resources and to strengthen the local economy by creating an economically sustainable environment.’ Its objectives are as follows (KMLM, 2011): • Poverty relief through effective basic service delivery and job creation. • Ensure effective service delivery through transformation, capacity
building and infrastructure development. • Form linkages in order to facilitate skills development. • Promote business and investment attraction and retention. • Assist with economic interventions in sector development
(agricultural, mining, tourism and renewable energy).
6.8.2 Key Sectors of Namakwa District Municipality
Mining and agriculture are the largest employers in the NDM, providing approximately 40 % of the jobs. See Section 6.8.4 for further detail on employment in these key sectors. Mining
In 2007, the mining sector contributed 52 % to the District’s GDP which made it the largest sector contributor. A key concern however, was that the sector’s contribution to employment has been declining as a number of mines have closed. The sector had an annual growth rate of -0.3 % between 2001 and 2007. Figures are not yet available to confirm if there is a change in the growth rate trend. There are still significant reserves of a range of minerals as well as unexploited deposits in the DM that can sustain the mining industry for years. The on-going challenge is achieving economic diversification however, to reduce the high dependency on mining as well as stimulating increased levels of minerals processing. Figure 6.14 below depicts current mining activities in the LM

ENVIRONMENTAL RESOURCES MANAGEMENT GAMSBERG ESIA REPORT
6-31
Figure 6.14 Deeps Mine Operated by BMM near Aggeneys
The LM has identified the following activities to support the mining sector as well as to ensure that the local communities derive greater benefits from the industry. These are as follows (1): • establish a permanent working group between the municipality and the
mine managers responsible for developing plans;
• develop a database of available labour and skills to encourage the employment of local people;
• provide skills training and support programmes;
• instigate mining procurement opportunities in consultation with the mines, develop a database of such opportunities and ensure that this information is made available to local business and communities; and
• develop a small scale mining strategy. The existing Black Mountain Mine adjacent to Aggeneys is the dominant mine in the area although there are also other minor quarries and diggings (such as the dormant mine nearby the Oase in de Wilderness Lodge about 15km to the north east of the Project). On the site itself, a small mining operation is currently operational roughly half way up the northern slope of the Gamsberg and visible from the N14.
(1) Khai ma LM, Integrated Development Plan, 2012 - 2017.

ENVIRONMENTAL RESOURCES MANAGEMENT GAMSBERG ESIA REPORT
6-32
Agriculture
The area predominantly supports livestock farming due to the semi-arid and arid environment, although large tracts of land are also required to support crop farming. The NDM area is renowned for the quality of meat produced in the Province (ostrich, Karoo lamb, beef and venison). The fertile land along the Orange River supports the production of quality agricultural products such as table grapes (see Figure 6.15) and dates for export.
Figure 6.15 Vineyards along the Orange River
Source: Orange River Cellars (http://www.orangeriverwines.com). Challenges to agricultural production include access to land, especially for emerging farmers, as well as access to water for irrigation. The land available for agriculture is threatened by the mining sector as well as the expansion of conservation areas. Beneficiation of agricultural products could greatly assist in the transformation of the sector and to the empowerment of emerging farmers.

ENVIRONMENTAL RESOURCES MANAGEMENT GAMSBERG ESIA REPORT
6-33
Figure 6.16 Commercial Livestock Farming in Khai Ma LM
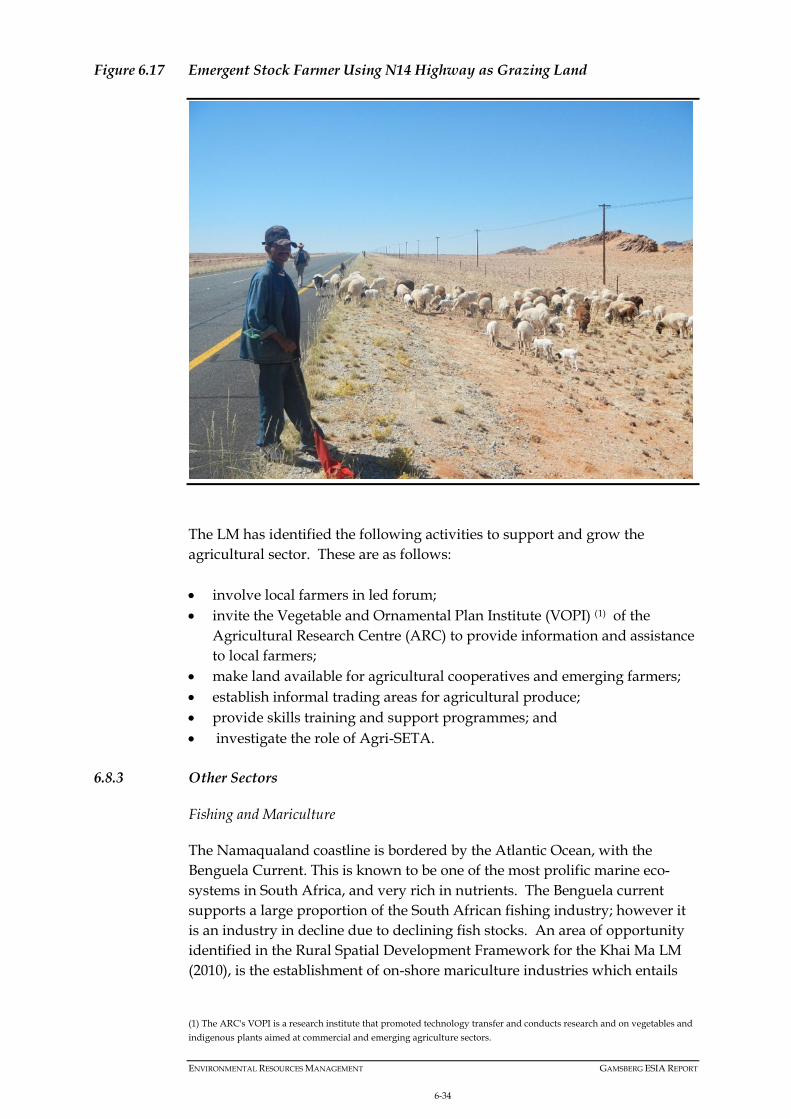
The emergent farmers (1) in the area have access to communal land owned by the Municipality. Access to this land is controlled by the LM, but the farmers complain that the land is not sufficient. They are of the opinion that the land is being utilised beyond its carrying capacity, but each farmer has a small number of livestock per sheep camp. According to emergent farmers, despite there being no room for expansion some farmers continue to overgraze in a quintessential “Tragedy of the Commons” fashion. Figure 6.17 shows an emergent farmer using the N14 road reserve as grazing land. As a result of sparse vegetation and limited water, carrying capacities are low reaching 14 to 18 hectares per large stock unit (LSU). Successful farms tend to be particularly large as a consequence of these low carrying capacities. During consultations, farmers noted that it would be ideal if they could gain access to land owned by the mine for grazing or if they could supply the mine with meat. Attempts to approach the mine with their proposals have allegedly failed to materialise into any type of agreement with the mine. Stock farming by the emergent farmers is entirely for subsistence purposes as they have limited access to markets. In addition, the abattoir costs are high and therefore they struggle to make a profit from selling their sheep. Other key issues faced by emergent farmers include stock theft, natural predators and lack of support by the local municipality (2).
(1) Emergent farmers are small-scale farmers who come from the local community, who historically were unable to farm due to a lack of access to grazing land. (2) Personal Communication, Emergent Farmers Focus Group Meeting, 12 September 2012, Pofadder.
ENVIRONMENTAL RESOURCES MANAGEMENT GAMSBERG ESIA REPORT
6-34
Figure 6.17 Emergent Stock Farmer Using N14 Highway as Grazing Land
The LM has identified the following activities to support and grow the agricultural sector. These are as follows: • involve local farmers in led forum; • invite the Vegetable and Ornamental Plan Institute (VOPI) (1) of the
Agricultural Research Centre (ARC) to provide information and assistance to local farmers;
• make land available for agricultural cooperatives and emerging farmers; • establish informal trading areas for agricultural produce; • provide skills training and support programmes; and • investigate the role of Agri-SETA.
6.8.3 Other Sectors
Fishing and Mariculture
The Namaqualand coastline is bordered by the Atlantic Ocean, with the Benguela Current. This is known to be one of the most prolific marine eco-systems in South Africa, and very rich in nutrients. The Benguela current supports a large proportion of the South African fishing industry; however it is an industry in decline due to declining fish stocks. An area of opportunity identified in the Rural Spatial Development Framework for the Khai Ma LM (2010), is the establishment of on-shore mariculture industries which entails
(1) The ARC's VOPI is a research institute that promoted technology transfer and conducts research and on vegetables and indigenous plants aimed at commercial and emerging agriculture sectors.

ENVIRONMENTAL RESOURCES MANAGEMENT GAMSBERG ESIA REPORT
6-35
the cultivation of a range of high value marine species. There are indications that mariculture offers sufficient growth potential to replace diamond mining as the principle industry in the coast region of NDM. Development in this area is critically important in the wake of closing mines along the coast (1). Tourism
Tourism as an industry spans several economic sectors ranging from accommodation to catering retail and wholesale, manufacturing, transport and communication, businesses and social services (2). The NDM has experienced growth in tourism and is also identified as an important growth area for the District as well as the Khai Ma LM. The NDM has the tourism potential in the following niche markets: • eco-tourism due to the vast open land, natural flora and fauna and a
number of national parks and conservancies;
• adventure tourism through 4x4 trails as well as hiking and fishing; • historical and cultural tourism due to the rich local heritage of the Khoi
San and Nama people; and
• technological tourism as a result of the South African Large Telescope (SALT), the Square Kilometre Array (SKA) as well as a number of proposed renewable energy projects in the area.
The Khai-Ma Municipality indicated that tourism activity in the Project Area of Influence is very limited, with the main features being a number of 4X4 and hiking trails, the Cathedral at Pella and a few accommodation establishments (3). A number of major new conservation and eco-tourism developments (Ai-Ais Richtersveld and Orange River Mouth transfrontier developments amongst others) have been completed in the Namakwa region. The Northern Cape Economic Development Agency is also currently developing several tourist areas in the Province including the Wildebeestkuil Rock Art site, which is known for its more than 400 rock engravings that are between 800 and 1,200 years old. There is likely to be some growth in tourist facilities with a low investment requirement such as hiking trails, 4X4 trails as well bed and breakfast style accommodation. Adequate marketing and identification of new tourist opportunities to build the tourism sector locally has been identified as a priority in the 2012 -2017 IDP of the LM.
(1) Namakwa District Municipality, 2009, 'Local Economic Development', Project Khuli's Unmotho (prepared by UrbanEcon Development Planners). (2) Namakwa District Municipality, 2009, 'Local Economic Development', Project Khuli's Unmotho (prepared by UrbanEcon Development Planners). (3) Black Mountain Mining, 2010, Gamsberg Zinc Project: Final Socio-Economic Baseline Report, Report no.:396036/5 (prepared by SRK Consulting).

ENVIRONMENTAL RESOURCES MANAGEMENT GAMSBERG ESIA REPORT
6-36
Local Businesses
The local businesses in the directly affected towns of Pofadder, Aggeneys and Pella primarily service the agricultural and mining sector. There are a number of businesses in Aggeneys that exclusively service the mine through long standing contracts. As such these have a very high dependency on Black Mountain Mining. The services they offer include transport services, contract miners, replacement parts suppliers and service companies. The mining sector is seen as a key sector for the development of the Province and the District, both of which support mining activities explicitly in their respective policy documents. A one-stop mining centre aimed at servicing the sector is envisioned for the District as well as a diamond polishing and cutting centre (1). There are attempts to establish a Small Business Forum in Pofadder to ensure that local business can benefit from procurement contracts from BMM. There is a desire to establish a training centre to train operators and provide support to small business to be in a position to benefit from the opportunities provided by BMM. It is perceived by a small business owner that at present only businesses from Springbok and other LMs in the NDM benefit from BMM. Renewable Energy
There are four renewable energy projects identified within a 50km radius of the Project site (refer to Section 11 for a map reflecting the location of proposed renewable energy facilities). The location of three of the four solar farms is concentrated in close proximity to the Project site, due to the existing Aggeneys substation. Four renewable energy facilities have been identified in and around Springbok. One renewable energy facility was identified east of the town of Onseepkans, close to the Orange River. In general, the solar energy projects are part of a trend in the wider region and province and are in keeping with the earmarking of a wide strip of land along the N14 as a Solar Corridor in Local and District Municipality planning. The potential to utilise renewable energy to meet the power requirements for the Project was explored. Due to the volumes and reliability of power supply, renewable energy facilities would not be able to meet the base load power requirements for the Project.
6.8.4 Regional Employment
As with the rest of the country, unemployment is a major challenge in the area. This situation continues to be exacerbated by the current difficult economic climate with low levels of economic growth.
(1) Namakwa District Municipality, 2009, 'Local Economic Development', Project Khuli's Unmotho (prepared by UrbanEcon Development Planners).
ENVIRONMENTAL RESOURCES MANAGEMENT GAMSBERG ESIA REPORT
6-37
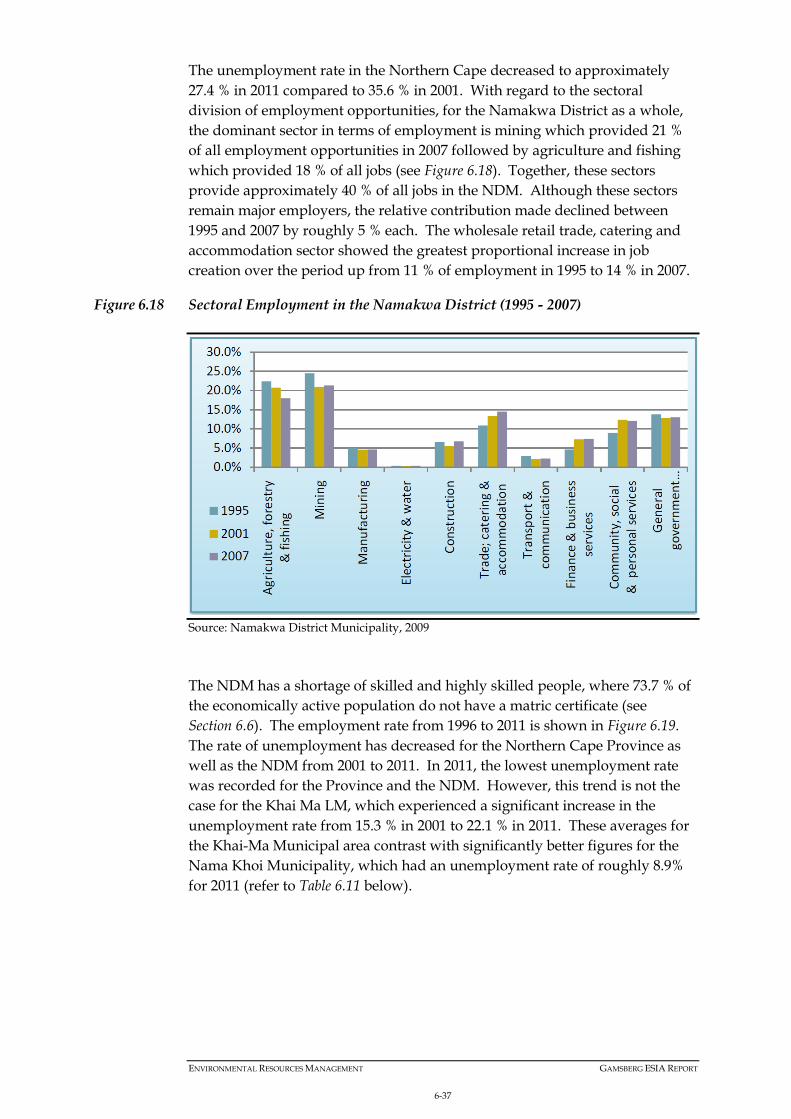
The unemployment rate in the Northern Cape decreased to approximately 27.4 % in 2011 compared to 35.6 % in 2001. With regard to the sectoral division of employment opportunities, for the Namakwa District as a whole, the dominant sector in terms of employment is mining which provided 21 % of all employment opportunities in 2007 followed by agriculture and fishing which provided 18 % of all jobs (see Figure 6.18). Together, these sectors provide approximately 40 % of all jobs in the NDM. Although these sectors remain major employers, the relative contribution made declined between 1995 and 2007 by roughly 5 % each. The wholesale retail trade, catering and accommodation sector showed the greatest proportional increase in job creation over the period up from 11 % of employment in 1995 to 14 % in 2007.
Figure 6.18 Sectoral Employment in the Namakwa District (1995 - 2007)
Source: Namakwa District Municipality, 2009 The NDM has a shortage of skilled and highly skilled people, where 73.7 % of the economically active population do not have a matric certificate (see Section 6.6). The employment rate from 1996 to 2011 is shown in Figure 6.19. The rate of unemployment has decreased for the Northern Cape Province as well as the NDM from 2001 to 2011. In 2011, the lowest unemployment rate was recorded for the Province and the NDM. However, this trend is not the case for the Khai Ma LM, which experienced a significant increase in the unemployment rate from 15.3 % in 2001 to 22.1 % in 2011. These averages for the Khai-Ma Municipal area contrast with significantly better figures for the Nama Khoi Municipality, which had an unemployment rate of roughly 8.9% for 2011 (refer to Table 6.11 below).

ENVIRONMENTAL RESOURCES MANAGEMENT GAMSBERG ESIA REPORT
6-38
Table 6.11 2011 Unemployment Levels for the Wider Study Area
Due to the high unemployment rate and the quality of jobs (in relation to the skills levels) a significant proportion of the Khai Ma LM population falls below the poverty line. This leads to a reliance on state support. In 2007, 36 % of households registered as indigent and 25 % of the population received State grants (1). It is likely that there is an increase in the number of people receiving State support. Participants in focus group discussions claim that 80 % of households in the Khai Ma LM are recipients of State grants.
Figure 6.19 Unemployment Rate from 1996 to 2011 at the Provincial and Municipal Level
Source: Stats SA, 2012.
6.8.5 Dependency
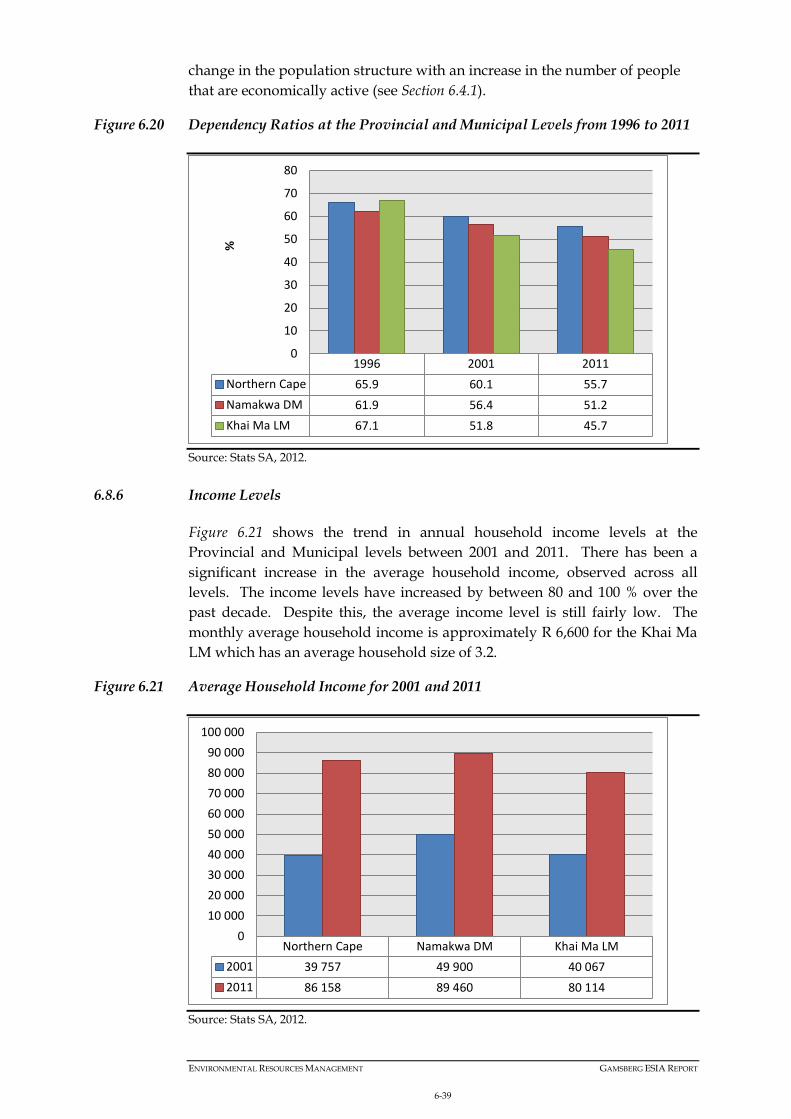
Figure 6.20 illustrates the dependency ratios at the NDM and the LM between 1996 and 2011. The dependency ratios have consistently decreased since 1996 for the Province as well as the NDM and LM. The decrease in the dependency ratio of the LM from 51.8 % in 2001 to 45.7 % in 2011 is possibly related to the
(1) Namakwa District Municipality, 2009, 'Local Economic Development', Project Khuli's Unmotho (prepared by UrbanEcon Development Planners).
Employment category Northern Cape
Namakwa District
Khâi-Ma Municipality
Khâi-Ma Municipality
Ward 1
Khâi-Ma Municipality
Ward 2
Khâi-Ma Municipality
Ward 3
Khâi-Ma Municipality
Ward 4
Nama Khoi Municipality
Employed 282 791 33 684 12 351 4 600 1 737 443 970 1 450
Unemployed 106 723 8 471 3 665 1 304 416 483 263 141
% unemployed 27.4% 20.1% 22.9% 22.1% 19.3% 52.2% 21.3% 8.9%
Discouraged work-seeker 39 913 4 040 1 935 322 24 121 113 64
% unemployed including discouraged work-seekers 34.1% 27.1% 31.2% 26.1% 20.2% 57.7% 27.9% 12.4%
Source: Census 2011
1996 2001 2011Northern Cape 32.20 35.60 27.40Namakwa DM 23.10 28.50 20.10Khai Ma LM 22.30 15.30 22.10
0.00
5.00
10.00
15.00
20.00
25.00
30.00
35.00
40.00
%
ENVIRONMENTAL RESOURCES MANAGEMENT GAMSBERG ESIA REPORT
6-39
change in the population structure with an increase in the number of people that are economically active (see Section 6.4.1).
Figure 6.20 Dependency Ratios at the Provincial and Municipal Levels from 1996 to 2011
Source: Stats SA, 2012.
6.8.6 Income Levels
Figure 6.21 shows the trend in annual household income levels at the Provincial and Municipal levels between 2001 and 2011. There has been a significant increase in the average household income, observed across all levels. The income levels have increased by between 80 and 100 % over the past decade. Despite this, the average income level is still fairly low. The monthly average household income is approximately R 6,600 for the Khai Ma LM which has an average household size of 3.2.
Figure 6.21 Average Household Income for 2001 and 2011
Source: Stats SA, 2012.
1996 2001 2011Northern Cape 65.9 60.1 55.7Namakwa DM 61.9 56.4 51.2Khai Ma LM 67.1 51.8 45.7
0
10
20
30
40
50
60
70
80
%
Northern Cape Namakwa DM Khai Ma LM2001 39 757 49 900 40 0672011 86 158 89 460 80 114
010 00020 00030 00040 00050 00060 00070 00080 00090 000
100 000

ENVIRONMENTAL RESOURCES MANAGEMENT GAMSBERG ESIA REPORT
6-40
Figure 6.22 shows the annual household income levels within the Namakwa District municipal area for 2001. The following key trends can be identified from this information (Urban-Econ, 2009):
• 11.8% of households in the District earned no income making them dependent on state grants, charity and possibly extended family/social networks for survival.
• 75% of households in the District earned below R 38,400 per annum.
• Very few households had high spending power – just 1.8% of the households were classified as high-income.
Figure 6.22 Household Incomes for the Namakwa District (2001)
Source: Census 2001 in Urban-Econ, 2009. According to Table 6.12, approximately 36% of households in the Namakwa District and 34% of households in the Khai Ma Municipality had incomes below R 19,600 per year in 2011. Furthermore, roughly 9% of households had no income at all. Aside from very low income levels, the situation in the local area and district with regard to grants gives further credence to high levels of poverty. Roughly 36% of households in the Namakwa District are registered as indigent and an even larger portion (65% and the highest in the District) are registered as indigent in the Khai-Ma Local Municipality as measured in 2005 (Urban-Econ, 2009).

ENVIRONMENTAL RESOURCES MANAGEMENT GAMSBERG ESIA REPORT
6-41
Table 6.12 Percentage of Household per Income Category in the Wider Study Area for 2011
6.8.7 Natural Resource Use
Wood Collection
Wood is an important source of energy and is primarily used for cooking (see Section 6.10.4). The wood is collected from the surrounding communal land and sold to locals. This serves as an important source of income as they have limited access to any other form of income generation. It must be noted that the Project site is an existing mining site and access into the inselberg is currently restricted. The existing mining operation at Gamsberg has no public access points and therefore surrounding communities have not developed a dependency on wood collection from the inselberg or surrounding mining license area. Medicinal Plants
In the Project study area, people use medicinal plants to treat high blood pressure, diabetes, stomach aches, headaches, cancer and flu as mentioned in Section 6.7. These medicinal plants include; Kalkoentjiebos (see Figure 6.23), Klipsweet, Gamostahoe, Dasiepis, Baarbos, Loesering, Agdag geneesbos, Hoedia, Skaapbos and Wymryk. There are no conservation programmes to protect or manage the collection of medicinal plants, which are found in the veld surrounding the settlements. It is generally the elderly that consume medicinal plants and advise on which medicinal plants to use to treat ailments. It must be noted that the Project site is an existing mining site and access into the inselberg is currently restricted. The existing mining operation at Gamsberg has no public access points and therefore surrounding communities have not developed a dependency for medicinal plants from the inselberg.

ENVIRONMENTAL RESOURCES MANAGEMENT GAMSBERG ESIA REPORT
6-42
Figure 6.23 Kalkoentjiebos (Sutherlandia frutescens) is used as a Remedy for Several Ailments
6.9 SOCIAL CHALLENGES AND VULNERABILITY
The quality of life of people in settlements within the Project’s area of influence is considered to be generally poor with limited access to social services and infrastructure. Key social challenges include: • high incidence of poverty; • high unemployment rate; • dependency on state grants; • lack of food security; • inability to meet basic social needs; and • lack of access to opportunities. This is exacerbated by the geographic isolation in most of the settlements in the area of influence and the general lack of access to economic opportunities.
6.9.1 Social Challenges
Alcoholism
Alcoholism has been identified as pervasive in the affected communities. Alcohol abuse is thought to be the root of most social pathologies in the communities and delinquent behaviour amongst the youth 1. Underage drinking is a serious problem; children start drinking as early as ten years old. High school girls are particularly vulnerable to early sexual activity in order to access alcohol. Aggeneys in particular is reported to have a very high alcohol abuse rate (2).
1) Community Safety Officer Focus Group Meeting, 12 September 2012, Pella, Personal Communication. (2) Constable Kaarstens, 12 September 2012, Aggeneys, Personal Communication.

ENVIRONMENTAL RESOURCES MANAGEMENT GAMSBERG ESIA REPORT
6-43
The extent of substance abuse in the NDM, alcohol and drug abuse is rife within the NDM (1). A study by the Northern Cape Department of Social Services sampled several LMs in the NDM. Key findings related to alcohol abuse are as follows: • each community sampled has illegal outlets of alcohol;
• child neglect is rife as most mothers in the sampled communities abuse
alcohol or drugs or both; and • approximately 40 % of respondents said that they used alcohol (2). Domestic Violence
Domestic violence is pervasive in all the local communities in the Khai Ma LM. According to an Aggeneys Community Safety Officer, a high incidence rate of domestic violence is reported in Aggeneys in particular. It is believed that the high rate of domestic violence is attributed to the high alcohol abuse rates. Drug Abuse
Drug abuse is also a problem amongst youth (3). Drug abuse is believed to start at the age of 13 and it is reported that in many instances, drugs such as Marijuana and Tik are brought into the communities by outsiders who move into the area with other developments/projects for seasonal or temporary work (4). Anecdotal evidence gathered during initial field visits and stakeholder interviews suggest that petty crime levels are increasing, which may be linked to the rising levels of drug abuse. Hope for Life, noted that they were currently working with members of the community to help stop the sale of alcohol and drugs to minors. Early addiction and substance abuse further perpetuates the cycle of poverty; youth are not learning to meaningfully contribute to society. Teenage Pregnancy
Teenage pregnancy is common (5). The Boesmanland High School Principal noted that seven learners in Grade 12 are pregnant. Early sexual activity amongst youth is pervasive and girls as young as 12 years old have given birth. This places an additional burden on the grandmothers who usually become the care givers because the young mothers either go back to school or are not mature enough to provide adequate child care. Single female headed households are common in the surrounding communities except for Aggeneys
(1) Based on a study conducted in 2007 by the Northern Cape Department of Social Services to assess substance abuse. (2) Namakwa District Municipality, Integrated Development Plan (IDP), 2006 - 2011, Third Revision, Springbok. (3) Personal Communication with several stakeholders including Hope for Life, Pofadder Women's Focus Group and the Community Safety Officer's Focus Group. (4)Community Safety Officer Focus Group Meeting, 12 September 2012, Pella, Personal Communication. (5) Personal Communication, Boesmanland School Principal and Hope for Life community workers, 11 and 12 September 2012, Pofadder.

ENVIRONMENTAL RESOURCES MANAGEMENT GAMSBERG ESIA REPORT
6-44
where the family unit seems to remain intact despite the high levels of domestic violence. Neglect of Children
It is reported that the high levels of alcohol and drug abuse leads to neglect of children (1). There are incidences where the State is forced to intervene and place children into foster homes. Children are also seen as access to income from the State and care-givers allegedly resist having children taken away from them as it will result in their child-grant being revoked (2). Crime
The leading crimes in the area include rape, statutory rape, stock theft and domestic violence (3). There have been anecdotal reports of prostitution, however the Community Safety Officer did not think it was a significant issue in the community.
6.9.2 Vulnerability
Vulnerability is defined as the ability of individuals or groups to respond to, cope with, adapt to or recover from an external stress or change that will affect their livelihoods and well-being. This approach to defining vulnerability allows for a focus on socio-economic and institutional constraints that limit individuals’ or groups ability to respond to change (4). The above issues and associated poor quality of life give rise to vulnerabilities in the communities in the settlements within the Area of Influence. Specific vulnerable groups include: • unemployed; • elderly; • children and youth (including orphans); • women (especially single women); and • disabled and chronically ill. Unemployed
There is a general sense of hopelessness within the communities because of the lack of economic opportunities and associated high unemployment rate. It is believed that socially deviant behaviour such as alcohol and drug abuse is prevalent in the area because people have nothing to occupy their time with; thereby creating a cycle of poverty and crime.
(1) Khai Ma LM, 2010, Rural Spatial Development Framework/Land Development Plan (prepared by Umsebe Development Planners). (2) SASSA Officials focus group meeting 12 September 2012, Pofadder, Personal Communication. (3) Community Safety Officer Focus Group Meeting, 12 September 2012, Pella, Personal Communication. (4) Kelly PM and WN Adger, 2000, Theory and Practice in Assessing Vulnerability to Climate Change and Adaption, Climate Change, Vol 47: 325-352.

ENVIRONMENTAL RESOURCES MANAGEMENT GAMSBERG ESIA REPORT
6-45
Elderly
There is only one old age home in the direct area of influence which is in Pofadder. The old age home is accessible to only those that can afford it, primarily White community members. The pension grant is often the only source of household income. This places an immense burden on the elderly as they are forced to financially support households typically comprising of three generations. According to feedback from elderly women during focus group meetings, it is not uncommon that their pension grant is taken from them by their family members or members of the community. Children and Youth
Children and youth are particularly vulnerable as they are exposed to alcohol and drug abuse at a very young age. Their vulnerability is exacerbated by poor access to education in terms of the quality of education provided; the limited employment opportunities available to inspire them to study and alleged limited interest by their care-givers. With minimal employment opportunity and significant barriers to further their education, the youth generally have a sense of hopelessness. According to feedback from the youth during focus group discussions, it is not uncommon for those that have managed to pass Grade 12 to be unemployed for two to three years or longer. Focus groups with the youth in Pella, Pofadder and Aggeneys revealed a high expectation from BMM to provide the training needed to be more employable and to ensure that they are given preference for employment. Women
Women are vulnerable for various reasons. They perceive that they have fewer opportunities for employment than men. In a focus group discussion with councillors, the jobs identified for women included cleaning and security work at the mine. Other employment opportunities included seasonal work on farms and municipal cleaning projects. As described in Section 6.9.1, women in the area become mothers and grandmothers at an early age and are primarily responsible for child care thus limiting their availability to work. They are vulnerable to HIV/AIDS and other sexually transmitted diseases as a result of poor access to health care and high incidences of alcohol and drug abuse. The prevalence rates between men and women in South Africa reported in Section 6.7.3 alludes to this trend. Similarly, they are vulnerable to abuse and domestic violence. Key crimes in the area such rape and statutory rape suggests that women are victimised and marginalised. The women of Aggeneys, who were mostly spouses of BMM employees, noted that although many had access to medical aid and the private clinic, they still do not have access to specialist medical services such as physiotherapy. The women interviewed noted that cervical cancer and breast cancer was on the increase and not spoken about. These are detected very late

ENVIRONMENTAL RESOURCES MANAGEMENT GAMSBERG ESIA REPORT
6-46
and appropriate medical treatment is simply not available to women in the LM. Disabled and Chronically Ill
There is limited availability of information about people with disabilities in the community. However, in general disabled people are hardly seen in the community. Within the socio-economic context as described in previous section, it is likely that they are unable to access any employment opportunities due to physical barriers such as lack of transport amongst others. Health care is such that people have a limited chance of health improvement. Care for the disabled and chronically ill is usually done by the family of the disabled or by NGO workers such as Hope for Life who provide home based care for a small monthly stipend. The disability grant is one of the highest paying grants which trap people in a life of morbidity in order not to lose their disability grant. The nurse at the local clinic noted that a key health problem is commitment from people to look after their health and to take their chronic medication as prescribed. The disabled and chronically ill are marginalised and vulnerable to abuse as they are seen as a means to additional income from the State.
6.9.3 Vulnerability per Community
The vulnerable groups outlined above are indicative of all the communities within the Project’s area of influence, although different communities have access to various resources which results in varying coping mechanisms. Examples of these coping mechanisms are outlined below. • Pella’s access to water and agricultural land provides an opportunity to
grow their own food and thereby improves their food security. Pofadder is the seat of administration of the Khai Ma LM and thus the Pofadder community have greater access to services and infrastructure compared to the other communities.
• The community of Aggeneys is materially privileged by association and proximity to the mine.
• The communities of Witbank and Onseepkans are the most vulnerable due
to their isolation; however, their proximity to the Orange River and agricultural land does provide some opportunity.
6.10 BULK SERVICES AND INFRASTRUCTURE
The bulk services and infrastructure in the Khai Ma LM is generally in poor condition. A number of services require upgrading such as the bulk sewerage system, the electricity reticulation system, access to water, as well as the waste management services. Upgrades to these services remain a priority for the

ENVIRONMENTAL RESOURCES MANAGEMENT GAMSBERG ESIA REPORT
6-47
NDM as well as Khai Ma LM. A number of infrastructure needs have been identified as reported in the NDM IDP: • efficient and effective maintenance of existing infrastructure; • minimise existing infrastructure backlogs; • the development of additional or alternative water sources; • increased maintenance investment for roads in order to maximise
economic benefits eg tourism and agriculture; • achieve and maintain developmental balance between infrastructure and
social economic development; • eradication of the bucket system; and • unblock housing projects and address existing housing backlog. Table 6.13 gives an indication of the basic service backlog in the Khai Ma LM.
Table 6.13 Basic Service Backlog
Community Number of HHs
Water Electricity Sanitation Bucket Refuse Housing
Pofadder 808 48 230 48 0 0 205 Pella 685 48 0 103 166 0 463 Onseepkans 345 40 53 45 0 0 196 Witbank 77 17 77 17 0 77 86 Aggeneys 556 - - - - - - Total Households
2471 1053 360 213 166 77 950
Source: Khai Ma IDP 2012 – 2017. The lack of finance is an important factor affecting the LM’s ability to deliver basic services. Key factors that have had an impact on the LM’s finance is the Eskom tariff increases (1) as well as the increase in the personnel costs (2).
6.10.1 Housing
In the Northern Cape Province there are approximately 301,406 households of which 65 % are found in urban areas. Approximately 82 % of the households live in formal structures, 13.2 % in informal and the remainder and traditional structures. The average household size for the Province is 3.7 compared to 3.3 for the District and Local Municipalities (3). The average size of households has been steadily decreasing since 1996 at all levels. It is estimated that there are 33,856 households in the NDM. Of these, 93.8 % are formal dwellings, 2.5 % are informal dwellings and two % are traditional (4).
(1) According to the Khai Ma LM IDP, the price of Eskom bulk electricity supplied to municipalities increased by 27.06 per cent on 1 July 2012. (2) Khai Ma LM, IDP, 2012 - 2017. (3) Sats SA, 2012, 'Census 2011 Northern Cape Municipal Report', Report No. 03-01-51. (4)Sats SA, 2012, 'Census 2011 Northern Cape Municipal Report', Report No. 03-01-51.
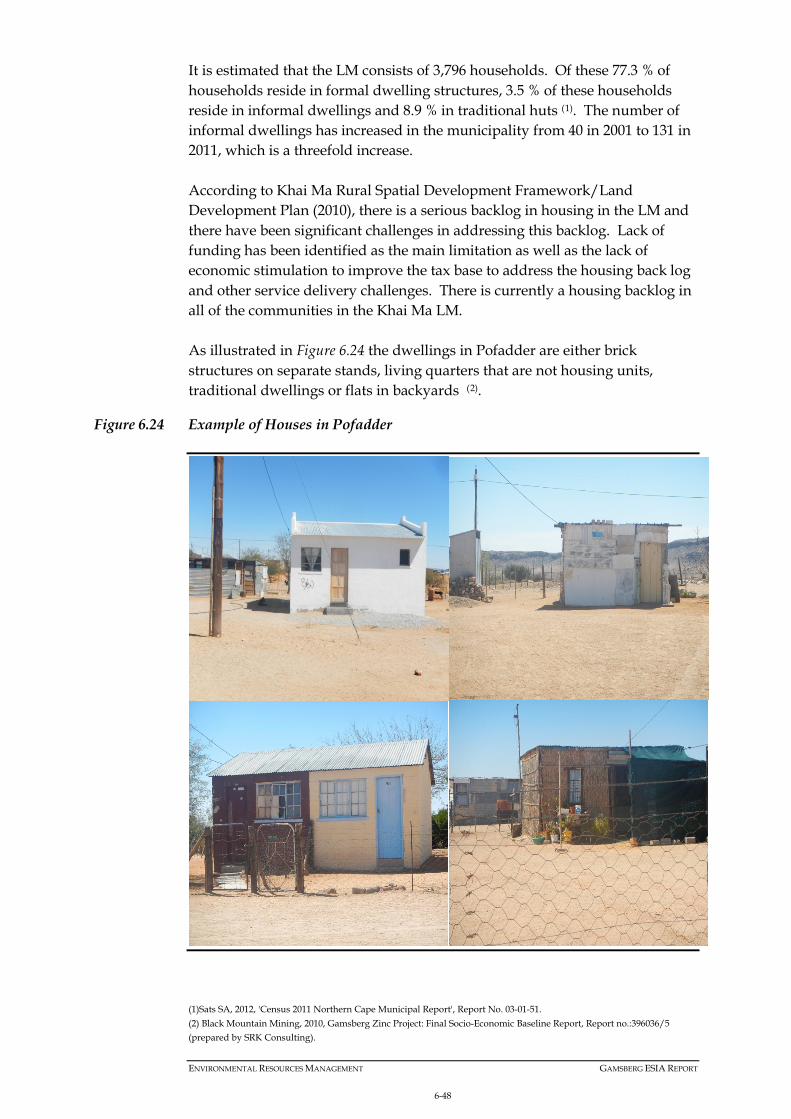
ENVIRONMENTAL RESOURCES MANAGEMENT GAMSBERG ESIA REPORT
6-48
It is estimated that the LM consists of 3,796 households. Of these 77.3 % of households reside in formal dwelling structures, 3.5 % of these households reside in informal dwellings and 8.9 % in traditional huts (1). The number of informal dwellings has increased in the municipality from 40 in 2001 to 131 in 2011, which is a threefold increase. According to Khai Ma Rural Spatial Development Framework/Land Development Plan (2010), there is a serious backlog in housing in the LM and there have been significant challenges in addressing this backlog. Lack of funding has been identified as the main limitation as well as the lack of economic stimulation to improve the tax base to address the housing back log and other service delivery challenges. There is currently a housing backlog in all of the communities in the Khai Ma LM. As illustrated in Figure 6.24 the dwellings in Pofadder are either brick structures on separate stands, living quarters that are not housing units, traditional dwellings or flats in backyards (2).
Figure 6.24 Example of Houses in Pofadder
(1)Sats SA, 2012, 'Census 2011 Northern Cape Municipal Report', Report No. 03-01-51. (2) Black Mountain Mining, 2010, Gamsberg Zinc Project: Final Socio-Economic Baseline Report, Report no.:396036/5 (prepared by SRK Consulting).

ENVIRONMENTAL RESOURCES MANAGEMENT GAMSBERG ESIA REPORT
6-49
Similarly, in Pella there are a diverse range of housing structures as illustrated in Figure 6.25.
Figure 6.25 Example of Houses in Pella
In Witbank most houses are RDP houses, with a small proportion of people having built their own houses in the town. Onseepkans consists of brick houses and traditional structures (built using locally sourced reeds and mud). In Aggeneys most dwellings are brick structures on separate stands, living quarters that are not a housing unit, a flat in a block of flats, and caravan/park homes (1).
(1) Black Mountain Mining, 2010, Gamsberg Zinc Project: Final Socio-Economic Baseline Report, Report no.:396036/5 (prepared by SRK Consulting).

ENVIRONMENTAL RESOURCES MANAGEMENT GAMSBERG ESIA REPORT
6-50
Figure 6.26 Typical House in Aggeneys
The houses provided in Aggeneys are supplied by the mine, which also supplies all bulk services at a fraction of the cost. The residents of Aggeneys pay R15 – R30 per month for rates and services. These houses are strictly allocated to permanent mine workers. Once employees are no longer in the employ of BMM they are required to vacate the premises. Only the immediate family of the employee may live in the house provided. There is a shortage of housing stock in Aggeneys. Those that are affected are people that are not permanently employed by the mine, subcontractors to the BMM, and those that are not employed by the mine but work in Aggeneys.
6.10.2 Water Supply
The Northern Cape Regional Office of the Department of Water Affairs (DWA) is responsible for managing water resources in the Province. The Province is an arid to semi-arid region with low summer rainfall, apart from a small strip of winter-rainfall which occurs in the area along the west coast. Rainfall variability results in periodic episodes of severe and prolonged drought. Approximately 2.6 % of households in the Northern Cape have no access to clean piped water. According to the Department of Water Affairs’ standard requirements for adequate access to water, households must have at least 20 to 30 litres of clean safe water per person per day, available within 200 m of the

ENVIRONMENTAL RESOURCES MANAGEMENT GAMSBERG ESIA REPORT
6-51
household (1). Improving access to clean piped water remains a priority for the Provincial Government. In the NDM 95.4 % of households have access to piped water in their dwellings and 2.2 % have access to piped water from a communal stand. Of the households in the Khai-Ma LM area 92 % have access to piped water inside their dwelling or yard. Figure 6.27 shows that significant progress has been made to improve access to water in the Province as well as the DM and LM. There has been a continuous increase in the number of people that access water from a tap inside their dwelling or yard at all levels.
Figure 6.27 Water Provision Methods from 1996 to 2011 for the Province and Municipalities
Source: Stats SA, 2012. All households in Pella, Pofadder and Aggeneys are serviced by the Pelladrift Water Board, which was established in 1974. The Pelladrift Water Board is currently being managed and maintained by BMM, which is the largest consumer of water in the area. The Water Board comprises several members of the Municipality management and BMM. Thus the Pelladrift Water Board is a public private partnership, which according to the CDW in Aggeneys is being run efficiently. The Pelladrift Water Board has a water use license to abstract 16,060,000 m3 from the Orange River, which translates into approximately 44 million litres per day. Pelladrift Water Board is responsible for water purification and distribution to its key clients including, BMM, Khai
(1) These are based on the RDP criteria, which define adequate access to water as households having 25 litres of water per capita per day within a maximum distance of 200m.
1996 2001 2011 1996 2001 2011 1996 2001 2011Piped (tap) waterinside dwelling/
yard
Piped (tap) wateron a communal
standNo access to water
Northern Cape 73.6 72 78 15.3 22 19.3 11.1 6.1 2.6Namakwa DM 82.8 86.5 95.4 6.6 9.4 2.2 10 4.1 2.4Khai Ma LM 92.3 87.8 92.0 0.9 4.6 5.3 6.7 7.5 2.6
0
20
40
60
80
100
120
%

ENVIRONMENTAL RESOURCES MANAGEMENT GAMSBERG ESIA REPORT
6-52
Ma LM, and individual farmers. The Khai Ma LM supplies water to the towns of Pofadder and Pella, which consume approximately 1.9 million litres of water per day. The water board is in the process of acquiring Blue Drop classification from the Department of Water Affairs. Blue Drop Accreditation is a flagship status programme to encourage and monitor water quality across the country. BMM consumes 94 % of the water supplied to the area for both mining activities as well as to supply the town of Aggeneys with potable water. All households in Aggeneys are supplied with free water by BMM and have piped water inside their dwellings.
Figure 6.28 Water Pipe Supplying BMM and Aggeneys
In Pofadder, 99 % of households have access to piped water within their residence or yard. In addition, 92 % of households have access to clean piped water inside their residence or yard, while seven % have access to a municipal tank. Occasional water shortages occur in the more isolated towns of Witbank and Onseepkans. Both towns source their water from the Orange River using small pumping stations. Shortages primarily occur when the pumps breakdown.

ENVIRONMENTAL RESOURCES MANAGEMENT GAMSBERG ESIA REPORT
6-53
Groundwater
Stock farmers in the surrounding areas depend on ground water sources to supplement water supply for domestic and livestock use. The groundwater quality is not suitable for human consumption due to the presence of fluorides, however, there are instances were groundwater is consumed directly, which could result in health impacts.
6.10.3 Sanitation
The percentage of households that have access to flush or chemical toilets has increased since 1996. The LM has shown the greatest increase between 2001 and 2011 and also had the highest percentage (77 %) of households across all levels. Significant progress has been made to eradicate bucket toilets. In 2011 four % of households in the Province still used a bucket toilet, which is down from 10 % in 2001. The NDM and Khai Ma LM both had one % of households use a bucket toilet, which is down from 17 % and 10 %, respectively since 2001. Despite this progress there is still work to be done to provide sanitation to all. In 2011 eight % of households in the Province had no access to sanitation and six % of households did not have access to sanitation for both the NDM and Khai Ma LM (See Figure 6.29 and Figure 6.30).
Figure 6.29 Distribution of Households by the Type of Sanitation Facilities between 1996 and 2011 for the Province, DM and LM
1996 2001 2011 1996 2001 2011 1996 2001 2011 1996 2001 2011Flush or
chemical toilet Pit latrines Bucket toilets None
Northern Cape 53% 59% 67% 20% 18% 20% 16% 10% 4% 12% 13% 8%Namakwa DM 48% 63% 72% 12% 10% 20% 29% 17% 1% 11% 10% 6%Khai Ma LM 66% 68% 77% 6% 9% 16% 19% 10% 1% 8% 13% 6%
0%10%20%30%40%50%60%70%80%90%

ENVIRONMENTAL RESOURCES MANAGEMENT GAMSBERG ESIA REPORT
6-54
Figure 6.30 Ventilated Pit Latrines in Pofadder
6.10.4 Refuse Removal
There is a shortage of landfill sites in the LM. Five landfill sites are currently operation in the settlements of Aggeneys, Onseepkans and Pofadder. The settlements of Aggeneys and Onseepkans both have two registered landfill sites. The landfill site in Pofadder is not registered although operational.
6.10.5 Power Supply
Figure 6.31 shows that the use of electricity for lighting, heating and cooking has steadily increased between 1996 and 2011 for the Northern Cape Province as well as the NDM and Khai Ma LM. Khai Ma LM has the highest increase in the use of electricity for lighting and cooking where 89.6 % of households used electricity for lighting in 2011 compared to 70.4 % in 2001. Similarly, the use of electricity for cooking increased approximately 26 % in the LM from 58.5 % in 2001 to 84.2 % in 2011.

ENVIRONMENTAL RESOURCES MANAGEMENT GAMSBERG ESIA REPORT
6-55
Figure 6.31 Distribution of Households That Use Electricity for Lighting, Heating and Cooking from 1996 to 2011
In the NDM, Eskom is primarily responsible for the distribution of electricity. An exception is Aggeneys, where BMM is responsible for electricity distribution, they supply all households with free power (1). According to the Khai Ma LM Spatial Development Framework and the Khai Ma IDP (2006 – 2011) upgrade of electricity networks in Pofadder and Onseepkans as well as the provision of electricity in Witbank is a high priority for the Khai Ma LM. The estimated cost for the upgrade in the three communities is approximately R44 million. These upgrade projects are considered to be urgent by the LM because the poor electricity infrastructure is seen to limit the development of other sectors in the municipality (2).
6.10.6 Transport, Roads and Rail
Transport
In the Northern Cape where unemployment is high, individuals have little or no access to transport services. Most people in the Northern Cape resort to walking as a mode of transport. Public transport is very limited with approximately 9.4 % making use of taxis and 0.3 % making use of busses
(1) Focus Groups with Aggeneys Women, 11 September 2012. (2) Khai Ma LM, 2011, Project Prioritisation Matrix.
1996 2001 2011 1996 2001 2011 1996 2001 2011Lighting Heating Cooking
Northern Cape 64.6% 72.4% 85.4% 44.9% 49.4% 62.2% 46.9% 54.1% 78.1%Namakwa DM 67.8% 75.7% 86.5% 46.2% 56.4% 65.7% 49.6% 62.8% 81.3%Khai Ma LM 77.4% 70.4% 89.6% 49.9% 56.7% 50.7% 52.7% 58.5% 84.2%
0.0%
10.0%
20.0%
30.0%
40.0%
50.0%
60.0%
70.0%
80.0%
90.0%
100.0%

ENVIRONMENTAL RESOURCES MANAGEMENT GAMSBERG ESIA REPORT
6-56
where they are available. As a result of the lack of public transport, the private vehicle is often the only form of transport available, although only 17.5 % have their own vehicle. Improvements to public transport have been identified in the Khai Ma IDP as a key priority for improving the living standards in the Khai Ma LM (1). Lack of public transport is a key inhibitor for people in the communities of Pofadder, Pella, Onseepkans and Witbank. The nearest major economic centre is Springbok. There are daily taxis available to Springbok at a cost of R120 per single trip, a cost that many simply cannot afford. BMM provides busses for workers on a Friday which transports them to Springbok to do their weekly shopping. Roads
The Northern Cape currently contains a network of tarred and gravel roads. Although the extent of tarred roads is the lowest in the country, the Province has the largest network of gravel roads (see Table 6.14).
Table 6.14 Extent of Provincial Road Networks (2006)
Province Surface roads (km)
Gravel roads (km)
Access roads (km)
Total kilometres
Total number of vehicles
Road densities (vehicle/km)
Eastern Cape 5,493 34,692 7,631 47,816 480,059 10,040 Free State 6,310 22,046 20,000 48,356 416,029 8,603 Gauteng 3,357 1,771 2,410 7,538 2,893,665 383,877 KwaZulu-Natal
7,216 19,373 10,571 37,160 1,023,368 27,540
Limpopo 4,973 11,631 10,578 27,182 352,906 12,983 Mpumalanga 6,144 10,752 7,479 24,375 432,313 17,736 Northern Cape
3,013 53,725 12,023 68,761 160,113 2,329
North West 5,691 19,161 10,017 34,869 400,098 11,474 Western Cape
6,621 24,991 7,822 39,434 1,236,809 31,364
Total 48,818 198,142 88,531 335,491 7,395,360 22,043 Source: Black Mountain Mining, 2010, Gamsberg Final Baseline Socio-economic Report. Report no.: 396036/5. Despite having the largest network of gravel roads, the Northern Cape has the lowest road infrastructure expenditure of any province. Due to limited resources the road network is at risk of deteriorating to such an extent that some roads might become impassable for light vehicles. Two major national routes are found in the Namakwa region, namely the N7 linking Cape Town to Namibia, which runs through the town of Springbok; and the N14 linking Johannesburg with Upington, Pofadder, Springbok (see Figure 6.32). While the N14 and N7 national roads are well maintained and roads to Aggeneys and Pella are tarred, transport to and from the more isolated settlements (ie
(1) Khai Ma LM, 2010, Rural Spatial Development Framework/Land Development Plan (prepared by Umsebe Development Planners).
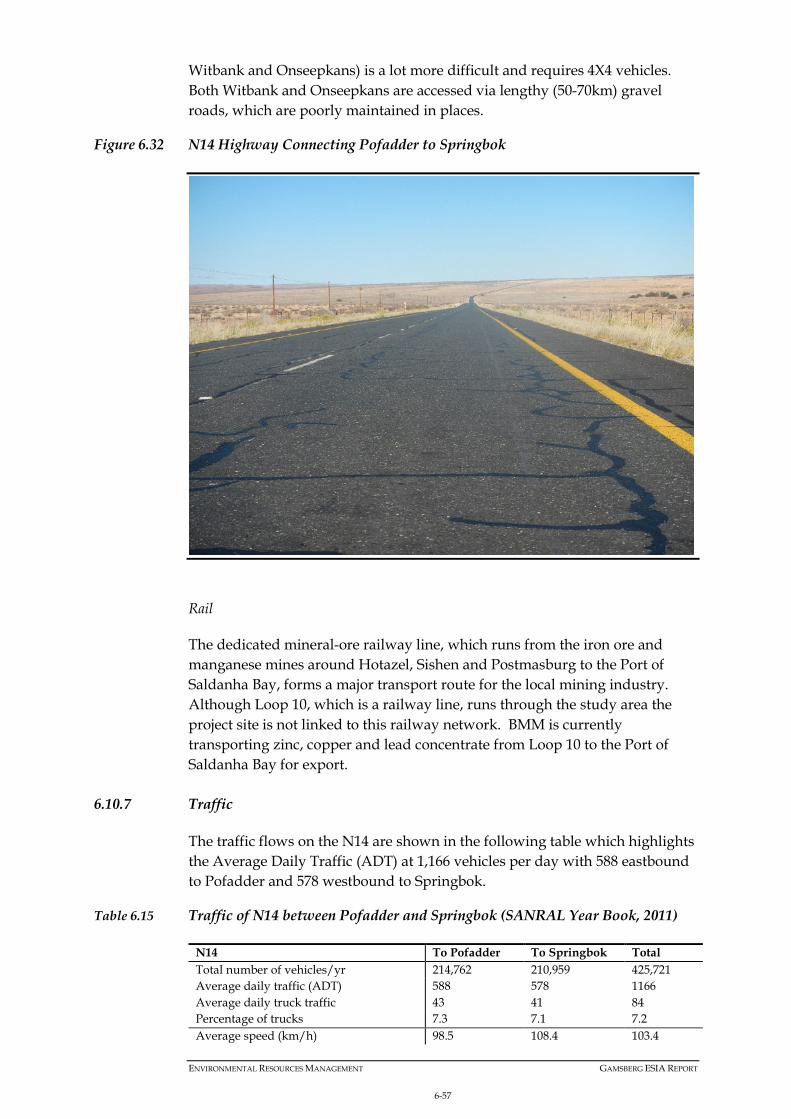
ENVIRONMENTAL RESOURCES MANAGEMENT GAMSBERG ESIA REPORT
6-57
Witbank and Onseepkans) is a lot more difficult and requires 4X4 vehicles. Both Witbank and Onseepkans are accessed via lengthy (50-70km) gravel roads, which are poorly maintained in places.
Figure 6.32 N14 Highway Connecting Pofadder to Springbok
Rail
The dedicated mineral-ore railway line, which runs from the iron ore and manganese mines around Hotazel, Sishen and Postmasburg to the Port of Saldanha Bay, forms a major transport route for the local mining industry. Although Loop 10, which is a railway line, runs through the study area the project site is not linked to this railway network. BMM is currently transporting zinc, copper and lead concentrate from Loop 10 to the Port of Saldanha Bay for export.
6.10.7 Traffic
The traffic flows on the N14 are shown in the following table which highlights the Average Daily Traffic (ADT) at 1,166 vehicles per day with 588 eastbound to Pofadder and 578 westbound to Springbok.
Table 6.15 Traffic of N14 between Pofadder and Springbok (SANRAL Year Book, 2011)
N14 To Pofadder To Springbok Total Total number of vehicles/yr 214,762 210,959 425,721 Average daily traffic (ADT) 588 578 1166 Average daily truck traffic 43 41 84 Percentage of trucks 7.3 7.1 7.2 Average speed (km/h) 98.5 108.4 103.4

ENVIRONMENTAL RESOURCES MANAGEMENT GAMSBERG ESIA REPORT
6-58
Average speed – light vehices 99.7 109.8 104.7 Average speed – heavy vehicles 82.8 90.2 86.4 15th centile speed (km/h) 79.8 85.8 81.7 85th centile speed (km/h) 119.9 132 126 Total number of heavy vehicles 15,694 14,993 30,687 Estimate of number of axles 4.3 4.4 4.4 Estimated truck mass (Ton/truck) 25.1 25.6 25.4 Estimated Average E80/truck 1.5 1.5 1.5 Estimated daily E80 on the road 128
Intersection of N14 and Aggeneys Access Road
The intersection of N14 and Aggeneys access road has relatively few turning vehicles as per field observation under typical operating conditions. Turning vehicles at the intersection are defined as low volumes with fewer than 50 vehicles turning per hour. The intersection is stop controlled on the Aggeneys minor approach to the N14. The access road is surfaced to Aggeneys and the existing BMM Deeps Mine. Intersection of N14 and Loop 10 Road
The intersection of N14 and Loop 10 carries even fewer vehicles with extremely low volumes at present with fewer than 10 turning vehicles per hour. The road is 147 km in length and will need to be graded constantly or reconstructed with an asphalt riding surface to accommodate the additional traffic from the Gamsberg Zinc Mine project.
The baseline output of BMM mineral production is roughly 125,000 tons per annum which is currently carried by road and rail in the following proportions: 1. Road 35,000 tons per annum (28%) 2. Rail 90,000 tons per annum (72%) Currently, 90 000 tons of mineral product is transferred on the Loop 10 gravel road to the loop 10 siding, per annum. Due to the existing traffic volumes, BMM currently maintains and upgrades the Loop 10 road, as and when required.
6.11 LAND TENURE AND REFORM
6.11.1 Land Ownership
Land management and distribution in the Northern Cape is governed by the Department of Agriculture, Land Reform and Rural Development. Almost all the land in the Northern Cape is privately owned. The land tenure and ownership system in the Khai Ma LM is briefly summarised as follows: • most of the land in Khai Ma is privately owned;

ENVIRONMENTAL RESOURCES MANAGEMENT GAMSBERG ESIA REPORT
6-59
• a large portion of Pella is owned by the Pella community; • BMM owns the land around Aggeneys, including Gamsberg; • the Khai Ma LM owns land in Pofadder, Onseepkans and farm portions to
the west of Aggeneys and south of Pofadder; • the Republic of South Africa owns the land along the Orange River and in
the vicinity of Witbank; and • the Witbank Development Trust owns the land at Witbank (1).
6.11.2 Land Reform
The land reform process is currently in progress in the Province and consists of land restitution, redistribution and tenure reform. Land Restitution
The Restitution of Land Rights Act (22 of 1994) addresses the restitution of land rights lost by South Africans as the result of discriminatory laws passed since 1913. The Act governs the establishment of the Commission on Restitution of Land Rights as well as the Land Claims Court. By the end of 2003, the Northern Cape had processed 2,606 land claims out of a total 2,773 (2). Land Redistribution
Land redistribution entails making land available for agricultural production, settlement and non-agricultural enterprises. In the past, state agricultural land was made available to emerging commercial farmers, via leasing, outright sale and access to grazing land. This was undertaken through the Settlement Land Acquisition Grant (SLAG) and Land Redistribution for Agricultural Development (LRAD). SLAG was a R16,000 cash grant for which poor landless Black South Africans could form a group to apply to buy and develop farm land. The SLAG programme ended in 2000 and LRAD was introduced later that year. The LRAD programme is designed to reduce rural poverty by helping previously disadvantaged people to manage their own farms effectively. Tenure Reform
Tenure Reform refers to laws introduced after 1994 to give people security of tenure over both house and the land where they work and stay (especially farm workers and labour tenants). Surplus Peoples Project was appointed by the NDM to facilitate the process of land tenure reform. The land reform projects and land claims in the Khai Ma LM are as follows:
(1) Khai Ma LM, 2010, Rural Spatial Development Framework/Land Development Plan (prepared by Umsebe Development Planners). (2) Black Mountain Mining, 2010, Gamsberg Zinc Project: Final Socio-Economic Baseline Report, Report no.:396036/5 (prepared by SRK Consulting).

ENVIRONMENTAL RESOURCES MANAGEMENT GAMSBERG ESIA REPORT
6-60
• Land claims have been registered on the farms Bloemhoek, Katko, Gariepdale and Karee Plaat. These claims are in the “research” phase; and
• In terms of the Transformation of Certain Rural Areas Act (94 of 1998) the Minister of Land Affairs granted approval of five areas in Namakwa to be transferred to the legal entities of the community’s choice. These are:
o Pella; o Concordia; o Richtersveld; o Steinkopf; and Leliefontein (1).
In Pella, the community elected for the land to be transferred to a Communal Property Association (CPA), however, a CPA was never established and the land is currently being managed by the Municipality as an interim measure (2)
6.12 PALEONTOLOGICAL, ARCHAEOLOGICAL AND HERITAGE RESOURCES
A Heritage and Archaeological Impact Assessment was undertaken by Dr David Morris (refer to Annex C for the report). In order to outline the nature of paleontological artefacts (fossils) in the subsurface of the Project area, which may potentially be affected by construction and operational activities, Mr John Pether was appointed to undertake a desktop Paleontological Impact Assessment (refer to Annex D). Heritage and Archaeology
Survey of land surfaces north of Gamsberg and on the northern slope of the inselberg itself on the farms Gams and Aroam revealed extremely minimal archaeological traces, namely a very few isolated stone flakes (refer to Figure 6.33). Where erosion had cut into the surface there was no indication of any artefacts below the surface there either (refer below).
(1) Khai Ma LM, 2010, Rural Spatial Development Framework/Land Development Plan (prepared by Umsebe Development Planners). (2) Personal Communication, Pella Community Leaders, 21 June 2012.

ENVIRONMENTAL RESOURCES MANAGEMENT GAMSBERG ESIA REPORT
6-61
Figure 6.33 The Red Dashed Line Indicates the Northern Slope of Gamsberg and the Adjacent Plain Extending Northwards Across the N14 Road. Yellow Circles and Ellipses Represent Heritage Sites or Features
A description of the three sites of archaeological importance is tabulated below, for ease of reference.
Table 6.16 Archaeological Observations: North of Gamsberg
Locality Description Heritage Significance NG 1 29.18247 S 18.94130 E
Apparent stone structure: mid-twentieth century drilling site (water or mine prospecting). Cement capping has code ‘2293 /54’. Bottle glass and wire found in the vicinity. A similar feature occurs further north at 29.18235 S 18.94446 E (P Desmet pers comm). Ostrich eggshell fragments on nearby rise are possibly indicative of Later Stone Age activity, but no stone artefacts found.
Low
NG2 29.19924 S 18.98100 E
A series of dome-shaped bedrock outcrops around which are clustered an abundance of Ceramic Later Stone Age artefacts (stone artefacts, pottery, ostrich eggshell). Elongated grinding grooves were noted on the outcropping bedrock. These features occur on other similar sites in the wider landscape. Hollows in the bedrock occur, which hold water for a time after rains (known locally as !Gorras the Nama word for these natural reservoirs). The sites probably represent repeated short-duration encampments by transhumant herders or hunter-gatherers with pottery, probably mainly in the last millennium. Transhumant farmers of the colonial era
High
NG 1 NG 2
NG 3

ENVIRONMENTAL RESOURCES MANAGEMENT GAMSBERG ESIA REPORT
6-62
Compared with the northern side of Gamsberg (above), the survey reveals that the south western and southern side is richer in sites and is consequently more sensitive (refer to Figure 6.34).
Figure 6.34 Archaeological Observations: South of Gamsberg. The Dashed Red Line Indicates the South Western and Southern Slopes of Gamsberg and the Adjacent Valleys and Plains Extending Southwards to and Beyond the Loop 10 Road. Yellow Circles and Ellipses Represent Heritage Sites. The Dashed Yellow Line Represents a Sensitive Portion of the Landscape Implicated in Documentary and Oral Evidence of Genocide Against the San
Higher sensitivity stems further from evidence that the southern/south eastern side of Gamsberg was the site (indicated by a yellow dashed line) of an incident in which a group of San were cornered and shot – part of what historians now characterise as a genocide against the indigenous people of the
evidently used such sites in similar manner (leaving broken glass and porcelain).
NG3 29.236 S 18.932 E
Isolated Earlier Stone Age (ESA) cleaver found on the plain below the inselberg, noted by P. Desmet. Such isolated finds indicate off-site activity. Small clusters of ESA artefacts have been found in the basin. This single instance lacks context and is hence of limited archaeological significance.
Low
SG 2
SG 6
SG 1
SG 3
SG 4
SG 5
SG 7
SG 8

ENVIRONMENTAL RESOURCES MANAGEMENT GAMSBERG ESIA REPORT
6-63
region (Morris, 2013). Some evidence suggests that this most likely took place in the kloof indicated as SG 7, known as ‘Inkruip’ (‘Creep in’). The occurrence of sites is focused on features such as watercourses and waterholes that would be activated by rain, and sheltered places. Colonial era stone-walling, as dwelling space and kraals, is evident at sites SG 5 and SG 8.
Table 6.17 Archaeological Observations: South of Gamsberg
Locality Description Heritage Significance SG 1 29.24859 S 18.90780 E
A possible grave site on the lower slope of a dune flanking a dry watercourse south west of the Gamsberg, consisting of two small mounds of stone (diameter 0.5 m), two disturbed mounds of stone and a patch of somewhat less concentrated stones. It could not be stated with certainty that these were graves but if they are they do not reflect colonial/missionary-influenced rectangular grave form. Broken bottle glass was the only artefactual material in the vicinity, not necessarily associated.
High subject to verification that they are graves.
SG2 29.24849 S 18.91609 E
A surface scatter of Ceramic Later Stone Age material on a flat sandy area upslope from a dry watercourse. Artefacts include fragments of ostrich eggshell, pottery (including decorated sherds and a lug fragment), stone tools made on quartz and river-rounded pebbles. In addition there is bottle glass and porcelain. Bone is preserved in places. The assemblage is consistent with late herder sites in the region, with an over-printing of proto-colonial traces. There is a stone cairn similar to that noted at the alleged grave site SG 1 mentioned above. The site reflects sub-recent Later Stone Age activity in the area. It appears that people of this period were exploiting resources mainly on the outer edges of the inselberg and to a lesser extent on the mountain or within the basin.
High
SG3 In vicinity of 29.26006 S 18.94331 E
A diffuse low density spread of archaeological traces of different ages including Later Stone Age pieces of ostrich eggshell, clay pot sherds, a lower grindstone (29.25710 S 18.94368 E); a colonial frontier era ‘tierhok’ (trap made of stone for capturing predators) (29.25734 S 18.94684 E); and twentieth century traces relating to prospecting (29.26144 S 18.94392 E).
Medium
SG4 29.26318 S 18.95436 E
A rich surface spread of Later Stone Age artefacts including stone tools, clay pottery and ostrich eggshell fragments on a sandy bank in a sheltered valley adjacent to a watercourse descending from the mountain.
High

ENVIRONMENTAL RESOURCES MANAGEMENT GAMSBERG ESIA REPORT
6-64
Locality Description Heritage Significance SG5 29.28555 S 18.95608 E
A small hill south of the Loop 10 road on the farm Bloem Hoek, with colonial era stone walling and a possible grave on the south west side. Later Stone Age artefacts occur in the shelter of a large boulder, with a grinding groove in bedrock nearby.
High
SG6 29.33326 S 18.87970 E 29.32940 S 18.88654 E 29.33251 S 18.90108 E
Well clear of the mining area but instructive in terms of the regional archaeological context, three adjacent bedrock exposures on the farms Aggeneys and Bloem Hoek with !Gorras (hollows where water collects during rains). In each case, variable quantities of Later Stone Age artefacts.
High
SG7 29.26467 S 18.99574 E
A kloof known to at least one local farmer as ‘Inkruip’ (Creep in) because according to legend this was where the last San of the area were cornered and shot. No archaeological traces were found in the kloof, however.
High
SG8 29.25135 S 19.01461 E 29.25209 S 19.01595 E
Colonial era rectangular stone walling (two kraals) on the east side of the inselberg, downslop from a spring, representing farming history in the area.
High
The survey also revealed a remarkable paucity of tangible archaeological or heritage traces on the inselberg itself and within the basin (refer to Figure 6.35). The terrain is, in general, highly eroded: it is extremely rocky, often with minimal or no topsoil, making it a hostile environment for preservation of archaeological traces, and indeed for human occupation in the first instance.
Figure 6.35 Archaeological Observations: Gamsberg Inselberg and Basin. Yellow Circles and Ellipses Represent Heritage Sites on the Inselberg and in the Basin of the Mountain
GI 2
GI 3
GI 1
GI 7
GI 4
GI 5
GI 6

ENVIRONMENTAL RESOURCES MANAGEMENT GAMSBERG ESIA REPORT
6-65
The outer rim of the Gamsberg and the broader eastern plateau was found on the whole to have extremely minimal archaeological traces, with occurrences being mostly in the form of occasional isolated flakes (exemplified by the locality GI 6). Attention was focused on several parts of the broad eastern rim and within valleys and kloofs sloping eastwards off the Gamsberg and westwards into the basin. The kloof areas, settings of high energy run off during heavier rains, were found to be largely devoid of artefacts. Small shelters/overhangs at various places in the sides of the basin and kloofs were examined for evidence of possible Later Stone Age occupation within the Gamsberg basin, eg stone tool scatters in driplines or on a shelter talus, or where finger paintings or engravings might feature on rocks or shelter walls. Again, evidence was generally lacking.
Table 6.18 Archaeological Observations: Gamsberg Inselberg and Basin
Locality Description Heritage Significance GI 1 29.23450 S 18.95805 E
A Middle Stone Age workshop site identified previously by Deacon (1995), of high regional significance. It had been quarried for the making of a landing strip on the top of Gamsberg. The in situ remainder of the occurrence is estimated to extend over an area of >150 x 50m, and was revealed in a scraped section to have a depth of at least 100 mm in at least that part of the site. The significance of the site is partly in relation to the raw material source at that point in the landscape.
High
GI 2 29.23668 S 18.95275 E
A small shelter on the northern side of the basin. While it was expected that there might be evidence of Later Stone Age (LSA) or earlier use, there were minimal traces of archaeological material: a single LSA quartz flake was found. The shelter was disturbed by previous mining-related activity.
Low
GI 3 In vicinity of 29.24339 S 18.95494 E
Scatters of varying but generally low density Middle Stone Age and Acheulean material, sometimes mixed, in and alongside the dry watercourse draining the western interior of the inselberg. Erosion and high energy run-off in heavy rains would account for what would essentially be a secondary depositional context, lacking in archaeological integrity.
Low
GI 4 In vicinity of 29.24162 S 18.95041 E
On the inner slopes of the Gamsberg basin several places with isolated or weakly clustered artefacts of Pleistocene age were noted. One of these in the approximate location indicated suggests an Acheulean (Earlier Stone Age) workshop site focussed on what was apparently a favoured raw material source outcropping there.
Low

ENVIRONMENTAL RESOURCES MANAGEMENT GAMSBERG ESIA REPORT
6-66
Locality Description Heritage Significance GI 5 In vicinity of 29.24649 S 18.95346 E
South east of Site GI 4, a further low density clustering of Acheulean artefacts. In an eroded setting on the sloping side of the basin, there is no depth of deposit and hence no likelihood of stratigraphy.
Low
GI 6 29.25676 S 18.99313 E
On a flat and slightly less rocky area, an extremely low density of probably Middle Stone Age artefacts (up to 20 m apart from one another).
Low
GI 7 29.230614 S 18.98044 E
A rock shelter near the northern exit of the kloof with some deposit but no clear evidence of archaeological material. Discolouration on the shelter wall may constitute a faded finger painting but this seemed equivocal. The shelter is beyond the planned mine layout.
Medium
Palaeontology
The Study Area is situated in the northern part of the Bushmanland Plateau where inselbergs and ridges of bedrock project steeply above the sandy plains. These are rocks of the Namaqua Metamorphic Province and the specific strata comprising Gamsberg belong to a meta-volcanosedimentary succession named the Aggeneys Subgroup of the Bushmanland Group. The age of the Bushmanland Group is between 1640 and 1200 Ma. The mining of the zinc ore in unfossiliferous Bushmanland Group bedrock strata does not have an impact on fossil heritage. The fossils most commonly seen in aeolianites are land snails and tortoises. Closer inspection reveals the incisors, skulls and bones of moles. Other small bones occur sparsely such as bird and micromammal bones. This is the ambient fossil content of dunes and it includes the bones of rodents, lizards, snakes, birds, ostrich eggshell and small mammals (hares, mongooses, cats etc.). The bones of larger animals are generally very sparsely scattered. Notwithstanding, concentrations of bones are found in specific contexts. Watercourses are present at a variety of scales, from small, ephemeral, braiding-stream courses on alluvial fans to more entrenched, integrated drainage sustems. The fossil potential of small-scale systems is very low. In larger drainages fossils such as abraded bone fragments and loose teeth occur sparsely in channel lags. These drainages must have been more active during periods of wetter climate such as occurred during the Quaternary. Finds such as the snail Melanoides, clam Corbicula and freshwater oyster Etheria attest to more perennial freshwater availability in the larger, now seldom-flowing drainages. The latter will also have hosted waterhole and pan deposits in places, with improved fossil potential.

ENVIRONMENTAL RESOURCES MANAGEMENT GAMSBERG ESIA REPORT
6-67
No areas of particular paleontological sensitivity are identified within the area of direct influence. Due to the sparse, very patchy distribution of fossils in the subsurface, the probability of an important fossil find is considered unlikely.
6.13 VISUAL QUALITY OF THE AREA
Newtown Landscape Architects (NLA) were commissioned to carry out a Visual Impact Assessment (VIA) for the Mine and associated infrastructure (refer to Annex G for the full report). It can be concluded from this study that the Project area has a high visual quality and a strong sense of place, even though its visual characteristics may be common within the region. The desolate, arid plain, punctuated by rugged koppies against the blue sky backdrop creates a sense of expansive vastness that can easily be recalled, especially by touristic travellers that would generally be interested in their surroundings. The sections that follow provide a brief summary of the visual quality associated with the Project area. This information is specifically based on the VIA undertaken by NLA (Cilliers & Young, 2013).
6.13.1 Landscape Character
Dominant landform and land use features (eg hills, rolling plains, valleys and urban areas) of similar physiographic and visual characteristics, typically define landscape character types. The study area is characterised by two broad landscape types. Flat expansive plains with gentle rolling topography and a series of inselbergs (and other smaller rocky outcrops, referred to as ‘koppies’) that protrude above these plains. These landscape types are typical of large portions of the Northern Cape Province. The panorama photographs in Figure 6.36 illustrate the striking and vast nature of the landscape when viewed from the N14 and a small koppie to the north of the road. The lack of tall vegetation and the flatness of the plain emphasises the ruggedness and the verticality of the inselberg and the surrounding koppies.

ENVIRONMENTAL RESOURCES MANAGEMENT GAMSBERG ESIA REPORT
6-68
Figure 6.36 Landscape Character
The southern slopes of the Gamsberg inselberg support a greater variety of vegetation than the northern slopes. These slopes also have a rugged beauty which is characteristic of the typical Northern Cape landscape. The interior of the Gamsberg inselberg is made up of rocky terrain with associated bowl shaped topography, covered by low growing grasses and shrubs. This is also the location of a rare occurrence, a kokerboom forest. These trees dot the landscape and are a noticeable feature of the landscape.
6.13.2 Visual Resource Value / Scenic Quality
Scenic quality ratings were assigned to predominant landscape types, including ‘Koppies and the Gamsberg Mountain’, ‘Farmsteads and the town of Aggeneys’ and ‘Existing Mining Infrastructure and Power Lines’. The highest

ENVIRONMENTAL RESOURCES MANAGEMENT GAMSBERG ESIA REPORT
6-69
value is assigned to the topographical features including the koppies and the Gamsberg Mountain, as well as the dry water courses. The farmstead and town of Aggeneys were rated as being moderate. The lowest scenic quality rating was assigned to mining infrastructure and power lines. Figure 6.37 rates the relative scenic quality of each type and its landscape sensitivity.

ENVIRONMENTAL RESOURCES MANAGEMENT GAMSBERG ESIA REPORT
6-70
Figure 6.37 Visual Resource and Views

ENVIRONMENTAL RESOURCES MANAGEMENT GAMSBERG ESIA REPORT
6-71
The overall study area can be regarded as having a high visual resource value with its relatively unspoilt, vast, arid pains and rugged, rocky koppies contrasting dramatically with the blue skies. A summary of the visual resource values is tabulated in Table 6.19 below.
Table 6.19 Value of the Visual Resource
High
Koppies and Gamsberg
Moderate
Farmstead and Town of Aggeneys
Low
Mining Infrastructure and Power Lines
This landscape type is considered to have a high value because it is a: Distinct landscape that exhibits a very positive character with valued features that combine to give the experience of unity, richness and harmony. It is a landscape that may be considered to be of particular importance to conserve and which has a strong sense of place.
This landscape type is considered to have a moderate value because it is a: Common landscape that exhibits some positive character but which has evidence of alteration /degradation/erosion of features resulting in areas of more mixed character.
This landscape type is considered to have a low value because it is a: Minimal landscape generally negative in character with few, if any, valued features.
Sensitivity: It is sensitive to change in general and will be detrimentally affected if change is in appropriately dealt with.
Sensitivity: It is potentially sensitive to change in general and change may be detrimental if in appropriately dealt with.
-
6.13.3 Sense of Place
The sense of place for the study area is derived from a combination of all landscape types and their impact on the senses. Most people who live near or pass through the study area approach it along the N14 national road. They travel through an open dry landscape that is frequently ‘punctuated’ by curious koppies. It is this vast, desolate landscape with its hues of brown and backdrop of magnificent skies that give the area its unique character. It is this image that will leave a visual impression that can easily be recalled, in the mind. Although the study evokes a distinct sense of place, it is not unique to the district or region. Nevertheless, the landscape quality or visual resource of the study area is considered to be high.
6.13.4 Views
The vast majority of the views of the Project will be experienced from the N14 as motorists travel past the site in an easterly or westerly direction. One of the tourist attractions of the Northern Cape Province and an event that increases the volume of traffic on the N14, is the natural spring flower display that extends up the west coast and inland to the east of Springbok. This makes

ENVIRONMENTAL RESOURCES MANAGEMENT GAMSBERG ESIA REPORT
6-72
views from the N14 road important and perhaps the most sensitive to the proposed intervention. The total volume of the N14 is however relatively low. Other views of the Project would be from the mining town of Aggeneys, to the west of the proposed project, and the farmstead of Achab, to the east of the proposed project (refer to Figure 6.38).
6.13.5 Sensitive View Locations
Sensitive viewer locations would be views from tourist type travellers along the N14 and views from the farmstead of the farm Achab. Views from the town of Aggeneys would not be regarded as being sensitive since it is a mining town and most residents are employed by a mining company. In accordance with Table 6.20 below, the potential sensitivity of visual receptors has been rated as being high.
Table 6.20 Potential Sensitivity of Visual Receptors
High Moderate Low Visitors of Game Farms/Lodges and travelling along local routes, whose intention or interest may be focused on the landscape.
People engaged in outdoor sport or recreation (other than appreciation of the landscape, as in landscapes of acknowledged importance or value).
Visitors and people working in mining / prospecting activities and travelling along local mining roads whose attention may be focused on their work or activity and who therefore may be potentially less susceptible to changes in the view.
Communities where the development results in changes in the landscape setting or valued views enjoyed by the community.
People travelling through or past the affected landscape in cars, on trains or other transport routes.
-
Occupiers of residential properties with views affected by the development.
- -
6.14 ECOSYSTEM SERVICES IMPACTS
6.14.1 Introduction
The IFC Performance Standard 6 defines ecosystem services as “the benefits that people, including businesses, obtain from ecosystems. Ecosystem services are organized into the following four major categories: • Provisioning ecosystem services include inter alia (i) agricultural products,
seafood and game, wild foods and ethno-botanical plants; (ii) water for drinking, irrigation and industrial purposes; (iii) areas which provide the basis for many biopharmaceuticals, construction materials, and biomass for renewable energy.

ENVIRONMENTAL RESOURCES MANAGEMENT GAMSBERG ESIA REPORT
6-73
• Regulating ecosystem services include inter alia (i) climate regulation and carbon storage and sequestration; (ii) waste decomposition and detoxification; (iii) purification of water and air; (iv) control of pests, disease and pollination; (v) natural hazard mitigation.
• Cultural services include inter alia (i) spiritual and sacred sites; (ii)
recreational purposes such as sport, hunting, fishing, ecotourism; (iii) scientific exploration and education.
• Supporting services are the natural processes that maintain the other
services such as (i) nutrient capture and recycling; (ii) primary production; (iii) pathways for genetic exchange.
Note that ecological/biophysical processes are not to be confused with ecosystem services unless an identifiable beneficiary is directly benefiting from that process as well.
6.14.2 Approach to Prioritisation and Assessment Ecosystem Services
A selection of the ecosystem services commonly assessed and having possible relevance to the project area has been compiled. Background data to provide a brief understanding of these services is presented. Thereafter the ecosystem services have been prioritised based on three variables, namely sustainability, importance to beneficiaries and replaceability. Sustainability is assessed in an ecological context, and is relevant to the provisioning ecosystem services only. Quantitative data is not available, but relevant services are subjectively assessed as either not used, sustainable or not sustainable. Importance of ecosystem services to beneficiaries is assessed according to the following criteria and assigned a rating from low to essential: • Intensity of use eg daily, weekly or seasonal use; quantitative data will be
used if available and relevant;
• Scope of use eg household versus village level, commercial use only, subsistence only or both;
• Degree of dependence eg contribution of wild fish to total protein in the diet; contribution of fishing to employment in the community; and
• The importance expressed by beneficiaries, including cultural / historical importance.
The weight given to each of these components will vary slightly depending upon the service, but stakeholder values should take precedence over other criteria where the rating is not clear. Finally, where a service may be of greater or lesser importance to different stakeholder groups, two (or more) ratings should be assigned so that impacts on these groups can be assessed

ENVIRONMENTAL RESOURCES MANAGEMENT GAMSBERG ESIA REPORT
6-74
individually. Ecosystem services are rated on importance as low, moderate, high or essential. Replaceability (or availability of alternatives): The ‘replaceability’ of a service is assessed according to the following criteria and assigned a rating from low to high: • Existence of spatial alternatives, including both natural replacements (eg
the replacement of one type of wild food with another) and man-made substitutes (eg availability of man-made drugs as an alternative to medicinal plants);
• Accessibility, cost and sustainability of potential alternatives, including a consideration of other users and the existing status and threats to the resource(s) providing natural alternatives to the service; and
• Preference/appetite for and cultural appropriateness of alternative services.
Non-sustainable ecosystem services are not prioritised in accordance with the approach adopted with the IFC. Other services are prioritised as Low, Medium, High or Critical priority based on the matrix presented in Table 6.21 .
Table 6.21 Matrix to Determine Ecosystem Priority Based on Replaceability and Importance to Beneficiaries
Replaceability of Service High
(many spatial alternatives)
Moderate (some spatial alternatives)
Low (few to no spatial
alternatives)
Impo
rtan
ce o
f se
rvic
e to
be
nefi
ciar
ies Low Low Low Medium
Moderate Low Medium High
High Medium High Critical
Essential High Critical Critical
6.14.3 Determination of Mine Dependencies on Ecosystem Services
A summary of ecosystem services is provided in Table 6.21 with an assessment of their priority. A brief description and discussion of each ecosystem service is provided below. • Wild-caught foods: This service is defined as the capture, killing, trading
and/or consumption of wild vertebrate fauna (not including fish). No evidence is available that local beneficiaries depend on wild-caught foods from the project area.

ENVIRONMENTAL RESOURCES MANAGEMENT GAMSBERG ESIA REPORT
6-75
• Capture fisheries: Baseline surveys by faunal specialists have revealed that aquatic ecosystems are limited and do not support any fish species (GroundTruth, 2013).
• Other Wild foods: This service is defined as fruit, nuts, wild plants, etc.
collected in natural areas for consumption or sale. Subsistence communities existed in the area historically, but no longer depend on natural resources there. Access to the Project site has been restricted for approximately 40 years and no known harvesting of wild foods is taking place, and there is no community of people currently dependant on this service.
• Fuel wood: Wood is an important source of energy and is primarily used
for cooking (see Section 6.10.4). The wood is collected from the surrounding communal land at the closest town Pofadder and sold to local beneficiaries. This serves as an important source of income as they have limited access to any other form of income generation. Limited availability of fuel wood exists due to the dry climate and slow growth of woody plants. It must be noted that the Project site is an existing mining site and access into the inselberg is currently restricted. The existing mining operation at Gamsberg has no public access points and therefore surrounding communities have not developed a dependency on wood collection from the inselberg or surrounding mining license area.
• Natural medicines: Communities in Pofadder and Pella use a range of
medicinal plants to treat high blood pressure, diabetes, stomach aches, headaches, cancer and flu as mentioned in Section 6.7. Some of the known medicinal plants include Kalkoentjiebos (Sutherlandia frutescens), Hoedia (Hoodia gordonii), Skaapbos (Tripteris sinuata) Gamostahoe, Baarbos, Loesering, Agdag geneesbos, and Wymryk. The following medicinal uses are known:
• Kalkoentjiebos (Sutherlandia frutescens) is claimed to be a natural cure
for Cancer.
• Hoodia gordonii has long been known by the indigenous populations of Southern Africa, who infrequently use these plants for treating indigestion, small infections and to suppress appetite.
• Non-floral medicines include Klipsweet / Dassiepis, which is an
accretion of urine and dung of rock hyraxes (also known as rock Dassies) which occur in the Project area, when fossilized with age, is used locally and elsewhere in South Africa for the traditional treatment of epilepsy.
There are no conservation programmes to protect or manage the collection of medicinal plants, which are found in the veld surrounding the settlements. It is generally the elderly that consume medicinal plants

ENVIRONMENTAL RESOURCES MANAGEMENT GAMSBERG ESIA REPORT
6-76
and advise on which medicinal plants to use to treat ailments. It must be noted that the Project site is an existing mining site and access into the inselberg is currently restricted. The existing mining operation at Gamsberg has no public access points and therefore surrounding communities have not developed a dependency for medicinal plants from the inselberg.
• Freshwater: The Project area is located in an arid low rainfall zone where
access of freshwater resources is limited. The Project area includes a number of freshwater springs and an aquatic system through the Kloof Habitat. It must be noted that the Project site is an existing mining site and access into the inselberg is currently restricted. The existing mining operation at Gamsberg has no public access points and therefore surrounding communities have no dependency on these water resources. However, the surrounding farmers are dependent on groundwater resources for stock farming and consumption.
• Crops: The arid climate of the study area is not suitable to crop production
and no crop production takes place within the mine site.
• Livestock farming: The dominant land use of the greater area surrounding the Project site is livestock farming with sheep and goats. Livestock farming is dependant on the grazing and browsing of natural vegetation. Unsustainable livestock production has resulted in widespread occurrence of overgrazing in the surrounding areas with reduced floral diversity. Access to the site for livestock farming has been prohibited for many years, and as a result the Gamsberg is currently considered to be the key biodiversity feature underpinning ecological processes/ function in the area. Emergent livestock farmers have indicated that they want access to unused BMM-owned land for grazing their stock.
• Air quality and climate regulation: The Gamsberg does not support lush
vegetation with low levels of photosynthesis taking place due to the arid climate. The site is therefore expected to provide a very limited contribution towards Carbon sequestration and climate regulation.
• Disease and pest regulation: A diversity of predatory birds and
mammalian carnivores are present within the Gamsberg, which provides an important refuge for these animals. Rock dassies have the potential to modify their habitats through overpopulation but are effectively controlled by Verreaux’s Eagles, their primary predator which nest within the Gamsberg. Few pest or disease regulating functions can be defined, however, it is expected that some may occur.
• Pollination and seed dispersal: Invertebrates and birds are important
pollinators or various plants and are thus important for maintaining floral and thus habitat diversity within the Gamsberg and surrounding areas.

ENVIRONMENTAL RESOURCES MANAGEMENT GAMSBERG ESIA REPORT
6-77
This is an important service, however there is limited evidence of direct human beneficiaries of these services.
• Religious, sacred or spiritual sites/purposes: The Gamsberg has
historically been an important site for spiritual purposes. Access to the site has been limited for almost two generations and from interviews with community members in Pella and Pofadder it is understood and accepted that access to the Gamsberg site is restricted. There are attempts to reinvigorate people’s sense of their Nama culture, but there is little evidence to show that the present communities of Pofadder and Pella have a spiritual connection to the Gamsberg site
• Aesthetic value: The Gamsberg is a prominent feature of the landscape.
The topographical features including the hills, koppies and the Gamsberg inselberg as well as the dry water courses are rates as having the highest scenic quality ratings. The farmstead and town of Aggeneys are rated as being moderate. The lowest scenic quality ratings were assigned to the mining infrastructure and power lines. The overall study area can be regarded as having a high visual resource value with its relatively unspoilt, vast, arid pains and rugged, rocky outcrops contrasting dramatically with the striking blue skies. The aesthetic value is linked to the tourism potential of the area.
• Tourism: Tourism as an industry spans several economic sectors ranging
from accommodation to catering retail and wholesale, manufacturing, transport and communication, businesses and social services. The Namakwa District Municipality has identified tourism as an important growth area for the District as well as the Khai Ma Local Municipality. The Namakwa District Municipality has the tourism potential in the following niche markets:
• Eco-tourism due to the vast open land, natural flora and fauna and a
number of national parks and conservancies;
• Adventure tourism through 4x4 trails as well as hiking and fishing;
• Historical and cultural tourism due to the rich local heritage of the Khoi San and Nama people; and
• Technological tourism as a result of the South African Large Telescope (SALT), the Square Kilometre Array (SKA) as well as a number of proposed renewable energy projects in the area.
Tourism is a fast growing sector and has had a significant impact on accommodation and catering sectors of the district economy. The tourism potential in Khai Ma LM is not fully realised.

ENVIRONMENTAL RESOURCES MANAGEMENT GAMSBERG ESIA REPORT
6-78
• Pathways for genetic exchange and maintenance of biodiversity: Inselbergs within the Bushmanland Inselberg Region represent an archipelago of rocky islands within a vast expanse of sand, and serve as stepping stones for many species that hop from one inselberg to another. They also provide important ecological refugia for species that are important from an evolutionary/climate adaptation perspective. The inselbergs form a sequence that represents an ecological corridor defined by the Namakwa District Map of Critical Biodiversity Areas. The Gamsberg is located midway along this corridor and its position is key to the east-west movement of species. The Gamsberg inselberg is considered to be the key biodiversity feature underpinning ecological processes/function in this system.
6.14.4 Prioritisation of Ecosystem Services
Ecosystem services described above are assessed below in terms of their importance to beneficiaries, replaceability and sustainability in the project area. Their priority is assessed based relationship between importance and replaceability using the matrix presented in Table 6.22.
Table 6.22 Priority Determination of Ecosystem Services for the Proposed Gamsberg Mine and Surrounding Environs
Ecosystem Service Importance to beneficiaries
Replaceability Sustainability in the project area
Priority Rating
Provisioning Services Wild-caught foods None Not applicable Not applicable - Capture fisheries None Not applicable Not applicable - Other Wild foods None Not applicable Not applicable - Fuel wood Low Moderate Not used Low
This service is available but communities do not have access. Natural medicines Low High Not used Low
This service is available but communities do not have access. Freshwater availability High High Sustainable Medium
Groundwater is the primary source of water, which will be adversely affected by the mine.
Crop production None Not applicable Not applicable - Livestock farming Low High Not used Low
Natural grazing is available, however communities do not have access to this resource.
Regulating Services Air quality and climate regulation
None Not applicable - -
Disease and pest regulation
Low Moderate - Low
Pollination and seed dispersal
Low Moderate - Low
Cultural Services Religious, Sacred or spiritual sites
Medium Moderate - Medium
Aesthetic value Medium Low - High Tourism Low Low - Medium Supporting Services

ENVIRONMENTAL RESOURCES MANAGEMENT GAMSBERG ESIA REPORT
6-79
Ecosystem Service Importance to beneficiaries
Replaceability Sustainability in the project area
Priority Rating
Genetic pathways and maintenance of biodiversity
Medium Low - High
6.14.5 Summary of Ecosystem Services Assessment
Most ecosystem services are not applicable or of low relevance to the project as the project site has not been accessible to local communities for many years and access to the site is likely to become more restrictive with mining activities. The areas surrounding the project area consist mostly of private commercially-owned farms and there are no communities depending on subsistence livelihoods. Only ecosystem services with a high or critical priority are considered relevant for assessment of the impact of the mining development. As can be seen from Table 6.21, only two ecosystem services have a high priority, namely tourism and pathways for genetic exchange and biodiversity maintenance. The tourism industry is discussed in the Social baseline, the mining development is not considered to present a major threat to the industry. Pathways for genetic exchange and maintenance of rare and threatened species has been assessed as high due to potential loss of endemic and threatened succulents. The impacts of biodiversity loss are assessed in Section 9.3.