polyce metropolisation and polycentric development in central … · larger size, although evidence...
TRANSCRIPT
ESPON 2013 1
POLYCE Metropolisation and Polycentric Development in Central Europe
Targeted Analysis 2013/2/12
Interim Report | Updated Version 22 December 2011

ESPON 2013 2
This report presents the interim results of a
Targeted Analysis conducted within the
framework of the ESPON 2013 Programme,
partly financed by the European Regional
Development Fund.
The partnership behind the ESPON Programme
consists of the EU Commission and the Member
States of the EU27, plus Iceland, Liechtenstein,
Norway and Switzerland. Each partner is
represented in the ESPON Monitoring
Committee.
This report does not necessarily reflect the
opinion of the members of the Monitoring
Committee.
Information on the ESPON Programme and
projects can be found on www.espon.eu
The web site provides the possibility to
download and examine the most recent
documents produced by finalised and ongoing
ESPON projects.
This basic report exists only in an electronic
version.
© ESPON & Centre of Regional Science, Wien
University of Technology, 2011
Printing, reproduction or quotation is authorised
provided the source is acknowledged and a
copy is forwarded to the ESPON Coordination
Unit in Luxembourg.
ESPON 2013 3
List of authors
Lead Partner:
Wien University of Technology, Centre of Regional Science
Rudolf Giffinger Johannes Suitner, Justin Kadi, Hans Kramar, Christina Simon
University of Ljubljana, Faculty of Civil Engineering and Geodesy
Natasa Pichler-Milanovic, Alma Zavodnik-Lamousek, Samo Drobne, Miha Konjar
Slovak University of Technology, Bratislava
Maros Finka, Matej Jasso, Zuzana Ladzianska
University of Szeged
Zoltan Kovacs, Tünde Szabo, Lajos Boros, Szabolcs Fabula, Agi Papp
Czech Technical University in Praha, Faculty of Architecture
Karel Maier, Marketa Hugova
Charles University in Praha, Faculty of Science
Ludek Sykora, Ondrej Mulicek, Petr Kucera
CEPS/INSTEAD - Centre for Populations, Poverty and Public Policy Studies, Luxembourg
Christophe Sohn , Sabine Dörry
Politecnico di Milano
Roberto Camagni, Andrea Caragliu, Ugo Fratesi

ESPON 2013 4
List of stakeholder cities and institutions
City of Vienna (Lead Stakeholder)
Department of Urban Development and Planning
City of Bratislava
Department for Spatial Systems Coordination
City of Ljubljana
Department of Spatial Planning
City of Prague
City Development Authority
City of Budapest
Studio Metropolitana, Nonprofit Ltd.
ESPON 2013 5
Table of contents
1. LIST OF ABBREVIATIONS .................................................................................... 6
2. FIGURES ................................................................................................................ 7
3. EXECUTIVE SUMMARY ........................................................................................ 8 3.1. The approach in POLYCE ......................................................................................................... 8 3.2. Preliminary results ..................................................................................................................... 8
4. STRUCTURE OF THIS REPORT ......................................................................... 13
5. INTRODUCTION ................................................................................................... 13
6. OBJECTIVES ....................................................................................................... 14
7. CONCEPTUALIZATION ....................................................................................... 14 7.1. Definitions and understanding.................................................................................................. 15 7.2. Basic assumptions regarding metropolisation and polycentricity ............................................. 16 7.3. Policy Relevance ..................................................................................................................... 18
8. POLYCENTRICITY ............................................................................................... 21 8.1. Introduction: definitions and methodological approach ............................................................ 21 8.2. Intra-metropolitan polycentricity: morphology and relations within the metropolises ................ 23 8.3. Polycentricity within the CED-zone and position of the CED-zone within Europe .................... 24
9. METROPOLISATION, POLYCENTRICITY AND URBAN SIZE .......................... 29 9.1. Introduction .............................................................................................................................. 29 9.2. Traditional views on cities ........................................................................................................ 29 9.3. Beyond traditional views .......................................................................................................... 31 9.4. The model ................................................................................................................................ 32 9.5. The data set ............................................................................................................................. 33 9.6. Empirical results ....................................................................................................................... 33 9.7. Conclusions ............................................................................................................................. 35
10. POSITIONING OF EUROPEAN METROPOLISES: URBAN PROFILES ........ 35 10.1. Methodology: steps for selection of cities and relevant indicators............................................ 36 10.2. Data Sources and Indicators Formation ................................................................................... 37 10.3. Key development characteristics ............................................................................................. 38
11. PERCEPTIONS, ASSESSMENTS AND PERSPECTIVES .............................. 40 11.1. Objectives ................................................................................................................................ 40 11.2. Methodology ............................................................................................................................ 40 11.3. Main results of stakeholder survey ........................................................................................... 42
12. STRATEGIC EFFORTS AND RECOMMENDATIONS .................................... 47 12.1. Introduction .............................................................................................................................. 47 12.2. Objectives ................................................................................................................................ 47 12.3. Methodology ............................................................................................................................ 48 12.4. Outcomes ................................................................................................................................ 48
13. FURTHER PROCEEDING TOWARDS THE DRAFT FINAL REPORT ........... 49
14. LITERATURE .................................................................................................... 52

ESPON 2013 6
1. List of Abbreviations
ATTREG Attractiveness of European Regions and Cities for Residents and Visitors
(ESPON Project 2012)
CC Core City; administrative area of a city
CED-zone Central European - Danube global integration zone
CORDIS Community Research and Development Information Service
DEMIFER Demographic and migratory flows affecting European regions and cities
(ESPON Project 2010)
EFP EU Research Framework Programme
ESDP European Spatial Development Perspective
ESPON European Observation Network for Territorial Development and Cohesion
EUROSTAT Statistical database with detailed information on the EU and candidate countries
FIRE firm networks Finance Insurance and Real Estate
FMA Functional Metropolitan Area
FOCI Future Orientation for Cities (ESPON Project 2010)
FUA Functional Urban Area; spatial delimitation for urban agglomerations in Europe as identified in ESPON 1.1.1 (ESPON Project 2005)
GaWC Global and World City Research Network
ICT Information and communication technologies
INTERCO Indicators of Territorial Cohesion (ESPON Project 2012)
KIT Knowledge, Innovation, Territory (ESPON Project 2012)
LUZ Large Urban Zone
MEGA Metropolitan European Growth Area; FUAs with metropolitan functions as identified in ESPON 1.1.1 (ESPON Project 2005)
MR Metropolitan Region
NUTS Nomenclature of Territorial Units for Statistics
POLYCE Metropolisation and Polycentric Development in Central Europe (ESPON Project 2012)
UA Urban Audit; Comparable statistics and indicators for European cities
WP Work Package of POLYCE as indicated in the project plan (see Fig. 13)

ESPON 2013 7
2. Figures
Figures
Fig. 1: Web search intensity on names of POLYCE cities .............................................. 9
Fig. 2: Growth potentials of the 5 POLYCE cities (logarithmic values) ......................... 10
Fig. 3: Key development characteristics in POLYCE metropolitan profiles .................. 10
Fig. 4: Spatial reference for recommendations in POLYCE .......................................... 16
Fig. 5: Understanding Smart Metropolitan Development .............................................. 20
Fig. 6: Metropolitan Territory of the POLYCE Capital Cities ......................................... 22
Fig. 7: FIRE firm networks 2000 (Source: GaWC research network) ........................... 26
Fig. 8: Cooperation in EFP research projects 2001-2010 (Source: CORDIS online database) ...................................................................................................................... 28
Fig. 9: Definitions of polycentricity according to POLYCE ............................................ 31
Fig. 10: Marginal costs and marginal benefits for city size ............................................ 33
Fig. 12: Equilibrium city size (population) as predicted by the main model vs. real city size ................................................................................................................................ 34
Fig. 13: Factors and indicators describing key development characteristics (key policy areas) .................................................................................................................. 39
Fig. 14: POLYCE project plan ....................................................................................... 50
ESPON 2013 8
3. Executive Summary
3.1. The approach in POLYCE
POLYCE aims at identifying the importance of the mutual links between processes of metropolisation and polycentric development as well as the challenges and perspectives of future urban development in Central Europe.
Theoretical and empirical research addresses structural, functional and strategic relations that are based on competition or cooperation, targeting the five metropolises of Bratislava, Budapest, Ljubljana, Praha and Wien with their territory and within the Danube region.
A general framework on terminology, understanding and basic assumptions is defined serving as a guideline for the project’s development.
Quantitative empirical research focuses on the identification of polycentric structures, relevant factors influencing metropolitan development and most important characteristics describing the metropolises` position in the European urban system. With the application of qualitative methods potentials and assets of metropolitan development are assessed and perspectives of the specific metropolitan development are discussed with stakeholders and important local and regional actors. Based on corresponding results of empirical research policy recommendations will be elaborated.
Policy relevance will be fostered through the discussion and assessment of processes of metropolisation and polycentric development under the perspective of competitive and inclusive metropolitan development.
Final considerations and strategic recommendations will refer to two spatial levels:
The 5 metropolises as core cities with their functional metropolitan area
Central Europe as part of the Danube macro region
3.2. Preliminary results
3.2.1. Polycentric relations in Central Europe
A first step towards a better understanding of the urban system of the five POLYCE cities was to depict their polycentric system. In the Central European context polycentricity is assessed on three territorial levels:
Intra-metropolitan polycentricity (micro level)
Polycentricity within the Central European - Danube global integration zone (henceforth CED-zone) (meso level)
The CED-zone within the polycentric structure of Europe (macro level)
Empirical analysis shows different degrees of morphological polycentricity in the five metropolises. While the two smaller cities, Bratislava and Ljubljana, are comparably polycentric from a morphological point of view, Budapest, Wien and Praha play a more dominant role in their metropolitan regions. In terms of relational polycentricity, however, interconnections (based on commuting data) clearly demonstrate the difference between the functionally integrated urban system of Wien and urban systems in former communist countries. The latter are dominated by capital cities through unidirectional commuting to the core city and hierarchical subordination of smaller sub-centers in the metropolitan area (Fig. 1).

ESPON 2013 9
Results on relational polycentricity on the meso and macro level highlight the institutional and structural relations both between the five cities and with other cities outside the CED-zone. Though there are only limited relational data available, the analysis of FIRE firm networks indicates the existence of strong economic ties between Budapest, Praha and Wien. The three cities are also highly integrated in European and global FIRE firm networks, although the rank of locations in Wien is in sum higher than
in Praha and Budapest.
The analysis of EU research networks reveals that, not surprisingly, Wien, Budapest, and Prague are participating in a higher number of projects than Ljubljana and Bratislava. Vienna, however, by far participates in most projects compared to the other four cities.
Considering the different city sizes, Bratislava performs quite well in FIRE firm networks within the CED region as well as on the global scale, while Ljubljana plays a stronger role in European research networks. The analysis further suggests that inter-city relations in terms of FIRE firm and research networks are significantly influenced by travel times and ethnic ties, pointing to the ongoing influence of transport accessibility and historically shaped relations on economic activities.
Summing up the most distinct findings it can be stated that:
In comparison of the five cities, Wien stands out as a functionally integrated urban system
Strong economic ties can be recognized between Budapest, Praha and Wien
Bratislava and Ljubljana are performing well irrespective of their comparably smaller size
3.2.2. Determinants of urban performance
Metropolitan development can be explained by numerous influencing factors. To assess expected growth patterns and potentials for the five POLYCE cities (Fig. 2) a model was built. It identifies a specific cost-and-benefit-function and analyzes optimal city sizes in a sample of 59 EU27 cities in the period of 1989-2010. Results show:
Land rent is the highest cost factor for urban dwellers
The concentration of human capital is an important factor driving urban agglomeration
Urban amenities are an important benefit
Polycentric urban development is associated with a larger urban size, both in morphological and relational terms
Fig. 1: Web search intensity on names of POLYCE cities

ESPON 2013 10
Metropolised cities (with a high density of power functions) seem to reach a larger size, although evidence is quite weak.
Administrative and power functions typical for a capital city also contribute to city size with capital cities being larger than other cities of the sample.
Cities more embedded in international scientific networks, with a richer endowment with control and power functions and characterized by a denser urban structure are on average larger.
3.2.3. Characteristics of metropolitan profiles
The identification of similarities and differences between the five capital cities and other metropolises in Central Europe is a key objective in POLYCE.
Differences are assumed to be an outcome of metropolisation based on a metropolis’ functional specialisation.
As one outcome, POLYCE defines metropolitan profiles of each city. Their characteristics (Fig. 3) consist of factors that are assumed to be of relevance for metropolitan development. These factors comprise of a set of indicators from various European databases and recent research projects.
Results are utilized for an enhanced descriptive statistical and benchmarking analysis of the POLYCE metropolises vis-à-vis other MEGAs representing the state-of-the-art and level of metropolisation of these cities between 1998 and 2008. For detailed information on pre-selected indicators for the metropolitan profiles see appendix 6 to the scientific report.
Fig. 2: Growth potentials of the 5 POLYCE cities (logarithmic values)
Fig. 3: Key developmentcharacteristics in POLYCE
metropolitan profiles
ECONOMY
(Competitiveness)
PEOPLE
(Social and Human Capital)
MOBILITY
(Transport and ICT)
ENVIRONMENT
(Natural Resources)
LIVING
(Quality of Life)
GOVERNANCE
(Participation)
ESPON 2013 11
3.2.4. Main Results of Stakeholder Survey
The above-discussed quantitative assessment is complemented by a qualitative analysis of perceived strengths, weaknesses, potentials, assets and challenges of the five POLYCE cities. For this, in a first step, a survey among a group of stakeholders in the five cities was conducted. The survey aimed at identifying and assessing the perceived spatial characteristics of the cities among a set of relevant stakeholders (10 – 15 per city). The respondents were sampled based on their function so as to get answers from stakeholders coming from different perspectives. The central aim of the survey was therefore not to reveal an “objectified” truth by maximizing the number of respondents but rather to get an insight into the perception of spatial characteristics of leading personalities and opinion-makers with different backgrounds. In the interpretation, particular focus was put on the divergence or convergence in the responses in order to identify possible points of disagreement. Stakeholders from the following fields were approached: politics (core city), city planning administration, chamber of commerce, media, economic development agency, academy, real estate development, international enterprise, international organization, cultural institution, tourist agency, politician of city in metropolitan region, NGO, private planning bureau. Importantly, the questionnaire only allowed for a general identification of stakeholder perceptions, and it was not possible to further discuss the meaning of terms that were raised during the survey with the participants. Nevertheless, the questionnaires allowed for a first insight into the perception of urban development in the five cities. Relatedly, it has to be kept in mind that the meaning of terms is contextually defined, and similar terms will mean different things to stakeholders in different cities. Comparisons of the responses between cities should therefore only be made with caution.
The preliminary results from the survey are summarized below.
Bratislava (completed questionnaires: 14; no response from Chamber of Commerce, politics (core city))
Bratislava is perceived as a center of research and education, a dynamic, growing city with historical heritage that is prospective but also expensive. In the view of the respondents, the city performs well economically but struggles with environmental quality, infrastructure provision and aspects related to its institutional structure. The geographical location and international connectivity, cultural and historical heritage as well as a highly-skilled workforce are strengths of Bratislava. Conversely factors related to the administration of the city (long-term planning, marketing, service provision, green space planning) are considered to be the city’s greatest weaknesses. Bratislava is perceived as a fairly attractive partner with a lot of potential for future cooperation with other cities, which is however threatened by a lack of effective management.
Budapest (completed questionnaires: 15; no response from chamber of commerce)
Budapest is considered to be an attractive city with a thriving historical heritage that is however split apart in its social climate. The overall development over the last years is perceived positively, but increasing social inequalities, bureaucracy and corruption are threatening to hamper this development path. While in the view of the respondents the strengths of Budapest are related more to its location and natural characteristics, historical as well as cultural richness, its weaknesses are related to the unclear roles in the management of the city, lack of cooperation and existing inequalities. Budapest is however regarded to be an attractive partner for international cooperation, as the city is open-minded, well equipped for any kind of economic activity and provides high quality services. Ljubljana (completed questionnaires: 12; no response from chamber of commerce, politicians, tourism agency and NGOs)

ESPON 2013 12
Ljubljana is regarded as historical city and tourism destination that has recently experienced solid economic development. In the view of the respondents it performs well economically, particularly as highly attractive business location but conversely struggles with low levels of social integration and social mobility. According to the respondents, strengths of Ljubljana are to be found in its geographical location, its cultural and historical heritage and the related high attractiveness for tourism and economic activities, while a lack of clear strategic planning, the organization of public transport and unsustainable land use represent the city’s greatest weaknesses. Ljubljana is seen as attractive partner for cooperation that has a great deal of potential, which is however sometimes threatened by administrative mismanagement.
Prague (completed questionnaires: 11; no response from chamber of commerce, international organization, and politicians)
Prague is seen as a city of tourism with a rich historical heritage and a flourishing urban economy, which is attractive and unique but also expensive. According to the respondents Prague performs well economically, environmentally, socially, and in terms of infrastructure provision but struggles with institutional aspects. Strengths of the city lie in its geographical position, its economic performance, its social climate and the organization of transport. In contrast, the respondents regard public administration and unsustainable land use as the city’s greatest weaknesses. Prague is considered to be an attractive partner but there is doubt about the city’s will to cooperate with other cities.
Vienna (completed questionnaires: 12; no response from cultural institution, real estate developer)
Vienna is perceived as attractive, unique and safe place that benefits from its historical heritage and its related role as a tourist destination. It is performing well in terms of infrastructural provision, economic development and environmental quality. In the view of the respondents, this positive performance is however threatened by problems related to social integration. Strengths of the city are the high quality of life and the performance of the local economy. Conversely, weaknesses are the lack of integration, the low energy and resource efficiency as well as the lack of innovative economic activities. The city is considered to be a very attractive partner for cooperation, mainly due to existing experience with cooperation, the geopolitical location and the well-functioning administration.
The results obtained from the survey will be used as an input for the local city conferences held in autumn 2011 and will be discussed and refined during this event.
3.2.5. Next steps
Following the project schedule running Work Packages (WPs) will be completed in the coming months through the elaboration of metropolitan profiles, the analysis of strategic planning documents and the holding of five local city conferences with selected stakeholders. Finally, the project will elaborate recommendations for each of the five POLYCE metropolises and for the CED-zone as part of the wider Danube macro region.
ESPON 2013 13
4. Structure of this report
As this is the Interim Report of the POLYCE project, some chapters are still less elaborated due to the structure of work packages (WPs) and the project’s time plan (see chapter 13).
The structure of the report largely corresponds to the project’s working plan based on Work Packages, where WP2.0 serves as a guideline for the content-related part of the project, while WPs 2.1 to 2.5 concentrate on specific issues and objectives of empirical research.
Correspondingly, after a brief introduction (chapter 5) and the specification of the reports’ objectives (chapter 6), chapter 7 concentrates on the basic understanding of the processes of metropolisation and polycentric development, discussing their policy relevance and their consideration in the project results (as defined in WP2.0). Chapter 8 focuses on polycentricity, its understanding and the polycentric features of each of the five metropolises (as elaborated in WP2.1). Chapter 9 analyses urban size and the meaning of metropolisation and polycentric features as non-traditional factors of future urban development (WP2.2). In chapter 10 a comparative approach is adopted, resulting in metropolitan profiles of a large sample of European cities based on the description of each city’s territorial capital (WP2.3). Based on interviews with key stakeholders, in chapter 11 insights regarding the perception of potentials and the assessment of assets for future development of the 5 metropolises are provided (WP2.4). Finally, chapter 12 describes how results and recommendations are going to be elaborated in order to develop strategic initiatives supporting metropolisation and polycentric development (WP2.5).
5. Introduction
Two specific development trends are regarded important for the increasing interurban competition European cities find themselves confronted with:
First, along with increasingly competitive conditions, the allocation of economic investment activities across different types of cities follows distinct characteristics and (partly) meets the provided comparative advantages of the cities. Under conditions of globalization world cities occur as the global economy impinges upon cities and transforms their social, economic and physical dimensions in relation to their role in the global urban hierarchy (Friedman, 1986; Sassen, 1991). The emergence of specialized city systems defines new roles for particular cities or groups of cities in the global urban hierarchy. Such cities integrated into the »functional city systems« (i.e. cross-border inter-regional urban networks) also transform within the process of world city formation - affecting its original urban form, structure and development.
Second, along with globalization, the issue of competitiveness gained increasing importance in recent years (Parkinson, 2003; Begg, 1999). The fall of the Iron Curtain and the integration process of the East European countries changed the conditions for urban development, especially for cities in Central Europe. New opportunities and perspectives for economic activities arose along the integration process. They provide new market potentials and new patterns of mobility of labor forces and capital. (Rodriguez-Pose, 2002) However, at the same time the pressure of competition has increased as cities lost their former centrality and dominant central functions in the present urban hierarchy on a national level. Hence, related place-based strategies to strengthen a territory are increasingly in discussion. (Camagni, 2007; 2009; Giffinger et al., 2010)
ESPON 2013 14
6. Objectives
POLYCE’s main objective is to identify the importance of the mutual links between processes of metropolisation and polycentric development and the challenges and perspectives of future urban development. The project’s theoretical and empirical analyses target the five metropolises with their territory and the CED-zone and their structural, functional and strategic relations based on competition or cooperation. Final conclusions and policy recommendations take into account both, a metropolitan perspective regarding the five capital cities Bratislava, Budapest, Ljubljana, Praha and Wien, as well as a European perspective based on the five metropolises as part of the Danube macro region.
Besides, POLYCE will provide added value in terms of the methodological approach and the policy perspective:
Theoretical and empirical analysis considers traditional factors as driving forces of urban development and will therefore go beyond recent research efforts.
Knowledge of stakeholders regarding potentials, resources and assets of metropolitan development will be explicitly considered. Important stakeholders are actively involved in the empirical stage. Their perceptions of city specific assets as driving forces of metropolitan development will be considered comprehensively.
Policy relevance of POLYCE is fostered through the discussion and assessment of processes of metropolisation and polycentric development from the perspective of competitive and inclusive metropolitan development.
7. Conceptualization
WP2.0 serves as a guideline for the content-related part of the project (WP2.1 to WP2.5) and therefore has the following specific objectives:
Providing a comprehensive understanding of the mutual relation between metropolisation processes and polycentric development
Supporting research activities and knowledge exchange regarding the role of specific potentials and assets for metropolitan development in order to formulate strategic recommendations;
Assuring comparability and transferability of information.
Considering the methodological approach, the aim of POLYCE is twofold. It not only requires a description and analysis of specific ‘phenomena’ of metropolitan development and components of a metropolis’ territorial capital. The conceptual outline also asks for evidence-based explicit identification and assessment of city specific potentials and assets as well as for a place-related elaboration of strategic recommendations. Hence, two types of methodologies are applied in the course of empirical analysis (Werlen, 1995). First, hypotheses based on recent theoretical discussion/knowledge/insights are formulated. Second, in WP 2.1, 2.2 and 2.3 empirical analysis applies relevant quantitative methods. Based on findings of these three analytical WPs, qualitative methods are applied in WP 2.4 and 2.5 to deepen the perceived potentials and to assess elaborated city specific assets. These quantitatively and qualitatively empirical results eventually lead to strategic findings for each of the five city regions. Hence, qualitative methods are used to support learning processes and discursive identification of strategic recommendations.
ESPON 2013 15
7.1. Definitions and understanding
The process of ‘metropolisation’ is regarded as a comprehensive form of urban restructuring on the urban and regional level with very specific aspects:
A spatial concentration of (new) economic functions as well as a further concentration of population has an effect on a metropolis’ growth and spatial extension through immigration (Friedman, 1986 and 2002; Geyer, 2002)
As nodes of global networks, where material and immaterial flows (e.g. capital, information, people, or commodities) touch down, cities exercise important command and control functions and are well-connected with each other (Keeling,1995)
Knowledge intensive economic activities increasingly shape industrial production and the service industry (Krätke, 2007)
Metropolitan functions are highly spatially concentrated in urban agglomerations (BBSR, 2010)
Specialised and specific functions as driving forces of economic and demographic development are unequally allocated within a city or in a polycentric agglomeration (Kunzmann, 1996; Leroy, 2000; Sassen, 2002; Elissade, 2004
In POLYCE, metropolisation is regarded as a process of comprehensive urban restructuring based on a city’s ability to compete with other cities and to gain specific metropolitan functions. Therefore, a metropolisation process provides a specific social, economic and spatial outcome, which - generally spoken - depends on specific local factors of influence. Accordingly, the ability to successfully compete with other cities (inter-urban competitiveness) is very much linked to its ‘territorial capital’ (OECD, 2001). Territorial capital comprises different location related endowment factors and potentials but also specific forms of co-operative efforts with (strategic) planning character. Combined, they are suggested to provide competitive advantages for the realisation of metropolitan functions (Camagni, 2009). Following this conceptualization, metropolisation is regarded an outcome of mobilised territorial capital.
The concept of territorial capital discusses competitiveness comprehensively. Its basic endowment and functional related elements are natural features, material and immaterial cultural, technical and social heritage, fixed assets as infrastructures and endowment related qualities of distinct places. The basic relational elements are ‘untraded’ interdependencies such as customs, informal rules, or ethical guidelines, as well as local specificities such as national law, rules and practices, common strategies and policies). (Storper, 1997) Camagni (2009, p.123) distinguishes nine different goods by their level of rivalry and materiality, which characterise a territory’s capital.
The debate on the concept of polycentricity already emerged in the European Spatial Development Perspective (ESDP) (CEC, 1999) and determines the discussion within and beyond the ESPON programme (ESPON 1.1.1, 2005; Waterhout, 2002; Tatzberger, 2008). Polycentrism refers to the existence of more than one spatial pole. It can be understood in more morphological or functional ways, but also in more analytical or normative/strategic ways. However, mostly the debate on polycentrism is linked to the question of scale. Hence, in theoretical and empirical discussion the characteristics of the relations between spatial entities as well as the spatial level of polycentricity became increasingly important.
From an analytical point of view in POLYCE polycentricity is defined on the micro, meso and macro level. The five metropolises and their respective polycentric relations are the main focus of empirical analysis. From a policy perspective, the final

ESPON 2013 16
considerations and strategic recommendation will refer to two spatial levels (see Fig. 4):
The five metropolises as core cities with their region
The Central Europe - Danube global integration zone (CED-zone)
Fig. 4: Spatial reference for recommendations in POLYCE
For a more detailed overview of the spatial delimitations of the metropolitan territories see Fig. 6.
7.2. Basic assumptions regarding metropolisation and polycentricity
Based on general conceptual considerations with regard to the assumed driving forces of metropolisation, POLYCE draws on the following assumptions:
A1: According to the territorial capital approach, metropolisation is driven by both, regionally specific hard factors of endowment and soft relational factors. In combination, they activate and mobilise perceived potentials and transform them into assets. These local assets provide area based advantages, which are able to strengthen the competitiveness of cities and further attract specific metropolitan functions.
A2: Depending on the objectives and effectiveness of governance performance/exertion, along with polycentric relations, a distinct metropolitan development can be stimulated and fostered. It includes strong functional complementarities as area-bound economic advantages (structural/functional
ESPON 2013 17
relations) as well as co-operative governance efforts (institutional/strategic relations) at the micro, meso and macro level.
A3: Metropolitan development is driven by the process of accumulation of assets based on relevant cooperative governance initiatives. New governance exhibits ‘soft’ forms of policy-making and conflict solutions, for example bargaining and learning processes. They are the more effective the more metropolitan assets are created as they have a recursive and positive influence predominantly on economic and human capital. At the same time, these specific local assets impact on relational capital, notwithstanding the high and unquestionable costs associated to large urban scales.
A4: Metropolitan functions are established due to area bound advantages. Because of endowment related factors, metropolisation very often goes far beyond city borders. According to the capability of governance approaches steering allocation of metropolitan functions, metropolisation is realised in a polycentric way on the micro and meso level in terms of functional and strategic relations.
A5: Polycentric development between metropolises on the Central European level will evolve the more specific the metropolitan characteristics and profiles are and the more complementary the specialization of metropolises is. Good connectivity and accessibility within the global or at least the European context are necessary preconditions for functional and strategic relations between metropolises.
While these basic assumptions concern the general approach of POLYCE, the following assumptions form the basis for the specific Work Packages:
A6: Polycentricity on the micro level is a main basis for future development of the core city and the whole metropolitan region. It determines the possibility to establish new ways of co-operation between the settlements and the involved actors as well as to expand existing networks.
A7: Relational polycentricity is the backbone of political and market integration of the metropolises. On a meso and a macro level it includes institutional relations and interactions, both between the 5 partner cities and between them and the “rest of the world”.
A8: The process of metropolisation suggests a concentration of knowledge intensive industries. It requires a high-skilled labour force and according functions as there can be recognised a specific division of work within and around large urban agglomerations. However, in comparison “to the classical concentration process represented by cities in general, metropolisation is characterized by an increase of weight of the largest cities in the distribution of some functions, as well as by con-centration of population in metropolitan areas” (Elissalde, 2004).
A9: Two main preliminary interpretations to metropolisation can be provided at this stage: on the one hand, cities are different in terms of functions and of territorial capital they are specialized in. A high-value added service city reaches the decreasing return threshold for a size different than that of a manufacturing city. On the other hand, the way in which a city organizes its activities within the general urban system, e.g., setting up relations with other cities in a polycentric way on different levels, allows the city to overcome possible physical limitations.
A10: Due to the concept of territorial capital a territory’s competitiveness is influenced by (in-)tangible assets. In particular, intangible assets are of great importance because they are not subject of short-term market volatilities. The concept also emphasises that competitiveness as a driving force of metropolisation is given only if potentials are perceived and activated and transformed into specific assets. Positive learning processes are crucial between stakeholders on a metropolitan level to realise such local assets.

ESPON 2013 18
7.3. Policy Relevance
Challenges of competitive metropolitan development have become the focus of a comprehensive academic debate around “governance” in recent years (Parkinson, 1997 and 2003; Begg, 1999; Ottgaar et al., 2008; Salet et al., 2003; Healey, 1997). At the same time, challenges of intra-urban development already found attention in the policy debate within the URBAN-initiative of the first and second programme period at the European level. Based on the Lisbon-Agenda of 2000 the policy debate then concentrated for some years on competitiveness predominantly. The Green Paper (2008) stresses three issues regarding Territorial Cohesion: concentration and specialization, connections through infrastructure, cooperation and multilevel governance. Since some years policy discussion shifted to issues of social and territorial cohesion facing problematic and divergent processes at least on the interregional level. Recently the Europe 2020 Strategy again raised the issue of cohesion and emphasized the objective of ‘smart growth’. (found at: http://eur-lex.europa.eu/LexUriServ/LexUriServ.do?uri=COM:2010:2020:FIN:EN:PDF; July 27, 2011) In this strategy the discussion of an EU Cohesion Policy after 2013 focuses on smart, sustainable and inclusive growth. This policy initiative emphasizes that (ESPON, 2010, p.6):
Metropolises have decisive importance for Europe’s competitiveness,
Connectivity between highly developed and specialized places and good accessible metropolitan areas is crucial,
Networks on different geographical scales are linking global market places, and
Good governance and territorial cooperation are vital elements for the enforcement of economic and social cohesion.
From the spatial perspective inclusive growth should be based on its urban and regional competitiveness and at the same time it is regarded as “…not just economic and social cohesion, but also territorial cohesion.” (ESPON, 2010, p. 29) Very obvious, it is acknowledged that competitiveness on the one hand and economic and social cohesion on the other hand are two clear complementary aims. Stressing these complementary or sometimes conflicting goals territorial cohesion becomes the most important challenge – as a political goal but also as a means to meet the respective challenges within a certain territory. Correspondingly, in the ESPON point of view inclusive development is directly linked to territorial cohesion overcoming the contradiction and mutual obstacles between competitiveness and economic performance on the one hand and cohesion, environmental standards and quality of life on the other. Hence, the notion of inclusive development clearly stresses the importance of territorial cohesion as one of its crucial pre-requisites. So, inclusive development has become an important aspect of territorial development. A short review of the literature on “inclusive development” can be found in the appendix. (see appendix 2 of the scientific report)
To conclude from a policy perspective: Metropolisation is a process of attracting specific new activities (functions), jobs and residents predominately based on a city’s competitiveness. This means that the attraction of specific metropolitan functions and activities is based on a city’s specific and usually strongest assets and important potentials which provide specific area based advantages. These pre-conditions make certain places/areas more attractive than others – even within cities or at least in a wider metropolitan territory. Along with this process new sub centers emerge and metropolitan development usually goes far beyond city borders in a more or less
ESPON 2013 19
polycentric manner. In this context metropolitan governance approaches become of crucial importance regarding territorial development: Through the enforcement of competitiveness and the attraction of such functions the risk of socioeconomic polarization increases and spatial fragmentation is intensified since not every social group and not every area is able to participate in the overall growth. Hence, the stronger these divergent processes are, the more will social polarization increase and social cohesion be jeopardized. As specific allocation of metropolitan function steers spatial development the risk of spatial disparities increases. If polycentric development implies mutual interlinks a cohesive economic and territorial development is secured. But, very often a metropolis’s territorial development is strengthened through spatially divergent processes which increasingly show the risk of spatial fragmentation the more distinct areas are not able to compete for new metropolitan functions.
In a territorial perspective policy on inclusive development is challenged as a normative approach on the socio-spatial level. Facing the impacts and risks of urban competitiveness, inclusive development policy has to explicitly ask for the enforcement of territorial cohesion. This is the more challenging the more metropolitan competitiveness mainly benefits the most attractive areas within a metropolitan region, which neglects other areas and, thus, enforces even disparities within a metropolitan area.
7.3.1. Policy for Smart metropolitan development
Over the last years the term ‘smart’ has become a buzz-word in the discussion on processes of urban growth and urbanization. Predominantly the term ‘Smart City’ is used to describe a city with ‘smart’ technological progress indicating economic activities in the field of information and communication technologies (ICT). Furthermore, the production of new technologies and their implementation in specific production processes are regarded as very important for urban growth.
Since recently, ‘smart growth’ is discussed on three dimensions within the European Union:
Education, which encourages people to learn, study and update their skills.
Research/innovation, which creates new products, services and jobs.
Digital society, which uses ICT in the run of urban development.
Again, the link to technological issues is very obvious (European Commission, Europe 2020; cf. http://ec.europa.eu/europe2020/priorities/smart-growth/index_en.htm) and the spatial and policy imperative seems to be unmistakable: “To achieve smart growth Europe will need smart places” (European Commission, 2010, p. 31). In terms of competitiveness, smart places are defined as places, which attract people and firms because knowledge and innovation, strategies and territorial governance, networks and connectedness, are crucial characteristics. Smart cities as ‘smart places’ are competitive due to their realisation of assets, which derive from functional specialisation and connectedness. According to it, smartness strongly refers to connectedness. However, the concept does not go into detail regarding the different forms of polycentricity.
In the light of growing inter-urban competition, Giffinger et al. (2010, p. 304f) identified several fields within which the smartness of urban development is challenged. Accordingly smart cities are defined, ”with regard to their ability to come to terms with the challenge of increasing city competition in a knowledge-based economy. For that purpose the cities have to be described from a functional perspective by new indicators which go far beyond conventional location related factors. These indicators must not be confined solely to local facilities of endowment;

ESPON 2013 20
they also have to cover the activities of self-decisive and independent citizens in terms of awareness and participation of a city’s inhabitants in addressing new challenges. Accordingly, ‘smart’ implies in particular the implicit or explicit ambition of a city to improve its economic, social and environmental standards and consequently its competitiveness in urban competition.” This understanding does not exclusively concentrate on technological issues but emphasizes in particular the interplay of inhabitants, economic actors and policy and asks for governance approaches which have to cope with different challenges.
However, the definition of a ‘smart city’ in POLYCE will stay in line with what was defined in the project ‘European Smart Cities’ (www.smart-cities.eu) (Giffinger, et al., 2007), while the emphasis lies on different challenges. Facing technological innovation, socio-demographic processes and economic restructuring, a city needs to balance competitive and inclusive metropolitan development to be economically successful. In particular, this policy-related perspective allows to consider the complementary and sometimes even conflicting issues of competitiveness and social cohesion as basic elements of territorial cohesion with regard to metropolitan development driven by processes of metropolisation and polycentric development (see Fig. 5).
7.3.2. Understanding Smart Metropolitan Development
Fig. 5: Understanding Smart Metropolitan Development
Based on the abovementioned discussion of ‘smartness’ a smart metropolis is therefore understood as a functional and polycentric metropolitan area within which competitive and inclusive development takes place in a mutually influencing form which has to be steered by relevant governance approaches in a balancing way. Hence, a ‘smart’ city is now defined in the following way:
‘Smart metropolitan development’ indicates the ability of a metropolitan agglomeration to cope with the challenges of competitiveness and inclusive development which is based on its

ESPON 2013 21
territorial cohesion under the polycentric perspective. Besides, this ability is not related to local facilities of endowment as potentials only, but it also considers covering the activities of self-decisive and independent citizens in terms of awareness and participation of a city’s inhabitants in addressing and activating new potentials and supporting and strengthening existing assets.’
8. Polycentricity
8.1. Introduction: definitions and methodological approach
The aim of the analysis in WP2.1 is the assessment of polycentricity in urban systems of the CED-zone on three territorial scales:
Intra-metropolitan polycentricity
Polycentricity within the Central European - Danube global integration zone
Position of the CED-zone within Europe
The analysis is focused on capital cities, their surrounding functionally integrated areas and metropolitan regions as major growth poles and engines of regional development, while reflecting their position within national urban and regional structures.
Polycentricity in POLYCE is conceptualized as an important feature of urban systems, which are understood as functionally integrated socio-spatial entities (in ESPON POLYCE these are Functional Metropolitan Areas (FMA), Metropolitan Regions (MR) and Central European Danube Zone (CED zone)).
A functionally integrated urban system consists of multiple nodes (centers) with several possible internal spatial arrangements ranging from the dominance of one center over the rest of the system (monocentric) to plurality of centers of the same size and significance (Clark 2000; Kloosterman & Musterd 2001; Hall, Pain 2006).
Polycentricity has several mutually interlocked aspects, which operate together. They include:
morphological polycentricity: hierarchies and structure of nodes according to their size and significance (rank and size)
relational polycentricity: reciprocal and multidirectional flows and interactions between nodes (as opposed to unidirectional to single center)
relational polycentricity in governance: mutual interests, considerations, inspiration, collaboration, complementarity in decision making in the nodes and between nodes
In this approach, polycentric urban systems are functionally integrated socio-spatial entities which consist of multiple urban nodes that may differ in size. Yet, all play important roles in the system. They are linked with further governance strategies through intensive reciprocal and multidirectional relations that recognise, consider and support future enhancement of mutual stakeholder interests, complementarities, synergies and potentials for collaboration.
There are three key methodological questions for the analysis of polycentricity: territorial units of analysis, identification of centers and indicators of polycentricity. The basic territorial unit of analysis is metropolitan area. The project investigates intra-metropolitan polycentricity within metropolitan areas and inter-metropolitan

ESPON 2013 22
polycentricity between these areas within Central European - Danube Zone and in relation to wider European space.
For the study of polycentricity we use three types of delimitation of metropolitan areas (see Fig. 6):
Core City (CC) - capital cities in their administrative delimitation
Functional Metropolitan Area (FMA) - daily urban system at micro-regional level delimited as areas of intensive commuting to work
Metropolitan Region (MR) - wider economic mezzo-region reflecting the territorial networks of a city’s economy.
Fig. 6: Metropolitan Territory of the POLYCE Capital Cities
The intra-metropolitan polycentricity is assessed within Functional Metropolitan Areas (FMA) and Metropolitan Regions (MR), in both cases using municipalities that play a role of local and micro-regional centers: Job centers with local influence were identified within FMAs using a threshold of 1000 jobs. Within only MRs job centers with micro-regional influence (more than 3000 jobs) were covered in the analysis.
ESPON 2013 23
Polycentricity within the Central European-Danube global integration zone and position of the CED-zone within Europe is assessed based on the Core City (CC), Functional Metropolitan Areas (FMA) and/or Metropolitan Regions (MR) as the basic units of analysis.
8.2. Intra-metropolitan polycentricity: morphology and relations within the metropolises
Two approaches were used to measure the level of polycentricity in FMA and MR: morphological analysis and relational analysis. Both analyses work with the core city and centers identified within FMA and MR territories. Morphological polycentricity was analyzed evaluating rank-size distribution of centers. We used regression coefficient from the Zipf regression function describing the nature of rank-size distribution within FMA and MR as the indicator of morphological polycentricity.
Ljubljana shows the lowest and Praha the highest level of dominance in FMA. Core cities also dominate their metropolitan regions (MR), yet on a lower level than in the case of FMAs. Both, Bratislava and Ljubljana, have relatively high and similar levels of morphological polycentricity which substantially differ from the other three metropolitan regions. The latter are strongly monocentric, with the highest dominance of Wien in terms of population concentration to core city and Budapest in terms of job concentration to the core city. The regression coefficient from the Zipf regression function, i.e. the slope of regression function is strongly influenced by both the capital city dominance and the evenness or unevenness between other centers in FMA and MR. Comparing both measures of morphological polycentricity Budapest is characterized by the dominance of the core city and a relatively balanced distribution of smaller centers. This stand in contrast to the situation in Bratislava, where the core city has no prominent role, but the other job centers in MR show an uneven distribution.
Relational polycentricity was analyzed evaluating functional linkages between centers within FMAs and MRs. Analyzing the matrix of commuting-to-work flows between centers in FMA and MR, we distinguished between reciprocal and hierarchical component of each commuting flow. Reciprocal component is the sum of commuting fluctuation between the two centers. Hierarchical component is the remaining unidirectional flow. Three levels of reciprocity were distinguished for relations between job centers and visualized in maps of MR and FMA. Furthermore, the level of relational polycentricity in the whole FMAs and MRs of individual cities was calculated as the share of reciprocal flows (reciprocal component) on the total sum of flows between all centers within given territory.
There is a striking difference between Wien, with high levels of commuting reciprocity (approaching 60%) and thus functional or relational polycentricity, and other cities with reciprocal flows between centers in FMA and MR accounting for 30-40%. Only Praha FMA has the share of reciprocal flows over 40% in 2001, reflecting residential and job suburbanization that started in the second half of the 1990s. The situation around 2000 clearly demonstrate the difference between the more open and functionally integrated organic urban system of Wien metropolitan area and urban systems of metropolitan areas in former communist countries dominated by capital cities and their labor markets through unidirectional commuting to core city and hierarchical subordination of centers in metropolitan area to the core city. The aggregate view on all relations between job centers in MRs and FMAs clearly shows virtual non-existence of hierarchical unidirectional flows in Wien region, while they dominate regions of Praha, Budapest and Ljubljana. There are two types of reciprocal flows in metropolitan areas of post-socialist cities. First is reciprocal
ESPON 2013 24
commuting between the core city and new suburban job centers in FMA. Second is reciprocal commuting between job centers in MR and/or FMA.
Comparing measures and indicators of morphological and relational polycentricity, we can find that they do not correspond. For instance, metropolitan area of Wien is in morphologic terms highly dominated by Wien, yet the region shows high levels of functional relational polycentricity. On the other hand side, Ljubljana metropolitan area is much less dominated by the core city of Ljubljana itself. Therefore, we could say that this means high predispositions for functional polycentricity. However, the level of reciprocity and hence relational polycentricity is in Ljubljana region lowest among the investigated cities.
8.3. Polycentricity within the CED-zone and position of the CED-zone within Europe
The following chapter deals with the relational aspect of polycentricity on the meso and macro level, which means that it tries to provide an insight into the institutional and structural relations both between the five cities and with other cities outside the CED-zone. According to the definitions given in ESPON 1.1.1 institutional (or political) relations rely “on co-constructions, co-operation, and on the willingness of territorial agencies to work together on joint projects and strategies” (ESPON 2005, pp.46), whereas structural relations are constituted by the interactions between the actors, including transport, financial, migration or information flows. Due to the poor availability of relational data, it is not possible to cover all aspects of these two dimensions of relational polycentricity. The challenge, however, is to provide relevant data, which give some evidence on the relations between the five cities (meso level) and with the “rest of the world” (macro level). In this context the share of “internal” and “external” relations is of special interest. Since available data only cover a small part of relevant inter-city relations, the indicators given in the following sections should be treated as proxies, which provide a rough indication of relational polycentricity on the meso/macro level without considering all relevant aspects of this issue.
8.3.1. Infrastructure networks: Accessibility
Place matters for economic activities, even for the so-called footloose industries (e.g., Cairncross, 1998). From that point of view it is necessary to consider travel times as an important determining factor of actual flows and interactions between different cities. An overview on average travel times between the five cities proves the central location of Wien and Bratislava within the CED-region, which is expressed by the shortest travel time to the other partner cities. Additionally, the immediate vicinity of two “twin-cities” implicates very good accessibility with each other. Contrary, Praha and Ljubljana as the northern and southern outposts of the region are less connected to the other partner cities, which means much longer travel times (especially by train) to the partner cities. The distances between some of the five cities are short enough to allow one-day-trips for business meetings. Assuming a maximum travel time of three hours as the upper limit, one-day-trips between Wien, Budapest and Bratislava are possible both by car and by train, whereas all other relations require at least one overnight stay to have a meeting. For these trips air traffic plays an important role, there are daily connections from Wien (Wien Airport can be reached within less than one hour from Bratislava) and Budapest to the two other partner cities. The connection between Praha and Ljubljana is the only relation, for which car and train transport play a negligible role for short-term business trips.

ESPON 2013 25
The rail connections between the five cities are characterized by a highly different quality of rail infrastructure with a huge need to catch up in some areas. Most connections have a reasonable travel speed between 75 and 95 km/h, which is, however, still very low in relation to comparable polycentric regions in Western Europe. The worst situation can be detected for the city of Ljubljana, which seems to be totally cut off from high-speed rail networks. The travel time to all other cities shows average travel speed of about 60 km/h, for most connections passengers have to change trains two or even three times. Consequently, trips per train are much longer than by car, which makes trains totally uncompetitive. According to this indicator, the most competitive relations are from Wien to Praha, Budapest and Bratislava and between Praha and Bratislava. The connection frequencies between the five cities show an acceptable supply of train connections with at least 10 trains per day in both directions. The geographical proximity and historical ties are also reflected in stronger railway relations within the triangle Wien - Budapest - Bratislava: In the daytime there are about two train connections per hour from Wien to both Budapest and Bratislava.
The analysis of railway connections with other cities in Europe shows prevailing overall orientation of POLYCE cities to the MEGAs in the Pentagon, especially to Germany, Benelux, France, Northern Italy and Switzerland. Strikingly, the 5 POLYCE metropolises are among the 8 most important railway connection destinations. While 12% of all connections from Wien, Budapest and Bratislava are towards the other partner cities, Ljubljana accounts for mere 9% and Praha only for 5%. These results seem to be influenced by the proximity between the three cities and their more central position within Central Europe-Danube space. The analysis shows that Praha is least integrated within the CED-region with a stronger orientation towards Western Europe.
8.3.2. Ethnic and historic relations
Economic, social and institutional interaction does not happen in a vacuum, but is always embedded in an existing network of established relations and traditions. From that point of view the ethnic and historic relations between two cities (common history, culture, language, etc.) are a main influencing factor of any interaction. In order to consider the relevance of these conditions, which have often grown and developed over centuries, an indicator on relevant ties between cities has to be generated: The simplest way of defining an applicable indicator is to consider ethnic relations based on nationalities. This was done by collecting the number of inhabitants with the other country’s nationality and comparing it to the total number of foreigners. Due to the lack of available data on the city level this indicator could only be provided for the home countries of the five cities.
One of the main results of this analysis is Austria’s role as an immigration country. Contrary to the four partner states, Austria has become an attractive destination for migrants over the last 50 years. Consequently it is the only country with a remarkable share (10%) of foreign population, which can presumably be considered as an asset for establishing international networks and co-operations. The values in the 4 partner states are at the end of the European scale, which can easily be explained by the fact that they accessed the European Union only in 2004. The relatively high share in Slovenia can probably be attributed to non-EU foreigners from the former fellow states in the Balkans to a large extent. The value in the Czech Republic is caused by a large group of Slovakian inhabitants.
Although the number of Slovaks in the Czech Republic is more than ten times higher than the other way round, there is still a strong ethnic connection between Slovakia and the Czech Republic, which can easily be attributed to the fact that these two countries were united until the year 1992. Another remarkable ethnic relation, which
ESPON 2013 26
can be explained by historic ties, exists between Slovakia and Hungary. Nevertheless, migration between the five partner states seems to be rather weak, since the share of people from one of the other countries is extremely low. Apart from the special situation between the Czechs and the Slovaks, only Austria hosts a remarkable number of people from the neighboring states. The enhancement of common networks and co-operations will definitely increase these numbers as a sign of close social and economic interaction on the one hand, and be a good condition for the further deepening of mutual relations on the other.
8.3.3. FIRE Firm networks
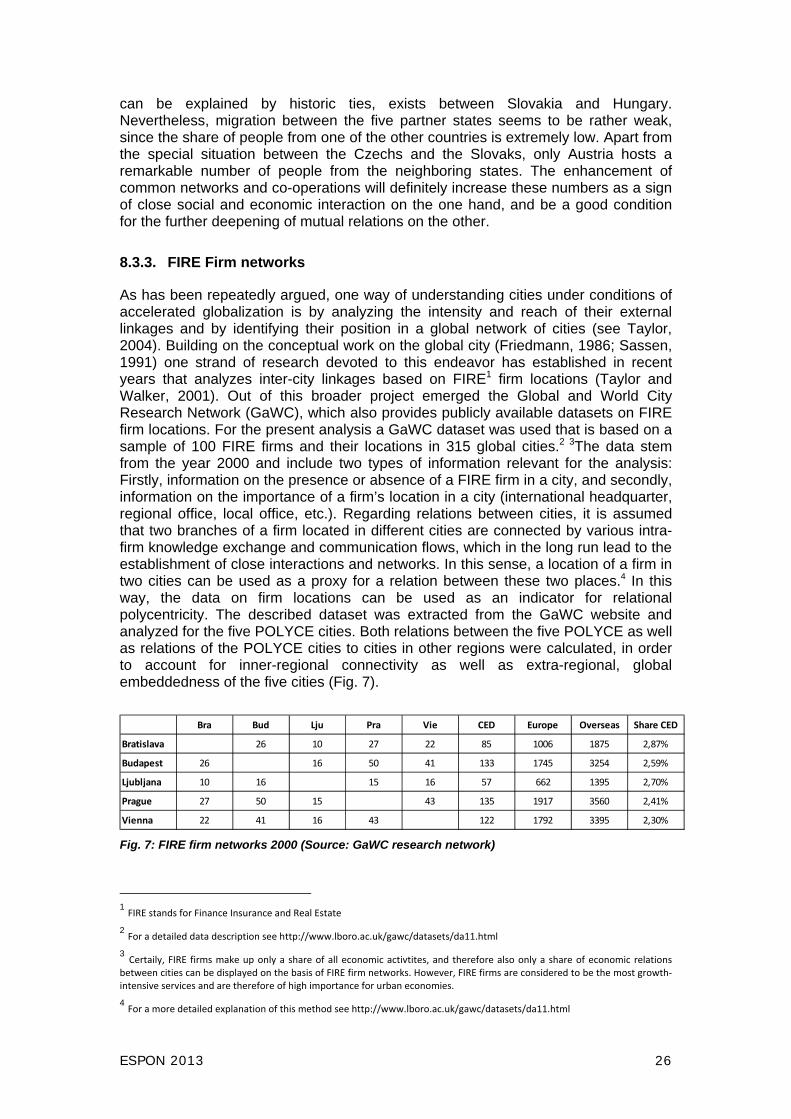
As has been repeatedly argued, one way of understanding cities under conditions of accelerated globalization is by analyzing the intensity and reach of their external linkages and by identifying their position in a global network of cities (see Taylor, 2004). Building on the conceptual work on the global city (Friedmann, 1986; Sassen, 1991) one strand of research devoted to this endeavor has established in recent years that analyzes inter-city linkages based on FIRE1 firm locations (Taylor and Walker, 2001). Out of this broader project emerged the Global and World City Research Network (GaWC), which also provides publicly available datasets on FIRE firm locations. For the present analysis a GaWC dataset was used that is based on a sample of 100 FIRE firms and their locations in 315 global cities.2 3The data stem from the year 2000 and include two types of information relevant for the analysis: Firstly, information on the presence or absence of a FIRE firm in a city, and secondly, information on the importance of a firm’s location in a city (international headquarter, regional office, local office, etc.). Regarding relations between cities, it is assumed that two branches of a firm located in different cities are connected by various intra-firm knowledge exchange and communication flows, which in the long run lead to the establishment of close interactions and networks. In this sense, a location of a firm in two cities can be used as a proxy for a relation between these two places.4 In this way, the data on firm locations can be used as an indicator for relational polycentricity. The described dataset was extracted from the GaWC website and analyzed for the five POLYCE cities. Both relations between the five POLYCE as well as relations of the POLYCE cities to cities in other regions were calculated, in order to account for inner-regional connectivity as well as extra-regional, global embeddedness of the five cities (Fig. 7).
Bra Bud Lju Pra Vie CED Europe Overseas Share CED
Bratislava 26 10 27 22 85 1006 1875 2,87%
Budapest 26 16 50 41 133 1745 3254 2,59%
Ljubljana 10 16 15 16 57 662 1395 2,70%
Prague 27 50 15 43 135 1917 3560 2,41%
Vienna 22 41 16 43 122 1792 3395 2,30% Fig. 7: FIRE firm networks 2000 (Source: GaWC research network)
1 FIRE stands for Finance Insurance and Real Estate
2 For a detailed data description see http://www.lboro.ac.uk/gawc/datasets/da11.html 3 Certaily, FIRE firms make up only a share of all economic activtites, and therefore also only a share of economic relations between cities can be displayed on the basis of FIRE firm networks. However, FIRE firms are considered to be the most growth‐intensive services and are therefore of high importance for urban economies. 4 For a more detailed explanation of this method see http://www.lboro.ac.uk/gawc/datasets/da11.html

ESPON 2013 27
Most importantly the analysis reveals that within the CED zone, Prague, Budapest and Vienna are much better connected through international FIRE firm networks than Bratislava and Ljubljana. Prague has the highest number of relations, closely followed by Budapest. Vienna ranks third. The two smaller cities in the region have much less relations than the three major capitals, indicating that they are not the first locational choice for FIRE firms. This pattern is replicated in the relations between the individual cities, with Budapest, Prague and Vienna having by far most relations with each other but much less with Ljubljana and Bratislava. Also when looking at extra-regional relations with all other European cities and with cities overseas Prague takes the lead and shows the highest embeddedness, followed by Vienna and Budapest. The importance of inner-regional relations within the CED zone for the five cities hardly differs (see column Share CED). However, especially Vienna and Prague are relatively less dependent on inner-regional relations, underlining their greater embeddedness in firm networks in Europe and overseas.
Since the GaWC data classify the firm locations according to their importance, it is also possible to provide an indication of hierarchies and dominances in these relations. For that purpose each firm which is situated in two of the five partner cities is assigned to the city with the higher-ranked location. The most significant result is the difference between the number of dominant relations (sum of the single columns) and the number of inferior relations (sum of the single rows). The results show that the two smaller capitals (Bratislava and Ljubljana) are predominantly dominated by other cities in these firm networks, which might be caused by their comparable small size and low functionality in global city competition. The positive differences between dominant and inferior relations in Wien, Budapest and Praha indicate that some important control functions are to be found in the three bigger cities. Especially Wien seems to cope successfully with its role as a central economic player in the region: A positive difference with all four partner cities proves that the city hosts higher-ranked firm locations than their opponents. This fact, which could be well expected for the relation to Bratislava and Ljubljana, is also true in a highly competitive situation with Budapest and Praha.
8.3.4. Research networks
Another way of measuring relations between cities is to look at co-operation of institutions in research projects. The CORDIS online database provides a useful information source for such an analysis. It includes data on EFP (EU Research Framework Programme) projects differentiated by participating institutions. Thus, the database makes possible to analyze research cooperation between institutions in different cities and thereby to determine the general degree of embeddedness of a city in research networks as well as, more specifically, to identify relations between cities based on these networks. For the present analysis data was extracted from the CORDIS online database and analyzed for the five POLYCE cities.
The total number of participations in EFP (EU Research Framework Programme) projects shows that especially Wien seems to be excellently integrated in European research networks. Compared with Budapest and Praha, which are both about the same size, Wien takes part in significantly more research projects than the two direct opponents, which might probably be attributed to established networks and co-operations with the Western EU member states. Surprisingly, Ljubljana is not far behind Praha but stays far ahead of Bratislava, although the city is much smaller in population and employment. In addition, the Slovenian capital is one of the few cities, which have increased their project participations from the first to the second half of the decennium, although the number of projects has been reduced due to bigger project sizes. The decline in Wien, Praha and Budapest does not indicate that these cities have been downgraded relatively, since the change rates are on European

ESPON 2013 28
average, whereas the numbers suggest that Bratislava has further deteriorated its position in European research networks.
The query of the CORDIS database on the internet does not allow to ask for the exact location but only for the nationality of the lead partner. The results clearly demonstrate the dominant role of Wien in EU-research projects: Even if the more dispersed spatial structure of scientific research in Austria is taken into consideration, a share of almost 30% of projects leaded by Austrian institutions suggests that the city of Wien (as the center of most research institutes) plays in central role in many scientific networks. In this respect Budapest with a share of 13% performs a bit better than the other three cities, where just below 10% of the projects are leaded by a domestic institute.
The second part of the CORDIS data analysis focused on the relations of the five partner cities in the research projects of the EFP. For that purpose, the number of projects, in which two of the five cities take part, was collected (Fig. 8).
total
no. share no. share no. share no. share no. share no.
Bratislava 148 29,50% 101 20,10% 123 24,50% 158 31,50% 502
Budapest 148 9,60% 198 12,90% 253 16,40% 351 22,80% 1539
Ljubljana 101 11,00% 198 21,50% 149 16,20% 232 25,20% 919
Prague 123 9,70% 253 19,90% 149 11,70% 244 19,20% 1271
Vienna 158 7,60% 351 16,80% 232 11,10% 244 11,70% 2088
Bratislava Budapest Ljubljana Prague Vienna
Fig. 8: Cooperation in EFP research projects 2001-2010 (Source: CORDIS online database)
The absolute numbers given in Fig. 8 point out that there are especially strong ties in scientific research between Wien and Budapest, which are both comparably less connected with Praha. The relative shares show that Bratislava, which is lagging behind in total FP participation, is highly dependent on research co-operations with the other partner cities, especially with Wien and Budapest. This result indicates that the Slovakian capital is less integrated in research networks with other European partners. Wien seems to be in a much more comfortable situation, because in spite of big number of project co-operations with the partner cities, the city is much more integrated in “external” research networks than the other cities, which is expressed by relatively low shares in the table.
8.3.5. Social networks
A simple way to get some indication on social relations between the five cities is the analysis of web searches on Google's web search service. Considering the mutual web searches between the five POLYCE cities, Wien is the most important node in the CED region and the main destination for searches from Ljubljana and Budapest. Wien distributes its attention to Praha, Bratislava and Budapest almost evenly. The relatively small number of incoming search connectivity in Ljubljana indicates its peripheral position within the region. Praha has stronger linkages to Wien than to Bratislava, which is, however, more strongly connected to Praha than to Wien.
In order to get some information on the integration of the five POLYCE cities in the European city network, searches from the five cities for European MEGAs were analyzed, too. Most of the attention to the five cities in total is paid from Slovakia/Bratislava (41%) and least from Wien (10%), which expresses the different relevance of the other cities in the CED region. Wien draws highest attention from the
ESPON 2013 29
five cities compared to all other European cities, it is searched more often than London, Paris and Barcelona with Praha, Bratislava, Budapest and Ljubljana following far behind.
8.3.6. Correlations and dependencies
Though all the indicators can only be considered and interpreted as proxies for relational polycentricity, it might be interesting to see whether they correlate in some way. In spite of the low number of cases, the results of a simple correlation analysis might indicate some interesting conclusions on interrelations and dependencies of these indicators. The first issue refers to the role of physical distance and ethnic ties for interaction, co-operation and networking. Even though the technological revolution in the telecommunication sector offers new opportunities for exchanging information and knowledge, the analysis slightly implies that both travel times between the 5 cities and ethnic ties between their home countries have a significant influence on firm and research networks.
Furthermore, the correlation between the extent of firm and research relations demonstrates that different kind of flows, networks and co-operations between cities cannot be separated but often go hand in hand with each other. Although the two proxy indicators only represent a very small part of intercity relations it can be assumed that all kinds of interactions are connected in some way and therefore stimulate and strengthen each other.
9. Metropolisation, polycentricity and urban size
9.1. Introduction
For centuries the fundamental questions “Why do cities exist?” and “What are the determinants of urban performance and size?” have been asked. Economists now enjoy a rich set of theories aiming at explaining the strikingly increasing concentration of people in urban areas.
This concentration of people and firms in large urban areas changes the form of the environment, and pushes most urban areas towards incorporating significant shares of the green space around them. However, such process of increasing concentration is simultaneously matched by a lasting validity of a hierarchical structure, with large cities cohabiting with smaller centers, much as predicted in classical location theories (Christaller, 1933; Lösch, 1954); stylized facts suggest that the urban system is slowly polarizing with the emergence of larger and larger urban agglomerations of skilled labor, characterized by a wealth of amenities, along with a process of stagnation of medium-small urban centers.
In this report we address simultaneously the fundamental questions above mentioned, and directly tackle the determinants of urban size, assuming that a higher urban competitiveness and productivity needs a wider labor market, while at the same time feeding a wider array of residential activities, thus allowing the overcoming of increasing costs associated to physical size (Camagni et al., 1986)
9.2. Traditional views on cities
Cities attracted only relatively recently the interest of economics. Most often, theories and models analyze the way cities work, how the land rent generates and is regulated by market forces, the effects of agglomeration economies on urban

ESPON 2013 30
performance, and so on. All such theories agree on the primacy of the object “city” in terms of the spatial organization of economic activities.
Cities are also complex to manage; this is probably why no proper “urban agglomeration” ever existed before the invention of agriculture (Bairoch, 1988).5 In this Section we offer a brief and critical overview of the wealth of theories aiming at explaining why cities exist in the first place, and which factors explain best their performance over time. For a comprehensive review of the rich set of theories being here summarized, the reader may resort on Nijkamp and Mills (1986), and Capello and Nijkamp (2004).
Apparently the main reason for the emergence of cities can be synthesized in the benefits stemming from agglomeration. As forces exist exerting centripetal and centrifugal forces on economic activities, some benefit has to prevail in the former, which has been variously declined over time:6
Localization economies, best known as “Marshallian economies” (Marshall, 1920), which can in turn be synthesized as encompassing:
o A thick labor market, with easier contacts between employers and potential employees;
o An industrial atmosphere, providing a fertile soil for the emergence of start-ups, and a better environment for their success;
o The possibility to share costly common production factors.
Economies related to the industrial structure of the city, and in particular: o Urbanization economies, i.e. reductions of production costs due to the
possibility of firms and individuals to share the costs of public intervention, to create a large common market, and to exploit the city as an incubator of production factors (Camagni, 1993);
o Diversity (Jacobian) economies, stating that agglomerations of people working in technologically different industries would be more creative;
Learning economies, or more precisely, localized knowledge spillovers, due to the decay process affecting what is traditionally known as “tacit knowledge (Polanyi, 1966; Bathelt et al., 2004)”. The crucial relevance of this last set of theories, in particular in a world where pure geography seems to matter less, is advocated in Capello (2010).
Moreover, structural views have been developed also on the way cities are organized internally as well as externally. Internally, cities based on market systems are regulated with the rent mechanism (whereas activities with a higher willingness to pay for a higher accessibility are assigned locations closer to the Central Business District). Internal traffic flows and external connections of a city have been successfully described with gravitational models (Zipf, 1949), while external relations of cities have been modeled with hierarchical theories (Christaller, 1933; Lösch, 1954).
This theoretical body has been matched by an equally impressive array of empirical estimates, mostly confirming the validity of these assumptions on the rationale for agglomerative behavior. However, more recently a new stream of studies has focused the attention of academics and policymakers on more subtle, yet insightful, reasons why people decide to agglomerate in the first place, and then which additional, other than pure hierarchical or gravitational, factors rule the urban system we live in. This second wave of studies is summarized in the next section.
5 This view has nevertheless been famously contested by Jacobs (1969), where the birth of cities is assumed to precede the invention of agriculture.
6 In this paragraph we follow the classification first proposed by Rosenthal and Strange (2004).
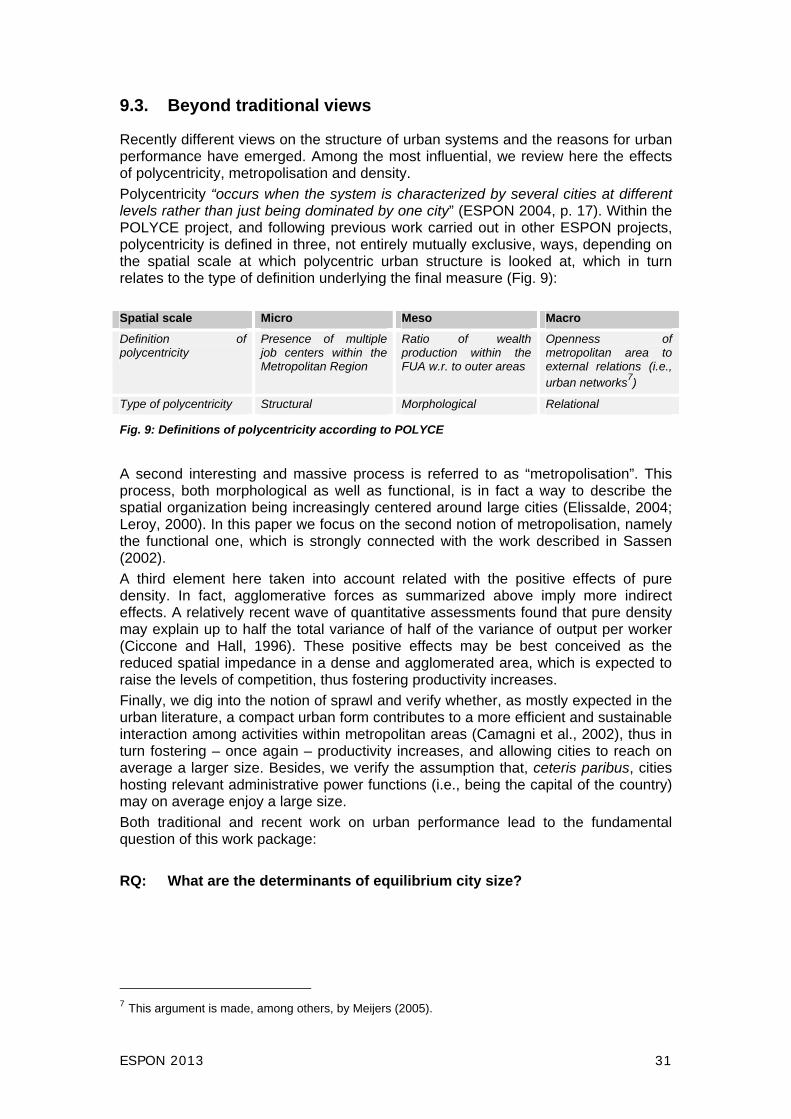
ESPON 2013 31
9.3. Beyond traditional views
Recently different views on the structure of urban systems and the reasons for urban performance have emerged. Among the most influential, we review here the effects of polycentricity, metropolisation and density.
Polycentricity “occurs when the system is characterized by several cities at different levels rather than just being dominated by one city” (ESPON 2004, p. 17). Within the POLYCE project, and following previous work carried out in other ESPON projects, polycentricity is defined in three, not entirely mutually exclusive, ways, depending on the spatial scale at which polycentric urban structure is looked at, which in turn relates to the type of definition underlying the final measure (Fig. 9):
Spatial scale Micro Meso Macro
Definition of polycentricity
Presence of multiple job centers within the Metropolitan Region
Ratio of wealth production within the FUA w.r. to outer areas
Openness of metropolitan area to external relations (i.e., urban networks7)
Type of polycentricity Structural Morphological Relational
Fig. 9: Definitions of polycentricity according to POLYCE
A second interesting and massive process is referred to as “metropolisation”. This process, both morphological as well as functional, is in fact a way to describe the spatial organization being increasingly centered around large cities (Elissalde, 2004; Leroy, 2000). In this paper we focus on the second notion of metropolisation, namely the functional one, which is strongly connected with the work described in Sassen (2002).
A third element here taken into account related with the positive effects of pure density. In fact, agglomerative forces as summarized above imply more indirect effects. A relatively recent wave of quantitative assessments found that pure density may explain up to half the total variance of half of the variance of output per worker (Ciccone and Hall, 1996). These positive effects may be best conceived as the reduced spatial impedance in a dense and agglomerated area, which is expected to raise the levels of competition, thus fostering productivity increases.
Finally, we dig into the notion of sprawl and verify whether, as mostly expected in the urban literature, a compact urban form contributes to a more efficient and sustainable interaction among activities within metropolitan areas (Camagni et al., 2002), thus in turn fostering – once again – productivity increases, and allowing cities to reach on average a larger size. Besides, we verify the assumption that, ceteris paribus, cities hosting relevant administrative power functions (i.e., being the capital of the country) may on average enjoy a large size.
Both traditional and recent work on urban performance lead to the fundamental question of this work package:
RQ: What are the determinants of equilibrium city size?
7 This argument is made, among others, by Meijers (2005).

ESPON 2013 32
9.4. The model
In order to answer the research question previously introduced, we set up a simple urban growth model which provides the framework for our empirical analyses. The model is rooted in the literature summarized in chapter 5 in Fujita (1989), and moves from the work in Camagni et al. 1986 and Capello and Camagni (2000). “Optimal”, or better “efficient” city size depends heavily on the internal productivity and competitiveness of the activities and functions encompassed by the single cities: an agglomeration of a few low-order activities may be supported by a limited number of inhabitants, while a cluster of advanced activities needs, and feeds, a wider urban population, overcoming the increasing urban costs with a superior productivity.
We start by assuming the following implicit urban cost and benefit functions:
, , ,C f size rent sprawl malaise (1.)
and
, , ,B f amenities humancapital diversity size (2.)
The choice of the arguments for the costs and benefits function is based on the literature summarized before. In particular, the literature usually finds a non-compact urban form to represent a cost for dwellers (e.g. Jacobs, 1961; with however a notable exception in Glaeser and Kahn, 2004), and equally identifies in a general distress effect the possible consequence from over-concentration of people in large urban areas. This last cost to agglomeration is here labeled as “malaise”.
On the benefit side, we include as arguments the quality of urban amenities (Carlino and Saiz, 2008), human capital (in line with the learning economies assumption previously summarized (Black and Henderson, 1999), and sectoral diversity (Jacobs, 1969).
Notice that in both equations we assume that urban size represents both a cost as well as a benefit for the city. Size is therefore a dual concept, representing a joint source of positive as well as negative externalities for city dwellers; this assumption is the key to solve the model and obtain an estimable function.
In order to get an estimable function assessing the relative importance of different urban size determinants, we assume full spatial equilibrium, so that marginal costs equal marginal benefits. This condition is represented in
Fig. 10.8
8 Details on the model derivation are described in the Scientific Report to the Interim Report.
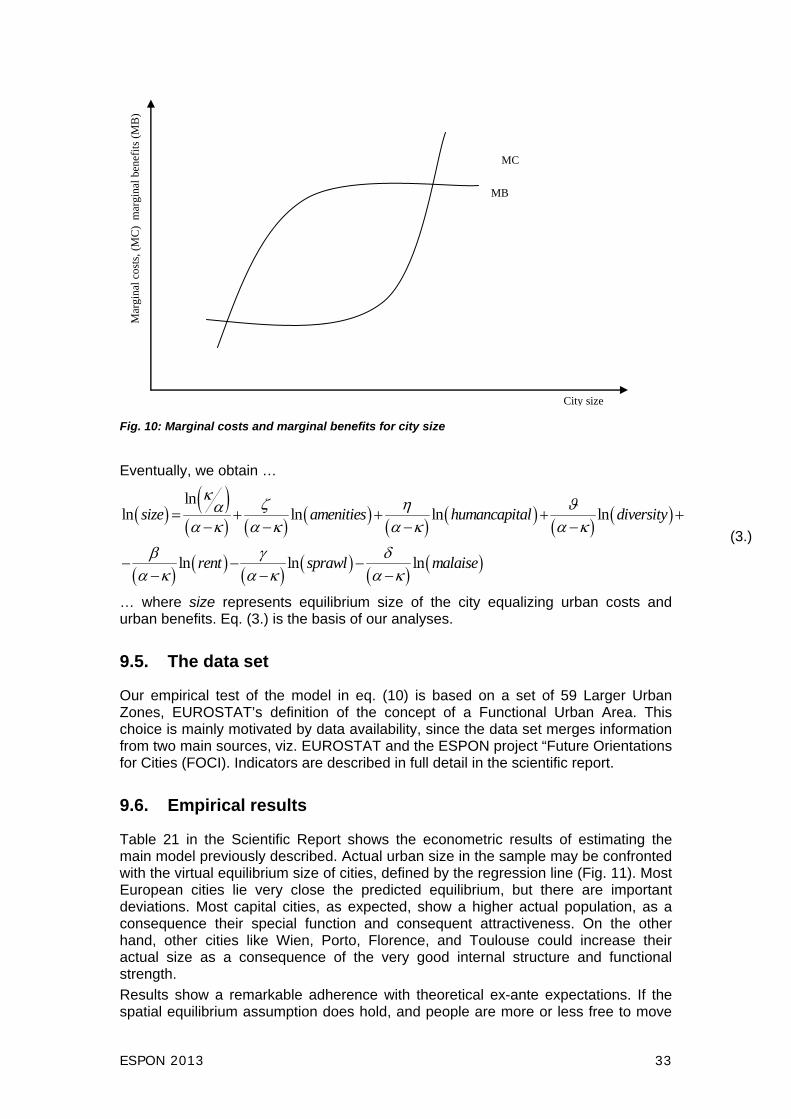
ESPON 2013 33
Mar
gina
l cos
ts, (
MC
) m
argi
nal b
enef
its (
MB
)
City size
MC
MB
Fig. 10: Marginal costs and marginal benefits for city size
Eventually, we obtain …
lnln ln ln ln
ln ln ln
size amenities humancapital diversity
rent sprawl malaise
(3.)
… where size represents equilibrium size of the city equalizing urban costs and urban benefits. Eq. (3.) is the basis of our analyses.
9.5. The data set
Our empirical test of the model in eq. (10) is based on a set of 59 Larger Urban Zones, EUROSTAT’s definition of the concept of a Functional Urban Area. This choice is mainly motivated by data availability, since the data set merges information from two main sources, viz. EUROSTAT and the ESPON project “Future Orientations for Cities (FOCI). Indicators are described in full detail in the scientific report.
9.6. Empirical results
Table 21 in the Scientific Report shows the econometric results of estimating the main model previously described. Actual urban size in the sample may be confronted with the virtual equilibrium size of cities, defined by the regression line (Fig. 11). Most European cities lie very close the predicted equilibrium, but there are important deviations. Most capital cities, as expected, show a higher actual population, as a consequence their special function and consequent attractiveness. On the other hand, other cities like Wien, Porto, Florence, and Toulouse could increase their actual size as a consequence of the very good internal structure and functional strength.
Results show a remarkable adherence with theoretical ex-ante expectations. If the spatial equilibrium assumption does hold, and people are more or less free to move
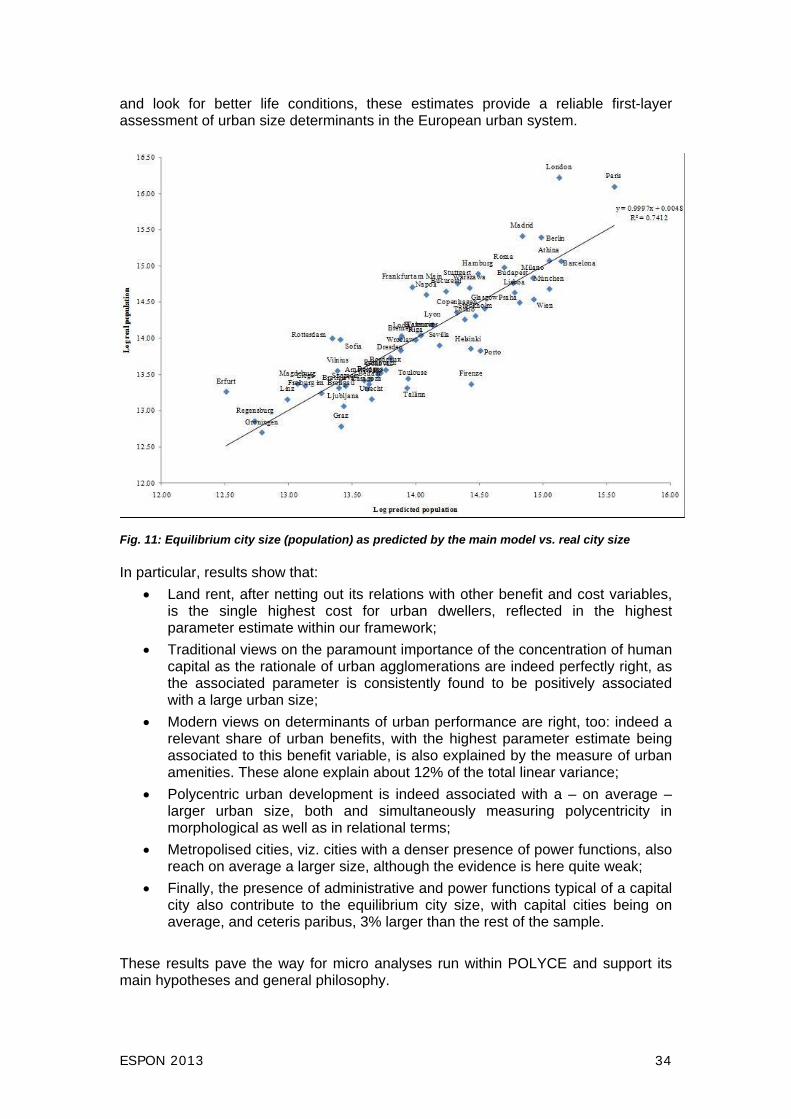
ESPON 2013 34
and look for better life conditions, these estimates provide a reliable first-layer assessment of urban size determinants in the European urban system.
In particular, results show that:
Land rent, after netting out its relations with other benefit and cost variables, is the single highest cost for urban dwellers, reflected in the highest parameter estimate within our framework;
Traditional views on the paramount importance of the concentration of human capital as the rationale of urban agglomerations are indeed perfectly right, as the associated parameter is consistently found to be positively associated with a large urban size;
Modern views on determinants of urban performance are right, too: indeed a relevant share of urban benefits, with the highest parameter estimate being associated to this benefit variable, is also explained by the measure of urban amenities. These alone explain about 12% of the total linear variance;
Polycentric urban development is indeed associated with a – on average – larger urban size, both and simultaneously measuring polycentricity in morphological as well as in relational terms;
Metropolised cities, viz. cities with a denser presence of power functions, also reach on average a larger size, although the evidence is here quite weak;
Finally, the presence of administrative and power functions typical of a capital city also contribute to the equilibrium city size, with capital cities being on average, and ceteris paribus, 3% larger than the rest of the sample.
These results pave the way for micro analyses run within POLYCE and support its main hypotheses and general philosophy.
Fig. 11: Equilibrium city size (population) as predicted by the main model vs. real city size
ESPON 2013 35
First of all, they confirm the relevance of a sound spatial structure of metropolises in the form of internal morphological polycentrism, external networking and reduction of sprawl. All these elements, linked to a sound urban planning, generate higher urban benefits and efficiency, while at the same time reducing the cost associated to physical size.
Secondly, developing urban quality, urban amenities, and a better human capital, is due to generate enhanced attractiveness and competitiveness, once again supporting a wider, more diversified, and urban realm. A potentially beneficial and virtuous cycle of urban development may be triggered along these lines.
9.7. Conclusions
Since the birth of the object city, urban agglomerations have been the loci of innovation, where human capital is attracted as is paid its highest return, and, as one famous saying goes, the place where people are truly free.9 Recent developments in the urban world, however, prompted the emergence of new trends for urban location. Not only does it pay off to accumulate human capital and locate where the returns associated to education are highest, but also, it becomes increasingly important to enjoy the more open atmosphere which characterizes modern urban agglomerations.
In this scientific report we review traditional and recent urban trends as sources of urban performance, framing them in a theoretical model which brings together the neoclassical and modern approaches to urban performance. This model is then tested on 59 Functional urban Areas within the EU27.
The evidence suggests that indeed modern paradigms explain much of current disparities in terms of urban performance (and in particular of city size). While rent, reflecting net of the urban benefits, still represents the single highest cost associated to urban size, cities now benefit not only from attracting highly educated professionals, and hosting a rich and diversified labor market, but also from pure amenities, which are found to be associated with a better urban performance.
Besides, results clearly and consistently show that being connected to a network (in this case, of scientific relations), i.e., being relationally polycentric, also fosters urban performance. Less clear, although still positive, is the effect of a metropolised urban system on overall city performance. However, this concept may actually offer a blurred image, being in part overlapping with the professional definition of human capital previously mentioned.
Planning matters, when smartly integrated with a sound urban economic strategy.
10. Positioning of European Metropolises: Urban Profiles
The key objective of WP2.3 is to identify the similarities and differences between the five POLYCE capital cities and other metropolises in (Central) Europe. This differentiation is assumed to be an outcome of metropolisation based on the specialization in metropolitan functions (Krätke, 2007; Friedman, 2002).
WP 2.3 has two objectives in analyzing the profiles of European and POLYCE metropolises:
9 Stadtluft macht frei
ESPON 2013 36
A group of European cities (MEGA) including the five POLYCE metropolises are described by a set of key development characteristics which are as follows: Economy, People, Mobility & ICT, Environment, Living.
Additional factors regarding the characteristics of polycentricity (with input from WP2.1, WP. 2.2 and WP 2.4 and other ESPON projects) will provide a more specific analysis of the territorial capital of five POLYCE metropolises
The metropolitan profiles will be defined by a set of characteristics describing specific fields of metropolitan development. They are composed of 25 factors describing metropolitan development in a multidimensional and hierarchical way. Empirically each factor is defined through a set of indicators describing specific properties of distinct fields of development characteristics as they are assumed to be relevant for the process of metropolisation.
In a hierarchical approach a corresponding method - already applied in the ‘European Smart-City project’ (see Giffinger et al., 2007) will be implemented. This will allow for the identification of metropolitan profiles derived from indicators, factors and key development characteristics.
On the basis of a distinct group of European metropolises this hierarchical approach is applied so that each metropolis becomes object of comparison and benchmarking within the European urban system. The selection of metropolises is based on former ESPON results. According to ESPON 1.1.1 (2005) project about 1595 FUAs (Functional Urban Areas) with more than 20,000 inhabitants have been identified in Europe. MEGAs (Metropolitan European Growth Area) correspond to FUAs with the highest average score with regard to Population, Transport, Manufacturing, Knowledge and Decision Making. About 76 MEGAs have been identified in Europe divided into 5 categories, including a specific category for the two global nodes of London and Paris.10 Wien is ranked as 3rd,, Praha, Budapest and Bratislava as 4th, Ljubljana is ranked as 5th MEGA. Hence, the five POLYCE capital cities are part of this description.
10.1. Methodology: steps for selection of cities and relevant indicators
In order to operationalize objective 1 the following steps must be realized:
Selection of MEGA (ESPON 1.1.1): 76 MEGA in Europe including all 27 EU member states as well as Norway and Switzerland (but excluding Iceland and Liechtenstein);
Selection of MEGA that are also covered with Urban Audit (UA) database for the Core City (CC) and Larger Urban Zone (LUZ) and approximation of LUZ to NUTS 3 and NUTS 2 level as defined by the ESPON FOCI project;
Exclusion of MEGA 1st class: London and Paris as well as The Hague (not defined as MEGA) and some MEGA 5th class: Bilbao (Spain), Le Havre (France), Turku (Finland), Southampton (UK) and Cork (Ireland) that are not included in FOCI LUZ list with approximation to NUTS 3 and NUTS 2 levels. Therefore 69 MEGA were selected for data collection (including 25 capital cities). This is the e.g. WP 2.3 “Master (or MEGA) Data File”.
Data collection are implemented primarily for LUZ (according to UA definitions and database coverage for 1999-2008) as proxy to MEGA, as well as LUZ
10 FUA (Functional Urban Areas) were defined as for: (i) countries with more than 10 million inhabitants, a FUA is defined as having an urban core of at least 15,000 inhabitants and over 50,000 in total population; (ii) for smaller countries, a FUA should have an urban core of at least 15,000 inhabitants and more than 0.5% of the national population, as well as having functions of national or regional importance
ESPON 2013 37
approximation to NUTS 3 and NUTS 2 level from the FOCI database, FUA/MEGA data (from several ESPON projects), NUTS 2 level data (as proxy to LUZ) collected directly from the EUROSTAT or by ESPON ATTREG TPG, or data for LUZ or CC collected directly from UA (i.e. if data are not included in FOCI database);
After collecting data for 169 indicators only those cities with more than 80% data coverage as well as indicators where data for all five POLYCE cities could be found will be selected for the elaboration of city profiles.
A hierarchical analysis will be implemented, grouping indicators under factors and key development characteristics in order to receive comparable results between factors and characteristics in each city.
In order to operationalize objective 2 additional steps must be realized:
POLYCE WP 2.3 Master (MEGA) Data File will be also utilized for an enhanced descriptive statistical and benchmarking analysis of five POLYCE metropolis (CC, LUZ, LUZ approximation to NUTS 3 or NUTS 2 level, spatial level of MEGAs) vis-à-vis other 64 MEGA (e.g. capital cities, EU 12 /15 vs. new EU members states, Pentagon vs. other macro-regions (e.g. Central and Eastern Europe, Danube region), etc.; WP 2.3 Master (MEGA) Data File represent the state-of- the-art or the level of metropolisation of 69 MEGA between 1998-2008.
10.2. Data Sources and Indicators Formation
All indicators and data which are used for analysis and ranking of POLYCE metropolis and other MEGA cities (objective I) are obtained from the publicly available databases: UA (CC, LUZ), EUROSTAT (NUTS 3, NUTS 2), ESPON 2006 - 2013 DB and data sources developing within new ESPON 2013 projects: FOCI, ATTREG, INTERCO, etc. The majority of all indicators in WP 2.3 Master (MEGA) Data File are defined on the local level (LUZ, CC). Others which are derived from data on the NUTS 3 and NUTS 2 level are included because they provide additional information not only about the endowment of MEGA and POLYCE metropolises but also about the perception and assessment of specific policy developments before year 2008. POLYCE Master (MEGA) Data File was developed for 69 MEGA metropolises including five POLYCE metropolises. Data was collected for approximately 160 indicators grouped in a bundle of approximately 30 factors and five key development characteristics as relevant policy areas.
For the enhanced benchmarking analysis (objective II) Master (MEGA) Data File is complemented with data file of five POLYCE metropolises (CC and LUZ) covered by UA database for five periods from 1989-1993, 1994-1998, 1999-2002, 2003-2006, and 2007-2010. If possible missing data are to be completed by POLYCE TPG from WP2.1 and WP2.2, or local/national statistical data sources for 1998-2010 periods), or estimates based on expert evaluation of trends in POLYCE metropolis Other sources - FOCI, ATTREG, INTERCO analysis (as well as other ESPON projects) will be used. Based on these results five POLYCE metropolitan profiles in Central Europe will be developed based on territorial capital assets as necessary input for policy recommendations and further governance and stakeholders actions.

ESPON 2013 38
10.3. Key development characteristics
10.3.1. ECONOMY
Economic factors relates to the performance of the economy assessing the competitiveness of MEGA and POLYCE metropolis as important attributes of metropolisation of European larger cities covering the period between 1995-2008. Most indicators are showing the situation before year 2008 i.e. economic and financial crisis in Europe. Since than many MEGA and POLYCE metropolises are under different impacts of these changes on economic endowments which will have to be evaluated by POLYCE project partners and stakeholders.
10.3.2. PEOPLE
Social and Human factors capture the characteristics of the people living within selected MEGA and POLYCE metropolis assessing the social and human capital competitiveness as well as inclusion attributes as important factors of European metropolisation. Human capital endowments are classically related to social cohesion policy interventions such as the provision of education programmes and active labor market programmes, including the integration of foreigners, and disadvantages social groups.
10.3.3. MOBILITY AND ICT
Mobility and ICT factors relates to the nature of infrastructure and the facilities that frame the intra-urban and inter-urban accessibility of MEGA and POLYCE metropolises. The nature of infrastructure provision is open to multi-level policy action (i.e. investments in transport infrastructure). The other dimensions of accessibility and access are their role in endogenous development, since they permit to every territory, whatever its territorial capital, to increase its development (particularly thanks to ICT) and to participate to global competitiveness. Accessibility and infrastructures of all types are crucial for competitiveness and cohesion since they should contribute to the reduction of disparities. Accessibility and social inclusion is about quality of life and participation of every MEGA and other territories to a balanced and sustainable development with reduction of poverty and access to basic services, jobs and market.
10.3.4. ENVIRONMENT
Environmental factors relates to the quality of the built environment, attractivity of natural conditions, (low) pollution levels, sustainable resource management and environmental protection of MEGA and POLYCE metropolis. Environmental endowments determine an advantage of some places with interesting spatial differences regarding some factors and indicators. Environmental endowments are related to different multi-level policy interventions such as land use, the provision of water supply, sewage and waste management infrastructure, provision of green and open spaces, and anti-pollution measures. Environmental endowments encompass three dimensions: risks, resources and quality of life. Climate change is a global challenge which must be tackled at all scales and it represents a multi-dimensional risk in future, since its impacts are numerous and asymmetric. Finally, better quality of life in a preserved natural patrimony will ensure attractiveness of MEGA and Europe as a smart and sustainable place.

ESPON 2013 39
10.3.5. LIVING
Living or quality of life factors measure the provision of public services/investment in selected MEGA and POLYCE metropolis as well as the degree of satisfaction of residents with public services and the city itself. These factors and indicators can be taken as proxies for good governance and frame the likely capacity of place-based institutions to maintain quality of life in European cities. Quality of living endowments are related to different national/local policy interventions such as provision of housing, urban services, anti-crime measures, or provision tourist attraction services for smart, inclusive and sustainable European cities and regions.
ECONOMY
(Competitiveness)
PEOPLE
(Social and Human Capital)
Productivity
Entrepreneurship
Innovative spirit
Flexibility of labor market
Investments
International embeddedness
Structural disparities
Demography
Level of qualification
Affinity to life-long learning
Ethnic plurality
Social cohesion
MOBILITY
(Transport and ICT)
ENVIRONMENT
(Natural resources)
Public transport
Commuting
(Inter-)national accessibility
Availability of ICT-infrastructure
Sustainable land use
Attractivity of natural conditions
Pollution
Sustainable resource management
Environmental protection
Individual assessment of urban environmental quality
LIVING
(Quality of life)
GOVERNANCE
(Participation)
Cultural facilities
Health facilities
Housing quality
Education facilities
Individual safety
Touristic attractivity
Individual assessments of the quality of urban services delivery
Participation in decision-making
Transparent governance
Municipal budget
Not enough data from publicly available data sources for selected MEGAs. To be completed by POLYCE TPG assessments for 5 POLYCE metropolises and information from WP2.4 and WP2.5.
Fig. 12: Factors and indicators describing key development characteristics (key policy areas)

ESPON 2013 40
11. Perceptions, assessments and perspectives
This chapter briefly summarizes the current state of WP2.4. It starts with a short description of the main objectives of the work package before briefly discussing the applied methods. Section 11.3 presents the preliminary results of the analysis. A more detailed discussion of the methodological approach can be found in the scientific report.
11.1. Objectives
WP2.4 focuses on the perceived spatial characteristics of the five cities with regard to environmental, economic, social and institutional aspects. The main goal of this WP is a qualitative evaluation of the strengths, weaknesses, potentials, assets and challenges of the examined core cities and their metropolitan regions. The results are meant to complement the quantitative assessment of spatial characteristics obtained in other WP, mainly WP2.3. Hence, the main focus lies on the interplay of objectively described and individually perceived characteristics. Methods and tools used in this WP are developed in close coordination with other WPs. The results will provide additional context for the interpretation of data gathered in other WPs.
The three main objectives of WP2.4 are:
Identification of most relevant potentials, factors and assets of the five cities on the micro, meso and on the macro level. These potentials, factors and assets of the examined five core cities and their metropolitan regions will be discussed from an analytical and a strategic point of view in comparison of the five metropolises.
Widening the perception of important assets and potentials among the stakeholders
Assessment of assets for future positioning of the five cities as metropolises on the macro level
Main tasks within WP2.4 are the following:
to prepare and implement a methodological framework for the analysis
to conduct a participative assessment of perceived strengths, weaknesses, potentials, assets and challenges for each city
to compare major strengths and weaknesses of each city
to analyze and compare the profiles of the five cities at the local and regional level
to detect relevant synergy effects of the five cities and their cooperative efforts
11.2. Methodology
Three methods are applied in WP2.4: a survey among stakeholders in the five POLYCE cities, a document analysis, and the holding of five local city conferences with stakeholders. All methods will be briefly described below.
11.2.1. Stakeholder survey
The survey aims at identifying and assessing the perceived spatial characteristics of the cities among a set of relevant stakeholders (10 – 15 per city). The respondents are sampled based on their function so as to get answers from stakeholders coming

ESPON 2013 41
from different perspectives (see below). The central aim of the survey is therefore not to reveal an “objectified” truth by maximizing the number of respondents but rather to get an insight into the perception of spatial characteristics of leading personalities and opinion-makers with different backgrounds. In the interpretation, particular focus is put on the divergence or convergence in the responses in order to identify possible points of disagreement. Importantly, the questionnaire only allows for a general identification of stakeholder perceptions, and it is not possible to further discuss the meaning of terms that are raised during the survey with the participants. Nevertheless, the questionnaires allows for a first insight into the perception of urban development in the five cities. Relatedly, it has to be kept in mind that the meaning of terms is contextually defined, and similar terms will mean different things to stakeholders in different cities. Comparisons of the responses between cities should therefore only be made with caution.
Content
The content of the questionnaire can be divided into three parts:
Part 1
The first part deals with the recent development of the city in economic, social, environmental and infrastructural terms, as well as with the overall profile of the city (performance of city, image, social climate, past achievements and failures). It integrates both the items which are perceived more subjectively and even emotionally (image of the city, social environment) and the items assessed more rationally (overall development and performance of the city in the delimited dimensions). The first 5 questions delimit the framework for general subjective evaluation of a city’s particular achievements and setbacks, with the opportunity to describe its individual subjective connotations creating unique identity.
Part 2
The second part deals with the future perspectives of the city. Future potentials are identified against the background of existing strengths and weaknesses. The emphasis is placed on the issues that might be actively shaped and influenced by the city itself. This part of the questionnaire is rather analytical and more in-depth oriented. Questions used in this part require a certain degree of knowledge and expertise in the field of urban and regional development of the particular city and its metropolitan region. Next to asking about the most significant strengths and weaknesses, also the most important and most challenging/controversial actions within city´s territory are relevant here. The implications of those events/projects on the positioning of the city are the last item of this part. A fine-grained evaluation of past and current activities is indirectly revealing the attitudes of the respondents (whether they tend to prefer more social oriented, environmental friendly solutions or they appraise rather neoliberal, progressive, business driven actions etc.).
Part 3
The third part of the questionnaire deals with the cooperative initiatives and factors that are important for an inclusive metropolitan development (factors important for cooperative effort, fields of cooperation, partnerships, strategic recommendations etc.). This section of the questionnaire is focused on measuring the attitudes (what are the preconditions for effective cooperation) and the reflection of satisfaction with the current state in this field (degree of satisfaction related to factors conditioning the

ESPON 2013 42
effective cooperation in respective city). Further questions are investigating the importance of particular fields of metropolitan development with regard to cooperation, attractiveness of the city as a partner, potential future partners for cooperation and strategic recommendations for the future. The last item of the questionnaire is set up as an open question, giving the respondents the opportunity to raise previously unmentioned aspects. These impulses might be further discussed and evaluated at the local city conferences in each respective city.
Selection of respondents
The respondents are the leading personalities and opinion-makers related to the particular city (stakeholders). To ensure consistency among the results in the five cities the following categories are used to sample the respondents:
Field of activity
1. politician
2. planner from capital city (public)
3. chamber of commerce
4. media (daily newspaper)
5. economic developing agency
6. academic (reg. planning)
7. project manager (city council)
8. representative international enterprise (private)
9. representative international organization (public, semi-public)
10. cultural (event organization)
11. tourist agency
12. representative / city in Metropolitan region
13. representative / city in Metropolitan region
14. NGO
15. private planner
The following section presents a short summary of the main findings of the survey for each POLYCE city. For sake of space only the most important results are summarized here. A more detailed interpretation can be found in the scientific report.
11.3. Main results of stakeholder survey
11.3.1. Bratislava
1. Recent urban development trends and city profile
The city of Bratislava is predominantly considered as center of research and education, dynamic, growing city, historical city and center of finance and business. Despite high frequency of perception of Bratislava as center of research and education, the city was never mentioned as city of innovation and similarly, despite an industrial past, the city was never mentioned as industrial city. According to the respondents, Bratislava is predominately perceived as an expensive and prospective city. Social climate in Bratislava is regarded to be indifferent, competitive, split apart and snobbish. Regarding overall development over the last 5 years, Bratislava is
ESPON 2013 43
predominantly considered as business location with high attractivity and high competitiveness. Environmental, infrastructural and institutional dimensions were confronted with considerable criticism. Among the most positive events/activities, the cross-border cooperation and common activities with neighbors, various transport infrastructure projects and project Eurovea are the most significant ones. The negative projects/events/activities are represented mainly by the River Park project, various non-favorable activities within public spaces and several new flagship building projects externalized after 2000. There is relatively high degree of concordance among the respondents regarding positive/negative projects/activities in Bratislava.
2. Perspectives for future development
Strengths of the city of Bratislava lie in the field of geographical position, international connections (Wien, Budapest, Praha), culture and history, qualified human resources and workforce and low unemployment rate. On the other hand, city marketing, city services, greenery, corruption, bureaucracy, passivity and lack of strategic conception and multiculturality are considered to be weak points. Most promising / most challenging projects or activities for future development include the highway bypass, Eurovea, transit of transport, airport reconstruction (new terminal), new sporting facilities, train corridor TENT, tramway to Petržalka, 4th quadrant and renewal of Danube delta and some reconstruction of industrial architectural heritage. On the other hand, especially the River Park project, the new oil pipeline (Žitný ostrov) and new administrative buildings as well as estate developments in general are perceived to be controversial activities.
3. Realization of inclusive metropolitan development
Legal stability and transparency in decision making are the most relevant preconditions for cooperation in general. Neither social security nor environmental awareness are the priorities with this regard. If we analyze the importance of the selected fields with regard to the situation in Bratislava, the most important factors are legal stability, political stability, transparency in decision making, proactive behavior of citizens and open-mindedness of society. Social security and participation tradition were left behind. Cooperation on the level of metropolitan region should concentrate on the coordination of spatial development, improving the transport infrastructure, and tourism and services. Existing cooperation with other cities concentrates on Wien but other cities were also mentioned (Praha, Brno, Budapest). Bratislava is clearly considered to be an attractive partner for cooperation, especially because of its favorable geographic position, considerable economic strength and pursue power and chances to serve as a gateway to Slovakia and Eastern Europe. Strategic recommendations for future metropolitan development are related to more public investments (sport, greenery, leisure time..), better spatial planning and knowledge based management, services and culture, transport issues, greenery and public spaces, advancing sustainability and a knowledge-based city and the improvement of positioning and of the city’s image. Bratislava is considered to be an attractive city with a lot of potential both for cooperation as well as for international competition. Though, this potential is sometimes wasted and mismanaged.
11.3.2. Budapest
1. Recent urban development trends and city profile

ESPON 2013 44
Budapest is considered to be a historic and attractive city. However, the respondents assessed Budapest as a city with split apart, competitive society. Transportation was considered to be the most important issue: it was often mentioned both among the positive and negative aspects. In some cases the respondents did not agree in their assessment – e.g. in the case of shopping malls or some new real estate developments. It is worth mentioning that the respondents mentioned significantly less negative aspects than positive ones.
2. Perspectives for future development
While the strengths of Budapest are related more to its location and natural characteristics and cultural richness, its weaknesses are related to the unclear roles in the management of the city, the lack of cooperation among stakeholders, and the severe inequalities within the society. There is a strong feeling that Budapest used to be a better place to live and to invest money in the past.
The most promising/important projects are strongly related to the improvement of transportation (Budapest Airport, underground line Metro4, completion of the M0 ring road, developing intermodal transportation hubs, integrated transport development in the metropolitan region, improving Park and Ride systems) and the renewal of public spaces, and improving the cultural facilities in the city.
There are some controversial issues in connection with the transport development projects as well (e.g. delay in completion of M0, Metro4, public transportation connection to the Airport). The land use of the city (greenfield, brownfield, World Heritage territory) is not based on a clear strategy.
3. Realization of inclusive metropolitan development
The transparency in decision-making, leadership and decision-making qualities and legitimacy of political-administrative system were regarded to be the most important preconditions for cooperation. Environmental awareness, pro-active behavior of citizens and open-mindedness of society are slightly less important.
Cooperation on the level of metropolitan region should concentrate on defining (and coordinating) spatial and regional development, the development of transportation both in the city and in the functional metropolitan area.
The majority of interviewees regarded Budapest as an attractive partner for cooperation because the city is open-minded, well equipped for any kind of economic activity and provides high quality services and in most cases is reliable. On the other hand, some of the experts think that Budapest is bureaucratic, badly organized, non-transparent, unaccountable, slow, inflexible and unreliable therefore in need to redefine itself. According to the recommendations of the interviewees Budapest should focus on its marketing/branding, develop its transportation, establish more clear roles in the management of the city, pay more attention to the maintenance of public spaces and create new relationships with other countries/regions and cities.
11.3.3. Ljubljana
1. Recent urban development trends and city profile
The results indicate that the dominant perception of the Ljubljana is related to its historical heritage and recent economic development, as well as its role as tourist destination. It performs well economically, particularly as highly attractive business location but conversely struggles with low levels of social integration and social mobility.
There is relatively high degree of concordance among the opinions of respondents regarding positive/negative projects/events/activities in Ljubljana. That means that there were only few exceptional issues which were being perceived both negatively

ESPON 2013 45
and positively (e.g. new spatial plan of Ljubljana municipality and Sports park Stožice).
2. Perspectives for future development
Strengths of Ljubljana are to be found in its geographical location, its cultural and historical heritage and the related high attractiveness for tourism and economic activities, while poorly organized public transport and ineffective land use represent the city’s greatest weaknesses.
Respondent do see promising perspectives mainly in transport and infrastructure projects, especially in improvement of public transport. Potential is seen also to exist in restoring old buildings and pushing forward the renewal of brownfields areas. There is, however, a high degree of heterogeneity within the sample of answers.
3. Realization of inclusive metropolitan development
Ljubljana is seen as attractive partner for cooperation that has a great deal of potential, which is however sometimes threatened by administrative mismanagement. Cooperation with other cities should be focused on transport issues and connectivity, social issues, Erasmus program for students’ exchange, cooperation in the field of cultural heritage, tourism, environmental problems and good practice exchanges.
11.3.4. Praha
1. Recent urban development trends and city profile
The perception of Praha is related to its historical heritage, tourism and economic performance. At the same time Praha is not considered to be very dynamic or innovative. The city is predominantly perceived as attractive, unique and prospective, but also expensive.
It is clear from the survey that the institutional dimension is the weakest part of Praha´s overall development over the last 5 years. Economic, societal, environmental and infrastructural dimensions are evaluated with high polarity of opinions, even though economic dimension is clearly Praha’s strongest element.
Projects that positively influenced urban development in recent years are related to transportation, new building projects and reconstructions and cultural and social events. The negative activities also concern transportation projects, as well as building and development policies, PR and the marketing of the city.
2. Perspectives for future development
According to our respondents, strengths of the city lie in its geographical position, its economic performance, its social climate and the organization of transport. In contrast, public administration and unsustainable land use are the city’s greatest weaknesses. More generally, strengths of Praha can be found rather in relation to the current state and existing potentials, while weaknesses are related mainly to the management of the city (politics, strategies).
3. Realization of inclusive metropolitan development
The difference in importance between the preconditions for cooperation in general and particularly in Praha is not significant. In both cases transparency in decision making is considered the most relevant precondition for cooperation, legal stability and political stability follow. The lowest priority was given to former experience with cooperation and social security.

ESPON 2013 46
According to the respondents, cooperation on the level of the metropolitan region should concentrate on infrastructure, especially transport and energy security, coordination of spatial development, tourism, security and other issues. Cooperation with other cities should focus on know-how transfer in various areas such as promotion of cycling, citizen participation, legislation modifications, tourism and transport connectivity. There is no general knowledge about cooperation of Praha and other cities (at all levels) with the exception of the city planner respondent. This indicates that cooperation of Praha with other cities is considered scarce or with low impact. The Central Bohemia Region as a whole was mentioned as a potential partner for Praha, as well as individual towns for more specific issues.
Praha is by respondents from multiple backgrounds considered to be an attractive partner for cooperation, but with many reservations. It is believed that if Praha “wants, it certainly has something to offer”. There are doubts, however, about its genuine interest to cooperate. Potential future partners within the metropolitan region were all municipalities and cities located within 10 to 15 km from the border of Praha. As further potential partners Brno, Pilsen and cities in Austria, Hungary, Slovakia, Poland, Germany as well as Lyon, Copenhagen, Amsterdam, Helsinki were mentioned.
In the view of the respondents, the most crucial strategic recommendations for future metropolitan development are to develop an urban-planning vision for the city, as well as a clear development strategy and a high-quality masterplan; to promote participation of citizens in planning and implementation of sustainable development; to effectively cooperate with the Central Bohemia Region; to promote research and innovation and to foster the use of public transport.
11.3.5. Wien
1. Recent urban development trends and city profile
Stakeholders from multiple backgrounds perceive Vienna as “historical city” and “center of tourism”. At the same time, the city is hardly seen as a “center of finance and business” or “center of innovation”. Furthermore, Wien is considered to be an attractive, unique and safe place with a supportive, friendly and cooperative social climate by the stakeholders surveyed. There is strong disagreement however whether the city is affordable or expensive. According to the respondents the city shows high performance in the provision of infrastructure, economic development and environmental quality but is considered weak on aspects of social integration and open-mindedness. However, stakeholders are heavily polarized in their opinion on this latter point. Projects or activities that positively influenced urban development in recent years are the improvement of public transport, the start of the Main Station Project and the Seestadt Aspern. Negatively perceived are the loss of public spaces in parts of the city, the failure of several large urban development projects and the lack of programs to ensure ongoing spatial integration of different groups in the city.
2. Perspectives for future development
According to the stakeholders strengths of Wien lie in the fields of life quality (public transport, affordable housing, cultural amenities, security) and economic development (high productivity, diversified economy, location in central Europe, hub function to Eastern Europe). Conversely, the low level of integration, the lack of innovation and R&D activities as well as the unsustainable resource consumption level are considered to be the greatest weaknesses of the city.
ESPON 2013 47
Most promising activities for the future development of the city are the completion of large urban development projects (Main Station, Aspern), the fostering of integration as well as the strengthening of cooperation with surrounding regions in the view of the stakeholders surveyed. However, despite the assumed positive effects of these projects they are also perceived to be highly controversial and challenging in their realization.
3. Realization of inclusive metropolitan development
Legal and political stability are clearly considered to be the most important preconditions for cooperation, both generally and for the case of Wien in particular. In Wien, the open-mindedness of society, leadership and decision-making qualities are also seen as important. The stakeholders perceive the city to be a very attractive partner, mainly due to existing experience with cooperation, the geopolitical location and the well-functioning administration. Cooperation with cities in the metropolitan region of Wien is regarded essential in the fields of infrastructure development and transport, coordination of spatial development, economic development and environmental issues. For cooperation with cities outside of the metropolitan region the fields of R&D, energy, knowledge transfer, cluster networks and transport and infrastructure are regarded necessary. There is generally a high awareness of existing cooperative initiatives of Wien with both cities in the metropolitan region as well as beyond. Centrope, PGO, VOR and the Wien Region appeared to be most important within the metropolitan region. Outside, initiatives with the city of Bratislava, as well as EUROCITIES, METREX and OPENCITIES were mentioned frequently. Remarkably, there were no explicit initiatives mentioned with Praha, Budapest or Ljubljana. Potential future partner cities for the stakeholders can be found in the metropolitan area but also in Germany, Hungary, the Czech Republic, Slovakia, Slovenia, Switzerland, Spain, Italy and France.
12. Strategic Efforts and Recommendations
12.1. Introduction
The concept of metropolitan/regional governance has been widely discussed for reaching common policy goals in metropolitan areas since the 1990s. Governance is regarded as the capacity to cope with the issues reaching beyond the jurisdiction limits, which often cannot be managed solely by public administration or market. As such it is closely connected to the spatial polycentricity as emerging pattern of arrangement of activities in territory. (Ottgar et al., 2008; Salet et al., 2003)
Apparently the concept of governance has not received so much attention in the political debate in the new member countries of EU, and they also have still maintained a rather monocentric spatial pattern of their metropolitan regions. However, the recent changes suggest that they will follow the earlier spatial changes of their western neighbors, probably with increased speed. This will require adoption of adequate changes also in their governance.
12.2. Objectives
WP 2.5 builds upon knowledge produced in all earlier WPs - from data analysis conducted in WPs 2.1, 2.2 and 2.3 to qualitative inquiries (questionnaires and local city conferences) done in WP2.4. It aims at deeper insight in the perception as well as an objective state-of-the-art of the spatial changes that are commonly classified as
ESPON 2013 48
polycentricity and metropolisation. It will provide background information for the development of new strategies that are better prepared to cope with the massive changing conditions affecting metropolitan regions of the Central European capitals - from suburbanization to changes resulting from the integration process of new EU members.
As the governance concept originated in the countries of North-Western Europe, the project will explore its applicability in the Central European context with its different political and administrative culture but with shared cultural tradition of the wider Danube and Central European region.
12.3. Methodology
Proposals for strategic recommendations will be based on identified factors influencing metropolitan development and providing future development opportunities. They will derive from the evidences and findings from previous analyses and stakeholders´ perceptions and opinions on characteristics, potentials and assets developed in the preceding stages of the project.
These proposals of perspectives and strategies for the metropolitan regions of capital cities will be elaborated by each national group and national stakeholders under coordination of the responsible TPG partner. They will be based on the identification and assessment of relevant factors (potentials, resources and assets).
On the background of these particular metropolitan regional proposals and on the background of the stakeholders´ perceptions and opinions a common proposal will be developed for a CED-zone-perspective.
The process of elaboration of strategic advice combines top-down and bottom-up approaches in the collection of information and receiving feedback from stakeholders. As such, it consists of several incremental steps:
Collection of existing background “top-down” information: analysis of planning documents of the 5 POLYCE cities
Collection of existing background “bottom-up” information: analysis of outcomes from questionnaires
Elaboration of strategic advice to be discussed at the local city conferences
Synthesis of the 5 strategies as a basis for identifying shared features for a CED-zone-perspective
Elaboration of final strategic advice for 5 POLYCE metropolises and CED-zone
It is essential that from each PP a set of comparable data is received for the comparison of strategies as well as for the elaboration of the shared strategic advice for the CED-zone level. Therefore, a shared form has been developed which is used by the TPG to identify relevant strategies and policies. The form distinguishes the territorial coverage of the strategies and policies - from core city and metropolitan region to Central European or Danube region level. The existence or absence of a strategy or a territorial dimension will give significant impulses for further discussion.
12.4. Outcomes
The strategy for strengthening polycentricity will be based on the following pillars:
ESPON 2013 49
Metropolitan growth management regarding the allocation of new metropolitan functions under consideration of land recycling and combating suburban sprawl
Metropolitan positioning through the strengthening and enhancement of relevant driving forces
Efficient and sustainable macro-transportation within and between respective metropolitan regions as well as in the entire CED-zone including linkages to wider Europe
Cooperative and integrated territorial governance on the level of metropolitan regions strengthening the mutual relation between metropolitan development of cities and polycentric development within the CED-zone
Development of cooperative structures between metropolitan regions in order to enhance polycentric development (focus on planning and transport policies)
Strategic recommendations will be elaborated for two territorial levels of polycentric development:
A) The metropolitan region of each capital city
The strategic recommendations for each metropolis and its metropolitan territory will consist namely of:
Recommendations regarding a metropolis in the Central European polycentric metropolitan system
A concept of sustainable development of the metropolitan territory with an emphasis on polycentric development focusing on co-operative initiatives between all partners
Key strategic issues to be tackled in order to support smart metropolitan growth and sustainable territorial development
Actions (projects, networks …) designed in cooperation with the involved stakeholders framed within key themes of metropolitan and regional governance,
B) The CED-zone
Key strategic issues of European significance are tackled to enhance and strengthen the position of the CED-zone (infrastructure, governance):
A future perspective for the CED-zone related to the Danube region strategy
Areas of co-operation among metropolises of the CED-zone
Potentials for the development of cooperative structures between metropolitan regions will be explored so that polycentricity in structural/functional as well as in institutional/strategic terms can be fostered.
13. Further proceeding towards the Draft Final Report

ESPON 2013 50
Fig. 13: POLYCE project plan
With the delivery of this Interim Report more than half of the project’s runtime is over and two of the content-related WPs have finished their work. Still, there are six more months reserved for empirical work in four other WPs until the draft final report of POLYCE will have to be finalized. The project plan foresees - next to a number of internal dates - two milestones serving the advancement of central project-related questions. One is the interview phase which is already finished and of which preliminary results are part of this Interim Report. The other are so-called local city conferences, which are to be understood as local workshops held in each of the 5 POLYCE cities in autumn, aiming at steering the project towards the strategic recommendations it is ought to deliver.
The Local City Conferences
The local city conferences are reaching out to representatives and stakeholders of the cities in order to provide additional information, assessments of potentials and assets as well as perspectives on future positioning of the 5 POLYCE cities. Also, they will help relating the findings to results obtained in other WPs. The main objective of these workshops is to get feedback from stakeholders on (perceived) spatial qualities of the five cities, to increase knowledge about important assets and potentials and to identify possible ways of utilizing these assets and potentials for future development.
City reports for the Local Conferences
It is a common task of several WPs in POLYCE to analyze the strategic planning documents of the 5 cities in order to get information about if and how they are dealing with the concepts of metropolisation and polycentricity in their development efforts. Together with the results from the questionnaires each POLYCE-city-PP will prepare a comprehensive city-report that is going to be used as a basic pillar of discussion in the local conferences.
Further efforts in WP2.3
WP2.3 is aiming at converting the concepts of metropolisation and polycentricity into factors and indicators for the analysis of metropolitan profiles in order to provide comparable results between metropolises for further discussion. This process has involved specifying factors and indicators in terms of content (what is the factor

ESPON 2013 51
about), time (what time period does the factor cover) and scale (what spatial scale does the factor cover).
A first selection of indicators was already made and will be updated in September 2011. The aim at this stage is to reduce the number of indicators and select MEGAs with highest possible data coverage for benchmarking. This is to be achieved through TPG decisions and cross-correlating statistical analysis indicators within each type of endowment factor. Hence, the next steps of WP2.3 for next two months are to calculate indicators according to the defined model and their discussion with the TPG and local stakeholders. Finally the metropolitan profiles of the 5 POLYCE cities will be developed, adding to the city reports as a subject of discussion at the local city conferences.
Further efforts in WP2.4
To date the first part of WP 2.4 (the conduction of a survey among stakeholders in the five POLCYE cities) is completed. In the coming months the remaining tasks of the WP will be completed which are the analysis of strategic planning documents and the preparation and conduction of local city conferences as described above.
Further efforts in WP2.5
WP2.5 will elaborate a first draft of strategic advice together with each local PP, building on city reports and metropolitan profiles. This will be done in the preparation phase of the local city conferences in October and deal with existing strategies, policies and projects as well as missing features in several policies and strategies on different spatial levels.
In the post-processing phase of the local conferences outcomes will be worked up and first draft strategies will be developed. Final strategies for local and European level will be developed for the delivery of the draft final report and slightly adapted afterwards if necessary.

ESPON 2013 52
14. Literature
Austrian Federal Railways (www.oebb.at)
Bairoch, P. (1988): “Cities and economic development: from the dawn of history to the present”, Chicago (IL): University of Chicago Press.
Bathelt, H., Malmberg, A: and Maskell, P. (2004): “Clusters and knowledge: local buzz, global pipelines and the process of knowledge creation”, Progress in Human Geography, 28 (1): 31-56.
BBSR (2010): Metropolräume in Europa. Bundesinstitut für Bau-, Stadt- und Raumforschung (BBSR) im Bundesamt für Bauwesen und Raumordnung (BBR). Bonn: Selbstverlag.
Begg, I. (1999): Cities and Competitiveness, in Urban Studies, Vol. 36, Nos 5-6, pp. 795-810.
Black, D. and Henderson, J.V. (1999): “A theory of urban growth”, Journal of Political Economy 107 (2): 252-284.
Cairncross, F. (1998): The Death of Distance. How the Communications Revolution Will Change Our Lives, London: Orion Business Books.
Camagni, R. (1993): “Principi di economia urbana e territoriale”, Rome (IT): Carocci.
Camagni, R. (2007): Towards a Concept of Territorial Capital, In: Joint Congress of the European Regional Science Association (47th Congress) and ASRDLF (Association de Science Regionale de Langue Francais, 44th Congress) Paris, August 29th – September 2nd.
Camagni, R. (2009): Territorial capital and regional development. In R. Capello and P. Nijkamp (eds.) Handbook of Regional Growth and Development Theories. P. 118-132, Northampton, Mass.: Edward Elgar Publ.
Camagni, R., Diappi, L., and Leonardi, G. (1986): “Urban growth and decline in a hierarchical system: a supply-oriented dynamic approach”, Regional Science and Urban Economics, 16.
Camagni, R., Gibelli, M.C., and Rigamonti, P. (2002): “Urban mobility and urban form: the social and environmental costs of different patterns of urban expansion”, Ecological Economics, Elsevier, 40 (2): 199-216.
Capello, R. (2009): “Indivisibilities, synergy and proximity: the need for an integrated approach to agglomeration economies”, Tijdschrift voor Economische en Sociale Geografie, 100 (2): 145-159.
Capello, R. and Camagni, R. (2000): “Beyond optimal city size: an evaluation of alternative urban growth patterns”, Urban Studies, 37 (9): 1479-1496.
Capello, R. and Nijkamp, P. (eds.) (2004): “Urban dynamics and growth: advances in urban economics”, Amsterdam (NL): Elsevier.
Carlino, J., and Saiz, A. (2008): “Beautiful city: leisure amenities and urban growth”, Federal Reserve Bank of Philadelphia Working Paper SSRN-1280157.
CEC (1999): European Spatial Development Perspective. Towards Balanced and Sustainable Development of the Territory of the European Union. Luxembourg, Office for Official Publications of the European Communities.
http://ec.europa.eu/regional_policy/sources/docoffic/official/reports/som_en.htm
Christaller, W. (1933): “Die zentralen Orte in Suddeutschland”, Jena (DE): Gustav Fischer.
Ciccone, A. and Hall, R.E. (1996): “Productivity and the density of economic activity”, American Economic Review,86 (1): 54-70.
ESPON 2013 53
Clark, W. A. V. (2000): Monocentric to Policentric: New Urban Forms and Old Paradigms. In: Bridge, G., Watson, S. (eds.): A Companion to the City. Blackwell Publishers, Oxford, pp. 141 – 154.
CORDIS online database (http://cordis.europa.eu)
Davoudi, S. (2003): Polycentricity in European Spatial Planning: From an Analytical Tool to a Normative Agenda. In: European Planning Studies, 11, 8, pp. 979 – 999.
Elissalde, B. (2004): “Metropolisation”, Hypergeo (http://www.hypergeo.eu/article.php3?id _article=257)
ESPON www.espon.eu
ESPON 1.1.1 (2005): ESPON 1.1.1 – Potentials for polycentric development in Europe, co-financed by the European Community through the INTERREG IIIB ESPON, final report August 2004, revised March 2005, Stockholm, www.espon.eu
ESPON 2013 DB (2010): Draft Final Report
ESPON ATTREG (2010): Attractiveness of European Regions and Cities for Residents and Visitors (2010-2012), Draft Interim Report
ESPON CAEE (2010): The Case for Agglomeration Economies in Europe, Final Report
ESPON CLIMATE (2010): Climate Change and Territorial Effects on Regions and Local Economies, Revised Interim Report
ESPON Coordination Unit (2010): First ESPON 2013 Synthesis Report. New Evidence on Smart, Sustainable and Inclusive Territories. Luxembourg.
ESPON DEMIFER (2010): Demographic and migratory flows affecting European regions and cities, Final report
ESPON FOCI (2010) Future Orientations for Cities, Final Report
ESPON INTERCO (2011):Indicators of Territorial Cohesion, Interim Report
ESPON SURE (2010): Success for convergence Regions’ Economies, Draft Final Report
ESPON Typology Compilation (2009): Interim Report
Faldui, A. (2004): Spatial Planning Traditions in Europe: Their Role in ESDP Process. In: International Planning Studies, 9, 2-3, pp. 155 – 172.
EUROSTAT: http://epp.eurostat.ec.europa.eu/portal/page/portal/statistics/themes
Friedmann, J. (1986): The World City Hypothesis. In Development and Change, vol. 17, p. 69-83.
Friedmann, J. (2002): The Prospect of Cities. Minneapolis: University of Minnesota Press.
Fujita, M. (1989): “Urban economic theory: land use and city size”, Cambridge (UK): Cambridge University Press.
GaWC, Global and World Cities Research Network (http://www.lboro.ac.uk/gawc)
Geyer, H.S. (2002): International Handbook of Urban Systems Cheltenham: E.Elgar Publ. Inc.
Giffinger, R., Haindlmaier, G. and Kramar, H. (2010) The role of rankings in growing city competition. In Urban Research & Practice, p. 299 – 312.
Giffinger, R. and Hamedinger, A. (2009): Metropolitan competitiveness reconsidered: the role of territorial capital and metropolitan governance.In Terra Spectra, Volume XX, 1/2009: 3-13.
Giffinger, R. and Hamedinger, A. (2010): Territorial Capital as a Key Element of Metropolitan Competitiveness. In Stojkov B. and Nedovic-Budic Zorica (ed.) Urban Nexus. London: Ashgate (forthcoming).
ESPON 2013 54
Giffinger, R., Fertner, C., Kramar, H., Kalasek, R., Pichler-Milanovic, N. and Meijers, E. (2007): http://www.smart-cities.eu/ (10.6.2010)
Glaeser, E. L. (2008): “Cities, agglomeration and spatial equilibrium”, Oxford (UK): Oxford University Press.
Glaeser, E.L. and Kahn, M.E. (2004): “Sprawl and urban growth”, in: J. Vernon Henderson and Jacques-Francois Thisse (Eds.), “Handbook of regional and urban economics”, Vol. 4 “Cities and geography”, pp. 2481-2527, Amsterdam (NL): Elsevier.
Glaeser, E. L., Kallal, H., Scheinkman, J. A.; and Shleifer, A. “Growth in cities”, Journal of Political Economy, 100 (6): 1126-52.
Hall, P. and Pain, K. (2006): The Polycentric Metropolis. EARTHSCAN London, Sterling, VA.
Healey, P. (1997): Collaborative Planning: Shaping Places in Fragmented Societies. London, Basingstoke: Macmillan.
Jacobs, J. (1961): “The death and life of great American cities” New York (NY): Random House.
Jacobs, J. (1969): “The economy of cities”, New York (NY): Random House.
Keeling, D. (1995): Transport and the World City Paradigm. In P.L. Knox and P.J. Taylor (eds.) World Cities in a World System. Cambridge: Cambridge University Press.
Kloosterman, R.C., MUSTERD, S. (2001): The Polycentric Urban Region: Towards a Research Agenda. In: Urban Studies, 38, 4, pp. 623 – 633.
Kragt, R. (2006): The Concept of Polycentricity. In: Proceedings of UNECE 10th Conference on Urban and Regional Research. Ministry of Housing, Spatial Planning and the Environment (VROM), The Netherlands.
Krätke, S., Borst, R. (2007): Metropolisierung und die Zukunft der Industrie im Stadtsystem Europas. Projektbericht; Otto Brenner Stiftung.
Kunzmann, K. (1996): Europe-Megalopolis or Themepark Europe? Scenarios for European Spatial Development. International Planning Studies 1.2, p.143-163.
Leroy, S. (2000): “Sémantiques de la métropolisation”, L'Espace géographique, 29 (1): 78-86.
Lösch, A. (1954): “The economics of location”, Yale (CT): Yale University Press.
Marshall, A. (1920): “Principles of economics”, London (UK): Macmillan. Retrieved on Oct. 12, 2009 on the website of the Library of Economics and Liberty: http://www.econlib.org/library/Marshall/marPCover.html
Meijers, E. (2005): “Polycentric urban regions and the quest for synergy: is a network of cities more than the sum of the parts?”, Urban Studies, 42 (4): 765-781.
Meijers, E., Waterhout, B. and Zonneveld, W. (2005a): Polycentric Development Policies in European Countries: An Introduction. In: Built Environment, 31, 2, pp. 97 – 102.
Meijers, E., Waterhout, B. and Zonneveld, W. (2005b): Polycentric Development Policies in Europe: Overview and Debate In: Built Environment, 31, 2, pp. 163 – 173.
Nijkamp, P. and Mills, E.S. (eds.) (1986): “Handbook of regional and urban economics”, Amsterdam (NL): North-Holland.
OECD (2001): OECD Territorial Outlook. Paris.
Otgaar, A., Van den Berg, L., Van der Meer, J and Speller, C. (2008): Empowering Metropolitan Regions through New Forms of Cooperation. Hampshire: Ashgate Pub.Lim.

ESPON 2013 55
Parkinson, M. (1997): The rise of the European entrepreneurial city. In: Financing of cities and regions: subsidiarity and finance potentials. East-West Conference, Munich, October 1996. (Conference proceedings, pp.125-136).
Parkinson, M., Hutchins, M., Simmie, J., Clark, G. and Verdonk, H. (Eds.) (2003): Competitive European Cities: Where Do The Core Cities Stand?.
Polanyi, M. (1966): “The tacit dimension”, New York (NY): Doubleday & Co.
Roback, J. (1982): “Wages, rents, and the quality of life”, The Journal of Political Economy, 90 (6): 1257-1278.
Rodriguez-Pose, A. (2002): The European Union: Economy, Society, and Polity. Oxford: University Press.
Rosen, S. (1979): “W'age-based indices of' urban quality of life”, in Mieszkowski, P. and Straszheim, M. (eds), Current issue in urban economics, Baltimore (MD): Johns Hopkins University Press.
Rosenthal, S. S. and Strange, W. C. (2004): “Evidence on the nature and sources of agglomeration economies”, in: J. Vernon Henderson and Jacques-Francois Thisse (Eds.), “Handbook of regional and urban economics”, Vol. 4 “Cities and geography”, pp. 2119-2171, Amsterdam (NL): Elsevier.
Salet, W; Thornley, A. & Kreukels, A. (eds.) (2003): Metropolitan governance and spatial planning. London: Spon Press.
Sassen, S. (1991): The global City. New York, London, Tokyo: Princeton University Press.
Sassen, S. (2001): “The global city: New York, London, Tokyo”, (Princeton (NJ): Princeton University Press.
Sassen, S. (ed.) (2002): “Global networks, linked cities”, New York (NY): Routledge.
Storper, M. (1997): The regional World. Territorial Development in a global Economy. New York und London: The Guilford Press.
Tatzberger, G. (2008): A global economic Integration Zone in Central Europe? Wien – Bratislava – Györ as a laboratory for EU Territorial Cohesion Policy. Wien: ÖIR.
Taylor, P, Walker, D. (2001): “World Cities: A First Multivariate Analysis of their Service Complexes” Urban Studies Vol 38: 23-47.
URBAN AUDIT:
http://epp.eurostat.ec.europa.eu/portal/page/portal/region_cities/city_urban
Uzawa, H. (1962): “Production functions with constant elasticities of substitution”, Review of Economic Studies, 29 (4): 291-299.
ViaMichelin (www.viamichelin.at)
Waterhout, B. (2002): Polycentric Development – What is behind it? In: Faludi A. (ed.) European Spatial Planning, p. 39 – 58, Cambridge Mass.: Lincoln Institute of Land Policy.
Werlen, B. (1995): Sozialgeographie alltäglicher Regionalisierungen. Band. 1, Stuttgart: Franz Steiner Verlag.
Zipf, G. K. (1949): “Human behavior and the principle of least effort”, Boston (MA): Addison-Wesley.

ESPON 2013 56
The ESPON 2013 Programme is part-financed by the European Regional Development Fund, the EU Member States and the Partner States Iceland, Liechtenstein, Norway and Switzerland. It shall support policy development in relation to the aim of territorial cohesion and a harmonious development of the European territory.
ISBN