reconciling polycentric administrative data to improve...
TRANSCRIPT
1
Reconciling polycentric administrative data to improve drinking water security in rural
Bangladesh
Alex Fischer, DPhil Candidate, University of Oxford
Smith School of Enterprise and Environment
School of Geography and the Environment
The University of Oxford
South Parks Road, Oxford OX1 3QY United Kingdom
Abstract
Ensuring safely managed drinking water for everyone is a global priority. In pursuit of the Millennium Development Goals (MDGs), the country of Bangladesh achieved nearly universal access to improved sources of drinking water. (WHO/UNICEF 2017) However improved access targets have long been overshadowed in Bangladesh by uncertainties around water quality and safety, which in turn contributed to the evolution of the Sustainable Development Goal (SDG) targets expanding definitions. While improved access is the critical first step on a progressive ladder, SDG 6.1 now addresses multiple intertwined factors of safety, reliability, affordability, equity and functionality that underpin water security. In rural Bangladesh, privately installed water points has contributed significantly to the increase in access; our recent water infrastructure audit in 10 villages found a 230% increase in the number of water points since 2008; this is an increased growth rate from previous academic and government studies (Fischer et al. n.d.; Alexander Van Geen et al. 2014). The government remains determined to expand the provision of public water point infrastructure including deep tubewells and municipal piped water systems. But the uncertainty of water quality, reliability, and affordability attached to these largely unmonitored and privately managed water points pose significant risks to consumers, regulators and service providers striving to achieve the goals of safely managed drinking water systems.
In the context of implementing the SDGs, this paper identifies the need to create information systems which aggregate data inputs from multiple sources, and derive value for multiple purposes. Pathways to do this are explored in the context of water data information systems in Bangladesh. The MDG dependence on household surveys for global reporting is no longer sufficient in isolation to support measurement and implementation of the new risk-based framework. The demand for more ambitious information systems, which not only supports monitoring but also fit-for-purpose designs, is evident. This paper suggests an achievable step is to triangulate household survey data with reconciled administrative and sensor data in support of official statistics, and providers of drinking water services. This paper, originally written as a project scoping document for the Sustainable Development Solutions Network’s (SDSN) Thematic Research Network on Data and Statistics (TReNDS), builds on further work with REACH Water Security for the Poor Programme. The intention is to support the process of matching new data technologies with multi-leveled decision-making processes. The SDGs provide the political incentives to explore this in line with the expanding data-driven mechanisms within, and across, multiple levels of state administrative and official statistical systems.

2
Introduction
In the era of post-2015 sustainable development strategies, governments are redefining the approaches required to deliver safe drinking water services for rural and urban populations. The Sustainable Development Goals (SDG) provide a normative framework that expands the Millennium Development Goals’ (MDG) target beyond “improved access” (Bradley and Bartram 2013; Lancet 2014). The discursive evolution of drinking water security steered the post-2015 debates away from targets narrowly focused on provision of service into ones that recognizes multiple risks factors: equitable access, functionality, safety, affordability and availability, reliability and institutional performance (Bartram et al. 2014; Hope and Rouse 2013; Mason and Calow 2012; WHO and UNICEF 2015).1 However, these goals were agreed by member states before indicators were defined and now require modified monitoring systems.
Through a review of the evolving information systems in Bangladesh, this paper explores the potential for data reconciliation technologies to simultaneously support SDG monitoring while also underpinning adaptive decision-making and service delivery of safe drinking water. The first section reviews how SDG 6.1 has harmonized global demand for expanded types and sources of data collection, delineated by risk factors facing drinking water security. The second section seeks to link two theoretical frameworks of this approach: the first applies value-of-information methods to design information systems in support of adaptive decision-making structures; the second maps action-situations, and related decision needs, across polycentric institutions. The final sections explore the evolution of data supply and demand in the country context of Bangladesh by returning to the original pragmatic research question around the potential use of machine learning approaches to automate and simplify data reconciliation.2 The paper is framed in the policy context of monitoring SDG 6.1 in rural Bangladesh and draws largely from a 2017 qualitative and field work in 10 villages of rural Bangladesh, analysis in forthcoming publications. Finally, the paper hopes to contribute to systematic evaluation approaches for new data collection technologies in the context of evolving definitional frameworks and complex, multi-leveled institutional systems.
Framing the context through the Sustainable Development Goals
The SDG agenda is being framed as occurring in tandem with the global data revolution. This is changing the possibility frontiers for information systems through new data accessibility, technological innovation, and real-time information systems which underpin institutions, decision-making and the relationships between governments and citizens (IEAG 2014; Sachs et al. 2015). Lessons around data-driven policy and implementation are available from the MDGs, specifically from the Joint Monitoring Platform (JMP). This co-convened initiative between UNICEF and the World Health Organization (WHO) advanced the standardization of survey questions around household water use and access, enabling more efficient aggregation household survey data. This enabled comparative indicators that quantified early global achievement of the MDG drinking water target (Bartram et al. 2014). While the UN Statistics Division, national statistics agencies and the JMP are now modifying calculation methods for SDG 6.1, the discourse around the data revolution is also pushing a systems approach to data generation that moves beyond linear evaluative indicators into ones that support multiple levels of decisions which address the multiple risk factors.
1 SDG 6 seeks to “ensure availability and sustainable management of water and sanitation for all.” Within this goal, target 6.1 states that “by 2030, countries will achieve universal and equitable access to safe and affordable drinking water for all.” (JMP 2017) 2 Data reconciliation is defined as the ability to repeatedly access, aggregate, analyze and present information collected from a variety of different inputs and sources.

3
Table1This ismodified fromUN-Water. JMPmeasurementplanswerereleased ina2017monitoring report.Potentialdatasources come fromauthor’sassessmentof technicaldocuments. (R.E. S.Bainetal. 2014;Bartrametal. 2014;BradleyandBartram2013;CarterandRoss2016;Cronk,Slaymaker,andBartram2015;Foster2013;Hutton2012;Lancet2014;SlaymakerandJohnston2016;Water2015;White,Bradley,andWhite1972;WHO/UNICEF2017;WHO2009)
While data collection technologies are advancing rapidly, standardizing and utilizing them is increasingly fragmented by countries and context. Across SDG 6.1, as seen in the table below, scholars and policymakers have debated and proposed a range of new definitions and corresponding monitoring technologies to measure the multiple elements of safety, sustainability and drinking water security. This includes frequently debated elements of functionality and reliability of infrastructure, with scholars proposing specific survey questions to expand beyond binary measures of functional/non-functional (Carter and Ross 2016; Foster 2013). The SDGs explicitly incorporate water quality parameters within the water safety mandate, promoting place-based risk assessments using water safety planning approaches and also prioritizing global prevention of microbial and fecal contamination (R. Bain et al. 2014; Lancet 2014; WHO/UNICEF 2017). Measuring affordability is still a challenge but Hutton proposes combining standardized questions in household surveys with utility data to allow disaggregated and temporal analysis of expenditure-to-income ratios across services types (Hutton 2012). These targets and measurement will also extend beyond households to include schools, health centers, markets and other public facilities and increasingly draw data from administrative
LanguageusedinSDG6.1
NormativeInterpretationExisting/PlannedDataSourcesforGlobalJMP
PotentialAdditionalorFutureDataSources
Universal
Impliesallexposureandsettingsincludinghouseholds,schools,healthfacilities,workplacesandpublicfacilities.(Bartrametal.2014;Cronk,Slaymaker,andBartram2015)
Householdsurveysandcensus;facilitysurveys;E-MIS/H-MIS
InfrastructureMapping;AdministrativedataincludingeducationorhealthMISsystems;crowdsourcing
AndEquitable
Impliesprogressivereductionandeliminationofinequalitiesbetweenpopulationsub-groups(BradleyandBartram2013)
Householdsurveysandcensus
GeospatialMapping;Publicorprivatesectorwaterutilities;Crowdsourced;AdministrativeData
Access
Impliessustainedaccesstoimprovedwaterandinfrastructurethatisreliablyandsufficientlyavailableclosetohome(CarterandRoss2016;Foster2013;SlaymakerandJohnston2016)
Householdsurveysandcensus
InfrastructureMapping;Smart-sensorsystems;Crowdsourcing;Climatemonitoring;AdministrativeData
ToSafe
Water,atpointofdelivery,thatisfreefrompathogensandelevatedlevelsoftoxicchemicalsatalltimes.(Bainetal.2014;Lancet2014;WHO2009)
Householdsurveysandadministrativedata
Administrativedatafromhealthfacilities;Administrativedatafromregulatorsandpublicwaterpoints;Publicorprivatesectorwaterutilities;CitizenScience
Andaffordable
Paymentforservicesdoesnotpresentabarriertoaccessorpreventpeoplefrommeetingbasichumanneeds(Hutton2012)
Householdsurveysandadministrativedata
Administrativedata;Publicorprivatesectorwaterutilities
DrinkingWater
Waterusedfordrinking,cooking,foodpreparationandpersonalhygiene.(White,Bradley,andWhite1972)
HouseholdSurveys
ForallSuitableforusebymen,women,girls,andboysofallagesincludingpeoplelivingwithdisabilities.(Lancet2014)
HouseholdSurveys Crowdsourceddata

4
management information systems (MIS) (Cronk, Slaymaker, and Bartram 2015). Further, but far less explored, are efforts to standardize measures of institutional and management arrangements such as formality of rules, regulations, policy, laws and information systems (Gallaher and Heikkila 2014; WHO 2012).
This broadened set of definitions has resulted in expanding demand for data by both national statistics offices, regional regulators and municipal officials. The 2017 JMP indicator guidance note understandably continues to depend on household surveys, methods adopted by country statistics offices. But JMP also intends to integrate administrative data for some high and middle income countries with formalized and regulated service providers (WHO/UNICEF 2017). As shown, the previous dependence on household surveys for global reporting is no longer sufficient in isolation to support measurement and implementation across the new risk-based framework.
Optimizing value of data for decision-makers in polycentric institutions The evolving complexity of determining safe drinking services implies more investments to fulfill the new measurement needs. The rapid advances in technologies have changed the frontiers of what one can do with information, allowing for new combinations of data, increased accessibility, and better temporal resolution. Designing an SDG information system around the evaluation of a goal-based framework generates a set of answers around accountability and proximity to targets, however not necessarily towards actions needed to achieve or sustain the outcomes. In a 2015 opinion article, Shepherd et al challenged the traditional linear target-driven indicator measurement systems reflected in the SDG monitoring frameworks and instead argued to reorient data investments towards the reduction of decision uncertainty (Shepherd et al. 2015). This perspective is supported by analysis from a 2011 UN country assessment which found that only 42% of the countries surveyed integrate official statistical information systems on water into national planning processes (WHO 2012). Along with numerous other examples, this raises questions of how to optimize new investments in information systems to derive maximum use and value by simultaneously supporting multiple decision-needs.
In a forthcoming SDSN TReNDS Working Paper, Levy extends this argument by applying value-of-information approach to information system design. (Hubbard 2007; Levy 2017) Levy’s “Living Manual” argues for a shift away from approaches following that linear goals-to-indicator-to-data collection process and instead towards fit-for-purpose ones that focuses on efficiency and flexibility to shift as contexts and decision-needs evolve. Levy further argues an approach that optimizes the combination of technologies to support multiple purposes, changing the cost-benefit ratios by considering tools as a package within a system, not siloed inputs. Levy outlines this process as first clarifying the decisions that matter, identifying the consequences of different choices, and finally narrowing the data needed to enable those decisions. (Levy 2017) The challenge to this approach, which Levy identifies, is the process of determining the data-demand function across complex overlapping levels of governance.
The model and tools for designing data systems based on this decision-orientated framework is supported by another body of literature around adaptive governance and polycentric institutional design. (Gallaher and Heikkila 2014; Leidel et al. 2014; McGinnis 2011; E Ostrom 2010; Elinor Ostrom 2005) The institutional analysis and development framework compliments Levy, Shepherd and Hubbard by focusing on defining and mapping action situations. This focuses on actions nested within the overlapping scales of decision-making jurisdictions, including formal and informal processes, and the surrounding situational variables (Elinor Ostrom 2010).
However, neither bodies of literature explicitly explore how to link the institutional framework with the information system design in ways to reinforce feedback loops for adaptive governance.
5
Re-visiting, and linking value-of-information approaches, could strengthen the connective tissue within these polycentric governance and service delivery systems, enhancing exactly what Levy and others call for in terms of adaptive monitoring. There are well-established analytic methods to map the networks and actors that underpin service delivery, resource allocation and resource management (Pahl-Wostl 2009). For example, Pahl-Wostl frames the dynamics of governance systems as learning processes, with learning loops (Hargrove 2002) based on evaluative response to decisions. This paper argues that information system design using value-of-information approaches, paired with mapping data use in subsequent action-situations, provides a thread to trace and enhance the connectivity of the system and the institutional performance. As described in later sections, the reconciliation of administrative data might provide a pathway to link the formal elements of polycentric decision-making and strengthen the system.
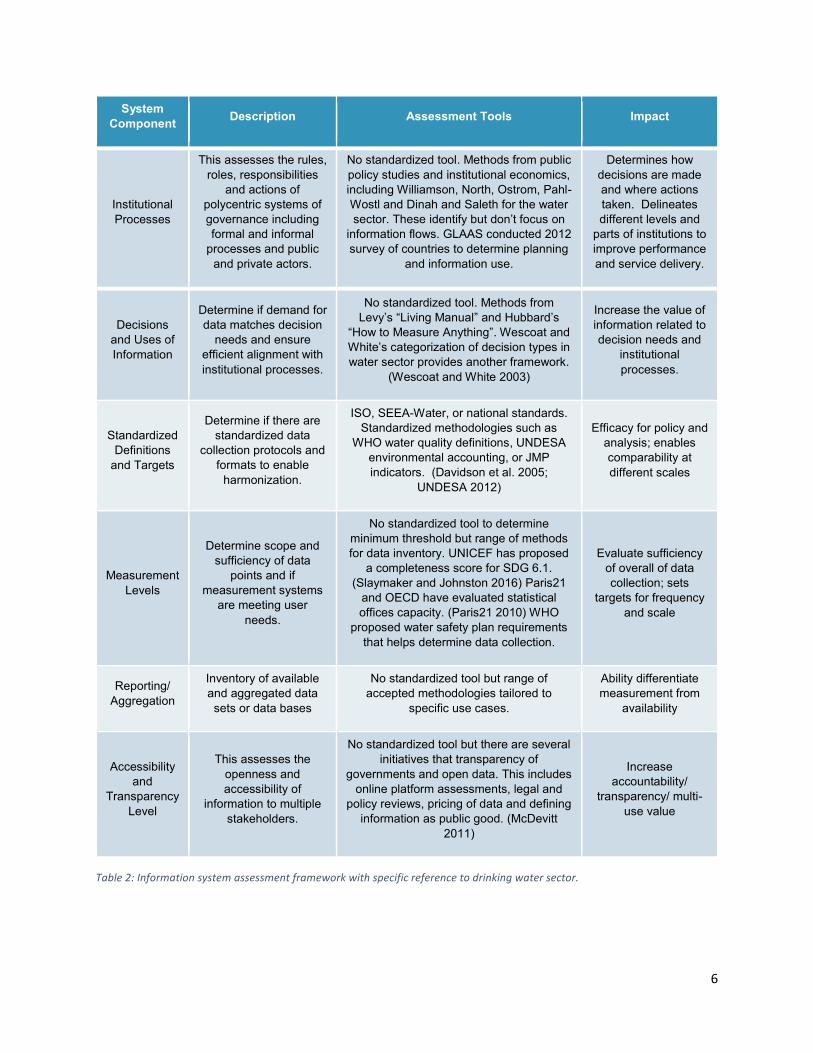
The table below proposes the first-iteration of a pragmatic assessment process pairing these theories and building from other established data assessment tools. This should be viewed as a dynamic and multi-pronged approach where components interact and change previous steps, not as a strictly linear process.
6
Table2:Informationsystemassessmentframeworkwithspecificreferencetodrinkingwatersector.
System Component Description Assessment Tools Impact
Institutional Processes
This assesses the rules, roles, responsibilities
and actions of polycentric systems of governance including formal and informal
processes and public and private actors.
No standardized tool. Methods from public policy studies and institutional economics, including Williamson, North, Ostrom, Pahl-Wostl and Dinah and Saleth for the water sector. These identify but don’t focus on
information flows. GLAAS conducted 2012 survey of countries to determine planning
and information use.
Determines how decisions are made and where actions taken. Delineates different levels and
parts of institutions to improve performance and service delivery.
Decisions and Uses of Information
Determine if demand for data matches decision
needs and ensure efficient alignment with institutional processes.
No standardized tool. Methods from Levy’s “Living Manual” and Hubbard’s
“How to Measure Anything”. Wescoat and White’s categorization of decision types in water sector provides another framework.
(Wescoat and White 2003)
Increase the value of information related to decision needs and
institutional processes.
Standardized Definitions
and Targets
Determine if there are standardized data
collection protocols and formats to enable
harmonization.
ISO, SEEA-Water, or national standards. Standardized methodologies such as
WHO water quality definitions, UNDESA environmental accounting, or JMP indicators. (Davidson et al. 2005;
UNDESA 2012)
Efficacy for policy and analysis; enables comparability at different scales
Measurement Levels
Determine scope and sufficiency of data
points and if measurement systems
are meeting user needs.
No standardized tool to determine minimum threshold but range of methods for data inventory. UNICEF has proposed
a completeness score for SDG 6.1. (Slaymaker and Johnston 2016) Paris21
and OECD have evaluated statistical offices capacity. (Paris21 2010) WHO
proposed water safety plan requirements that helps determine data collection.
Evaluate sufficiency of overall of data collection; sets
targets for frequency and scale
Reporting/ Aggregation
Inventory of available and aggregated data sets or data bases
No standardized tool but range of accepted methodologies tailored to
specific use cases.
Ability differentiate measurement from
availability
Accessibility and
Transparency Level
This assesses the openness and accessibility of
information to multiple stakeholders.
No standardized tool but there are several initiatives that transparency of
governments and open data. This includes online platform assessments, legal and
policy reviews, pricing of data and defining information as public good. (McDevitt
2011)
Increase accountability/
transparency/ multi-use value
7
Managing and monitoring exponential growth of infrastructure in rural Bangladesh Since independence in 1972, the Government of Bangladesh has reported impressive progress towards achieving near universal access to improved drinking water sources for both rural and urban populations. This has impacted millions of people. Although the population growth rates have slowed significantly since 1972, the most recent census data shows that the total population has more than doubled since independence, increasing by over 70 million people since 1974 (BBS 2011). This population growth has thus been matched by even larger exponential growth of drinking water infrastructure, particularly to rural communities’ dependent on groundwater.
There are multiple types of infrastructure and corresponding management systems in Bangladesh’s drinking water system. Only a small fraction of the rural population is connected to formal, public and regulated infrastructure. The government reports an inventory of the 136 piped water systems installed in towns and cities across Bangladesh, with upwards of 180 more systems in the planning phases (DPHE 2016b). This compares to a 2009 report by the Bangladesh Bureau of Statistics which estimated a total of 11 million tubewells installed across the country; 1 million provided by the government and 10 million installed by private owners. Administrative records from the Government of Bangladesh’s Department of Public Health and Environment (DPHE) show that as of June 2016, this number has increased to 1,628,733 public water points. This is shown in map 3 below as the ratio of the population to safe and functioning public water points (DPHE 2016a). The scale of privately owned and managed water points vastly out numbers the public ones with delineated formal responsibilities to monitor and maintain.
Two recent academic studies quantify the enormous increase of water points by conducting blanket inventories of several villages. They both reported growth rates of 200% or more of water points across multiple locations between 2000-2012 and 2008-2016 (Fischer et al. n.d.; Alexander Van Geen et al. 2014). The 2017 REACH water audit found an average of 7 people per tubewell in 10 villages in 2016, down from 17 people per tubewell in 2008 in the same area, and compared to the national ratio of 14 people per tubewell in 2010 (BBS 2010). If the average rate of growth across the villages is used as indicative of national trends, there could now be upward bound estimate of 23 million tubewells nationally (Fischer et al. n.d.). The trend towards privately-owned and managed tubewells suggests this number is not likely to decrease anytime soon. The expansion of infrastructure remains a critical element contributing to the high levels of improved access reported in national household surveys, but also the risks of the private water infrastructure increasing 3 times faster than the public points, increasing the complexity to manage, and more importantly, to monitor these sources.
Evolution of monitoring what matters in rural Bangladesh The global targets of improved access have been consistently overshadowed in Bangladesh by uncertainties around water quality and safety. This has helped in turn shape the evolution of global safe water goals. The widespread prevalence of cholera and microbial contamination of water points and surface water in the 1970’s directed national attention towards finding safe drinking water alternatives, specifically ones that were affordable and accessible at scale. This led to the rapid adoption of low cost #6 handpumps to access shallow aquifers using suction-lift mechanisms and the resulting dependency of millions of households on aquifers less than 150 meters deep. But the confirmation of widespread and naturally occurring arsenic in the shallow alluvial sediments in 1993 shifted the previous two decades of policy towards the new risk. But this initial exponential growth of shallow tubewells unintentionally increased the risk of exposure to elevated arsenic to tens-of-millions of people (A Van Geen et al. 2003; Kinniburgh and Smedley 2001).

8
By the late 1990’s, the scale of exposure and spatial distribution of risk was still uncertain. In response to the new information and realization of risk levels, DPHE and the British Geological Survey (BGS), in parallel to other ongoing national efforts, undertook a comprehensive analysis of the hydrogeologic conditions through a systematic survey of groundwater quality parameters. They installed a national network of 3,534 sentinel wells across Bangladesh which resulted with a spatial projection of risk shown in Map 1 (Kinniburgh and Smedley 2001). Despite this estimated spatial distribution of risk, researchers found that arsenic contamination is highly variable, with potential variation of safe-to-unsafe in tubewells less than 100 feet apart. (BGS and DPHE 2001; Alexander van Geen et al. 2014; Mcarthur et al. 2008) This prevented reliable risk prediction models to guide policy and left significant uncertainty of the safety of each newly installed shallow tubewell. It also implied a need to change the measurement approach to reduce uncertainty across actors.
Multiple levels of government and civil society were mobilized in the early 2000’s to respond, even when they had little formal control over the private tubewells or household consumption decisions and behaviors. To move beyond diagnosis of the problem and towards one that supported individuals at risk, the government undertook one of the world’s most comprehensive water quality screening efforts at the time and tested over 5 million tubewells serving an estimated 67 million people from 2002-2006 (A van Geen et al. 2006). This resulted with information for users by labeling wells red, for unsafe arsenic levels, and green for safe levels. It also produced a national database for government, academic and civil society that guided design of major arsenic mitigation programs.
The 2006 Bangladesh Arsenic Mitigation and Water Supply Program (BAMWSP) was the last region-wide blanket testing but national policy has continued to be evaluated through national household surveys and smaller-scale water point testing, including the Multi-Indicator Cluster Surveys (MICS) undertaken by the Bangladesh Bureau of Statistics with support from UNICEF. Using representative samples, this produced estimates to support national policy, identifying in 2010 that 22 million people were still drinking water with arsenic levels that exceeds the government’s standards. (BBS 2010)
The Bangladesh national drinking water agenda has been dominated by water quality concerns for decades at all levels of decision-making actors. But this wasn’t reflected in global indicators focused on improved access. Analysis by UNICEF of the 2009 MICS data, using the multi-risk framework, showed a different perspective on water security in Bangladesh. It revealed a rapid decline from 95% of the population with improved access to only an average of 13% having
Figure1ThesetwochartsshowdatafromhouseholdsurveysunderSHEWA-BProgramme(UNICEF2014)andanwaterauditofwaterpointinfrastructurein2017byREACHProgramme.(Fischeretal.n.d.;UNICEF2014)

9
safe, reliable access as seen in the figure below. The MICS national household findings are triangulated below with recent analysis from the 2017 REACH Programme in ten villages, which uses a water point infrastructure questionnaire instead of a household survey. The initial results, seen in the right side of figure 1, shows a similar decline of water security when considering access, affordability, functionality and safety risks measured at the infrastructure level.
However these techniques are focused on statistical risk for households, with the data being used primarily by policy makers for annual planning cycles and by academics, not for implementation or project design. The figure below shows the evolution of data sources, from estimating spatial scale of risk using physical water quality measurements to understanding provision of public services derived by household surveys and provision of services. Map 1 shows the projected concentration of arsenic-contaminated wells across the country using water quality test results from the 2000 BGS study. Map 2 shows the spatial distribution of population risks derived from 2013 household survey data and a randomized subsample of those for water quality testing. Map 3 provides spatial visualization of DPHE administrative records on distribution of functioning public water points (not including piped water systems), visualized in a ratio of population-to-infrastructure. Map 1 served as the basis for national risk mapping from physical measurements of water quality safety while map 2 provides perspectives on risks at the household level. Map 3 uses annual administrative data to identify coverage of “safe” water infrastructure. The areas with the largest population-to-safe water point, meaning the lowest coverage of public infrastructure, are the areas that were previously identified as having the greatest risk of population using water that exceed GoB standards of arsenic safe. The iterative progression of measurement tools and indicators shows a benefit of moving towards measurement techniques that integrate administrative records with outcome measurements to
improve delivery of safe drinking water.
Map3:Ratioofpopulationtosafeandfunctioningpublicwaterpoints
DPHEadministrativedata
Map1:SmoothedArsenicConcentrations NationalWaterPointSurvey
Map2:ProportionofpopulationdrinkingwaterwitharsenicexceedingGoBStandard
HouseholdSurveyData(MICS)
Data:BBS/UNICEFMICS2011-2013
Figure2Threemapsthatcomparenationaldatafrominfrastructureinventory,householdsurveyandadministrativedatashowingimpactofriskandresponseofarsenictodrinkingsources.(BBS2010;DPHE2016a;KinniburghandSmedley2001)

10
These measurements have been used by researchers and policymakers seeking a broader understanding of the risks and responses. Some of these studies, like the national blanket testing, have resulted with labeling water points as safe or not safe, providing immediately relevant information for individuals and households who face difficult daily choices around consumption, especially as arsenic has no taste, color or other identifiable characteristics. Several recent studies show that there is a significant discord between certainty levels of water point test results for arsenic and water users perception of safety.(George et al. 2012) In a 2014 article, Van Geen et al showed that despite two blanket testing campaigns, only half households reported knowing the status of the tested tubewells (Alexander van Geen et al. 2014). As seen in the figure below, the 2017 REACH survey of 10 villages showed that there is negligible testing of water points at time of installation, and that labeling of the tubewells after installation does not correspond with user perception of arsenic contamination. (Fischer et al. n.d.). Similar analysis by Madajewicz et al 2007, and expanded by Pfaff et al 2016, argues that water quality testing does not consistently result with users selecting the safe water options, identify communication and social barriers inhibiting well-switching decisions (George et al. 2012; Johnston et al. 2014; Madajewicz et al. 2007; Pfaff et al. 2016). Although user responses to information is far from uniform, these studies repeatedly find that frequency and repetition of water points testing improves decisions to select the safe water options. With the red/green markings of tested tubewells fading, and very few tests of newly installed water points, there is a continued concern that the majority decisions about drinking water consumption are made in absence of needed information.
Figure3Thisfigureshowsresultsfroma2017REACHsurveyof10villagesinChandpur,Bangladesh.Thebarcolumnsshowthedistributionofhandpumplabelsbetweenred(arseniccontaminated),green(safe),band(testedbutsafetyuncertain)andnomarking.Thelinesindicatespatialvariationinrespondentsperceptionsofarseniccontaminationbutaconsistentlylowpercentageofwaterpointsthatweretestedattimeofinstallation.(Fischeretal.n.d.)
11
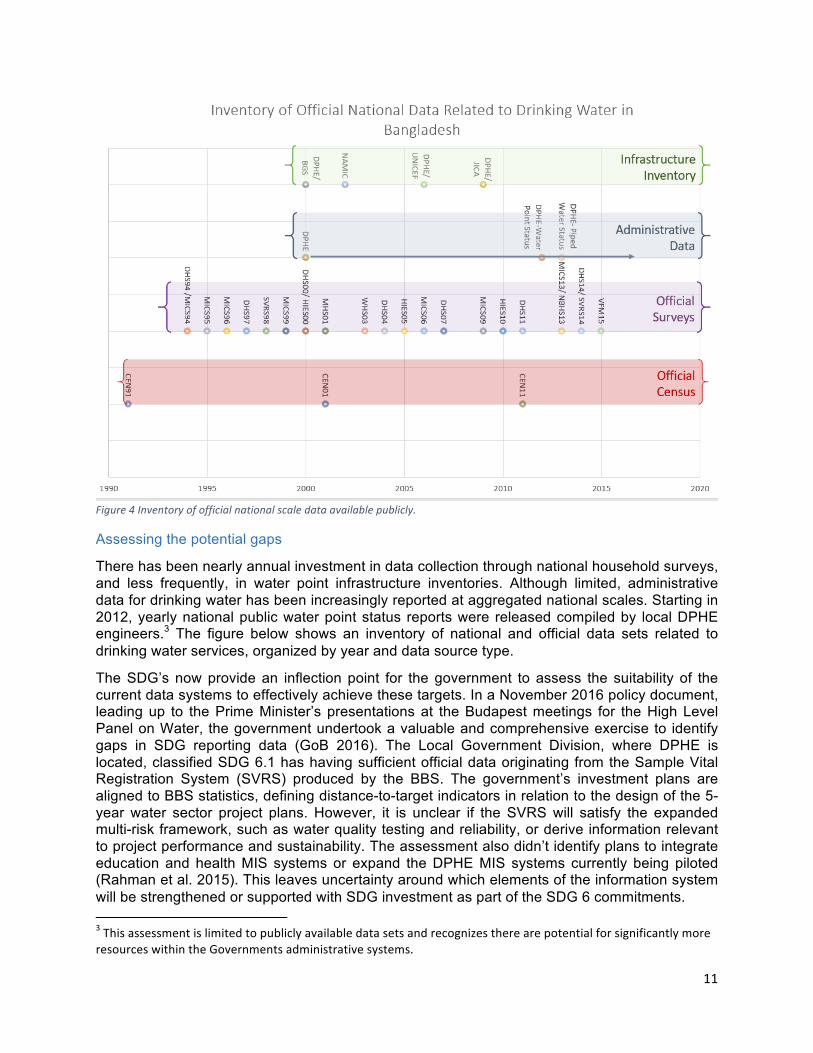
Figure4Inventoryofofficialnationalscaledataavailablepublicly.
Assessing the potential gaps
There has been nearly annual investment in data collection through national household surveys, and less frequently, in water point infrastructure inventories. Although limited, administrative data for drinking water has been increasingly reported at aggregated national scales. Starting in 2012, yearly national public water point status reports were released compiled by local DPHE engineers.3 The figure below shows an inventory of national and official data sets related to drinking water services, organized by year and data source type.
The SDG’s now provide an inflection point for the government to assess the suitability of the current data systems to effectively achieve these targets. In a November 2016 policy document, leading up to the Prime Minister’s presentations at the Budapest meetings for the High Level Panel on Water, the government undertook a valuable and comprehensive exercise to identify gaps in SDG reporting data (GoB 2016). The Local Government Division, where DPHE is located, classified SDG 6.1 has having sufficient official data originating from the Sample Vital Registration System (SVRS) produced by the BBS. The government’s investment plans are aligned to BBS statistics, defining distance-to-target indicators in relation to the design of the 5-year water sector project plans. However, it is unclear if the SVRS will satisfy the expanded multi-risk framework, such as water quality testing and reliability, or derive information relevant to project performance and sustainability. The assessment also didn’t identify plans to integrate education and health MIS systems or expand the DPHE MIS systems currently being piloted (Rahman et al. 2015). This leaves uncertainty around which elements of the information system will be strengthened or supported with SDG investment as part of the SDG 6 commitments. 3ThisassessmentislimitedtopubliclyavailabledatasetsandrecognizestherearepotentialforsignificantlymoreresourceswithintheGovernmentsadministrativesystems.

12
This Government assessment concludes without identifying gaps in official statistics underpinning SDG 6.1 reporting. Other actors have raised concerns about design, measurement and reporting for the drinking water sector both for national policy and local decision-makers. The explicit demand for expanded water quality testing has emerged from previous Government of Bangladesh household surveys and been echoed by advocacy groups seeking more attention given to arsenic mitigation activities(BBS 2010; HRW 2016; Pfaff et al. 2016). Qualitative interviews in 2016 also identified unfilled information demand from regional and local engineers seeking more information to structure their decisions about service provision.
Using qualitative interviews and the literature review, the table below summarizes the rapid assessment using the proposed assessment framework. This assessment process is limited and only preliminary, meant as a limited indicative review by category and encourage future assessment processes. But this process identifies potential gaps in data availability and access at different institutional levels and resulting information asymmetries across institutional levels, specifically between national planning units, municipal engineers and end users. As the data suitability question is re-framed away from SDG reporting to include the wider decision-support systems, the extent of the gaps multiple.

13
Table3QualitativeassessmentofinformationsystemrelatedtoSDG6.1inBangladesh.
Data Assessment Component
Context in Bangladesh Rapid Gap Assessment
Institutional Design and
Decision Needs
Department of Environment and Public Health is the primary government agency with responsibility for
public drinking water services and decisions related to implementation strategies. The Prime Minister’s
office manages national policy planning and budgetary resource allocation. The Pourshava and Union level committees and municipal staff make
decisions about placement of public water infrastructure related to community requests.
International agencies and non-governmental guide resource allocation and research and development.
Individual and household users make daily decisions on consumption between multiple sources, for
multiple uses.
There appears to be gaps between supply and demand of information at the sub-national level,
particularly households and at the municipal levels. Local engineers, union committees and Pourshava officials identified gaps between current information and desired for their decision processes. Qualitative interviews suggest that the local DPHE engineers
make allocation decisions in the absence of information related to poverty, existing coverage and water quality risks. National level decisions-makers identified gaps in temporal coverage and frequency for project and budgetary allocation. Households are
at biggest risk for making consumption decisions with low levels of certainty on water quality status.
Definition and Standards
The Government SDG monitoring plan defines the indicator as “Proportion of the population using safely
managed drinking water services.” (GoB 2016) There are varying methods and definitions of “safe”
water including microbial and chemical contaminants.
Definitional gaps remain to standardize monitoring of the new multi-factors of SDG framework. Preliminary GoB meetings in November 2016 suggest plans to use the guidance notes from UN Stats and JMP to define indicators. Definitions for “safe” weren’t fully
defined in GoB documents. There are national water quality standards used to define quality thresholds
for arsenic. Additional elements of “safely managed” were not yet defined or standardized in GoB
documents.
Measurement System
National indicators are derived from BBS Sample Vital Registration System and associated household
surveys, including the MICS and HIES surveys. Different nationally representative household surveys have a high frequency with a total of 24 since 1990, or roughly one per year since 1990. Administrative data is aggregated and reported by DPHE. Water quality, specifically arsenic, is monitored at time of
installation for public water points. Academic studies provide more spatially robust studies but are not
incorporated to national data bases.
No significant gaps in annual national household surveys. Administrative data from DPHE is available
once a year in summary reports, but data inputs require more careful analysis. Water quality data is only reported for newly installed public water points and has been identified as the greatest data gap for
households. Academic and BBS papers identify significant measurement gaps in water quality and
infrastructure functionality. There are no clear aggregated data points on around affordability.
Reporting/ Aggregation
There are multiple data bases available online, including the National Water Resource Data Base
from WARPO that archives data sets; the BBS Statistical Yearbook of Bangladesh and the BBS GIS data portal; the DPHE Water Point Mapper; and the Global JMP Bangladesh Drinking Water Statistics.
DPHE engineers also reported that there are significant gaps between departments in sharing and
aggregating similar data. Within the department, specifically at the sub-national level, various weekly reports are filed but not aggregated to a central data
system. DPHE is developing a system for mobile data submission and online reporting to improve
availability of administrative data. Water quality labs are located across the country but data is not
systematically reported or aggregated.
Accessibility
Legal decrees require data archiving for all water-related ministerial work with WARPO. Public
information laws are also in place to mandate data sharing. Interviews suggest these are not enforced. Future work can evaluate the procedures to access
CEGIS, LGED, WARPO, DPHE and WASA data sets.
DPHE is building a data platform to link administrative data with population and macro
indicators. This is not yet available at time of report. Ease and cost of access varies across data sets.
Greater availability of hydro-climatic data than drinking water data. Unclear what administrative
data is collected and utilized as not available publicly.

14
Reconciling data sources For official SDG reporting, JMP is moving towards a model of data collection that integrates multiple sources of data to generate national indicators. This requires new approaches to data standardization, sustained accessibility and cost-effective reconciliation software (WHO/UNICEF 2017).4 As seen in the figure below, there are a variety of sources of data to explore in relation to expanding the frontier of monitoring and decision systems for SDG 6.1. Although many of them collected for specific actors or functions outside official statistics platforms, they present opportunities for reconciliation and value to a multi-user system. Although household surveys are likely to remain the primary source of SDG 6.1 data for most countries, especially those like Bangladesh with largely informal and unregulated service systems, the potential for new data sources and cost-effective reconciliation warrants a systematic review. The table, and review of Bangladesh measurement needs in previous sections, identify the specific opportunity, with some standardization, to use administrative data from existing government processes. These methods are currently being developed by JMP in several countries piloting data reconciliation of regulatory and administrative information, however not in Bangladesh. In 2010, WaterAid in collaboration with JMP and participation from national statisticians, identified the potential for of data reconciliation in four African countries to improve outcome measurements. The meeting participants identified limitations to this approach in the lack of standardized definitions across data sources, such as access which was often confused with use rates. They also identified challenges around transaction costs for each round of reconciliation. The technology for “big data” automated reconciliation has evolved significantly since the WaterAid conference. New companies created by data scientists now automated the merges using machine learning techniques. Once consistent and repeated data is identified, automated software systems ingest, parse, match, reconcile, configure and aggregate master records. The challenge is to identify data sets that are produced repeatedly in the same format and under the same definition across producers, and in countries like Bangladesh, digitized.
4This paper was originally written before the advances in the JMP methodology and sought to identify and demonstrate the potential for data reconciliation using evolving automated software algorithms used in the health sector.

15
Table4Inventoryofdatacollectiontoolsandrelatedliteraturerelatedtopilotingorinnovationsaroundthesetechnologies.
Tool Summary
Type of Data Collected Type of Data Collection Tools
Small Sample of Overall Examples and Cases
Household Surveys
Harmonized questions at household level on source of drinking water, time to collect
water, expenditure and household income,
demographic characteristics, responsible household
member collecting water and water treatment
Demographic and Health Surveys (DHS), Multiple Indicator Cluster Surveys
(MICS), World Health Surveys (WHS), Census
data, Living Standard Measurement Surveys
(LSMS) and Sample Vital Registration System
(SRVS)
Joint Monitoring Programme (JMP); UNICEF; WHO; United States Agency for International
Development (USAID); The World Bank. (WHO/UNICEF 2017)
Sample Vital Registration System (SRVS) in Bangladesh. (BBS 2011)
Automated Sensors
Flow data, aquifer monitoring, consumption data, payment
data
Real-time automated sensors for piped and
pump systems.
OxWater, SWEETSense, M-Water, Vergnet Hydro, Flygt MultiSmart
Xylem (Colchester et al. 2014; Nagel et al.
2015)
Geospatial
Geolocated point data on service provision
infrastructure and high spatial resolution distribution of
populations
Water Point Mapping Water Audit Surveys
Network Mapping
WPDx, Akvo, M-Water, REACH, (Fisher et al. 2016; Susanna
Goodall, Trevett, and Matua 2016; WaterAid 2010; WPDx 2015)
Satellite Imagery Infrastructure mapping, land use and population
settlement mapping.
NASA SWOT and TRIMM ORNL automated infrastructure
and population mapping (Bain et al. 2014; Tollefson 2017)
Crowd sourcing
Functionality, reliability, institutional performance,
water quality
Open-Government platforms, web markup
languages, open algorithms
Citizen science
Open Street Maps; 311 NYC Service Requests; (NYC, 2012)
Administrative Data
Utility and Service Provider Data
Metering, administrative records, management information systems,
water quality tests, water level sensors Investment and operation records, construction reports, maintenance reports
IBNET (van den Berg and Danilenko 2010; IBNET Toolkit
2016) OxWater, SweetSense (Colchester
et al. 2014; Thomas et al. 2013) Smart Water Systems- Hardware
and software (Naphade et al. 2011; Water 2016)
Government Records
Public expenditure data, engineering reports,
regulatory enforcement records, municipal reports, water quality tests and lab
data
System of Environmental and Economic Accounting (UNDESA
2012) IMIS (Wescoat, Fletcher, and
Novellino 2016)
Mobile Phone Data
Call records, movements data, and transaction data
Mobile transaction records, targeted surveys, location-based analysis,
user records,
Orange-Senegal D4D climate challenge. Haiti Digicel cholera
(Bengtsson et al. 2011; Finger et al. 2016)
Private Company
Data
Water quality from industry, water consumption rates
Open Algorithms to generate indicators from company data without
access data base directly
SAP/Oracle Microsoft Azure
Food/Beverage/Textile Companies

16
Reconciliation of administrative data, whether automated or manual, is feasible in Bangladesh and there are models to follow. Since 2009, the Government of India’s National Rural Drinking Water Programme (NRDWP) has provided annual disaggregated updates to population data that are linked to water service delivery, institutional performance and water quality data. The Indian Integrated Management Information System (IMIS) demonstrates that this approach to data aggregation and reconciliation can be achieved at scale without advanced machine learning software. IMIS provides a web-based data platform which focuses on documenting service delivery and institutional performance at sub-state levels to inform policy and support citizen-to-government accountability. The system intakes updated population data to compare with administrative data that reports progress of government investment projects and water quality results, providing spatially comparable indicators of efficient delivery of safe water services (Wescoat, Fletcher, and Novellino 2016).
The Government of Bangladesh is already moving towards more advanced digital water-MIS systems and could build on these comparative experiences to advance the reconciliation of administrative data around infrastructure planning, financing, implementation and performance efficiency. The existing annual DPHE water point status is one place to start to this system, and reflects potential for more rigorous standardized reporting. Across the levels of water service delivery and use, there are opportunities to build in new data inputs, as summarized in the figure below. The level that appears to have the most opportunity for data reconciliation tools is the sub-national level with municipal civil servants, local piped water utilities and private regulated tubewell drillers and vendors. Additional areas of opportunity would be at the national level with policy makers and national budget documentation.
Figure5Thisgraphicoutlinesthelevelsofdecision-makersandpotentialforrelatedadministrativedata.

17
Conclusion Bangladesh’s unique arsenic prone hydro-geology, high population density, and economic limitations converge to create levels of uncertainty and exposure to unsafe drinking water with few historical precedents on effective responses. To address that uncertainty, this paper systematically identifies opportunities to derive additional value from existing data resources and more effectively underpin action-situations and multi-level decisions about safely managed drinking water services. Automated big (and little) data reconciliation software provides an opportunity to efficiently multiple value of existing resources by integrating and aggregating data sources across multi-level reporting, measurement and implementation processes, as seen in the Indian Integrated Management Information System (IMIS). By seeking an adaptive approach to determining what measurements matter this paper tests a pragmatic six component assessment process, accompanied by existing best-practice tools. This includes delineating the institutional processes and responsibilities; mapping decision points and action-situations to maximize value-of-information; aligning definitions and standards; inventorying what is currently measured; determining extent of reporting or aggregating what is measured; and profiling accessibility and data openness.
By applying this to Bangladesh, the paper identifies the potential for aggregation of administrative data generated mostly by local and sub-national actors, recognizing potential limitations that these records exist but are not digitized. The Government is already producing annual water point status reports with information generated by district engineers and is in the process of releasing a new management information system to increase system-wide tracking of government investments and infrastructure development. This builds on current water point mapping systems. There was clear demand from district and union officials seeking more integration of this information with their decision processes to optimize allocation of safe water points, specifically to vulnerable and at-risk populations. The analysis found gaps in what is being measured, specifically water quality at time of installation of new water points in rural settings. Further analysis is required to determine if there is potential for reconciliation of water quality tests in government labs. The key challenge identified for data reconciliation remains the availability of standardized, digitized and consistently collected data generated by different actors. This is also limited by the small proportion of rural water points that are publicly or formally managed, as the private ones are informal management systems without consistent records.
There is an opportunity within the SDG political window to advance the information system that underpins safely managed drinking water, but it requires moving away from a linear indicator based monitoring framework only using household survey data. Instead it encourages multi-level data collection and aggregation, from existing sources and new sources, including automated sensors, administrative data and more consistent water quality testing.

18
Works Cited Bain, R et al. 2014. “Fecal Contamination of Drinking-Water in Low- and Middle-Income Countries: A Systematic
Review and Meta-Analysis.” Plos Medicine 11(5): 23. http://www.plosmedicine.org/article/fetchObject.action?uri=info:doi/10.1371/journal.pmed.1001644&representation=PDF.
Bain, R. E S, J. A. Wright, E. Christenson, and J. K. Bartram. 2014. “Rural: Urban Inequalities in Post 2015 Targets and Indicators for Drinking-Water.” Science of the Total Environment 490(2014): 509–13. http://dx.doi.org/10.1016/j.scitotenv.2014.05.007.
Bartram, Jamie et al. 2014. “Global Monitoring of Water Supply and Sanitation: History, Methods and Future Challenges.” International journal of environmental research and public health 11(8): 8137–65. http://www.mdpi.com/1660-4601/11/8/8137/htm.
BBS. 2010. 1 Multiple Indicator Cluster Survey 2009 Volume 1: Technical Report. Bangladesh Bureau of Statistics. ———. 2011. Population and Housing Census: Preliminary Results. Dhaka, Bangladesh. BGS, and DPHE. 2001. “Arsenic Contamination of Groundwater in Bangladesh Vol 4: Data Compilation.” British
Geological Survey Technical Report WC/00/19 4. Blomquist, William. 2006. “Crafting Water Constitutions in California.” In Vincent Ostrom: The Quest to Understand
Human Affiairs, , 1–40. Bradley, David J, and Jamie K Bartram. 2013. “Domestic Water and Sanitation as Water Security: Monitoring,
Concepts and Strategy.” Philosophical Transactions of the Royal Society of London A: Mathematical, Physical and Engineering Sciences 371(2002). http://www.annualreviews.org/doi/pdf/10.1146/annurev-environ-013012-093817.
Carter, Richard C., and Ian Ross. 2016. “Beyond ‘functionality’ of Handpump-Supplied Rural Water Services in Developing Countries.” Waterlines 35(1): 94–110. http://www.developmentbookshelf.com/doi/full/10.3362/1756-3488.2016.008.
Cronk, R, T Slaymaker, and J Bartram. 2015. “Monitoring Drinking Water, Sanitation, and Hygiene in Non-Household Settings: Priorities for Policy and Practice.” International Journal of Hygiene and Environmental Health 218(8): 694–703. http://www.sciencedirect.com/science/article/pii/S1438463915000267.
DPHE. 2016a. “DPHE CircleWise Water Source Status and Coverage June 2016.” http://www.dphe.gov.bd/download/June 2016.pdf.
———. 2016b. Urban Water Supply Status. http://www.dphe.gov.bd/index.php?option=com_content&view=article&id=93&Itemid=102 (July 1, 2017).
Fischer, Alex et al. Achieving and Sustaining Safely Managed Drinking Water in Bangladesh Provisional Findings from a Water Audit in Matlab. Dhaka, Bangladesh.
Foster, Tim. 2013. “Predictors of Sustainability for Community-Managed Handpumps in Sub-Saharan Africa: Evidence from Liberia, Sierra Leone, and Uganda.” Environmental Science and Technology 47(21): 12037–46.
Gallaher, Samuel, and Tanya Heikkila. 2014. “Challenges and Opportunities for Collecting and Sharing Data on Water Governance Institutions.” Journal of Contemporary Water Research & Education 153(1): 66–78. http://dx.doi.org/10.1111/j.1936-704X.2014.03181.x.
van Geen, A et al. 2006. “Targeting Low-Arsenic Groundwater with Mobile-Phone Technology in Araihazar, Bangladesh.” Journal of Health, Population, and Nutrition 24(3): 282–97. http://www.ncbi.nlm.nih.gov/pmc/articles/PMC3013249/.
Geen, A Van et al. 2003. “Spatial Variability of Arsenic in 6000 Tube Wells in a 25 Km 2 Area of Bangladesh.” 39(5): 1–16.
van Geen, Alexander et al. 2014. “Comparison of Two Blanket Surveys of Arsenic in Tubewells Conducted 12 Years Apart in a 25 Km 2 Area of Bangladesh.” Science of the Total Environment 488–489: 484–92. http://dx.doi.org/10.1016/j.scitotenv.2013.12.049.
Van Geen, Alexander et al. 2014. “Comparison of Two Blanket Surveys of Arsenic in Tubewells Conducted 12years Apart in a 25km2 Area of Bangladesh.” Science of the Total Environment 488–489(1): 484–92.
George, Christine Marie, Joseph H Graziano, Jacob L Mey, and Alexander van Geen. 2012. “Impact on Arsenic Exposure of a Growing Proportion of Untested Wells in Bangladesh.” Environmental health : a global access science source 11(1): 7. http://www.pubmedcentral.nih.gov/articlerender.fcgi?artid=3334680&tool=pmcentrez&rendertype=abstract.
GoB. 2016. SDG DATA Gap After Workshop 2016. Hope, Robert, and Michael Rouse. 2013. “Risks and Responses to Universal Drinking Water Security.” Philosophical
Transactions of the Royal Society 371(2002): 22.
19
http://rsta.royalsocietypublishing.org/content/roypta/371/2002/20120417.full.pdf. HRW. 2016. Nepotism and Neglect: The Failing Response to Arsenic in the Drinking Water of Bangladesh’s Rural
Poor. https://www.hrw.org/sites/default/files/report_pdf/bangladesh0416web_0.pdf. Hubbard, Douglas W. 2007. How to Measure Anything : Finding the Value Of “intangibles” in Business. Hoboken,
N.J.: John Wiley & Sons. Hutton, Guy. 2012. Monitoring “Affordability” of Water and Sanitation Services after 2015: Review of Global Indicator
Options. IEAG, U N. 2014. A World That Counts, Mobilising the Data Revolution for Sustainable Development. ed. C
Melamed. New York: United Nations Secretary-General Office. http://www.undatarevolution.org. Johnston, Richard et al. 2014. “Enhancing Arsenic Mitigation in Bangladesh: Findings from Institutional,
Psychological, and Technical Investigations.” Science of the Total Environment 488–489(1): 477–83. http://www.sciencedirect.com/science/article/pii/S0048969713014472 (April 13, 2016).
Kinniburgh, D.G (British Geological Survey), and P.L (British Geological Survey) Smedley. 2001. 1 Arsenic Contamination of Groundwater in Bangladesh. http://www.bgs.ac.uk/research/groundwater/health/arsenic/Bangladesh/reports.html.
Lancet, The. 2014. “Water and Sanitation: Addressing Inequalities.” The Lancet 383(9926): 1359. http://dx.doi.org/10.1016/S0140-6736(14)60665-6.
Leidel, Marco et al. 2014. “Supporting Decisions in Water Management by Exploring Information and Capacity Gaps: Experiences from an IWRM Study in the Western Bug River Basin, Ukraine.” Environmental Earth Sciences 72(12): 4771–86. http://search.proquest.com/docview/1642619904?accountid=13042.
Levy, Marc. 2017. Getting the Most out of SDG Data Investments A Guide to Increasing Value by Focusing on Decision Needs and Portfolio Design.
Madajewicz, Malgosia et al. 2007. “Can Information Alone Change Behavior? Response to Arsenic Contamination of Groundwater in Bangladesh.” Journal of Development Economics 84(2): 731–54. http://www.sciencedirect.com/science/article/pii/S030438780600201X.
Mason, Nathaniel, and Roger Calow. 2012. Water Security: From Abstract Concept to Meaningful Metrics. London: Overseas Development Institute. http://www.odi.org/sites/odi.org.uk/files/odi-assets/publications-opinion-files/7865.pdf.
Mcarthur, J M et al. 2008. “How Paleosols Influence Groundwater Flow and Arsenic Pollution : A Model from the Bengal Basin and Its Worldwide Implication.” Water Resource Research 44: 1–30.
McGinnis, Michael D. 2011. “An Introduction to IAD and the Language of the Ostrom Workshop: A Simple Guide to a Complex Framework.” Policy Studies Journal 39(1): 169–83. http://search.ebscohost.com/login.aspx?direct=true&db=bth&AN=58120280&site=ehost-live.
Ostrom, E. 2010. “Institutional Analysis and Development: Elements of The Framework in Historical Perspective.” In Historical Developments and Theoretical Approaches in Sociology, ed. Charles Crothers. Encyclopedia of Life Support Systems (EOLSS).
Ostrom, Elinor. 2005. Princeton paperbacks Understanding Institutional Diversity. Princeton: Princeton University Press.
———. 2010. “Beyond Markets and States: Polycentric Governance of Complex Economic Systems.” American Economic Review 100(3): 641–72. http://www.aeaweb.org/articles.php?doi=10.1257/aer.100.3.641.
Pahl-Wostl, C. 2009. “A Conceptual Framework for Analysing Adaptive Capacity and Multi-Level Learning Processes in Resource Governance Regimes.” Global Environ. Change 19(3): 354.
Pfaff, A, A Schoenfeld, K M Ahmed, and A Van Geen. 2016. “Reduction in Exposure to Arsenic from Drinking Well-Water in Bangladesh Limited by Insufficient Testing and Awareness.” Journal of Water, Sanitation and Hygiene for Development (8086). http://www.ldeo.columbia.edu/~avangeen/Pfaff_WashDev_accepted_ss.pdf.
Rahman, Mustafizur, Towfiqul Islam Khan, Zafar Sadique, and Mostafa Amir Sabbih. 2015. Addressing the Deficits: An Action Plan for Data Revolution in Bangladesh. Dhaka. http://southernvoice.org/wp-content/uploads/2016/08/SV-OP-34.pdf.
Sachs, J, S Badiee, E Giovannini, and R Chen. 2015. “The Data Revolution for Sustinable Development.” Project Syndicate.
Shepherd, Keith et al. 2015. “Development Goals Should Enable Decision-Making.” Nature 523(7559): 152–54. Slaymaker, Tom, and Rick Johnston. 2016. “Monitoring Safely Managed Drinking-Water Services in the 2030
Agenda.” In Stockholm: World Water Week. http://programme.worldwaterweek.org/event/5846. UNICEF. 2014. Mid-Term Review, Government of Bangladesh, UNICEF Country Program 2012-16.
https://www.unicef.org/evaldatabase/files/WASH_SHEWA-Bangladesh_health_impact_eval.pdf.
20
Water, U N. 2015. Consolidated Metadata Note from UN Agencies for SDG 6 Indicators on Water and Sanitation. UN Water. http://www.unwater.org/fileadmin/user_upload/unwater_new/docs/Consolidated metadata note from UN agencies for SDG 6 indicators_v2015-09-04.pdf.
Wescoat, J. L., S. Fletcher, and M. Novellino. 2016. “National Rural Drinking Water Monitoring: Progress and Challenges with India’s IMIS Database.” Water Policy 18: 1–18. http://wp.iwaponline.com/cgi/doi/10.2166/wp.2016.158.
White, Gilbert F., David J. Bradley, and Anne U. White. 1972. 80 Bulletin of the World Health Organization Drawers of Water; Domestic Water Use in East Africa. Chicago,: University of Chicago Press.
WHO. 2009. Water Safety Planning for Small Community Water Supplies Step-by-Step Risk Management Guidance for Drinking-Water Supplies in Small Communities. Geneva, Switzerland.
———. 2012. GLAAS 2012 Report. UN-Water Global Analysis and Assessment of Sanitation and Drinking-Water. Geneva. http://www.un.org/waterforlifedecade/pdf/glaas_report_2012_eng.pdf.
WHO/UNICEF. 2017. Safely Managed Drinking Water - Thematic Report on Drinking Water 2017. Geneva, Switzerland. https://washdata.org/report/jmp-2017-tr-smdw.
WHO, and UNICEF. 2015. JMP Green Paper: Global Monitoring of Water, Sanitation and Hygiene Post-2015. http://www.wssinfo.org/fileadmin/user_upload/resources/JMP-Green-Paper-15-Oct-2015.pdf.