political institutions, lobbying and corruption
TRANSCRIPT
Journal of Institutional Economics (2017), 13: 4, 917–939C© Millennium Economics Ltd 2017. This is an Open Access article, distributed under the terms of the Creative Commons Attribution licence(http://creativecommons.org/licenses/by/4.0/), which permits unrestricted re-use, distribution, and reproduction in any medium, provided theoriginal work is properly cited. doi:10.1017/S1744137417000108First published online 4 April 2017
Political institutions, lobbying andcorruption
N A U R O F . C A M P O S∗
Brunel University London, London, UK, ETH-Zurich and IZA-Bonn
F R A N C E S C O G I O V A N N O N I∗∗
University of Bristol, Bristol, UK
Abstract. Although firms use various strategies to try to influence governmentpolicy, with lobbying and corruption chiefly among them, and politicalinstitutions play an important role in determining policy choices, very littleresearch has been devoted to these topics. This paper tries to fill this gap. Usingcross-country enterprise-level data, it investigates (1) the effect of a key politicalinstitution, namely electoral rules, on the probability that a firm engages inlobbying activities and (2) the impact of lobbying on influence, accounting forcorruption and political institutions. The main conclusion is that lobbying is asignificantly more effective way of generating political influence than corruption,and that electoral rules are a key mediating political institution. Our baselineestimate is that the probability of influencing government policy is 16% higher forfirms that are members of lobbying groups than for those firms that are not.
1. Introduction
One of the main lessons from the burgeoning political economy literatureis that organized special interest groups (Bertrand et al., 2014) cruciallyaffect how economic policies are designed, agreed upon and implemented.Moreover, the political economy literature stresses the importance of politicalinstitutions in shaping the policy making process (Persson and Tabellini, 2002).It seems therefore natural to enquire whether special interests can legitimatelyorganize themselves and, in so doing, whether they can overcome other moreindividual, atomistic and direct methods, such as corruption, to exert influence ongovernment policies. It is important also to understand how this choice dependsupon political institutions.
While the economics literature on lobbying is vast, the relationship betweenlobbying, corruption and political institutions, such as electoral rules, has notbeen studied extensively. In this paper, we take the view that an important reason
∗Email: [email protected]∗∗Email: [email protected]
917
https://www.cambridge.org/core/terms. https://doi.org/10.1017/S1744137417000108Downloaded from https://www.cambridge.org/core. IP address: 65.21.228.167, on 21 Nov 2021 at 03:21:15, subject to the Cambridge Core terms of use, available at

918 NAURO F. CAMPOS AND FRANCESCO GIOVANNONI
may be the lack of a clear-cut distinction between lobbying and corruption,between the general phenomenon of special interests trying to gain influencewith parts of the public sector and some of its special manifestations.
There are of course ways other than lobbying and corruption to obtaininfluence on government policies. Faccio (2006) shows for example how firmscan obtain political influence by having direct relationships with politicians.
The Grossman and Helpman (1994) model is probably the most influentialmodel of lobbying in economics and it conceptualizes lobbying as the provisionof resources to a policy maker. Thus, if one interprets these resources not ascampaign contributions but as bribes, one could argue that this is not a model oflobbying but a model of corruption. Indeed, Coate and Morris (1999) or Yalcinand Damania (2005) are but two examples of this interpretation.1
The vast majority of the empirical evidence is based on the US experiencewhere exactly what constitutes lobbying is commonly understood, in large partbecause lobbying is highly regulated. The problem is that such evidence canthrow little light on the interaction between lobbying and political institutions,simply because the latter do not vary sufficiently across US states nor over time.This paper tries to address this imbalance by studying the relationship betweenlobbying, corruption and political institutions, focusing on electoral rules across26 Central and Eastern European countries.
We build upon the distinction proposed by Harstad and Svensson (2011)where lobbying consists in seeking influence with policy makers while corruptionconsists in seeking influence with policy enforcers or bureaucrats. Interestingly,discretion is on the side of policy makers, and rules and their enforcement is onthe side of bureaucrats. Trying to influence ‘rule enforcers’ is often illegal, whiletrying to influence ‘rule makers’ is not. Our data allow us to take this distinctionseriously in a cross-country context and to link them with a significant literaturethat studies the relationship between political corruption and electoral rules. Acrucial difference between our analysis and the literature on political corruptionis that the latter uses country-level measures of corruption that tend to confuseactivities aimed at politicians, which we would define as lobbying, with thoseaimed at bureaucrats which we define as corruption. This is not a semanticdifference but a very substantial one.
The main contribution of this paper is to put forward a framework andattendant evidence in which the different roles of corruption and lobbying arestudied conditional on a set of political institutions. We focus on the variousways in which elections are organized (‘electoral rules’) as our main politicalinstitution of interest.
1 For surveys of the literature on lobbying, see among others Austen-Smith (1997), De Figueiredo andRichter (2014), Drazen (2000), Grossman and Helpman (2001), Lowery and Gray (2004), Macher andMayo (2015), Mitchell and Munger (1991), Persson and Tabellini (2002), Potters and Sloof (1996), andVan Winden (2004).
https://www.cambridge.org/core/terms. https://doi.org/10.1017/S1744137417000108Downloaded from https://www.cambridge.org/core. IP address: 65.21.228.167, on 21 Nov 2021 at 03:21:15, subject to the Cambridge Core terms of use, available at

Political institutions, lobbying and corruption 919
Electoral rules have received considerable attention from economists (cf.Persson et al. 2003 and references therein), which tends to focus on two ofits key features, namely the size or magnitude of the electoral districts and theuse of open lists of candidates. The magnitude of the electoral district refers to thenumber of politicians elected in a typical electoral district. One can conjecturethat there are greater incentives for firms to be members of lobbying groupswhen fewer officials are to be elected (or, in other words, the smaller the typicalelectoral districts are). The open/closed-list feature of an electoral system reflectsthe extent of the influence that general voters have vis-a-vis party members andofficials. Closed lists give general voters less influence, and one can conjecturethat under certain conditions discussed in detail in section 2 below, give firmsmore incentives to be members of lobbying groups.
Our main findings are as follows:
(1) Lobbying is significantly more likely, and corruption less likely, when theelectoral system features smaller electoral districts and open lists.
(2) The interaction between district magnitude and ballot structure is complex aswe find lobbying may become more prevalent as district magnitude increasesunder closed lists.
(3) Lobbying is a more effective instrument for political influence than corruption.Our baseline estimate is that the probability of influencing government policy(the marginal effect at the mean) is 16% higher for firms that are members oflobbying groups than for those firms that are not members of lobbying groups.
(4) The enterprise-level data set allows us to isolate the role of these politicalinstitutions by controlling for firm-level features. We find, in line with previousliterature, that older, larger and foreign-owned firms in more democraticcountries are more likely to engage in lobbying activities.
The paper is organized as follows. In section 2, we articulate the theoreticalunderpinnings for our empirical analysis. In section 3, we describe the data andeconometric methodology, and discuss our measurement choices (with emphasison the lobbying membership variable, which is central to this analysis). Section 4presents and discusses our econometric results. Section 5 concludes.
2. Theoretical underpinnings
The objective of this paper is to identify empirically the impact of differentelectoral institutions on lobbying activity and to determine whether lobbyingactivity is indeed effective in influencing government policy decisions. Ourcontribution is to do this by defining lobbying as influence or activities thatare directed at rule makers as opposed to corruption, which is influence aimedat rule enforcers. This is important because it implies a novel way of measuringlobbying and corruption. In particular, our measures of lobbying and corruptionare not based on country-level surveys where respondents are asked for thegeneral level of corruption in a country and don’t distinguish between lobbying
https://www.cambridge.org/core/terms. https://doi.org/10.1017/S1744137417000108Downloaded from https://www.cambridge.org/core. IP address: 65.21.228.167, on 21 Nov 2021 at 03:21:15, subject to the Cambridge Core terms of use, available at

920 NAURO F. CAMPOS AND FRANCESCO GIOVANNONI
and corruption in the way we do, but on firm-level data where what constituteslobbying and what constitutes corruption are much more clearly identified.
The danger with country-level surveys is that if these measures fail todistinguish between lobbying and corruption, and if these two phenomena aresubstitutes (as suggested for instance by Campos and Giovannoni 2007), thenany identified relationship between these measures and political institutions ispotentially spurious. The confusion is one that is frequently underestimated inthe literature: Treisman (2007) surveys the empirical literature with regard to therelationship between political institutions and corruption and points out that themeasures of corruption used (country-level perceptions of corruption indicators)can include both what we define as lobbying and what we define as corruption.For example, both Persson et al. (2003) and Chang and Golden (2007) study therelationship between different characteristics of electoral rules and corruption ina cross-country setting, but their survey-based measure of corruption capturesthe two levels and is vulnerable to our critique.2 Chang and Golden are awareof these limitations in the data and write:
Available cross-national measures of corruption do not allow us to distinguishpolitical corruption (that is, illegal activities on the part of elected publicofficials) from other types of corruption, such as corruption by appointedofficials or bureaucrats and the increasingly public phenomenon of corporatecorruption. (p. 5, 2007)
They also provide an analysis based on Italy where the measure used doescapture illegal activity by politicians and addresses our critique, but this is notavailable at cross-country level and is narrower than our definition of lobbying.
Another potential contribution of our analysis is that this is, to our knowledge,the only study that attempts to link lobbying performance and politicalinstitutions to the transition countries of Eastern Europe and former SovietUnion, because they provide something as similar to a natural cross-countryexperiment as we will ever encounter. All these countries started out in 1989with similar levels of political and economic development. The variation in thetype and intensity of political influence in early 1989 across these countries isminimal and the same can be said of their economic liberalization. Since 1989,they have followed radically different economic and political trajectories, whichgenerate the variation we here also exploit to aid with identification.
Given that the objective of this paper is to undertake an empirical studyof the relationship between lobbying and electoral institutions, it is crucial tounderstand what theory predicts are the relationships between these variables.
2 Holburn and Vanden Bergh (2004) are a rare exception in that they recognize that in the context ofthe provision of campaign contributions, it is important to distinguish between those who seek influencewith the legislature directly and those who seek to (indirectly) influence regulatory agencies. This analysisis limited to the US, however.
https://www.cambridge.org/core/terms. https://doi.org/10.1017/S1744137417000108Downloaded from https://www.cambridge.org/core. IP address: 65.21.228.167, on 21 Nov 2021 at 03:21:15, subject to the Cambridge Core terms of use, available at
Political institutions, lobbying and corruption 921
A large literature on electoral rules has emphasized the role of elections as apolitical mechanism for voters or principals to discipline politicians or agents.According to this view, elections are a crucial element in democratic politicalsystems, not just because they help aggregate voters’ preferences but also becausethey help solve both moral hazard and adverse selections issues that voters facewhen dealing with politicians. In the context of lobbying, these issues are thatvoters want to make sure both that candidates who are less amenable to influencefrom lobbyists be elected (adverse selection) and that, once elected, politicianshave as few incentives to make deals with lobbyists as possible (moral hazard).
Moral hazard and adverse selection are conceptually separate issues and whileelections are supposed to be able to deal with them simultaneously, the literaturehas focused on them separately and developed two distinct views of voting:retrospective voting and prospective voting.
In retrospective-voting models, voters determine who to vote for by lookingat politicians’ past performance, so that for our purposes, this class of models inparticularly apt at capturing the aspect of elections as a mechanism for dealingwith the moral hazard problem in lobbying.
In prospective-voting models, on the other hand, voters vote for thosepoliticians who they believe will deliver better outcomes and so these models,for our purposes, are useful for thinking of elections as a way of dealing withthe adverse selection problem in lobbying (Persson and Tabellini, 2002).
This conceptual distinction between prospective and retrospective views ofvoting is extremely useful in interpreting the literature that links electoralinstitutions with lobbying, because how some authors claim certain featuresof an electoral system will affect the decisions of firms in that country to lobby ismore or less explicitly related to whether they emphasize the retrospective or theprospective view of elections. Obviously, these two different interpretations ofwhat voting does in solving agency problems are complementary, not substitutes,and yet the different emphasis leads different authors to theorize sometimes verydifferent consequences in terms of the incentive to lobby for specific electoralrules.3
Persson et al. (2003) implicitly emphasize the retrospective-voting aspect ofelections, because their key question is whether a certain feature of an electoralrule makes politicians more or less accountable for their actions. Thus, they arguethat decreasing district magnitude is associated with more lobbying because asdistrict magnitude decreases, fewer and fewer parties can hope to challenge.
3 The empirical papers discussed in this section claim to study the link between political corruptionand electoral institutions. As discussed above, it is our contention that a more appropriate distinctionis that between lobbying (of which political corruption is a part) and corruption (which is sometimesdescribed as petty corruption by these authors) and that even the distinction between political and pettycorruption is incorrectly captured by the data they use. All these differences notwithstanding, it is clearthat the theoretical predictions this literature makes about the relationship between electoral rules andpolitical corruption would still apply to lobbying as defined here.
https://www.cambridge.org/core/terms. https://doi.org/10.1017/S1744137417000108Downloaded from https://www.cambridge.org/core. IP address: 65.21.228.167, on 21 Nov 2021 at 03:21:15, subject to the Cambridge Core terms of use, available at
922 NAURO F. CAMPOS AND FRANCESCO GIOVANNONI
This gives voters less choice and makes it harder to hold politicians accountable.They also argue that closed-party lists, where voters don’t have a direct choiceof candidates and can only vote for a given party, also reduce accountabilityand make lobbying relatively more effective. The reason is that open-list systemsmake it easier to punish a politician who is being influenced by lobbyists becausevoters can still vote for the same party while punishing that specific politician,something that is harder to do with closed lists.
Kunicova and Rose-Ackermann (2005) also focus on accountability and aretrospective-voting interpretation of elections. Indeed, they agree with Perssonet al. (2003) on the reasons that should make closed-party lists inherently moreamenable to lobbying. They differ on district magnitude, however. Kunicova andRose-Ackermann (2005) argue that electoral systems where district magnitudeis small generate a smaller number of parties and so it is easier to see whois accountable for specific policies, which should lead to fewer incentives forlobbying.
Our view is that this difference in predictions for the relationship betweendistrict magnitude and lobbying can be resolved by noting that, while it mayvery well be that electoral systems leading to a smaller number of parties increasevisibility for the policy-making process, it is also true that if voters have fewalternatives, then it would be relatively difficult for them to punish politicianswho are influenced by lobbyists. Therefore, on balance we believe that in aretrospective view of elections, we should expect lobbying to be associated withclosed lists and small district magnitudes.
Chang (2005) and Chang and Golden (2007) consider the consequences ofthe ‘personal vote’ theory put forward by Shugart et al. (2005).4 This is aninherently prospective-voting interpretation of elections because the emphasisis not on whether a certain feature of an electoral system provides more orless accountability but on whether that certain feature increases or decreasescompetition among candidates and, consequently, whether there is a greater orsmaller need for a given candidate to acquire resources that helps him or hercompete. According to Chang (2005), in open-list systems, voters can expressa preference for specific candidates so that, from an individual candidate’sperspective, competition is mostly with members of his or her own party, while ina closed-list system, where the order of preference is fixed by the party, the focusis on the competition across parties. The incentive to compete against candidatesof one’s own party thus makes candidates in open-list systems more eager toplease lobbyists in order to get the resources they need.
4 Chang (2005) does not measure corruption as a country-level survey variable, but directly collectsdata on indictments for Italian politicians. This is much more likely to separate political corruption frompetty corruption and so, in our view, is more reliable. However, the paper focuses only on Italy (anopen-list system at the time) and doesn’t compare different electoral rules as such but looks at how muchcompetition different legislators face from other members of their own list.
https://www.cambridge.org/core/terms. https://doi.org/10.1017/S1744137417000108Downloaded from https://www.cambridge.org/core. IP address: 65.21.228.167, on 21 Nov 2021 at 03:21:15, subject to the Cambridge Core terms of use, available at
Political institutions, lobbying and corruption 923
Chang and Golden (2007) refine this theory by linking the degree of opennessof party lists with district magnitude. The idea is that in an open-list systemthe incentive to be receptive to lobbying is stronger as district magnitudeincreases, because the number of candidates one has to compete against increases.Conversely, in a closed-list system, the incentive to pander to lobbying interestsincreases as the district magnitude decreases because as the number of candidatesdecreases each candidate internalizes the direct effect he or she has on thecompetition between parties. The conclusion is that we should expect open-list systems to be vulnerable to lobbying and the more so as district magnitudeincreases, while closed-list systems should less vulnerable to lobbying, althoughthis vulnerability should increase as district magnitude decreases.
We summarize our discussion with the following predictions:
1. (Retrospective view of elections)
a. There are greater incentives to lobby with closed-list systemsb. There are greater incentives to lobby when district magnitude is small.
2. (Prospective view of elections)
a. There are greater incentives to lobby in open-list systems.b. In an open-list system, incentives to lobby increase in district magnitude, while
in a closed-list system incentives to lobby decrease in district magnitude.
Thus, theoretical predictions put forward by Persson et al (2003) on the onehand and Chang (2005) and Chang and Golden (2007) on the other are, to someextent, incompatible because of the different retrospective- versus prospective-voting interpretations that they impose on what voting does. As mentioned,from a theoretical perspective, both interpretations are valid and complementeach other, and it is therefore an empirical matter to decide which of the predictedeffects of specific electoral rules on the decision to lobby will prevail.
In our empirical analysis, we consider additional variables both at countryand firm levels. At the country level, we would expect that firms in countriesthat are richer, less unequal and more democratic to rely more on lobbying andless on corruption. At the firm level, we expect that foreign-owned firms wouldtend to lobby more and to corrupt less than domestic firms. With respect to firmsize and age, two possible conjectures emerge. On the one hand, smaller andyounger, less established firms should be less likely to rely on lobbying becausethey don’t have the resources or have not had the time to establish connectionswith the political establishment. On the other hand, one can also conjecturethat it is precisely because of these drawbacks that these firms should be morelikely to join a lobby group that would compensate for this. Finally, we alsoconsider possible interactions between country-level and firm-level variables thatthrow light on possible links, for example, small firms having greater influencein more democratic countries or foreign firms having greater influence in smallercountries.
https://www.cambridge.org/core/terms. https://doi.org/10.1017/S1744137417000108Downloaded from https://www.cambridge.org/core. IP address: 65.21.228.167, on 21 Nov 2021 at 03:21:15, subject to the Cambridge Core terms of use, available at

924 NAURO F. CAMPOS AND FRANCESCO GIOVANNONI
3. Data and methodology
In this section, we describe the main features of the data set and of theeconometric methodology we use to test the hypotheses outlined above. Ourmain data source is the Business Environment and Enterprise Performance Survey(hereafter, BEEPS). This is a survey of firms that was conducted in 2005 by theEuropean Bank for Reconstruction and Development (EBRD) and the WorldBank. It covers more than 8,000 firms which were surveyed using identicalquestionnaires through face-to-face interviews with firm managers and owners.5
The 26 East European countries in our sample are Albania, Armenia, Azerbaijan,Belarus, Bosnia, Bulgaria, Croatia, Czech Republic, Estonia, Georgia, Hungary,Kazakhstan, Kyrgyzstan, Latvia, Lithuania, Macedonia, Moldova, Poland,Serbia, Romania, Russia, Slovakia, Slovenia, Tajikistan, Ukraine and Uzbekistan.
In order to ensure representativeness, statistical offices in each country werecontacted and the total numbers of firms by industry and of employees wereobtained.6 Information was also collected from the statistical offices on theshare of each industrial sector in gross domestic product (GDP) so that, for eachcountry, the composition of the firms in the sample reflects differences in therelative shares of each sector in GDP as well as their firm size distribution.7
Central to our analysis is the question of whether the firm is a member ofa lobbying group. It is possible that firms lobby directly in addition to, or asopposed to, lobbying indirectly through a trade association or lobby group.Unfortunately, our data do not contain information on this. Further, the questionas phrased does not separate trade associations from pure lobby groups whenit is reasonable to expect that their effects may differ as the latter may tend tobe more focused. Contrast say an environmental lobby with a trade associationthat lobbies for a broad range of issues that are of interest to its membership.These issues notwithstanding, ‘membership’ is the standard way of proxying forlobbying in the country-level literature that focuses on the US (Potters and Sloof,1996).
Firms were asked whether or not they were a member of a trade associationat the time of the interview. A positive answer was coded 1, while the value ofzero was given to a negative answer. Approximately 37% of the firms in oursample said they were members of a lobby group. Table A1 in the Appendix hasbasic statistics, variable definitions and sources. The relatively large standarddeviation indicates that these figures vary across countries. Indeed, they range
5 The original questionnaire, a report on sampling and implementation and the data set are availableonline at http://ebrd-beeps.com/
6 The sample is representative of firms operating in the formal sector and thus having a registrationnumber with the central authorities (in other words, it excludes those in the informal sector). The sampleswere drawn for each country independently.
7 At least 10% of the sample was to be in the small and 10% in the large size categories. Firms withonly one employee or more than 10,000 employees were excluded.
https://www.cambridge.org/core/terms. https://doi.org/10.1017/S1744137417000108Downloaded from https://www.cambridge.org/core. IP address: 65.21.228.167, on 21 Nov 2021 at 03:21:15, subject to the Cambridge Core terms of use, available at

Political institutions, lobbying and corruption 925
from a low of 19% of the firms being lobby members in Belarus to 91% ofSlovenian firms answering they were members at the time of the interview.8 Ifwe correlate lobbying membership with the level of per capita GDP (the sourcefor the latter is the Penn World Tables and the data refer to the log of percapita GDP at purchasing power parity) we can see there is a positive correlationbetween lobby membership and per capita GDP, but also that this correlationis not particularly high, at around 0.12. Table A2 in the Appendix presents thecorrelation matrix. It is also worthwhile mentioning that the highest pairwisecorrelations involve per capita GDP: the highest one is 0.79, between per capitaGDP and a measure of democracy.
Note that, using the BEEPS 1999 and 2002 data to compare levels of lobbymembership in 2005 to those in 1999 and 2002, one finds it is rising in theseeconomies. Moreover, this is happening while these countries post positive andhigh GDP growth rates and, as noted by the EBRD (2006), decreasing levels ofcorruption.
The central hypothesis is that political institutions in general, and electoralrules in particular, are a crucial determinant of a decision to lobby. Followingon from the previous section, we collected data on the key relevant politicalinstitutions from the World Bank Database of Political Institutions (DPI: Keefer2005). In particular, the variable ‘closed lists’ reflect whether or not closed listsare used in the electoral system, while ‘mean district magnitude’ reflects the sizeof electoral districts. Keefer (2005) defines mean district magnitude as:
the weighted average of the number of representatives elected by eachconstituency size, if available. If not, we use the number of seats divided bythe number of constituencies, if both are known. If the constituencies arethe provincial or state divisions, we use the number of states or provinces tomake this calculation for as long as we know this number and the number ofseats. If the only information we have on the number of constituencies comesfrom the Inter Parliamentary Union (IPU), and the constituencies are not thestates/provinces, then we use IPU’s number to calculate the Mean DistrictMagnitude for 1995, and leave all unknowns blank.
How lobbying translates into political influence and how it consequentlyaffects firm performance are important issues. The measure of influence we usereflects firms’ perceptions of whether it has influenced the content of laws andregulations affecting their operation. The source is again the 2005 BEEPS database. Our measure is a binary variable coded 1 if the firm answered ‘yes’, andzero if it answered ‘no’. We find that 14% of the firms answer yes to this questionon influence, with the relatively large standard deviation suggesting large cross-country variation: from 3% in Uzbekistan to 33% in Slovenia. The pairwise
8 For the sake of robustness and because Slovenian firms were obliged to be members of a tradeassociation until the late 1990s, we re-estimated all models reported below without these firms and findthat our main results were unaffected (these are available from the authors upon request).
https://www.cambridge.org/core/terms. https://doi.org/10.1017/S1744137417000108Downloaded from https://www.cambridge.org/core. IP address: 65.21.228.167, on 21 Nov 2021 at 03:21:15, subject to the Cambridge Core terms of use, available at
926 NAURO F. CAMPOS AND FRANCESCO GIOVANNONI
correlations between corruption and lobbying, on the one hand, and influence,on the other, are also not high, being around -0.001 for the former and about0.27 for the latter.
From the BEEPS 20005 data set, we also obtain various auxiliary variablesto reflect potentially important characteristics of the firms. These are the yearin which the firm started production, the size of the firm (number of full-timeemployees) and whether or not the largest shareholder is a foreign company.The year in which the average firm started operating is 1989. This is because ofa few old firms in the sample, the oldest dating from 1825. As explained above,the majority of the firms sampled are small privately owned enterprises, so it isunsurprising to see that the share of medium-sized firms, classified in the originalquestionnaire as having more than 50 and less than 249 full-time employees, isaround 19% of the total and that of large firms, with more than 250 full-timeemployees, is about 9%. By the same token, the share of foreign-owned firmsis approximately 12%. We have also added an important country-level controlthat many believe mediates the relationship between political institutions(electoral rules), on the one hand, and lobbying membership and perceivedpolicy influence on the other. That factor is income inequality and here it ismeasured by the Gini coefficient obtained from the UNU-WIDER World IncomeInequality Database (WIID).
The measure of corruption that we favour captures firms’ experience in eachcountry. Our firm-level corruption measure is originally from the BEEPS database. In our analysis, it is the answer to the following question: ‘On average,what percent[age] of total annual sales do firm’s [sic] like yours typically payin unofficial payments/gifts to public officials?’ A crucial indication that we areindeed capturing something inherently different with our measures of corruptionand lobbying is that the simple correlation between these two is very low, at -0.038. Also of interest is that the correlation between corruption and the levelof per capita GDP is negative but not particularly high, at -0.13.
Let us now turn to the econometric methodology. There are two mainquestions of interest: (a) what are the factors that determine the likelihoodof a firm being a member of a lobby group? (b) What is the role of lobbymembership in explaining the probability of a firm seeing itself as influentialvis-a-vis government laws and regulations? As explained above, the dependentvariables in (a) and (b) are dichotomous variables. In question (a), it takes thevalue of 1 if the firm is a lobby member and of zero if not. In question (b) it takesthe value of 1 if the firm perceives itself as influential, zero otherwise.
The focus is on which political institutions affect lobbying and how they doso. Thus we estimate the following maximum likelihood probit equation forlobbying:
P (Lobbyic = 1) = �(β0FSic + β1Ageic + β2Ownerprivic
+ β3Ownerforic + β4GDPc + δPic + πVic) (1)
https://www.cambridge.org/core/terms. https://doi.org/10.1017/S1744137417000108Downloaded from https://www.cambridge.org/core. IP address: 65.21.228.167, on 21 Nov 2021 at 03:21:15, subject to the Cambridge Core terms of use, available at
Political institutions, lobbying and corruption 927
where Lobbyic is a binary variable indicating whether firm i in country c is amember of a lobbying group; FSic is firm size (measured in numbers of full-timeemployees); Ageic is the year the firm started to operate; Ownerprivic is whetherthe firm has private owners; Ownerforic is whether the firm has foreign owners;GDPc is real per capita GDP in the country in which the firm is located; Pic isa vector of political institutions variables (as discussed above, electoral rules);Vic is a vector of auxiliary control variables; and � is the cumulative standardnormal distribution function. In order to minimize omitted variables concerns,we include sector fixed-effects in all regressions we estimate, with the sectordummies representing a coarse way of dealing with the important issue of assetspecificity. Country fixed-effects cannot be included because of their correlationwith the political institutions variable we use but standard errors are clusteredat the country level, and country-level variables such as the level of per capitaincome and the Gini coefficient for income inequality are included throughout.
The next model we estimate is for political influence and uses the followingprobit equation:
P (Influenceic = 1) = �(δ1Lobbyic + ηWic) (2)
where Influence ic is a binary variable indicating whether firm i (in country c)perceives itself as influential vis-a-vis laws and regulations; lobbyic is the binaryvariable defined above; Wic is a vector of auxiliary control variables (includingper capita GDP, firm size and ownership); and � is the cumulative standardnormal distribution function. In order to minimize omitted variables concerns,we include sector fixed-effects in all regressions we estimated and cluster thestandard errors at the country level.
In these latter models on influence, one concern is the potential endogeneityof lobby membership. This refers to the possibility that firms may be more likelyto join lobby groups if and when such groups are perceived to be influential. It istherefore important to address this possibility. We do so using an instrumentalvariables approach by estimating the influence equation (equation 2 above),while treating lobbying as an endogenous variable.
We carry out two different exercises. In the first, we use different instrumentsto assess the potential endogeneity of lobbying or, in other words, whetherthe exogenous or unexplained part of the variation we observe in the lobbyingdecision is a good predictor of policy influence. We use a set of instruments tocapture the strength of civil society: a dynamic measure of ethnic fractionalization(Campos and Kuzeyev, 2007), a measure of natural resources abundance (WorldBank, 2005) and the average number of political protests events in 1989 (fromBruszt et al., 2012). We expect that increases in fractionalization and naturalresource abundance reduce the likelihood of firms joining lobbying groupsand increase the probability of firms using corruption as a preferred meansof influencing government policy. By the same token, we expect the number of
https://www.cambridge.org/core/terms. https://doi.org/10.1017/S1744137417000108Downloaded from https://www.cambridge.org/core. IP address: 65.21.228.167, on 21 Nov 2021 at 03:21:15, subject to the Cambridge Core terms of use, available at

928 NAURO F. CAMPOS AND FRANCESCO GIOVANNONI
Table 1. The effects of electoral rules on lobbying: probit estimates for a sample of firms in26 countries, 2005
(1) (2) (3) (4)
Age of the firm 0.00481∗∗∗ 0.00446∗∗∗ 0.00447∗∗∗ 0.00447∗∗∗
[0.00102] [0.000997] [0.00103] [0.00103]Medium-sized firm 0.522∗∗∗ 0.521∗∗∗ 0.528∗∗∗ 0.528∗∗∗
[0.0397] [0.0390] [0.0404] [0.0404]Large firm 0.780∗∗∗ 0.778∗∗∗ 0.789∗∗∗ 0.789∗∗∗
[0.0565] [0.0554] [0.0577] [0.0577]Foreign-owned firm 0.351∗∗∗ 0.348∗∗∗ 0.347∗∗∗ 0.347∗∗∗
[0.0478] [0.0469] [0.0489] [0.0489]Log per capita GDP 0.00818 0.326∗∗ − 0.00153 − 0.00153
[0.0770] [0.142] [0.0760] [0.0760]Income inequality (Gini) 0.0441∗ 0.0110 0.0456∗ 0.0456∗
[0.0261] [0.0194] [0.0261] [0.0261]Closed list − 1.118∗∗∗ − 1.539∗∗∗
[0.156] [0.197]Mean district magnitude − 0.0093∗∗∗ − 0.0405∗∗∗
[0.00220] [0.0179]Interaction CL x mean district 0.000289∗∗ 0.0408∗∗
[0.000119] [0.0179]Constant − 2.285 − 3.655∗∗ − 3.397∗∗ − 1.858
[1.617] [1.752] [1.704] [1.742]Observations 8,539 8,764 8,214 8,214
Notes: Robust standard errors in brackets, clustered at country level. ∗∗∗p < 0.01, ∗∗p < 0.05, ∗p < 0.10.Dependent variable is a dummy for Lobby Membership, with yes equal to 1, zero otherwise. Sectoralfixed-effects are included in all specifications.
political protests before 1989 to increase the likelihood that firms will lobby anddecrease the probability that they will choose corruption.
The second way we implement instrumental variables in this context is touse our various electoral rules features as instruments for lobbying. This is aparticularly interesting exercise because it allows us to further investigate whetherthe effect of political institutions (electoral rules) on the capacity to influencegovernment policy is mostly direct or mostly indirect, that is, on their ownaccount or through membership in business or trade associations.
4. Econometric results and discussion
In this section, we present and discuss our econometric results. First, weinvestigate whether electoral institutions do indeed affect lobbying in light of thehypotheses discussed above. Second, we study how lobbying generates politicalinfluence and which type of role (direct or indirect) political institutions play.
What are the main factors that determine whether a firm is a member of alobbying group? Which electoral institutions affect lobbying, and how do they
https://www.cambridge.org/core/terms. https://doi.org/10.1017/S1744137417000108Downloaded from https://www.cambridge.org/core. IP address: 65.21.228.167, on 21 Nov 2021 at 03:21:15, subject to the Cambridge Core terms of use, available at

Political institutions, lobbying and corruption 929
Table 2. The effects of electoral rules on lobbying: probit estimates for a sample of firms in26 countries, 2005. Interaction between small firms and democracy
(1) (2) (3) (4)
Age of the firm 0.00471∗∗∗ 0.00433∗∗∗ 0.00436∗∗∗ 0.00436∗∗∗
[0.00104] [0.00101] [0.00104] [0.00104]Medium-sized firm 0.0819 0.0228 0.0250 0.0250
[0.0954] [0.101] [0.103] [0.103]Large firm 0.356∗∗∗ 0.295∗∗∗ 0.302∗∗∗ 0.302∗∗∗
[0.102] [0.107] [0.110] [0.110]Foreign-owned firm 0.345∗∗∗ 0.341∗∗∗ 0.340∗∗∗ 0.340∗∗∗
[0.0481] [0.0471] [0.0492] [0.0492]Log per capita GDP 0.0152 0.347∗∗ 0.0108 0.0108
[0.0753] [0.138] [0.0741] [0.0741]Income inequality (Gini) 0.0404 0.00558 0.0410 0.0410
[0.0255] [0.0189] [0.0215] [0.0215]Interaction small firms and − 0.102∗∗∗ − 0.114∗∗∗ − 0.114∗∗∗ − 0.114∗∗∗
democracy [0.0202] [0.0214] [0.0215] [0.0215]Closed list − 1.304∗∗∗ − 1.754∗∗∗
[0.158] [0.202]Mean district magnitude − 0.00966∗∗∗ − 0.0437∗∗
[0.00215] [0.0178]Interaction CL x mean district 0.000160 0.0439∗∗∗
[0.000118] [0.0178]Constant − 1.643 − 3.149∗ − 2.881∗ − 1.127
[1.587] [1.711] [1.663] [1.704]Observations 8,539 8,764 8,214 8,214
Notes: Robust standard errors in brackets, clustered at country level. ∗∗∗p < 0.01, ∗∗p < 0.05, ∗p < 0.10.Dependent variable is a dummy for Lobby Membership, with yes equal to 1, zero otherwise. Sectoralfixed-effects are included in all specifications.
do it? Tables 1–3 report our results. Our results first suggest that firms are lesslikely to resort to lobbying when district magnitude is larger, a result that iscompatible with the retrospective-voting view of elections. On the other hand,our results suggest that firms are also less likely to lobby when based in countrieswhere the electoral system has closed lists and this result is not compatible witha retrospective-voting view of elections, but it is compatible with the prospectiveview put forward by Chang (2005) and Chang and Golden (2007). Moreover,considering the interaction between district magnitude and closed lists, we obtainthe result predicted by the retrospective view of elections. This is because amongclosed-list electoral systems, our results suggest it is those with the larger districtmagnitude that seem to make firms more likely to lobby. On balance, theseresults suggest to us that only certain aspects of each interpretation of electionscan be confirmed, although the retrospective view seems to enjoy slightly strongersupport.
https://www.cambridge.org/core/terms. https://doi.org/10.1017/S1744137417000108Downloaded from https://www.cambridge.org/core. IP address: 65.21.228.167, on 21 Nov 2021 at 03:21:15, subject to the Cambridge Core terms of use, available at
930 NAURO F. CAMPOS AND FRANCESCO GIOVANNONI
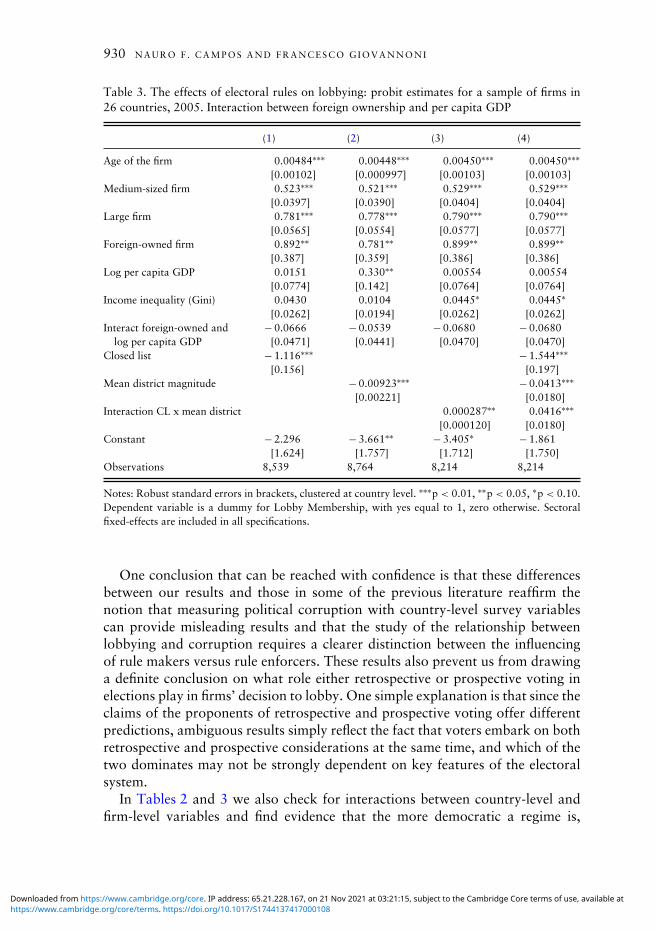
Table 3. The effects of electoral rules on lobbying: probit estimates for a sample of firms in26 countries, 2005. Interaction between foreign ownership and per capita GDP
(1) (2) (3) (4)
Age of the firm 0.00484∗∗∗ 0.00448∗∗∗ 0.00450∗∗∗ 0.00450∗∗∗
[0.00102] [0.000997] [0.00103] [0.00103]Medium-sized firm 0.523∗∗∗ 0.521∗∗∗ 0.529∗∗∗ 0.529∗∗∗
[0.0397] [0.0390] [0.0404] [0.0404]Large firm 0.781∗∗∗ 0.778∗∗∗ 0.790∗∗∗ 0.790∗∗∗
[0.0565] [0.0554] [0.0577] [0.0577]Foreign-owned firm 0.892∗∗ 0.781∗∗ 0.899∗∗ 0.899∗∗
[0.387] [0.359] [0.386] [0.386]Log per capita GDP 0.0151 0.330∗∗ 0.00554 0.00554
[0.0774] [0.142] [0.0764] [0.0764]Income inequality (Gini) 0.0430 0.0104 0.0445∗ 0.0445∗
[0.0262] [0.0194] [0.0262] [0.0262]Interact foreign-owned and − 0.0666 − 0.0539 − 0.0680 − 0.0680
log per capita GDP [0.0471] [0.0441] [0.0470] [0.0470]Closed list − 1.116∗∗∗ − 1.544∗∗∗
[0.156] [0.197]Mean district magnitude − 0.00923∗∗∗ − 0.0413∗∗∗
[0.00221] [0.0180]Interaction CL x mean district 0.000287∗∗ 0.0416∗∗∗
[0.000120] [0.0180]Constant − 2.296 − 3.661∗∗ − 3.405∗ − 1.861
[1.624] [1.757] [1.712] [1.750]Observations 8,539 8,764 8,214 8,214
Notes: Robust standard errors in brackets, clustered at country level. ∗∗∗p < 0.01, ∗∗p < 0.05, ∗p < 0.10.Dependent variable is a dummy for Lobby Membership, with yes equal to 1, zero otherwise. Sectoralfixed-effects are included in all specifications.
One conclusion that can be reached with confidence is that these differencesbetween our results and those in some of the previous literature reaffirm thenotion that measuring political corruption with country-level survey variablescan provide misleading results and that the study of the relationship betweenlobbying and corruption requires a clearer distinction between the influencingof rule makers versus rule enforcers. These results also prevent us from drawinga definite conclusion on what role either retrospective or prospective voting inelections play in firms’ decision to lobby. One simple explanation is that since theclaims of the proponents of retrospective and prospective voting offer differentpredictions, ambiguous results simply reflect the fact that voters embark on bothretrospective and prospective considerations at the same time, and which of thetwo dominates may not be strongly dependent on key features of the electoralsystem.
In Tables 2 and 3 we also check for interactions between country-level andfirm-level variables and find evidence that the more democratic a regime is,
https://www.cambridge.org/core/terms. https://doi.org/10.1017/S1744137417000108Downloaded from https://www.cambridge.org/core. IP address: 65.21.228.167, on 21 Nov 2021 at 03:21:15, subject to the Cambridge Core terms of use, available at

Political institutions, lobbying and corruption 931
the more likely it is that small firms will lobby. This is a reassuring result,because among other things it is compatible with the notion that our measureof lobbying captures attempts to influence rule makers through legal means anddoes not necessarily coincide with political corruption.9 There is considerablyless evidence that foreign firms are either more or less likely to lobby dependingon a country’s level of per capita GDP (Table 3).10 It is also important to notethat accounting for such rich interactions does not substantially change our mainconclusions about political institutions and lobbying: firms that are more likelyto engage in lobbying are those where the electoral system favours open (notclosed) lists and smaller electoral districts.
There are also various interesting findings referring to the controls we use: forexample, we find evidence that older, larger and foreign firms are systematicallymore likely than younger, smaller and domestic firms to be members of a lobbyinggroup. These findings are very much in line with the rest of the literature (Kerret al. 2014). Interestingly, the level of per capita GDP itself also doesn’tseem to have an ambiguous effect on incentives to lobby: this again may bebecause lobbying, as defined here, includes the use of information, campaigncontributions and endorsements.11 This suggests that future work should befocused on building data that further distinguish between these different lobbyingchoices.
One natural question that follows is how effective lobbying is. Table 4examines its importance in terms of the production of political influence. Themain finding is that firms in our sample systematically point to lobbying asa very effective way of exerting political influence. As shown in Table 4, thecoefficient on corruption is never significant and, in a few cases, even suggeststhat corrupt firms are less influential, lending some further support to the notionof substitutability between the two. In terms of firm characteristics, the resultsare also reassuring: we find that older and larger firms tend to see themselves asmore influential, while foreigners and those located in richer countries do notnecessarily see themselves as more influential.12
For two hypothetical firms with same average characteristics, the predictedprobability of influencing government policy (the marginal effect at the mean)
9 It is important to point out that when one replicates the regressions in Tables 1–3, substituting ourmeasure of corruption for our measure of lobbying, we get the result that any electoral institution thatincreases the incentive to lobby in Tables 1–3 decreases the incentive to use corruption.
10 We also find the effects of an interaction term between firm age and political democracy to besimilar to those for firm size (arguably because of the correlation between size and age).
11 However, it is important to note that the main conclusions from Tables 1–3 do not change whenmeasures of corruption are added to the specifications (either firm-based or country-level). We find thecoefficients on these measures are seldom statistically different from zero.
12 When we considered the impact of lobbying and corruption on firm performance, measured assales growth, we found evidence that firms that lobby tend to experience faster growth in their sales thanfirms that use corruption (available upon request).
https://www.cambridge.org/core/terms. https://doi.org/10.1017/S1744137417000108Downloaded from https://www.cambridge.org/core. IP address: 65.21.228.167, on 21 Nov 2021 at 03:21:15, subject to the Cambridge Core terms of use, available at

932 NAURO F. CAMPOS AND FRANCESCO GIOVANNONI
Table 4. The effects of lobbying on political influence: probit estimates for a sample of firmsin 26 countries, 2005
(1) (2) (3) (4)
Age of the firm 0.00594∗∗∗ 0.00627∗∗∗ 0.00560∗∗∗ 0.00570∗∗∗
[0.000913] [0.000994] [0.000923] [0.000927]Medium-sized firm 0.278∗∗∗ 0.268∗∗∗ 0.283∗∗∗ 0.291∗∗∗
[0.0358] [0.0376] [0.0336] [0.0358]Large firm 0.431∗∗∗ 0.460∗∗∗ 0.460∗∗∗ 0.461∗∗∗
[0.0632] [0.0587] [0.0642] [0.0641]Foreign-owned firm 0.233∗∗∗ 0.269∗∗∗ 0.253∗∗∗ 0.241∗∗∗
[0.0812] [0.0739] [0.0805] [0.0832]Lobbying 0.817∗∗∗ 0.786∗∗∗ 0.806∗∗∗ 0.801∗∗∗
[0.0751] [0.0771] [0.0781] [0.0807]Corruption 0.0544 0.0164 0.0164 0.0434
[0.0453] [0.0434] [0.0426] [0.0330]Per capita GDP − 0.095 − 0.159∗∗ − 0.155∗∗ − 0.185∗∗∗
[0.137] [0.0632] [0.0687] [0.0673]Income inequality (Gini) − 0.0109∗ − 0.0117∗ − 0.0104∗ − 0.0114∗
[0.00654] [0.00617] [0.00600] [0.00683]Closed list − 0.200∗ − 0.246∗
[0.114] [0.148]Mean district magnitude − 0.00103∗∗∗ − 0.00248
[0.000199] [0.00917]Interaction CL x mean district − 0.000998∗∗∗ 0.00148
[0.000212] [0.00918]Constant − 0.355 0.318 0.205 0.566
[1.491] [0.839] [0.861] [0.841]Observations 8,135 8,362 7,812 7,812
Notes: Robust standard errors in brackets, clustered at country level. ∗∗∗p < 0.01, ∗∗p < 0.05, ∗p < 0.10.Dependent variable is a dummy for individual firm’s influence on government policy, yes equal to 1, zerootherwise. Sectoral fixed-effects are included in all specifications.
is 16% higher for firms that lobby than for those that do not. This effect isremarkably constant across specifications. Even though the coefficient capturingthe impact of corruption is never statistically significantly different from zero, thepredicted effect of lobbying is always larger than the estimated marginal effectfor corruption.
Thanks to the large number of firms in the BEEPS survey we can also carry outan important robustness check in terms of whether these findings differ acrosssectors. One can conjecture that manufacturing firms would be more likely tochoose lobbying over corruption than, for example, firms in the constructionsector. In order to assess this possibility, we re-estimate the model in Table 4 foras many sectors as the database allows us to differentiate. Our overall findingis that our main conclusions do not change, that is, for most sectors lobbyingmembership is a much-preferred method of obtaining political influence, muchmore so than corruption. Yet there are two noticeable exceptions: wholesale and
https://www.cambridge.org/core/terms. https://doi.org/10.1017/S1744137417000108Downloaded from https://www.cambridge.org/core. IP address: 65.21.228.167, on 21 Nov 2021 at 03:21:15, subject to the Cambridge Core terms of use, available at

Political institutions, lobbying and corruption 933
real estate. For firms in mining, construction, manufacturing, transport, hotelsand ‘others’, lobbying is always more important than corruption in generatingpolitical influence (the coefficient on lobbying is always statistically significantwhile the one on corruption never is). Lobbying is also very effective in producinginfluence for firms in the wholesale and real estate sectors, but now the coefficienton corruption is significant and positive for wholesale and negative for real estate.This is an exciting result because it suggests the possibility that firms use mixedstrategies depending on their main area of economic activity.13
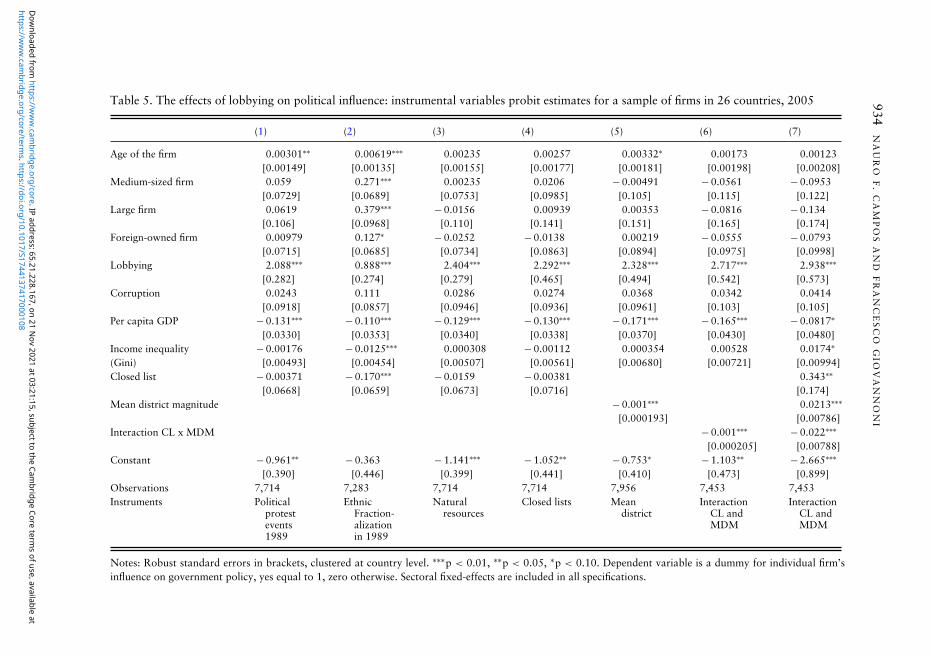
One major concern regarding the results above is reverse causality: that is,that lobbying and political influence may be jointly determined. It may be thecase that lobbying in the influence equation is endogenous because, say, firmsare more likely to join lobby groups when they perceive them to be effective(i.e. influential). To try to deal with this concern, we re-estimate the influenceequation (equation 2) treating lobbying as an endogenous variable and we do soin two different ways as discussed below.
In the first exercise, we use three instruments (Table 5, columns 1 to 3) to checkwhether the exogenous or unexplained part of the variation we observe in thelobbying decision is a good predictor of policy influence. Our three instrumentsare ethnic fractionalization in 1989, natural resources abundance and the averagenumber of political protests in 1989. Examining the first-stage regressions wefind that natural resource abundance in a country and ethnic fractionalizationsignificantly decrease lobbying (interestingly, these have opposite effects oncorruption). The choice of these instruments is also justified in purely statisticalterms, specifically from standard Wald exogeneity tests. The main conclusion isthat there is little evidence that reverse causality affects our baseline results inimportant ways.
In the second exercise, we use the various measures of political institutions(electoral rules) as instruments for lobbying (columns 4 to 7 in Table 5). Thisallows us to investigate whether the effect of electoral rules on influence is director indirect (through lobbying) as well as whether the exogenous or unexplainedpart of the variation we observe in the lobbying decision is a good predictor ofpolicy influence.
We can conclude from columns 4 to 7 that electoral rules seem to exert a muchmore powerful indirect (through lobbying) effect on political influence comparedto its direct effect on political influence. Another way of testing this possibility(available from the authors) is to examine the interaction between lobbying andthe political institutions. We find these interactions to be significant while the
13 One can imagine that lobbying is an ‘offensive strategy’ in that it can wield political influence,which decreases competition and benefits the individual firm. However, a firm may only pay bribesbecause it is forced to do so. Thus, there isn’t a direct benefit to the firm and one should not expect thisto generate political influence. This could be a ‘defensive strategy’, necessary to operate in a politicallycorrupt environment.
https://www.cambridge.org/core/terms. https://doi.org/10.1017/S1744137417000108Downloaded from https://www.cambridge.org/core. IP address: 65.21.228.167, on 21 Nov 2021 at 03:21:15, subject to the Cambridge Core terms of use, available at
934N
AU
RO
F.
CA
MP
OS
AN
DF
RA
NC
ES
CO
GIO
VA
NN
ON
I
Table 5. The effects of lobbying on political influence: instrumental variables probit estimates for a sample of firms in 26 countries, 2005
(1) (2) (3) (4) (5) (6) (7)
Age of the firm 0.00301∗∗ 0.00619∗∗∗ 0.00235 0.00257 0.00332∗ 0.00173 0.00123[0.00149] [0.00135] [0.00155] [0.00177] [0.00181] [0.00198] [0.00208]
Medium-sized firm 0.059 0.271∗∗∗ 0.00235 0.0206 − 0.00491 − 0.0561 − 0.0953[0.0729] [0.0689] [0.0753] [0.0985] [0.105] [0.115] [0.122]
Large firm 0.0619 0.379∗∗∗ − 0.0156 0.00939 0.00353 − 0.0816 − 0.134[0.106] [0.0968] [0.110] [0.141] [0.151] [0.165] [0.174]
Foreign-owned firm 0.00979 0.127∗ − 0.0252 − 0.0138 0.00219 − 0.0555 − 0.0793[0.0715] [0.0685] [0.0734] [0.0863] [0.0894] [0.0975] [0.0998]
Lobbying 2.088∗∗∗ 0.888∗∗∗ 2.404∗∗∗ 2.292∗∗∗ 2.328∗∗∗ 2.717∗∗∗ 2.938∗∗∗
[0.282] [0.274] [0.279] [0.465] [0.494] [0.542] [0.573]Corruption 0.0243 0.111 0.0286 0.0274 0.0368 0.0342 0.0414
[0.0918] [0.0857] [0.0946] [0.0936] [0.0961] [0.103] [0.105]Per capita GDP − 0.131∗∗∗ − 0.110∗∗∗ − 0.129∗∗∗ − 0.130∗∗∗ − 0.171∗∗∗ − 0.165∗∗∗ − 0.0817∗
[0.0330] [0.0353] [0.0340] [0.0338] [0.0370] [0.0430] [0.0480]Income inequality − 0.00176 − 0.0125∗∗∗ 0.000308 − 0.00112 0.000354 0.00528 0.0174∗
(Gini) [0.00493] [0.00454] [0.00507] [0.00561] [0.00680] [0.00721] [0.00994]Closed list − 0.00371 − 0.170∗∗∗ − 0.0159 − 0.00381 0.343∗∗
[0.0668] [0.0659] [0.0673] [0.0716] [0.174]Mean district magnitude − 0.001∗∗∗ 0.0213∗∗∗
[0.000193] [0.00786]Interaction CL x MDM − 0.001∗∗∗ − 0.022∗∗∗
[0.000205] [0.00788]Constant − 0.961∗∗ − 0.363 − 1.141∗∗∗ − 1.052∗∗ − 0.753∗ − 1.103∗∗ − 2.665∗∗∗
[0.390] [0.446] [0.399] [0.441] [0.410] [0.473] [0.899]Observations 7,714 7,283 7,714 7,714 7,956 7,453 7,453Instruments Political
protestevents1989
EthnicFraction-alizationin 1989
Naturalresources
Closed lists Meandistrict
InteractionCL andMDM
InteractionCL andMDM
Notes: Robust standard errors in brackets, clustered at country level. ∗∗∗p < 0.01, ∗∗p < 0.05, ∗p < 0.10. Dependent variable is a dummy for individual firm’sinfluence on government policy, yes equal to 1, zero otherwise. Sectoral fixed-effects are included in all specifications.
https://ww
w.cam
bridge.org/core/terms. https://doi.org/10.1017/S1744137417000108
Dow
nloaded from https://w
ww
.cambridge.org/core. IP address: 65.21.228.167, on 21 N
ov 2021 at 03:21:15, subject to the Cambridge Core term
s of use, available at
Political institutions, lobbying and corruption 935
results for lobbying and for corruption remain unchanged, further supportingthe idea that the effects of political institutions on influence are mostly indirect,through the firm’s choice of membership in lobbying groups.
Both exercises produced strong results that reinforce the finding that lobbyingis a more effective way of generating influence on government policies thancorruption and that the effect of electoral rules on influence occurs mostlythrough lobbying, rather than independently or directly.
5. Conclusions
This paper studies how a firm chooses to influence government policies. Wedifferentiate between corruption and lobbying as two main methods of producinginfluence. In doing so we challenge a commonly held view that these differ mostlyin the means used to obtain influence, while we argue that the fundamentaldifference has to do with where influence is being sought. For us, lobbyingincludes all the actions taken to obtain influence with rule makers whilecorruption includes all the actions taken to influence rule enforcers. We notethat across the globe the latter is seldom legal, while the former is often legal.We provide a conceptual framework in which we show how this distinctionallows us a set of predictions on the relationship between these phenomena andhow they are affected by different political institutional set-ups.
Using 2005 survey data for a large number of firms across 26 countries, weshow that political institutions play a significant role in explaining the decisionto lobby. More specifically, we focus on electoral systems and find that thefirms that are more likely to engage in lobbying are those where the electoralsystem has open lists and smaller districts and that they tend to be older, largerand foreign-owned. Crucially, we find confirmation that lobbying seems to be amuch more effective instrument for political influence than corruption and thiseven in poorer, less developed countries than those normally considered in theliterature. Our baseline estimate is that the probability of influencing governmentpolicy is 16% higher for firms that are members of lobbying groups comparedto those firms that are not with political institutions playing an important role,which is chiefly indirect and magnifies the effect of lobbying. The implicationsof these results for individual firms are straightforward in supporting lobbyinginstead of corruption as the preferred method to effectively influence governmentpolicy. We also note we obtained evidence that lobbying is a stronger predictor offirms’ sales growth than corruption, which further supports the broad directionof such policy implications.
One main challenge for future research on these issues is that while moreprecise data at firm level on corruption is beginning to be available, data onlobbying at the firm level are still very sketchy. We believe that a very importantissue is, for example, that using existing data one cannot distinguish firmsthat lobby indirectly (through a trade association or lobby group) from firms
https://www.cambridge.org/core/terms. https://doi.org/10.1017/S1744137417000108Downloaded from https://www.cambridge.org/core. IP address: 65.21.228.167, on 21 Nov 2021 at 03:21:15, subject to the Cambridge Core terms of use, available at

936 NAURO F. CAMPOS AND FRANCESCO GIOVANNONI
that lobby directly; and nor can one separate trade associations from purelobby groups. Further, we have stressed above the importance of differentiatingbetween lobbying and corruption with respect to their targets rather than themeans used. Once this distinction is better appreciated, the question of howdifferent ways of lobbying perform in specific institutional contexts will gainurgency. On this count, further progress at both theoretical and empirical levelis still needed and would be extremely valuable.
Acknowledgements
We thank Saul Estrin, Roman Horvath, Iiika Korhonnen, Fabrizio Zilibotti, twoanonymous referees and seminar participants at BOFIT (Helsinki), Universityof Paris-Sorbonne, Universidad Complutense de Madrid, Bristol University,University of Reading and Ausschuss fur Entwicklungslander Conference(Zurich) for valuable comments on previous versions. We also would like tothank Branko Milanovic and Torsten Persson for kindly sharing their data withus. The usual disclaimer applies.
References
Austen-Smith, D. (1997), ‘Interest groups: money, information and influence’, in D. Mueller(ed.), Perspectives on Public Choice, Cambridge, UK: Cambridge University Press, pp.296–321.
Bertrand, M., M. Bombardini, and F. Trebbi (2014), ‘Is it whom you know or what youknow? An empirical assessment of the lobbying process’, American Economic Review,104(12): 3885–3920.
Bruszt, L., N. Campos, J. Fidrmuc, and G. Roland (2012), ‘Civil society, institutional changeand the politics of reform: the great transition’, in G. Roland (ed.), Economies inTransition: The Long-Run View, Basingstoke: Palgrave Macmillan, pp.194–221.
Campos, N. and F. Giovannoni (2007), ‘Lobbying, corruption and political influence’, PublicChoice, 131(1): 1–21.
Campos, N. and V. Kuzeyev (2007), ‘On the dynamics of ethnic fractionalization’, AmericanJournal of Political Science, 51(3): 620–639.
Chang, E. (2005), ‘Electoral incentives for political corruption under open-list proportionalrepresentation’, Journal of Politics, 67(3): 716–730
Chang, E. and M. Golden (2007), ‘Electoral systems, district magnitude and corruption’,British Journal of Political Science, 37(1): 115–137.
Coate, S. and S. Morris (1999), ‘Policy persistence’, American Economic Review, 89(5):1327–1336.
De Figueiredo, J. and B. Richter (2014), ‘Advancing the empirical research on lobbying’,Annual Review of Political Science, 17(2): pp.163–185.
Drazen, A. (2000), Political Economy in Macroeconomics, Princeton NJ: Princeton UniversityPress.
EBRD (2006) Transition Report, London: EBRD.Faccio, M. (2006), ‘Politically connected firms’, American Economic Review, 96(1): 369–386.
https://www.cambridge.org/core/terms. https://doi.org/10.1017/S1744137417000108Downloaded from https://www.cambridge.org/core. IP address: 65.21.228.167, on 21 Nov 2021 at 03:21:15, subject to the Cambridge Core terms of use, available at

Political institutions, lobbying and corruption 937
Grossman, G. and E. Helpman (1994), ‘Protection for sale’, American Economic Review,84(4): 833–850.
Grossman, G. and E. Helpman (2001), Special Interest Politics, Cambridge MA: MIT Press.Harstad, B. and J. Svensson (2011), ‘Bribes, lobbying and development’, American Political
Science Review, 105(1): 46–63.Holburn, G. and R. Vanden Bergh (2004), ‘Influencing agencies through pivotal political
institutions’, Journal of Law, Economics and Organization, 20(2): 458–483.Keefer, P. (2005), DPI 2004: Database of Political Institutions, Washington, DC: World Bank,
mimeo.Kerr, W., Lincoln, W. and P. Mishra (2014), ‘The dynamics of firm lobbying’, American
Economic Journal: Economic Policy, 6(4): 343–379.Kunicova, J. and S. Rose-Ackerman (2005), ‘Electoral rules and constitutional structures as
constraints on corruption’, British Journal of Political Science, 35(3): 573–606.Macher, J. and J. Mayo (2015), ‘Influencing public policymaking: firm-, industry-, and
country-level determinants’, Strategic Management Journal, 36(13): 2021–2038.Mitchell, W. and M. Munger (1991), ‘Economic models of interest groups: an introductory
survey’, American Journal of Political Science, 35(2): 512–546.Lowery, D. and V. Gray (2004), ‘A neopluralist perspective on research on organized interests’,
Political Research Quarterly, 57(1): 163–175.Persson, T. and G. Tabellini (2002), Political Economics, Cambridge MA: MIT Press.Persson, T., Tabellini, G. and F. Trebbi (2003), ‘Electoral rules and corruption’, Journal of
the European Economic Association, 1(4): 958–989.Potters, J. and R. Sloof (1996), ‘Interest groups: a survey of empirical models that try to assess
their influence’, European Journal of Political Economy, 12(4): 403–442.Shugart, M., M. Valdini, and K. Suominen (2005), ‘Looking for locals: voter information
demands and personal vote-earning attributes of legislators under proportionalrepresentation’, American Journal of Political Science, 49(2): 437–449.
Treisman, D. (2007), ‘What have we learned about the causes of corruption from ten yearsof cross-national empirical research?’ Annual Review of Political Science 2007, 10(1):211–244.
Van Winden, F. (2004), ‘Interest group behavior and influence’, in C. Rowley andF. Schneider (eds), Readings in Public Choice and Constitutional Political Economy:The Encyclopedia of Public Choice, New York: Springer. pp. 118–129.
World Bank (2005), World Development Indicators, Washington, DC: World Bank.Yalcin, E. and R. Damania (2005), ‘Corruption and political competition’, Washington, DC:
World Bank, mimeo.
https://www.cambridge.org/core/terms. https://doi.org/10.1017/S1744137417000108Downloaded from https://www.cambridge.org/core. IP address: 65.21.228.167, on 21 Nov 2021 at 03:21:15, subject to the Cambridge Core terms of use, available at

938 NAURO F. CAMPOS AND FRANCESCO GIOVANNONI
Appendix
Table A1. Basic statistics, variable definitions and data sources
Variable Mean Std Dev. N Definition and Source
Lobby membership 0.3714 0.4832 9,098 Dummy variable: 1 if firm is a member ofa trade association or lobby group,0 otherwise. Source: BEEPS (2005)
Corruption 1.033 2.467 8,230 Answer to ‘on average, what percentageof total annual sales do firms like yourstypically pay in unofficialpayments/gifts to public officials?’Source: BEEPS (2005)
Influence 0.1404 0.3474 9,093 Dummy variable: 1 if firm answers ‘yes’to whether it has influenced the contentof laws and regulations affecting itsoperation, 0 otherwise. Source: BEEPS(2005)
Age of the firm 15.54 17.46 9,090 Year in which firm started production.Source: BEEPS (2005)
Foreign ownership 0.118 0.323 9,098 Dummy variable: 1 if any foreign firm hasa financial stake in respondent firm,0 otherwise. Source: BEEPS (2005)
Small firm 0.706 0.456 9,097 Dummy variable: 1 if firm has between 2and 49 full time employees,0 otherwise. Source: BEEPS (2005)
Medium-sized firm 0.198 0.398 9,097 Dummy variable: 1 if firm has between50 and 199 full time employees,0 otherwise. Source: BEEPS (2005)
Large firm 0.096 0.295 9,097 Dummy variable: 1 if firm has between200 and above full time employees,0 otherwise. Source: BEEPS (2005)
Closed lists 0.789 0.407 8,548 Dummy variable: 1 if the electoral systemuses closed lists. Source: Keefer (2005)
Mean district magnitude 62.93 16.2 9,098 The weighted average of the number ofrepresentatives elected by eachconstituency size, if available.Source: Keefer (2005)
Log GDP 8.151 0.973 9,098 Log of per capita gross domestic product(PPP).
Gini coefficient 37.84 0.295 9,098 Gini coefficient for income inequalitycirca 2003. Source: UNU-WIDERWorld Income Inequality Database(WIID)
Democracy 4.255 1.63 9,098 Composite measure of democracy.Source: Freedom House’s Nations inTransit (2008)
Source: Penn World Tables.
https://www.cambridge.org/core/terms. https://doi.org/10.1017/S1744137417000108Downloaded from https://www.cambridge.org/core. IP address: 65.21.228.167, on 21 Nov 2021 at 03:21:15, subject to the Cambridge Core terms of use, available at

Politicalinstitutions,lobbyingand
corruption939
Table A2. Correlation matrix
1 2 3 4 5 6 7 8 9 10 11
1 Lobby member2 Corruption − 0.0383 Influence 0.278 − 0.0014 Firm age 0.161 − 0.073 0.1555 Medium size 0.143 − 0.025 0.108 0.1486 Large size 0.164 − 0.055 0.141 0.331 − 0.1597 Foreign 0.112 − 0.013 0.084 − 0.031 0.119 0.1328 Log GDP pc 0.121 − 0.136 0.008 0.049 − 0.021 − 0.003 − 0.0399 Gini − 0.161 0.145 − 0.060 − 0.053 0.003 − 0.002 0.027 − 0.68110 Closed list − 0.107 0.103 − 0.042 − 0.017 0.006 0.009 − 0.019 − 0.465 0.41411 District size − 0.044 − 0.001 − 0.062 − 0.011 − 0.017 0.008 0.022 − 0.406 0.299 0.14412 Democracy 0.131 − 0.135 0.027 0.082 − 0.011 − 0.018 − 0.023 0.799 − 0.494 − 0.469 − 0.394
https://ww
w.cam
bridge.org/core/terms. https://doi.org/10.1017/S1744137417000108
Dow
nloaded from https://w
ww
.cambridge.org/core. IP address: 65.21.228.167, on 21 N
ov 2021 at 03:21:15, subject to the Cambridge Core term
s of use, available at