policy paper 10, 2013 understanding - research ict … paper 10, 2013 understanding what is...
TRANSCRIPT

Evidence for ICT Policy ActionPolicy Paper 10, 2013
Understandingwhat is happening in ICTin Mozambique
Francisco Mabila
A supply- and demand- side analysis of theICT sector

Research ICT Africa
Research ICT Africa (RIA) is an information and communication technology (ICT) policy and regulation research network based in Cape Town, South Africa, under the directorship of Dr. Alison Gillwald. As a public interest think tank, RIA fills a strategic gap in the development of a sustainable information society and knowledge economy. The network builds the ICT policy and regulatory research capacity needed to inform e!ective ICT governance in Africa. RIA was launched a decade ago and has extended its activities through national, regional and continental partnerships. The network emanates from the growing demand for data and analysis necessary for appropriate but visionary policy required to catapult the continent into the information age. Through development of its research network, RIA seeks to build an African knowledge base in support of sound ICT policy and regulatory design, transparent implementation processes, and monitoring and review of policy and regulatory developments on the continent. The research, arising from a public interest agenda, is made available in the public domain, and individuals and entities from the public sector, private sector and civil society are encouraged to use it for purposes of teaching and further research or to enable them to participate more e!ectively in national, regional and global ICT policymaking and governance.
Series Editor: Alison Gillwald
Editorial assistance: Broc Rademan

Evidence for ICT Policy Action
AcknowledgementsResearch ICT Africa (RIA) is an information and communication technology (ICT) policy and regulation research network based in Cape Town, South Africa, under the directorship of Dr. Alison Gillwald. As a public interest think tank, RIA fills a strategic gap in the development of a sustainable information society and knowledge economy. The network builds the ICT policy and regulatory research capacity needed to inform e!ective ICT governance in Africa. RIA was launched a decade ago and has extended its activities through national, regional and continental partnerships. The network emanates from the growing demand for data and analysis necessary for appropriate but visionary policy required to catapult the continent into the information age. Through development of its research network, RIA seeks to build an African knowledge base in support of sound ICT policy and regulatory design, transparent implementation processes, and monitoring and review of policy and regulatory developments on the continent. The research, arising from a public interest agenda, is made available in the public domain, and individuals and entities from the public sector, private sector and civil society are encouraged to use it for purposes of teaching and further research or to enable them to participate more e!ectively in national, regional and global ICT policymaking and governance.
This research is made possible by significant funding received from the International Development Research Centre (IDRC), Ottawa, Canada, and RIA network members express their gratitude to the IDRC for its support. The network consists of members in 18 African countries, and RIA researchers in 12 countries were able to participate in the 2012 supply- and demand-side reviews of their national ICT sectors (as detailed in this and other country reports). The 2012 national studies were led by the following RIA network members: Dr. Patricia Makepe (Botswana); Prof. Olivier Nana Nzépa (Cameroon); Dr. Lishan Adam (Ethiopia); Dr. Godfred Frempong (Ghana); Prof. Tim Waema (Kenya); Francisco Mabila (Mozambique); Dr. Christoph Stork (Namibia); Fola Odufuwa (Nigeria); Louise Karamage (Rwanda); Dr. Alison Gillwald (South Africa); Mary Materu-Behitsa (Tanzania); and Ali Ndiwalana (Uganda).
RIA’s 2012 Household and Individual ICT Access and Use Surveys and Informal Sector ICT Access and Use Surveys were led by Dr. Christoph Stork who, together with Mariama Deen-Swarray, was responsible for the preparation of the statistical data and data analysis for the 12 sets of national findings and the comparative analyses across the 12 countries. The 2012 Telecom Regulatory Environment (TRE) assessments, the compilation of supply-side indicators, and the collection and presentation of the pricing data, were coordinated across the 12 study countries by Enrico Calandro and Mpho Moyo. Additional peer-reviewing to that done amongst partners was undertaken by Steve Esselaar and Enrico Calandro.
This report would not have been possible without the contributions and assistance of many people. Their inputs, especially during the data gathering process, were determinants to the quality of this study. Special thanks is dedicated to Américo Muchanga, Director-General of the INCM and all of his team for their valuable inputs and the provision of critical data. My profound appreciation and gratitude goes to Christoph Stork and Alison Gillwald for their continuous support and guidance, especially regarding the research methodology.
AuthorFrancisco Mabila is Director of the Informatics Centre of the Eduardo Mondlane University. He joined the University in 1992 after serving 14 years at the Telecommunications Division of the Ministry of Defense. He was part of the team of experts that was invited by the Government of Mozambique to develop the National ICT Policy and its respective Implementation Strategy in 1998. Since 2001, he has been actively involved in various research projects, especially in the ICT sector as a member of the Research ICT Africa Network.
He has been referred to as a resource person by UNECA for a number of projects, such as the SCAN ICT Initiative, the African Bandwidth Consortium and the study on “Assessing ICT Policy Development and Implementation Process: The case of Mozambique”. He holds a Certificate in Telecommunication Policy, Regulation and Management from the University of Witwatersrand Graduate School of Public Development and Management.
Design and layout: Grant Logan, Creative Storm | Cover image: Amy DeVoogd, Photodisc

Understanding what is happening in ICT in Mozambique
Executive summary
The growth of the ICT sector in Mozambique is driven by the economic development trends that characterise the country today, with special emphasis on so-called “mega-projects” and the exploitation of the newly discovered mineral and energy resources. The demand for telecommunications services has been growing rapidly, both at the corporate and individual levels. This situation o!ers excellent business opportunities for telecommunications operators in terms of both network infrastructure development and service deployment in the regions of the country that have been poorly served in the past.
The entry of the third mobile operator (Movitel) in 2011 shook up the market, leading to lower prices, better voice and data coverage, and higher tra"c volumes. With the new entrant in operation, a significant price drop in the market was expected, but the reductions were not as large as predicted, especially regarding broadband internet (Movitel has adopted a very similar pricing strategy to the other two operators).
While Movitel is busy expanding network coverage and mobile market leader Mcel is trying to use all possible means to keep its top position in the market, Vodacom Mozambique is still struggling to become profitable (the company has been investing continuously in network expansion and modernisation over the last few years).
Mozambique’s telecommunications market is changing very quickly. While the fixed segment remains, in real terms, a monopoly of the incumbent Telecomunicações de Moçambique (TDM), the mobile sector has become very dynamic since the new player Movitel entered the market (its first full year of operation was 2012). Mobile penetration in 2012 was 48% while fixed teledensity was at 0.38%.
The ICT Policy (Politica de Informática) is 12 years old and needs to be reviewed in order to align national priorities with the new developments in the ICT sector and other global trends. The Instituto Nacional de Tecnologias de Informação e Comunicação (INTIC, the National ICT Institute) has yet to organise the necessary policy review process, despite the fact that the matter has been repeatedly mentioned as one of its priorities. The reasons for this delay are unknown.
The telecommunications regulatory environment is improving due to the e!orts of the regulator, the Instituto Nacional das Comunicações de Moçambique (INCM, the National Communications Institute of Mozambique), to fill legislative gaps and, to some extent, enforce existing legislation. A considerable number of regulations have been produced during the last few years. Currently the Telecommunications Law from 2004 is under review.
The review process began in 2012 and is driven by the INCM. However, the fact that the Telecommunications Law (“Lei das Telecomunicações”) is being reviewed prior the review of the ICT Policy (“Politica de Informática”) means that there may be discrepancies between the objectives of the two documents. The expected key innovations in the Telecommunications Law include introduction of a unified licensing regime, provision for voice over Internet Protocol (VoIP) services and, more generally, focus on stimulation and promotion of greater competition.
Unlike at the time of the previous Research ICT Africa (RIA) Mozambique Sector Performance Review (SPR) in 2010 when there was much controversy among the operators and the INCM regarding interconnection termination rates, the new agreed termination rates are symmetrical and will decrease gradually from the MZM1.99 in 2013 to MZM0.86 in 2015.
Following global trends, internet access in Mozambique is shifting from PC to mobile connections. This is the result of technological advances enabling the provision of cheaper mobile handsets and other mobile devices that run internet applications, coupled with improved operator access to international bandwidth (through the SEACOM and EASSy submarine cables).
The current economic development in Mozambique o!ers excellent telecom-munications development opportunities
Simultaneous reviews of the Telecommunica-tions Law and ICT Policy could cause an overlap in objectives
Evidence for ICT Policy Action
However, the price of broadband internet continues to be prohibitive for individual users. Fixed-line ADSL broadband is therefore only used by (a small number of ) corporate entities. Prepaid mobile internet, for 1GB and 5GB bundles of data, is cheaper than both prepaid and postpaid ADSL packages of the same size. RIA’s 2012 data for Mozambique, generated through the 2012 RIA Mozambique Household and Individual ICT Access and Use Survey, indicates that in Mozambique, 68.7% of individual users rely on mobile phone handsets to access the internet, 56.8% rely on 3G dongle modems, 10.6% use wireless broadband (TDM’s WiMAX) and only 3.9% use ADSL connections.
The number of households with a working telephone line is extremely small. The 2012 RIA ICT Survey found that only 0.39% of households have a working fixed line, while 42.5% of individuals (aged 15 years and older) own a mobile phone. According to the INCM, the total number of active SIM cards in 2012 was 8 804 986, which constitutes 38.2% of the population.
The cost of access remains one of the major limitations for internet use: the 2012 RIA Survey indicates that 52% of respondents find the use of internet “too expensive” and only 11.1% use it.
Despite the relatively fast growth of TV broadcasting in Mozambique, radio continues to be the most-used ICT resource for mass communication. Radio is attractive, particularly to people living in rural areas, because of, inter alia, its wide geographical coverage, its low-cost receivers (compared to TV sets), its provision of content in numerous languages, the relevance of its content and its low power requirements (significant given limits in coverage of the national electricity grid). The 2012 RIA Survey found that radio listeners account for 53.8% of the population while those who watch TV are 43.3%.
Other emerging media resources are social networking applications, where Facebook leads (used by the 58% of internet users); only 64.36% of internet users have an email address.
Mobile money is still in its embryonic stage, with only 0.2% of the population having used mobile money in 2012. Both Mcel and Vodacom o!er mobile money, via their mKesh and M-Pesa products respectively. Meanwhile, mobile banking is provided by Banco Internacional de Moçambique (BIM) and Banco Comercial e de Investimentos (BCI). Other banks are o!ering basic online operations while positioning themselves to implement mobile banking platforms.
Mobile phone use is profoundly more common than that of "xed line
Mobile money is still in its embryonic stage

Table of contents
Introduction 1
Main developments in Mozambique’s ICT sector 1
Global ranking 2
Policies, laws and institutional arrangments 4
ICT policymaking 4
Telecommunications policymaking 4
Institutional arrangements 5
The e-Government Strategy 6
The Government Electronic Network (GovNet) 6
Digital migration of TV signals 6
SIM card registration requirement 7
Telecom Regulatory Environment (TRE) assessment 11
4HYRL[�Z[Y\J[\YL�HUK�ÄUHUJPHS�performance 23
Public payphones 23
Mobile telephony 25
:LJ[VY�ÄUHUJPHS�WLYMVYTHUJL� ��
ICT pricing 30
Fixed and mobile services 30
Broadband data/internet services 32
Interconnection termination rates 33
ICT access and use 34
Telephony 34
Radio and TV 37
Internet 39
Social networking 45
Mobile money 46
*VUJS\ZPVUZ�HUK�YLJVTTLUKH[PVUZ�� ��
References 50
Annexures 52
Annexure 1: e-Government flagship projects 52
Annexure 2: Other e-Government projects 52

Evidence for ICT Policy Action
ADSL asymmetric digital subscriber line
BAÚ Balcão de Atendimento Único [Single Desk Service “One-Stop Shop”]
BCI Banco Commercial e de Investimentos
BIM Banco Internacional de Moçambique
CIUEM Centro de Informatica da Universidade Eduardo Mondlane [Eduardo Mondlane University Informatics Centre]
CMC Community Multimedia Centre
CPInfo Commissão para a Política de Informática [ICT Policy Commission]
CPRD Centros Provinciais de Recursos Digitais [Provincial Digital Resource Centres]
EASSy Eastern Africa Submarine Cable System
FSAU Fundo do Serviço de Acesso Universal [Universal Access Service Fund]
GDP gross domestic product
GovNet Government Electronic Network
ICT information and communication technology
INCM Instituto Nacional das Comunicações de Moçambique [National Communications Institute of Mozambique]
INE Instituto Nacional de Estatística [National Institute of Statistics]
INTIC Instituto Nacional de Tecnologias de Informação e Comunicação [National ICT Institute]
ISDN integrated services digital network
ISP internet service provider
IT information technology
ITU International Telecommunication Union
MCT Ministério da Ciência e Tecnologia [Ministry of Science and Technology]
MTC Ministério dos Transportes e Comunicações [Ministry of Transport and Communications]
MZM Mozambique metical
NRI Networked Readiness Index
OECD Organisation for Economic Co-operation and Development
PC personal computer
PSTN public switched telephone network
QoS quality of service
RIA Research ICT Africa network
SADC Southern African Development Community
SIM subscriber identity module
SIRC Sistema de Registo Criminal [Criminal Record Information System]
SISCAL Sistema de Cadastro e Licenciamento de Empresas [Company Registration and Licensing System]
SISTAFE Sistema de Administração Financeira do Estado [State Financial Administration System]
TDM Telecomunicações de Moçambique [Mozambique Telecommunications]
TRE Telecom Regulatory Environment
UN United Nations
UNDP UN Development Programme [Programa das Nações Unidas para o Desenvolvimento (PNUD)]
UNECA UN Economic Commission for Africa
UTICT Unidade Técnica de Implementação da Política de Informática [ICT Policy Technical Implementation Unit]
USD United States dollar
USO universal service obligations
VANS value-added network services
VoIP voice over Internet Protocol
WEF World Economic Forum
WiMAX worldwide interoperability for microwave access
ZAR South African rand
3G third generation mobile network
Acronyms and abbreviations

1
Understanding what is happening in ICT in Mozambique
Introduction
Main developments in Mozambique’s ICT sector
Since the end of the civil war in 1992, Mozambique´s economy has developed steadily, due in particular to a number of large infrastructure projects (e.g. construction of roads, bridges, airports and railways) as well as the exploitation of mineral and energy resources. The GDP in 2012 was estimated at USD14.6billion and the GDP per capita at USD579 (World Bank, n.d.). Although it is still one of the poorest countries in the world (and thus growing o! a low base), Mozambique currently has one of the fastest-growing GDP rates on the continent (and the world), calculated at 7.25% in 2012 (Portal de dados de Moçambique, n.d.).
In terms of ICT development, there have been some visible improvements as a result of public and private investment in telecommunications network infrastructure and services. And policy and regulation have helped to improve the ICT business environment in the country. However, despite market liberalisation, there is still no competition in the fixed market. This has produced ine"ciencies in the sector, with implications for both consumer prices and pursuit of sector targets for the underserved areas of the country. This situation has a direct influence on the status of all ICT-related indicators, e.g. teledensity, internet penetration, computer literacy, availability of local content, radio and TV broadcasting, and even mobile network coverage.
In its ICT Policy Implementation Strategy of 2002 (Estratégia de Implementação da Política de Informática), the Mozambique Government’s Information Policy Commission stresses the importance and need for establishing a robust and modern nationwide network infrastructure, as a pre-condition for boosting the development of an information society in Mozambique (Secretariado Executivo da Comissão para a Política de Informática, 2002). Key priorities for fixed-line incumbent Telecomunicações de Moçambique (TDM), in terms of the Strategy, included expanding network coverage and replacing old technologies with more modern ones. Currently the transmission network and all telephone switches are 100% digitalised, and all 10 provincial capitals are linked to the network via submarine or terrestrial optical fibre. Thus, the next challenges include:
expanding fibre to district level;
expanding 3G mobile (voice and data) services to all provincial capitals and districts;
migrating from analogue to digital broadcasting; and
reducing the price for accessing backbone services.
These challenges are to be addressed through a combination of government-funded initiatives (e.g. the Universal Access Service Fund) and private investments. Additionally, donor funds and bank loans are to play an important role. Currently, both the fixed and mobile sectors are involved in a number of projects with special emphasis on the expanded deployment of network infrastructure.
The mobile sector is contributing significantly to growth of the national ICT network infrastructure and, consequently, to internet access rates. By stimulating service demand among potential mobile users, the mobile operators have forced fixed-line operator TDM to look at network expansion and modernisation as real business necessities.
Public and private investment in Mozambique’s telecommunica--tions infrastructure has resulted in some visible improvements
Mozambique’s mobile sector is contributing signi"cantly to growth of the national ICT network infrastructure and internet access rates

2
Evidence for ICT Policy Action
Despite many challenges in the fixed network segment, the overall figures in terms of ICT infrastructure and ICT penetration are encouraging. Table 1 below presents some basic ICT data in order to provide a backdrop for this study.
Table 1: ICT indicators and licencees
ICT Indicators
Fixed teledensity 0.4%
Mobile penetration 33.1%
Internet users 4.8%
Licencees
Fixed telecommunications operators 1
Mobile operators 3
International broadband access operators 2
National broadband access operators 3
Data and Internet Service Providers 25
Cable TV operators 3
Telecentres/CMCs (community access centres) 33
Source: ITU (2012), INCM response to RFI (2013), CAICC (2012)
Global ranking
Rapid economic growth is driving demand for telecommunications services and transport infrastructure. As indicated above, the Mozambique Government is investing significant amounts of funding in the construction of roads, railways, ports and airports, and into expansion of existing national backbone network infrastructure. In this context, TDM is installing multiple fibre rings to ensure connectivity and network redundancy, while the newly licensed mobile operator Movitel is laying aerial fibre reaching the most remote areas of the country. For its part, Vodacom is investing heavily in private fibre-optic backbone network infrastructure to cover the main urban centres in the country.
The Universal Access Service Fund is financially backing other initiatives aimed at bridging the “last mile” connectivity gap. The National Communications Institute (INCM) reports that 43 projects were funded between 2011 and 2012 (INCM, 2012a).
Despite these developments, Mozambique’s ranking against other RIA ICT Survey countries is poor. The comparative Table 2 below illustrates the country’s low ranking among RIA countries in terms of the World Economic Forum (WEF) Networked Readiness Index (NRI) and NRI sub-indices for 2010-11.
Rapid economic growth is increasing demand for telecommunica-tions services and transport infrastructure

3
Understanding what is happening in ICT in Mozambique
Table 2: 2010-11 NRI rankings for 10 RIA ICT Survey countries
CountryOverall
NRI ranking
Environment (NRI sub-
index)
Readiness (NRI sub-
index)
Use (NRI sub-index)
Overall Governmant Business Individual
South Africa 61 38 79 83 76 52 95
Kenya 81 99 55 88 65 67 104
Namibia 82 56 71 109 129 90 107
Botswana 91 74 93 97 84 112 101
Ghana 99 82 80 108 116 102 112
Nigeria 104 105 108 99 123 81 92
Mozambique 106 113 87 107 92 96 125
Uganda 107 102 105 118 109 111 121
Tanzania 118 104 124 125 117 120 127
Ethiopia 123 129 96 132 103 131 136
Cameroon 125 126 128 124 111 113 129
Source: WEF (2011)
As seen in Table 2, Mozambique was ranked 106th in the overall Networked Readiness Index (NRI) for 2010-11, based on rankings of 113th for its ICT environment, 87th for its ICT readiness and 107th for its overall ICT use. Mozambique’s overall NRI ranking put it in seventh place among the 10 RIA countries covered in Table 2.
Mozambique ranked 106th in the 2011 NRI

4
Evidence for ICT Policy Action
Policies, laws and institutional arrangments
ICT policymaking
In 1998, the Government of Mozambique created an ICT Policy Commission (Commissão para a Política de Informática or, CPInfo) with the main task of leading and guiding the process of preparing a national ICT Policy and Implementation Strategy (Decreto Presidencial No. 2/1998, 1998). The CPInfo was then assisted by an executive secretariat which, in 2002, was replaced by the ICT Policy Technical Implementation Unit (Unidade Técnica de Implementação da Política de Informática, or UTICT) – a change seen as necessary to give the new body a more operational character (Decreto No. 50/2002, 2002). The CPInfo was disbanded in 2007 and its tasks transferred to the Ministry of Science and Technology (MCT, Ministério da Ciência e Tecnologia), which has since played an increasingly direct role in ICT policy development and implementation (Decreto Presidencial No. 3/2007, 2007).
The ICT Policy (Política de Informática) was approved in 2000, and its Implementation Strategy (Estratégia de Implementação da Política de Informática) was approved in 2002.
In 2011, UTICT was converted into an autonomous public institution, the National ICT Institute (INTIC, Instituto Nacional de Tecnologias de Informação e Comunicação) (Decreto No. 9/2011, 2011). In addition to taking over the functions previously assigned to the UTICT, the Institute has a regulatory role in the ICT sector, carried out in coordination with the regulator, the National Communications Institute (INCM, Instituto Nacional das Comunicações de Moçambique).
There are various calls for the review and reformulation of the ICT Policy of 2000 in order to take into account both the state of implementation achieved so far and the many technological advances and innovations that have brought about major changes at all levels of the ICT sector during the past decade. At the time of writing, a consultancy would be tendered to conduct the ICT Policy review.
In 2011, the UN Economic Commission for Africa (UNECA) hired local expertise to conduct a study assessing the ICT Policy and its implementation. INTIC and the MCT were to organise a workshop involving the major stakeholders, in order to validate the final report before it was published, but that has not yet happened. UNECA sees the study as a potentially valuable contribution to the review process for the ICT Policy.
Telecommunications policymaking
The current Telecommunications Law was passed in 2004 and there is a common feeling among stakeholders that there is need for its review. Challenges resulting from new developments and trends in the sector, both regionally and internationally, as well as the huge investments flowing into the country (especially in the mining and energy sectors), have increased the pressure for such a review.
As this report was being finalised in early 2013, the Ministry of Transport and Communications (MTC, Ministério dos Transportes e Comunicações) launched a process of public consultations intended for a drafting a new telecommunications law. The process is being led by the regulator, INCM, and consists of debates with operators and other stakeholders as well as public workshops organised in the three major cities (Nampula, Beira and Maputo) – cities which represent the three regions of the country: North, Centre and South, respectively. It is anticipated that a final draft law will be submitted to the Council of Ministers for ratification by Parliament before the end of 2013.
The Ministry of Science and Technology has played an increasingly direct role in ICT policy development and implementation
The National ICT Institute performs regulatory functions in addition to the INCM
There is a need to review the Telecommunica-tions Law of 2004

5
Understanding what is happening in ICT in Mozambique
Two other policy instruments are currently subject to public discussion, namely the Estratégia das Telecomunicações (2014-2018) (Telecommunications Strategy [2014-2018]) (2006) and the Regulamento de Instalação de Infrastruturas de Telecomunicações em Edi!ícios e Projectos de Obras Públicas (Regulation of Telecommunications Infrastructure Installation on Buildings and Public Works Projects) (INCM, 2012b), both drafted in 2012. The Telecommunications Strategy, a document complementing the Telecommunications Law, describes how the definitions and principles of the Law will be implemented.
The main focus of the Strategy, and the planned new law referred to above, are to increase competition in the sector by creating an appropriate legal environment; to respond adequately to technology convergence; and to align the country with world trends and best practices. At the time of writing, a revision of the Telecommunications Law suggested all market segments will be liberalised, including fixed-voice telephony (which is at present still under the monopoly control of the incumbent TDM).
The revised Telecommunications Law and the respective Strategy call for, inter alia:
strengthening the role of the regulator, with institutional capacity-building as the main priority in order to achieve this goal;
implementation of a unified licensing regime;
legalisation of use of VoIP by operators and service providers; and
full integration of the Universal Access Service Fund into the organisational structure of INCM (as opposed to the current situation where the Fund is physically located at the INCM but administratively attached to the Ministry of Transport and Communications).
Institutional arrangements
Despite a negative overall score for Mozambique in the 2012 RIA Telecom Regulatory Environment (TRE) assessment (detailed later in this report) the INCM, the regulator, has continued to strengthen and consolidate its role in the sector, becoming more and more respected among stakeholders. The transformation strategy of the regulator has mainly been based on a strong institutional capacity-building programme, which prioritises:
human resource development linked to technical capacity;
creation of new units; and
strengthening of existing units in order to adequately prepare the organisation for the sector challenges of today.
One of the results of this transformation process at the INCM was the creation of the Universal Access Service Fund (Fundo do Serviço de Acesso Universal [FSAU]). The Fund received a negative assessment in the 2010 RIA SPR for Mozambique due to poor performance and inappropriate organisational structure, resulting in a large unused budget. In 2006 and 2007, there were no expenditures at all. In 2011 and 2012, however, the Fund has been used extensively to support a considerable number of projects. In 2008, the Fund reported MZM14million of expenditure for the same year, which is equivalent to only 21.5% of the total collected budget during the same year. In contrast, it was reported by the INCM that in 2012, the Fund had spent MZM172.3million on di!erent projects. (Personal interview with Dr Américo Muchanga, Director General INCM, Maputo, 21 May 2013)
The Telecommuni-cations Law of 2004 and the Telecom-munications Strategy aim to increase competition in Mozambique’s ICT sector
The INCM continues to consolidate its regulatory role in Mozambique’s ICT sector

6
Evidence for ICT Policy Action
The Fund’s projects are aimed at expanding broadband to rural areas – by establishing last mile solutions or point-to-point connectivity within villages, in order to provide voice, data and internet access.
Through a competitive process, the INCM has recently signed two contracts, with Mcel and Movitel respectively, for the implementation, with Fund monies, of 50 new projects in 2013. The objective of these projects will be to provide broadband to rural areas using fibre networks. Those projects are projected to benefit an estimated 873 000 people, and the total cost will be MZM217million (approximately USD7million). (Personal interview with Dr Américo Muchanga, Director General INCM, Maputo, 21 May 2013)
The e-Government Strategy
The e-Government Strategy, approved in 2006, was conceived specifically to support the second phase, from 2006 to 2011, of Mozambique’s public sector reform. The reform intended for the Government to achieve decentralisation, improvement of service delivery as well as improvement of institutional and human capacity. For the implementation of the e-Government Strategy six main e-Government objectives, each with a flagship project, were identified (see Annexure 1 to this report). Four other e-Government projects, not given flagship status, were also identified in the Strategy (see Annexure 2). Some services and applications developed within the framework of the flagship projects are now operational, showing that some of the objectives of the e-Government Strategy have already been achieved.
The Government Electronic Network (GovNet)
GovNet is a key contibutor to the successful implementation of the e-Government Strategy because it constitutes the technological foundation for all other components. GovNet was accordingly given the highest priority during the first few years of the Strategy’s implementation.
The implementation of e-Government Strategy began in 2004 and was divided into three phases:
1. Pilot phase (2004-2005): aimed at proofing the concept and provision of basic services such as email and internet;
2. Provincial Phase (2007-2009): dedicated to deployment of the network at the provincial level, as well as provision of content and applications for civil servants and citizens through the Government Portal; and
3. District Phase (2010-2014): aimed at further deployment of GovNet at the district level as well as the provision of new services and electronic content to citizens.
The GovNet implementation plan has, however, been significantly delayed. According to INTIC, the main reasons relate to financial constraints, poor telecommunications infrastructure coverage at the district level and the lack of IT-specialised human resources (in the public sector in general, and at the district level in particular) necessary to provide network management and technical support.
Digital migration of TV signals
Mozambique has subscribed to the Southern African Development Community (SADC) Roadmap for Digital Broadcasting Migration, which mandates complete switch-o! of analogue TV signals by the middle of 2015. However, the process is dependent upon the availability of funding. According to the INCM’s estimates, USD90million is needed to cover the entire process, including, inter alia, training, conversion of the existing analogue transmission infrastructure into digital and rollout of TV set-top boxes that can receive terrestrial digital signals. There was a timely start to the public awareness campaign on broadcast digital migration matters, but the pilot digital terrestrial TV (DTT)
The INCM has promised to extend broadband infrastructure to the rural areas using "bre networks
The 2006 e-Government Strategy was to support the second phase of Mozambique’s public sector reform
Mozambique lags behind SADC’s Roadmap for Digital Broadcasting Migration switch-o! date in 2015

7
Understanding what is happening in ICT in Mozambique
transmissions – necessary before the public launch – have not yet begun. The regulator INCM argues that the full user switchover from analogue to digital signal reception will take a minimum of 18 months from the point of public launch – meaning that, if the SADC mid-2015 analogue switch-o! deadline is to be met, terrestrial digital signals must be publicly launched before or at the beginning of 2014.
SIM card registration requirement
Following the food riots that took place in the Mozambican capital Maputo in February 2010 – which were mainly coordinated via SMS – the Government decided to introduce SIM card registration (through Ministerial Decree No. 153/2010, 2010). As justification for the Decree, the Government has indicated a need to create an integrated public database containing all telephone numbers and names of associated subscribers so as to promote the responsible use of a SIM card and to protect citizens from criminal activities that can be carried out using mobile phones.
This argument is questionable since kidnapping, for instance, appeared as a new criminal phenomenon in Mozambique exactly one year after the Ministerial Decree No. 153/2010 was introduced. In 2012, the situation became worse. The police never clarified most of the cases, but communication between the criminals and the families of the victims were always held via mobile phones for ransom purposes.
Initially mobile operators were given a deadline of three months to complete the registration process, but the regulator had underestimated the amount of work and resources required for this operation and the target could not be met by any of the operators. The INCM extended the deadline to January 2011. However, even that extension was insu"cient for Mcel and Vodacom to register all their customers and the process had to be continued throughout 2011 and into 2012. Mcel and Vodacom reported that, in May 2012, 54.71% and 46.19% of their subscribers, respectively, were still not registered (INCM, 2013).
Figure 1: Mcel SIM card registrations, January 2011 to May 2012 Source: INCM (2013)
2 000 000
2 500 000
3 000 000
3 500 000
4 000 000
1 500 000
1 000 000
500 000
0Jan Apr May Jun Jul Aug Oct Nov Dec Jan Feb Mar Apr May
Total forms received for registration Total registered SIM cards
SepFeb Mar
The Government introduced mandatory SIM registration in 2010 to regulate criminal behaviour

8
Evidence for ICT Policy Action
Figure 2: Vodacom SIM card registrations, January 2011 to May 2012 Source: INCM (2013)
Figure 3: Comparison: Mcel and Vodacom SIM card registrations, January 2011 to May 2012 Source: INCM (2013)
2 000 000
2 500 000
1 500 000
1 000 000
500 000
0
Total forms received for registration Total registered SIM cards
Jan Apr May Jun Jul Aug Oct Nov Dec Jan Feb Mar Apr MaySepFeb Mar
2 000 000
2 500 000
1 500 000
1 000 000
500 000
0
Mcel Vodacom
Jan Apr May Jun Jul Aug Oct Nov Dec Jan Feb Mar Apr MaySepFeb Mar

9
Understanding what is happening in ICT in Mozambique
According to representatives from Mcel and Vodacom, the SIM registration process has generated significant financial burdens for both companies, due to the extra resources that had to be put in place. Movitel, meanwhile, has been accused by competitors of violating the SIM registration Decree of 2010 by distributing thousands of free startup packages in an e!ort to increase user numbers.
As a consequence of the SIM card registration process, Vodacom reported the loss of 1million subscribers (presumably through database-cleaning) between 2011 and 2012. The regulator has confirmed during the interview conducted by the author of this report, that before SIM card registration, operators had more subscribers in their databases than the real number of active SIM cards -- due to data duplications and users not reporting the loss of mobile phones/SIM cards could also have such an e!ect. (Personal interview with Dr Américo Muchanga, Director General INCM, Maputo, 21 May 2013)
Figure 4 below provides comparative figures, between the Mcel and Vodacom networks, for active SIM cards between 2004 and 2012. The asterisk attached to 2012 denotes the fact that, while Vodacom reported a decrease of the number of subscribers between 2011 and 2012, Mcel appears with an increase, because the company did not clean their database during the SIM card registration process. (Personal interview with Dr Américo Muchanga, Director General INCM, Maputo, 21 May 2013)
Figure 4: Mcel and Vodacom: active SIM cards between 2004 and 2012Source: INCM (2013)
In Mozambique, many people have more than one active SIM card, chiefly as a result of o!-net prices (communicating between two operator networks) being higher than on-net prices (for communicating within a single operator network), and poor network quality and coverage forcing users to be able to switch between operators in order to optimise network quality.
4 000 000
5 000 000
6 000 000
3 000 000
2 000 000
1 000 000
0
Mcel Vodacom
2006 2007 2008 2009 2010 201220112004 2005
The SIM card registration process placed cost burdens on operators and removed many subscribers from the database
Many users have more than one SIM card to account for o!-net/on-net price discrepancies and poor network quality

10
Evidence for ICT Policy Action
Figure 5 below shows the percentages of individuals (aged 15 years or older), in each of the RIA countries owning at least one mobile phone or active SIM card – in 2012 and in 2008.
Figure 5: Individuals owning a mobile phone or active SIM in RIA ICT Survey countriesSource: RIA ICT Survey data 2007-08 and 2011-12
Figure 5 shows that in 2012, 46% of individuals in Mozambique reported owning a mobile phone or active SIM card, against 25.7% of individuals that did in 2008 (based on respondents aged 16 years and older in the 2008 RIA ICT Survey). Despite this increase, Figure 5 also shows that Mozambique still ranks near the bottom (ninth out of 12) among RIA ICT Survey countries for mobile penetration.
Mozambique’s mobile penetration is comparatively low
Ethiopia
Rwanda
Tanzania
Cameroon
Uganda
Namibia
Nigeria
Ghana
Botswana
Kenya
South Africa
3.2%
9.9%
21.5%
36.5%
20.7%
49.3%
59.8%
59.9%
52%
62.1%
19%
38.5%
41.7%
Mozambique 25.7%46%
50.6%
53.6%
66.5%
69.4%
70.5%
83.5%
86.7%
87%
2007/20082011/2012

11
Understanding what is happening in ICT in Mozambique
Telecom Regulatory Environment (TRE) assessment
The Telecom Regulatory Environment (TRE) assessment is a research method, developed by LIRNEasia (see LIRNEasia, 2008), which measures stakeholder perceptions of the e!ectiveness of ICT regulation in a given country. The TRE method assesses perceptions of the telecommunications regulatory environment in relation to seven regulatory dimensions, namely:
1) market entry;
2) access to scarce resources;
3) interconnection;
4) tari! regulation;
5) anti-competitive practices;
6) universal service obligations (USO); and
7) quality of service (QoS).
Each of the seven dimensions is canvassed across three service sub-sectors: (1) fixed, (2) mobile and (3) value-added network services (VANS). Perceptions are sought in terms of a Likert Scale, with each of the seven regulatory dimensions scored by stakeholders, in terms of each-subsector, on a scale from 1 (“highly ine!ective”) to 5 (“highly e!ective”). To simplify interpretation, the 1 to 5 scale is, during the data analysis, transformed into a scale from -2 to 2.
The next three figures provide the scores from the 2012 RIA Mozambique TRE assessment across the seven dimensions for regulation of fixed (Figure 6), mobile (Figure 7) and VANS (Figure 8) sectors.
Figure 6: Perception of regulation of the !xed sectorSource: RIA TRE assessment data 2011-12
-2 -1 0 1 2
Quality of service (QoS)
Universal service obligations (USO)
Anti-competitive practices
Tari! regulation
Interconnection
Allocation of scarce resources
Market entry
A TRE survey assesses perceptions of the performance of the telecom-munications regulatory environment
Perception of the regulation of Mozambique’s "xed, mobile and VANS sector is mostly negative

12
Evidence for ICT Policy Action
Figure 7: Perception of regulation of the mobile sectorSource: RIA TRE assessment data 2011-12
Figure 8: Perception of regulation of the VANS sectorSource: RIA TRE assessment data 2011-12
-2 -1 0 1 2
Quality of service (QoS)
Universal service obligations (USO)
Anti-competitive practices
Tari! regulation
Interconnection
Allocation of scarce resources
Market entry
-2 -1 0 1 2
Quality of service (QoS)
Universal service obligations (USO)
Anti-competitive practices
Tari! regulation
Interconnection
Allocation of scarce resources
Market entry

13
Understanding what is happening in ICT in Mozambique
The comparison (in Figure 9 below) of the results (across seven TRE dimensions) from the 2006, 2009 and 2012 Mozambique TRE assessments shows a clear shift from the general perception of a predominantly “e!ective” regulatory environment to a predominantly “ine!ective” environment for these seven dimensions.
Figure 9: Mozambique TRE scores for di"erent dimensions (in 2006, 2009 and 2012)Source: RIA TRE assessment data 2006-2012
Despite e!orts by the regulator in recent years to strengthen its institutional capacity and develop legal instruments for e!ective regulation, TRE respondents had a generally negative perception of Mozmabique’s regulatory environment in 2012.
0-1 1-2
Access to scarce resources
Market entry
Anti-competitive practices
Universal service obligations (USO)
Quality of service (QoS)
Tari! regulation
Interconnection and facilities
2
2006 2009 2012
Mozambique’s overall regulation was perceived as weak in 2012

14
Evidence for ICT Policy Action
Among the 2012 RIA TRE assessment countries, Rwanda and Kenya are perceived to be the most effective countries regarding interconnection regulation (Figure 10 below), being the only ones with positive scores i.e. between 0 and 1.
Figure 10: Perception scores for interconnection regulationSource: RIA TRE assessment data 2011-12
Figure 10 also shows that Ethiopia has the worst perception among national stakeholders for interconnection regulation, with a score nearly equal to -2. Mozambique, although it ranks in the “ine!ective” range, holds the fourth best score for interconnection regulation among RIA countries – presumably a result of stakeholder recognition of the INCM’s e!orts to get a new interconnection framework approved by consensus among all operators in 2012 (a victory given the disputes registered between Mcel and Vodacom regarding the application of the previous interconnection termination rates).
Ine!ective E!ective
Ethiopia
South Africa
Uganda
Cameroon
Botswana
Nigeria
Ghana
Namibia
Mozambique
Tanzania
Kenya
Rwanda
Despite the INCM’s success in installing a new interconnection regulation in 2012, it was still perceived as negative

15
Understanding what is happening in ICT in Mozambique
Regarding regulation of market entry (Figure 11), the countries with the most favourable stakeholder perceptions in 2012 are Nigeria, Namibia, Uganda and Kenya. These four countries all score positively. Ethiopia, meanwhile, has the most negative stakeholder perception for this TRE dimension, scoring almost -2.
Figure 11: Perception scores for market entry regulationSource: RIA TRE assessment data 2011-12
Figure 11 also shows that Mozambique occupies the third worst position in terms of national stakeholder perception of market entry regulation, ahead of only Ethiopia and Cameroon. This negative evaluation may result from the fact that although the market was opened for a third mobile operator’s entrance, the INCM was accused of not being able to keep its independence during the process. There was strong political interference, particularly from prominent members of the ruling party, that tarnished the legitimacy of the process.
Ine!ective E!ective
Ethiopia
Cameroon
Mozambique
South Africa
Ghana
Botswana
Tanzania
Rwanda
Kenya
Uganda
Namibia
Nigeria
Mozambique’s ICT sector scored poorly in the market entry dimension of the TRE

16
Evidence for ICT Policy Action
For regulation of access to scarce resources (Figure 12 below), Namibia is the only RIA country where national ICT stakeholders rate this dimensions of regulation positively (as e!ective). Ethiopia and South Africa get the lowest stakeholder rankings among RIA countries for this dimension.
Figure 12: Perception scores for regulation of access to scarce resources Source: RIA TRE assessment data 2011-12
Mozambique, as shown in Figure 12, sits in the middle (seventh out of 12 RIA TRE assessment countries) amongst the countries with average scores between -1 and 0. This somewhat negative evaluation would appear to reflect the perception that although the INCM has a scarce resources management plan in place, there have been many complaints from operators and users of radio spectrum relating to interference, especially in the ISM band (the licence-free frequency range). Most commercial entities operate in the ISM band to avoid paying frequency taxes and the regulator has not been able to adequately intervene in settling interference cases due to technical limitations.
Ine!ective E!ective
Ethiopia
South Africa
Uganda
Cameroon
Nigeria
Mozambique
Botswana
Kenya
Ghana
Tanzania
Rwanda
Namibia
The regulator has not been e#cient in regulating the tax-free ISM bandwidth leading to frequent interference

17
Understanding what is happening in ICT in Mozambique
For the universal service obligations (USO) dimension, regulation was perceived as ine!ective in all 12 RIA TRE assessment countries (Figure 13).
Figure 13: Perception scores for USO regulationSource: RIA TRE assessment data 2011-12
Figure 13 also shows that Mozambique has one of the worst USO regulation perceptions (fourth from the bottom). As mentioned above, and reported in the 2010 RIA Mozambique SPR, the Universal Access Service Fund has struggled to spend the large amounts of money collected from operators. With the full assimilation of the Universal Service and Access Fund managing unit into the INCM, the situation has improved substantially. But more still has to be done, including marketing activities relating to the Fund’s implemented projects, in order to increase the Fund’s institutional visibility and accountability (and presumably, in the years to come, to also increase the TRE score for the USO dimension).
Ine!ective E!ective
South Africa
Botswana
Uganda
Mozambique
Nigeria
Kenya
Cameroon
Namibia
Ghana
Tanzania
Rwanda
Ethiopia
The Universal Access Service Fund has struggled to spend its large budget leading to a negative USO score

18
Evidence for ICT Policy Action
Rwanda is the only country here with a positive stakeholder rating for QoS regulation (Figure 14).
Figure 14: Perception scores for QoS regulationSource: RIA TRE assessment data 2011-12
South Africa, Namibia, Ethiopia and Mozambique are the countries with the worst stakeholder perceptions of QoS regulation in 2012; while Tanzania, Botswana and Cameroon score less poorly (but are still judged to be ine!ective) in relation to this regulatory dimension. In the case of Mozambique, QoS was a big challenge between 2010 and 2011 for both mobile operators Mcel and Vodacom, with Mcel’s network dropping the higher number of calls. Despite the existence of regulatory standards for QoS, the INCM did not undertake appropriate measures to implement standards, which probably explains why QoS was so badly perceived by Mozambican TRE stakeholder respondents.
Ine!ective E!ective
South Africa
Namibia
Ethiopia
Mozambique
Uganda
Nigeria
Kenya
Ghana
Cameroon
Botswana
Tanzania
Rwanda
Despite the existence of regulatory standards for QoS, the INCM did not undertake appropriate measures to implement those standards

19
Understanding what is happening in ICT in Mozambique
All 12 RIA countries have negative scores in 2012 for regulation of anti-competitive practices (Figure 15 below), with the Ethiopian regulatory environment once again standing out as the most negatively evaluated by its national ICT stakeholders, almost reaching the most negative mark (-2). Mozambique is second-worst for this TRE dimension (-1). Rwanda scores best among RIA countries, but is still perceived negatively, i.e. is still judged as being ine!ective in its regulation of anti-competitive practices.
Figure 15: Perception scores for the regulation of anti-competitive practicesSource: RIA TRE assessment data 2011-12
In the case of Mozambique, the reason for the negative perception among TRE interviewees of the regulation of anti-competitive practices is not immediately clear. In 2011, there were some signs of anti-competitive behaviour from Mcel and Vodacom (against the new entrant Movitel) in relation to infrastructure-sharing. Movitel could not reach agreement with either of the incumbent mobile operators, allegedly due to the high fees Mcel and Vodacom were seeking to impose. Consequently, Movitel decided to invest in its own network infrastructure. This situation may have contributed to the country’s negative TRE score in 2012 for the regulation of anti-competitive practices.
Ine!ective E!ective
Ethiopia
Mozambique
Botswana
Cameroon
Uganda
South Africa
Namibia
Nigeria
Ghana
Kenya
Tanzania
Rwanda
Movitel’s struggles in setting up its own infrastructure and gaining access to the market harmed Mozambique’s anti-competitive perceptions

20
Evidence for ICT Policy Action
Regarding tari! regulation (Figure 16 below), again all 12 RIA TRE assessment countries score negatively in 2012. Botswana, Cameroon and Mozambique are the countries with the worst scores (i.e. are judged by their stakeholders to be highly ine!ective) for the tari! regulation dimension, while Namibia, Rwanda and Kenya score better (with scores close to 0).
Figure 16: Perception scores for tari" regulationSource: RIA TRE assessment data 2011-12
Mozambique’s poor ranking for this TRE dimension must certainly be related to the general perception of high pricing for telecommunications services in comparison to other African countries, as discussed later in this report. Furthermore, the INCM has not yet created a legal instrument for tari! regulation.
Ine!ective E!ective
Botswana
Cameroon
Mozambique
South Africa
Uganda
Ethiopia
Tanzania
Ghana
Nigeria
Kenya
Rwanda
Namibia
Mozambique’s high prices are re$ected in its poor tari! regulation score

21
Understanding what is happening in ICT in Mozambique
Figure 17 (below) provides the overall scores for each of the 12 RIA TRE assessment countries in 2012, showing that all 12 RIA countries have negative overall TRE scores at present.
Figure 17: Country comparison for overall TRE scores Source: RIA TRE assessment data 2011-12
Figure 17 also shows that Rwanda’s overall TRE score is the least negative and Ethiopia’s the most negative. Mozambique, meanwhile, sits third from the bottom, ahead of only Ethiopia and South Africa.
Ine!ective E!ective
Ethiopia
South Africa
Mozambique
Cameroon
Botswana
Uganda
Nigeria
Ghana
Kenya
Tanzania
Namibia
Rwanda

22
Evidence for ICT Policy Action
Figure 18 (below) shows the progression of RIA TRE assessment country scores from 2006 through to 2009, and then to 2012. With the exceptions of the scores achieved by Tanzania and Mozambique in 2009, all the overall scores are negative. Ethiopia and South Africa appear to be the worst performers across the three TRE assessments, while Ghana has the best average overall score (though always negative) across the three assessments.
Figure 18: Overall TRE scores (2006, 2009 and 2012) Source: RIA TRE assessment data 2006-2012
2006 2009 2012
Ine!ective E!ective
Ethiopia
South Africa
Mozambique
Cameroon
Botswana
Uganda
Nigeria
Ghana
Kenya
Tanzania
Namibia
Rwanda
Mozambique did not continue its positive progression and fell down the ladder

23
Understanding what is happening in ICT in Mozambique
4HYRL[�Z[Y\J[\YL�HUK�ÄUHUJPHS�WLYMVYTHUJLMozambique’s telecommunications network infrastructure consists of the international segment (via the two submarine cable carriers SEACOM and EASSy) and the national segment, which is a combination of fixed-line incumbent TDM’s backbone infrastructure and the mobile networks of Mcel, Vodacom and the new entrant Movitel.
The telecommunications market is divided in two major segments, namely fixed and mobile. Despite the liberalisation process, the incumbent TDM is still the only operator in fixed telephony.
In the mobile sector Mcel and Vodacom were the first two entrants, recently joined by the third operator, Movitel, which was awarded its licence in 2011. The number of mobile subscribers has been growing continuously, as opposed to the situation for fixed voice, where TDM, despite investments and e!orts to o!er innovative services and promotional packages, has not been able to increase the number of its subscribers.
Public payphones
Fixed public payphones are rapidly disappearing, while mobile public payphones are still in operation. But their clear decrease in use means they too will meet their “natural death” in the near future. The market is full of cheap handsets and mobile operators are o!ering smaller and cheaper airtime slots that appear to be more attractive and convenient than mobile payphones.
In the 2008 RIA ICT Survey, the share of individuals who had used a public payphone during the previous three months was 3% in Mozambique, while in 2012 the percentage is three times higher (9.4%). However, this increase can be explained by the fact that in 2008, mobile public phones had only just been introduced in Mozambique, and therefore their use at that time was still very limited. In 2012, despite the expected decrease in payphone user numbers resulting from lower prices of handsets in the market and the drop in mobile call costs, the use in relative terms is higher, especially outside the urban areas. In urban areas these days, one can hardly find a public payphone.
There are fewer and fewer TDM kiosks with fixed-line public phones. According to TDM’s annual reports, the number of fixed public phones dropped from 6 287 to 2 071 between 2005 and 2009, as shown in Table 3. The current TDM payphone numbers are unknown. (Such data are now di"cult to access because TDM in 2010 stopped publishing annual reports via its website.)
Table 3: TDM’s !xed-line public payphones, 2005 to 2009
2005 2006 2007 2008 2009
Number of fixed-line public payphones 6 287 4 239 3 194 2 453 2 071
Source: TDM annual reports 2005-2009
Mozambique’s "xed sector is dominated by the lone TDM while mobile has Vodacom, Mcel and Movitel
Public payphones are still in operation but their availability is in rapid decline
The prevalence of public payphones has been in decline since 2005

24
Evidence for ICT Policy Action
Figure 19 below shows the evolution of public payphone use, between 2008 and 2012, in 12 RIA ICT Survey countries.
Figure 19: Share of individuals who have used a public payphone during the past 3 months, RIA ICT Survey Coun-tries, 2008 and 2012Source: RIA ICT Survey data 2007-08 and 2011-12
Tanzania
Namibia
Kenya
Rwanda
Botswana
Ethiopia
Ghana
Uganda
2007-08 2011-12
1.1%97.3%
1.3%14.5%
5.4%24.1%
5.7%73%
Mozambique
9.6%
9.4%
27.4%
14.7%
12.8%6%
3%
14.8%39.5%
Nigeria21%
South Africa28.7%
42.2%
49.4%44.1%
Cameroon
6.5%

25
Understanding what is happening in ICT in Mozambique
Fixed-line telephonyThe fixed telephony network has remained small and has slightly decreased in size since its peak at 88 120 subscriber connections in 2011 (Figure 20). In 2012, the number of subscribers was 87 984.
Figure 20: Fixed-line (TDM) telephony subscriber numbers, 2005 to 2013Source: INCM (2013)
Mobile telephony
Growth in individual use of mobile telephony continues to be strong in Mozambique. Figure 21 below shows the evolution of the number of mobile subscribers between 2003 and 2013, during which time the three operators registered significant growth, reaching a total of 8 804 986 subscribers in 2012. Until the end of 2011, the mobile market was shared between Mcel and Vodacom. Since then, the relative balance between Mcel and Vodacom has been disrupted by the new entrant Movitel, which reported 1 250 000 subscribers at the end of its first year of operation (2012), against 4 885 842 and 2 894 144 declared by Mcel and Vodacom, respectively, in the same year.
2005
65 99270 313
2006
78 000
2007
78 324
2008
82 447
2009
88 062
2010
88 120
2011
87 984
20132012
84 998
Fixed line telephone use has decreased since 2011
The use of mobile phone networks has been much stronger than that of "xed lines

26
Evidence for ICT Policy Action
Figure 21: Growth in mobile telephony subscriber numbers, 2003 to 2013Source: INCM (2013)
A key Movitel strategy has been to build out its network into locations uncovered or poorly covered by the other two operators, thus extending ICT inclusion to deep rural areas. With Movitel in the market, competition is increasing, and now quality of service standards – which have to date not been enforced by the regulator, despite existing regulations – are becoming an important issue.
Table 4 below shows the evolution of mobile operators’ annual tra"c between 2007 and 2012, in comparison to TDM’s fixed-line tra"c. There have been substantial tra"c decreases on TDM’s fixed network, with rapid growth on both Mcel and Vodacom networks. (Movitel’s tra"c data for 2012 are not available.)
Table 4: Annual telephony tra#c, 2007 to 2012
OperatorTra#c (millions of minutes)
2007 2008 2009 2010 2011 2012 2013 - Q1
Vodacom 298 580 572 409 512 657 903 292 525 228 400 189 1 241 961 961 3 185 228 930 751 944 078
Mcel 648 696 119 388 143 420 1 635 656 773 814 606 976 3 583 826 759 4 246 535 096 990 698 221
TDM 702 037 000 726 431 000 32 377 175 92 957 000 117 849 000 78 728 000 27 269 000
Source: INCM (2013)
Mcel Vodacom Movitel Total
8 000 000
10 000 000
12 000 000
6 000 000
4 000 000
2 000 000
02006 2007 2008 2009 2010 2012 201320112003 2004 2005
Movitel’s strategy has been to build out its network into locations uncovered or poorly covered by the other two operators
27
Understanding what is happening in ICT in Mozambique
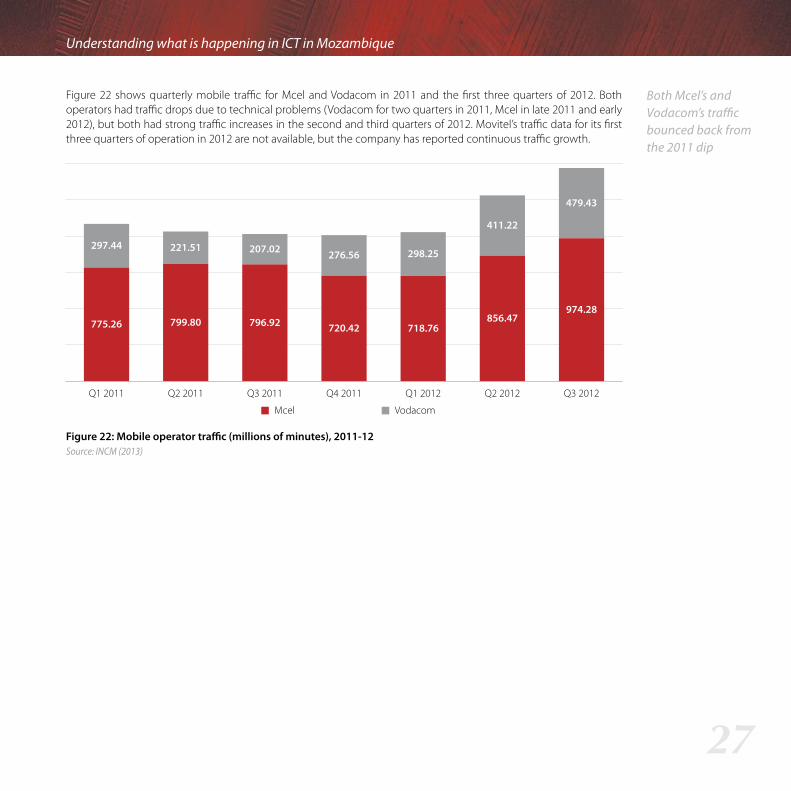
Figure 22 shows quarterly mobile tra"c for Mcel and Vodacom in 2011 and the first three quarters of 2012. Both operators had tra"c drops due to technical problems (Vodacom for two quarters in 2011, Mcel in late 2011 and early 2012), but both had strong tra"c increases in the second and third quarters of 2012. Movitel’s tra"c data for its first three quarters of operation in 2012 are not available, but the company has reported continuous tra"c growth.
Figure 22: Mobile operator tra#c (millions of minutes), 2011-12Source: INCM (2013)
Mcel Vodacom
Q1 2011
775.26
297.44
799.80
221.51
796.92
207.02
720.42
276.56
718.76
298.25
856.47
411.22
974.28
479.43
Q2 2011 Q3 2011 Q4 2011 Q1 2012 Q2 2012 Q3 2012
Both Mcel’s and Vodacom’s tra#c bounced back from the 2011 dip

28
Evidence for ICT Policy Action
:LJ[VY�ÄUHUJPHS�WLYMVYTHUJLDespite the process of reformation in 2004 intended to liberalise the policy and legislation framework, the fixed-voice market is still under TDM’s monopolistic control. TDM is 100% state-owned and its financial performance has been questionable over the past 10 years. Unable to cope with the competition and associated challenges posed by the mobile sector, TDM has seen stagnation and even regression in the number of subscribers to its fixed network in recent years (as shown earlier in Figure 20).
Both the fixed and mobile sectors have reported substantial investments over the last decade. TDM’s investments have been focussed on digitisation of the public switched telephone network (PSTN) and replacement of copper- and microwave-based network infrastructure with fibre-optic systems – specifically by building network redundancy through regional fibre rings and putting in place broadband solutions based on WiMAX technology to bridge the “last mile” in remote areas. Meanwhile, Mcel and Vodacom, and now also Movitel, have been concentrating their e!orts on expanding their respective network coverage and improving QoS by introducing new mobile technologies such as 3G.
With its notable upstart investments of USD250million over two years, Movitel has managed to establish a network infrastructure consisting of more than 1 500 base stations (more than Mcel and Vodacom combined) and over 20 000 km of fibre, becoming the largest fibre network in Mozambique, closely followed by TDM’s network.
Figure 23 below illustrates the latest developments in terms of the backbone network infrastructure of TDM and Movitel respectively.
Figure 23: TDM and Movitel !bre network infrastructure Source: TDM (2013) and INCM (2013)
TDM is still 100% owned by the Government and maintains a monopoly over the "xed-line market
Movitel’s infrastructure investments have made it the largest "bre network in Mozambique

29
Understanding what is happening in ICT in Mozambique
Figure 24 below shows the value of investments made by all four operators – Vodacom, Mcel, TDM and Movitel – between 2003 and 2012.
Figure 24: Total investments by !xed and mobile operators (in USD millions) Source: INCM (2013)
After decreases between 2003 and 2007, the annual investment totals by all four operators grew significantly year-on-year between 2007 and 2011, before falling between 2011 and 2012.
In terms of financial performance, the four operators have together declared a total net income of USD3 690 709 000 during the same 2003 to 2011 period.
Figure 25 below represents the combined net income of all four operators between 2003 and 2012. The graph indicates that the total net income of all operators has grown very quickly between 2006 and 2009 and again between 2010 and 2011 – when Movitel entered the market.
Mcel Vodacom TDM Movitel Total
300 000
350 000
400 000
250 000
200 000
150 000
100 000
50 000
02006 2007 2008 2009 2010 201220112003 2004 2005
The combined net income of both "xed and mobile sectors spiked after Movitel entered the market

30
Evidence for ICT Policy Action
Figure 25: Fixed and mobile combined net income (in USD million)Source: INCM (2013)
In 2009, Mcel reported losses due to exchange rate fluctuations and external debt, while Vodacom registered an improvement by replacing ZAR debt with preferential shares. It is important here to mention that, Vodacom Mozambique is a branch of the South African company Vodacom Group. However despite its e!orts, Vodacom is still struggling to become profitable. Following the acquisition of Gateway Telecommunications by the Vodacom Group, the Mozambican subsidiary, Gateway Communications Mozambique (previously known as GS Telecom), was integrated into Vodacom Mozambique. This gives Vodacom Mozambique a new dimension in terms of service delivery, allowing it to go beyond regular mobile operations and target corporate business. Vodacom Mozambique’s new company profile now includes, amongst others, gateway services, network access solutions and corporate internet service provision. And Vodacom is currently rolling out a fibre backbone network infrastructure.
ICT pricing
Fixed and mobile services
As discussed above, the fixed market continues to decline, due to, inter alia, lack of competition and the “death” of fixed public payphones. Between 2000 and 2010, retail tari!s for fixed voice telephony were, on average, far lower than for mobile. But during the period 2010 to 2012, fixed tari!s became the same as mobile and then slightly higher (see Figre 26). And TDM’s leased lines for broadband data and internet are more expensive than internet services o!ered by the mobile providers.
In Figre 26, it can be seen that the biggest drop in mobile tari!s was between 2001 and 2003, a drop instituted by Mcel just before Vodacom entered the market. This tari! drop, from USD1.20 to USD0.40 in just two years, was a move by Mcel to meet impending competition.
2003
178 021
2004
244 629
2005
243 053
2006
227 289
2007
384 363
2008
489 806
2009
576 020
2010
572 656
2011
774 872
The Vodacom Group bought GS Telecom in Mozambique which gives it the option of operating gateway services
The "xed market continues to decline due the lack of success of the public payphone

31
Understanding what is happening in ICT in Mozambique
Figure 26: Mobile v. !xed voice tari"s, 2000-2012 (in USD per minute)Source: INCM (2013)
Figure 27 below shows the evolution in the cost, between Q4 2010 and Q4 2012, of Mcel’s and Vodacom’s cheapest prepaid mobile products in Mozambique – as calculated by RIA using the OECD mobile prepaid low-user price basket methodology (RIA, n.d.; OECD, 2010). Dominant operator Mcel’s cheapest product has for the most part been lower-priced than Vodacom’s (with the exception of Q2 and Q3 2011) and both operators decreased the price of their cheapest prepaid product significantly between Q4 2011 and Q2 2012, in response to the arrival of the new entrant Movitel.
Figure 27: Cheapest prepaid mobile basket in Mozambique, based on OECD low-user basket (in MZM)Source: RIA (n.d.)
Móvel Fixo
2000 2001 2002 2003 2004 2005 2006 2007 2008 2009 2010 2011 2012
0.8
0.1
1.2
0.2
1.0
0.2
0.4
0.2
0.4
0.2
0.4
0.2
0.4
0.2
0.5
0.2
0.6
0.40.3
0.2 0.20.3
0.2 0.2 0.2 0.2
700
600
500
400
300Q4 2010 Q3 2011 Q4 2011 Q1 2012 Q2 2012 Q3 2012 Q1 2013
Mcel Vodacom
Q4 2012Q1 2011 Q2 2011
Mcel has mostly had a cheaper product available in comparison to Vodacom even after the arrival of new entrant Movitel

32
Evidence for ICT Policy Action
Table 5 below presents the comparative ranking of prepaid prices during Q1 2013 across the 12 countries participating in the 2012 RIA ICT Survey. The table compares the ranking of all operators on one side and the ranking of the dominant operators by country on the other. (This table was extracted from the RIA prepaid price comparison table for the entire continent in Q1 2013.)
Table 5: RIA prepaid price comparison Q1 2013 (in USD)
All operators Dominant operators
USD Rank USD Rank
Kenya 2.58 3 4.37 5
Ghana 3.9 4 3.9 1
Ethiopia 4.3 7 4.3 4
Tanzania 5.01 8 8.32 12
Nigeria 5.77 9 9.48 15
Uganda 6.32 11 9.17 13
Rwanda 6.37 13 9.19 14
Botswana 11.75 18 14.66 25
Namibia 12.2 19 12.2 16
South Africa 12.57 23 14.91 26
Mozambique 14.02 28 14.02 24
Cameroon 17.13 37 17.32 33
Source: WEF (2011)
Mozambique was ranked 28 and 24 in the respective rankings of “All operators” and “Dominant operators”. Kenya has the best ranking (3) in the “All operators” category, followed by Ghana (4) and Ethiopia (7). In the ranking of “Dominant operators”, Ghana reached the first position in the group and on the continent, followed by Ethiopia (4) and Kenya (5). The worst rankings belong to Cameroon with positions 37 and 33 in “All operators” and “Dominant operator” respectively.
Broadband data/internet services
TDM’s uncapped fixed-line ADSL internet service has a speed of only 128 kbps, which fails to meet even the original ITU standard for broadband (256 kbps). Therefore, TDM ADSL cannot be considered in the RIA broadband price comparison with other African countries, for which a minimum speed of 256 kbps is required.
For mobile broadband internet in Mozambique, prepaid bundles of 1GB and 5GB are cheaper (at USD25 and USD57 respectively) than the cost of postpaid bundles of the same size (USD30 and USD68 respectively) or the cost of postpaid ADSL (USD62 for 5GB, with no discount for smaller bundles) (see Figure 28 below). Any new fixed-line broadband o!ering would likely need to be prepaid if it were to compete successfully with mobile broadband o!erings.
Mozambique scored very poorly in the comparison of prepaid voice costs
Mozambique’s "xed line sector does not enjoy broadband internet speeds and mobile is thus preferred

33
Understanding what is happening in ICT in Mozambique
Figure 28: Data bundle pricing (ADSL, prepaid mobile, postpaid mobile in USD)Source: RIA (n.d.)
Interconnection termination rates
Following the deliberations of a meeting held by the four operators (TDM, Mcel, Vodacom and Movitel) in September, 2012, the regulator INCM published a resolution (Resolução No. 46/2012, 2012) setting out a glide path for gradually reduced interconnection termination rates between 2013 and 2015, as shown in Table 9 below. The agreed rates are symmetrical for all operators. Departing from the current rate of MZM2.5 per minute in 2012, the rate will decrease gradually to MZM0.86 per minute in 2015. The INCM resolution indicates that the regulator may change the termination rates for 2014 and 2015 if so recommended by an impact study to conclude in September 2013.
Table 6: Interconnection termination rate glide path, 2013 to 2015
InterconnectionYears and termination rates (MZM per minute)
2013 2014 2015
Termination on TDM network 1.99 1.44 0.86
Termination on Mcel network 1.99 1.44 0.86
Termination on Vodacom network 1.99 1.44 0.86
Termination on Movitel network 1.99 1.44 0.86
Source: INCM, Resolução No. 46/2012, (2012)
5GB
1GB
Postpaid ADSL Postpaid mobile Prepaid mobile
62
62
68
30
200100500
25
57
150
Mozambique’s interconnection rates are symmetrical

34
Evidence for ICT Policy Action
ICT access and use
As referred to in previous sections, ICT access in Mozambique has improved significantly in terms of, inter alia, the number of users, the geographic coverage of the national backbone infrastructure and associated facilities and, to some extent, the retail prices. Table 7 below provides some of Mozambique’s major ICT access and use indicators for 2012.
Table 7: Mozambique ICT access indicators, 2012
Indicator Number Penetration (%)
Fixed lines 87 984 0.38
Households with working fixed-lines 20 628 0.39
Active mobile SIM cards 8 804 986 38.2
Individuals with a mobile phone 5 514 603 42.5
Individuals without a mobile phone but with an active SIM card 458 191 3.53
Number of mobile phone owners with two or more active SIM cards 1 130 332 20.5
Source: INCM (2012), RIA ICT Survey data 2011-12
Telephony
Table 8 below shows the evolution of fixed and mobile telephony subscriber numbers between 2004 and 2012, with more than 8million Mozambicans now having telephony connections, either mobile or fixed.
Table 8: Telephony access numbers (Mcel, Vodacom, Movitel, TDM) between 2004 and 2012
2004 2005 2006 2007 2008 2009 2010 2011 2012
Mcel 393,271 1,221,316 1,483,160 2,315,658 2,957,445 3,647,452 4,330,596 4,375,828 4,885,842
Vodacom 217,204 434,960 856,157 1,079,295 1,447,561 2,323,329 2,971,495 3,479,517 2,894,144
Movitel 1,025,000
Total mobile 610,475 1,656,276 2,339,317 3,394,953 4,405,006 5,970,781 7,302,091 7,855,345 8,804,986
TDM - 65,992 70,313 78,000 78,324 82,447 88,062 88,120 87,984
Grand Total 610,475 1,722,268 2,409,630 3,472,953 4,483,330 6,053,228 7,390,153 7,943,465 8,892,970
Source: INCM (2013)
Mozambique’s telephony access and use has improved signi"cantly

35
Understanding what is happening in ICT in Mozambique
Figure 29 shows the share of households with a working fixed-line telephony connection.
Figure 29: Share of households with working !xed-line telephony connectionsSource: RIA ICT Survey data 2011-12
The share of households with working fixed-line telephony in Mozambique is only 0.4% in 2012. The main reasons for the very low figures are the lack of fixed-line population coverage and high costs of fixed-line telephony use.
Rwanda 0.2%
Nigeria 0.3%
Tanzania 0.4%
Mozambique 0.4%
Kenya 0.6%
Uganda 1.5%
Ghana 1.8%
Cameroon 2.2%
Ethiopia 4%
Namibia 11.5%
Botswana 15%
South Africa 18%

36
Evidence for ICT Policy Action
Figure 30 below shows the share of individuals who own a mobile phone handset.
Figure 30: Share of individuals owning a mobile phone handset Source: RIA ICT Survey data 2011-12
In Mozambique, the share of individuals who own a mobile phone is 42.5%, putting Mozambique at the bottom, for this measure, among the featured countries – far behind South Africa (84.2%) and Botswana (80%).
Ethiopia
Rwanda
Tanzania
Mozambique
Cameroon
Uganda
Namibia
Ghana
Share of individuals owning a mobile phone Share of individuals using the internet
2.7%18.3%
6%24.4%
3.5%35.8%
11.1%42.5%
14.1%44.5%
7.9%46.7%
16.2%56.1%
12.7%59.5%
Nigeria 18.4%
Kenya 26.3%74%
66.4%
29%80%
Botswana
33.7%84.2%
South Africa
Mozambique has very poor mobile phone ownership and internet use

37
Understanding what is happening in ICT in Mozambique
Radio and TV
Figure 31 below shows the share of individuals who listen to radio in RIA study countries, comparing 2012 findings with 2008 findings. Six RIA countries have registered a decrease in the share of individuals who listen to the radio between 2008 and 2012. The most drastic drop occurred in Cameroon where the share has dropped to half (leading to concern, expressed in the Cameroon 2012 RIA SPR, that there may have been a misunderstanding among survey respondents regarding the question).
In Mozambique, there has been an increase in the share of radio listeners from 42.1% in 2008 to 53.8% in 2012.
Figure 31: Share of individuals who listen to radio Source: RIA ICT Survey data 2011-12 and 2007-08
The radio listener figures for Mozambique show that despite growth in the share of individuals who watch TV (see below), radio is still the main mass communications medium in Mozambique, especially in the rural areas (where newspapers and TV are either absent or irrelevant due to illiteracy and language barriers).
Cameroon
South Africa
Botswana
Ethiopia
Ghana
Namibia
Tanzania
Nigeria
Rwanda
Kenya
Uganda
61.9%
68.5%
55.3%
39%
87.7%
70.4%
65.1%
68.5%
83.6%
87.3%
30.4%
55.6%
Mozambique 42.1%53.8%
56.2%
57.2%
64.6%
68.2%
70.8%
75.6%
77.1%
81.1%
82.3%
2007/20082011/2012Radio is still common in rural areas where newspapers and TV cannot "nd literate and well-versed audiences

38
Evidence for ICT Policy Action
Between the 2008 and 2012 RIA ICT Surveys, the share of individuals who watch TV has grown in all RIA study countries except Rwanda and Cameroon (where slight decreases were registered) (see Figure 32 below).
Figure 32: Share of individuals who watch TV Source: RIA ICT Survey data 2011-12 and 2007-08
In the case of Mozambique, Figure 32 shows that the share of TV watchers increased from 11.3% in 2008 to 43.3% in 2012. This growth can be attributed to a number of factors including:
consistent Government e!orts to extend coverage of the national electricity grid;
increased use of alternative power sources, such as solar panels, in rural areas;
decreasing TV prices;
an increased number of TV stations; and
increased geographic coverage of TV signals due to competition among stations as well as INCM’s use of the Universal Access and Service Fund to finance TV transmission projects aimed at serving the less commercially attractive rural areas of the country.
We also see that the share of TV viewers in Mozambique, at 43.3%, is 10% lower than that of radio at 53.8%.
Rwanda
Uganda
Tanzania
Namibia
Ethiopia
Cameroon
Ghana
Nigeria
Botswana
Kenya
South Africa
12.9%
27.5%
34.9%
39.2%
19%
53.6%
57%
49.4%
56.8%
69.1%
12.3%
27.2%
31.5%
39.5%
40.3%
53%
Mozambique 11.3%43.3%
57.9%
58.8%
59.8%
66.1%
77.7%
2007/20082011/2012
TV penetration and viewership has increased immensely to rival that of radio

39
Understanding what is happening in ICT in Mozambique
Internet
Internet access and use have been hampered by the fact that the cost of internet access has not yet decreased as much as was predicted when Mozambique’s linkages to abundant wholesale bandwidth via the SEACOM and EASSy international undersea cables came into operation. The key reason for the lack of significant retail cost reductions for internet is that, despite the positive developments in wholesale access to broadband, competition remains minimal on the retail side. Figure 33 shows the share of households, in RIA study countries, with a working internet connection (fixed or mobile).
Figure 33: Share of households with working internet connection (!xed or mobile) Source: RIA ICT Survey data 2011-12
Ethiopia 0.5%
Rwanda 0.7%
Tanzania 0.8%
Uganda 0.9%
Cameroon 1.3%
Ghana 2.7%
Nigeria 3.4%
Mozambique 3.6%
Botswana 8.6%
Namibia 11.5%
Kenya 12.7%
South Africa 19.7%
The costs of internet access have not decreased su#ciently due to the lack of competition, leaving internet access and use at low levels

40
Evidence for ICT Policy Action
Figure 34 below shows the how often each type of internet access is used at a household level in 2012 RIA ICT Survey countries.
Figure 34: Types of internet connections among households with internet access (multiple responses)Source: RIA ICT Survey data 2011-12
Figure 34 shows that in Mozambique, 68.7% of households with internet access use mobile phone handsets to get connected, followed by 56.8% of those using mobile 3G modems, 16.1% using wired ISDN connections, 10.6% using wireless broadband and 4.5% using wired ADSL. With the exception of Cameroon and Tanzania, the rest of the 2012 RIA ICT Survey countries follow similar tendencies regarding the use of mobile phone handsets and mobile 3G modems for internet access. Botswana is leading the list of countries where mobile phone handsets are the primary means of internet connection at household level.
Mobile internet access is far more popular than access to and use of ADSL and wireless broadband
Botswana
Mobile phone handset Mobile 3G modem Wireless broadband Wired ADSLWired ISDN
83.9% 15.3%47.7%
Rwanda 76.4% 42.2% 2.9% 26.4%
21.5%
South Africa 56.4% 54.8% 4.9% 22.0%7.5%
4.9%
Namibia 75.3% 59.8% 34.8% 16.3% 4.5%
Nigeria 63.4% 1.9%56.9% 46.6% 7.6%
Cameroon 9.8% 16.6%69.4% 33.5% 3.2%
Ghana 68.9% 0.5%65.0% 18.7% 23.8%
Ethiopia 55.7% 18.7% 13.7% 10.6% 8.3%
Tanzania 64.3% 45.8% 82.3%7.1% 6.3%
Kenya 71.5% 10.3% 31.8%45.2% 2.4%
Uganda 73.3% 63.7% 11.2% 37.3% 7.8%
Mozambique 68.7% 56.8% 10.6% 16.1% 3.9%

41
Understanding what is happening in ICT in Mozambique
Figure 35 below shows the share of individuals in the RIA study countries who own mobile phone handsets capable of browsing the internet.
Figure 35: Share of individuals owning a mobile phone capable of browsing the internetSource: RIA ICT Survey data 2011-12
Figure 35 shows that South Africa is in the lead (51%) among the countries featured in the share of individuals who own a mobile phone that is capable of browsing the internet. Mozambique is in third position on this measure at 30.1%.
Ethiopia 6.5%
Uganda 14.9%
Cameroon 14.9%
Rwanda 19.1%
Tanzania 19.2%
Nigeria 22.7%
Ghana 28.5%
Botswana 29.5%
Mozambique 30.1%
Namibia 30.7%
Kenya 32.3%
South Africa 51%

42
Evidence for ICT Policy Action
Figure 36 shows the places of individual internet use (excluding household access over a fixed line) across RIA study countries.
Figure 36: Places of internet access (multiple responses)Source: RIA ICT Survey data 2011-12
Figure 36 shows a heavy reliance on the mobile phone for internet access among Mozambique’s internet users – a heavier reliance, in percentage terms, than in Kenya, South Africa or Ghana (three other countries with high use of the mobile phone for internet connectivity).
Mozambique has one of the most mobile-dependent internet sectors
0%
10%
20%
30%
40%
50%
60%
70%
80%
90%
100%
Mobile phone handset At work Place of education Internet caféAnother person’s home
Moz
ambi
que
Ethi
opia
Tanz
ania
Rwan
da
Ugan
da
Ghan
a
Cam
eroo
n
Nam
ibia
Nige
ria
Keny
a
Botsw
ana
Sout
h Af
rica
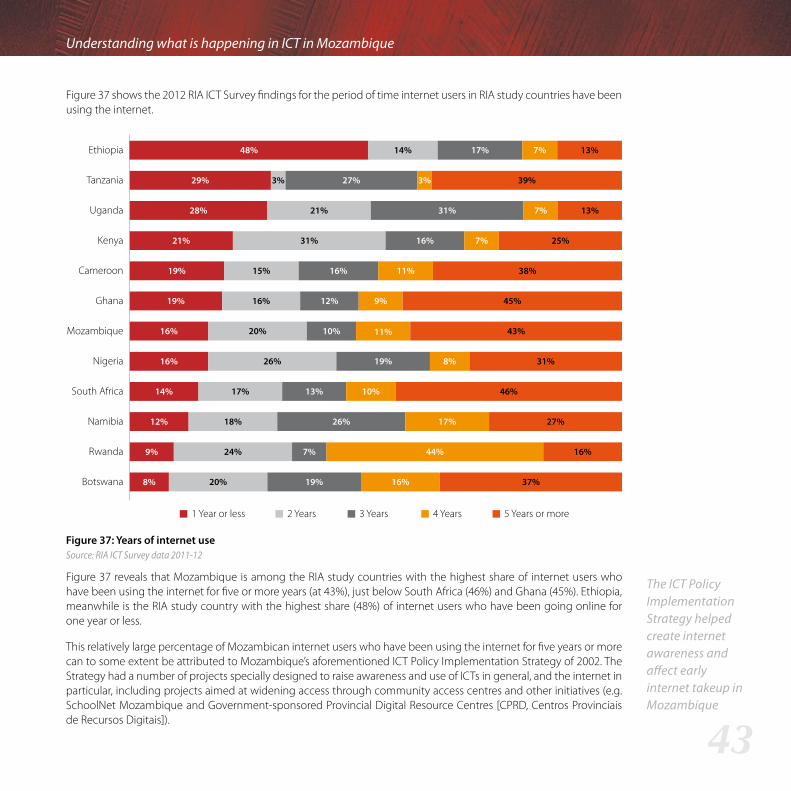
43
Understanding what is happening in ICT in Mozambique
Figure 37 shows the 2012 RIA ICT Survey findings for the period of time internet users in RIA study countries have been using the internet.
Figure 37: Years of internet useSource: RIA ICT Survey data 2011-12
Figure 37 reveals that Mozambique is among the RIA study countries with the highest share of internet users who have been using the internet for five or more years (at 43%), just below South Africa (46%) and Ghana (45%). Ethiopia, meanwhile is the RIA study country with the highest share (48%) of internet users who have been going online for one year or less.
This relatively large percentage of Mozambican internet users who have been using the internet for five years or more can to some extent be attributed to Mozambique’s aforementioned ICT Policy Implementation Strategy of 2002. The Strategy had a number of projects specially designed to raise awareness and use of ICTs in general, and the internet in particular, including projects aimed at widening access through community access centres and other initiatives (e.g. SchoolNet Mozambique and Government-sponsored Provincial Digital Resource Centres [CPRD, Centros Provinciais de Recursos Digitais]).
Botswana
Rwanda
Namibia
South Africa
Nigeria
Mozambique
Ghana
Cameroon
Kenya
Uganda
Tanzania
1 Year or less 2 Years 3 Years 5 Years or more4 Years
Ethiopia
8%
9%
12%
14%
16%
16%
19%
19%
21%
28%
29%
17%
43%
21%
20%
7%
18%
13%
26%
7% 13%
12%
11%
31%
3%3%
16%
15%
20%
19%
10%
17%
44%
19%
27%
31%
7%
16%
16%
10%
8%
26%
24%
16%
39%
48% 7%14% 17% 13%
25%
38%
9% 45%
11%
31%
27%
16%
37%
46%
The ICT Policy Implementation Strategy helped create internet awareness and a!ect early internet takeup in Mozambique

44
Evidence for ICT Policy Action
Figure 38 shows the frequency of individual internet use in RIA study countries.
Figure 38: Frequency of individual internet use Source: RIA ICT Survey data 2011-12
Figure 38 shows that the share of individuals in Mozambique who use the internet every day or almost every day is 44.7% -- more frequent use than users in Ghana or Cameroon, and just below the levels of use in South Africa and Kenya.
Mozambique internet users use the internet on a fairly regular basis but not as regularly as most countries
Every day or almost every day At least once a week Less than once a monthAt least once a month
Botswana 55% 26% 11% 8%
Ghana 43% 21.5%32%
Rwanda 57% 25% 17%
South Africa 64% 24% 9%
Mozambique 45% 13%33% 10%
Nigeria 34% 22%27% 17%
Cameroon 19% 40% 33% 8.5%
Ethiopia 47% 44% 7.5%
Tanzania 52% 24% 10% 14.5%
Kenya 53% 35% 10.5%
Uganda 28% 49% 18% 6%
Namibia 59% 35% 5%

45
Understanding what is happening in ICT in Mozambique
Figure 39 provides reasons from the 2008 and 2012 RIA ICT Surveys for the low or non-use of the internet by Mozambicans.
Figure 39: Reasons for non-use, or infrequent use, of internet in MozambiqueSource: RIA ICT Survey data 2007-08 and 2011-12
Figure 39 shows that the “too expensive to use” reason has increased as a barrier to internet use, cited by 46.1% of non- or limited users of the internet in 2012, up from 19.9% in 2008. This is an indication that, as stated earlier, despite the abundance of wholesale international bandwidth, internet use is still strongly challenged by high pricing in the insu"ciently competitive domestic retail internet market. Meanwhile, the share of individuals who cited lack of interesting content for them as the main reason for little or no use of the internet has fallen from 22.4% in 2008 to 4.5% in 2012.
Social networking
The use of social networking applications in the country is increasing rapidly, especially among young people. Although the real number is unknown, it is estimated that about 6% of the population (equivalent to about 1.38million people) is using the internet (ITU, n.d.). Of those, approximately 362 560 are Facebook subscribers (Socialbakers, n.d.). Other popular social networking applications in Mozambique include Twitter and blogs.
The growth in popularity of online social networking in Mozambique is presumably influenced by the fact that internet-enabled mobile handsets are becoming cheaper and, on the other hand, mobile operators have introduced prepaid packages for smaller bandwidth fractions to attract those who cannot a!ord standard internet bundles.
Figure 40 compares, across all 12 RIA ICT Survey countries, the share of internet users with an email address with the share of internet users signed up for an online social networking application such as Facebook.
There is no interesting content for me
Lack of local language content
The internet is very slow
Too expensive to use
2007/2008 2011/2012
4.5%22.4%
13.3%0.8%
34%14.6%
46.1%19.9%
The pricing of internet services is still too high for most people to access and use
The use of social networking is made easier by the a!ordability of web-capable handsets

46
Evidence for ICT Policy Action
Figure 40: Share of internet users that have an email address v. share signed up for an online social networking application (multiple responses)Source: RIA ICT Survey data 2011-12
The share of internet users with an email address in Mozambique is 64.36%, while those who have signed up for an online social networking application is 58%. Rwanda leads RIA study countries in both these measures, with shares of 97% and 88% respectively for the two measured indicators. Ethiopia scores lowest among RIA study countries for both measures.
Mobile money
Mobile money in Mozambique is still in a very early stage. Mcel was the first mobile operator to introduce mobile money by launching mKesh in 2011. However, due to the lack of a clear business model or market strategy, this service did not pick up as quickly as desired and ended up being more oriented towards airtime sales than towards mobile money operations. Today, the company is adopting new strategies in an e!ort to correct initial mistakes.
Meanwhile, Vodacom is set to launch its mobile money product, M-Pesa, in the first half of 2013. (M-Pesa has been successfully deployed by Safaricom in Kenya. Both Vodacom Mozambique and Safaricom are part of the UK-based Vodafone Group.)
Figure 41 shows the share of individuals in RIA study countries who use mobile money against the share of individuals who have a bank account. (The experience in other countries has been that mobile money tends to be particularly attractive to people who do not have bank accounts.)
Ethiopia
South Africa
Botswana
Namibia
Uganda
Nigeria
Tanzania
Kenya
Ghana
Cameroon
Rwanda
41%
75%
73%
81%
59%
50%
81%
81%
61%
88%
59%
66%
Mozambique 58%64%
78%
79%
80%
81%
86%
88%
90%
94%
97%
Social network (eg. Facebook)Email address
63%
Mozambique’s social networking users nearly match the number of the country’s email addresses
The mobile money market has not grown as successfully as expected and a strategy change is required in order to realign the sub-sector’s goals

47
Understanding what is happening in ICT in Mozambique
Figure 41: Share of individuals who use mobile money against share of individuals who have a bank accountSource: RIA ICT Survey data 2011-12
The share of individuals who reported using mobile money in Mozambique is a low 0.2%, while only16% have a bank account (suggesting significant potential demand for mobile money services). The leading mobile money country among RIA study countries is Kenya with 60.3%, while South Africa has the highest percentage (58.9%) of individuals owning a bank account.
In the case of Mozambique, the low share of individuals that have a bank account can be attributed to the low income levels of individuals and households. The majority of the labour force in Mozambique’s formal sector consists of people making low wages, with the minimum wage in Mozambique being less than USD100 per month. It is very di"cult for people with such low earnings to have enough savings to justify opening a bank account. However, companies increasingly use bank transfers to pay their workers, and in those cases it becomes necessary to open a bank account.
Ethiopia
Tanzania
Cameroon
Uganda
Rwanda
Ghana
Nigeria
Kenya
use mobile money have a bank account
3.7%
6.2%14.1%
10.8%0.4%
15.2%13.9%
Mozambique16%
0.2%
16.3%3.3%
29.4%1.3%
30.5%0.5%
44.5%60.3%
Botswana48.4%
Namibia56.3%
2.0%
10.5%
58.9%3.2%
South Africa
The lack of su#cient pay has disincentivised workers in Mozambique from opening a bank account

48
Evidence for ICT Policy Action
Conclusions and recommendations
Compared with the situation at the time of the previous RIA Mozambique SPR in 2010, the Mozambican ICT sector has registered noticeable growth, especially in the mobile sector where large investments in infrastructure have been made.
International bandwidth is no longer a constraint, with the capacity of the two international submarine cables landing in Mozambique, SEACOM and EASSy, still not close to their carrying capacity. However, this apparent bandwidth surplus, despite bringing new options for users in terms of service diversity, has not significantly reduced the cost of internet access, especially in relation to broadband internet – mainly due to the lack of competition in the network access layer.
Some of the major operators, who have the financial capacity to buy bandwidth in bulk from the submarine cable operators are becoming involved in the business of service provision to end-users and smaller ISPs.
The entry of the third mobile operator Movitel has shaken up the mobile market, leading to lower and more competitive prices, better voice and data coverage, and higher tra"c volumes. However, the lack of wholesale competition has not allowed price reductions to be as big as predicted, especially for broadband internet, for which the new entrant has adopted a very similar pricing approach to that of the other two operators. It would seem that there was inadequate regulatory intervention in support of the new entrant in order to give it the ability to exert pricing pressure on the incumbents, which would explain the poor TRE score for regulating competitiveness.
Despite some liberal market developments, there still has not been any new market entry in the fixed sector, and no further wholesale access to the fixed network (which is necessary to encourage services-based competition therein).
Movitel is engaged in expanding the coverage of its network infrastructure, and Mcel is using all possible means to retain its leading position in the market, while Vodacom continues to struggle to become profitable.
Despite all the achievements, the mobile sector is still held back by network congestion and a lack of supply, presumably because one or all of the following is/are true:
a lack of competition exists in the market;
entry costs are overly high, e.g. licence fees; and
there is a lack of competition regulation (necessary where there is a lack of competition and/or dominance in a market).
The situation requires more energetic intervention from the INCM and the Government, in order to protect consumer rights (in terms of the Telecommunications Law of 2004) and to ensure reasonable QoS.
The 2012 RIA TRE Survey results show that Mozambique’s regulatory environment is generally perceived by stakeholders as being “ine!ective”, especially in relation to QoS regulation and that of anti-competitive practices. However, some noticeable progress has been made in relation to the perception of regulation of interconnection where the new tari! glide path set for 2013-2015 is based on consensus amongst all operators (in contrast to the interconnection di"culties su!ered in 2010) (Mabila et al., 2010).
International bandwidth is no longer a constraint in the Mozambican ICT sector
There seems to be inadequate regulation for the new entrant to gain a foothold in the market
The mobile sector is still held back by network congestion and a lack of supply

49
Understanding what is happening in ICT in Mozambique
Mozambique’s fixed telephony market is in decline, with teledensity having decreased from 0.51% in 2001 to just 0.38% in 2012 (while mobile penetration has grown from 2.6% in 2003 to 48% in 2012) (INCM, 2013).
The country’s mega-projects, undertaken in support of resource exploitation (minerals, natural gas and oil), o!er excellent opportunities for development of the entire ICT sector, particularly the national backbone infrastructure.
There has been some progress in terms of policy and regulation. The INCM has made significant e!orts to strengthen its institutional capacity in terms of human resources and organisational structure. As a result, new regulatory instruments have been created and the Telecommunications Law of 2004 is set to be replaced by a new law, following a process of public consultation and review.
The major challenge for the regulator at present is enforcement. For instance, QoS continues to be a challenge in the mobile sector, but the INCM appears hesitant to enforce the applicable sanctions. The new telecommunications bill and resulting law need to give the INCM a wider gamut of regulatory remedies.
In relation to internet, there is a clear shift underway from traditional computer-based access to mobile access. Technological advances have brought internet features to cheaper mobile handsets, as opposed to the previous situation where only expensive smartphones were internet-enabled. Accordingly, more and more people rely on mobile phones to access the internet. Content-wise, the 2012 RIA ICT Survey has clearly indicated that internet uptake is being driven by use of social networks and social media. The internet is increasingly used for socialising rather than simply for information and research purposes (as used to be the case).
The majority of the population has no access to electricity. In 2011, the national electricity network grid covered only about 18% of the population (EDM, n.d.). Therefore, the Government must accelerate the national electrification program in order to improve the geographic coverage of the grid and provide access to electricity for all citizens.
As was also pointed out in the previous RIA Mozambique SPR, the National ICT Policy of 2000 is now very much out of date and must be reviewed as soon as possible. INTIC must lead the process and increase and mobilise its internal capacity so as to function as an e!ective national ICT observatory, which will help the Government to keep relevant and updated statistics in the sector.
Mega-projects in other Mozambican sectors has had indirect growth bene"ts for the ICT sector
The ICT regulator continues to struggle with successful enforcement of sector policies
The majority of the population still struggles to access the national electricity grid

50
Evidence for ICT Policy Action
Centro de Apoio à Informação e Comunicação Comunitária (CAICC) (2012), website, available at: www.caicc.org.mz/index.php/component/jbusinessdirectory/ (accessed 15 December 2012)
Comissão para a Política de Informática (CPInfo) (2000), Politica de Informática, (2000), Maputo.
Comissão para a Política de Informática (CPInfo) (2002), Estratégia de Implementação da Política de Informática, Maputo.
Conselho de Ministros (1998), Decreto Presidencial N° 2/98, 1998, Maputo.
Conselho de Ministros (2000), Resolução 28/2000, BR I Série, N° 49, 3° Supplemento, Decreto N° 50/2002, Maputo.
Electricidade de Moçambique (EDM) (n.d.), website, available at: www.edm.co.mz (accessed 12 December 2012).
Gaster, P, Cumbana, C., G.Macueve, L.N.C.Domingos, F. Mabila (2009), Digital Inclusion in Mozambique: A Challenge for All, Centro de Informatica da Universidade Eduardo Mondlane (CIUEM), Maputo.
Instituto Nacional das Comunicações de Moçambique (INCM) (2012a), Fundo do Serviço de Acesso Universal (FSAU) – Expansão do acesso às Telecomunicações nas cidades e zonas rurais, Maputo.
Instituto Nacional das Comunicações de Moçambique (INCM) (2012b), Proposta de Regulamento de Instalação de Infrastruturas de Telecomunicações em Edifícios e Projectos de Obras Públicas, Maputo.
Instituto Nacional das Comunicações de Moçambique (INCM) (2013), Response from regulator to RIA Requests for Information.
Instituto Nacional de Estatística (INE) (2007), III Recenseamento Geral da População e Habitação, Resultados Definitivos, Maputo.
Instituto Nacional de Estatística (INE) (2008), Anuário Estatístico 2007, Maputo.
Instituto Nacional de Estatística (INE) (2010), Projecções Anuais da População Total Rural e Urbana, 2007-2040, Maputo.
Instituto Nacional de Tecnologias de Informação e Comunicação (INTIC) (n.d.), website, available at: www.intic.gov.mz (accessed 12 December 2012).
International Telecommunciation Union (ITU) (2011), International Telecommunication Union (ITU) (2011), “Statistics” available at: www.itu.int/en/ITU-D/Statistics/Pages/stat/default.aspx (accessed 12 December 2012).
International Telecommunciation Union (ITU) (2012), “Mozambique Profile, ITU eye on ICT”, available at: www.itu.int/net4/itu-d/icteye/CountryProfile.aspx (accesed 21 July 2014)
International Telecommunciation Union (ITU) (n.d.), “Statistics”, available at: www.itu.int/en/ITU-D/Statistics/Pages/stat/default.aspx (accesed 21 July 2014)
LIRNEasia (2008), Manual of Instructions for Conducting the Telecom Regulatory Environment (TRE) Assessment, available at: www.lirneasia.net/wp-content/uploads/2008/04/lirneasia_tremanual_v21.pdf (accessed 12 December 2012).
Mabila, F., Mboane, J.M. and Mondlane, A. (2010), Mozambique ICT Sector Performance Review, 2009/2010, available at: www.researchictafrica.net/publications/ICT_Sector_Performance_Reviews_2010/Vol%202%20Paper%2016%20-%20Mozambique%20ICT%20Sector%20Performance%20Review%202010.pdf (accessed 12 December 2012).
Mcel (n.d.), website, available at: www.mcel.co.mz (accessed 12 December 2012).
Ministério da Ciência e Tecnologia (MCT) (2010), Ponto de Situação da Implementação dos Projectos Âncora da Estratégia de Governo Electrónico, Maputo.
Ministério da Ciência e Tecnologia (MCT) and Instituto Nacional de Tecnologias de Informação e Comunicação (INTIC) (2011), “Seminário nacional sobre a rede Electrónica do Governo (GovNET): Impacto da GovNET nos serviços de governo electrónico”, Maputo.
Organisation for Economic Co-operation and Development (OECD) (2010), “Revision of the Methodology for Constructing Telecommunication Price Baskets”, available at: www.oecd.org/sti/broadband/48242089.pdf (accessed 12 December 2012).
Portal de dados Moçambique (n.d.), Resumo dos Principais Indicadores Macroeconómicos/Taxa de Crescimento do PIB (%) (2010-2012), available at: www.ine.gov.mz/principais_indicadores/ (accessed 12 December 2012).
Portal do Governo de Moçambique (n.d.), website, available at: www.portaldogoverno.gov.mz/documentos (accessed 12 December 2012).
República de Moçambique (1999), Lei N° 14/99, Lei das Telecomunicações, de 1de Novembro, Maputo.
República de Moçambique (2002), Decreto N° 47/2002, de 26 Dezembro, Maputo.
República de Moçambique (2002), Decreto N° 50/2002, de 26 Dezembro, Maputo.
República de Moçambique (2004), Lei N° 8/2004, Lei das Telecomunicações, de 21 de Julho, Maputo.
República de Moçambique (2006), Estratégia das Telecomunicações, Decreto N°. 64/2006, de 26 de Dezembro, Maputo.
República de Moçambique (2007), Decreto Presidencial N°. 3/2007, de 8de Março, Maputo.
República de Moçambique (2010), Decreto Ministerial N° 153/2010 de 15 de Setembro, Maputo.
República de Moçambique (2011), Decreto N° 9/2011 - Boletim da República I SÉRIE — Número 18, de 4 Maio, Maputo.
References

51
Understanding what is happening in ICT in Mozambique
República de Moçambique (2012), Resolução N° 46/CA/INCM/2012 de 10 de Setembro, 2012, Maputo.
Research ICT Africa (RIA) (n.d.), “Fair Mobile”, available at: www.researchictafrica.net/prices/Fair_Mobile.php (accessed accessed 12 December 2012).
Secretariado Executivo da Comissão para a Política de Informática (2002), Estratégia de Implementação da Política de Informática, Maputo.
Socialbakers (n.d.), “Mozambique Facebook Statistics”, available at: www.socialbakers.com/facebook-statistics/mozambique (accesed 21 July 2014)
Telecomunicações de Moçambique (TDM) (2002), Relatório de Contas 2001, Maputo.
Telecomunicações de Moçambique (TDM) (2003), Relatório de Contas 2002, available at: www.tdm.mz/portdm/rc2002/rc2002.pdf (accessed 12 December 2012).
Telecomunicações de Moçambique (TDM) (2004), Relatório de Contas 2003, available at: www.tdm.mz/portdm/rcontas2003/rcontas2003%20.pdf (accessed 12 December 2012).
Telecomunicações de Moçambique (TDM) (2005), Relatório de Contas 2004, available at: www.tdm.mz/portdm/rc2004/rc04.pdf (accessed 12 December 2012).
Telecomunicações de Moçambique (TDM) (2006), Relatório de Contas 2005, available at: www.tdm.mz/portdm/rc2005/rc2005.pdf (accessed 12 December 2012).
Telecomunicações de Moçambique (TDM) (2007), Relatório de Contas 2006, available at: www.tdm.mz/portdm/rc2006/rc2006_big.pdf (accessed 12 December 2012)
Telecomunicações de Moçambique (TDM) (2008), Relatório de Contas 2007, available at: www.tdm.mz/portdm/rc_2007/rc2007.pdf (accessed 12 December 2012).
Telecomunicações de Moçambique (TDM) (2009), Relatório de Contas 2008, available at: www.tdm.mz/portdm/rc2008/rc2008.pdf (accessed 12 December 2012).
Telecomunicações de Moçambique (TDM) (2010), Relatório de Contas 2009, available at: www.tdm.mz/portdm/rc2009/rc_2009.pdf (accessed 12 December 2012).
Telecomunicações de Moçambique (TDM) (2013), website, available at: www,tdm.mz (accessed 12 December 2012).
UN Development Programme (UNDP) (2008), Mozambique National Human Development Report 2008: The Role of ICTs in Achieving the Millennium Development Goals, Maputo.
UN Develoment Programme (UNDP) (2011), Relatório Nacional do Desenvolvimento Humano de Moçambique 2011, Programa das Nações Unidas para o Desenvolvimento (PNUD), Maputo.
Unidade Técnica de Implementação da Política de Informática (UTICT) (2005a), Estratégia de Governo Electrónico de Moçambique, Maputo.
Unidade Técnica de Implementação da Política de Informática (UTICT) (2005b), Projecto Rede Electrónica do Governo-Fase Piloto, Relatório Final do Projecto, Maputo.
Unidade Técnica de Implementação da Política de Informática (UTICT) (2009a), Quadro de Interoperabilidade de Governo Electrónico (eGOV-RAPIDO), Maputo.
Unidade Técnica de Implementação da Política de Informática (UTICT) (2009b), Resumo sobre o Projecto Rede Electrónica do Governo - Fase de Extensão, Maputo.
Vodacom Mozambique (n.d.), website, available at: www.vm.co.mz (accessed 12 December 2012).
World Bank (n.d.), “Indicators”, available at: http://data.worldbank.org/indicator/ (accessed 12 December 2012).
World Economic Forum (WEF) (2011), The Global Information Technology Report 2010-2011, available at: www3.weforum.org/docs/WEF_GITR_Report_2011.pdf (accessed 12 December 2012).

52
Evidence for ICT Policy Action
Annexures
(UUL_\YL��!�L�.V]LYUTLU[�ÅHNZOPW�WYVQLJ[Z
Flagship project name Objective
Common Communication Platform and Interoperability Framework
Provision of a common communication platform for all institutions in the public sector.
State Financial Administration System (e-SISTAFE)
Provision of a secure and transparent financial system to support the internal operations of state and government institutions as well as their business transactions with citizens and the private sector.
Personal ID Registration System Provision of personal documents (e.g. IDs, passports, residence permit, driving licence) with reliable data and an integrated database.
Company Registry and Licensing System (SISCAL)
Facilitation and acceleration of the company registration and licensing process.
Land and Property Management System
Integration and optimisation of land and property registration.
Local Government Horizontal Integration System
Development and sharing of local government content, e.g. plans and projects (via websites) at district and municipality level, as well as facilitating public access to information.
Source: MCT (2010)
(UUL_\YL��!�6[OLY�L�.V]LYUTLU[�WYVQLJ[Z
Project name Objective
Legal Entities Registration System Improvement of the business environment in Mozambique by computerising the registration of legal entities.
Civil Registration System Computerisation of civil registration procedures, including registration records of births, marriages, divorces, deaths.
Criminal Record Information System (SIRC)
Facilitation and acceleration of the issuing of criminal record certificates. (In Mozambique, public appointments and most employers require candidates to provide a certificate showing a clean criminal record.)
One-Stop Shops (BAUs) and Provincial Digital Resource Centres (CPRD)
Integration of services and provision of a single point of entry/access (a one-stop shop) for citizens, and promotion of ICT access and training.
Source: MCT (2010)

ISSN: 2310-1156