policy compass workshop - 1st of june 2015
TRANSCRIPT

Policy Compass WorkshopProject Introduction
•1st June 2015 URBUN

Agenda
Today! - Policy Compass Project Workshop
Introduction of Policy Compass Project
Methodology - Three Pillars of Policy Compass
Policy Impact Modeling using Fuzzy Cognitive Map (FCM)
in Policy Compass – Two Case Study
Platform Demo
Q&A with short survey
2

Introduction of Policy Compass Project
• Policy Compass Project (FP7-ICT)(September 2013~ September 2016, 36 Month)
26 March 2015 WP4 – UBRUN, UK 3
www.policycompasss.eu

Introduction of Policy Compass Project
4WP4 – Berlin, Germany10 February 2015
• The main goal of Policy Compass is to develop a research prototype of an easy-to-use, highly visual and intuitive tool for social networks and eParticipation platforms, enabling citizens and public officials to easily create, apply, share, embed, annotate and discuss causal models, charts and graphs of historical data from trusted open data sources. The aim is to develop methods and tools that facilitate more factual, evidence-based, transparent and accountable policy evaluation and analysis.
• How to realize this goal?Let’s visit the platform after presentation(alpha version)
alpha.policycompass.eu
Official Page
policycompass.eu

Introduction of Policy Compass Project
1st June 2015 UBRUN, UK 5

Three Pillars of Policy Compass
• The Policy Compass methodology pillars represent different views on the Policy Compass platform centred on the particular interests of typical end users
• Evaluating Performance of Policies (EPP)
• Building Causal Policy Models (BCPM)
• Policy Impact Deliberation and Argument Mapping (PIDAM)
1st June 2015 6

1st Pillar - Evaluating Performance of Policies (EPP)
• EPP.1 Data discovery and processing• EPP.2 Metrics definition.
UBRUN, UK 7
1st Pillar - Evaluating Performance of Policies (EPP)
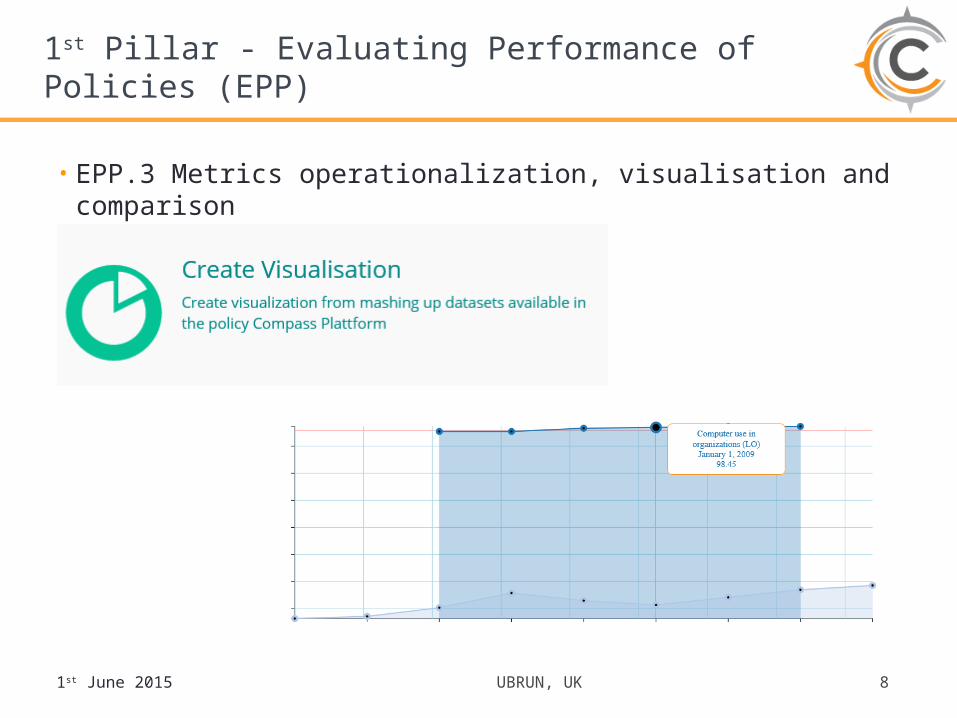
• EPP.3 Metrics operationalization, visualisation and comparison
1st June 2015 UBRUN, UK 8

1st Pillar - Evaluating Performance of Policies (EPP)
• EPP.4 Improving understanding of the data.
• EPP.5 Seeking explanation of policy impacts.
=>Next Pillar
1st June 2015 UBRUN, UK 9

2nd Pillar - Building Causal Policy Models (BCPM)
• BCPM 1. Creating/refining causal models.
1st June 2015 UBRUN, UK 10

2nd Pillar - Building Causal Policy Models (BCPM)
• BCPM 2. Turning causal networks to Fuzzy Cognitive Maps.• What is FCMs?
1st June 2015 UBRUN, UK 11
A weight wij describes the strength of causality between two concepts.

2nd Pillar - Building Causal Policy Models (BCPM)
• BCPM 3. Simulating FCMs and visualising impacts.
1st June 2015 UBRUN, UK 12

2nd Pillar - Building Causal Policy Models (BCPM)
• BCPM 4. Sharing knowledge and results.• Both the FCM models and the simulation results can be saved under a
user account and shared with others via social networks and web 2.0 channels.
1st June 2015 UBRUN, UK 13
0.20 0.20 0.20 0.20 0.20 0.20 0.20 0.20 0.20 0.20 0.20 0.20 0.20 0.20 0.20
0.20 0.46 0.46 0.46 0.46 0.46 0.46 0.46 0.46 0.46 0.46 0.46 0.46 0.46 0.46
0.80 0.55 0.61 0.61 0.61 0.61 0.61 0.61 0.61 0.61 0.61 0.61 0.61 0.61 0.61
0.20 0.67 0.62 0.63 0.63 0.63 0.63 0.63 0.63 0.63 0.63 0.63 0.63 0.63 0.63

3rd Pillar - Policy Impact Deliberation and Argument Mapping
• PIDAM.1 Initiate and participate in deliberations using Adhocracy• Adhocracy was conceived as a cooperative discourse, delegation and
voting software, which enables a collective, binding decision-making process online.
• PIDAM.2 Transform structured discussions into argument maps using Carneades
• PIDAM.3 Navigate argument maps using Carneades
1st June 2015 UBRUN, UK 14

Introduction of Policy Compass Project
1st June 2015 UBRUN, UK 15
1st Pillar
2nd Pillar
3rd Pillar

Policy Impact Modeling using Fuzzy Cognitive Map (FCM) technique in Policy Compass
16•1st June 2015
• Formal Representation
A weight wij describes the strength of causality between two concepts.

Fuzzy Cognitive Map (FCM) technique and Policy Compass
17•1st June 2015
• Obtaining Fuzzy Value • by Experts’ judgment• Or based on historical data
Very high -> 1
High -> 0.8
Medium -> 0.6
Low -> 0.4
Very Low -> 0.2
1 1 1 1 1 0.6 0.4 0.2 0.2 0.2 Fuzzified value

Fuzzy Cognitive Map (FCM) technique and Policy Compass
18•1st June 2015
• Weight between concepts• by Experts’ judgment• Or based on historical data – Automatic option
C1
C3
C2 C1 C2 C3
C1 0 1 1
C2 0 0 1
C3 0 0 0<Relationship matrix>
t0 t1 t2 t3
C1 0.2 0.4 0.2 0.2
C2 0.8 0.6 0.6 0.4
C3 0.2 0.4 0.6 0.8
<Status vector based on historical data>
C1 C2 C3
C1 0 w12 w13
C2 0 0 w23
C3 0 0 0<Weight matrix>
w12
w13
w23

Policy Impact Evaluation with FCM – usage example (1)
19•1st June 2015
• Let assume that policy maker in government now want to know the future impact of change in interest rate to stimulate the productive investment.
Present State of Concepts
Interest rate: 0.4 (low)
Productive Investments: 0.2 (very low)
Occupation: 0.8 (high)
Inflation: 0.2 (very low)

Policy Impact Evaluation with FCM – usage example (1)
20•1st June 2015
• Possible scenarios for a policy maker • Situation 1. If the interest rate is kept in the same level in the future• Situation 2. If the interest rate decreases to date• Situation 3. Or if the interest rate increases
Present State of Concepts
Interest rate: 0.4 (low)
Productive Investments: 0.2 (very low)
Occupation: 0.8 (high)
Inflation: 0.2 (very low)

Policy Impact Evaluation with FCM – usage example (1)
21•1st June 2015
<Result for Situation 1>
<Result for Situation 2>

Policy Impact Evaluation with FCM – usage example (1)
22•1st June 2015
<Result for Situation 3>
<Comparing the Simulation Results>
Decision Future Value of Productive Investment Future Value of InflationKeep the interest rate as it is 0.4206757 0.6106903Decreasing the interest rate 0.4600851 0.6117947Increasing the interest rate 0.3452465 0.6085645

Policy Impact Evaluation with FCM – usage example (2)
23•1st June 2015
• Drug Policy – Strengthen or Weaken the probation against drug?• What will happen in the future ?

Policy Impact Evaluation with FCM – usage example (2)
24•1st June 2015
• Drug Policy – Strengthen or Weaken the probation against drug?
Very High “National prohibition” Very Low “National prohibition”

Policy Impact Evaluation with FCM – usage example (2)
25•1st June 2015
National prohibition
Drug acreage
Gaining Syndicates Availability of drugs
Streetgangs Use of drug Drug price
0.8 (Higher) 0.5729 0.5872 0.5878 0.7054 0.680272 0.5116 0.7100
0.2 (Lower) 0.5714 0.5891 0.5753 0.7210 0.599626 0.5561 0.6078
• Comparison between two cases
vs.

DEMOQ&A with Short survey
26•1st June 2015