policy brief indicators for integrated territorial and urban development brief... · policy brief...
TRANSCRIPT
Policy Brief
Indicators for integrated territorial and urban development
Inspire Policy Making with Territorial Evidence

KEY MESSAGES
There is a need for a short list of indicators which reflect the impact of the integrated investments on an aggre-gate level.
Classical indicators should not be abandoned; however, a stronger focus should be put on indicators being able to capture the spatial distribution of what the integrated investments have accomplished.
Understanding the context is the key to choosing appro-priate indicators. The actual content, territorial coverage, budget and scope of the integrated investments matter, as well as the purpose for which the indicators are selected. One has to distinguish between measuring achievements in territories and populations and measur-ing the direct performance of the EU funded programmes and projects.
Hard indicators (based on registered data) should be complemented with softer qualitative indicators (based on people’s perceptions). This approach would help engage local communities to understand the real achievements
on the ground, particularly those which are less tangible and not measurable in numerical terms.
Composite indicators (indices) can be used as an effec-tive tool to communicate the overall effectiveness of the integrated investments, especially in cases when it is hard to find single indicators that capture territorial aspects of investments. However, the actual meaning of a composite indicator (what is being measured) should always be kept in mind to over/under estimating the effects of integrated investments.
Timing should be taken into account. Most of the indica-tors used for measuring the territorial impact of integrated investments require time to capture the effects.
Registered statistics may often prove to be a better source of data than official statistics. In many instances, information included in national registers is overlooked because of possible non-compliance with statistical standards; however, careful examination of data can rem-edy this problem.
The Common Provisions Regulation (No 1303/2013) has introduced new tools that can be used to implement terri-torial strategies in an integrated manner by combining several funds and thematic objectives and addressing the development of a territory across sectors, namely com-munity-led local development (Articles 32-35) and inte-grated territorial investments (Article 36). The Regulation on the European Regional Development Fund (ERDF) explicitly lays down that at least 5 % of the ERDF resources allocated at national level for the Investment for growth and jobs goal shall be allocated to integrated actions for sustainable urban development (Article 7,
Regulation No 1301/2013). In this case, it can be done through integrated territorial investments or a specific operational programme, or a specific priority axis.
To what extent is it possible to measure the move towards integrated territorial and urban development? What kind of indicators and data is needed to capture the impact of integrated investments on territorial and urban develop-ment across sectors? As the implementation of the inte-grated development strategies is under way it is para-mount to understand the added value of investments being implemented in an integrated way.
The purpose of this policy brief is to offer advice on how to measure the impact of integrated investments, using insights from the ESPON 2013 projects which focused on indicator development and analysis: Indicators of Territorial Cohesion (INTERCO), Key Indicators for Territorial Cohesion and Spatial Planning (KITCASP), Spatial Indicators for the ‘Europe 2020 Strategy’ Territorial Analysis (SIESTA), and ESPON Atlas. It offers a synthesis of the vast amount of information presented in the ESPON projects and recommends a short and clear set of indicators which could be used for measuring the impact of integrated investments. In addition, recommendations on how to attribute the impact of integrated investments to change in the impact indicators are also presented.
2 ESPON // espon.eu
Policy Brief // Indicators for integrated territorial and urban development

1. How is measuring the territorial impact of integrated investments different from any other impact measurement? Problem statement
1 Van der Zwet, A., Bachtler J., Ferry M., McMaster I. and Miller S. 2017. Integrated Territorial and Urban Strategies: How Are ESIF Adding Value in 2014-2020? Final Report to the European Commission. European Policies Research Centre. Publications Office of the European Union, Luxembourg. http://ec.europa.eu/regional_policy/sources/docgener/studies/pdf/integrated_strategies/integrated_strategies_en.pdf.
Going beyond sectoral impact to measure effectiveness of investments at territorial levelIn standard practice, the impact of investments for inte-grated territorial and urban development is measured and evaluated using classical sectoral indicators that meas-ure the impact of the investments under the sectoral poli-cies. A few illustrative examples can be mentioned that show how the impact of integrated investments is being measured in terms of the indicators:
▪ education – capacity of supported childcare or education infrastructure;
▪ health – population covered by improved health services;
▪ energy efficiency – decrease in annual primary energy consumption by public buildings.
This approach is not inherently wrong, as it follows the normal practice of monitoring and evaluation by putting emphasis on measuring the direct outcomes (results) of the investments. Sometimes the emphasis is narrowed down to the output indicators by over-relying on “count-ing” the direct outputs of the investments, for instance “km of built road”, “number of houses renovated” or “num-ber of people instructed”.
However, in that way, the actual impact of the investments on the territory is overlooked. There is a need for a stronger focus on how to link integrated investments with the impact on development in the territory across sectors.
Figure 1 Measuring effectiveness of integrated investments through territoriality of various sectoral impacts
Territorialimpact
Education Health Economy Transport
Sectoralimpact
Sectoralimpact
Sectoralimpact
Sectoralimpact
Source: Made by the ESPON EGTC
Distinguishing between indicator frameworks and measurement levelsIntegrated investments at territorial level also pose a chal-lenge in terms of the complexity involved regarding the content, the scale and the implementation mechanism. Thus, when it comes to measuring the impact of such investments, contextualisation and choice of indicators can cause confusion.
Indicators relevant to measuring the impact of integrated investments at territorial level are a mixture of indicators related to the programme and project framework for which the EU funding is used, and indicators which are normally used to measure the overall effectiveness of the integrated strategies. It is also pointed out in the research of the European Commission that the indicators are a mixture of those used for the operational programmes and others that are specific to strategies1.
3ESPON // espon.eu
Policy Brief // Indicators for integrated territorial and urban development
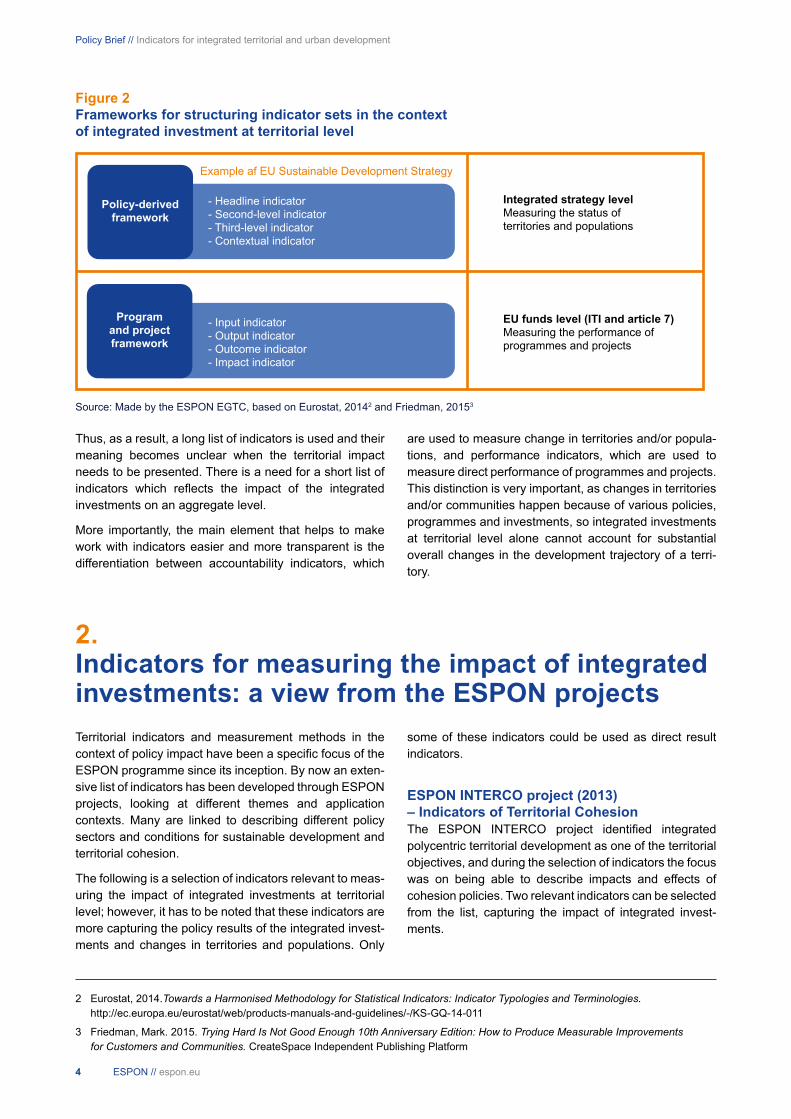
Figure 2 Frameworks for structuring indicator sets in the context of integrated investment at territorial level
2 Eurostat, 2014.Towards a Harmonised Methodology for Statistical Indicators: Indicator Typologies and Terminologies. http://ec.europa.eu/eurostat/web/products-manuals-and-guidelines/-/KS-GQ-14-011
3 Friedman, Mark. 2015. Trying Hard Is Not Good Enough 10th Anniversary Edition: How to Produce Measurable Improvements for Customers and Communities. CreateSpace Independent Publishing Platform
- Headline indicator- Second-level indicator- Third-level indicator- Contextual indicator
Example af EU Sustainable Development Strategy
Policy-derivedframework
Integrated strategy levelMeasuring the status of territories and populations
EU funds level (ITI and article 7)Measuring the performance of programmes and projects
Programand projectframework
- Input indicator- Output indicator- Outcome indicator- Impact indicator
Source: Made by the ESPON EGTC, based on Eurostat, 20142 and Friedman, 20153
Thus, as a result, a long list of indicators is used and their meaning becomes unclear when the territorial impact needs to be presented. There is a need for a short list of indicators which reflects the impact of the integrated investments on an aggregate level.
More importantly, the main element that helps to make work with indicators easier and more transparent is the differentiation between accountability indicators, which
are used to measure change in territories and/or popula-tions, and performance indicators, which are used to measure direct performance of programmes and projects. This distinction is very important, as changes in territories and/or communities happen because of various policies, programmes and investments, so integrated investments at territorial level alone cannot account for substantial overall changes in the development trajectory of a terri-tory.
2. Indicators for measuring the impact of integrated investments: a view from the ESPON projectsTerritorial indicators and measurement methods in the context of policy impact have been a specific focus of the ESPON programme since its inception. By now an exten-sive list of indicators has been developed through ESPON projects, looking at different themes and application contexts. Many are linked to describing different policy sectors and conditions for sustainable development and territorial cohesion.
The following is a selection of indicators relevant to meas-uring the impact of integrated investments at territorial level; however, it has to be noted that these indicators are more capturing the policy results of the integrated invest-ments and changes in territories and populations. Only
some of these indicators could be used as direct result indicators.
ESPON INTERCO project (2013) – Indicators of Territorial CohesionThe ESPON INTERCO project identified integrated polycentric territorial development as one of the territorial objectives, and during the selection of indicators the focus was on being able to describe impacts and effects of cohesion policies. Two relevant indicators can be selected from the list, capturing the impact of integrated invest-ments.
4 ESPON // espon.eu
Policy Brief // Indicators for integrated territorial and urban development

Table 1 Selection of Indicators from the ESPON INTERCO project (2013)
Indicator Measurement unit Notes
Population potential living within 50 km Person Expressed as being above or below defined average figure
Net migration rate Person Usually expressed per thousand of population; can be positive or negative
Source: ESPON INTERCO project
BOX 1
How can ESPON INTERCO project indicators be used to determine impact of integrated investments?
Rationale for using the indicator “Net migration rate” in the impact assessmentThis indicator captures the net outcome of immigration and emigration in a given year. If, for instance, the emigration is exceeding immigration then the rate is negative. This indicator gives information about the impact of investments on many levels, because migration is related not only to people’s preferences and choices, but also to the attractiveness of a territory. It can be considered a proxy for the overall attractiveness of a region in terms of labour markets, education, quality of life, welfare, infrastructure, etc.
Rationale for using the indicator “Population potential living within 50 km” in the impact assessmentThis is defined as the number of people within reach of 50 km airline distance for a system of 1 x 1 km (or other distri-bution) grid cells. For each cell the reachable population can be calculated. It is a proxy for the demand for provision of (public) services, for market potential and for polycentricity. In other words, if a territory maintains a low potential over time, the impact of investment might prove to be ineffective, as individuals and companies do not see the benefit of concentration close to development centres.
ESPON KITCASP project (2013) – Key Indicators for Territorial Cohesion and Spatial PlanningThe ESPON KITCASP targeted analysis project used an extensive consultation process within five stakeholder territories to select key indicators to measure integrated
spatial development. Integrated spatial development was understood as encompassing balanced regional develop-ment and settlement infrastructure alignment, entailing well-managed and effective spatial development that is tailored to local needs.
Table 2 Selection of Indicators from the ESPON KITCASP project (2013)
Indicator Measurement unit Notes
Natural population change Person Usually expressed per thousand of population; can be positive or negative
Newly completed private dwellings as a percentage of the total housing stock
%
Modal split of passenger transport Passenger-kilometers Based on transport by passenger cars, buses and coaches, and trains
Access to public services (hospitals and schools)
Travel time minutes
Source: ESPON KITCASP project
5ESPON // espon.eu
Policy Brief // Indicators for integrated territorial and urban development

BOX 2
How can ESPON KITCASP project indicators be used to determine impact of integrated investments?
Rationale for using the indicator “Natural population change” in the impact assessmentThis indicator captures the difference between the numbers of live births and deaths. At the level of impacts of inte-grated investments, it provides information on the extent to which the general socioeconomic conditions, infrastructure and public services are favourable for starting a family. It also shows the composition of the population and gives some information about the investments’ ability to attract younger people who would see their future in the particular territory. Overall, the indicator provides valuable information on any future developments in a territory in terms of depopulation and whether or not the investments are changing any trends in this respect.
Rationale for using the indicator “New completed private dwellings as a percentage of the total housing stock” in the impact assessmentThis indicator provides an overall assessment of whether or not the level of investment and economic development is sufficient for people to decide to stay in a territory. New dwellings and capital investments indicate the attractiveness of the territory.
Rationale for using the indicator “Access to public services (hospitals and schools)” in the impact assessmentThis is a classical indicator providing an understanding of whether or not public services and thus investments are organised in an effective manner in terms of geographical spread, providing transportation possibilities and ensuring proper transport networks.
Rationale for using the indicator “Modal split of passenger transport” in the impact assessmentThis is defined as the percentage share of each mode of transport in total inland transport, expressed in passenger-kilo-metres. This indicator, in contrast to accessibility and connectivity indicators, which are more related to the transport sector, measures overall economic and sociocultural activity. It indicates whether or not people move to do things, serving as a proxy for determining the impact of integrated investments in terms of creating vibrant and active societies.
Map 1 Natural population change in European regions, 2015
500 km
Malta
Acores (PT)
Guyane (FR)
Madeira (PT)
Reunion (FR)Mayotte (FR)
Canarias (ES)
Liechtenstein
Martinique (FR)
Guadeloupe (FR)
Natural population change
Regional level: NUTS 3 (2013)Source: ESPON 2020 DATA AND MAPS UPDATES (2017)
Origin of data: Eurostat (2017); ESPON (2017)UMS RIATE for administrative boundaries
© ESPON, 2017
Difference between births and deaths per 1000 habitants, 2015
No data available
-8,73 - -0,97
-0,96 - 0
0,01 - 0,2
0,21 - 0,67
0,68 - 181,03
Source: ESPON 2020 Data and Maps Updates project, 2017
6 ESPON // espon.eu
Policy Brief // Indicators for integrated territorial and urban development

Map 2 Areas of poor access to three or four out of the main ten Services of General Interest (SGIs) (at risk of becoming inner peripheries)
500 km
Malta
Acores (PT)
Guyane (FR)
Madeira (PT)
Reunion (FR)Mayotte (FR)
Canarias (ES)
Liechtenstein
Martinique (FR)
Guadeloupe (FR)
Areas at risk of becoming inner peripheries
© ESPON, 2017
Regional level: Grid level (2.5x2.5 km)Source: ESPON PROFECY, 2017
Origin of data: TCP International Accessibility Model, 2017 UMS RIATE for administrative boundaries
Areas of poor access to three or four SGIs,but not identified as inner peripheries
Areas of risk to become innerperipheries in the future
No data
Notes:- all areas with poor access to three or four SGIs are considered as areas of risk- outermost regions excluded from analysis
Source: ESPON PROFECY project, 2017
ESPON SIESTA project (2013) – Spatial Indicators for the ‘Europe 2020 Strategy’ Territorial AnalysisThe ESPON SIESTA project attempted to measure the extent to which Europe 2020 strategy targets are being
achieved at a territorial level. The project came up with an extensive list of indicators and also presented an aggre-gate index, some of the indicators appeared in the ESPON Atlas (http://atlas.espon.eu/) in the chapter “Integrated View to Territorial Development”.
BOX 3
Rationale for using the indicator “Long-term unemployed persons as a proportion of total unemployed people” in the impact assessment
This indicator provides an indication of economic development and possible persistent structural problems. Unemploy-ment as such is an inevitable shortcoming of the economic cycle; however, a large proportion of persons being unem-ployed for a long time can indicate social exclusion problems: economic development which is not inclusive. Thus, long-term unemployment can provide an aggregate view of the overall impact of integrated investments.
7ESPON // espon.eu
Policy Brief // Indicators for integrated territorial and urban development

3. Potential use of composite indicators (indices) to measure impact of integrated investments
4 ESPON EGTC. 2016. Polycentric Territorial Structures and Territorial Cooperation. Policy Brief. https://www.espon.eu/topics-policy/publications/policy-briefs/polycentric-territorial-structures-and-territorial
Composite indicators (indices) present yet another approach to measuring territorial development in a simple way through a single quantitative figure by combining several indicators into one.
To avoid the problem of not being able to attribute some parts of the investments to the composite indicator (index), only relevant indicators can be selected and their contribution to the overall index calculated. Most of the methodologies used for calculating the composite indica-
tors allow for such calculations. In this way, the potential impact of the integrated investments can be more con-cretely specified.
Polycentricity IndexIn 2016, the ESPON EGTC developed an easy to under-stand polycentricity index which was presented in the ESPON policy brief “Polycentric Territorial Structures and Territorial Cooperation” (see map 3)4 .
Map 3 Potentials for further polycentric development in Europe (based on polycentricity composite indicator developed by the ESPON EGTC)
500 km
Malta
Acores (PT)
Guyane (FR)
Madeira (PT)
Reunion (FR)Mayotte (FR)
Canarias (ES)
Liechtenstein
Martinique (FR)
Guadeloupe (FR)
Polycentric development potentials
Regional level: NUTS 3 (version 2013)Source: ESPON EGTC, 2016
Origin of data: TOWN 2014, Accessibility Update 2014, TANGO 2013UMS RIATE for administrative boundaries
© ESPON, 2016
+++-+---
++-+--+-
+-++-+--
Urb
an s
truct
ure
Acc
essi
bilit
y
Terr
itoria
l coo
pera
tion
HighLow
+-
Polycentric development
Source: ESPON EGTC Policy Brief “Polycentric Territorial Structures and Territorial Cooperation”, 2016
8 ESPON // espon.eu
Policy Brief // Indicators for integrated territorial and urban development
Polycentricity fosters balanced regional development and territorial cohesion. Therefore, integrated investments, especially in cities should result in territories becoming more polycentric. ESPON’s Polycentricity index can be
adapted (and modified if necessary) to national contexts, taking into account data availability, and used for the pur-pose of measuring the impact of integrated investments.
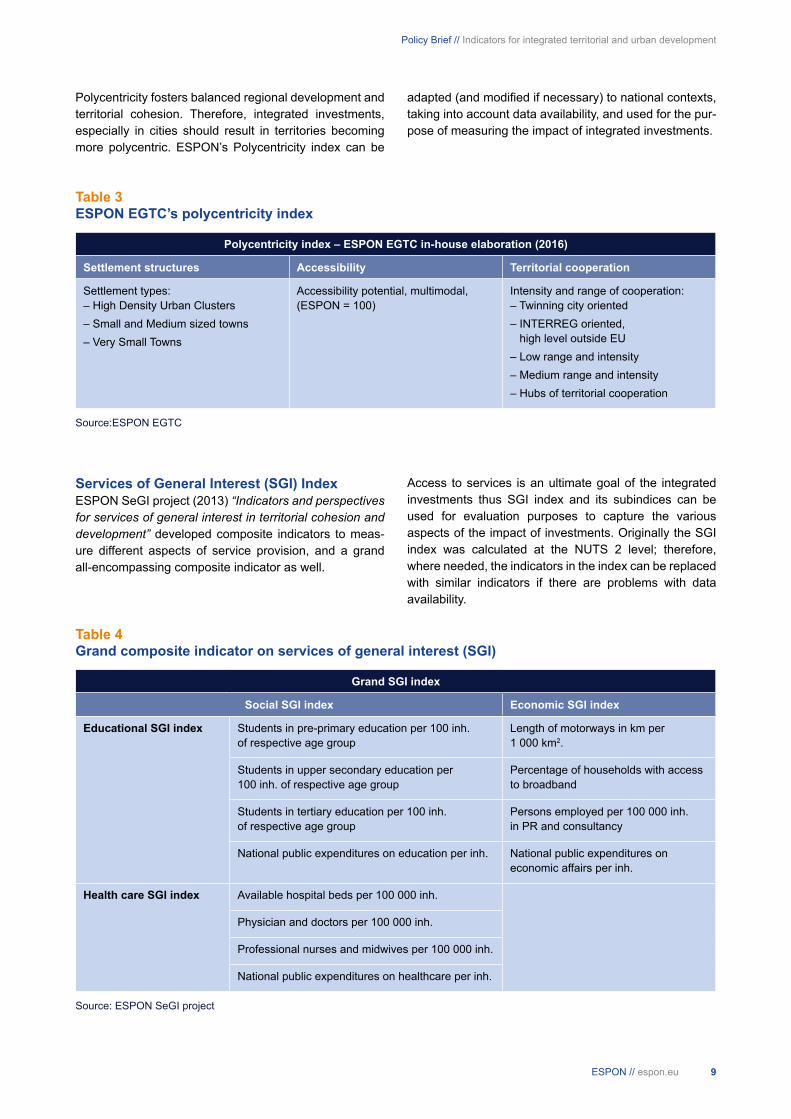
Table 3 ESPON EGTC’s polycentricity index
Polycentricity index – ESPON EGTC in-house elaboration (2016)
Settlement structures Accessibility Territorial cooperation
Settlement types:– High Density Urban Clusters– Small and Medium sized towns– Very Small Towns
Accessibility potential, multimodal, (ESPON = 100)
Intensity and range of cooperation:– Twinning city oriented– INTERREG oriented,
high level outside EU– Low range and intensity– Medium range and intensity– Hubs of territorial cooperation
Source:ESPON EGTC
Services of General Interest (SGI) IndexESPON SeGI project (2013) “Indicators and perspectives for services of general interest in territorial cohesion and development” developed composite indicators to meas-ure different aspects of service provision, and a grand all-encompassing composite indicator as well.
Access to services is an ultimate goal of the integrated investments thus SGI index and its subindices can be used for evaluation purposes to capture the various aspects of the impact of investments. Originally the SGI index was calculated at the NUTS 2 level; therefore, where needed, the indicators in the index can be replaced with similar indicators if there are problems with data availability.
Table 4 Grand composite indicator on services of general interest (SGI)
Grand SGI index
Social SGI index Economic SGI index
Educational SGI index Students in pre-primary education per 100 inh. of respective age group
Length of motorways in km per 1 000 km2.
Students in upper secondary education per 100 inh. of respective age group
Percentage of households with access to broadband
Students in tertiary education per 100 inh. of respective age group
Persons employed per 100 000 inh. in PR and consultancy
National public expenditures on education per inh. National public expenditures on economic affairs per inh.
Health care SGI index Available hospital beds per 100 000 inh.
Physician and doctors per 100 000 inh.
Professional nurses and midwives per 100 000 inh.
National public expenditures on healthcare per inh.
Source: ESPON SeGI project
9ESPON // espon.eu
Policy Brief // Indicators for integrated territorial and urban development
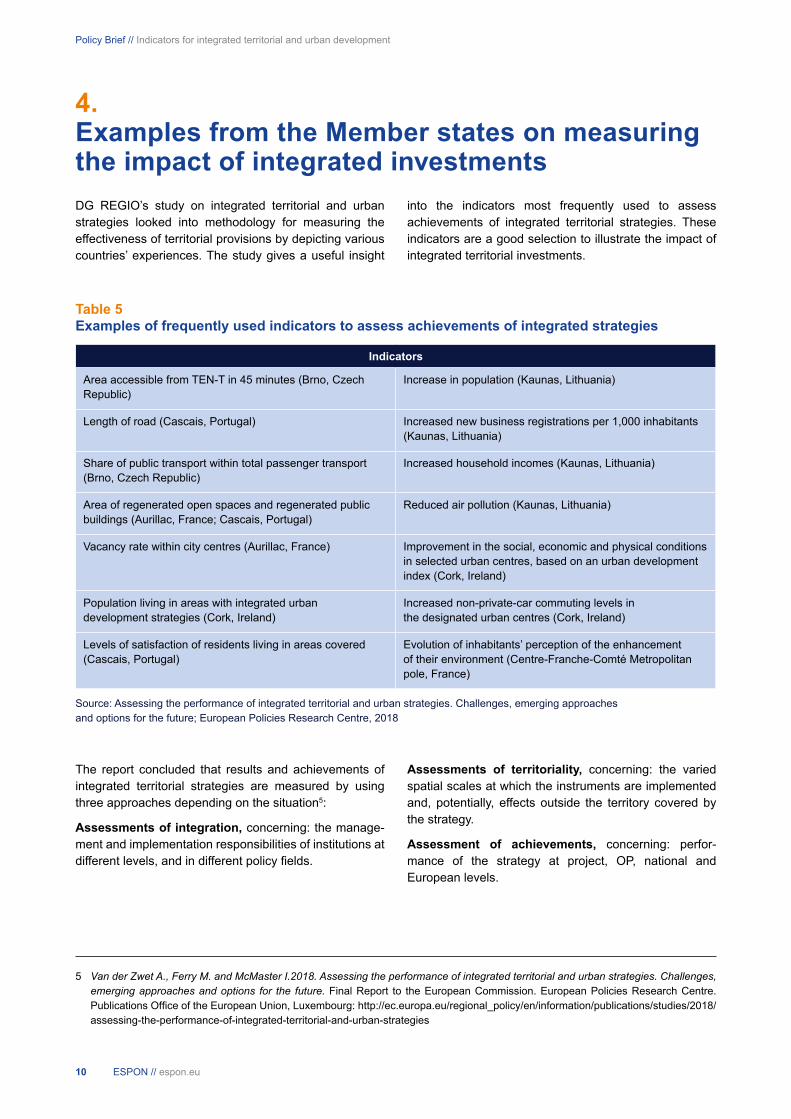
4. Examples from the Member states on measuring the impact of integrated investmentsDG REGIO’s study on integrated territorial and urban strategies looked into methodology for measuring the effectiveness of territorial provisions by depicting various countries’ experiences. The study gives a useful insight
into the indicators most frequently used to assess achievements of integrated territorial strategies. These indicators are a good selection to illustrate the impact of integrated territorial investments.
Table 5 Examples of frequently used indicators to assess achievements of integrated strategies
Indicators
Area accessible from TEN-T in 45 minutes (Brno, Czech Republic)
Increase in population (Kaunas, Lithuania)
Length of road (Cascais, Portugal) Increased new business registrations per 1,000 inhabitants (Kaunas, Lithuania)
Share of public transport within total passenger transport (Brno, Czech Republic)
Increased household incomes (Kaunas, Lithuania)
Area of regenerated open spaces and regenerated public buildings (Aurillac, France; Cascais, Portugal)
Reduced air pollution (Kaunas, Lithuania)
Vacancy rate within city centres (Aurillac, France) Improvement in the social, economic and physical conditions in selected urban centres, based on an urban development index (Cork, Ireland)
Population living in areas with integrated urban development strategies (Cork, Ireland)
Increased non-private-car commuting levels in the designated urban centres (Cork, Ireland)
Levels of satisfaction of residents living in areas covered (Cascais, Portugal)
Evolution of inhabitants’ perception of the enhancement of their environment (Centre-Franche-Comté Metropolitan pole, France)
Source: Assessing the performance of integrated territorial and urban strategies. Challenges, emerging approaches and options for the future; European Policies Research Centre, 2018
The report concluded that results and achievements of integrated territorial strategies are measured by using three approaches depending on the situation5:
Assessments of integration, concerning: the manage-ment and implementation responsibilities of institutions at different levels, and in different policy fields.
5 Van der Zwet A., Ferry M. and McMaster I.2018. Assessing the performance of integrated territorial and urban strategies. Challenges, emerging approaches and options for the future. Final Report to the European Commission. European Policies Research Centre. Publications Office of the European Union, Luxembourg: http://ec.europa.eu/regional_policy/en/information/publications/studies/2018/assessing-the-performance-of-integrated-territorial-and-urban-strategies
Assessments of territoriality, concerning: the varied spatial scales at which the instruments are implemented and, potentially, effects outside the territory covered by the strategy.
Assessment of achievements, concerning: perfor-mance of the strategy at project, OP, national and European levels.
10 ESPON // espon.eu
Policy Brief // Indicators for integrated territorial and urban development

5. Methods for attributing impact of integrated investments to change in the impact indicators
6 See: http://ec.europa.eu/regional_policy/en/policy/evaluations/guidance/#2; especially Evalsed Sourcebook on methods and tech-niques regarding impact evaluation: http://ec.europa.eu/regional_policy/sources/docgener/evaluation/guide/evaluation_sourcebook.pdf
7 See: https://www.espon.eu/tools-maps/espon-tia-tool.
Any change (over time) in the abovementioned ESPON and other indicators of integrated territorial and urban development can be theoretically attributed to the impact of the integrated investments. However, understanding the exact attribution can be achieved only through an impact evaluation study examining the specific context and content of the integrated investments and their con-tribution to the territorial development.
Impact evaluation and a results-oriented approach have become a major component of cohesion policy, with the European Commission providing extensive guidance6. Normally an impact evaluation falls into a category of “theory-based evaluation” or “counterfactual impact eval-uation” (each having a clear set of methods). As this is well documented, there is no need to repeat the whole set of methods, but perhaps it would be valuable to single out some basic useful approaches.
Quantitative techniquesA regression type of analysis can be used to determine whether or not funding used for integrated investments (independent variable), while controlling for other factors, can explain the territorial distribution of the abovemen-tioned ESPON indicators for integrated territorial and urban development (dependent variable).
Qualitative approachesIntegrated territorial investments are complex. Therefore, sometimes people on the ground can say more about the impact by pointing out concrete examples of what has worked and what has not worked. Thus, survey data exploring people’s perceptions of the achievements can be a valuable addition to the evaluation process, espe-cially during an economic recession, when investments may not generate an instant positive effect on the econ-omy and territorial development.
Simple quantitative methods of looking at correlationsESPON’s 2006 programme already had an experience of trying to draw conclusions on the extent to which EU structural funds had an impact on territorial development (ESPON 2.2.1. project "Territorial effects of structural funds"). The study used either simple two-variable corre-lation or more advanced graphic mapping techniques. Here again, one of the variables could be funding used for integrated investments, correlated with the abovemen-tioned ESPON indicators for integrated territorial and urban development.
Territorial impact assessment techniquesIn recent years ESPON’s territorial impact assessment (TIA) Quick Scan Methodology has become a widely used technique to determine ex-ante the territorial impact of EU legislative proposals using the online TIA web tool7, supported by expert evaluations. ESPON’s TIA Quick Scan Methodology can also be used for an ex-post terri-torial impact assessment to determine the extent to which funding used for integrated investments could have had an impact on the abovementioned ESPON indicators for integrated territorial and urban development.
11ESPON // espon.eu
Policy Brief // Indicators for integrated territorial and urban development
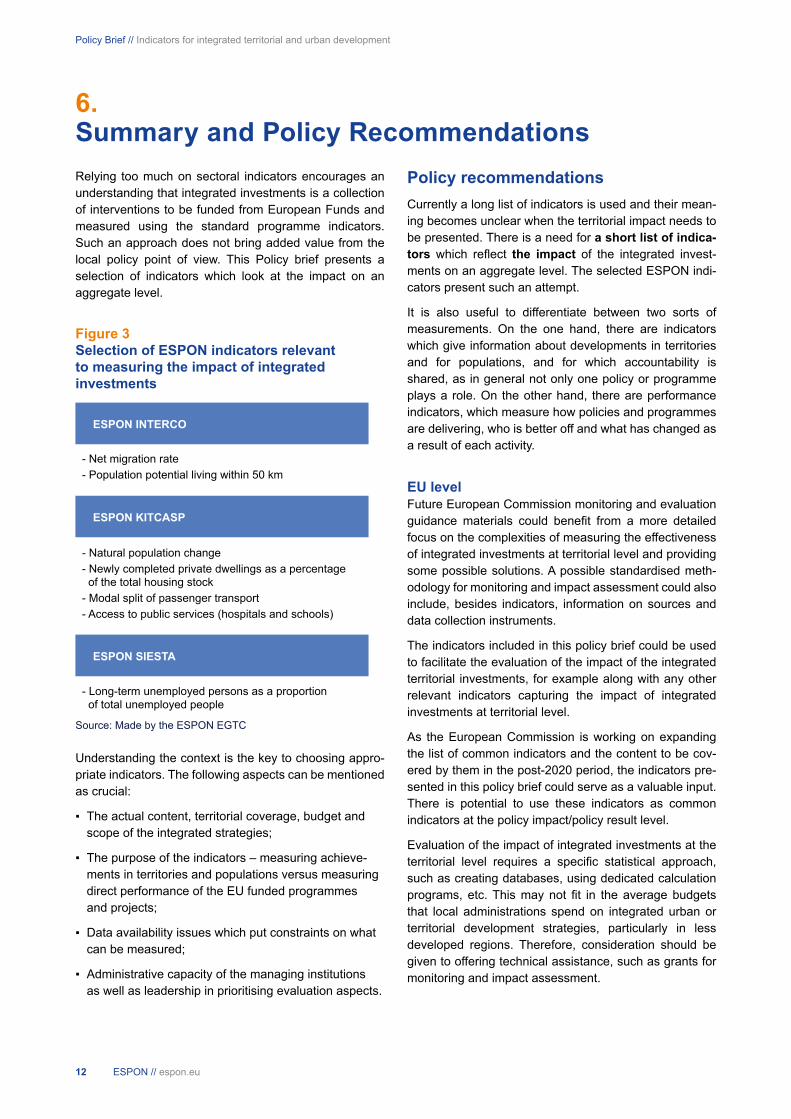
6. Summary and Policy Recommendations Relying too much on sectoral indicators encourages an understanding that integrated investments is a collection of interventions to be funded from European Funds and measured using the standard programme indicators. Such an approach does not bring added value from the local policy point of view. This Policy brief presents a selection of indicators which look at the impact on an aggregate level.
Figure 3 Selection of ESPON indicators relevant to measuring the impact of integrated investments
ESPON INTERCO
ESPON KITCASP
ESPON SIESTA
- Net migration rate- Population potential living within 50 km
- Natural population change- Newly completed private dwellings as a percentage of the total housing stock- Modal split of passenger transport- Access to public services (hospitals and schools)
- Long-term unemployed persons as a proportion of total unemployed people
Source: Made by the ESPON EGTC
Understanding the context is the key to choosing appro-priate indicators. The following aspects can be mentioned as crucial:
▪ The actual content, territorial coverage, budget and scope of the integrated strategies;
▪ The purpose of the indicators – measuring achieve-ments in territories and populations versus measuring direct performance of the EU funded programmes and projects;
▪ Data availability issues which put constraints on what can be measured;
▪ Administrative capacity of the managing institutions as well as leadership in prioritising evaluation aspects.
Policy recommendationsCurrently a long list of indicators is used and their mean-ing becomes unclear when the territorial impact needs to be presented. There is a need for a short list of indica-tors which reflect the impact of the integrated invest-ments on an aggregate level. The selected ESPON indi-cators present such an attempt.
It is also useful to differentiate between two sorts of measurements. On the one hand, there are indicators which give information about developments in territories and for populations, and for which accountability is shared, as in general not only one policy or programme plays a role. On the other hand, there are performance indicators, which measure how policies and programmes are delivering, who is better off and what has changed as a result of each activity.
EU levelFuture European Commission monitoring and evaluation guidance materials could benefit from a more detailed focus on the complexities of measuring the effectiveness of integrated investments at territorial level and providing some possible solutions. A possible standardised meth-odology for monitoring and impact assessment could also include, besides indicators, information on sources and data collection instruments.
The indicators included in this policy brief could be used to facilitate the evaluation of the impact of the integrated territorial investments, for example along with any other relevant indicators capturing the impact of integrated investments at territorial level.
As the European Commission is working on expanding the list of common indicators and the content to be cov-ered by them in the post-2020 period, the indicators pre-sented in this policy brief could serve as a valuable input. There is potential to use these indicators as common indicators at the policy impact/policy result level.
Evaluation of the impact of integrated investments at the territorial level requires a specific statistical approach, such as creating databases, using dedicated calculation programs, etc. This may not fit in the average budgets that local administrations spend on integrated urban or territorial development strategies, particularly in less developed regions. Therefore, consideration should be given to offering technical assistance, such as grants for monitoring and impact assessment.
12 ESPON // espon.eu
Policy Brief // Indicators for integrated territorial and urban development

National and regional levels It is important to emphasise that the indicators presented in this policy brief are not necessarily direct result indica-tors which show the immediate results of interventions by the EU funds. Therefore, it is advisable that national and regional authorities responsible for the use of EU funds examine carefully the particular national and regional contexts and the actual content of the investments before using these indicators as direct result indicators. The fol-lowing recommendations can be put forward.
The indicators presented in this policy brief can be used to observe progress towards integrated territorial devel-opment. If integrated territorial investments have been made but there are no changes in these indicators, then the impact of integrated investments might be questiona-ble.
Composite indicators (indices) can be used as an effec-tive tool to communicate the overall effectiveness of the integrated investments, especially in cases when it is hard to find single indicators that capture territorial aspects of investments. However, the actual meaning of a composite indicator (what is being measured) should always be kept in mind to avoid over-/underestimating the effects of integrated investments.
Selection of the “right” indicators is often seen as the answer to identifying impacts. However, it is equally important to establish a valid explanation of why certain changes in indicators can be attributed to policy actions and investments. Thus, evaluation and attribution play a critical role.
While it would be useful to have a Europe-wide methodol-ogy and indicators list, cities/metropolitan areas are encouraged to take responsibility for formulating specific and sound visions, with tailored indicators for the main objectives/priorities, and to translate “integrated territorial development” into their specific contexts.
Data availability in many cases might be an issue, so the indicators presented in this policy brief are not an off- the-shelf solution, but need to be adjusted depending on the national context. Three criteria can help in choosing the indicators:
▪ Communication power: does the indicator communi-cate to a broad and diverse audience?
▪ Proxy power: is the indicator representative and does the indicator come in “herds”? Similar indicators which capture roughly the same meaning might be used as a substitute in the event of data problems.
▪ Data power: are there timely and reliable data?
Registered statistics may often prove to be a better source of data than official statistics. In many instances, information included in national registers is overlooked because of possible non-compliance with the statistical standards; however, careful examination of data can rem-edy this problem.
If integrated territorial development strategies cover sev-eral administrative territories, it is worth examining the spatial distribution of indicators, such as dispersion and clustering.
13ESPON // espon.eu
Policy Brief // Indicators for integrated territorial and urban development

ReferencesESPON. 2012a. “ESPON INTERCO – Indicators of Territorial Cohesion.” https://www.espon.eu/programme/projects/espon-2013/scientific-platform/interco-indica-tors-territorial-cohesion .
ESPON. 2012b. “ESPON SIESTA – Spatial Indicators for a Europe 2020 Strategy Territorial Analysis.” https://www.espon.eu/programme/projects/espon-2013/applied-research/siesta-spatial-indica-tors-europe-2020-strategy .
ESPON. 2013a. “ESPON KITCASP – Key Indicators for Territorial Cohesion and Spatial Planning.” https://www.espon.eu/programme/projects/espon-2013/targeted-analyses/kit-casp-key-indicators-territorial-cohesion-and .
ESPON. 2013b. “ESPON SeGI – Indicators and Perspectives for Services of General Interest in Territorial Cohesion and Development.” https://www.espon.eu/programme/projects/espon-2013/applied-research/segi-indica-tors-and-perspectives-services-general .
ESPON.2016. “Polycentric Territorial Structures and Territorial Cooperation”. Policy Brief. https://www.espon.eu/topics-policy/publications/policy-briefs/polycentric-territorial-struc-tures-and-territorial
ESPON.2017a. “ESPON 2020 Data and Maps Updates project”.
ESPON.2017b. “ESPON PROFECY – Inner Peripheries: National territories facing chal-lenges of access to basic services of general interest” https://www.espon.eu/inner-peripheries
Eurostat. 2014. “Towards a Harmonised Methodology for Statistical Indicators. Indicator Typologies and Terminologies.” http://ec.europa.eu/eurostat/web/products-manuals-and-guidelines/-/KS-GQ-14-011 .
Friedman, Mark. 2015. Trying Hard Is Not Good Enough 10th Anniversary Edition: How to Produce Measurable Improvements for Customers and Communities. CreateSpace Independent Publishing Platform.
Van der Zwet A., Bachtler J., Ferry M., McMaster I. and Miller S. 2017. Integrated Territorial and Urban Strategies: How Are ESIF Adding Value in 2014-2020? Final Report to the European Commission. European Policies Research Centre. Publications Office of the European Union, Luxembourg: http://ec.europa.eu/regional_policy/sources/docgener/studies/pdf/integrated_strategies/ integrated_strategies_en.pdf
Van der Zwet A., Ferry M. and McMaster I.2018. Assessing performance of integrated territorial and urban strategies. Challenges, emerging approaches and options for the future. Final Report to the European Commission. European Policies Research Centre. Publications Office of the European Union, Luxembourg: http://ec.europa.eu/regional_policy/en/information/publications/studies/2018/assess-ing-the-performance-of-integrated-territorial-and-urban-strategies
14 ESPON // espon.eu
Policy Brief // Indicators for integrated territorial and urban development

ESPON 2020
ESPON EGTC4 rue Erasme, L-1468 LuxembourgGrand Duchy of LuxembourgPhone: +352 20 600 280Email: [email protected]
The ESPON EGTC is the Single Beneficiary of the ESPON2020 Cooperation Programme. The Single Operation withinthe programme is implemented by the ESPON EGTC andco-financed by the European Regional Development Fund,the EU Member States and the Partner States, Iceland,Liechtenstein, Norway and Switzerland.
Acknowledgements:This policy brief is based on the input provided by the participants who attended the ESPON workshop “Indicators for Integrated Territorial and Urban Development” that took place in Brussels on 25 January 2018.
Disclaimer:The content of this publication does not necessarily reflectthe opinion of the ESPON 2020 Monitoring Committee.ISBN: 978-99959-55-23-6© ESPON 2018
Reproduction is authorized provided that the source is acknowledged and a copy is sent to the ESPON EGTC
Editorial team:Ilona Raugze, Zintis Hermansons, ESPON EGTC
Published in April 2018
Inspire Policy Making with Territorial Evidence
espon.eu