police officers’ adoption of information technology: a
TRANSCRIPT

APPROVED: Brian C. O’Connor, Major Professor and
Director of the Interdisciplinary Information Science Doctoral Program
Eric Fritsch, Committee Member Jiangping Chen, Committee Member Herman L. Totten, Dean of the School of
Library and Information Science Sandra L. Terrell, Dean of the Robert B.
Toulouse School of Graduate Studies
POLICE OFFICERS’ ADOPTION OF INFORMATION TECHNOLOGY: A CASE STUDY OF
THE TURKISH POLNET SYSTEM
Ramazan Yalcinkaya, B.A, M.S.
Dissertation Prepared for the Degree of
DOCTOR OF PHILOSOPHY
UNIVERSITY OF NORTH TEXAS
August 2007

Yalcinkaya, Ramazan, Police officers’ adoption of information technology: A case
study of the Turkish POLNET system. Doctor of Philosophy (Information Science).
August, 2007, 182 pp., 13 tables, references, 64 titles.
One of the important branches of government and vital to the community, police
agencies are organizations that have high usage rates of information technology
systems since they are in the intelligence sector and thus have information incentives.
Not only can information technologies develop intra- and inter-relationships of law
enforcement agencies, but they also improve the efficiency and effectiveness of the
police officers and agencies without adding additional costs. Thus, identifying the
factors that influence the police officers’ adoption of information technology can help
predict and determine how information technology will contribute to the social
organization of policing in terms of effectiveness and efficiency gains.
A research framework was developed by integrating three different models,
theory of planned behavior (TPB), technology acceptance theory (TAM), and diffusion
of innovation theory (DOI) while adding two other factors, facility and voluntariness, to
better determine the factors affecting the implementation and adoption of the POLNET
software system used by the Turkish National Police (TNP). The integrated model used
in this study covers not only basic technology acceptance factors, but also the factors
related to policing. It also attempts to account for the factors of cultural differences by
considering the important aspects of Turkish culture. A cross sectional survey was
conducted among TNP officers using the POLNET system. The LISREL 8.5® analysis for
the hypothesized model resulted in a good model fit; 13 of the 15 hypotheses were
supported.

ii
Copyright 2007
by
Ramazan Yalcinkaya

iii
ACKNOWLEDGMENTS
I would like to express my sincere thanks to the Turkish National Police (TNP) for
providing me the opportunity to attend this graduate program in the USA. I also would
like to express the most heartfelt thanks to my family, particularly my wife Nilgun, and
my daughters, Selin and Nilsu, for their support and patience during my extensive
studies.
In addition, thanks goes to Dr. O’Connor, the chair of my committee, Dr. Chen
for whom I worked for as a teaching assistant, and Dr. Fritsch who was the chair of my
thesis’ committee in criminal justice. I would like to express my sincere gratitude to Dr.
O’Connor for his supervision, encouragement, and invaluable discussions. I also thank
to Dr. Chen and Dr. Fritsch for their time and invaluable assistance as a member of my
committee. In fact, I would like to thank all of them for their encouragement, invaluable
assistance and advice, and most importantly, for their understanding during the
completion process of my dissertation.
I also would like to thank my colleagues, Ilker Pekgozlu, Orhan Altuntas and
Oguzhan Basibuyuk for providing me advice and assistance in order to develop a better
understanding in some areas of this dissertation.

iv
TABLE OF CONTENTS Page
ACKNOWLEDGMENTS…………………………………………………………………….……………………iii
LIST OF TABLES…………………………………………………………………………………………….....vii
LIST OF ILLUSTRATIONS…...................................................................................viii
CHAPTER 1. INTRODUCTION TO STUDY……………………………………………………………………..1
Introduction Problem Statement Research Questions Purpose of the Study Conceptual Framework Significance of the Study Organization of Following Chapters
2. LITERATURE REVIEW…………………………………………………………………………….13
Introduction The Importance of Information Technology in Law Enforcement Knowledge Management in Law Enforcement Information Technology and Usability Characteristics of Law Enforcement Information Technology Tasks User characteristics of police officers Information Technology Developments in Law Enforcements Data Integration Programs in Law Enforcement Case Study: Research Application Tool, POLNET, Turkey The Effect of Natural Culture Theoretical Backgrounds of Technology Acceptance Theory of Reasoned Action (TRA) Theory of Planned Behavior (TPB) The Diffusion of Innovations Theory (DOI) Task-Technology Fit Model (TTF) Technology Acceptance Model (TAM) Usability and Information Technology Acceptance Research

v
Conducted in Law Enforcement Settings Usability and Information Technology Acceptance Research
Conducted in Different Cultures Research Model Summary
3. METHODOLOGY…………………………………………………………………………………….79
Introduction Research Design Operational Definition of Variables and Hypotheses Participants and Sampling Plan Instrument Development Expert Validation Survey Administration and Data Collection Data Analysis Method: Structural Equation Model Data Analysis Tool LISREL Measurement Model Structural Model Summary
4. FINDINGS and DATA ANALYSIS…………………………………………………………….106
Introduction Primary Data Analysis Descriptive Statistics of Respondents Psychometric Properties Reliability Validity Data Analysis Measurement Model Structural Model Evaluation of Hypotheses Testing Summary
5. CONCLUSION and RECOMMENDATION………………………………………………....141
Introduction General Discussion of Findings Limitations and Delimitations of the Study Recommendation to the TNP and Policy Implementations Directions for the Future Research Conclusion

vi
APPENDICES
A. SURVEY QUESTIONS……………………………………………………………………….….150 B. INSTITUTIONAL REVIEW BOARD (IRB) FOR THE PROTECTION OF
HUMAN RIGHTS IN RESEARCH APPROVAL……………………………………….155 C. CONSENT FORM………………………………………………………………………………...157 D. SURVEY APPROVAL FROM THE TURKISH NATIONAL POLICE (TNP)……..…160 E. CORRELATION MATRIX OF SURVEY ITEMS…………………………………………..163
REFERENCES…………………………………………………………………………………………………….167

vii
LIST OF TABLES
1. Survey Construct and Measurement Items…………………………………..…………......94
2. Descriptive Statistics of Items……………………….….……………………………………...107
3. Frequency Distribution of Respondents by Age……………………………….….........109
4. Frequency Distribution of Respondents by Gender………………………….…….......110
5. Frequency Distribution of Respondents by Education Level……………………....…111
6. Frequency Distribution of Respondents by Job experience……………………..…...112
7. Reliability Analysis……………………………………………………………………..…………...113
8. Factor Loadings…………………………………………...……………………….……….……….115
9. Confirmatory Factor Analysis- Factor Loadings…………………………………….……..118
10. Model Fit Index……………………………………………..………………………………………..122
11. Comparison of Chi-squared Values……………………………………………….…………...123
12. Goodness of Fit in Structural Model……………………………................................125
13. Path Coefficients………………………………………………….………………………………….127

viii
LIST OF ILLUSTRATIONS
1. Figure 1. An interface of POLNET system ……………………..………………………..….46
2. Figure 2. Graphical view of Theory of Reasoned Action ……………………………..…51
3. Figure 3. Graphical view of Theory of Planned Behavior ……………………….........53
4. Figure 4. Graphical view of Diffusion of Innovation Theory …….………………….…57
5. Figure 5. Adopter Categorization on the Basis of Innovativeness ……………..…...58
6. Figure 6. Graphical view of Task Technology Fit Model……………………………..….60
7. Figure 7. Graphical view of Original TAM…………………………………………………….62
8. Figure 8. Conceptual Diagram of Research Model……………………………………..….75
9. Figure 9. Research Model with Hypothesis………………………………………….……….91
10. Figure 10. Diagram of Confirmatory Factor Analysis……………………………….….121
11. Figure 11. Model Testing Results……………………………………...........................129

1
CHAPTER 1
INTRODUCTION TO STUDY
Introduction
Today, the world is experiencing significant technological revaluation at the main
part of which is the information technology. There is a general belief that information
technology eases and contributes to many aspects of our life (Nunn & Quinet, 2002).
New technologies have changed drastically our ways of thinking, our perceptions, our
attitudes, our symbols, and even our community. In particular, information technology
has transformed our big world into a small village by creating communication channels
all around the globe (Chan, 2001). Unlike traditional means of communication/
information sharing, information technology transfers more information more quickly at
a lower cost in addition to adding more flexibility of data management. In this new age
of information, many people and organizations utilize information technologies and
track new developments in this sector. The increasing investment in the information
technology by many organizations as well as its widespread usage even in households
show what an important element in our lifestyle it has become (Flanagin, 2002).
In this information age, whose parameters can be identified by technologies
processing information to increase the efficiency and performance of not only
individuals, but also of large organizations, people are bombarded with the promise of
technological success (Nunn & Quinet, 2002). This idea of technological success stems
from the promises of more power, authority, control, and the remarkable potential of

2
the systems designed with technology (Manning, 2003). Flanagin (2002) claimed that
these technological developments have improved the capabilities of contemporary
organizations and have made significant changes within and among these
organizations. In the law enforcement setting, the belief in technological success has
even been depicted in the entertainment media such as with the imagery of Robocop
and high tech crime scene investigation series, like CSI.
Among large organizations using information technology systems, police
agencies can be mentioned as such groups that have high usage rates of information
technology systems (Nunn & Quinet, 2002). Moreover, this use is extremely crucial for
these agencies in terms of the negative consequences from wrong or inappropriate
implementations. Thus, most police agencies offer information technology as support
for their police officers (Gottschalk, 2006). In fact, Maltz, Freidman, and Gordon (1991)
maintain that “information is the lifeblood of the police” (p.12). The amount of
information that the police receive during enforcing the law is overwhelming
(Gottschalk, 2006). Police use information technology tools at almost every stage,
including allocation of sources, patrolling, crime prevention, crime tracking, hot
pursuits, and crime solving. Colvin and Goh (2005) assert that information technology
has substantial impact on police practices. In addition, any increased acceptance of
information technology by police officers improves the quality of policing and
performance of law enforcement agencies (Gottschalk & Holgersson, 2006). Therefore,
it is important to know how well information technology is working for a police force.

3
Problem Statement
In this fast-paced era of rapid technological advances, people spend considerable
amounts of money on technology to increase productivity in almost all organizational
structures across the globe. However, whether this investment really results in efficient
output is a big concern for not only policymakers but also investors (Malhotra &
Galletta, 1999).
Law enforcement is highly information intensive, and technology and training
require significant resources, so the effective use of technology requires acceptance by
those involved. Therefore, studies focusing on understanding user technology
acceptance in law enforcement settings may contribute to the use of information
technology more effectively by law enforcement personnel (Lin, Hu, & Chen, 2004).
Similarly, Colvina and Goh (2005) assert that knowing the factors that influence the
police officer’s adoption of information technology identifies and predicts how
information technology contributes to police organizations or the social organization of
policing in terms of effectiveness and efficiency gain. Moreover, allocating any new
information technology and embedding it to the present structure may have also some
unintended consequences unpredicted by policy makers as a result of the resistance of
users (Manning, 2003).
If both the number of police officers using information technology in police
organizations and the amount of investment for the establishment and development of
this technology are taken into account, it becomes clear that police executives and

4
policy makers should pay special attention to identifying the optimum usage of these
systems (Gottschalk & Holgersson, 2006).
When evaluating the impact of information technology on police practices, a
comparative analysis is required to see how much the predictions and expectation fully
become true in terms of users’ perspective in that particular police departments.
Generally, information technology tools are purchased without considering user
demands, systematic cost benefit analysis or not acquired by police budgetary officers.
Moreover, lacking sufficient information technology knowledge and not tracking newest
innovations the police are more vulnerable to the vendors of information technology.
The reasons for this are that police administrators often readily accept the offers of new
information technology tools from the vendors because they can not stand up to
external political and social pressures. Although this purchase seems rational from their
management perspective, it ignores the users’ opinions and users’ participation, which
results in resistance and inefficient performance. Thus, information technology can not
change the structure of the traditional process of policing as much as it can effect
change in the business sector (Manning, 2003).
Several paradigms have been developed and used to explain the acceptance of
information technology by users. Researchers have tested user technology acceptance
in various occupations by using different instruments stemming from those theories.
However, few studies have been conducted in law enforcement setting to examine
usability features of police officers. Since the police organizations tend not to disclose
5
their activities publicly, the police officer’s adoptions of information technology are not
well identified and studied by researchers (Manning, 2003).
Other aspects need to be considered. For example, each profession has different
structures, cultures, and usability features. In addition, police agencies in each country
have unique characteristics and different features in terms of organizational structure;
therefore, it is really difficult to make generalizations about them (Sheptycki, 2004).
Thus, for accurate understanding of a user’s acceptance in each occupation, different
instruments need to be developed. Cork, Detmer, and Friedman (1998) argued that
similar structures of attitudes and beliefs can not be known for different professions.
They also claimed that each member of a different occupation has different attitudes
regarding information technology usage. A unique design for just one type of
profession can address the acceptance and use of information technology to obtain
accurate measurements (Colvina & Goh, 2005). Clearly, there is a need to develop an
instrument designed for information technology acceptance for law enforcement
settings.
Additionally, the variety of work in policing, including personnel management and
fighting different kinds of crimes, affects the usability of information technology and
requires comprehensive information technology tools. If the usability of information
technology is not seriously taken into account, all efforts made in this area and
purchases of new technology may turn into a critical mass in which information is being
collected without systematic organization and specific purpose (Manning, 2003). In this
context, there is a need to understand these issues: whether law enforcement

6
personnel accept technological advances, what the primary elements of successful
adoption of information technology are, what the primary blocks to acceptance are, and
what the aspects of law enforcement culture that are significantly different from the
private sector corporate environment are.
Veiga, Floyd and Dechant, (2001) argue that the additional pressure of
globalization make these aspects more challenging and complex. Especially in the last
two decades, considering the enormous and continuous investments being made in
business and organizational resources, a main concern within the information
technology community has been to understand and create conditions in which the
technology will be accepted and used. Manning (2003) asserted that today,
technological innovations occur as a result of demands and needs based on measured
results, systematic feedbacks, and rational evaluations, but there is also a need to
understand usability of these innovations systematically. Therefore, understanding the
reasons why individuals accept or reject the information technology systems appears to
be one of the most demanding issues currently facing researchers of information
systems (Premkumar & Bhattacherjee, in press; Yi, Jacson, Park, & Probst, 2006).
As international and domestic competition among organizations has become
more dependent on information and thus information technology, organizations try to
produce new policies and transform their structures and perceptions to survive in this
information-dependent environment. This transformation severely affects organizations
which can not adapt to these rapid changes in terms of economic conditions and
compels them to reconsider their traditional approaches. From the individual’s

7
perspective, information technology is viewed as knowledge and skills that a person has
to know to get a good job (Chu, 2001).
Therefore, especially for the last two decades, the research on information
technology based on user needs and usability has grown and continues to interest
researchers (Hu, Lin, & Chen, 2005; Premkumar & Bhattacherjeeb, in press). Adoption
is not instantly embraced and comprehended; rather, it is a complex and continuing
process of which every part needs to be clear. For this reason, researchers have
developed many theories, conducted numerous studies, and tested these theories in
different environments. In business settings, researchers have concentrated on
identifying the factors of usage because they have found that information technology
has been used by enterprises to reduce costs, increase production, and raise the quality
of service (Legris, Ingham, & Collerette, 2003). However, most previous research has
concentrated on user acceptance in business settings but few research studies have
been conducted in non business settings, such as law enforcement environments.
Among the instruments developed, Davis’ (1986) Technology Acceptance Model
(TAM) has been used and tested in the past two decades in various professions to
explain user acceptance of information technology as a theoretical foundation of policy
(Veiga et al., 2001). However, according to McCoy (2002), the majority of these studies
have been conducted in North America and relatively few of them have focused on
information technology acceptance outside of this continent. Thus, there is a need to
determine if cultural differences influence technology acceptance.

8
Research Questions
In this study, an integrated technology acceptance model is designed to
understand user features of information technology adoption in a law enforcement
setting in Turkey. Using a survey instrument adapted from the relevant literature, the
following questions related to information technology usability were tested:
1. Does the integrated technology acceptance model, designed for
this study, confirm the information technology adoption of police officers using
the POLNET system in Turkey?
2. To what extent do the characteristics of police officers as end users
of information technology affect their acceptance of technology?
3. Do information technology users having different cultural values in
the law enforcement environment in Turkey exhibit different technology adoption
characteristics?
Purpose of the Study
The primary objective of this study is to respond to the research questions by
providing a research model, an integrated framework of three different theoretical
models which were developed to estimate and measure information technology
innovation success. The research model used in this study covers not only basic
technology acceptance factors, but also the factors related to policing. Moreover, it also
attempts to account for the factors of cultural differences by considering the important
aspects of Turkish culture. In doing so, this study aims to assess individual
characteristics, technology characteristics, task characteristics, and national culture

9
characteristics. Thus, the main aim of the study was to provide evidence of the research
model's predictive relevance.
To address research questions, this study implemented a data gathering method,
a quantitative survey. Based on this quantitative research methodology, the outcomes
of the research questions mentioned above are expected:
To contribute to information technology management practices of the Turkish
National Police (TNP),
To add to technology acceptance literature,
To test technology acceptance models in a non business setting,
To fill the gap in the area of testing technology acceptance models in different
cultures.
Conceptual Framework
The conceptual framework of this study is related to the information technology
adoption theories. Thus, a research model was developed by integrating three different
models, the Theory of Planned Behavior (TPB), Technology Acceptance Theory (TAM),
and Diffusion of Innovation Theory (DOI), while adding two other factors, facility and
voluntariness, to better determine the factors affecting the implementation and
adoption of the POLNET (Police Network System) software system used by the TNP.
These kinds of unified and integrated technology acceptance models have been used by
many different studies in different settings. Realizing the importance of information
technology for police agencies, this model attempts to explain the concepts where
policing and information technology meet.

10
Significance of the Study
This study provides useful insights in different areas. This study attempts to
explain the Turkish police officers’ behaviors and beliefs with the POLNET system from
both theoretical and practical perspectives. Theoretical frameworks maintain the
foundation of the subject which allows us to analyze it in greater detail and depth than
just anecdotal case study alone. A combination of both theoretical frameworks and
practical case study examination provide for gaining robust understanding of this
phenomenon.
From the theoretical perspective, this study can shed light on better
understanding the factors affecting the Turkish police officers’ successful adoption and
implementation of POLNET system. It also provides empirical support for the integrated
technology acceptance models developed from the three different theories. This study
adds to the technology acceptance literature by testing this integrated technology
acceptance model in a different culture and in a rarely studied organizational setting,
law enforcement.
From the practical standpoint, if the usability of technology adoption factors is
taken into account by the TNP, this study will be helpful in providing recommendations
for each step of the process. The subjects, as users of the POLNET system, can get a
better system based on the suggestions highlighted in this study.
This study also overcomes some of the common limitations of many of the
technology acceptance studies. In their meta-analysis of TAMs, Legris et al., (2003),
addressed three distinct and apparent limitations. First, they claimed that most of the

11
studies are conducted in universities or academic settings due to economic availability
instead of in business or government settings. However, in this study, a Turkish law
enforcement setting was used to measure the adoption of information technology.
Second, Legris et al., (2003) found that most of the research application tools
described in the literature are office automation software or system development
applications, which again do not reflect real life environments. They suggested that
business process applications would be better for analyzing technology acceptance. In
this study, the POLNET software system, which can be attributed to a process
application, was used as a research application tool.
Third, most of the studies measuring technology acceptance do not test system
usage; instead relying on self reports of individuals. Legris et al., (2003) claimed that
this kind of measurement may not reflect an actual measure of acceptance. In this
study, system usage was not tested; instead intention to use was selected as a
dependent variable because the official report systems that measure personnel use of
the system are restricted and inaccessible due to security concerns in the TNP.
Organization of Following Chapters
Chapter 2 reviews the background of this research including practical
observations about and explanations for information technology and the law
enforcement and theoretical backgrounds of information technology acceptance. After
explaining five different models, the research model and hypotheses are presented.
Chapter 3 describes the methodology of this study. Since this study is quantitative
research, the research design, survey participants, instrumentation, procedure,

12
instrument validation, and data analyses are explained in this chapter. Chapter 4
presents the results and explains the statistical analyses of the cross-sectional survey
conducted in Turkey. Chapter 5 consists of a summary of findings, limitations of this
study, recommendations for the practitioners including Turkish National Police, policy
implications, the directions for future research, and conclusion.

13
CHAPTER 2
LITERATURE REVIEW
Introduction
The relevant literature guides to comprehend the basic concepts of information
technology, policing and culture and the relationships among them to understand the
notion of research model of this study. Thus, this chapter first introduces the
importance of information technology in law enforcement settings. Basically,
information technology helps police agencies to collect, organize, store, and replicate
information to enable crime analysis, crime mapping, and other activities aimed at crime
prevention. In addition, not only can information technology disseminate information to
the public at large, but it can also create a network of communication within agencies.
This network has been extended parallel to the development of internet in the world.
Today, the police can inform citizens by showing maps, diagrams, statistics, and
pictures in their own websites (Manning, 2003).
Second, knowledge management in law enforcement is introduced because one
of the main purposes of this study is to contribute to the knowledge management
practices in the TNP.
Third, information technology and usability are introduced because this high
utilization of technology also requires acceptance; just allocating the systems does not
return always efficient results. Information technology systems significantly depend on
the individual users’ capacities for usage. Usability of information technology affects

14
directly the knowledge management of the police agencies. Thus, later, task
characteristics of law enforcement and user characteristics of police officers are
presented to understand what factors affect usability of police officers employing
information technology.
Fourth, based on the idea that culture is a discerning variable of information
technology, the cultural dynamics of technology acceptance are handled since the
participants of this study are from a culture different from those in the relevant
literature. Fifth, to structure the theoretical background of this study, the summary of
five accepted information technology models, Theory of Reasoned Action (TRA), TBA,
DOI, Task Technology Fit (TTF), and TAM are introduced and discussed.
Fifth, in light of all these factors and theoretical facts, the research model used in
this study is developed and presented.
The Importance of Information Technology in Law Enforcement
Not only can information technologies develop and facilitate the intra- and inter-
relationships in law enforcement agencies, but they also have the potential to improve
the efficiency and effectiveness of the police officers and agencies without adding
additional costs (Nunn & Quinet, 2002; Premkumar & Bhattacherjee, in press). Chan
(2001) claimed that information technology has contributed to policing by enabling the
sharing of more information among officers, creating officer accountability, improving
communication, providing cooperation, and creating positive work environments. She
also asserted that there have been three types of essential impulses for technological
changes in law enforcement; enhancing effectiveness and efficiency, responding to the

15
demands of other agencies, and providing for the necessities of new methods in police
management and accountability.
In fact, information technology, historically, has always reformed police practices
and opened new horizons in policing (Chan, 2001). For instance, Manning (1992) said
that in the USA, the first use of information technology in policing dated back to the
1877 when the telegraph was employed to provide communication between law
enforcement agencies (as cited in Flanagin, 2002). Information technology has also
helped law enforcement agencies control crime and improve their professional status
and organizational authority (Chan, 2001).
As an important branch of government and a vital part of the community, the
law enforcement agencies need information technology to communicate effectively with
other agencies. Today, information exchange between agencies is an unavoidable
necessity for modern governments (Chan, 2001). The tragic events of the 9/11 terrorist
attacks in America showed how important information sharing between and within
national and international organizations is. Also, the example of the Oklahoma court
house bombing indicates how significant data exchange among different federal, state,
and local police agencies is. Timothy McVeigh, who killed 168 people and injured
hundreds more, was arrested for driving without a license plate in a routine traffic stop
in Perry, Oklahoma, while the FBI was looking for him in the US criminal database for
being a suspect in the bombing of the Murrah Federal Building, in Oklahoma City. If the
FBI had not got the arrestee information from the Perry Police Department on April 21,
1995, two days after bombing, he would have not been captured (Chu, 2001).

16
Due to new aspects of human rights and new management approaches in
policing, the concept of public accountability has gained enormous attention among
researchers in criminal justice and police executives dealing with criminals. In addition,
police executives and policy makers also consider cost-effectiveness, integrity, ethics,
and procedural standardization for better management in policing. All of these issues
relate to the necessity of information technology usage and hence a large scale
acceptance of information technology promises a positive difference in policing (Chan,
2001).
Flanagin (2002) said that information technology changes the dynamics of
organizations by creating effective communication tools which allow more interpersonal
relationships. He noted that Hinds and Kiesler (1995) claimed that information
technology also provides an environment in which a variety of people can join the
organizational decision-making process (as cited in Flanagin, 2002). Similarly, Flanagin
pointed out that Pinsonneault and Kaemer (1990) found that information technology
has an impact on reaching group consensus and increasing the confidence and
satisfaction of its members. They believed that information technology has enhanced
vertical and horizontal relationships within organizations by removing physical
interaction problems (as cited in Flanagin, 2002). Information technology also
contributes to improving inter-organizational relationships by providing competitive
advantages and experience, reducing costs, and increasing profits. Information
technology helps change the communication structure of organizations from hierarchical
to horizontal. Moreover, studies that showed that information technology tools used

17
intra- organizationally, such as electronic mail, videoconferencing, group communication
systems, and corporate interests, have a profound positive impact on success in the
organizations (Flanagin, 2002).
For law enforcement agencies, information technology offers timely, reliable, and
intact data, in addition to cost effective and flexible solutions for data communications
which are crucial for most kinds of policing (Nunn & Quinet, 2002). For these reasons,
law enforcement agencies have invested in information technology to improve their
storage capacity and process and to effectively access these huge volumes of data for
better intelligence and investigation (Chan, 2001).
A positive image of law enforcement is crucial for effective policing and
generally, the police rely on citizen cooperation by providing information. This affiliation
brings about crime prevention, which is called proactive policing (Cao & Burton, 2006).
Moore (1997) claimed that by using the tools of information technology, not only can
complex relationships of social structure and uncertainty between police and community
be overcome, but also effective and improved public service can be managed. To
implement this proactive policing, described as preventing crimes beforehand,
communication channels need to be established for information exchanges between the
community and police by using information technology.
Community policing can be defined as a proactive and organizational strategy
which is designed to reduce fear of crime, crime, and disorder, and is aimed to increase
citizen satisfaction with police services through collaboration with the community (Chu,
2001). This policing recognizes the community as a stakeholder in providing safety and

18
encourages the community to join in activities with the police to prevent crimes in their
neighborhoods. Community policing includes the full partnership between police and
community to set up order in the community and identify the problems to address
reducing crime. Crime and disorder problems are the common concerns of the
community and the police (Hinnat & Welch, 2002). Therefore, the community members
need to participate in determining public policy based on an interactive and cooperative
relationship with police. By collaborating with each other, the police and community can
do many useful things, such as repair property damage immediately before allowing it
to be destroyed by vagrants. This community involvement can be obtained through
different means; one of these is “Community Crime Watch” which focuses on gathering
information from citizens and giving it to the police.
As an example of this policy related to information technology in the United
States, Williams and Aasheim (2005) outlined the Knowledge-Based Community
Oriented Policing System (KBCOPS) which was implemented by the Charlotte-
Mecklenburg Police Department (CMPD) in North Carolina. They said that the CMPD has
recognized that information technology is one of the most important crime fighting and
community policing tools in the 21st century in the practice of law enforcement,
especially for crime analysis and computerized mapping. They also stressed how crucial
it is to make information a part of problem-solving policing. In this department’s
operational plan, information technology played an essential role to make Charlotte a
safe city. Although Williams and Aasheim (2005) did not address a specific casual

19
relationship, they indicated that crime rates decreased after 1996 when this system was
first implemented.
Similarly, Chu (2001) indicated that police are more likely considered successful
by citizens due to professionalism, rapid response time, high arrest rate, and technology
usage. He also added that information technology can contribute in many ways to
community policing. Many police agencies uses internet based web pages to implement
community policing strategies by getting feedback through emails and message boards,
such as Automated Regional Justice Information System (ARJIS) providing crime
statistics and mapping for San Diego Police Department, Canadian Police Information
Center (CPIC) allowing citizens to search some areas of law enforcement records, and
crime prevention website of Albuquerque Police Department based on crime free multi
housing program. However, Nunn & Quinet (2002) claimed that these benefits of
information technology may not be so effective in every type of community policing due
to different types of activities.
Law enforcement agencies are hierarchical and masculine in form (Ozdemir,
2004). Thus, lower ranking or female officers may avoid face to face communication,
which in turn affects decision making processes and successful management in that
department. Online telecommunication using information technology may resolve this
problem and increase the communication within the law enforcement organization
(Flanagin, 2002). In another perspective, information technologies can also increase the
capacity of organizational supervision, command control, and authority. For instance,
increasing technology seen at cellular phones, car locators, video cameras on the cars,

20
and audio devices improve capacity of managers to observe their workers. Police
organizations having paramilitary bureaucracy always need these kinds of supervision
means (Manning, 2003).
Law enforcement agencies are in the intelligence sector and their crime fighting
and prevention capabilities depend on individual officers’ timely access to relevant and
accurate information (Hu et al., 2005). Collier (2006, p.110) defined intelligence as
“actionable knowledge” and indicated that intelligence is very critical for policing.
Mueller (2006) asserted that the value of information has increased due to threats
against national security. Intelligence analysis used for allocation, decision making, and
tactical planning has emerged as a significant component of contemporary policing
strategies (Hauck & Weisband, 2002).
In Europe, intelligence-led policing based on information and communication
technology has emerged after organized crime groups have increased during 1990s.
According to Action Plan to Combat Organized Crime deployed by European Council in
1997, this policing requires an establishment of a data collection system for better
analysis the situations of organized crime groups. Police agencies across the Europe
have recognized the importance of information technology when they have
disseminated and analyzed the criminal intelligence during the combat against
organized crime groups. Thus, they have begun to implement new policies to utilize
more of information technology, such as National Intelligence Model (NIM) in England
(Sheptycki, 2004).

21
Particularly after September 11, it is clear that domestic intelligence is also
important for counterintelligence and observing terrorist movements within the borders
of homelands (Martin, 2004). There is general consensus that better information and
intelligence analyses are needed to combat terrorism threats. Thus, after September
11, The Patriot Act of 2001 has changed the process of collection, dissemination, and
evaluation of information, which affects significantly to public managers in terms of
their decision making practices in the USA (Haque, 2005).
Mueller (2006) pointed out that technology is an important factor when analyzing
information. It organizes the information to determine patterns and connections.
Mueller (2006) claimed that every pieces of information needs to be converted into
readily accessible intelligence to protect countries from threats. Thus, this intelligence
task can be implemented successfully by information technology systems (Lin et al.,
2004).
Increasing digital government applications requires law enforcement officers to
use more information technology (Galindo, 2006; Hu et al., 2005). Computer
technology used by governments to present information and services to citizens or
other stakeholders has become so prevalent that it has recently been named e-
government (Hinnat & Welch, 2002). Galindo (2006) suggested that government
agencies using e-government services should promote innovative uses of information
technology among their agencies. He also argued for a need for standardization of
information technology including interconnectivity and interoperability among agencies
for security. By the same token, the citizens’ use of e-government systems has also

22
increased in direct proportions. However, creating technology applications readily
accepted by citizens is also critical and significant to the ultimate success of digital e-
government systems (Lin et al, 2004). Manning (2003) stated that police need to serve
public by giving requesting information. For instance, in the USA, in accordance with
the Freedom of Information Act, search engines for information about arrestees have
been created several police departments. Similarly, FBI posted 16,000 case files on the
internet in 1997. Therefore, there is a growing effort among law enforcement
departments to institutionalize the process of ‘learning the technology’ so that they can
better serve and respond to demands from citizens (Redmond & Baveja, 2002). In
addition, security challenges that may be a threat to the e-government systems and
security informatics require an effective usage of information technology by law
enforcement agencies (Hu et al., 2005).
Hu et al. (2005) claimed that the progressive usage of information technology
has a positive impact on crime fighting and prevention. Crime fighting and prevention
are not only core tasks of policing but also fundamental requirements of justice, which
is one of basic dynamics of society. In addition to protecting and serving, the basics of
policing require the prevention of future crimes or the catching of criminals after a
crime has occurred (Redmond & Baveja, 2002).
While enforcing the law, police officers have to decide whether or not a crime
has been committed, to investigate the case to gain information and evidence to
identify the suspects, to recover the stolen property, to arrest the suspects, and to
bring them to justice by presenting the evidence to the prosecutor (Chen, Schroder,

23
Hauck, Ridgeway, Atabaksh, Gupta, Boarman, & Rausmussen, 2002; Gottschalk,
2006).Thus, law enforcement agencies make tremendous efforts to perform these
tasks, which can be very expensive. While implementing these basic and frequent tasks,
police regularly retrieve and use information about crime scenes, crime patterns,
locations of vehicles, responses to calls for service, personnel, finances, and various
other aspects of departmental performance (Redmond & Baveja, 2002).
Couret (1999) added that information technology also helps police officers to
gain information before they have physical and verbal contact with criminals, which
improves the quality of response. He asserted that information technology yields a more
timely response, more arrests, and thus a safer community. Therefore, the police need
effective information technology tools to perform these critical and costly tasks.
Moreover, successful monitoring and efficient investigation necessitate advanced
collaboration and communication, which can be accomplished by information
technology (Hu et al., 2005).
Time is also a critical concept for law enforcement officers (Hu et al., 2005). The
police have limited time to clarify a case due to the difficulty of retaining evidence,
suspects, criminals, and witnesses indefinitely (Hauck & Weisband, 2002). This issue is
so important that a new technological device, a mobile display terminal (MDT) that
facilitates computerized dispatch; access to state, local, and federal crime information
databases; report writing; and electronic submission of reports from the field to the
station has been designed (Chen et al, 2002). Clearly, the police need to access correct,
relevant, and accurate information as much and as efficiently as possible.

24
With new technology benefits come possible drawbacks. Cyber crime and cyber
terrorism are growing problems for law enforcement agencies, and are a new focus in
crime literature. Shelley (1998) claimed that the developments in information and
communication technologies create the situation in which crime has no geographic
boundaries—it is now global. The developments have also affected the forms of
criminality and criminal behaviors. He also asserted that though there have been many
technological innovations in 21st century, law enforcement agencies have not prepared
themselves adequately against cyber crime and criminals. According to police evidence,
organized crime groups use computers for their daily transactions and communication
networks. They also benefit from encryption techniques to hide from criminal justice.
Shelley suggested that the police need to adapt information technologies to serve them
and combat criminals in this era of globalization where transnational crime and
corruption can be seen frequently.
The growing number of criminal groups and crime networks operating over the
internet require effective tools for fighting against them and the implementation of new
technological developments in this area. Organized crime and even some terrorist
organizations use network systems by utilizing the latest information technology tools.
Thus, the police need to embrace information technology to fight these kinds of crimes
and criminals (Mueller, 2006).
In the United States, 940,000 police officers who spread out around the country
domestically protect the homeland; in Turkey, 170,200 police officers perform the same
role (Colvin & Goh, 2005; Ozmen, 2006). These huge organizations need effective

25
network systems that provide communication within and between organizations. The
reality is that this can be provided by information technology systems. In today’s crime
environment where organized crime and terrorist organizations have established perfect
communication networks, it is a clear necessity for law enforcement to acquire
information technology systems to establish communication channels and network
systems (Xuan & Chen, 2005).
When police officers perform their jobs, they have a high level of autonomy and
discretion in pursuing criminals. Although there are many variables including offenders,
victims, witnesses, crime tools, and evidence and many changeable aspects that affect
officer decisions at the crime scenes, police officers have to be able to make correct
judgments to provide justice. They exercise their individual judgment in conjunction
with regulations and formal rules while making decisions. In fact, no specific and unique
list of policies and procedures can potentially guide police officers at every crime scene
where police officers must take into account even small pieces of information that may
affect their decisions. Therefore, the police need an effective and comprehensive
information system to make good choices (Lin at al., 2004).
Knowledge Management in Law Enforcement
Gottschalk (2006) explored knowledge management in law enforcement in terms
of usage of information technology. Knowledge management embraces a broad range
of complex organizational, social, and behavioral factors. It can be defined as the
sharing, disseminating, and comprehension of information within an organization;
clearly, it is directly related to policing because of the knowledge intensive and time

26
critical structure of policing (Collier, 2006; Gottschalk, 2006). Chu (2001) stated that
information technology tools, such as computers or network devices support knowledge
management by their effects on decision making and problem solving. In his knowledge
evolution model regarding information technology and knowledge management,
Gottschalk (2006) identified four stages and concluded that it is in the later stages that
information technology is more beneficial to the organizations.
In the first stage, officer-to-technology, general information technologies, such
as email, spreadsheets, and word processing are used by knowledgeable workers.
Officers have information technology tools to share documents within an organization.
The second stage, officer-to-officer, contains knowledge sources where users can
access which officer has what information, such as an intranet in the organization to
find, and communicate and coordination with other knowledgeable workers.
In the third stage, officer-to-information, officers can access the stored
information by means of information technology. A database that stores information can
be an example of this stage. Officers can search the information by data mining
techniques. In the fourth stage, officer-to-application, the officer using the information
system can assess the situation to solve missing knowledge problems by using a
particular information technology system. An expert system can be an example of this
stage. The POLNET system used by the TNP is an intranet system that has a database
where users can access stored documents. In this context, as with the COPLINK
system, “An advanced intelligence and security informatics (ISI) technology” (Hu

27
&Chen, 2005, p. 236) used in Tucson Police Department in America, POLNET can be
defined as a third level knowledge management system using information technology.
Gottschalk (2006) indicated that database technology is a critical factor for
information management. If the users find them unusable and difficult, the system can
not manage the information effectively within that particular organization (Collier,
2006).
Information Technology and Usability
Collier (2006) defined information as organized data without any assessment.
Broadly, information technology consists of three important structures: hardware,
software, and systems. Based on existing technological development, any software,
hardware, or combination of systems that allow users to access or process the
information constitute information technology. It can be utilized by organizations for
different purposes, such as data handling, cataloging, communications, quality
enhancement, cost reduction, providing statistical data, and finding strategic
innovations (Chu, 2001).
As with any other technology implementation, information technology systems
depend significantly on the individual’s capacity for usage, i.e., how individuals use the
functions of the system (Money, 2004). Lewis (1995) stressed that a usable system can
be delineated by the competence of users ease in handling the system and quickly
recovering from errors. Nielsen (1993) stated that individual characteristics and task
differences are the two main determining factors for usability of technology (as cited in
Hauck & Weisband, 2002).

28
The characteristics of users and features of tasks affect the process of
technology acceptance and effective usage of that particular technology. By the same
token, Egan (1988) stated that in a system design, individual differences play an
important role because they influence whether or not people can use the system to
perform their tasks well (as cited in Hauck & Weisband, 2002). Al-Gahtani and King
(1999) acknowledged that a lack of information technology acceptance by its end users
is an important obstacle for organizations and requires investigation. They asserted that
resistance to usage of information technology is a common problem for organizations
but found that the acceptance of information technology can bring success to
organizations at managerial, professional, and operational levels.
Williams and Aasheim (2005) pointed out that if the user needs can not be
understood properly and user resistance occurs, this situation may undermine the
system usage. They said that some users may perceive information technology as
creating a greater workload and heavy burden for them. Some users question the value
of the system when they encounter some deficiencies and limitations of the information
technology systems. However, adoption of technology may create opportunities and
convenience, and also it may generate some difficulties and strain for some people
because of adoption problems.
Familiarization is another concept that affects usage of information technology.
The more they familiar the system, the more elaborately they use it (Williams &
Aasheim, 2005). Dennis and Wixom (2002) indicated that training is the critical factor
for implementation of systems and system management. Barney (1991) remarked that

29
training improves user satisfaction, organization effectiveness, and user morale (as
cited in Williams & Aasheim, 2005).
Characteristics of Law Enforcement Information Technology Tasks
Overall, the usage of information technology is affected by the characteristics of
police work and organization, types of information, the form of police intelligence and
various operational strategies (Flanagin, 2002). Although new information technologies
promoting better performance are implemented often in law enforcement agencies, the
expected improvements may not be observed every time (Nunn & Quinet, 2002).
Generally, in law enforcement agencies with paramilitary organizations, deploying new
information technology may not stem from the needs of that particular police agency;
rather, it may be a general implementation of new policy decided earlier by the police
executives or policy makers (Nunn & Quinet, 2002).
There is no difference between policing and business either commercial or non
profit in terms of usage of information technology. Organizational response of police
organizations to the information technology consists of several stages including
familiarity, adoption, resistance, and reformation. These stages include several
dynamics similar to the ones observed in organizational change process in business
setting. Technological capacities, such as memory capacity, software capabilities, and
fittingness for demanding job also play critical role in these stages (Manning, 20030.
However, comparing to business sector, law enforcement agencies have fallen behind
the business sector in utilizing new information technologies. Although there seems to

30
be significant improvements in using computers, commitment to paper based traditional
policing needs to be replaced totally in this pre-digital era (Chu, 2001).
Flanagin (2002) claimed that law enforcement agencies have some obstacles
when compared to other agencies in terms of obtaining benefits from information
technology. The structure of police organizations, the characteristics of policing, and the
demand of maintaining efficient information processing are some of these obstacles
that prevent police officers from using information technology as effectively as users in
other settings, such as business. Generally, law enforcement agencies have a traditional
hierarchical bureaucracy in which the orders are assigned and dictated. As Manning
(1992) mentioned, the information flow in the law enforcement agencies is
asymmetrical as there is always an authoritative figure who designs the communication
system (as cited in Flanagin, 2002).
Collier (2006) indicated that in the policing, the main problem is not if the
information is available, but rather to access the information when it is necessary.
Police officers spend a considerable amount of time and energy to collect and store the
data, but if the information technology tools are not used properly in law enforcement,
then information retrieval and optimum usage of stored information can not be
obtained (Gottschalk, 2006).
Police agencies are, traditionally, reactive in nature rather than proactive in
controlling crime within their jurisdictions. Police officers usually go to crime scenes
after the crime is committed. Because of the uncertain and unpredictable environment
at the crime scene, the officers attempt to take into account even very small amounts
31
of data before they go to the crime scene, because unprepared action may cause fatal
results (Flanagin, 2002).
The communications within and between organizations rely on two kinds of
information; explicit and tacit information. Explicit information is strict, formal, and
systematic, while tacit information can not be formulated in a systematic way, and is
highly dependent on an individual’s ability to express it. Thus, personal experience and
comprehension ability regarding a particular situation are critical factors for tacit
information. Explicit information can be gathered by books and other learning
materials, but tacit information is obtained from shared experience. Generally, due to
the changeable and unstable environments at the crime scenes and to the nature of
policing, the information the police handle is tacit. Therefore, an officer’s ability to
evaluate tacit information in uncertain conditions and the shared experience of this tacit
information may affect the performance of policing (Flanagin, 2002). However, newly
developed information technology offers a way to formulate this kind of tacit
information, such as crime mapping, police network systems, and crime scene
simulations so that police can share information among organizations. These
technologies translate this information to be more accurate and accessible for everyone,
although the officers’ ability to use these technologies affects the accuracy and
comprehensiveness of information and performance of policing.
Sheptycki (2004) identified the organizational problems of European police
agencies regarding intelligence and information sharing technologies. He stated that
there are many digital data storage systems within and between police agencies, which

32
make analysis of information really difficult. Without coordination of information and
communication technology systems, it is difficult to mention a well built information
flow and intelligence system among police agencies. Lack of data linkages between
police agencies may also cause serious problems for crime series analysis.
Sheptycki (2004) also mentioned that there is a lack of analytical capacity and
administrative support in police agencies to analyze intelligence gathered from the
fields. In this context, he addressed the importance of information technology systems
to handle intelligence overload which damages the quality of data analysis.
Flanagin (2002) said that information technology processes the information by
decreasing the amount of raw information and increasing the analyzed information.
Thus, data reduction is an essential part of information processing. Although explicit
information can be easily processed, data reduction for tacit information, which the
police mostly deal with, is difficult, so there is a need to use and follow the new
information technology in policing.
Nonetheless, despite the increased availability and utility, not everyone is
positively inclined towards the technology. The resistance stems from how the
organizational culture discloses the effects of users’ cognitive understanding in the
course of organizational learning. Inadequate technological systems can cause cultural
barriers in the organizations (Collier, 2006).
Positive public image is very important for law enforcement agencies due to its
effect on public confidence (Collier, 2006). This is because public confidence is related
directly to the cooperation and the community’s willingness for reporting any

33
information, such as crimes and suspects (Cao & Burton, 2006). Thus, any failure of
information technology systems may damage public confidence in the police, which the
police do not want (Collier, 2006).
Police organizations are generally quasi-military in nature, so the morale and the
encouragement of supervisors influence a police officer’s behaviors (Ozdemir, 2004).
When police officers perform their jobs, they use high level of autonomy and discretion.
Although there are many variables including offenders, victims, witnesses, crime tools,
and evidence and many changeable factors that affect officers’ decisions at the crime
scenes, police officers have to make correct judgments to provide justice (Ozdemir,
2004). They exercise their individual judgments in addition to formal rules while
making decisions. Moreover, there is no specific and unique list of policies and
procedures that can potentially guide police officers at the crime scenes where police
officers crucially need even small piece of information that may affect their decisions.
Therefore, police needs correct information systems to make good choices (Lin at al.,
2004). In addition, police officers should consider public accountability and
responsibility while using their discretionary powers (Ozdemir, 2004).
Manning (1992) delineated information handled by the police in three different
types: Primary, Secondary, and Tertiary Information. Primary information is raw data
that need to be processed by police after being obtained. Secondary information is the
data adjusted by a member of the police organization. Tertiary information is a kind of
managerial information that is processed by more than one agency. He also commented
that most of the information that the police have is primary information and not shared

34
among police officers due to different storage practices. Therefore, this primary
information gathered by the police needs to be analyzed and classified systematically by
information technology tools (Flanagin, 2002).
Generally, the intranet, a network system restricted to limited users, is used in
law enforcement agencies to provide communication and data transfer within an
organization. For example, intranet-based calendars and member directories help the
law enforcement officer keep all the events and schedules effectively (Dees, 2001).
However, Lutz (2003) claimed that most law enforcement agencies do not share
information routinely. It is very difficult to make a form of information retrieval that can
gather information covering all institutions in law enforcement. Therefore, this lack
demonstrability affects the usability of information technology systems in law
enforcement settings. There is a need for a comprehensive information technology
system to organize the information flow among these organizations (Chen et al, 2002).
Colvin and Goh (2005) insisted that the two factors of information quality and
timeliness for law enforcement agencies are important in terms of the general
acceptance of information technology. They defined information quality as being
accurate, relevant, specific, and recent information. The construct of timeliness they
described as gathering information and responding to calls for services in the most
convenient time.
User Characteristics of Police Officers
Although there are clear and certain rules for police behavior, the events that the
police encounter are mostly irregular, uncertain, and unstable in nature. Thus, police

35
officers use their discretionary power based on the situational rationality in light of the
information they get beforehand and at the crime scene. The information that the
police deal with is very contextual and related to the officer’s ability and evaluation
(Flanagin, 2002).
Manning (1992) claimed that traditional policing and the traditional role of the
police can contradict information technology usage (as cited in Colvin and Goh, 2005).
Officers may resist using information technology if they believe that this method
changes or disturbs their accustomed social structure, such as preventing them from
engaging in social relationships with other colleagues (Colvin and Goh, 2005).
Resistance is the main problem of usability. Saade and Kira (in press) stated that
the user resistance of information technology may stem from computer-phobia which is
rooted on computer anxiety. This physiological condition becomes more critical in non-
voluntary environments in law enforcement. Manning (2003) asserted that as an
indicator of resistance, officers may re-designate the information technology by re-
describing the situations where information technology does not exist. For instance,
they may claim that the reports are better gathered by using paperwork. In Michigan
City, senior police officers complain about the young officers for not interacting with the
citizens, but relying on computers, which cause them to loose some policing skills. They
may also perceive that information technology can be used as a big brother tool by
their supervisor, such as Automatic Vehicle Locators (AVL) developed for better
direction and supervisions of police cars. In addition, police officers may adjust or
manipulate the conditions by using information technology. For instance, officers may

36
close their AVL devices in their cars in certain places where the signal may go off when
they need to leave their jurisdictions. They may also give misleading information
through information technology to cover up their failure or deficiencies. The worst way
of resistance is sabotage to the information technology tools where the maintenance
takes too much time. After sabotaging the information technology tool, they may
report it as a regular break down for not to use that particular technology.
Collier (2006) indicated that one of the reasons for the failure of intelligence
systems is that the systems are not user friendly. In addition, Che (2001) stated that
some police officers may not want to disseminate of information gathered and locked to
other people due to security concerns. The cases of hackers in digital world and the
secretive nature of policing stimulate these concerns.
Typically, police officers have strong psychological attachments to their peers
and supervisors and personal commitments to the public service. Such psychological
attachment and personal bonds might be partially attributed to several factors that
include the nonprofit nature of organization, the relatively less straightforward peer
competition for resources or promotion, the greater trust of peers for assigned tasks,
the personal commitment to public service, the comparatively long-term career pursuit,
and the closed nature of the community. These characteristics are determining factors
for usability and acceptance of technology, because subjective norms which can be
defined as influence of important others, affect acceptance of technology (Lin et al.,
2004).

37
Police officers have a very pragmatic, tangible, and anti-theoretical perspective
to their job due to focusing on daily work with minimum paperwork. As a result, this
situation causes police officers to find research and experimentation objectionable.
Chen et al, (2002) claimed that police, particularly, are more pragmatic than those in
business settings. The fact that testability and performance are determining factors for
acceptance of technology makes this characteristic of police affect officers’ acceptance
of information technology and they are liable to concentrate more on the usefulness of
a technology than on its ease of use.
Perception is an important determinant for usage of information technology.
Although information is perceived by many police officers as power, control, and
influence and later, a valuable personal asset and a gain, the impact of information
technology on this process is not the same as the one in business settings because of
the nature of police work (Manning, 2003). Rocheleo (1993) stated that unlike most
private sector organizations, law enforcement agencies have not typically viewed
information system as a strategic and a valuable asset. In the private sector,
information technology contributes a highly competitive advantage. There are some
reasons of this perception. Generally, in policing, usability is ignored where users and
tools confront each other and when allocating and purchasing the systems. This
confrontation begins with the process of gathering raw data by patrol officers when
they decide that it is necessary to use these technologies pragmatically. Then, they
format and formulate these raw data and changed into official information. Because of
these reasons, police officers alter and reshape the information technology systems

38
based on their needs and purposes while obtaining information from crime scenes
(Manning, 2003). However, in the public sector, in an organization such as law
enforcement, there is a misperception of utility due to inadequate evaluation of
information technology and being seen as unnecessary for beneficially serving the
public. (as cited in Hauck & Weisband, 2002).
Information Technology Developments in Law Enforcements
Manning (2003) categorized information technology developments accrued in law
enforcement in the USA in five stages: pre World War II, post World War II, the Law
Enforcement Assistance Administration (LAEE) stage, the National Institute of Justice
(NIJ) policy, and the Crime Control Bills (COPS) period. His categorization stems from
the significant impacts of information technology on police practices. For instance, pre
WW II, police had used the telegraph, the call box, the telephone, and the two way
radios which changed the structure of policing in those times by providing coordination
within agencies. Unified Crime Reports under the FBI was developed during this stage.
Policy makers were trying to depict crime fighting, scientific, and professional image
during these time period. Especially, after the 1930s, two way radios met the need for
responding citizen’s calls.
After World War II and till 1967, the telephone was used widely to decrease
police response time to citizen’s calls. After the 1960s, computers were used to collect
and organize citizen’s calls (Byrne & Buzawa, 2005). Between 1968 and 1980, the Law
Enforcement Assistance Administration (LEAA), an agency giving grants to the states to
support researchers and studies in law enforcement, had significant impact on

39
information technology usage in police. LEAA sponsored Computer Assisted Dispatching
(CAD) systems for police agencies. The CAD could organize and store by means of
computers. 911, emergency call number, was introduced by the President Crime
Commission and accepted during this time period. However, the adoption of this system
took many years by police agencies, such as the usage rate was 17% in the mid 1980s
and reached 85% in the late 1990s. After 1974, the National Institute of Law
Enforcement and Criminal Justice (NILECJ) and later National Institute of Justice (NIJ)
had significant impact on information technology process in the USA’s law enforcement
system. They conducted several experiments and implemented several policies, such as
reducing random patrol, simplifying detective work, advocating crime analysis unit,
rationalizing drug law enforcement by using information technologies funded by
mentioned agencies. In 1994, Crime Control Bill was enacted to support community
policing. In accordance with this law, new information systems, including intelligence
gathering and integrated databases were funded. Today, information technology
systems are still being adopted by the local police agencies. Considering all information
technology developments in law enforcement in the USA, Manning (2003) claimed that
these developments were unplanned and generally politically driven.
In Turkey, the Turkish Police Organization was established in 1845 although
there were similar organizations in Ottoman Empire before that time. As a modern
organization, Directorate General of Turkish National Police was established in 1909.
Deployed by Technical Department which, now, has been called the Communication
Department since 1984, different communication devices, including telegraph, radio,

40
and telephone had been used by Turkish Police Officers since then. The Computer
Department was established in 1981 as a section under the Department of Research
Planning and Coordination to handle computer related jobs of the TNP. In 1984, this
section was transformed as an independent unit called Computer Department to
provide information technology to the Police for better, faster, secure, effective and
reliable services. Pekgozlu (2003) categorized the information technology developments
in the TNP in three phases: establishment of data processing, police computer network
project, reorganization and the POLNET. During that time, several projects, including
wide area police network, were started to create a database system covering many
information necessary for Turkish National Police.
One of main purposes of Police Network Project was to establish computer
infrastructures both in central unit and 81 city police agencies. To do so, the TRANSPOL
system, a physical telecommunication infrastructure of Police services was established
to combine different transmission systems, including Automatic Fingerprint System,
digital imaging, data transmission, LAN & WAN computer communication, and voice
transmission, into one unique platform. Computer Department also focused on
computer training for police officers and initiated many course activities. Today, several
projects, including mobile information system which is an implementation of digital map
supported by global positioning system (GPS), digital signature, and document
management system are on the agenda (Askan, 2006).

41
Data Integration Programs in Law Enforcement
Several different information management systems used by law enforcement
organizations exist. As mentioned earlier, Knowledge-Based Community Oriented
Policing System (KBCOPS) has implemented in Charlotte-Mecklenburg Police
Department (CMPD) in the USA. This system is based on a mobile information system
using wireless data sharing and transfer. The main aims of this system are to reduce
the amount of paperwork, increase data integrity, promote information sharing within
this police department and between other police departments, and support problem
solving. This system is designed to support information sources encountered by police
officers including incident reports, crime management, arrests of criminals, crime
investigation, and crime analysis. In doing so, the processes of reporting and
investigating incidents are linked by information technology. This linkage created a
precise, timely, and complete information system for police officers in Charlotte
(Williams & Aasheim, 2005).
The KBCOPS also has search capabilities that allow users to search any type of
crime, date ranges, patrol divisions, operation methods, suspect features, type of
weapons used in the crime, or any other variables that officers want to identify. The
KBCOPS database includes information that can be used to determine and arrest
criminals and to find track and plot criminal behavior patterns and trends (Williams &
Aasheim 2005). A study interviewed the law enforcement users of KBCOPS systems to
determine their perceptions about this system by utilizing questions from the TAM
(Davis, 1989) and the information systems implementation literature (Burns, Turnipseed

42
& Riggs, 1991). The researchers found that the overall perceptions of the officers were
positive although some older officers had resisted the system initially. They claimed that
the resistance stemmed from involuntary changes in the daily routine activities of
officers.
The National Incident-Based Reporting System or NIBRS (NIBRS Implementation
Program, 2002), is a national crime tracking system which was established to solve
crimes that happen in jurisdictions of individual police departments and across state
lines (Williams & Aasheim, 2005). The INFOTECH International was developed in
Tampa, FL. This program focuses on developing public safety to enhance information
sharing between law enforcement agencies. The objective of this is to utilize
information and security technology to enable secure data transmission between
agencies (Chen et al, 2002).
The COPLINK project (Chen, et al. 2002) was initiated and processed by the
Artificial Intelligence Lab at the University of Arizona. The objectives of COPLINK are to
increase the crime-fighting and prevention capabilities of law enforcement officers. The
COPLINK project offered two modules; COPLINK Connect and COPLINK Detect.
COPLINK Connect allows law enforcement officers to access other data located in other
jurisdictions or government agencies, beyond the initial restrictions of the systems.
COPLINK Detect supports individual officers’ analyses of complex criminal connections
by providing effective data integration and knowledge discovery. Typically, this module
also supports knowledge sharing by identifying and connecting individual officers
working on the related cases. One of the objectives of COPLINK is to develop an

43
integrated system to allow the Tuscon Police Department’s officers easy access to all
the information contained in all three systems, the Record Management System, Mug
Shots, and the Criminal Information Computer. The database technology plays an
important role in the management of information technology for a police department.
For instance, in one interview a patrol officer recounted that if he had had COPLINK
Connect, either in the patrol car or at one of the local substations, then he could quickly
and easily have verified the person’s identity (Chen et al, 2002).
Law Enforcement Online (LEO) is a secure intranet system that facilitates the
communication between law enforcement agencies. This system, operated by the FBI,
has online educational programs in addition to sensitive information for national
security. The Knowledge Management Centre (KMC) at The Hague in the Netherlands
is a knowledge management center administrated by Europol, the European Police
Organization. Europol regularly updates KMC’s databases and tracks new developments
in information technology to provide accurate and current information to member law
enforcement agencies (Gottschalk, 2006).
Case Study: Research Application Tool, POLNET, Turkey
Case studies help to comprehend whether the information technology tools fit to
the group norms, cultures, and practices since the traditional usability of technology
assessments just focus on the single users (Sonnenwald, Maglaughlin, & Whitton,
2001). In this study, the POLNET system was selected to understand usability features
of Turkish police officers.

44
The modern Turkish Police were established in 1845 (Cao & Burton, 2006).
Today, the TNP, which is the largest law enforcement agency in Turkey and is
administered by the Minister of Interior, has more than 174,000 employees. The TNP is
a highly centralized organization based on the structure of integrated policing which can
be defined as a structure where all the functions of police are encompassed in one
organization (Ozmen, 2006).
For the TNP, the POLNET is an information technology system that provides a
secure, reliable, and fast online aid to police officers dealing with criminal investigations
(Askan, 2006). POLNET was established for knowledge management, with the main
purpose of increasing performance in the TNP. Providing a secure network system,
POLNET enables Turkish police officers to access a national database that combines
different kinds of information storage, such as a criminal record database, a vehicle
database, and the data for terrorist or organized crime groups. In fact it was designed
to cover all the needs of Turkish police officers, including communication between
different agencies. (Yazici, n.d).
There are several reasons for establishing POLNET system in Turkey. First, due
to the rapid changes in social, economic, political, cultural, and industrial structures of
Turkey, and the growing population, new types of crime and methods have appeared in
the last decades. These conditions compel the TNP to have strong communication
systems between its agencies. Second, because of the requirements of e-government
applications and citizen satisfaction, the TNP has needed to respond to the demands of
online inquires of services such as passport and driving license issues, so an e-

45
government system like POLNET has been a necessity for the Turkish police. Third, the
TNP has to respond to other security organizations in Turkey in terms of information
sharing. POLNET has the capability to do this. Fourth, international police organizations,
such as Interpol and Europol, requires effective information sharing within member
countries’ police organizations due to increasing international organized crime
organizations around the world. Turkey, as a member of Interpol and Europol, has to
respond to these demands by using an effective information management system. Fifth,
establishing timely and effective information and communication system within the TNP
in terms of improving decision making process has been a requirement of contemporary
policing. Sixth, the TNP has needed an efficient and cost effective communication
system in terms of economical considerations by omitting duplications and errors in the
system (Pekgozlu, 2003).
Surveillance, smuggling, gun license, passport and visa control, criminal
background checks, fingerprint compression, traffic investigation, and decision support
systems are some of the areas that can be handled more quickly and effectively by
POLNET. Wireless connection through GPRS can be made for officers working in the
field. This system is also designed to provide a communication tool with international
organization networks and information databases as well as national organizations
under the protocol of e-government projects. Along with the project of TRANSPOL, the
POLNET system causes an establishment of electronic infrastructure with new hardware
and software programs which enable past and high quality data transfer for many
police agencies in Turkey. After deploying the POLNET system, more than 30,000 police

46
officers who will use this system have been trained regarding usage of POLNET system
and other computer applications, such as office programs until 2005. Based on these
training results and establishing the POLNET system, new personnel deployment system
has been applied to officers using POLNET system, which increase efficiency in the TNP
(Pekgozlu, 2003). Figure 1 indicates an interface of POLNET system (Public Security
Project of POLNET) (Askan, 2006).
Within the POLNET system, many different programs have been developed by
different areas of policing as of June, 2005. To increase search capability, 31 main
applications, 51 search programs, 26 local programs, and many statistical programs
have been installed in the POLNET system. The POLNET system is being used by
33,000 users with 13,567 workstations. The number of processes performed daily on
POLNET system is around 2.5 million.
Figure 1. An interface of the POLNET system (Askan, 2006).

47
In 2003, POLNET was also awarded a prize by the Turkish Informatics
Foundation and Turkish Industrialists’ and Businessmen’s Association (TUSIAD) in the
competition of e-government projects that support the transformation of information
technology in the applications of e-services in Turkey (Sozen, n.d).
The Effect of Natural Culture
The studies conducted on information technology adoption and usage outside of
the North America offered different results not only compared to the results in the
United States, but also one from another. Some of them found that national culture is a
discerning variable for technology acceptance and different factors of national culture
influence the core variables of TAM (Koeszegi, Vetschera, & Kersen, 2004; Malhotra &
Galletta, 1999; Mao, Strite, Thacher, & Yaprak, 2005; McCoy, 2002; Straub, Keil, &
Brenner, 1997; Veiga et al., 2001). Predominantly, they used and measured Hofstede’s
National Culture Model which was designed in 1980 (Hofstede, 1991; McCoy, 2002).
Hofstede’s National Culture Model is based on research which Hofstede
conducted at the IBM Corporation between 1967 and 1970. There were 116,000
respondents from 66 countries for the survey. Basically, he classified the countries
based on significant value differences (Veiga et al., 2001). Hofstede’s model consists of
five different variables that were the main classification dimensions of his study. These
variables are:
(1) Power Distance: defined as the “the extent to which the less powerful
members expect and accept that power is distributed unequally” (Hofstede, 1991, p.28)

48
(2) Uncertainty Avoidance: Hofstede’s explanation for this variable is the “the
extent to which the members of a culture feel threatened by certain or unknown
situations” (Hofstede, 1991, p.113)
(3) Masculinity / Femininity: Hofstede said that the “degree to which ‘masculine’
values like assertiveness, performance, success and competition prevail over ‘feminine’
values like the quality of life, maintaining warm personal relationships, service, caring,
and solidarity: from tender to tough” (Hofstede, 1991, p.163)
(4) Individualism/ Collectivism: Hofstede delineated individualism as “societies in
which the interest of individual prevail over the interests of a group” and collectivism as
“societies in which the interest of the group prevail over the interest of the individual”
(Hofstede, 1991, p.50)
(5) Long Term Orientation: According to Hofstede, “to the extent which people in
a country have a long term versus a short term outlook on life, the values of
perseverance and thrift are future oriented and more dynamic while the short-term
values are more static, being past and present oriented” (Hofstede, 1991, p.164-166 ;
Srite & Karahanna, 2006).
Studies exploring various cultures in terms of information technology found
significant differences in attitudes toward technology. Therefore, the researchers’
findings were different from the results of North America, so many hypothesized that
these differences stemmed from the effects of national culture on people. However,
some of them took a different position and claimed that the effect of national culture
was not a determinant variable for information technology acceptance (McCoy, Eyerard,

49
& Jones, 2005; McCoy, Galletta, & King, 2005). National culture also consists of
different interrelated concepts which are legitimacy, acceptance of authorities, dispute
solution means, perceptions, and authorities’ discretionary powers.
According to Hofstede’s National Cultural Model, the score of cultural variables
for Turkey:
Power Distance: 66
Individualism: 37
Uncertainty Avoidance: 85
Masculinity: 45
(Where 100= Highest, 50= Individualism, 0= Lowest value. Adapted from
Hofstede, 1991; Mao et al, 2005)
Based on these scores, it can be asserted that the people in Turkey have
relatively high power distance, are group oriented, avoid taking risks and are
moderately masculine in nature. Turkey is a nation with an obvious authoritarian legal
culture although western cultural influences have been observed recently. Collectivist
orientation, referring to the prevalence of group interest over individual interest is
another common feature of the Turkish nation. Individuals are affected by societal
power and legal control. However, modernization has begun to change the political,
social, and economic realities of this country (Cao & Burton, 2006).
Theoretical Backgrounds of Technology Acceptance
Many theories of technological acceptance have been proposed and expanded
for the past decades in contemporary information system research literature. In this

50
context, most of the studies inspiring these theories have generated adoption metrics
that can be used to determine the likelihood of information technology usage and they
all attempt to explain what factors influence the acceptance or rejection of technology
by its potential users. The relevant paradigms will be presented in a chronological
discussion.
Theory of Reasoned Action (TRA)
The Theory of Reasoned Action (TRA), a widely studied model in social
psychology, was established on several dynamics including relations between beliefs,
attitudes, intentions, and behaviors (Fishbein & Ajzen, 1975). The basic goal was to
understand what and how motives that change people’s beliefs and attitude affect
behavior in general. While proposing this theory, Fishbein and Ajzen (1975) assumed
that human beings make rational choices and also make systematic use of the
information that they have in their decision making process. Thus, individuals consider
the consequences of their actions whether or not they implement that particular
behavior.
Instead of attitude, behavioral intention is selected as a main predictor of
behavior by this theory. In fact, behavioral intention, the core determinant of user
acceptance for this theory, is classified by the person’s attitude toward behavior and
subjective norms (Malhotra & Galletta, 1999). An individual’s attitude toward behavior
consists of behavioral beliefs and evaluations of behavioral outcomes. In this context,
behavioral beliefs refer to an individual’s positive or negative feelings about performing
the intended behavior. Later, these beliefs are defined as silent or available beliefs that

51
a person holds (Azjen & Fishbein, 1980). By presenting this behavioral intention model,
Fishbein and Ajzen (1975) propose that researchers should be able to predict the
performance of any behavior unless individuals make deliberate changes between
evaluation and carrying out that behavior.
In this theory, evaluation of outcomes refers to individuals’ engagement in
activities when they perceive adequate benefits (Hinnat & Welch, 2002). Overall,
attitude can be evaluated as the consequences of individual behavioral beliefs and
expected consequences of that behavior. As for the subjective norm, it is formed by
normative beliefs and motivation to comply with that particular task. Subjective norm
refers to an individual’s perception of his or her significant referents' opinions. TRA
hypothesizes that people’s beliefs influence their attitude, which joins with subjective
norms in shaping the behavioral intention that eventually guides or dictates the actual
behavior (Lin et al., 2004). Figure 2 shows the schematic design of TRA:
Figure2. Graphical view of Theory of Reasoned Action (Adapted from: Fishbein &
Ajzen, 1975; Legris et al., 2003).

52
However, according to Vankatesh, Morris, Davis, G, and Davis F. (2003), there
are some limitations in the theory. First, in TRA, there is no clear distinction made
between attitude and norms, which may cause confusion and misusage when
determining the concepts. Second, this theory does not take into account variables
other than attitude and subjective norm that may affect the behavior, such as ability,
time, cultural factors, and unconscious habits. Therefore, some behaviors may not be
explained by this theory. Third, Fishbein and Ajzen (1975) pointed out that their
observation was based on self reports of individuals and not an actual and direct
observation. Fourth, in this theory, there is also a limitation for individuals who perceive
that they have little power over their behaviors, so this theory does not clearly explain
these kinds of individuals’ behaviors. Thus, to overcome these problems, Ajzen
developed and presented the Theory of Planned Behavior (TPB) (Schifter & Ajzen,
1985).
Theory of Planned Behavior (TPB)
The Theory of Planned Behavior (TPB) extends the TRA by adding perceived
behavioral controls to the model, including attitude, subjective norms, behavioral
intention, and actual behavior (Madden, Ellen, & Ajzen, 1992; Yi et al., 2005). The main
reason behind this addition was the recognition that behavior is not always controlled
voluntarily. Ajzen (1991) claimed that behavior is deliberative and planned and behavior
is a determination of behavioral intention (Huang & Chuang, 2007). This theory posits
that there are three beliefs that affect behavioral intention. The first one is behavioral

53
beliefs which lead to attitude. Attitude is defined in this theory as positive or negative
feelings about that behavior or its outcomes (McCoy, 2002).
Second, normative beliefs which lead to subjective norms consist of the
referent’s opinion and motivation to comply, motivation to what each referent thinks.
Third, control beliefs that lead to perceived behavioral control refer to people's
perceptions of their ability to perform a given behavior. This perception consists of two
dimensions, internal and external, which are affected by the individual’s knowledge
capacity. Internal perceptions refer to past experience and channels where information
is received and external perception refers to social influence and resource limitations
including technical and managerial support (Lee, Kim, Rhee, & Trimi, in press; Veiga, et
al, 2001). Figure 3 depicts the schematic view of TPB:
Figure 3. Graphical view of Theory of Planned Behavior (Adapted from: Ajzen’s
personal website: http://www.people.umass.edu/aizen/tpb.diag.html).
54
TPB also hypothesizes that knowledge affects not only attitudes but also
perceived behavioral control and that there is a strong correlation between intention
and behavior. In this theory, behavioral intention can be defined as the perceived
likelihood of performing the behavior (Lin et. al, 2004). In sum, people are more likely
to perform the behavior and intention if they have a more favorable attitude and
subjective norm in addition to considerable perceived behavioral control to that targeted
behavior (Ajzen, 2002).
Taylor and Todd (1995) presented different version of the TPB and called
Decomposed Theory of Planned Behavior (DTPB). They found that attitude, subjective
norm, and perceived behavioral control contributed equally to the behavioral intention.
Moreover, they claimed that both the TPB and DTPB have more explanatory power over
behavioral intention than TAM has alone (Brown, Massey, Montoya-Weiss, & Burkman,
2002).
The Diffusion of Innovations Theory (DOI)
The Diffusion of Innovation (DOI) theory hypothesizes that information flows by
means of communication networks and channels in the society and the diffusion of an
innovation is formed in this society by being affected by these channels (Russell &
Hoag, 2004). This theory also posits that the level of adoption of new technology is
determined by the perceived attributes of innovation and the process of communication
(Premkumar & Bhattacherjee, in press). In addition, Mao, et al., (2005) claimed that
this theory assumes there are differences in adapting innovations across cultures.

55
Rogers, the creator of DOI, (1995) identified the innovation as individuals’
perceptions of new about an idea, practice, or object. He defined how innovation,
particularly technological innovation, has critical importance for our society in every
aspect of our daily life and civilization. He also mentioned that individuals’ reactions to
these innovations determine their effects to society.
The important concepts of DOI can be described in their special meanings for
this theory. Rogers (1995) defined key factors of this theory. First, innovation is any
thought or process observed as new by people. Second, communication is the process
of the new idea transferring from one person to another- mass media play an important
role in this stage. Third, a social system is the group of individuals that have a complete
and specific goal. Fourth, time is how long it takes the rate of adoption for individuals
or the group to adapt an innovation (as cited in Yi, et al., 2006).
Based on his five years of investigation on diffusion of innovation, Rogers (1995)
determined that five basic factors occur in social systems and change over the course of
time. These are knowledge, persuasion, decision, implementation, and confirmation.
Knowledge is shaped by two determining variables: Receiver variables including
personality characteristics, social characteristics, and perceived need for innovation, and
social system variables including social system norms, tolerance of deviancy, and
communication integration (Russell & Hoag, 2004).
Persuasion is formed by perceived characteristics of innovation attributes.
According to the Rogers, (1995), these key innovation attributes are:

56
• Relative advantage is a degree of persuasion for being better than what it
supersedes. It can be measured by several variables, such as usefulness,
credibility, quality of results, or prestige.
• Compatibility can be described as consistency with existing values, including past
experiences and needs. Compatibility is also related to norms, cultural values,
and objectives of people who try the innovation in terms of differences between
traditional work patterns and new innovation approach.
• Complexity is the difficulty of understanding and use of technology. When the
system is found difficult, Rogers claimed that people do not adopt that particular
innovation Because of this reason, usability engineering and user friendly
interface designs have been become appealing subjects among designers and
computer programmers.
• Trialibility is the degree of experimentation for that particular innovation. It
includes perception of ease of try and risks for possible unintended
consequences. If the systems allows you to make redo, people more likely adopt
the innovation. Exploring the system effortlessly gives people more information
and confident about usage of the system.
• Observability is the visibility of its results. It is the degree to whether the results
of innovation can be understood easily. Rogers (1995) asserted that users need
to know the consequences of usage before they try that particular innovation.

57
Figure 4 shows the schematic view of DOI:
Figure 4. Graphical view of Diffusion of Innovation Theory. (Adapted from:
Rogers, 1995).
Yi, et al, (2006) noted that in this theory, the decision stage includes two
options. First, rejection of innovation results in either later adoption or continuation of
rejection. Second, adoption of innovation results in either continued adoption or
replacement. In the implementation stage, innovation is put into use by end users.
Finally, a confirmation of innovation happens in which individual users can evaluate the
results of that innovation. Moreover, in this theory, result demonstrability, a tangible
product as a result of innovation, and image, a belief that innovation increase one’s

58
image or status, are important characteristics that affect user intention (Lundblad,
2003).
Rogers (1995) also categorized adapters in this process based on their reaction
time to new innovations. He classified these groups by using a normal distribution
curve, and called them innovators, early adaptors, early majority, late majority, and
laggards as seen in Figure 5. The innovators are well educated, venturesome, and have
multiple information sources. Early adaptors are also educated, popular, and
respectable. Early majorities are deliberate and have many informal social contacts.
Late majorities are skeptical and have lower socio-economic status. Laggards are very
traditional and have very few information sources (Starkweather & Wallin, 1999).
Figure 5. Adopter Categorization on the Basis of Innovativeness (Adapted from Rogers,
1995).
Rogers (1995) asserted that the process of diffusion is also influenced by
reduction of uncertainty. Individuals, at first, are uncertain about that particular

59
innovation, and then they cope with this uncertainty by learning form different sources,
including consulting others about this new innovation. He claimed that early adopters
more likely to ask to authoritative sources about their opinions since they have limited
education background and skills. He pointed out that this situation approves how the
process of innovation develops in a given society. However, his theory has been
criticized for not focusing individual perspective of technology adoption rather
addressing innovation occurs in society (Dillion & Morris, 1996).
Task-Technology Fit Model (TTF)
TTF focuses on the match between user task needs and the available
functionality of the information technology (Goodhue & Thompson, 1995). The core
structure of a TTF model is the matching of the capabilities of the technology with the
demands of the task (Ioimo & Aronson, 2004). Goodhue & Thompson (1995) developed
a measurement that shows important factors for utilization of technology. These are
quality, ability of locate, authorization, compatibility, ease of use, training, production
timeliness, systems reliability, and relationship with users.
Dishaw and Strong (1999) indicated that users utilize information technology
provided that their needs fit the capabilities of the technology. Information technology
is more likely to have a positive impact on individual performance. They suggested that
an integration model of TTF and TAM would better explain technology acceptance.

60
Figure 6 shows a schematic view of TTF:
Figure 6. Graphical view of Task Technology Fit Model (Adapted from: Goodhue
& Thompson, 1995).
The degree of individual abilities also affects the utilization of technology. This
concept can be defined in this model as computer efficacy and classified as cognitive
abilities, experience, and frequency of use (Dishaw & Strong, 1999). TTF theory has
four basic factors that affect the performance of individuals. These are first, task
characteristics and second, technology characteristics, which together affect the third
factor Task-Technology Fit, which in turn affects the outcome factors, either
performance or utilization. The model hypothesizes that individual abilities also affect
the process of TTF. For instance, experienced users will benefit from technological tools
and methods more than new users will (Ioimo & Aronson, 2004).

61
Technology Acceptance Model (TAM)
The Technology Acceptance Model (TAM) developed by Fred Davis in 1986 is an
information system that illustrates how users come to acknowledge and adapt the
technology. The TAM addressed why users accepted or rejected information
technology. As was the Theory of Planned Behavior (TPB), this model was also an
adapted version of the TRA (Colvin & Goh, 2005). TAM is such a widely accepted and
tested model that, according to Money (2004), 355 journal citations have been made,
indicating a strong acceptance among researchers due to its understandability and
simplicity. Moreover, there were approximately, 200 studies, published in journals,
proceedings, or technical reports, related to the TAM between 1989 and 2001 (Ma &
Liu, 2004). This paradigm contends that when users are introduced to a new
technology, some factors impact their intention to use the system. The TAM holds that
users’ behavioral intention to use technology is affected by the perceived usefulness
and perceived ease of use of the technology (Vankatesh & Davis, 2000).
Davis (1989) claimed that perceived usefulness, “a belief that using the new
system will increase the performance”, and perceived ease of use or “the degree to
which a person believes that using a particular system would be effortless” (p.320) are
the main two parameters that impact the usage of these systems. Both perceived
usefulness and perceived ease of use predict attitude, the user’s interest or desire to
use the system. Attitude and perceived usefulness, together, are then predictive of an
individual’s behavioral intention to use the system. In addition, perceived usefulness is

62
also affected by perceived ease of use which escalates the usefulness (as cited in
Vankatesh & Davis 2000).
Davis, Bagozzi, and Warshaw, (1989) stated that TAM’s capability to explain
individuals’ attitudes and behaviors toward information technology system depends on
the external variables. These external factors both affect perceived ease of use and
perceived usefulness simultaneously. Specifically, what these external variables
constitute depends on the environments that the research is conducted. Thus, many
researchers have used different variables for these external factors.
Figure 7 shows a schematic view of the original TAM:
Figure 7. Graphical view of Original TAM (Adapted from: Davis, et al., 1989;
Legris et al., 2003).
In this model, there is a direct causal link between the behavioral intentions and
actual behavior and this mentality is theoretically explained by many researchers in a
variety of studies (Lin et al., 2004; Money, 2004; Ma & Liu, 2004; Malhotra & Galletta,
1999).

63
TAM provides an important theoretical contribution to our understanding of user
acceptance of information technology (Robey, 1996). Szajna (1994) examined the
reliability and validity of perceived usefulness and perceived ease of use and found
significant reliability and good predictive validity. In 1995, Chin and Todd tested TAM in
their cross validation study. They used a structural equation model by applying a one
factor usefulness construct and two-factor explanatory interactions and found that the
one factor model fit their sample.
TAM can be classified as a leading model for explaining or predicting individual
technology acceptance and presents a framework from which extended models can be
developed for examining individuals having different characteristics (Lin et al, 2004).
Among these extended models, several of them, classified as milestones of this theory,
are mentioned chronologically.
Taylor and Todd (1995) modified TAM by explaining the evaluation of the
effectiveness and the understanding of the behavior of experienced or inexperienced
users. The results of their study showed that there were significant differences in the
relative influence of the determinants of usage regarding users’ experience.
Chau (1996) modified the TAM model and distinguished between perceived near-
term usefulness and long-term-usefulness. He also found that contrary to perceived
ease of use, a person’s usage of a new technology relies on perceived usefulness of
that technology and that perceived ease of use has a relative impact on intention to
use. Similarly, Sun (2003) claimed that the most important factor among all the
variables determining the user acceptance of a new technology is perceived usefulness.

64
Gefen and Straub (1997) investigated whether gender affects technology
acceptance. They found that women were more cooperative in terms of social
conversion than men who were more competitive than women. Later, Venkatesh and
Morris (2000) also investigated the effect of gender on technology acceptance. They
found that perceived usefulness is a strong predictor of technology acceptance for men.
On the other hand, women are affected by systems’ ease of use and subjective norms.
The TAM2 model proposed by Venkatesh and Davis (2000) extends the original
TAM by incorporating subjective norms and cognitive instrumental processes in the
model (Lin et al, 2004). Social influence processes, subjective norms, voluntariness,
image, cognitive instrumental process, job relevance, output quality, result
demonstrability, and perceived ease of use are all included. According to Vankatesh and
Davis (2000), the social influence processes affect the social dynamics and forces on
users in terms of whether they use the new systems or not. In this context, a subjective
norm can be defined as a perception of being influenced by the referent(s) who is/are
the authority in that particular organization. Similarly, an image is a level of perception
that innovation is beneficial.
Venkatesh and Davis (2000) tested the TAM2 model and discovered a correlation
between these social factors and perceived usefulness of technology. Voluntariness
was chosen as a moderating variable in two sample groups and defined as being non
mandatory for the decision to adapt and use the technology. As a result of testing these
assumptions and hypotheses, Vankatesh and Davis found that subjective norms have a
significant effect on usage intentions over perceived usefulness in both voluntary and

65
non voluntary conditions. However, there is only a slight effect on ease of use in non
voluntary conditions and when people get experience in their jobs, the effect of social
influence process decreases. In cognitive instrumental processes, all four conditions
have a significant effect on perceived usefulness and ease of use. Another interesting
finding from the Venkatesh and Davis study was that job relevance and output quality
shared a mutual effect. They also questioned the effectiveness of attitude in mediating
the effect of perceived usefulness and perceived ease of use on behavioral intention,
thus they argued for its removal from TAM and its extensions.
Van der Heijden (2004) examined the individual acceptance of technology and a
related subject, usage of a website, adding two new constructs, perceived
entertainment value and perceived presentation attractiveness (Gardner & Amoroso,
2004). This study offers several interesting findings; first, that the relationships among
perceived usefulness, perceived entertainment value and website revisits were
significant. Second, in determining website usage, perceived usefulness and perceived
entertainment value were both significant factors. Third, perceived entertainment value
increased to the length of visits to websites more than perceived usefulness. And
finally, fourth, ease of use only indirectly influenced website usage (Van der Heijden,
2004).
Similarly, Yi, Jacson, Park, and Probst’s (2006) study produced an integrated
model which was a combination of TAM, TPB, and IDT and tested it on individual
professions (Yi et al, 2005). This model provides a cognitive understanding of the
mechanisms underlying technology acceptance through the combination of these three

66
models. They assert that this new model can better explain information technology
acceptance and usage. They also found that individuals are more likely to accept
technology if the tangible results are visible or technology improves their stature at
work.
Premkumar and Bhattacherjee (in press) developed an integration model which
is a combination of TAM and the Expectation-Disconfirmation Theory (EDT). EDT is a
longitudinal process model and hypothesizes that user intention and behavior depend
on a satisfaction process which is formed by a user’s previous expectations and initial
experiences. The integration of TAM and EDT provided a more comprehensive
understanding of processes related to information technology usage. According to this
model, users have pre-usage expectations for the particular product. In addition to
gaining experience by using it, they compare this perceived performance and initial
experience and arrive at a disconfirmation. As a result, this disconfirmation level
determines usage satisfaction which directs and affects user intentions about whether
they will use it or not (Premkumar & Bhattacherjee, in press).
In addition to individual studies, some researchers conduct meta-analyses by
reviewing various technology acceptance models. Legris et al., (2003) stated that
although TAM is a very useful model for determining technology acceptance, the
variables used to explain TAM in previous studies are inconsistent and unclear, so there
is a need to add some other variables including human and change processes and
adoption of innovations. They claimed that original Tam models explain just 40% of
system usage.

67
Similarly, Sun and Zhang (2004) stressed that Tam can explain 40% of variance
in technology acceptance and stated that studies usually explaining technology
acceptance by using TAM have used technology imperatives and micro level analysis
when considering individual perceptions. They suggested that a mixed level focus,
including both macro and micro analyses should be used to solve the inconsistent
results of previous research. They asserted that technology acceptance is a dynamic
process involving technological and organizational structures.
Sun and Zhang (2005) also examined the moderating factors that influence TAM.
These factors were categorized into three groups, individual, technological, and
organizational. They concluded that most of the technology acceptance models need
improvement although they found some statistically significant results. In addition,
they pointed out the importance of moderating factors explaining technology adoption.
They also stressed that cultural values have not been examined adequately by
researchers in this field and suggested that researchers focus on cultural dimensions of
technology acceptance.
King and He (2006) reviewed 88 published articles and found that TAM is a
robust model to explain technology acceptance. They organized the concept and
variables of TAM into four categories: (1) external factors, such as experience and self
efficacy, (2) other factors suggested by other theories, such as subjective norms, risk,
and trust, (3) contextual factors, such as culture and technology characteristics, and (4)
measures, such as actual usage or perception of usage. They found that perceived
usefulness and behavioral intention are significantly reliable.

68
Usability and Information Technology Acceptance Research
Conducted in Law Enforcement Settings
Lin et al. 2004 examined the perceived ease of use and perceived usefulness for
the COPLINK. This framework, basically, is a combination of the TAM and the TPB. They
measured perceived usefulness and perceived ease of use in terms of subjective norms,
availability, job relevance, output quality, result demonstrability, external data
exchange, efficiency gains, and self-efficacy. Results from preliminary evaluations of
COPLINK showed that individual officers placed great importance on task performance
efficiency resulting from their use of a technology. (Lin et al, 2004). This study found
that perceived usefulness may be the single most important factor in individual officers’
technology acceptance decision making. Perceived usefulness appears to be the only
construct that has a significant direct effect on behavioral intention.
In their study validating the use of TAM on police officers, Colvin and Goh (2005)
determined that TAM findings were supported empirically in law enforcement settings.
A patrol officer who accepted new technology would be facilitated by increasing the
ease of use and perceived usefulness. Their findings suggested that the new factors of
information quality and timeliness were the most important components of technology
acceptance by patrol officers (Colvin & Goh, 2005).
Timeliness elements were defined as timely access to information and timely
response to calls for service. Given the potentially dangerous situations in which law
enforcement officers performed their jobs, placing importance on the quality and
timeliness of information might prevent fatal outcomes. The findings also implied that

69
administrators should be clear about the purpose of new technology. For this reason,
for example, they might emphasize the usefulness of the technology in the form of
report writing functions that would permit patrol officers to remain in the field while
they completed incident reports (Colvina & Goh, 2005). Patrol officers rely on
technology to ensure the safety of the communities they serve. Officers who readily
accept new technology would improve both efficiency and resources that facilitate their
efforts to serve community members effectively.
Zaworski (2005) examined the impact of the Automated Regional Justice
Information System (ARJIS) on police officers to find out whether an information
sharing system has any effect on policing performance. He focused on individual
effectiveness, job performance, productivity, investigative support, arrests, and
clearances in terms of technology effectiveness. In his experimental study, one of the
two groups was assigned to use the ARJIS system. He found significant results for
these variables, except for the arrest factor, between his subject groups.
Pekgozlu (2003) conducted a study for end-users of POLNET in 2003. He stated
that there is a high correlation between end-users’ participation and the success of the
project based on information technology. Usability features of end-users may influence
the system’s performance positively or negatively in accordance with their participation
to the system. He added that end users may resist the system because of the
inappropriate system design, their confusion or distrust to the system, and their
negative attitudes about the system. This resistance may go further and even leads to

70
the sabotage. In addition, he also mentioned that end-users’ too high expectations
about the system may result in disappointment and distrust of the system.
In his study, Pekgozlu (2003) found that even when the end-users’ knowledge
about computers is only at an average level, they are liable to trust the computers’
technology and the POLNET system. End-users think that computers and the POLNET
system contribute a lot to their work, but they also are concerned that some projects in
the POLNET system do not completely meet the needs of their work. They also think
that using the POLNET system is relatively easy and it is not perceived as an obstacle to
their decision making process. In addition, 61.5% of the end-users think that the
POLNET system increases the Turkish police’s prestige and status and thus they have a
positive attitude to the POLNET system (Pekgozlu, 2003).
In his master’s thesis, Tosun (2006) conducted a study to test the attitude and
perception ofTurkish police officers, working in Istanbul, toward the Mobile Information
System (MOBESE) system terminals mounted in police cars by utilizing TAM. As external
factors, he chose police officers’ tenure of job, their user experience with computer, and
user satisfaction of MOBESE system. He found that perceived usefulness, perceived
ease of use, and attitude toward MOBESE usage are positively related to system usage.
Usability and Information Technology Acceptance Research
Conducted in Different Cultures
There are many studies focusing on the acceptance and diffusion of information
technology systems in North America (Premkumar & Bhattacherjee, in press; Vankatesh

71
& Davis, 2000; Yi, et al., 2006). Compared to the number of American studies, there
are relatively few studies conducted outside of North America (McCoy, 2002). The most
seminal of these studies of the past decade are presented in chronological order:
First, in 1994, Phillips, Calantone, and Lee conducted research in China. They
measured cultural affinity and TAM in the setting of Chinese firms adopting technology
for transactions. They investigated employees of those firms to determine whether
adoption of information technology differs across countries and found that culture had a
significant effect on international information technology adoption.
In 1997, Straub, et al. compared the level of e-mail adoption in three different
countries, the United States, Japan, and Switzerland. They found that email was
adopted highly in the USA, moderately in Switzerland, and rarely in Japan. They
attributed these differences to culture. However, McCoy (2002) and McCoy, et al.
(2005) pointed out that though the researchers claimed that culture had a moderate
effect on information technology acceptance, they did not collect data related to culture
and they could not empirically prove that the variance in the results stemmed from
culture.
Evers and Day’s 1997 Australian study hypothesized that in order to gain
economic success in the software business; web-interfaces should be designed in
accordance with cultural differences. To test this, they investigated native Australian
and international students’ design preferences in their survey. They found that design
preferences influenced interface acceptance. As with the previous study, they attributed
this variance to culture without actually measuring it (McCoy, et al., 2005).

72
Veiga et al. designed a qualitative study in 2001 to investigate whether cultural
variables defined by Hofstede could have an impact on key components of TAM. They
proposed 16 different hypotheses to explain the gap or lack of functional relationships
between culture and TAM.
Then, Koeszegi, et al. conducted research in 2004 using an extended TAM to find
out whether national culture influences a user's perception and use of Internet-based
negotiation support systems (NSS). However, they used a different comparison scale
based on Hall’s (1976) contextual distinctions between cultures (as cited in Koeszegi et
al., 2004). Low-context or high-context cultures constituted the unit of measurement to
identify cultural differences. In low-context cultures, like the United States or Northern
European countries, a small amount of information is shared and encoded completely in
a given context of an event. However, in high-context cultures, like in Latin-American or
Eastern (Asian) countries, most information is either included in the physical
background of that event or personalized by them. Koeszegi, et al found that during
negotiations, users from high-context cultures exchange significantly more messages
and offers than users from low-context cultures.
Most recently, Mao et al (2005) conducted a comparative study examining user
behaviors related to cell-phones in Turkey and the United States. They focused on how
the adoption of cell phones changes across two cultures. As hypothesized, their results
differed in terms of technology acceptance and adoption of innovations. For instance,
they found that perceived ease of use to intention to use was significant for the Turkish
sample, but not significant for the Americans. They attributed these differences to

73
cultural and economic structural differences. However, they did not measure the
culture. They just found different results for technology acceptance and concluded that
these differences stem from cultural differences because their argument was consistent
with the Hofstede’s model of culture. The researchers also compared these two cultures
based on Hofstede’s model, and found consistent results with their study.
However, some recent researchers have criticized these aforementioned studies
in terms of either not using Hofstede’s model or not measuring cultural factors with
technology acceptance models. These researchers claim that previous studies were
conducted in student settings, not in “real” environment settings. Moreover, their
international variance was even lower than variance in Hofstede’s model (McCoy, 2002).
The following are three of the major studies that critique the earlier research.
First, McCoy tested the factors of TAM and culture dimensions in university
settings across the world in 2002. He claimed that there is a strong correlation between
patterns of TAM and whether or not a person has low or high cultural dimensions. The
result of this study indicated empirically that the cultural orientation of people can make
a difference in decisions of technology adoption. He examined the results individually
and also attempted to measure cultural factors themselves.
Second, McCoy, et al. examined TAM in Uruguay and the USA in 2005. Their
assumption was that no significant differences exist across cultures in terms of
technology acceptance, which stem from Straup et al’s., (1997) critiques regarding the
relationship between culture and technology acceptance. They conducted a survey by
using the TAM to test email usage by American and Uruguayan university students. An

74
important finding was that it was appropriate to apply TAM to explain significant
differences in intention to use technology in a non-American nation. The variables of
TAM showed consistency within both countries although they had been found to be
different in Hofstede’s Model.
Third, McCoy, Galletta, and King (2005) also criticized previous studies. They
attributed these inconsistent results to some flaws of the previous research, pointing
out that Hofstede’s Model was more than 30 years old. They claimed that the world has
changed significantly and more importantly, habits of technology usage also have
changed drastically in the last two decades. Another criticism was that the country
scores in Hofstede’s model may not reflect every individual in a given country.
Obviously, there can be variability across individuals in every country. They advised a
trait-based approach that evaluates each individual’s score to test cultural differences in
terms of technology acceptance. They also stressed how important it is to collect
contemporary data of cultural variables.
Research Model
The research model used in this study is based on the integration of three
different technology acceptance models: TAM, TPB, and DOI, while including
modifications not originally in those models and including two additional variables
(facility and voluntariness). The model is designed to best fit police officers using the
POLNET system in Turkey, considering three main dynamics including national and
organizational culture, characteristics of police officers toward technology, and
distinctive features of policing and technology acceptance. In addition, the previous

75
studies conducted in law enforcement settings and the studies whose samples were
drawn from Turkey were considered while structuring this model. Figure 8 shows the
conceptual diagram of the research model:
Figure 8. Conceptual Diagram of the Research Model.
This particular design was selected because different professions may show
different paths in terms of attitude about and intention of using information technology
(Colvin & Goh, 2005). Thus, the police officers’ adaptation of information technology
can be jointly explained by these different factors, so this integration of three
technology acceptance models, having more explanatory power than each theory alone,

76
was chosen. Other than two variables of Voluntariness and Facility, the design of the
model was tested by Yi et al. in 2006 in the health professions and they found
significant results although some paths of variables that are slightly different than this
research model proposed. By integrating these theories, it is assumed that this model
provides an improved and more comprehensive understanding of the cognitive
processes and behaviors regarding information technology usage of Turkish police
officers, than each theory alone can.
The reason for integration stems from findings of recent studies. Wu and Wang
(2005) suggested that the TAM model needs to be strengthened by including additional
variables in its structures. In fact, there are some common constructs in these three
theories. They all include system usage and behavioral intention. Legris, et al., (2003)
recommended that TAM needs to be integrated with other variables including adoption
of innovation and social control factors. The constructs of perceived usefulness and
perceived ease of use, the core variables of TAM; the subjective norm and perceived
behavioral control from TPB; and prestige, result demonstrability, and personal
innovativeness from DOI were all adapted and integrated for this study.
The concepts of facility and voluntariness were also selected as factors involved
in the acceptance of information technology because of the specific nature of law
enforcement settings. TAM focuses on perceived gains and benefits because it assumes
that people make rational decisions by weighing risks and benefits, but in TPB, positive
or negative beliefs play important roles for technology adoption (Horst, Kuttschreuter, &
Gutteling, in press).

77
This model not only embraces these general rules but also includes some
variables from DOI. Indeed, in TAM 2, Vankatesh and Davis (2000) used the concept of
image (called prestige in this study as Rogers defined originally) and result
demonstrability, but they did not evaluate personal innovativeness in their model.
Legris, et al., (2003) suggested that new variables need to be added, including
innovativeness, to better explain technology acceptance. Vankatesh and Davis (2000)
included perceived voluntariness in their model as a mediating variable of the social
influence process and reported significant findings. Lin, et al (2004) included availability
(it is rephrased as facility in this model) in their case study of COPLINK. As a result, I
assume that the intention to adopt the POLNET system is related to the concepts
mentioned above: perceived usefulness, perceived ease of use, subjective norms,
behavioral control, facility, prestige, result demonstrability, and personal innovation.
Summary
The importance of information technology for police agencies reveals that policy
makers and administrators continue to invest in this sector by considering usability
factors which directly influence the effectiveness of the information technology. To
examine usability characteristics of police officers, technology acceptance theories
offering different models can be employed by considering task characteristics of policing
and police officers’ usability features. Recent studies indicate that researchers also
ought to take into account national cultural factors when examining user attitudes and
perceptions toward technology adoption.

78
Thus, a research model was presented based on three different technology
acceptance models, TAM, DOI, and TPB, to test the Turkish police officers’ adoption of
information technology to contribute to Turkish information management practices.
Police agencies in many countries have developed many projects for better information
management systems in their organizations, one of which is POLNET developed by the
TNP and selected as a research tool for this study.

79
CHAPTER 3
METHODOLOGY
Introduction
This chapter reviews the research design and methodology used to conduct this
study to answer the research questions. First, it presents the variables for testing the
research questions and states the main hypotheses. Next, the research methodology is
described in detail, including sampling, instruments, data collection, and the data
analysis method.
Research Design
The methodological plan of this cross-sectional study is a self administrated
survey design. The survey was given to the participants, was completed by them, and
then collected. For researchers in social sciences, such as in criminal justice, the main
motivation of choosing a survey design is its one high predictive value of assessing the
efficiency of an organization or a group in a society when the aspects being studied are
related to human opinions, perceptions, and beliefs. In addition, survey research is
preferred when researchers can not manipulate the conditions that the subjects will
experience. In this study, the attitude, intentions, and beliefs of Turkish police officers
were sought and evaluated. In fact, their individual cognitive perceptions were tested,
so a survey that collects perceptual data from individual respondents was conducted in
a Turkish law enforcement setting.

80
To determine and evaluate the perceptions of subjects via a research survey, in
turn, creates prerequisites for rectifying policies consistent with the changes in
perceptions. In this study, the researcher assumes that using effective and valid survey
research will have helped to determine the factors that affect the usability of the
information technology on which the TNP has spent considerable money in order to
improve the performance of policing in Turkey. As a result, this study was performed
based on survey research rather than an experimental or quasi-experimental design.
Operational Definition of Variables and Hypotheses
Dependent Variable-Intention to Use
The dependent variable is “Intention to Use” the POLNET system, a subjective
probability of using the POLNET system. This variable is justifiable and empirically
supported by previous studies (see Hu et al., 2005; Premkumar & Bhattacherjee, in
press; Saade & Kira, in press; Vankatesh & Davis, 2000, Wu & Wang, 2005). According
to Ajzen and Fishbein (1975), intention has significant effects on behavior. Similarly,
TPB postulates that behavior is a result of behavioral intention (Ajzen, 1991).
In this cross sectional study, selecting intention instead of system usage prevents
the potential problem of retrospective analysis. In fact, in their meta-analysis, Sun and
Zhang (2005) said that behavioral intention is a better indicator of system usage than
expectation, motivation, value, and user satisfaction. In this study, intention to use was
selected as a dependent variable instead of system usage because in involuntary
settings, usage may not accurately reflect the real opinions of users. Choosing intention

81
could also be beneficial for managers and policy makers involved in the development
and deployment of new systems.
Attitude
Attitude refers to the police officers’ positive or negative attitudinal beliefs about
the use of POLNET technology (Hu et al., 2005; Huang & Chuang, 2007). According to
the TAM model, attitude is a determinant of perceived usefulness and perceived ease of
use (Zain, Rose, Abdullah, & Masrom, 2005). However, in technology acceptance
literature, attitude has always been discussed relevant to its effect on intention or
technology usage. In the original TAM model, attitude was a strong determinant of
behavioral intention to use the target technology. However, in TAM2 and later studies,
Taylor and Todd (1995) and Vankatesh and Davis (1996, 2000) excluded attitude,
claiming it has only a partially mediating effect on behavioral intention when
considering the effects of perceived usefulness on behavioral intention.
In contrast, Yanga and Yoo (2004) claimed, from the perspective of social
psychology, that attitude deserves more attention. They stated that attitude has two
components: affective attitude and cognitive attitude. Affective attitude can be related
to whether a person likes or dislikes the object, but cognitive attitude refers to that
person’s specific beliefs about that particular object. In their study they found that
cognitive attitude mediated the effects of technology usage, but the affective
component did not mediate the influence of technology usage. They suggested that
attitude should be linked in a cognitive understanding of information technology usage
though attitude can be changed immediately. Wu and Wang (2005) pointed out that

82
attitude toward usage directly predicts intention, which also predicts system usage.
Similarly, Brown et al., (2002) stated that in mandatory environments, attitude should
not be excluded: as TAM can not explain actual phenomenon where usage is not
voluntary, they concluded that attitude is critical for technology acceptance. Most
specifically, Hu et al. (2005) stated that attitude is an important factor for indicating a
police officer’s intention to use information technology since police officers have high
levels of autonomy and discretionary power while they perform their job. Thus, I
hypothesized:
H 1: A police officer’s Attitude towards the POLNET system has a positive effect
on Intention to Use this system.
Perceived Ease of Use
Davis (1989), the creator of TAM, defined the variable, Ease of Use, as “the
degree to which an individual believes that using a particular system is free of effort”
(p.320). This easiness includes mental and physical effort, especially in the learning
phase (Yanga & Yoo, 2004). In this study, this variable can be defined as police officers’
perceptions that their usage of the POLNET system is effort-free. Consistent with TAM
and later TAM2, perceived ease of use has an effect on both intention to use and
perceived usefulness, though some studies found that perceived ease of use has no
influence on intention to use, since they omitted the attitude factor in their models
(Davis, 1989; Vankatesh & Davis, 2000).
However, some studies did find that perceived ease of use has significant effect
on intention to use through attitude (Lin et al., 2004). In this study, it is assumed that

83
police officers using the POLNET system consider that the POLNET system is useful
when they perceive it is easy to use and their attitudes are affected if they perceive the
POLNET system is effortless. Similarly, I hypothesized:
H 2: Perceived Ease of Use has a positive effect on Attitude of police officers
using the POLNET system.
H 3: Perceived Ease of Use has a positive effect on perceived Usefulness of
police officers using the POLNET system.
Perceived Usefulness
Davis (1989) defined perceived usefulness as “a belief that using a new system
increases the performance” (p.320). It is related to effectiveness on the job, to more
productivity at work, such as consuming less time or money, and to relative motivation
for usage of that particular technology (Yanga & Yoo, 2004). In this study, perceived
usefulness refers to the concept that police officers perceive POLNET as useful.
Usefulness has been tested relative to the system’s ability to increase performance,
productivity, and effectiveness. Many empirical studies have found that perceived
usefulness is an important determinant of intention to use and also of attitude (Colvin &
Goh, 2005; Hong, Thong, & Tam, 2006; Hu et al., 2005; Lee, Kang, & Kim, 2007;
Premkumar & Bhattacherjee, in press; Srite, Thatcher, & Yaprak, 2005; Vankatesh &
Davis, 2000). For this reason, this variable was added into this study, so I
hypothesized:
H 4: Perceived Usefulness has a positive effect on Attitude of police officers using
the POLNET system.

84
Subjective Norm
In many studies, the Subjective Norm has been found to be an important factor
for intention to use information technology (Chau & Hu, 2002; Hu et al, 2005; Huang &
Chuang, 2007; Lee et al., in press; Yi et al. 2006). It refers to individuals’ perceptions
affected by important others’ opinions about information technology adoption. Lee et al.
(in press) categorize the subjective norm in two parts: peer pressure and effects of
supervisors. When considering the organizational culture and subculture of police
officers working in a hierarchical environment, social norms and interpersonal
communications between police officers and with their supervisors have significant
effects on intention behavior. In addition, as a sub-cultural value, the police officers’
commitment and attachments to their jobs and peers also show the influence of
opinions of significant others on police officers. Unlike in a business setting where
competition between workers can be observed, police officers bond to their agency and
peers easily because of the nonprofit nature of policing (Hu et al., 2005).
Moreover, in terms of the national culture, people in Turkey are collectivist in
their behaviors and there is a notable power distance between supervisors and
employees in work settings. This indicates that people in Turkey are affected by the
opinions of significant others (Srite et al., 2005). In addition to these factors, the
subjective norm has considerable background depicted on TPB and DOI (Ajzen, 1991;
Goodhue and Thompson, 1995). Yi et al. (2006) asserted that observed behaviors from
social groups are an effective instructional tool for people learning technological issues.
Furthermore, users may perceive the particular technology to be more useful if their

85
supervisors or peers say so. Thus, subjective norm is included in this model as a
determinant on intention to use and perceived usefulness, so the hypothesis is:
H 5: Subjective Norm has a positive effect on Intention to Use the POLNET
system.
Prestige
Prestige can be attributed as individuals’ high standing among others in the
society. Gaining a positive image and increasing prestige in a social group are important
factors for some people who value success, assertiveness, challenge, and competition
(Srite & Karahanna, 2006; Yi et al., 2006). McCoy (2002) pointed out that for people in
male-dominated cultures, such as in Turkey, success and status are essential and
venerated concepts in social groups. In addition, police officers who enjoy a high level
of autonomy and discretionary powers dignify the public image and gain prestige within
the organization and from society. An authoritative image and prestige help officers to
enforce the law more easily. Moreover, prestige is also related to the others and their
opinions in the work environment where the system is used. Supervisors’ and peers’
opinions can be affected by the users’ prestige after using the system in terms of
increasing performance for supervisors or competition among peers.
Especially in masculine cultures, colleagues may or may not encourage the police
officer to use the system if they perceive that use of system increases the prestige of
that particular police officer. It is assumed that if police officers use the POLNET
system, they will gain prestige, so they will find POLNET more useful. In addition, the

86
prestige obtained by police officers affects important others’ opinions in the work
environment. Thus, I hypothesized:
H 6: Prestige has a positive effect on perceived Usefulness of police officers
using the POLNET system.
H 7: Prestige has a positive effect on the Subjective Norm of police officers using
the POLNET system.
Behavioral Control
Behavioral Control refers to a belief about an individual’s control over technology
in terms of resources and opportunities (Ajzen, 1991; Yi et al, 2006). It includes
accessibility of skills, controls, resources, and necessary allocations (Huang & Chuang,
2007). Recent studies indicate that external and internal behavioral control has a
positive effect on perceived ease of use (Venkatesh & Davis, 2000). This variable has
similarities with the concept of self-efficacy (Horst et al., in press). The police officers’
ability to control their use of the POLNET system and their resources to handle it are
important determinants of their perceived ease of use of the system. Thus, I
hypothesized:
H 8: Behavioral Control has a positive effect on perceived Ease of Use of police
officers using the POLNET system.
H 9: Behavioral Control has a positive effect on Intention to Use the POLNET
system.

87
Result Demonstrability
Result Demonstrability can be attributed as the system’s capability of presenting
the results easily after system usage. Apparent and tangible results of information
technology contribute to people’s willingness to adapt more easily to using it and to
gain confidence of use (Yi et al, 2006). Positive outcomes also help those who hesitate
to take the risk of accepting new technology. In terms of risk avoidance, people who
prefer structured situations and avoid uncertainty are more likely to accept new
technology when there is a positive outcome. Police officers, being practical in nature,
should recognize the apparent and tangible results of information technology for
dealing with crime.
System capability of presenting results is also related to the perceived easiness
of the system. If the system has the capability to show tangible results, police officers
may perceive the system is easy to use when they see outcomes of their use
straightforwardly. Thus, police officers will find it useful and will be willing to use the
POLNET system when they see positive outcomes and also police officers will find it
easy to use when they see the results of their usage clearly, so I hypothesized:
H 10: Result Demonstrability has a positive effect on perceived Usefulness of
police officers using the POLNET system.
H11: Result Demonstrability has a positive effect on perceived Ease of Use of
police officers using the POLNET system.

88
Personal Innovativeness
Personal Innovativeness refers to "the willingness of an individual to try out any
new information technology" (Agarwal & Prasad, 1998, p. 206). Individual reactions to
new technological innovations differ from people to people based on their approach to
risk taking, according to DOI theory. The DOI hypothesis is that adopters can be
grouped into five categories: innovators, early adopters, early majority, late majority,
and laggards (Rogers, 1995). Thus, personal reaction to innovations is a strong
predictor of information technology usage (Lee et al., in press). Examining the personal
innovativeness of individuals enables us to learn how different users control systems.
Taylor and Todd (1995) stated that self efficacy has an effect on behavioral control, so
innovators and early adopters are more likely to take risks and control over that
particular technology.
In terms of national cultural values, for people who tend toward uncertainty
avoidance, such as the Turkish people, the degree of innovation may affect their
willingness to adopt and accept new technology. In addition, the technical skills of
adopters as defined in the five categories change, based on their reactions. For
instance, early adopters have more technical ability than late majority or laggards,
according to DOI (Yi et al, 2006). Thus, it is obvious that adopters with more technical
skills will find it easier to use the target technology than others, so it can be argued that
the degree of innovation affects the perceived ease of use. Therefore, I hypothesized:
H 12: Personal Innovativeness has a positive effect on Behavioral Control of
police officers using the POLNET system.

89
H 13: Personal Innovativeness has a positive effect on Perceived Ease of Use of
police officers using the POLNET system.
Facility
Facility refers to the perception that police officers using the POLNET system can
easily access necessary computers and resources while performing jobs on this system.
TPB posits that external factors, including availability of a system (It is rephrased as
facility in this study), influence behavioral control (Ajzen, 1991). Similarly, Venkatesh
and Davis (2000) showed system availability to be a determiner of technology
acceptance. If the users believe that enough resources and computers are available
when they need them, they are more likely to use that particular technology; otherwise,
they may try to find other solutions to handle their jobs.
Hu et al. (2005) found a somewhat significant relationship between availability
and intention to use, so this study tested the direct effect of facility of the POLNET
system on the behavioral control of the police officers. It is obvious that providing and
maintaining computers in working condition is not easy for a central government which
has many branches. In this study, I assume that if the police officers perceive that
computers are readily available when they need them, they will have more control over
the POLNET system. Thus I hypothesized:
H 14: Facility of the POLNET system has a positive effect on Behavioral Control
of the police officers using the POLNET system.
90
Voluntariness
Most of the user acceptance research on information technology has been tested
in volitional environments (see Al-Gahtani & King, 1999; Chau, 2001; Horst et al., in
press; Li et al., 2004; Lin & Wu, 2004, Premkumar & Bhattacherjeeb, in press; Saade &
Bahli, 2005; Wu & Wang, 2005). However, little focus has been given to study
voluntariness in the area of technology acceptance (Braun et al., 2002; Venkatesh &
Davis, 2000). Braun et al., (2002) defined the voluntary usage as a choice opportunity
for users in terms of performing that specific technology or not. They claimed that if the
technology use was not voluntary, then the relationships of variables offered by
traditional technology acceptance models would be different. In this context, they found
that unlike voluntary settings, perceived ease of use was the key antecedent of
intention to use technology instead of perceived usefulness. They added that users, in
order to keep working in their jobs, accept using technology as dictated by their
supervisors.
Similarly, in their model, TAM2, Venkatesh and Davis (2000) defined
voluntariness as the perception that a decision adoption is non mandatory; they found
that in mandatory settings, individuals are affected by opinions of their significant
others, but not in voluntary settings. Since the usage of POLNET is mandatory for
certain assignments, voluntariness was chosen as an important factor for subjective
norm. Thus, I hypothesized:
H 14: Voluntariness has a significant effect on Subjective Norm for police officers
using the POLNET system

91
The proposed research model with its hypotheses is depicted in Figure 9 below:
Figure 9. Research Model with hypotheses.
Participants and Sampling Plan
The sample was drawn from the police officers of the TNP who are currently
using the POLNET software system. It is critical to draw a sample that can represent
the population correctly to reduce the bias. Therefore, this study used the “Purposive
Sampling” method where the researcher is responsible for the representativeness of the

92
samples to the population based on some criteria to determine the sample frame. Later,
simple random sampling was used to select samples from this sample frame.
Purposive sampling allows researchers to use judgments to select samples
having specific features and conditions (Kerlinger, 1986). Researchers’ beliefs,
judgments, or their prior experiences about the representativeness of sample to the
population play an important role for selecting purposive sampling. In this study, the
main logic behind selecting purposive sampling is that the sample should include a
collection of respondents with an understanding of and familiarity with the POLNET
system, since its establishment, to adequately measure the effects described in the
hypotheses.
The personnel in the TNP Computer Department have worked on this project
both in the infrastructural phase and the software phase. The personnel in the TNP
Communication Department jointly participated on this work. Knowing this information
and having this experience, I chose purposive sampling because I assumed that the
police officers selected from these departments had more conceptual and broader
knowledge about the POLNET system than other TNP departments, which may directly
influence the results of this survey. In addition, it is assumed that they can give more
accurate responses than other police officers because of their cognitive understanding
of the POLNET system. Other police officers focus more on their jobs instead of on
handling the POLNET system. Just knowing a part of the system may not be sufficient
enough to answer the survey questions. This condition could have affected the validity
of this study, so I preferred to draw sample by utilizing purposive sampling techniques,

93
which can be specified as an expert sampling. I also assumed that this sample can be
referred to as a subset of this study population and generalizations about the results of
this study can be made by using this purposive sampling.
The TNP has 170,000 members consisting of almost 156,000 police non-ranked
officers and 14,000 ranked personnel; they constitute the theoretical population of this
study. However, the study population includes the 33,000 police officers who have the
authorization to use the POLNET system in all departments of the TNP. The sample
frame constituted the police officers who work under the Directorate of the Computer
Center and the Communication Department in both the TNP General Directorate located
in Ankara, Turkey, and in the other 81 city police agencies. This sample frame uses the
POLNET system regularly and actively by dealing with most parts of POLNET. The study
frame of included 2627 police officers-- 1360 police officers who work under the
Directorate of the Computer Center and 1267 police officers who work under the
Communication Department.
Among these police officers who were selected based on the purposive sampling
method, 500 police officers were chosen as a sample by using simple random sampling
where each police officer has an equal chance of being selected within this group. A
computerized random number generator to frame the units and elements was used in
this phase of sampling. Although a sample size of 200 was enough to administer a
reliable analysis in structural equation modeling (Harris & Schaubroeck, 1990), I started
with a large sample size to offset a potentially high non-response rate.

94
Instrument Development
The constructs in this study were operationalized through items validated in prior
research studies. Data were collected from participants through these previously
validated questionnaires (Appendix A) to understand the technology acceptance of
Turkish police officers using the POLNET system.
First, the instrument was comprised of items from previous relevant studies
having confirmed reliability and validity of the instruments. Excluding the demographic
questions which were asked at the end of questionnaire, all of the items were measured
by a 5 point Likert-type scale (ranging from 5 indicating strongly agree to 1 indicating
strongly disagree).
Table 1 presents the survey constructs related to each variable used in this
study.
Table 1
Survey Construct and Measurement Items
Intention to Use was measured by a three item scale developed by
Venkatesh and Davis (2000):
IUSE1 Assuming I have access to the POLNET system, I intend to use it.
IUSE2 Given that I have access to the POLNET system, I predict that I
would use it.
1
IUSE3 If I access the POLNET system, I want to use it as much as
possible

95
Perceived Usefulness was measured by three scale items developed by
Venkatesh and Davis (2000)
PU1 Using the POLNET system improves my performance in my
job.
PU2 Using the POLNET system in my job increases my
productivity.
2
PU3 Using the POLNET system enhances my effectiveness in my
job.
Perceived Ease of Use was measured by three scale items developed by
Venkatesh and Davis (2000):
PEU1 My interaction with the POLNET system is clear and
understandable.
PEU2 Interacting with the POLNET system does not require a lot of
my mental effort.
3
PEU3 I find the POLNET system to be easy to use.
Subjective Norm was measured by two scale items developed by
Venkatesh and Davis (2000):
SN1 In my work, people who influence my behavior, such as my
supervisors, think that I should use the POLNET system. 4
SN2 In my work, people who are important to me, such as my
colleagues, think that I should use the POLNET system.
5 Prestige was measured by two scale items developed by Venkatesh and

96
Davis (2000):
PRES1 Having the POLNET system is a status symbol in my work
PRES2 Using the POLNET system provides a high profile.
Result Demonstrability was measured by two scale items developed by
Venkatesh and Davis (2000):
RD1 I have no difficulty telling others about the results of using
the POLNET system.
6
RD2 The results of using the POLNET system are apparent to me.
Attitude was measured by two scale items developed by Bhattacherjee
(2000):
ATTI1 Using the POLNET in policing would be a wise idea. 7
ATTI2 I like the idea of the POLNET system in policing.
Behavioral Control was measured by three scale items developed by
Taylor and Todd (1995) and Bhattacherjee (2000):
BC1 I would be able to use the POLNET system in my work.
BC2 Using the POLNET system gives me greater control over my
work in policing.
8
BC3 I have enough resources and necessary documents.
Personal Innovativeness was measured by two scale items developed by
Yi, et al (2006): 9
PINNOV1 If I heard about a new information technology, I would look
for ways to experiment with it.
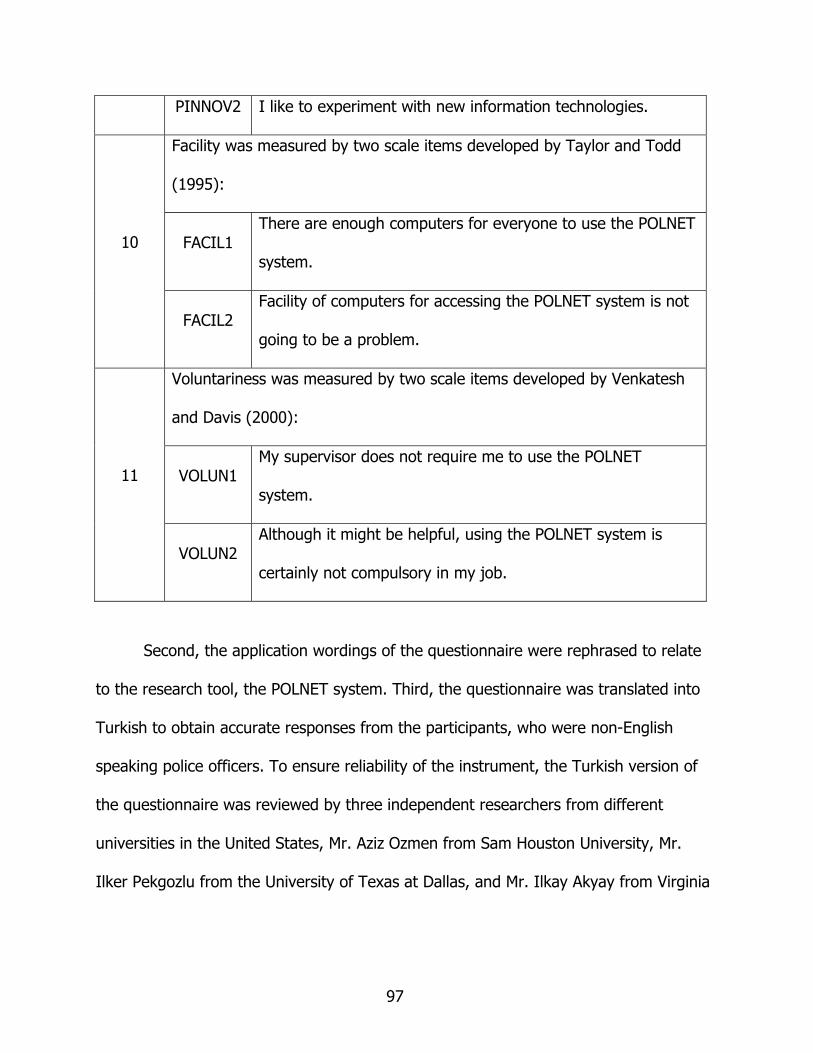
97
PINNOV2 I like to experiment with new information technologies.
Facility was measured by two scale items developed by Taylor and Todd
(1995):
FACIL1 There are enough computers for everyone to use the POLNET
system. 10
FACIL2 Facility of computers for accessing the POLNET system is not
going to be a problem.
Voluntariness was measured by two scale items developed by Venkatesh
and Davis (2000):
VOLUN1 My supervisor does not require me to use the POLNET
system. 11
VOLUN2 Although it might be helpful, using the POLNET system is
certainly not compulsory in my job.
Second, the application wordings of the questionnaire were rephrased to relate
to the research tool, the POLNET system. Third, the questionnaire was translated into
Turkish to obtain accurate responses from the participants, who were non-English
speaking police officers. To ensure reliability of the instrument, the Turkish version of
the questionnaire was reviewed by three independent researchers from different
universities in the United States, Mr. Aziz Ozmen from Sam Houston University, Mr.
Ilker Pekgozlu from the University of Texas at Dallas, and Mr. Ilkay Akyay from Virginia

98
Commonwealth University. They verified that the translation was accurate and the
meanings of items in the questionnaire were consistence in English and Turkish.
Fourth, in order to mitigate the bias problem, which is a tendency to select the
same response choice for each question, 5 negative statements were used in the
questionnaire out of 47 survey questions. Thus, the responses of five respondents, who
had entered “strongly agree or strongly disagree” for each item were dropped from the
analysis since this would cause conflicting scores because the positive and negative
items were scattered. Sixth, the instructions for the administration of the survey and
the consent form for participants were designed and added to the questionnaire.
Expert Validation
In order to ensure that the respondents in this study would properly interpret the
items, the survey questions were reviewed by Ilker Pekgozlu, who has done a master’s
thesis regarding the POLNET system in Turkey and the two POLNET users who are
currently working at the TNP Directorate of the Computer Center and are active
POLNET users. Based on their interviews, revisions and additions were made to the
instrument. I assumed that if the purposive sample is designed carefully, results similar
to the ones designed by probability sampling can be obtained. Thus, in terms of content
validity, the questionnaire was submitted to these experts in the relevant field to
determine if the items are appropriate for the subject in question.

99
Survey Administration and Data Collection
Before the data gathering process, I met the requirements set forth by the
University of North Texas Institutional Review Board (Appendix B). In addition, I also
received the approval from the TNP General Directorate to conduct research among the
police officers working in the TNP Computer and Communication Departments
(Appendix D). The survey instrument, a self administrative form, was then given.
After determining the sample, the survey was distributed to the sample with the
consent form. Participants were asked to indicate the degree to which they agreed with
a series of statements. A descriptive note, including the design of questions, how they
can respond to the questions, and how much time they may spend for this survey, was
provided prior to the survey questions to decrease any missing data and increase the
response rate. In addition, the respondents were notified and informed about the
survey and how it may contribute to the TNP. Clear survey question statements and
appropriate check boxes were attached to each set of the survey.
The questionnaire survey was delivered to the sample in two ways: a paper
survey and a web-based online survey via email. A hard copy of the questionnaire is
presented in Appendix A. The paper survey was delivered to the police officers working
in the Computer and Communication Departments under the TNP General Directorate in
Ankara, Turkey because of the geographic feasibility. For other respondents, randomly
selected police officers working in the other 81 cities, but under the auspices of the
Computer and Communication Department branches, a web-based online survey was
provided by sending the questionnaire to the samples’ email addresses. The email
100
containing the link to the online questionnaire was provided to these participants. A
website, Surveymonkey.com ™ was used for online survey administration since this
website is very user friendly and provides many options including graphical
demonstration and raw data storage in appropriate formats. In addition, follow-up and
thank you emails were also sent as a reminder to those who had not already completed
the survey.
In the data gathering process, I took into consideration ethical issues, such as
assuring the confidentiality of subjects, maintaining the privacy of respondents, and
verifying the consent form (Appendix C) provided to meet the Institutional Research
Board requirements. In the presentation of the results, I reported aggregate rather than
individual data to ensure protection of the participants. The questionnaires were filled
out by subjects anonymously, and the subjects were assured that their responses would
not be disseminated to the police administrators or other authorities in any personally
identifiable way. After the data gathering processes, data obtained from the two survey
formats was inserted into SPSS 12 ™ and LISREL 8.5 ® programs to conduct the
necessary analyses.
Data Analysis Method: Structural Equation Model
Structural Equation Modeling (SEM), a multivariate statistical technique, was
used in this study. Currently, SEM is frequently used in behavioral and social science
research areas, such as organizational behavior, management, business, and applied
psychology (MacCallum & Austin, 2000; Millsap, 2002; Streiner, 2006). SEM can test a
variety of theoretical models and provides a practical tool for researchers exploring the

101
relationships in those areas (Schumacker & Lomax, 2004). Technically, SEM combines
confirmatory factor analysis used in apparent factor structures and path analysis
generally used to explore causal relationships among sets of variables (Kelloway, 1998).
In fact, SEM expands path analysis by constructing paths between latent (theoretical)
variables that can not be directly measured, and variables that are observed (manifest)
(Streiner, 2006).
Basically, SEM has five stages (Schumacker & Lomax, 2004):
1. Model Specification:
In this phase, based on all relevant literature and theories, a theoretical model is
developed. The variables which are used in the theory are specified and necessary
relationships between these variables are created. This phase is so important that
including or omitting a variable may cause a misspecification, which may yield a
situation in which the model may not fit the data
2. Model Identification:
This stage concerns whether or not a unique set of parameter estimates can be
found in the data. It depends on the designation of fixed, free, and constrained
parameters. In order to identify the entire model, all parameters need to be
identified. There are three levels for model identification: under-identified, just-
identified, and over-identified. Just-identified and over-identified are necessary for
model identification and estimation because the number of observed variables is
more than the number of variances in the model. In addition, there are different
rules to overcome identification problems for both the measurement model and

102
structural model. In this phase, the path diagram of causal association is depicted
and constructed.
3. Model Estimation:
The parameters of the proposed model are estimated and the sample covariance
matrix type is chosen. Different types of estimation methods including ordinary list
square (OLS), generalized list square (GLS), and maximum likelihood (MD?L) can be
used depending on the nature of the data and the sample size. Specified SEM
software, i.e., LISREL, can be used for estimation. The estimated standard error of
the parameters, which determines whether the estimates statistically differ from
zero, is used in most cases.
4. Model Testing:
After the parameter estimates are obtained from the model, the next step is to
evaluate how well the data fit the proposed model. The estimates of Goodness-of-Fit
express whether the model fit the data or rejected them. The fit refers to whether
the model can reproduce the data. If the value of the fitting function is close to 0,
then it can be evaluated as a good model fit.
5. Model Modification:
If the model’s estimation of the covariance/variance matrix does not reproduce
one of the samples of data, then the model can be modified and adjusted. If
necessary, the path diagram might be reconstructed and parameters can be
changed or fixed (Schumacker & Lomax, 2004).

103
There are several reasons why SEM is used in this study. First, SEM allows
researchers to examine linear relationships between multiple observed variables and
unobserved variables simultaneously, so complex variables of theories can be analyzed
by this model (Williams, Edwards, & Vandenberg, 2003). Second, SEM is considered a
confirmatory method rather than an explanatory approach. In this study, a model based
on different theories of technology acceptance and adoption was tested and confirmed
by data obtained from a Turkish law enforcement setting. Thus, the validity of this
model was established rather than a new model being created. Third, SEM has several
advantages over traditional models testing theories (Yang & Yoo, 2004): SEM considers
measurement error during data analysis and does not require perfect measurement
error, unlike path analysis, in terms of reliability and validity of measurement
instruments (Williams, et al., 2003). Fourth, SEM has various, windows based, and user
friendly software programs including AMOS® and LISREL® which was used in this study
as well (Schumacker & Lomax, 2004).
Data Analysis Tool
LISREL®1
A program of Linear Structural Relationships (LISREL 8.5®) was used to analyze
the data. It is frequently used in research to analyze linear structural relationships and
factor analysis of models in SEM. LISREL® is a useful tool for this study because it is
robust for the sample size of this study. LISREL® has several advantages over other
techniques. LISREL® analyzes all of the covariance in the data and when estimating the 190 1 LISREL®: www.www.ssicentral.com

104
significance level and coefficient of the paths, it enables researchers to examine all of
the correlations, shared variances, and paths in the model (Bollen, 1989). Bollen (1989)
asserted that LISREL® gives more accurate and original results than other methods. It
aims to measure the structure of latent variables measured by indicators. A causal
structure between latent variables and underlying causes of observed variables is a first
assumption for LISREL®. Then, two sets of equation models are created in LISREL®: a
validating measurement model and a fitting structural model (Al-Gahtani & King, 1999).
Measurement Model
In the measurement model, hypothesized latent variables are measured by
observed variables. Factor loadings indicate the relationship between observed and
latent variables. Confirmatory factor analysis is used in this model. This model requires
selecting a number of common factors and of measured variables which are related to
those common factors. In addition, the reliability and validity of observed variables are
described by using latent variables (Schumacker & Lomax, 2004).
Structural Model
In the structural model, the causal relationships and their effects between latent
variables are described. This model identifies the directional relation among variables.
Path analysis is used in this stage. The exogenous variables, independent variables,
endogenous variables, moderators, and their causal relationships are depicted
(Schumacker & Lomax, 2004).

105
Summary
By conducting a cross sectional survey, 15 hypotheses were developed to test
the Turkish police officers’ information technology adoption. The sample was drawn
from police officers working in the TNP Computer and Communication Department in
accordance with non probability sampling design, purposive sampling. Data were
collected in two ways: on paper and online, both accompanied by the appropriate
consent form for the respondents. The dependent variable of this study is intention to
use POLNET system. Ten other independent variables were selected based on three
aspects: general technology acceptance factors, policing related factors, and national
cultural factors. To analyze the statistical results, the SEM was selected by using LISREL
8.5® program.
106
CHAPTER 4
FINDINGS and DATA ANALYSIS
Introduction
This chapter presents the findings based on the data analyses. To respond to the
research questions, this study aimed to prove 15 hypotheses. First, the primary analysis
is provided to get information about the response rate and response distribution.
Second, descriptive statistics are presented for demographic information. Third,
psychometric analysis is described to give information about reliability and validity of
this study. Fourth, the measurement model and structural model are analyzed based
on the techniques of the structural equation model.
Primary Data Analysis
The response rate and descriptive statistics were examined for the primary
analysis. A total of 500 surveys were distributed and 407 usable responses were
received. This response rate is very high (81.4%) compared to the relevant literature.
For analysis purposes, the response scale was assigned Likert-scale like numerical
values for each item response on the instruments:
• Strongly Agree = 5;
• Agree = 4;
• Neutral = 3;
• Disagree = 2;
• Strongly Disagree = 1.

107
The “neutral” category option was provided to not force the respondents to
select a choice when they were not clear. Thus, the analysis used in this study was
measured using this 5 point scale. Due to the fact that the structural equation model
tool, LISREL is sensitive to missing data, missing values were replaced by using the
‘series mean’ method in the SPSS™ (12) program. This replacement was just made for
53 cases. However, it was not necessary to transform the data related to the
demographic information. Numeric values were reversed for the negative statements
by using SPPS ™ (12) program.
Table 2
Descriptive statistics of items
N Mean Std.
Deviation Variance
Items Statistic Statistic Std. Error Statistic Statistic
PU1 407 4.33 .03 .680 .462
PU2 407 4.44 .03 .677 .458
PU3 407 4.41 .04 .726 .527
PEU1 407 4.38 .04 .813 .661
PEU2 407 4.30 .04 .849 .720
PEU3 407 4.24 .04 .797 .635
SN1 407 4.24 .04 .718 .515
SN2 407 4.25 .03 .674 .454

108
PRES1 407 3.97 .04 .845 .713
PRES2 407 3.97 .05 .959 .920
RD1 407 3.95 .05 .985 .971
RD2 407 4.17 .04 .874 .763
ATTI1 407 4.09 .04 .800 .640
ATTI2 407 4.00 .04 .824 .680
BC1 407 3.97 .04 .784 .615
BC2 407 4.41 .03 .694 .482
BC3 407 4.31 .04 .744 .553
PINNOV1 407 3.81 .05 1.000 1.001
PINNOV2 407 3.99 .05 .914 .835
FACIL1 407 3.99 .04 .901 .813
FACIL2 407 4.27 .03 .672 .452
VOLUN1 407 4.29 .03 .661 .437
VOLUN2 407 3.85 .06 1.135 1.288
PU1 407 3.88 .05 .927 .860
PU2 407 2.84 .06 1.283 1.645
PU3 407 2.66 .07 1.325 1.755

109
Descriptive Statistics of Respondents
Consistent with prior research practices, the respondents were asked to provide
demographic information, age, gender, education level, and job experience.
Table 3 indicates that the respondents are fairly young. Almost one-third of the
respondents are in the age group of 21-30; almost half of them (201) are between 31
and 40 years old. Approximately 15% the respondents are in the age group of 41-50,
but just 5% them are between 51 and 60 years old.
Table 3
Frequency Distribution of Respondents by Age (N=407)
Age
Age Group Frequency PercentValid
Percent
Cumulative
Percent
21-30 118 29.0 31.1 31.1
31-40 201 49.4 52.9 83.9
41-50 59 14.5 15.5 99.5
51-60 2 .5 .5 100.0
Total 380 93.4 100.0
Missing 27 6.6
Total 407 100.0
According Table 4, of the respondents, 79 were female police officers (19.4%)
and 299 were male police officers (73.5%). The female response rate in this survey is

110
almost four times greater than the general rate of women police officers in the TNP
(5.5%). The reason for the high response rate may stem from the fact that most of the
female personnel work in office environments such as these departments.
Table 4
Frequency Distribution of Respondents by Gender (N=407)
Gender
Frequency PercentValid
Percent
Cumulative
Percent
Men 299 73.5 79.1 79.1
Women 79 19.4 20.9 100.0
Total 378 92.9 100.0
Missing 29 7.1
Total 407 100.0
Table 5 indicates the education level of respondents, which in general is high.
The largest groups of respondents have a two-year college degree (35.9%). However,
approximately 30% have a four-year Police Academy or university degree or higher.
The remaining one-fourth has a high school degree, in addition to police school; high
school is a requirement for Turkish police applicants.

111
Table 5
Frequency Distribution of Respondents by Education Level (N=407)
Education Level
Frequency Percent Valid
Percent
Cumulative
Percent
High School 106 26.0 28.3 28.3
2 year College 146 35.9 38.9 67.2
University 94 23.1 25.1 92.3
Master 25 6.1 6.7 98.9
PhD 4 1.0 1.1 100.0
Total 375 92.1 100.0
Missing 32 7.9
Total 407 100.0
Table 6 shows the job experience of respondents. Among these respondents, the
largest group (32.9%) had between 11 and 15 years of on the job experience; these
results correspond with the age groups of respondents. Of the others, the smallest
group (3.7%) to respond was the least experienced officers (0-2 years).

112
Table 6
Frequency Distribution of Respondents by Job experience (N=407)
Job Experience
Frequency Percent Valid
Percent
Cumulative
Percent
0-2 year 15 3.7 4.0 4.0
3-6 year 70 17.2 18.5 22.4
7-10 year 95 23.3 25.1 47.5
11-15 year 134 32.9 35.4 82.8
More than 15
years 65 16.0 17.2 100.0
Total 379 93.1 100.0
Missing 28 6.9
Total 407 100.0
Psychometric Properties
After gathering the data, the reliability and the construct validity including the
convergent and discriminant validity were examined, although the purpose of this study
was theory testing and pre-validated scales were employed (Premkumar &
Bhattacherjee, in press). To examine whether the variables were measured with correct
items, convergent and discriminant validities were checked through exploratory and
confirmatory factor analysis, which is discussed in the measurement model section.

113
Reliability
Reliability is the degree to which a measurement instrument gives consistent,
steady, and uniform results even after repeating the measurements of the same item
each time. For the reliability testing in this study, Cronbach’s alpha coefficient was
chosen as it is a commonly accepted measurement among researchers. In the
composite reliability test, also called internal consistency reliability, all items were above
the .70 reliability threshold; the negative statements in the questionnaire (6, 12, 25, 30)
were recoded by reversing their scores in the SPSS (11) ™ program. The Cronbach's
alpha values are shown in the Table 7 below:
Table 7
Reliability Analysis
Constructs Cronbach’s α Number of Cases
Intention to Use 0.84 407
Perceived Usefulness 0.87 407
Perceived Ease of Use 0.79 407
Subjective Norm 0.84 407
Prestige 0.78 407
Results Demonstrability 0.78 407
Attitude 0.88 407
Behavioral Control 0.82 407
Personal Innovativeness 0.73 407

114
Facility 0.82 407
Voluntariness 0.84 407
All items 0.89 407
Standardized Items 0.91 407
Validity
Validity, basically, can be determined in accordance with whether the instrument
measures what it is intended to measure. Mentzer and Flint (1997) asserted that
validity is a measurement that ensures the researchers can share their findings with
confidence. Many types of validity measurements have been used in the research,
including external related, content related, construct related, and criterion related
validities. In this study, due to the response rate (81.4%) and sample size (407), it is
assumed that there is enough evidence to believe this study has external validity.
Content validity should be suitable because the various parts of the questionnaire were
all adapted from the literature and have been reviewed carefully by the researcher.
As for the construct validity, it is related to whether a scale measures what it is
meant to measure (Garver & Mentzer, 1999). There are several sub-forms of construct
validity, some of which are discriminant and convergent validity. In the explanatory
factor analysis, the construct validity was assessed by using principal components
analysis with varimax rotation in this study. Convergent validity addresses the measures
of constructs that are theoretically related. The latent variable should correlate the
items which are assigned for that particular variable (Garver & Mentzer, 1999).

115
Discriminant validity addresses the measures of constructs that are not theoretically
related. The variables should not correlate the items which are not assigned for that
particular variable. The requirements for discriminant and convergent validity are
satisfied when measurement items load high (0.70 or more) on their corresponding
constructs and low (0.40 or less) on other constructs (Straub, 1989). Table 8 indicates
the factor loadings of this study’s items. Although some factors, PEU3 and RD1, RD2,
BC2, BC3, have lower factor loadings than other items and fall slightly below the 0.70
threshold, they were kept in the measurement due to the content validity.
Table 8
Factor Loadings
Component
ITEMS 1 2 3 4 5 6 7 8 9 10
PU1 0.7687
PU2 0.7877
PU3 0.8046
PEU1 0.7343
PEU2 0.854
PEU3 0.6303
SN1 0.8369
SN2 0.7922
PRES1 0.7724
PRES2 0.7044
RD1 0.5769
RD2 0.6737
ATTI1 0.7665
ATTI2 0.714
BC1 0.7675
BC2 0.694
BC3 0.6365

116
PINNOV1 0.8516
PINNOV2 0.8962
FACIL1 0.851
FACIL2 0.8081
VOLUN1 0.9333
VOLUN2 0.8710
Extraction Method: Principal Component Analysis.
Rotation Method: Varimax with Kaiser Normalization.
Data Analysis
The data analysis was handled in two separate stages by using the measurement
model and the structural model, as recommended by Gerbing and Anderson (1988):
Measurement Model
The measurement model was used to estimate the factor loadings between
manifest and latent variables. The main idea of measurement model is to describe how
well the manifest variables explain the latent variables (Garver & Mentzer, 1999), that
is, in order to evaluate a latent construct, a measurement model needs to be performed
to make the construct observable by using indicators. In this stage, confirmatory factor
analysis (CFA) was employed to supplement the construct validity and confirm the
relationships between the manifest variables and their corresponding factors. CFA uses
maximum likelihood estimation (MLE) as a primary form of estimation (Netemeyer,
Bearden, & Sharma, 2003). To be theoretically valid, each manifest variable should be
represented by only one latent variable (Garver & Mentzer, 1999).

117
Convergent validity can be verified by measuring whether the indicators load
together on their corresponding latent variable. Garver and Mentzer (1999) assert that
convergent validity exists when the loadings are significant, in addition to good fit
results after CFA. These factor loadings should exceed the 0.7 threshold level to ensure
each measurement explains 50% or more of the corresponding latent variable variance
(Chin, 1998).
In this study, an 11-factors model was used to describe the relationship between
the factors and 26 indicators while performing CFA. Based on the theoretical
foundation, the factors were classified into the following 11 groups: Intention to Use,
Perceived Usefulness, Perceived Ease of Use, Subjective Norm, Attitude, Prestige,
Results Demonstrability, Behavioral Control, Personal Innovation, Facility, and
Voluntariness. Each indicator was assigned to its corresponding factors, for example,
with Intention to Use, the indicators were IUSE1, IUSE2, and IUSE3.
All factor loadings, latent variables, and error variances of manifest variables
were significant (p <0.01, two tailed test). With respect to the factor loadings, it
appears that most of the manifest variables loaded well on related latent variables
(p<0.001, λ>0.70) evidencing the unidimensionality of each construct, except for the
loadings PEU2 -PEU3 to Perceived Usefulness (λ =68, 69), PRES2 to Prestige (λ =68),
and BC1 to Behavioral Control (λ =69). However, since these items were validated
before, the scores were found close to the threshold, and the reliabilities of these items
were high, they were retained, so their loadings were considered acceptable (Yi et al,
2006). In terms of factor loadings, for every standard unit increase in the Intention to
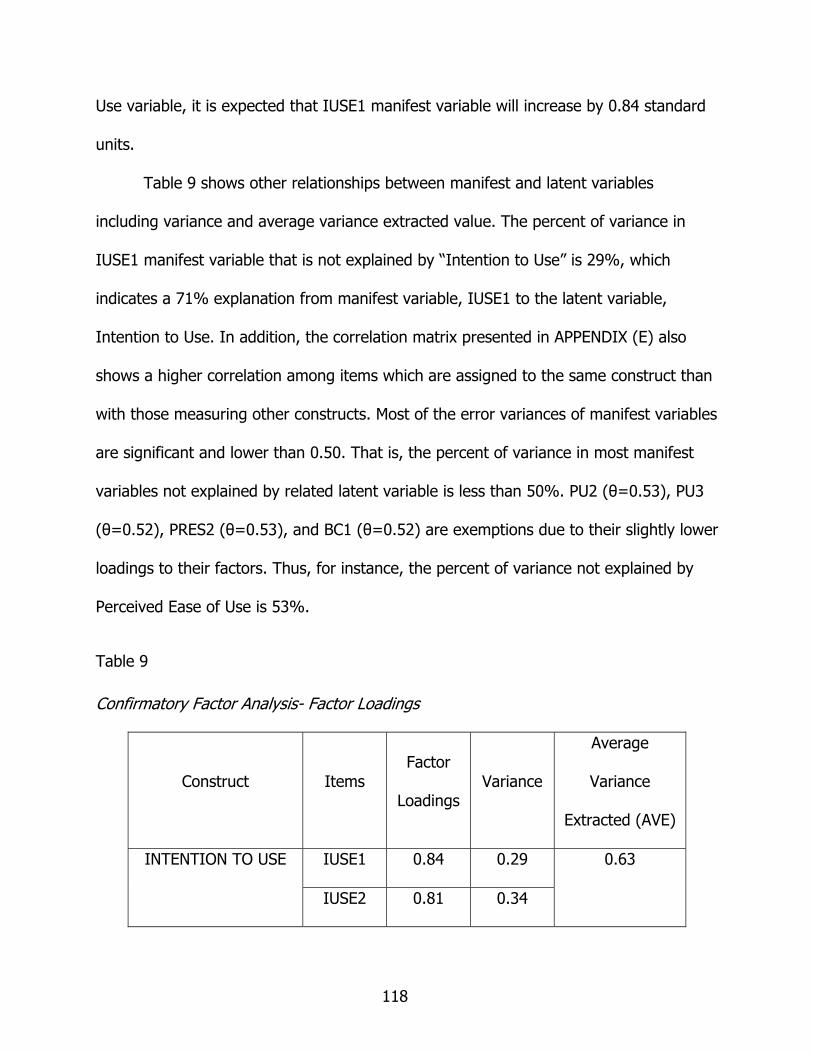
118
Use variable, it is expected that IUSE1 manifest variable will increase by 0.84 standard
units.
Table 9 shows other relationships between manifest and latent variables
including variance and average variance extracted value. The percent of variance in
IUSE1 manifest variable that is not explained by “Intention to Use” is 29%, which
indicates a 71% explanation from manifest variable, IUSE1 to the latent variable,
Intention to Use. In addition, the correlation matrix presented in APPENDIX (E) also
shows a higher correlation among items which are assigned to the same construct than
with those measuring other constructs. Most of the error variances of manifest variables
are significant and lower than 0.50. That is, the percent of variance in most manifest
variables not explained by related latent variable is less than 50%. PU2 (θ=0.53), PU3
(θ=0.52), PRES2 (θ=0.53), and BC1 (θ=0.52) are exemptions due to their slightly lower
loadings to their factors. Thus, for instance, the percent of variance not explained by
Perceived Ease of Use is 53%.
Table 9
Confirmatory Factor Analysis- Factor Loadings
Construct Items Factor
Loadings Variance
Average
Variance
Extracted (AVE)
IUSE1 0.84 0.29 INTENTION TO USE
IUSE2 0.81 0.34
0.63

119
IUSE3 0.75 0.43
PU1 0.85 0.28
PU2 0.80 0.37 PERCEIVED
USEFULNESS PU3 0.87 0.25
0.70
PEU1 0.75 0.44
PEU2 0.68 0.53 PERCEIVED EASE OF
USE PEU3 0.69 0.52
0.50
SN1 0.80 0.36 SUBJECTIVE NORM
SN2 0.88 0.23 0.70
PRES1 0.74 0.48 PRESTIGE
PRES2 0.68 0.53 0.50
RD1 0.86 0.26 RESULTS
DEMOSTRABILITY RD2 0.89 0.21 0.76
ATTI1 0.84 0.30 ATTITUDE
ATTI2 0.86 0.25 0.72
BC1 0.69 0.52
BC2 0.73 0.46 BEHAVIORAL
CONTROL BC3 0.71 0.50
0.50
PINNOV1 0.91 0.17 PERSONAL
INNOVATIVENESS PINNOV2 0.70 0.50 0.65
FACILITY FACIL1 0.72 0.49 0.57

120
FACIL2 0.80 0.36
VOLUN1 0.71 0.50 VOLUNTARINESS
VOLUN2 1.03 -0.06 0.78
“Average Variance Extracted (AVE) assesses the amount of variance captured by
a set of items in a scale relative to measurement error” (Netemeyer, et al., 2003, p:
153). The threshold of 0.5 is used for convergent validity where the AVE from each
construct is greater than this recommended threshold (Fornell & Larcker, 1981). Table
10 shows that the AVE’ s of all the constructs exceeded the 0.5 threshold, which
indicates that the measurement model exhibited satisfactory convergent validity.

121
Figure 10. Diagram of Confirmatory Factor Analysis

122
A measurement model should also be assessed with the criteria of goodness-of-
fit values. The CFA conducted in this study showed good model fit. First, for a good
model fit, chi-square (χ²)/degrees of freedom (df) should be less than 3. The χ² of
392.17 with 239 df showed an χ² to df ratio of less than the recommended 1:3 ratio.
Additionally, the value of Goodness of Fit (GFI) is 0.93 with 0.04 Root Mean Square
Error of Approximation (RMSEA), evidencing the good fit of the model to data. The
model fit index is indicated below in Table 10:
Table 10
Model Fit Index
Fit index Recommended criteria Results in this
study
Chi Square (χ²)/Degrees of
Freedom 1:3 1.640
Goodness of Fit (GFI) >0.90 0.93
Adjusted GFI >0.80 0.90
Non-Normed Fit Index (NNFI) >0.90 0.96
Comparative Fit Index (CFI) >0.90 0.97
Root Mean Square Residual
(RMR) < 0.10 0.029
Root Mean Square Error of
Approximation (RMSEA) <0.06 0.04
P < 0.001

123
Thus, based on the observed values gathered in this study, it can be said that
the model fit the data well.
The results of discriminate validity were verified by a guideline suggested by
Segars (1997). All the modifications indices were below the critical level of 5.0. This
means that adding a path from the manifest variables to the latent variable does not
cause any significant change in the χ² statistic. If the constructs are correlated more
strongly with their indicators than with any other construct, the discriminant validity of
research study is acceptable (Fornell, Tellis, & Zinkhan, 1982).
Soundness of discriminate validity can also be assessed by seeing whether the χ²
value of the unconstrained model is lower than the χ² value of constrained model in
which the variance between the two constructs is constrained to 1.0 (Netemeyer, et al.,
2003). Table 11 indicates the χ² differences between the dependent variable “Intention
to Use” and other constructs and thus demonstrates that discriminant validity exists.
Table11
Comparison of Chi-squared values
Construct Constrained Unconstrained
Perceived Usefulness 583.06
Perceived Ease of Use 470.92
Subjective Norm 491.04
Prestige 570.05
Results Demonstrability 470.23
392.17

124
Attitude 596.74
Behavioral Control 478.92
Personal
Innovativeness 483.14
Facility 584.04
Intention
to Use
Voluntariness 738.02
Structural Model
In the structural model stage, model fit, hypotheses testing and the paths
between latent variables were analyzed. The structural model was used to estimate the
relationships between the hypothesized latent variables. This model also gives path
coefficients and the variance proportions in the endogenous variables explained by the
exogenous variables.
Exogenous variables are the traditional independent variables. Exogenous
variables are those for which the model makes no attempt to explain. In other words,
they are not supposed to be placed between another independent variable and latent
variable in SEM. This means that they are not supposed be correlated with other
exogenous variables. However, endogenous variables are called mediating variables in
SEM language and the model attempts to explain them. They are placed between two
exogenous variables or between one exogenous and one dependent variable.
Exogenous variables are independent variables in all equations, but endogenous

125
variables are dependent variables in at least one equation, though they may be
independent variables in other equations in the system (Schumaker & Lomax, 2004).
In this study, the exogenous variables are Prestige, Results Demonstrability,
Personal Innovation, Facility, and Voluntariness. The endogenous variables are
Behavioral Control, Perceived Usefulness, Perceived Ease of Use, Subjective Norm,
Attitude, and Intention to Use. The research model of this study postulates that the
endogenous variables indicate the internal process of technology acceptance, but the
exogenous variables are external factors that are assumed to affect the internal rational
process of technology acceptance.
In the structural model, the first step is to examine the model fit results of
hypothesized research model. Like the measurement model, the structural model
presented here shows an adequate fit with the data when compared with the suggested
fit criteria as discussed in the measurement model. In this model, as with the RMSEA,
(0.051), and the GFI, (0.91), all results are above the recommended threshold, which
indicates the good fit of the research model. Table 12 indicates the recommended
criteria and results in this study.
Table 12
Goodness of Fit in Structural Model
Fit index Recommended
criteria Results in this study
Chi Square (χ²)/Degrees
of Freedom 1:3 2.09
Goodness of Fit (GFI) > 0.90 0.91

126
Adjusted Goodness of Fit
(AGFI) > 0.80 0.88
Non-Normed Fit Index
(NNFI) > 0.90 0.94
Comparative Fit Index
(CFI) > 0.90 0.95
Root Mean Square
Residual (RMR) < 0.10 0.042
Root Mean Square Error
of Approximation
(RMSEA)
< 0.06 0.051
P < 0.001
The second step in this structural model is to examine the path of the
coefficients between the latent variables in addition to variance explained. The results
shown in Table 13 indicate that all factor path coefficients between exogenous variables
and endogenous variables are significant except for the paths between Personal
Innovativeness and Perceived Ease of Use (p=0.0, γ=- 0.06, T-value=1.19) and
Personal Innovativeness and Behavioral Control (p =0.0, γ=0.03, T-value= 0.39).
However, all other coefficients’ significances indicate that the data support all proposed
hypotheses, except for the two mentioned above.

127
Table 13
Path Coefficients
Structural Path Standardized
Coefficients T- Value
Hypothes
is
Direction
Hypothesis Hypothesis
Testing
Attitude – Intention
to Use 0.67*** 9.90 + H1 Supported
Perceived Ease of
Use - Attitude 0.41*** 6.37 + H2 Supported
Perceived Ease of
Use – Perceived
Usefulness
0.54* 3.01 + H3 Supported
Perceived Usefulness
- Attitude 0.49*** 7.76 + H4 Supported
Subjective Norm –
Intention to Use 0.15* 3.13 + H5 Supported
Prestige – Perceived
Usefulness 0.79*** 6.39 + H6 Supported
Prestige – Subjective
Norm 0.65*** 10.03 + H7 Supported
Behavioral Control-
Perceived Ease of
Use
0.34*** 5.17 + H8 Supported
Behavioral Control –
Intention to Use 0.16* 2.76 + H9 Supported
Results
Demonstrability –
Perceived Usefulness
-0.61** -3.32 - H10 Supported

128
Results
Demonstrability –
Perceived Ease of
Use
0.67*** 10.03 + H11 Supported
Personal
Innovativeness-
Behavioral Control
0.03 0.39 + H12 Rejected
Personal
Innovativeness-
Perceived Ease of
Use
0.06 1.19 + H13 Rejected
Facility- Behavioral
Control 0.85*** 8.19 + H14 Supported
Voluntariness –
Subjective Norm -0,24*** -5.31 - H15 Supported
* P<0.05, ** P<0.01,*** P<0.001
As Figure 11 indicates, 13 of the 15 causal paths designed in accordance with
the research model in this study were supported with the statistically significant value
(P-value), of 0.01 or less than 0.001.

129
Figure 11. Model Testing Results
The explanatory power of the model was also evaluated by squared multiple
correlations for structural equations. This process enables the researcher to assess the
percent of variance in the latent dependent variable explained by the latent
independent variable. In this context, the research model could explain 75% variance

130
for the model’s dependent variable, Intention to Use. Similarly, the research model was
able to account for 67% of the variances for Attitude, 87% of the variance for the
Perceived Ease of Use, 73% of the variance for the Perceived Usefulness, 73% of the
variance for the behavioral control, and 55% of the variance for the subjective norm. As
an gauge of the explanatory power, all these variances indicate an acceptable
explanation of information technology adoption for police officers using the POLNET
system.
Evaluation of Hypotheses Testing
1. H 1: The police officer’s attitude toward the POLNET system has a positive effect
on intention to use this system.
As predicted, attitude has significant effect on behavioral intention (γ=0.67,
p<0.001). For every one standard unit increase in the latent endogenous variable
Attitude, it is expected that the latent endogenous variable, Intention to Use, to
increase by 0.67 standard points (γ= 0.67, P<0.001). This suggests that attitude is a
significant information technology driver for the officer’s intention to use the POLNET
system. Consistent with Yanga and Yoo (2004), this study found that attitude is strong
predictor of behavioral intention to use information technology. Similarly, as Brown et
al., (2002) stated, in a mandatory use environment, the factor of attitude is significant
on intention, so the intention toward using POLNET system can be predicted by
individual police officers’ attitudes.

131
2. H 2: Perceived ease of use has a positive effect on attitude of police officers
using the POLNET system.
Police officers’ perceptions of easiness of the system predict significantly their
attitudes and intentions. For every one standard unit increase in the latent endogenous
variable, Perceived Ease of Use, it is expected that the latent endogenous variable
Attitude will increase by 0.41 standard points (γ= 0.41, P<0.001). Although a few
studies have found insignificant results for perceived ease use to intention toward
attitude (Yi et al, 2006; Venkatesh & Davis, 2000), this study found that easiness of the
system is a strong predictor for attitude toward intention to use information technology,
which is consistent with other studies that found perceived ease of use to have a
significant effect on intention to use toward attitude (Lin et al., 2004).
The studies conducted in policing, such as that of Hu, et al. (2005) found that
perceived ease of use has significant effect on attitude although they found insignificant
results from attitude to intention. Similarly, Colvin and Goh (2005) determined that ease
of use was a predictor of technology usage of police officers. Tosun (2006) asserted
that perceived ease of use is strongly correlated with the system usage in his study
conducted in Istanbul, Turkey. In terms of studies conducted in different cultures, Mao
et al, (2005) had significant results between perceived ease of and behavioral intention
for the Turkish sample of their study. Thus, this study’s finding is consistent with the
previous, relevant research.

132
3. H 3: Perceived ease of use has a positive effect on perceived usefulness of police
officers using the POLNET system.
This study found that police officers are more likely to consider the POLNET
system to be useful because it is easy to use. For every one standard unit increase in
the Perceived Ease of Use, it is estimated that Perceived Usefulness will increase 0.54
standard unit (γ= 0.54, P<0.05). This is similar to the studies conducted in policing
settings that found that perceived ease of use significantly affected perceived
usefulness (Colvin & Goh, 2005;Hu et al, 2005; Tosun, 2006) and parallel to other
studies conducted in different environments. Mao et al (2005) also found significant
results between perceived ease of use and perceived usefulness. Culturally, this
situation can be explained by the Turkish cultural factor, risk avoidance. Complex
systems are not preferable for police officers although they have a cognitive
understanding of the system (addressed in the Hypothesis 8).
4. H 4: Perceived usefulness has a positive effect on the attitude of police officers
using the POLNET system.
Consistent with the prior research, Perceived Usefulness has a strongly
significant effect on Attitude and Intention to Use the information technology, which
implies that the Turkish police officers using the POLNET system are more likely use the
system if they perceive that the system is useful. Thus, for every standard unit increase
in the Perceived Usefulness, it is expected that the latent endogenous variable, Attitude
will increase by 0.49 standard units (γ=0.49, p<0.001). Particularly because of its

133
mediating factors, results demonstrability and prestige, in addition to perceived ease of
use, perceived usefulness is a predictive factor on attitude and an officer’s intention to
use the POLNET system. As discussed earlier, perceived usefulness has been found as a
very strong factor for system attitude, intention, or usage (Colvin & Goh, 2005; Hong,
Thong, & Tam, 2006; Hu et al., 2005; Lee, Kang, & Kim, 2007; Premkumar &
Bhattacherjee, in press; Srite, Thatcher, & Yaprak, 2005; Vankatesh & Davis, 2000).
Similarly, studies conducted in different cultural environments also found that perceived
usefulness has a positive effect on intention to use the information technology
(Koeszegi, Vetschera, & Kersen, 2004; Malhotra & Galletta, 1999; Mao, Strite, Thacher,
& Yaprak, 2005; McCoy, 2002; Straub, Keil, & Brenner, 1997; Veiga et al., 2001).
5. H 5: Subjective norm has positive effect on intention to use the POLNET system.
Subjective norm has relatively significant effect on Intention to Use the
information technology. This situation can be attributed to mandatory system usage,
but voluntariness shows a negative direct effect on subjective norm to intention to use
(γ= -.24, p<0.001), contrary to the predicted outcome. With respect to the total
amount of significance, it can be evaluated that police officers using the POLNET
system are likely to listen to those whose opinions are valued by the police officers.
With every standard unit increase in the subjective norm, it is expected that the latent
endogenous variable, Intention to Use will increase by 0.49 standard units (γ=.49,
p<0.001). However, it appears that the subjective norm is not the only predictor of
intention to use the system. This factor may be mediated by perceived usefulness, as

134
tested by previous studies. Hu, et al, (2005) found similar results in their study of the
COPLINK.
6. H 6: Prestige has a positive effect on perceived usefulness of police officers using
the POLNET system.
Prestige was found to be a very strong predictor for Perceived Usefulness. This
hypothesis was supported by a significant coefficient value (γ=0.79, p<0.001). Every
standard unit increase in the latent exogenous variable, prestige, is expected to
increase the latent endogenous variable, perceived usefulness, by 0.49 standard units.
Police officers using the POLNET system are more likely to find useful the information
technology if they believe that technology helps to increase their prestige in their work
environment. This behavior can be understandable because in the police environment
where every individual’s social position is determined by rank, an officer may seek other
factors to gain prestige, so using information technology may serve under these
circumstances. Similarly, Yi et al, (2006) found significant effects on image to
perceived usefulness.
7. H 7: Prestige has positive effect on the subjective norm of police officers using
the POLNET system.
As with the previous hypothesis, the positive strong effect from Prestige to the
Subjective Norm was found in this study (γ=0.65, p<0.001). Every standard unit
increase in the latent exogenous variable, prestige, is expected to increase by 0.49

135
standard units the latent endogenous variable, subjective norm. Police officers are more
likely to be affected by their important others if they believe they will gain prestige as a
result of that recommendation. In their study, Yi et al, (2006) found the opposite
relationship between image and the subjective norm; They found significant results
from subjective norm to perceived usefulness via image.
8. H 8: Behavioral control has a positive effect on perceived ease of use of police
officers using the POLNET system.
Consistent with the previous research (Venkatesh & Davis, 2000; Huang &
Chuang, 2007), behavioral intention was found as a significant predictor directly to
perceived ease of use and indirectly to attitude. Predictably, police officers found it easy
to use the information technology if they have enough resources and control over the
system. For every standard unit increase in the behavioral control, it is expected that
the latent endogenous variable, perceived usefulness will increase by 0.34 standard
units. (γ=0.34, p<0.001).
9. H 9: Behavioral control has positive effect on intention to use the POLNET
system.
Although this hypothesis was supported with a significant result (γ=0.16,
p<0.05), it is not as powerful a predictor as attitude via perceived usefulness and
perceived ease of use in terms of intention to use the information technology. With
every standard unit increase in the behavioral control, it is expected that the latent

136
endogenous variable, intention to use the system to increase by 0.16 standard units.
This condition may stem from the particular work conditions of the sample respondents
because they more likely work in offices with enough computers and resources. The
researcher assumes that the result may be different if the study were conducted in
other departments in the TNP. The significant degree effects of facility prove this
statement because police officers perceive they have control over the system if they
have enough facility. Yi et al, (2006) found similar results in their study conducted
among physicians.
10. H 10: Result demonstrability has a positive effect on perceived usefulness of
police officers using the POLNET system.
This hypothesis was also found significant, yet the direction of this hypothesis is
negative (γ= - 0.61, p<0.01). This may stem from another variable effect, such as
perceived ease of use, because this variable appears to be an important determinant
from the path through perceived ease of use. Police officers find the information
technologies useful if they see explainable results and perceive the system to be effort
free.
11. H11: Result demonstrability has a positive effect on perceived ease of use of
police officers using the POLNET system.
This hypothesis was supported with the coefficient level (γ=0.67, p<0.001)
evidencing the significant effect from result demonstrability to perceived ease of use.

137
For every standard unit increase in the results demonstrability, it is expected that the
latent endogenous variable, perceived ease of use will increase by 0.67 standard units.
This is predictable because police officers find the system easy to use if they find
tangible and explainable results. Particularly, in cultures with relatively high risk
avoidance levels like Turkey, results play an important role. In their study Yi et al, had
similar findings as well.
12. H 12: Personal Innovativeness has a positive effect on Behavioral Control of
police officers using the POLNET system.
This hypothesis was not supported. (γ=0.03) The reason for rejection may stem
from two possible explanations. First, police officers’ self esteem may generally be very
high due to the fact that they are very technical people, have strong affiliations with
computers, or have been worked with the POLNET system for several years. Thus,
innovativeness does not play a significant role over control beliefs for behavioral
intention. Second, cultures that have high risk avoidance, like Turkey, may take less of
an innovative approach to new technology. They may hesitate to use these new
technologies due to avoidance from possible risks. In either case, this study found that
personal innovativeness has no significant effect over behavioral control.
13. H 13: Personal Innovativeness has a positive effect on Perceived Ease of Use of
police officers using the POLNET system.

138
This hypothesis was also rejected, contrary to theoretical predictions. Personal
innovativeness has no significant effect over perceived ease of use (γ=0.03). As
discussed above, other factors, such as a technological affiliation or a cultural feature,
such as risk avoidance, may influence this variable to be insignificant.
14. H 14: The facility of the POLNET system has a positive effect on behavioral
control over police officers using the POLNET system.
Facility is found to be the most significant result in this study. With every
standard unit increase in the latent exogenous variable, facility, it is expected that the
latent endogenous variable, behavioral control will increase by 0.85 standard units
(γ=0.85, p<0.001). Police officers feel control over the system if they have enough
facility for the information technology system. This finding highlights the importance of
the infrastructures and technical capabilities of system. In the literature, although
Venkatesh and Davis (2000) asserted that availability (rephrased as facility in this
study) is a mediating determinant for intention to use the system, Hu et al (2005) found
insufficient results from availability to intention to accept the information technology.
15. H 15: Voluntariness has a positive effect on subjective norm for police officers
using the POLNET system
It was predicted that if the technology usage were not voluntary, then the
relationships of variables offered by traditional technology acceptance models would be
different. Moreover, individuals are affected by opinions of their significant others, but

139
not in voluntary settings. Similarly, this study found that voluntariness has significant
effect on subjective norm, but the direction of the hypothesis is negative. This may
stem from other factors that may correlate both the voluntariness and subjective norm
in terms of intention to use the system. The coefficient of this hypothesis is (γ=-24,
p<0.024).
Summary
Of the 500 surveys, 407 participants responded (81.4%) to the questionnaire
designed for this study. The largest group of the respondents was male, between 31
and 40 years old, had more than 10 years job experience, and had at least a two-year
college degree. Although the validity and reliability of instruments had already been
demonstrated in several studies, they were retested in this study due to survey being
translated from English to a different language, Turkish. The results of the composite
reliability test indicated that all items passed the reliability threshold, which proves that
the responses were consistent and steady. As for the validity, first, the convergent and
discriminant validity were tested by explanatory factor analysis (EFA) by using principal
component analysis with varimax rotation. Convergent and discriminant validity were
satisfied because most of the items were above the 0.70 loading threshold.
The main data analysis was handled in two stages: the measurement model and
the structural model. CFA was used in the measurement model to test how manifest
variables accounted for latent variables. The results indicated that these manifest
variables loaded on their corresponding latent variables, evidencing convergent validity.
Moreover, AVE values were also assessed to test validity, which showed that every
140
constructs passed the 0.5 threshold. In terms of goodness of fit statistics, a good model
fit was ensured by passing all thresholds. Discriminant validity was tested by comparing
chi squared values in constrained and non-constrained conditions.
In the structural model, causal paths were established and the model was tested
by the goodness of fit criteria. Again, the model passed the necessary threshold and
showed a good fit. Paths coefficients indicated that most of the paths were significant,
showing 13 out of 15 hypothesizes were supported. Only personal innovativeness was
found to be significant in its causal relationships with other variables. In addition, the
explanatory power statistics were also assessed and found that the high variance
explained 75% value for the independent variable, Intention to Use.

141
CHAPTER 5
CONCLUSION and RECOMMENDATIONS
Introduction
The final chapter discusses the findings of this study with respect to the research
questions. This chapter presents the recommendations to the practitioners including
Turkish National Police (TNP), policy implications, and suggestions for future studies.
The conclusion section wraps up the study.
General Discussion of Findings
The findings in this study can provide a foundation for an integrated technology
acceptance model explaining why police officers using the POLNET system in Turkey
would accept or reject information technology. Intention to use, the dependent variable
of this study, can account for 75% of the variances which indicates a very good
explanatory power. Moreover, the goodness-of-fit statistical results for both the
measurement model and the structural model indicate that the model may explain the
police officers’ behaviors about their adoption of information technology with high
probability. The reliability tests also reveal that there is a high internal consistency in
the scale of the instrument.
Having found these results, this study positively answered the first research
question “Does the integrated technology acceptance model, designed for this study,
confirm information technology adoption of police officers using the POLNET system in

142
Turkey?” The following section addresses the second and third research questions
exploring the adoption factors in policing and national culture.
In line with the findings of previous relevant studies, among all variables,
attitude via perceived usefulness and perceived ease of use seems a more significant
determinant of technology adoption of police officers compared with the other
determinants, behavioral intention and subjective norm. Particularly, perceived
usefulness emerged as a strong determinant of information technology adoption for
police officers. As for the perceived ease of use, although its path coefficient was lower
than that of perceived usefulness, it also had a significant direct affect on attitude
toward intention to use and an indirect effect through perceived usefulness. However,
this result should be assessed with the knowledge that most of the police officers
working in the Computer and Communication department had familiarity with the
computers. Thus, the cognitive understanding of easiness may be attributed to the
user-friendly interface of the POLNET system. From this point of view, it can be
evaluated that designing a user-friendly system increases the adoption of technology by
Turkish police officers. In addition, along with prestige and results demonstrability,
these determinants play a significant role in explaining, and therefore, understanding
which dynamics influence information technology adoption.
Perceived usefulness and perceived ease of use are technology oriented
variables. Other variables selected based on the criteria of policing and national cultural
aspects are more social in nature. This study combined these two aspects to come up

143
with a model that has the ability to understand the work culture and social culture
facets of technology adoption.
Particularly, prestige has a significant effect both on perceived usefulness and on
subjective norm. This is understandable because most of the police officers in the
Computer and Communication Department are working in the same condition with the
same hierarchical structure. That any benefit, such as “prestige’ provokes the
acceptance of technology is predictable. Prestige had also an effect on subjective norm.
In a cultural environment in which the groups’ interests are more important than the
individual’s, it is obvious that social status and prestige affect the normative beliefs.
Moreover, these findings can also be attributed to one of the characteristics of policing,
creating a positive image from other people. Gaining prestige at work by using
information technology may help to increase a positive public image.
Another strong determinant found in this study was results demonstrability.
Generally, it is believed that police officers have a very pragmatic, tangible, and anti-
theoretical perspective to their job. This finding also supports the belief that explainable
and tangible results have positive effects on attitude and intention via perceived
usefulness and perceived ease of use. Results demonstrability, particularly, can account
for its effect on perceived ease of use. If the Turkish police officers see the tangible
results, they are more likely to perceive the information technology as effortless. This
situation can be explained by a cultural value, risk avoidance. People having the high
risk avoidance cultural future hesitate to take risk in complex and unknown conditions.

144
Subjective norm was found to be a moderately significant variable. For police
officers having strong attachments to their peers and jobs, the opinions of important
others are very valuable. Moreover, in cultures having high power distance, supervisors’
opinions affect the people who have the lower power status. However, in this study, the
subjective norm was not found as a very strong determinant of technology adoption.
There may several explanations for these results. In a police department, quasi military
in nature, most of the tasks are determined by rules including the scope of POLNET
usage, so important others’ opinions affecting the users of the POLNET system may not
be an appropriate research tool to test subjective norm.
Interestingly, this study found that facility of the system was the most significant
factor that affects control beliefs of police officers. In public management, resources are
critical elements, so police officers think that their control over the system depends on
the number of computers and their technical capacities. One of the projects under the
umbrella of POLNET is to support city police agencies by providing new computers
along with the necessary sources. Thus, this policy matches the findings of this study.
Personal innovativeness was not found as a significant determinant for perceived
ease of use and behavioral control. The reason for this may stem from several factors
discussed above, such as high self esteem of police officers toward technology, in
addition to fact that police officers may not perceive the POLNET system as a new
innovation since they have been using it since 2005. Consistent to previous research,
voluntariness affects technology acceptances, either it influences subjective norm found
in this study or in other ways.
145
Limitations and Delimitations of the Study
The research has several limitations. First, in terms of generalizability, the
participants of this study were drawn from the TNP, so the results of this study may not
be generalizable to the other police officers in different countries because of the fact
that specific acceptance determinants may change with different technology tools, user
groups, or cultures.
Second, the sampling design of this study is non-probability of purposive
sampling. The sample of this study was drawn from two departments, computer and
communication in the General Directory of the TNP and its affiliate branches in other
cities due to availability and security reasons. Therefore, the results of this study may
not refer to all members of the TNP since the users sampled in this study may have
different user characteristics than other police officers in different departments.
Third, the findings of this study are based on a single study by testing a specific
information technology tool, the POLNET software system. Longitudinal studies may
give different perspectives or outcomes than this study presented here (Vankatesh &
Davis, 2000). In addition, other technological devices may have different effects on the
information technology acceptance of police officers.
Fourth, although it is believed that this study will contribute to the cross-cultural
understanding of information technology acceptance, cultural factors were not tested
directly. The variables of technology acceptance models were referred to as cultural
factors to understand the adoption of information by police officers in Turkey.

146
Fifth, the constructs and survey items administered in this study were mostly
drawn from previous research written in English. Although the translated and rephrased
survey items were reviewed by several researchers who are fluent in both English and
Turkish, there is always possibility of the slight loss of meaning in the translation,
though reliability and validity tests were re-conducted.
In this study, the main focus is on users of information technology. Human
beings are so complex that it is difficult to determine all factors at one time when
considering behaviors, attitudes, and beliefs, so caution needs to be taken when
analyzing this study.
Recommendations to the Practitioners Including TNP and Policy Implementations
This study has important policy implementations and ramifications for executives
and policy makers of information management practices in the TNP. As information
technology spread out to the organizations gradually, understanding the usability
factors of technology adoption gives an important advantage to the administrators in
the organizations.
The empirical findings of this study offer strategic directions by suggesting a
policy for even greater acceptance that can be achieved by considering the importance
of results demonstrability and prestige over main TAM constructs, perceived usefulness
and perceived ease of use, and attitude. Executives, administrators, or policy makers
that are responsible for making purchasing decisions about technology hardware and
software on behalf of the TNP should give strong preference to systems that facilitate
ready availability of the information and that give observable and understandable

147
outcomes. Administrators should also pay attention to promoting, commending, or
rewarding the users of the systems by increasing their social prestige in the work
environment. In the TNP, this can be achieved by giving extra credit or recognition to
successful users as is done in the business sector. The findings also imply that policy
makers and administrators should be clear about the purpose of the deployed
technology deployed and its usefulness. It is important to develop implementation
strategies that show how useful the information technology systems are. If they explain
and emphasize to the users how this system can increase their performance and how it
is easy to use, this study asserts that they are more likely to accept this new
information technology. Thus, executives should be keen on obtaining feedback from
the adopting users regarding the perceived usefulness of the system, and respond to all
the adaptations needed to increase performance. In addition, to increase adoption,
executives may assign to the supervisors of users to encourage them to use the
information technology system, POLNET in this case. This situation can also be achieved
by increasing the support of the social network within the organization.
Since the proper allocation of systems’ hardware and software, as much as
possible, increases the acceptance of its use, executives and administers should be
careful about deploying the system. Police officers who readily adopt information
technology may optimize the resources which were deployed to assist policing. Thus,
having recognized these factors found in this study, it is assumed that administrators or
information technology professionals can create an environment which fosters
technology adoption of police officers.

148
Directions for the Future Research
While the results confirmed and fit the research model, further research is
needed to confirm either this model or create another model which may be more fitted
to the given data. Although explaining a great deal of the variance in factors depicted in
this study, the scope of this study can be expanded to gain a more complete picture of
the information technology adoption of police officers in future research.
This research presented a model based on theoretical facts and tested it on
police officers using the POLNET system, in accordance with the confirmatory
perspective. Although statistical results of this shows good fit for this model, there is
always the possibility that other factors may affect the technology acceptance of police
officers. In future research, researchers may also want to consider other possible
psychosocial or contextual variables that may affect behavioral intention of information
technology usage.
The sampling design of this study is purposive sampling in which the researcher
determines the sample based on his/her experience. This sampling is also used in pilot
studies before conducting the main research. Thus, a future study can be conducted by
choosing probability sampling utilizing this research approach to provide generalizability.
Conclusion
This study may provide a theoretical perspective for successful information
management system design and implementation and may contribute to determine the
problems before the system is implemented. Design and usage of advance information
technology systems can improve the quality of policing from various perspectives.

149
Especially, crime fighting and crime prevention, the core elements of policing, can be
enhanced with optimum usage of information technology in today’s world. To fully
utilize these anticipated technological benefits, it is obvious that police agencies should
consider user adoptions of information technology. However, the relevant literature and
theories indicate that various dynamics influence technology acceptance depending on
user and task characteristics including the structures of their environments. In this
context, organizational and national culture and the basic structure of technology
acceptance play important roles in the acceptance of information technology.
Thus, this study has produced insights into factors that affect the technology
adoption of police officers by presenting a model inspired by three important aspects,
national cultural factors, the factors of policing, and the basic technology acceptance
factors tested in previous studies. Overall, the results indicate that the model fit the
data drawn from Turkish police officers using the POLNET system. In doing so, it is
assumed that this study helps to fill the gap of empirical and theoretical knowledge
about information technology acceptance in the TNP since there is a dearth of research
in this area.

150
APPENDIX A
SURVEY QUESTIONS

151
SURVEY QUESTIONNAIRE
1=Strongly Disagree 2= Disagree 3= Neutral 4= Agree 5= Strongly Agree Assuming I have access to the POLNET system, I intend to use it. 1 2 3 4 5
Given that I have access to the POLNET system, I predict that I would use it. 1 2 3 4 5
In my work, if I have access to the POLNET system, I want to use it as much as possible. 1 2 3 4 5
I prefer to use the POLNET system even though I can do my work with other tools. 1 2 3 4 5
I do not want use the POLNET system for policing in Turkey. 1 2 3 4 5
Using the POLNET system improves my job performance. 1 2 3 4 5
Using the POLNET system in my job increases my productivity. 1 2 3 4 5
Using the POLNET system enhances my effectiveness in my work. 1 2 3 4 5
The POLNET system meets the requirements of my job. 1 2 3 4 5
The POLNET system increases the communication within the TNP. 1 2 3 4 5
The POLNET system enables us to do our job more quickly. 1 2 3 4 5
I find the POLNET system to be useful in my work. 1 2 3 4 5
My interaction with the POLNET system is clear and understandable. 1 2 3 4 5
Interacting with the POLNET system does not require a lot of my mental effort. 1 2 3 4 5
I find the POLNET system to be easy to use. 1 2 3 4 5 It is difficult use the POLNET system in my work 1 2 3 4 5 I find it easy to get the POLNET system to do what I want it to do. 1 2 3 4 5
In my work, people who influence my behavior, such as my supervisors think that I should use the POLNET system.
1 2 3 4 5
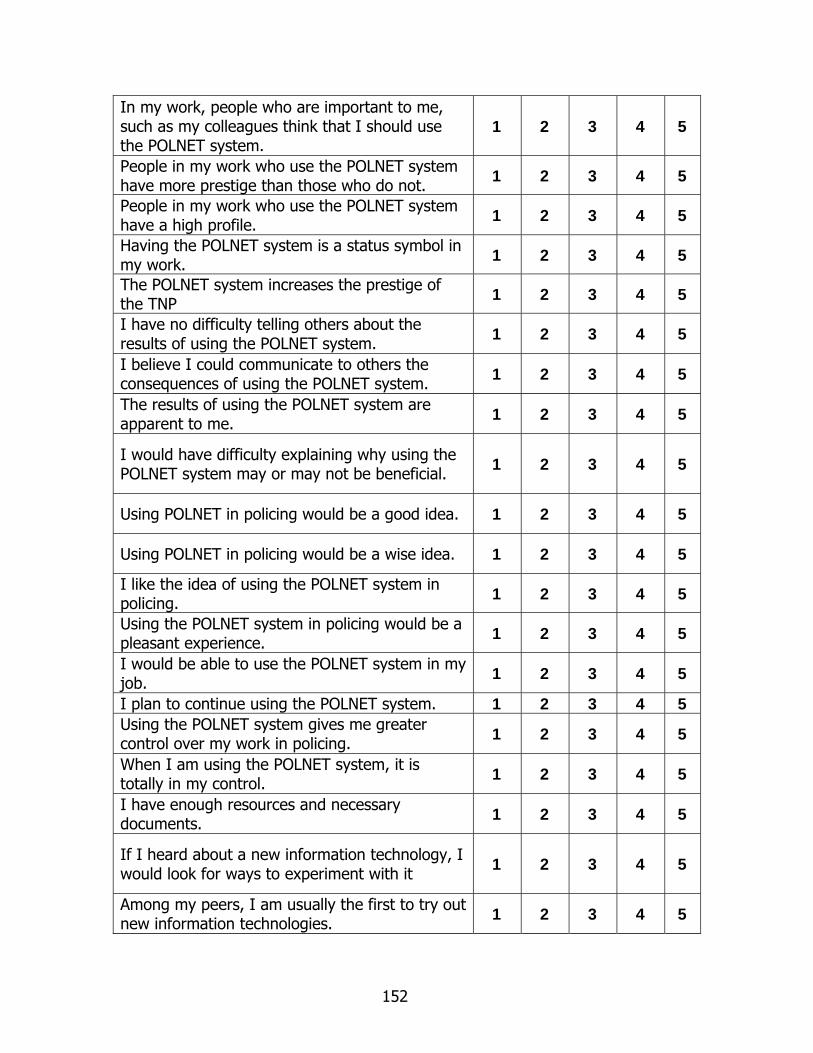
152
In my work, people who are important to me, such as my colleagues think that I should use the POLNET system.
1 2 3 4 5
People in my work who use the POLNET system have more prestige than those who do not. 1 2 3 4 5
People in my work who use the POLNET system have a high profile. 1 2 3 4 5
Having the POLNET system is a status symbol in my work. 1 2 3 4 5
The POLNET system increases the prestige of the TNP 1 2 3 4 5
I have no difficulty telling others about the results of using the POLNET system. 1 2 3 4 5
I believe I could communicate to others the consequences of using the POLNET system. 1 2 3 4 5
The results of using the POLNET system are apparent to me. 1 2 3 4 5
I would have difficulty explaining why using the POLNET system may or may not be beneficial. 1 2 3 4 5
Using POLNET in policing would be a good idea. 1 2 3 4 5
Using POLNET in policing would be a wise idea. 1 2 3 4 5
I like the idea of using the POLNET system in policing. 1 2 3 4 5
Using the POLNET system in policing would be a pleasant experience. 1 2 3 4 5
I would be able to use the POLNET system in my job. 1 2 3 4 5
I plan to continue using the POLNET system. 1 2 3 4 5 Using the POLNET system gives me greater control over my work in policing. 1 2 3 4 5
When I am using the POLNET system, it is totally in my control. 1 2 3 4 5
I have enough resources and necessary documents. 1 2 3 4 5
If I heard about a new information technology, I would look for ways to experiment with it 1 2 3 4 5
Among my peers, I am usually the first to try out new information technologies. 1 2 3 4 5

153
I like to experiment with new information technologies. 1 2 3 4 5
There are enough computers for everyone to use the POLNET system. 1 2 3 4 5
I have no difficulty finding a computer to use the POLNET system when I need it. 1 2 3 4 5
The availability of computers for accessing the POLNET system is not going to be a problem. 1 2 3 4 5
My use of the POLNET system is voluntary. 1 2 3 4 5 My supervisor does not require me to use the POLNET system. 1 2 3 4 5
Although it might be helpful, using the POLNET system is certainly not compulsory in my job. 1 2 3 4 5
People whom I think they know information technology very well think that the TNP use the POLNET system.
1 2 3 4 5
In my work, people whose knowledge I value think that I should use the POLNET system. 1 2 3 4 5
Demographic Information
(Please select the appropriate option for you)
Gender 1- Male 2-Female
21-30 31-40 41-50 51-60
Age
Over 61

154
0-2 years 3-6 years 7-10 years 11-15 years
Job Experience
More than 15 years
High School
Community College
University
Master Degree
Education (Please select
last graduation)
PhD

155
APPENDIX B
INSTITUTIONAL REVIEW BOARD (IRB) FOR THE PROTECTION OF HUMAN
RIGHTS IN RESEARCH APPROVAL

156

157
APPENDIX C
CONSENT FORM

158

159

160
APPENDIX D
SURVEY APPROVAL FROM THE TURKISH NATIONAL POLICE (TNP)

161

162

163
APPENDIX E
CORRELATION MATRIX OF SURVEY ITEMS
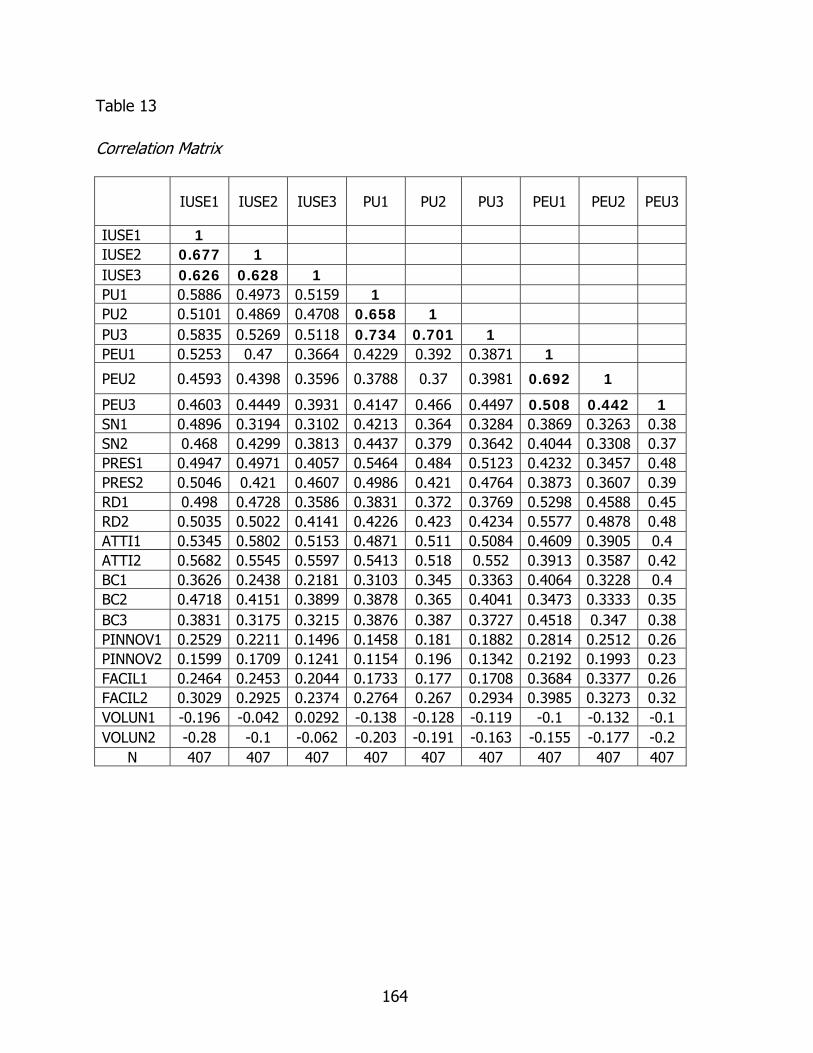
164
Table 13
Correlation Matrix
IUSE1 IUSE2 IUSE3 PU1 PU2 PU3 PEU1 PEU2 PEU3
IUSE1 1 IUSE2 0.677 1 IUSE3 0.626 0.628 1 PU1 0.5886 0.4973 0.5159 1 PU2 0.5101 0.4869 0.4708 0.658 1 PU3 0.5835 0.5269 0.5118 0.734 0.701 1 PEU1 0.5253 0.47 0.3664 0.4229 0.392 0.3871 1
PEU2 0.4593 0.4398 0.3596 0.3788 0.37 0.3981 0.692 1
PEU3 0.4603 0.4449 0.3931 0.4147 0.466 0.4497 0.508 0.442 1 SN1 0.4896 0.3194 0.3102 0.4213 0.364 0.3284 0.3869 0.3263 0.38 SN2 0.468 0.4299 0.3813 0.4437 0.379 0.3642 0.4044 0.3308 0.37 PRES1 0.4947 0.4971 0.4057 0.5464 0.484 0.5123 0.4232 0.3457 0.48 PRES2 0.5046 0.421 0.4607 0.4986 0.421 0.4764 0.3873 0.3607 0.39 RD1 0.498 0.4728 0.3586 0.3831 0.372 0.3769 0.5298 0.4588 0.45 RD2 0.5035 0.5022 0.4141 0.4226 0.423 0.4234 0.5577 0.4878 0.48 ATTI1 0.5345 0.5802 0.5153 0.4871 0.511 0.5084 0.4609 0.3905 0.4 ATTI2 0.5682 0.5545 0.5597 0.5413 0.518 0.552 0.3913 0.3587 0.42 BC1 0.3626 0.2438 0.2181 0.3103 0.345 0.3363 0.4064 0.3228 0.4 BC2 0.4718 0.4151 0.3899 0.3878 0.365 0.4041 0.3473 0.3333 0.35 BC3 0.3831 0.3175 0.3215 0.3876 0.387 0.3727 0.4518 0.347 0.38 PINNOV1 0.2529 0.2211 0.1496 0.1458 0.181 0.1882 0.2814 0.2512 0.26 PINNOV2 0.1599 0.1709 0.1241 0.1154 0.196 0.1342 0.2192 0.1993 0.23 FACIL1 0.2464 0.2453 0.2044 0.1733 0.177 0.1708 0.3684 0.3377 0.26 FACIL2 0.3029 0.2925 0.2374 0.2764 0.267 0.2934 0.3985 0.3273 0.32 VOLUN1 -0.196 -0.042 0.0292 -0.138 -0.128 -0.119 -0.1 -0.132 -0.1 VOLUN2 -0.28 -0.1 -0.062 -0.203 -0.191 -0.163 -0.155 -0.177 -0.2
N 407 407 407 407 407 407 407 407 407

165
Table (Continued) Correlation Matrix
SN1 SN2 PRES1 PRES2 RD1 RD2 ATTI1 ATTI2
IUSE1 IUSE2 IUSE3 PU1 PU2 PU3 PEU1 PEU2 PEU3 SN1 1 SN2 0.705 1 PRES1 0.3067 0.4011 1 PRES2 0.4435 0.4769 0.49 1 RD1 0.402 0.5309 0.4297 0.4585 1 RD2 0.4013 0.4794 0.3083 0.4445 0.77 1 ATTI1 0.3041 0.4079 0.4718 0.4371 0.4871 0.524 1 ATTI2 0.3373 0.4244 0.4826 0.4803 0.4714 0.5043 0.726 1 BC1 0.3366 0.3653 0.2381 0.2883 0.4222 0.3528 0.2083 0.2684 BC2 0.4126 0.4399 0.3905 0.4664 0.448 0.5118 0.3731 0.4152 BC3 0.3098 0.3513 0.3317 0.309 0.4044 0.4245 0.3325 0.3705 PINNOV1 0.2447 0.2284 0.1926 0.1947 0.3042 0.2747 0.2328 0.2262 PINNOV2 0.126 0.1357 0.1146 0.171 0.2157 0.2492 0.2216 0.2255 FACIL1 0.2461 0.2203 0.2239 0.1389 0.2403 0.2544 0.1773 0.1306 FACIL2 0.2521 0.3004 0.2909 0.269 0.3838 0.3491 0.2723 0.2796
VOLUN1 -0.311 -0.234 -0.0948 -0.102 -
0.2415 -0.13 -0.132 -0.085
VOLUN2 -0.409 -0.334 -0.1225 -0.172 -
0.2352 -0.163 -0.157 -0.158
N 407 407 407 407 407 407 407 407

166
Table (Continued) Correlation Matrix
BC1 BC2 BC3 PINOV1
PINOV2 FACIL1 FACIL
2 VOLUN
1 VOLUN
2
IUSE1 IUSE2 IUSE3 PU1 PU2 PU3 PEU1 PEU2 PEU3 SN1 SN2 PRES1 PRES2 RD1 RD2 ATTI1 ATTI2 BC1 1
BC2 0.5202 1
BC3 0.4584 0.505 1
PINNOV1 0.2594 0.217
9 0.213
9 1
PINNOV2 0.1338 0.174
5 0.152 0.617 1
FACIL1 0.2615 0.2499
0.3589 0.2041 0.0884 1
FACIL2 0.3279 0.3002
0.4247 0.2452 0.1857 0.574
4 1
VOLUN1 -0.2519 -0.121
-0.174
5
-0.1476 -0.039 -
0.1802
-0.117
4 1
VOLUN2 -0.3014 -0.231
-0.266
1
-0.2156 -0.094 -
0.2529 -0.2 0.731 1
N 407 407 407 407 407 407 407 407 407

167
REFERENCES
Ajzen, I., & Fishbein, M. (1980). Understanding attitudes and predicting social behavior.
Englewood Cliffs, NJ: Prentice-Hall.
Ajzen, I. (1991). The theory of planned behavior. Organizational Behavior and Human
Decision Processes, 50, 179-211.
Ajzen, I. (2002). Perceived behavioral control, self-efficacy, locus of control, and the
theory of planned behavior. Journal of Applied Social Psychology, 32, 665-683.
Agarwal, R., & Prasad, J. (1998). A conceptual and operational definition of personal
innovativeness in the domain of information technology. Information Systems
Research, 9 (2), 204-215.
Al-Gahtani, S. S., & King, M. (1999). Attitudes, satisfaction and usage: Factors
contributing to each in the acceptance of information technology. Information
Behavior, 18 (4), 277-297.
Askan, Y. (2006). Turkish national police: Police information system, POLNET.
Unpublished manuscript: Ankara, Turkey.
Barney, J. (1991). Film resources and sustained competitive advantage. Journal of
Management, 17 (1), 99-120.
Bhattacherjee, A. (2006). Influence processes for information technology acceptance:
an elaboration likelihood model. MIS Quarterly, 30 (4), 805-825.
Bhattacherjee, A., & Premkumar, G. (2004). Understanding changes in belief and
attitude toward information technology usage: A theoretical model and
longitudinal test. MIS Quarterly, 28 (2), 229-235.

168
Brown, S. A., Massey, A. P., Montoya-Weiss, M. M., & Burkman, J. R. (2002). Do I really
have to? User acceptance of mandated technology. European Journal of
Information Systems, 11(4), 283-295.
Burns, M., Turnipseed, D., & Riggs, W. (1991). Critical success factors in manufacturing
resource planning implementation. International Journal of Operations and
Product Management, 11 (4), 5-19.
Byrne, J. M., & Buzawa, E. (2005). Information, technology, and the criminal justice
education. In A. Pattavina (Ed.), Information technology and the criminal justice
system. Thousand Oaks, CA: Sage.
Cao, L., & Burton, V. S. (2006). Spanning the continents: Assessing the Turkish public
confidence in the police. Policing: An International Journal of Police Strategies &
Management, 29 (3), 451-463.
Chan, J. B. L. (2001). The technological game: How information technology is
transforming police practice. Criminal Justice, 1(2), 139-159.
Chau, P.Y.K. (1996). An empirical assessment of a modified technology acceptance
model. Journal of Management Information Systems, 13, 185-204.
Chau, P. Y. K. (2001). Influence of computer attitude and self-efficacy on IT usage
behavior. Journal of End User Computing, 13 (1), 26-33.
Chau, P. Y. K., & Hu, P. (2002). Investigating healthcare professionals’ decisions to
accept telemedicine technology: An empirical test of competing theories.
Information & Management, 39 (4), 297-311.

169
Chen, H., Schroeder, J., Hauck, R. V., Ridgeway, L., Atabaksh, H., Gupta, H., et al.
(2002). COPLINK connect: Information and knowledge management for law
enforcement. Decision Support Systems, 34, 271-285.
Chin, W. (1998). The partial least squares approach for structural equation modeling.
In: G.A. Marcoulides, (Ed.), Modern Methods for Business Research. (pp. 295-
336). Hillsdale, NJ: Lawrence Erlbaum Associates.
Chin, W., & Todd, P. (1995). On the use, usefulness, and ease of use of structural
equation modeling in MIS research: A note of caution. MIS Quarterly, 19 (2),
237-246.
Chu, J. (2001). Law enforcement information technology: A managerial, operational,
and practitioner guide. Boca Raton, FL: CRC Press
Collier, P. M. (2006) Policing and the intelligent application of knowledge. Public Money
& Management, 26 (2), 109-116.
Colvin, C. A., & Goh, A. (2005). Validation of the technology acceptance model for
police. Journal of Criminal Justice 33, 89–95.
Cork, R., Detmer, W., & Friedman, C. (1998). Development and initial validation of an
instrument to measure physicians’ use of, knowledge about, and attitudes
toward computers. Journal of the American Medical Informatics Association,
5(2), 164–175.
Couret, C. (1999). Police and technology: The silent partnership. The American City &
County, 114 (9), 31-36.

170
Davis, F.D. (1986). A technology acceptance model for empirically testing new end-user
information systems: theory and results. Doctoral dissertation, Sloan School of
Management, Massachusetts Institute of Technology, Boston.
Davis, F.D. (1989). Perceived usefulness, perceived ease of use, and user acceptance of
information technology. MIS Quarterly, 13, 319-339.
Davis, F. D., Bagozzi, R. P., & Warshaw, P. R. (1989). User acceptance of computer
technology: A comparison of two theoretical models. Management Science,
35(8), 982-1003.
Dees, T. (2001). Intranets. Law and Order, 49 (4), 32-35.
Dennis, A., & Wixom, B. (2000). Systems analysis and design. New York: John Wiley &
Sons.
Dillon, A., & Morris, M.G. (1996). User acceptance of information technology: Theories
and models. Annual Review of Information Science and Technology (ARIST), 31,
3-32.
Dishaw, M. T., & Strong, D. M. (1999). Extending the technology acceptance model
with task–technology fit constructs. Information & Management, 36(1), 9-21.
Egan, D. E. (1998). Individual differences in computer interaction. In M. Helander (Ed.),
Handbook of human-computer interaction, Amsterdam: New Holland.
Evers, V., & Day, D. (1997). The role of culture in interface acceptance. In S Howard
(Ed.), Proceedings, 6th IFIP Conference on HCI, TC 13 International Conference
on Human Computer Interaction, (pp. 260-267). London: Chapman & Hall.

171
Fishbein, M., & Ajzen, I. (1975). Belief, attitude, intentions and behavior: An
introduction to theory and research. Boston: Addison-Wesley.
Flanagin, A. J. (2002). The impact of contemporary communication and information
technologies on police organizations. In H. Giles (Ed.), Law enforcement,
communication and community. (pp. 85-107). Philadelphia: John Benjamins.
Fornell C. R., & Larcker, D. F. (1981). Structural equation models with unobservable
variables and measurement error: Algebra and statistics. Journal of Marketing
Research, 18 (3), 382-388.
Fornell, C.R., Tellis, G. L., & Zinkhan, G.M (1982) Validity assessment: a structural
equation approach using partial least squares. In: B.J. Walker et al., (Eds.), An
assessment of marketing thought and practice (pp. 405–409). American
Marketing Association, Chicago.
Galindo, F. (2006). Basic aspects of the regulation of e-government. Law Technology,
39(1), 1-22.
Gardner, C. & Amoroso, D.L. (2004). Development of an instrument to measure the
acceptance of Internet technology by consumers. Proceedings of the 37th Hawaii
International Conference on System Sciences. Honolulu, HI.
Garver, M. S., & Mentzer, J. T. (1999). Logistics research methods: Employing
structural equation modeling to test for construct validity. Journal of Business
Logistics, 20 (1), 33-57.
172
Gefen, D., & Straub, D.W. (1997). Gender differences in the perception and use of e-
mail: An extension to the technology acceptance model. MIS Quarterly, 21 (4),
389-400.
Gerbing, D. W., & Anderson, J. C. (1988) An updated paradigm for scale development
incorporating unidimensionality and its assessment, Journal of Marketing
Research, 25, 186-192
Goodhue, D. L., & Thompson, R. L. (1995). Task-technology fit and individual
performance. MIS Quarterly, 19 (2), 213-236.
Gottschalk, P. (2006). Stages of knowledge management systems in police
investigations. Knowledge-Based Systems, 19 (6), 381-387.
Gottschalk, P., & Holgersson, S. (2006). Stages of knowledge management technology
in the value shop: The case of police investigation performance. Expert Systems,
23 (4), 183.
Hofstede, G. (1991). Cultures and organizations: Software of the mind. London:
McGraw-Hill.
Harris, M., & Schaubroeck, J. (1990). Confirmatory modeling in organizational
behavior/human resource management: Issues and applications. Journal of
Management, 16, 2, 337-360.
Haque, A. (2005). Information technology and surveillance: Implications for public
administration in a new world order. Social Science Computer Review, 23 (4),
480-485.

173
Hauck, R., V., & Weisband, S. (2002). When a better interface and easy navigation
aren't enough: examining the information architecture in law enforcement
setting. Journal of the American Society for Information Science and Technology,
53 (10), 846.
Hinnat, C. C., & Welch, E. W. (2002). Managerial capacity and digital government in the
states: Examining the link between self-efficacy and perceived impacts of it in
public organizations. Paper presented at Proceedings of the 36th Hawaii
International Conference on System Sciences. Honolulu, HI.
Hong, S., Thong, J. Y. L., & Tam, K. A. (2006). Understanding continued information
technology usage behavior: A comparison of three models in the context of
mobile internet. Decision Support Systems, 42 (3), 1819-1834.
Host, M., Kuttschreuter, M., & Gutteling, J. M. (in press). Perceived usefulness, personal
experiences, risk perception and trust as determinants of adoption of e-
government services in The Netherlands. Computers in Human Behavior.
Hu, P. J., Lin, C., & Chen, H. (2005). User acceptance of intelligence and security
informatics technology: A study of COPLINK. Journal of the American Society for
Information Science and Technology, 56 (3), 235.
Huang, E., & Chuang, M. H. (2007). Extending the theory of planned behavior as a
model to explain post-merger employee behavior of IS use. Computers in Human
Behavior, 23 (1), 240-257.
Ioimo R. E., & Aronson, J. E. (2004). Police field mobile computing: Applying the
theory of task-technology fit. Police Quarterly, 7(4), 403-428.
174
Kelloway, E. K. (1998). Using LISREL for structural equation modeling: A researcher
guide. Thousand Oaks: Sage.
Kerlinger, F. N. (1986). Foundations of behavioral research. (3rd ed.), Forth Worth, TX:
Harcourt, Brace, Jovanovich.
King W. R., & He, J. (2006). A meta-analysis of the technology acceptance model.
Information & Management, 43(6), 740-755.
Koeszegi, S., Vetschera, R., & Kersen, G. (2004). National cultural differences in the use
and perception of internet-based NSS: Does high or low context matter?
International Negotiation, 9 (1), 79.
Lee, S. M., Kim, I., Rhee, S., & Trimi, S. (in press). The role of exogenous factors in
technology acceptance: The case of object-oriented technology. Information &
Management.
Legris, P., Ingham, J., Collerette, P. (2003). Why do people use information technology?
A critical review of the technology acceptance model. Information &
Management, 40 (3), 191-204.
Lewis, J. R. (1995). IBM computer usability satisfaction questionnaires: Psychometric
evaluation and instructions for use. International Journal of Human-Computer
Interaction, 7 (1), 57- 78.
Lin, C., Hu, P. J., and Chen, H. (2004). Technology implementation management in law
enforcement: COPLINK system usability and user acceptance evaluations. Social
Science Computer Review, 22(1), 24-36.

175
Lin, F., & Wu, J. (2004). An empirical study of end-user computing acceptance factors
in small and medium enterprises in Taiwan: Analyzed by structural equation
modeling. Journal of Computer Information Systems, 44 (3), 98-108.
Lundblad, J. P. (2003). A review and critique of Rogers' diffusion of innovation theory as
it applies to organizations. Organization Development Journal, 21(4), 50.
Lutz, W. (2003). Low-cost technology for public safety. The American City & County,
118 (3), 10.
Ma, Q., & Liu, L. (2004). The technology acceptance model: A meta-analysis of
empirical findings. Journal of Organizational and End User Computing, 16(1), 59-
73.
Madden, T. J., Ellen, P. S., & Ajzen I. (1992). A comparison of the theory of planned
behavior and the theory of reasoned action. Personality and Social Psychology
Bulletin.18 (1), 3-9
Malhotra, Y., & Galletta, D.F., (1999, March). Extending the technology acceptance
model to account for social influence: Theoretical bases and empirical validation.
Paper presented at Proceedings of the 32nd Hawaii International Conference on
System Sciences, Honolulu, HI.
Maltz, M. D., Gordon, A. C., & Friedman, W. (1991). Mapping crime in its community
setting: Event geography analysis. New York, NY: Springer-Verlag.
Manning, P. K. (1992). Organizational communication. New York: A. de Gruyter.
Manning, P.K. (2003). Policing contingencies. Chicago, IL: The University of Chicago
Press.

176
Mao, E., Strite M., Thacher J. B, & Yaprak O. (2005). A research model for mobile
phone service behaviors: Empirical validation in the USA and Turkey. Journal of
Global Information Technology Management, 8 (4), 7.
Martin, K. (2004) Domestic intelligence and civil liberties. SAIS Review, 24(1) 7-22.
MacCallum R., C., & Austin, J. T. (2000). Applications of structural equation modeling in
psychological research. Annual Review of Psychology, 51, 201-236.
McCoy, S. (2002). The effect of national culture dimensions on the acceptance of
information and technology: A trait based approach. Unpublished Doctoral
Dissertation, University of Pittsburg, PA.
McCoy, S., Eyerard, A., & Jones, B. (2005). An examination of the technology
acceptance model in Uruguay and the US: A focus on culture. Journal of Global
Information Technology Management, 8 (2), 25.
McCoy S., Galletta, D., & King W.R., (2005). Integrating national culture into IS
research: The need for current individual-level measures. Communications of the
Association for Information Systems, 15, 211-224.
Mentzer, J. T. & Flint, D. J. (1997). Validity in logistics research. Journal of Business
Logistics, 18 (2), 199-216.
Millsap, R. E. (2002) Structural equation modeling: A user's guide. In F. Drasgow & N.
Schmitt (Eds.), Advances in Measurement and Data Analyses. (pp. 257-301) San
Francisco: Jossey-Bass.

177
Money, W. (2004). Application of the technology acceptance model to a knowledge
management system. Proceedings of the 37th Hawaii International Conference
on System Sciences. Honolulu, HI.
Moore, M. H. (1997). Creating public value. Cambridge: Harvard University Press.
Mueller, R. S. (2006). The art of information. Vital Speeches of the Day, 72 (14/15),
434-437.
National Incident-Based Reporting System (NIBRS) Implementation Program. (2002,
December 26) Retrieved January, 2007 from www.ojp.usdoj.gov/bjs/nibrs.htm
Netemeyer, R. G., Bearden, W. O., & Sharma, S. (2003). Scaling procedures: Issues
and applications. Thousand Oaks, CA: Sage Publications.
Nielsen, J. (1993). Usability engineering. San Francisco, CA: Morgan Kaufmann.
Nunn, S. and Quinet, K. (2002). Evaluating the effects of information technology on
problem-oriented-policing: If it doesn’t fit, must we quit? Evaluation Review,
26(1), 81-108.
Ozdemir, H. (2004). An examination of the need to establish cultural literacy in police
administration. Turkish Journal of Police Studies, 6(3-4), pp. 95-114.
Ozmen, A. (2006). The examination of transformational and transactional leadership
philosophies and practices in policing. Unpublished Manuscript. Sam Houston
State University, College of Criminal Justice, Huntsville, TX.
Pekgozlu, I. (2003). Turk Emniyet Orgutu’nde bilgi teknolojilerinin uygulanmasi. (Master
thesis, Hacettepe University, Ankara, Turkey)

178
Phillips, L. A., Calantone, R., & Lee, M. (1994). International technology adoption:
Behavior structure, demand certainty and certainty and culture. The Journal of
Business & Industrial Marketing, 9 (2), 16.
Premkumar G. & Bhattacherjee A., (in press). Explaining information usages: a test of
competing models. The International Journal of Management Science.
Redmond, M. & Baveja A. (2002). A data-driven software tool for enabling cooperative
information sharing among police departments. European Journal of Operational
Research, 141, 660-678.
Robey, D. (1996). Research commentary: Diversity in information systems research:
Threat, promise, and responsibility. Information Systems Research, 7, 400-408.
Rocheleau, B. (1993). Evaluating public sector information system: Satisfaction versus
impact. Evaluation and Program Planning, 16, 119-129.
Rogers, E.M. (1995). Diffusion of innovations (4th ed.). New York: The Free Press.
Russell, D. M., & Hoag, A. M. (2004). People and information technology in the supply
chain: Social and organizational influences on adoption. International Journal of
Physical Distribution & Logistics Management, 34 (1), 102.
Saade, R., & Bahli, B. (2005). The impact of cognitive absorption on perceived
usefulness and perceived ease of use in on-line learning: an extension of the
technology acceptance model. Information & Management, 42, 317–327.
Saade, R. G., & Kira, D. (in press). Mediating the impact of technology usage on
perceived ease of use by anxiety. Computers & Education.

179
Schifter, D. E., & Ajzen, I. (1985). Intention, perceived control, and weight loss: An
application of the theory of planned behavior. Journal of Personality & Social
Psychology, 49(3), 843-851.
Schumacker, R. E. & Lomax R. G. (2004). A beginner's guide to structural equation
modeling. New Jersey: Lawrence Erlbaum.
Segars, A. H. (1997) Assessing the unidimensionality of measurement: a paradigm and
illustration within the context of information systems research, Omega, 25(1),
107-121.
Shelley, L. I. (1998). Crime and corruption in the digital age. Journal of International
Affairs, 51 (2), 605-621.
Sheptycki, J. (2004). Organizational pathologies in police intelligence systems: some
contributions to the lexicon of intelligence-led policing. European Journal of
Criminology, 1 (3), 307-332.
Sonnenwald, D.H., Maglaughlin, K.L., & Whitton, M.C. (2001). Enabling technologies:
Infrastructure for collaborative enterprises. Proceedings: Tenth IEEE
International Workshops, 114-119.
Sozen, U. (n.d.). Polisten e-polise. Retrieved January 10, 2007 from
http://www.egm.gov.tr/stratejigelistirmedb/zzzz_14112006_egitime%20devredild
i_dergi/37/web/makaleler/uzeyir_sozen.htm
Srite, M., & Karahanna, E. (2006). The role of espoused national cultural values in
technology acceptance. MIS Quarterly, 30 (3), 679- 704.

180
Srite, M., Thatcher, J. B., & Yaprak, O. (2005). A research model for mobile phone
service behaviors: empirical validation in the USA and Turkey. Journal of Global
Information Technology Management, 8 (4), 7.
Starkweather, W. M., & Wallin, C. C. (1999.) Faculty response to library technology:
insights on attitudes. Library Trends, 47(4).
Straub, D. W. (1989) Validating instruments in MIS research, MIS Quarterly, 13 (2),
147-169.
Straub D., Keil, M., & Brenner, W. (1997). Testing the technology acceptance model
across cultures: A three country study. Information & Management, 33, 1-11.
Streiner, D. L. (2006). Building a better model: An introduction to structural equation
modeling. The Canadian Journal of Psychiatry—Research Methods in Psychiatry,
51 (5), 317-324.
Sun, H. (2003, August 4). An integrative analysis of the TAM: Towards a deeper
understanding of technology acceptance model. AMCIS 03, Tampa, Fl.
Sun, H., & Zhang, P. (2004). A Methodological analysis of user technology acceptance.
Proceedings of the 37th Hawaii International Conference on System Sciences.
Honolulu, HI.
Szajna, B. (1994). Software evaluation and choice: predictive validation of the
technology acceptance instrument. MIS Quarterly, 18(3), 319-324.
Taylor, S., & Todd, P. (1995). Understanding information technology usage: A test of
competing models. Information Systems Research, 6 (2), 144-176.

181
Tosun, H. (2006). Turkish police perceptions and attitudes toward using computer
technology in police cars. Unpublished master’s thesis. Michigan State University,
East Lansing, Michigan.
Xuan, J. & Chen, H. (2005) Criminal Network Analysis and Visualization.
Communications of the ACM, 48 (6) 101-107.
Van der Heijden, H. (2004). User acceptance of hedonic information systems. MIS
Quarterly, 28 (4), 695-704.
Veiga, J. F., Floyd, S., & Dechant, K., (2001). Towards modeling the effects of national
culture on IT implementation and acceptance. Journal of Information
Technology, 16, 145-158.
Vankatesh, V. & Davis, F. D. (2000). A theoretical extension of the technology
acceptance model: Four longitudinal field studies. Management Science, 46 (2),
186-204.
Venkatesh, V., & Morris, M. G. (2000) Why do not men ever stop to ask for directions?
Gender, social influence, and their role in technology acceptance and usage
behavior. MIS Quarterly, 24 (1), 115-139.
Venkatesh, V., Morris, M. G., Davis, G. B., & Davis, F. D. (2003). User acceptance of
information technology: Towards a unified view. MIS Quarterly, 27(3), 425-478.
Williams, S. R., & Aasheim, C. (2005). Information technology in the practice of law
enforcement. Journal of Cases on Information Technology, 7 (1), 71-92.

182
Williams, L. J., Edwards, J. R., & Vandenberg, R. J., (2003). Recent advances in causal
modeling methods for organizational and management research. Journal of
Management, 29, 903-936.
Wu, J., & Wang, S. (2005). What drives mobile commerce? An empirical evaluation of
the revised technology acceptance model. Information & Management, 42 (5),
719-729.
Yazici, N. (n.d.). Emniyet teşkilatının e-devlet yapılanmasındaki yeri. Retrieved January
10, 2007 from
http://www.egm.gov.tr/stratejigelistirmedb/zzzz_14112006_egitime%20devredild
i_dergi/37/web/makaleler/nevzat_yazici.htm
Yanga, H., & Yoo, Y. (2004). It’s all about attitude: Revisiting the technology
acceptance model. Decision Support Systems, 38, 19–31.
Yi, M. Y., Jackson, J.D, Park, J.S., & Probst, J. C. (2006). Understanding information
technology acceptance by individual professionals: Towards an integrative view.
Information & Management, 43 (3), 350- 363.
Zain, M., Rose, R. C., Abdullah, I., & Masrom, M. (2005). The relationship between
information technology acceptance and organizational agility in Malaysia.
Information & Management, 42, 829–839.
Zaworski, M.J. (2005). An assessment of an information sharing technology (ARJIS):
Examining its potential contribution to improved performance through the eyes
of street level officers. Retrieved January 10, 2007 from
http://www.ncjrs.org/pdffiles1/nij/grants/210487.pdf