polb sediment quality summary final - port of los angeles · summary of sediment quality ... 2.5...
TRANSCRIPT

Final
Summary of Sediment Quality Conditions in the
Port of Long Beach
Prepared For:
Port of Long Beach 925 Harbor Plaza
Long Beach, California 90802
May 2009

Final
Summary of Sediment Quality Conditions in the
Port of Long Beach
Prepared for:
Port of Long Beach 925 Harbor Plaza
Long Beach, California 90802
Prepared by:
WESTON Solutions, Inc. 2433 Impala Drive
Carlsbad, California 92010
May 2009

SUMMARY OF SEDIMENT QUALITY CONDITIONS IN THE PORT OF LONG BEACH May 2009
WESTON Solutions, Inc. i
TABLE OF CONTENTS
1.0 INTRODUCTION ......................................................................................................................... 1 1.1 Land Uses and Possible Sources of Sediment Chemical Contamination in Long Beach Harbor ............... 1 1.2 Physical Pathways for Chemical Distribution and Deposition into Long Beach Harbor ............................ 2 1.3 Data Selection Process ................................................................................................................................ 3
2.0 DISTRIBUTION AND MAGNITUDE OF CHEMICALS IN LONG BEACH HARBOR SEDIMENTS .................................................................................................................................. 5
2.1 Water Quality Standards: Total Daily Maximum Loads ............................................................................. 5 2.1.1 Introduction ..................................................................................................................................... 5 2.1.2 Listing Procedures .......................................................................................................................... 5 2.1.3 De-listing Procedure ....................................................................................................................... 6 2.1.4 Water Quality Standards for Sediment ............................................................................................ 7
2.1.4.1 Sediment Chemistry Standards ........................................................................................................................ 7 2.1.4.2 Sediment Toxicity Standards ........................................................................................................................... 9 2.1.4.3 Sediment Benthic Standards ............................................................................................................................ 9
2.1.5 Current Pollutant 303(d) Listings and TMDLs ............................................................................... 9 2.1.5.1 The General Condition of Sediment Quality within the Ports ....................................................................... 10 2.1.5.2 Sediment Chemistry Maps ............................................................................................................................ 11
2.2 Summary of Project-Specific Surface Sediment Characterization Studies (1992 – 2008) ........................ 36 2.2.1 Heavy Metals ................................................................................................................................. 38
2.2.1.1 Arsenic .......................................................................................................................................................... 38 2.2.1.2 Cadmium ....................................................................................................................................................... 39 2.2.1.3 Chromium ..................................................................................................................................................... 39 2.2.1.4 Copper ........................................................................................................................................................... 39 2.2.1.5 Lead ............................................................................................................................................................... 40 2.2.1.6 Mercury ......................................................................................................................................................... 40 2.2.1.7 Nickel ............................................................................................................................................................ 40 2.2.1.8 Zinc ............................................................................................................................................................... 40
2.2.2 Organic Chemicals ........................................................................................................................ 40 2.2.2.1 Tributyltin (TBT) .......................................................................................................................................... 40 2.2.2.2 Total Detectable PCBs .................................................................................................................................. 40 2.2.2.3 Total Detectable PAHs .................................................................................................................................. 41 2.2.2.4 Total Detectable DDTs .................................................................................................................................. 41 2.2.2.5 Total Chlordane ............................................................................................................................................. 41
2.3 Primary Literature Review of Relevant Long Beach Harbor Sediment Studies ....................................... 55 2.4 Future Remediation Areas ........................................................................................................................ 57
2.4.1 Installation Restoration Site 7 ....................................................................................................... 57 2.4.2 Middle Harbor Redevelopment Project ......................................................................................... 59
2.5 Issues Associated with Evaluating Large Sediment Chemistry Datasets .................................................. 60 2.5.1 Analytical Issues ............................................................................................................................ 60 2.5.2 Physical Factors ............................................................................................................................ 61
2.6 Analytical Data Gaps in LB Harbor .......................................................................................................... 61 2.6.1 Emerging Substances of Concern .................................................................................................. 61 2.6.2 Other Pollutant Data Gaps ........................................................................................................... 62
3.0 REFERENCES ............................................................................................................................. 63

SUMMARY OF SEDIMENT QUALITY CONDITIONS IN THE PORT OF LONG BEACH May 2009
WESTON Solutions, Inc. ii
LIST OF TABLES Table 1. Minimum number of measured exceedances needed to place a water segment on the
Section 303(d) list for toxicants (reproduced from SWRCB 2004, Table 3.1) ................................ 6 Table 2. Maximum Number of Measured Exceedances Allowable to Remove a Water Segment
from the §303(d) List (reproduced from SWRCB 2004, Table 4.2) ................................................ 7 Table 3. Marine Sediment Quality 303(d) Listing Guidelines ...................................................................... 8 Table 4. 2006 Section 303(d) List of Water Quality Limited Segments Requiring Pollutant-
Specific TMDLs ............................................................................................................................ 10 Table 5. The Range of Concentrations and Total Exceedances of Sediment Quality Guidelines for
Surface Sediment Collected as Part of Numerous Studies from LB Harbor (1992 – 2008) .......... 39 Table 6. The Range of Concentrations and Total Exceedances of Sediment Quality Guidelines for
Surface Sediment Collected and Analyzed by Chen and Lu (1974) .............................................. 56 Table 7. The Range of Concentrations and Total Exceedances of Sediment Quality Guidelines for
Surface Sediment Collected from IR Site 7 AOEC A and C ......................................................... 59
LIST OF FIGURES Figure 1. Dredge and Fill Areas within Long Beach Harbor ........................................................................ 4 Figure 2. Los Angles/Long Beach Harbors surface sediment site specific and monitoring copper
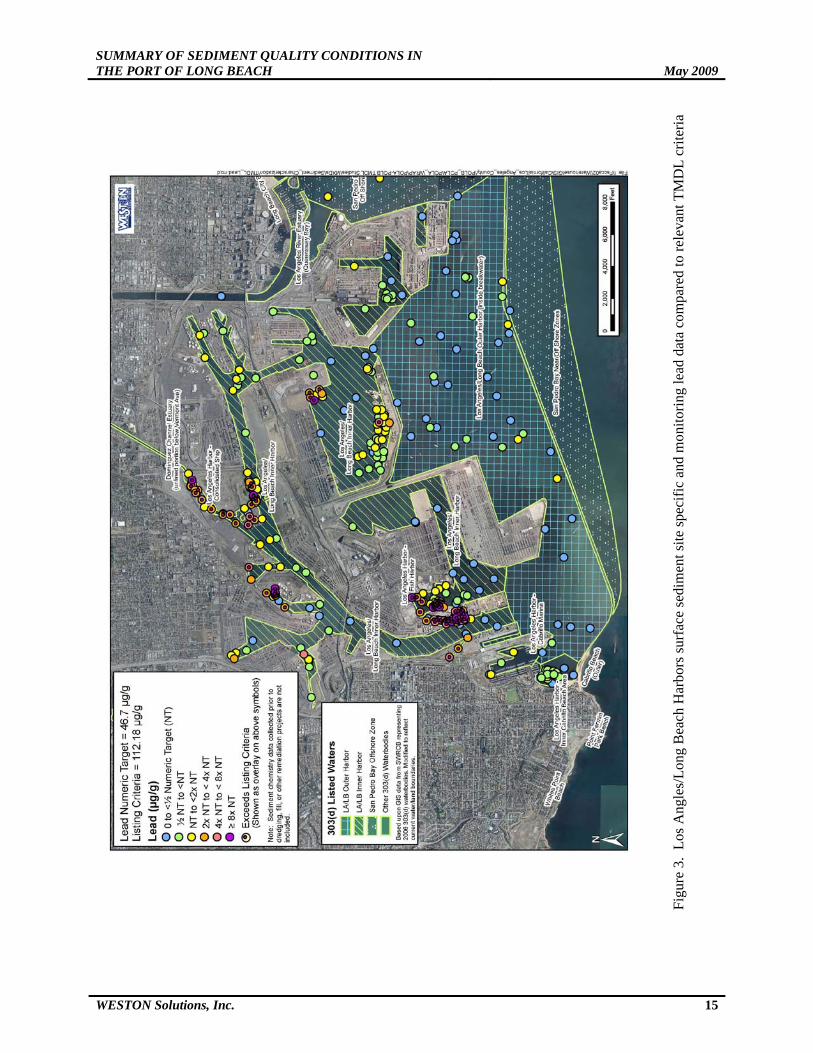
data compared to relevant TMDL criteria ...................................................................................... 14 Figure 3. Los Angles/Long Beach Harbors surface sediment site specific and monitoring lead
data compared to relevant TMDL criteria ...................................................................................... 15 Figure 4. Los Angles/Long Beach Harbors surface sediment site specific and monitoring mercury
data compared to relevant TMDL criteria ...................................................................................... 16 Figure 5. Los Angles/Long Beach Harbors surface sediment site specific and monitoring zinc
data compared to relevant TMDL criteria ...................................................................................... 17 Figure 6. Los Angles/Long Beach Harbors surface sediment site specific and monitoring silver
data compared to relevant TMDL criteria ...................................................................................... 18 Figure 7. Los Angles/Long Beach Harbors surface sediment site specific and monitoring
chlordane data compared to relevant TMDL criteria ..................................................................... 19 Figure 8. Los Angles/Long Beach Harbors surface sediment site specific and monitoring DDT
data compared to relevant TMDL criteria ...................................................................................... 20 Figure 9. Los Angles/Long Beach Harbors surface sediment site specific and monitoring PCB
data compared to relevant TMDL criteria ...................................................................................... 21 Figure 10. Los Angles/Long Beach Harbors surface sediment site specific and monitoring
benza[a]anthracene data compared to relevant TMDL criteria ...................................................... 22 Figure 11. Los Angles/Long Beach Harbors surface sediment site specific and monitoring
phenanthrene data compared to relevant TMDL criteria ............................................................... 23 Figure 12. Los Angles/Long Beach Harbors surface sediment monitoring (randomized studies)
copper data compared to relevant TMDL criteria .......................................................................... 25 Figure 13. Los Angles/Long Beach Harbors surface sediment monitoring (randomized studies)
lead data compared to relevant TMDL criteria .............................................................................. 26 Figure 14. Los Angles/Long Beach Harbors surface sediment monitoring (randomized studies)
mercury data compared to relevant TMDL criteria ....................................................................... 27 Figure 15. Los Angles/Long Beach Harbors surface sediment monitoring (randomized studies)
zinc data compared to relevant TMDL criteria .............................................................................. 28 Figure 16. Los Angles/Long Beach Harbors surface sediment monitoring (randomized studies)
silver data compared to relevant TMDL criteria ............................................................................ 29 Figure 17. Los Angles/Long Beach Harbors surface sediment monitoring (randomized studies)
chlordane data compared to relevant TMDL criteria ..................................................................... 30

SUMMARY OF SEDIMENT QUALITY CONDITIONS IN THE PORT OF LONG BEACH May 2009
WESTON Solutions, Inc. iii
Figure 18. Los Angles/Long Beach Harbors surface sediment monitoring (randomized studies) DDT data compared to relevant TMDL criteria ............................................................................ 31
Figure 19. Los Angles/Long Beach Harbors surface sediment monitoring (randomized studies) PCB data compared to relevant TMDL criteria ............................................................................. 32
Figure 20. Los Angles/Long Beach Harbors surface sediment monitoring (randomized studies) benza[a]anthracene data compared to relevant TMDL criteria ...................................................... 33
Figure 21. Los Angles/Long Beach Harbors surface sediment monitoring (randomized studies) phenanthrene data compared to relevant TMDL criteria ............................................................... 34
Figure 22. Locations of 63 Stations Associated with Sediment Chemical Characterization Studies ......... 37 Figure 23. Concentrations of Arsenic in Surficial Sediment Samples Collected in LB Harbor from
1992 – 2008 as Part of Sediment Characterization Studies ........................................................... 42 Figure 24. Concentrations of Cadmium in Surficial Sediment Samples Collected in LB Harbor
from 1992 – 2008 as Part of Sediment Characterization Studies .................................................. 43 Figure 25. Concentrations of Chromium in Surficial Sediment Samples Collected in LB Harbor
from 1992 – 2008 as Part of Sediment Characterization Studies .................................................. 44 Figure 26. Concentrations of Copper in Surficial Sediment Samples Collected in LB Harbor from
1992 – 2008 as Part of Sediment Characterization Studies ........................................................... 45 Figure 27. Concentrations of Lead in Surficial Sediment Samples Collected in LB Harbor from
1992 – 2008 as Part of Sediment Characterization Studies ........................................................... 46 Figure 28. Concentrations of Mercury in Surficial Sediment Samples Collected in LB Harbor
from 1992 – 2008 as Part of Sediment Characterization Studies .................................................. 47 Figure 29. Concentrations of Nickel in Surficial Sediment Samples Collected in LB Harbor from
1992 – 2008 as Part of Sediment Characterization Studies ........................................................... 48 Figure 30. Concentrations of Zinc in Surficial Sediment Samples Collected in LB Harbor from
1992 – 2008 as Part of Sediment Characterization Studies ........................................................... 49 Figure 31. Concentrations of Tributyltin in Surficial Sediment Samples Collected in LB Harbor
from 1992 – 2008 as Part of Sediment Characterization Studies ................................................... 50 Figure 32. Concentrations of Total Detectable PCBs in Surficial Sediment Samples Collected in
LB Harbor from 1992 – 2008 as Part of Sediment Characterization Studies ................................ 51 Figure 33. Concentrations of Total Detectable PAHs in Surficial Sediment Samples Collected in
LB Harbor from 1992 – 2008 as Part of Sediment Characterization Studies ................................ 52 Figure 34. Concentrations of Total Detectable DDTs in Surficial Sediment Samples Collected in
LB Harbor from 1992 – 2008 as Part of Sediment Characterization Studies ................................ 53 Figure 35. Concentrations of Chlordane in Surficial Sediment Samples Collected in LB Harbor
from 1992– 2008 as Part of Sediment Characterization Studies .................................................... 54 Figure 36. Sediment Sampling Stations within the Installation Restoration Site 7 Project Area ............... 58

SUMMARY OF SEDIMENT QUALITY CONDITIONS IN THE PORT OF LONG BEACH May 2009
WESTON Solutions, Inc. iv
ACRONYMS AND ABBREVIATIONS AOEC area of ecological concernARCO Atlantic Richfield CompanyBasin Plan California Water Quality Control Plan, Los Angeles Region BP British Petroleum BPTCP Bay Protection and Toxic Cleanup ProgramCal EPA California Environmental Protection Agency CCR California Code of RegulationsCTR California Toxics RuleCFR code of federal regulations DDT dichlorodiphenyltrichloroethaneEIR/EIS environmental impact report/environmental impact statementER-L effects range-low ER-M effects range-medianGFAA graphite furnace atomic absorptionHMW high molecular weight ICPMS inductively coupled plasma mass spectrometryIR installation restorationLA Los Angeles LB Long Beach LIFOC Lease in Furtherance of ConveyanceLMW low molecular weight LOEC lowest observable effects concentrationMDL method detection limitND non-detect OTC over-the-counter pH hydrogen ion potentialPAHs polycyclic aromatic hydrocarbons PBDE polybrominated diphenyl etherPCBs polychlorinated biphenylsPCDD polychlorinated dibenzo dioxin PCDF polychlorinated dibenzo furanPEL probable effects levelPFOA perfluorooctanoic acid PFOS perfluorooctane sulfonic acid Policy California §303(d) Listing PolicyPOLB Port of Long Beach PRG preliminary remediation goalQA/QC quality assurance/quality controlRWQCB Regional Water Quality Control Board RWQCB-LA Regional Water Quality Control Board, Los AngelesSCCWRP Southern California Coastal Water Research ProjectSQG sediment quality guideline SQOs sediment quality objectiveSWRCB State Water Resources Control BoardTBT tributyltin TCDD tetrachlorodibenzo-p-dioxinTIE toxicity identification evaluationTMDL total maximum daily load TTLC total threshold limit concentrationUSEPA United States Environmental Protection AgencyWEMAP Western Environmental Monitoring and Assessment Program WESTON Weston Solutions, Inc.

SUMMARY OF SEDIMENT QUALITY CONDITIONS IN THE PORT OF LONG BEACH May 2009
WESTON Solutions, Inc. v
WQLS Water-Quality Limited SegmentWRAP Water Resources Action Plan
UNITS OF MEASURE ºC degrees Celsius cm centimeter m3 cubic meter cy cubic yard ft feet or foot HA hectares in inches km kilometer L liter mi mile µg/kg microgram per kilogram µg/L microgram per liter mg/kg milligram per kilogram mg/L milligram per liter mL milliliter ng/kg nanogram per kilogram

SUMMARY OF SEDIMENT QUALITY CONDITIONS IN THE PORT OF LONG BEACH May 2009
WESTON Solutions, Inc. 1
1.0 INTRODUCTION 1.1 Land Uses and Possible Sources of Sediment Chemical Contamination
in Long Beach Harbor Since it’s foundation in 1911, there has been a diversity of land uses in the Port of Long Beach (POLB) and throughout the Dominguez and Los Angeles (LA) River Watersheds that may have contributed to historical and/or present chemical contamination of Long Beach (LB) Harbor sediment. Historically, in addition to shipping operations, major land uses in POLB included oil production, shipbuilding, commercial fish canneries, and naval activities. Shipbuilding started in Long Beach in 1907, when Craig Shipbuilding relocated from Toledo, Ohio. During World War I, ship building advanced with Craig Shipbuilding and Long Beach Shipbuilding Company jointly operating several shipyards to meet the demands of war (White, 2009). In 1940, the U.S. Navy purchased 119 acres of land on Terminal Island, establishing a naval station including a large shipyard. During World War II, ship repairs were the largest activity at the naval station. The naval shipyard performed structural, sheetmetal, boiler, rigging, electronics, electrical, insulating, ordnance, sandblasting, welding, machining, woodworking, painting, pipe fitting, and other repair services (California State Military Department, 2008). In 1997, the naval shipyard closed. Over 50 years of industrial naval activities have contributed to significant contamination of harbor sediment in West Basin. Prior to the U.S. Navy’s presence on Terminal Island, this area was used by commercial fishing operations. In the 1930’s, canneries located on Terminal Island included South Pacific Canning Company and the Long Beach Tuna Canning Company (currently Chicken of the Sea) (White, 2009). In 1938, the first oil well was drilled in LB Harbor. During World War II, oil production was non-stop with over 125 wells located in POLB. Today, oil remains important cargo; however, most of the crude oil originates in Alaska. Atlantic Richfield Company (ARCO), British Petroleum (BP), and Shell currently operate in POLB. In addition to land uses on POLB facilities, historical residential, commercial, and industrial land uses adjacent to both Dominguez Channel and the LA River have contributed to contamination as discussed in Section 1.2 below. Today, POLB is the second busiest port in the United States. It encompasses approximately 1,295 HA (3,200 acres), containing 80 deepwater berths, 10 piers, and 71 post-panamax gantry cranes. Cargo includes containerized, Roll On-Roll Off (i.e. automobiles), liquid bulk, dry bulk, and break bulk. Liquid bulk includes crude oil, petroleum products, vegetable oil, and ethanol. Dry bulk includes gypsum, coal, sodium sulfate, concentrates, cement, borax, petroleum coke, potash, prilled sulfur, and salt. Break bulk includes food products, lumber, steel, recyclable metal, and machinery. Current and historical activities occurring on POLB facilities involving the handling, transport, and processing of this cargo may have some relationship to chemical contamination in LB Harbor sediment. Commercial activities in POLB (i.e. cruise lines) and businesses accommodating recreational activities in POLB (i.e., Pierpoint Landing sport fishing operations) also may contribute to contamination in LB Harbor through the storage and release of waste materials (i.e. fuels). Similar types of activities occurring throughout the Dominguez and LA River Watersheds also may contribute to LB Harbor sediment contamination. Chemicals associated with past and present land use activities in LB Harbor and throughout the Dominguez and LA River Watersheds (discussed in Section 1.2) may have been released into the environment through accidental release (i.e., leaks, spills, storm water runoff) or intentional discharges. At shipbuilding and repair shops, possible sources of contamination are metals, polychlorinated biphenyls (PCBs), polycyclic aromatic hydrocarbons (PAHs), and organotins associated with paints, solvents used to remove paints, and oil-based products used to operate heavy machinery (Mesa Environmental Services, 1998; Black Rock Geosciences, 2002). In areas where liquid bulk products are stored and transported, contamination may have resulted from leakage of petroleum, fuels, or chemicals from holding tanks or spills during transfer (Tetra Tech, 1994a; Tetra Tech, 1994b). Similarly, accidental release of bulk products during transport and handling at POLB facilities are also possible sources of contamination.

SUMMARY OF SEDIMENT QUALITY CONDITIONS IN THE PORT OF LONG BEACH May 2009
WESTON Solutions, Inc. 2
Other activities in LB Harbor that may contribute to contamination include oil spillage from vessels, boat waste discharges, hazardous waste storage, and the fragmentation of metal from vessels. In addition, other historical industrial land uses on POLB facilities (i.e., battery disposal) are also possible sources of contamination. 1.2 Physical Pathways for Chemical Distribution and Deposition into Long
Beach Harbor Numerous physical mechanisms contribute to the fate, transport, and ultimately deposition of chemical constituents into LB Harbor sediments. Many of these are discussed in detail as part of the Water Resources Action Plan (WRAP) being generated for POLB and therefore, they are only briefly summarized here. During storm events water may flow directly off of impervious surfaces within POLB, thereby transporting chemical-bound particles or freely dissolved chemicals (i.e., oil) into the Harbor. The majority of outfalls within the Harbor discharge runoff originating from the industrial areas within POLB; however, four outfalls (fed by pump stations) discharge stormwater originating from the City of Long Beach. All four of these outfalls are located in Cerritos Channel. Another significant source of contamination into LB Harbor includes inflows from the LA River and Dominguez Channel. Over the last century, residential, commercial, and industrial land uses adjacent to both Dominguez Channel and the LA River have contributed to contamination derived from sources such as permitted discharges, nonpoint source runoff, atmospheric deposition from nearby industries, and illicit dumping of wastes. The LA River drains a land area of over 2,135 km2 (834 mi2) from the eastern portions of Santa Monica Mountains, and Simi Hills to the San Gabriel Mountains in the west. More than half of this watershed is highly developed and encompasses land uses which influence water quality of the LA River or its eight major tributaries. As a consequence of these activities, there are water quality impairments due to pH, ammonia, metals, coliforms, trash, scum, algae, oil, pesticides, volatile organics, and sediment. The LA River discharges to the east side of LB Harbor; plume and sediment transport modeling predict the area of influence to include the entire San Pedro Bay and the southern portions of POLB. During large storm events, high levels of suspended solids and associated chemical constituents are transported down the LA River, which mixes with seawater within San Pedro Bay (Long Beach Harbor District and the City of Long Beach District) and as a consequence of the breakwater flows in part into the outer portion of LB Harbor, dispersing suspended particulates into this area. The Dominguez Watershed is a 110-square mile area that includes portions of the southern part of the City of Los Angeles, much of the cities of Lomita, Carson, Gardena, Inglewood, Hawthorne, Lawndale, and Torrance, and portions of the South Bay cities, the Palos Verdes peninsula, and the City of Long Beach. Similar to the LA River, point and nonpoint source pollution over the last century has been released into the Dominguez Channel from the surrounding residential and industrial areas. The Dominguez Channel discharges into LA and LB Harbors via the Consolidated Slip. Storm water runoff entering the harbor through the Dominguez Channel, particularly after the first rain of the season, is a potentially significant source of contamination as a consequence of elevated levels of suspended solids and associated chemical constituents. During large storm events, plume and sediment transport modeling predict fresh water flows from the Dominguez Channel discharge into Cerritos Channel, distributing suspended solids and contaminants into LB Harbor prior to deposition. Another significant source of sediment contamination in the Harbor is via atmospheric deposition of particles, particularly those greater than 10 microns (4 x 10⁻⁴ in; Stolzenback et al., 2001). Specifically, the large particulates generated through a variety of mechanisms at POLB and throughout the South Coast Air Basin may be transported and deposited in LB Harbor. The use of cars, trucks, buses, and heavy equipment (e.g. diesel engines, locomotives, and marine vessels) are known to release products of incomplete combustion (i.e., PAHs, vanadium, nickel, etc.; [Poor, 2002]). Industrial activities such as mechanical generation of particles resulting from grinding, braking, maintenance operations,

SUMMARY OF SEDIMENT QUALITY CONDITIONS IN THE PORT OF LONG BEACH May 2009
WESTON Solutions, Inc. 3
sandblasting, welding, and painting may potentially result in the creation of fugitive dust and release of particulates to the atmosphere. These particulates may be comprised of carbon, nitrates, sulfates, organic chemicals, metals, and other materials. Once in the atmosphere, particles are transported by the wind and deposited directly into LB Harbor or indirectly into LB Harbor through the watershed. There are similarities in management programs and differences in the pathways through which stormwater contaminants are released into the Ports of Los Angeles (POLA) and POLB. As a consequence of the discharge associated with storm drains, both Ports have existing programs to manage storm water discharges from industrial operations and construction projects, as regulated under the State of California General Industrial and General Construction Programs. However, storm water conveyance systems in POLA that discharge during both dry weather and rain events have the potential to deliver large volumes of freshwater and associated contaminants and are another major vehicle through which contaminants are released into LA Harbor. The Dominguez Channel, Gaffey Channel, and several major storm drains also discharge from Wilmington and San Pedro community into LA Harbor. The ongoing discharge of dry weather flows from channels and major storm drain conveyance systems have the potential to contribute waterborne contaminants throughout the year and may be greater than wet weather loadings. In POLB, there are smaller storm drain systems and no major channels or conveyance systems discharging directly into LB Harbor. The ultimate source abatement or mitigation activities undertaken to reduce contaminant discharges from stormwater conveyance systems may be different in the two Ports based on the dry weather and wet weather loadings. 1.3 Data Selection Process The purpose of this review is to provide an overview of POLB’s surface sediment condition based on all surface sediment characterization and monitoring studies from 1987 to 2008. These studies include surficial sediment chemistry data sampled as part of large monitoring programs including the Bay Protection and Toxic Cleanup Program (BPTCP) conducted from 1992-1997 (BPTCP, 2008), Western Environmental Monitoring and Assessment Program (WEMAP, 1999), Environmental Monitoring and Assessment Program (EMAP, 2005), Southern California Bight Monitoring conducted in 1994, 1998, and 2003 (Southern California Coastal Water Research Project [SCCWRP], 1996; 2003; 2007), a separate SCCWRP study called PV88 (Anderson et al., 1988), 2006 Port TMDL Support Study (Weston Solutions, Inc. [WESTON], 2007a), and sediment characterization studies conducted on behalf of the U.S. Navy (Long Beach Naval Station Feasibility Study in 1998 [Bechtel, 2003]) and POLB (WESTON, 2007b). All references associated with the data summarized in this report are provided in the reference section below (Section 3.0). It should be noted that sediment chemistry data collected in areas where dredging, fill, or remediation activities has since occurred was not included in this data set because it no longer represents the current surficial sediment condition in LB Harbor. To determine relevant data to include in this review, all surface sampling stations were overlain with dredge, fill, and remediation areas within LB Harbor. If the station was located in a dredge area and dredging occurred subsequent to sample collection, the station was eliminated. In addition, if the station was located in a fill area, the station was eliminated. Figure 1 depicts the location of dredge and fill areas in LB Harbor. Only surface sediment chemistry is summarized in this review of sediment quality conditions because unlike subsurface sediment, surface sediment has the potential to contribute to the concentrations of pollutants in the water column and is likely to be bioavailable to benthic organisms that inhabit this biologically active layer. Sediment collected as part of dredged material evaluations was also not included because the sediment was removed and therefore no longer represents the current condition.

SUMMARY OF SEDIMENT QUALITY CONDITIONS IN THE PORT OF LONG BEACH May 2009
WESTON Solutions, Inc. 4
Figure 1. Dredge and Fill Areas within Long Beach Harbor

SUMMARY OF SEDIMENT QUALITY CONDITIONS IN THE PORT OF LONG BEACH May 2009
WESTON Solutions, Inc. 5
2.0 DISTRIBUTION AND MAGNITUDE OF CHEMICALS IN LONG BEACH HARBOR SEDIMENTS
2.1 Water Quality Standards: Total Daily Maximum Loads 2.1.1 Introduction TMDLs are being developed for Los Angeles/Long Beach Harbor to control inputs of water quality contaminants via stormwater and the continued input to the harbors of waterborne contaminants from non-point sources such as land uses inside and outside the harbors, aerial deposition, and vessel activities. The TMDLs will also address the presence of legacy sediment contaminants that have prompted Section 303(d) listings. As described in Section 2.1, Section 303(d) of the CWA requires states to develop a list of bodies of water that are impaired according to the listing criteria. Listings can be made on the basis of water, sediment, tissue, and/or biological factors such as toxicity and benthic community structure. By placing a water body on the Section 303(d) list, the state identifies it as “Water-Quality Limited Segment” (WQLS). Once a water body is identified as WQLS, it is assumed that it will always need additional limitations beyond technology-based controls. These limitations usually take the form of TMDLs. A TMDL establishes a maximum limit for a specific pollutant that can be discharged into a waterbody without causing it to become impaired. The regulatory agencies have expanded their evaluation of attainment of water quality standards to include consideration of contaminant movement through water to or from other media, and in the coastal marine environment of the harbors “other media” includes sediment and biota. The California Water Quality Control Plan, Los Angeles Region (Basin Plan), sets standards for surface waters, sediments, and tissues (where relevant). These standards are comprised of designated beneficial uses and the numeric and narrative objectives necessary to support those beneficial uses. 2.1.2 Listing Procedures Water quality listing criteria are used as a measure to define whether a water body is in exceedance for specific pollutants in one or more of the media. The criteria are based upon the concentrations of the various pollutants that are expected to cause impacts to water quality. A water body becomes Section 303(d) listed for a pollutant if a specific percentage of all the samples exceed the listing criteria. According to the State Water Resources Control Board (SWRCB), if approximately 15% of the samples in any medium exceed the listing criteria for that medium, the whole water body is listed for that pollutant (SWRCB, 2004; Table 1). TMDL-specific numeric targets are set for each medium at levels that will ensure the water body will meet the water quality necessary to support all beneficial uses. Note that there are no impairments listed for the Los Angeles/Long Beach Harbor based on water column chemistry; all 303(d) listings in the harbor are based upon sediment chemistry, fish tissue, and benthic organisms. At this point, the Los Angeles Harbor/Inner Cabrillo Beach Bacteria TMDLs, the Los Angeles River Metals TMDLs, and the Machado Lake Nutrients TMDLs have been completed by the State of California and approved by EPA. The Los Angeles River Bacteria TMDLs have not been completed nor approved by the SWRCB; they are still in development and the public review draft is scheduled for early 2010. The Dominguez Channel and greater Los Angeles/Long Beach Harbor Toxics TMDLs are still in development; the public review draft is scheduled for 2009.

SUMMARY OF SEDIMENT QUALITY CONDITIONS IN THE PORT OF LONG BEACH May 2009
WESTON Solutions, Inc. 6
Table 1. Minimum number of measured exceedances needed to place a water segment on the Section 303(d) list for toxicants (reproduced from SWRCB 2004, Table 3.1)
Sample Size List if the Number of Exceedances is Equal or is Greater Than2 From To
21 24 225 36 3 37 47 4 48 59 5 60 71 6 72 82 7 83 94 8 95 106 9
107 117 10 118 129 11
1 Recommended minimum sample size is 16. 2 Compared to Listing Criteria.
Listings are based on all available data and the listing criteria recommend a minimum number of samples needed to support a listing. The spatial extent of area evaluated used to support the listing is not considered. For example, all samples with exceedances could be in a small area within a larger waterbody. 2.1.3 De-listing Procedure The process for removing a waterbody from the §303(d) List in California is summarized in the Water Quality Control Policy for Developing California’s Clean Water Act §303(d) List (SWRCB, 2004). Listing criteria are used to list a pollutant on the§303(d) list and the attainment of “numeric targets” are used to de-list a pollutant. Segments can also be de-listed by demonstrating inappropriate information was used to list specific pollutants in the waterbody. For example, data contained errors or data were insufficient quantity or quality. Prior to 2004, the Regional Water Quality Control Boards (RWQCB) did not commonly evaluate numeric information using statistical procedures in making §303(d) listing decisions. For the 2004-2006 list development, the SWRCB established a state-wide policy governing how listing decisions were to be made (SWRCB, 2004). The California §303(d) listing policy (Policy) requires that the RWQCBs base §303(d) recommendations on valid statistical procedures for analysis of numeric water quality data. Procedures were presented in the Policy for establishing hypotheses to be tested, sampling design, numeric analyses, and statistical testing. By establishing better-defined criteria, the Policy was established to increase confidence in §303(d) decision making, allow quantification of the level of assurance (i.e., that decisions are correct), and follow standard scientific protocols for decision-making based on numeric information.

SUMMARY OF SEDIMENT QUALITY CONDITIONS IN THE PORT OF LONG BEACH May 2009
WESTON Solutions, Inc. 7
Table 2. Maximum Number of Measured Exceedances Allowable to Remove a Water Segment from the
§303(d) List (reproduced from SWRCB 2004, Table 4.2)
Sample Size Maximum number of exceedances allowable
for de-listing From To
261 30 4 31 36 5 37 42 6 43 48 7 49 54 8 55 60 9 61 66 10 67 72 11 73 78 12 79 84 13 85 91 14 92 97 15 98 103 16
104 109 17 110 115 18 116 121 19
1 The minimum sample size for de-listing consideration identified by the SWRCB (2004) is 26. 2.1.4 Water Quality Standards for Sediment This section includes a discussion of sediment chemistry, sediment toxicity, and benthic community effects used to develop TMDLs. Assessments of contaminant related impacts in marine environments often include chemical, toxicological, and biological evaluations in order to determine contaminant-related impacts by determining if (1) contaminants are present within the sediment, (2) the sediment is toxic, and (3) the benthic community has been impacted by contaminants by examining alterations in the community structure. Therefore, sediment quality can be defined by this triad of indicators; chemistry, toxicity, and benthic community. When listings are generated based on contaminant concentrations, there are often listings for toxicity and benthic community effects. 2.1.4.1 Sediment Chemistry Standards
At the present time, there are no promulgated sediment standards. However, the SWRCB is developing Sediment Quality Objectives (SQOs) to characterize sediments in enclosed bays and estuaries that will likely be incorporated into listing policy. Phase I (direct effects) SQOs have been approved by the State Board and Office of Administrative Law and are currently being reviewed by the EPA. Once approved, the SQOs will be sent to RWQCBs for incorporation into Basin Plans. The Phase I SQOs are based on a multiple-lines-of-evidence approach in which the lines of evidence are sediment toxicity, sediment chemistry, and benthic community condition. In the absence of promulgated standards, sediment quality is evaluated by comparing concentrations found in the sediments to published benchmark values, such as the 303(d) listing criteria presented in Table 3.

SUMMARY OF SEDIMENT QUALITY CONDITIONS IN THE PORT OF LONG BEACH May 2009
WESTON Solutions, Inc. 8
Table 3. Marine Sediment Quality 303(d) Listing Guidelines
Analyte Listing Criterion Numeric Targets Units
Cadmium 4.21 1.2 ppm
Copper 270 34 ppm
Chromium 370 not established ppm
Lead 112.18 46.7 ppm
Silver 1.77 1 ppm
Zinc 410 150 ppm
Mercury 2.61 0.15 ppm
Chlordane 6 0.5 ppb
Dieldrin 8 not established ppb
Total DDT 590 1.58 ppb
Total PCBs 400 22.7 ppb
Total PAHs 180000 4022 ppb
Total HMW PAHs not established 1700 ppb
Total LMW PAHs 1442 not established ppb
Benza[a]anthracene 692.53 261 ppb
2-methyl-napthalene 201.28 not established ppb
Benzo[a]pyrene 763.22 430 ppb
Chrysene not established 384 ppb
Dibenz[a,h]anthracene not established 260 ppb
Phenanthrene 543.53 240 ppb
Pyrene not established 665 ppb
Toxaphene not established 10 ppb
Source: Table adapted from the Functional Equivalent Document [SWRCB and Cal EPA, 2004 Table 12] and the Draft Problem Statement [LA RWQCB and USEPA Region IX, 2008, Table 3-2])
Unit equivelents: ug/g = ppm; ng/g = ppb Current TMDL guidance uses several different sediment quality guidelines as threshold values for sediment related impacts. For many of the “listing criteria” values, Effects Range-Median (ER-M) values and Probable Effects Levels (PELs) are used, while many of the numeric targets are Effects Range-Low (ER-L) values. Recently, State Sediment Quality Objectives have been developed using the weight of evidence approach by the integration of sediment toxicity, chemistry, and benthic health. Other tools, such as sediment toxicity identification evaluations (TIEs) are available to demonstrate causal relationships between the benthic community and contaminants of concern. It is anticipated that these tools will be used in the listing and delisting procedures in the near future.

SUMMARY OF SEDIMENT QUALITY CONDITIONS IN THE PORT OF LONG BEACH May 2009
WESTON Solutions, Inc. 9
2.1.4.2 Sediment Toxicity Standards
The Basin Plan includes a narrative toxicity objective which states, in part: “All Waters shall be maintained free of toxic substances in concentrations that are toxic to, or that produce detrimental physiological responses in, human, plant, animal, or aquatic life.” Toxic substances, like those listed in the table above, will elicit toxic responses in test organisms if the concentrations are elevated enough to interfere with cellular processes, the whole organism, or population. To determine if toxic substances are at concentrations in sediment that produce detrimental physiological responses to benthic organisms, sediment toxicity tests are conducted. Toxicity is measured by exposing standardized organisms to test sediments for specified times, following prescriptive procedures detailed in testing protocols. Toxicity is observed when there is an adverse effect or decrease in survival of an organism after exposure to the test sediments. A numeric sediment toxicity target of no observable sediment toxicity has been established (LA RWQCB, 1995). Sediment toxicity is observed when standardized tests result in: 1) a statistically significant difference (p < 0.05) in mean organism response (e.g., percent survival) between a sample and the control, and 2) the mean organism response in the toxicity test is less than 90 % survival. 2.1.4.3 Sediment Benthic Standards
Patterns of distribution of benthic species are used to determine if toxic substances are at concentrations in sediment that affect the community structure. Benthic organisms are considered good indicators of sediment quality because these organisms live within the sediments where they are directly exposed to contaminants through ingestion, burrowing, and respiration. These organisms are often the base of food chains and are therefore considered important to ecosystem health. Benthic community impacts are determined by examining the types of organisms that are living in the sediment. For example, the number of species, the presence of pollution-tolerant organisms, and the absence of pollution sensitive organisms are indicators of poor benthic health. 2.1.5 Current Pollutant 303(d) Listings and TMDLs Specific water bodies within the Ports’ jurisdiction were identified as impaired for several pollutants on the most recent (2006) California Section 303(d) list (LA RWQCB, 2007). The list for the Dominguez Channel estuary and Los Angeles/Long Beach Harbor waters is the basis of the TMDLs. Recently, the LA RWQCB and EPA developed a draft TMDL problem statement (LA RWQCB and EPA Region IX, 2008) which incorporates some newer data and recommends additions and deletions to the original list; the modified list is provided in Table 4. TMDLs will be developed for 303(d) listed and new impairment findings, unless the problem statement provides conclusions of non-impairment for specific waterbody-pollutant combinations. The Ports assume that the 303(d) List will be modified to reflect the problem statement.

SUMMARY OF SEDIMENT QUALITY CONDITIONS IN THE PORT OF LONG BEACH May 2009
WESTON Solutions, Inc. 10
Table 4. 2006 Section 303(d) List of Water Quality Limited Segments Requiring Pollutant-
Specific TMDLs
Water Body Pollutants Requiring TMDL (Sediment and/or Tissue)
Other Impairments
Los Angeles/Long Beach Inner Harbor
Tissue: DDT and PCBs
Sediment: Copper, Zinc, Lead, Benzo(a)pyrene, Chrysene
Benthic community effects
Los Angeles/Long Beach Outer Harbor Tissue: DDT and PCBs Toxicity
Los Ángeles Harbor –
Inner Cabrillo Beach Tissue: DDT and PCBs None
Los Angeles Harbor –
Cabrillo Marina
Tissue: DDT and PCBs
Sediment: Benzo(a)pyrene, Pyrene, Chlordane None
Los Angeles Harbor –
Fish Harbor
Tissue: DDT and PCBs
Sediment: Copper, Lead, Zinc, Chlordane, Total DDT, Total PCBs, Benzo[a]pyrene, Phenanthrene, Benza[a]anthracene, Chrysene, Pyrene, Dibenz[a,h]anthracene,
Toxicity
Los Angeles Harbor –
Consolidated Slip
Tissues: Chlordane, Dieldrin, DDT, PCBs, toxaphene
Sediment: Cadmium, Copper, Chromium, Lead, Zinc, Mercury, Chlordane, Total DDT, Total PCBs, Benzo[a]pyrene, 2-methyl-napthalene, Phenanthrene, Benza[a]anthracene, Chrysene, Pyrene
Toxicity, benthic community effects
Source: LA RWQC and EPA Region IX, 2008 and Personal Communication Peter Kozelka April 2009 2.1.5.1 The General Condition of Sediment Quality within the Ports
Activities in San Pedro Bay associated with port land uses, on-water discharges, and watershed influences have all contributed to historical and current sediment contamination. In recent decades, CWA requirements, dredging and removal of contaminated sediments, implementation of port water and sediment quality programs and studies, and port participation in key regulatory programs have resulted in a substantial improvement in sediment quality. However, most areas within Los Angeles/Long Beach Harbor are listed under CWA Section 303(d) for sediment pollutants. The overall quality of sediments within Los Angeles/Long Beach Harbor varies widely. Sediments with contaminant concentrations above relevant TMDL listing criteria are often localized in back channels (e.g., Fish Harbor), along wharf faces, and near storm water outfalls (e.g., Consolidated Slip; Figure 2). Contaminant concentrations in newly developed areas and open channel areas are typically below the listing criteria. Open-water areas, such as Cabrillo Beach and the Outer Harbor, are typically well below listing criteria. The benthic community and sediment toxicity assessments have also yielded widely varied findings that have been found to depend to a considerable degree on the analyses or test species used.

SUMMARY OF SEDIMENT QUALITY CONDITIONS IN THE PORT OF LONG BEACH May 2009
WESTON Solutions, Inc. 11
Current Condition This description of current conditions in the harbors summarizes some of the general parameters and provides additional detail on the pollutants for which the harbors are listed as impaired. As previously mentioned, the harbors are listed on the basis of sediment and tissue concentrations. Currently, sediment conditions, including chemical contaminant concentrations, benthic community health and toxicity, are driving the TMDL development. Sediment quality in the Los Angeles/Long Beach Harbor complex has been documented by numerous focused studies and monitoring efforts over the past four decades. Sediment samples have been collected for a variety of reasons, including dredge material characterization, regional monitoring, and hot spot delineation. Depending on the purpose of the study, very different scientific approaches have been used. The two major sampling strategies are 1) randomized sampling, generally used in regional monitoring and waterbody characterization, and 2) non-randomized sampling, typically used for dredge material and hot spot characterization. Both strategies can collect either surficial sediments alone at each station or a series of samples to establish a depth profile of sediment chemistry, but it is typical of regional programs to collect surface samples and of dredge and hot spot sampling to collect depth profiles. Both of these methods have been used in studies of the Los Angeles/Long Beach Harbors, as described more fully below. As is consistent with the TMDL and SQO efforts undertaken by the agencies, only surface sediment chemistry is used to describe sediment quality in Los Angeles/Long Beach Harbor. Unlike subsurface sediment, surface sediment has the potential to contribute to the concentrations of pollutants in the water column and is likely to be bioavailable to benthic organisms that inhabit this biologically active layer. Sediment data collected in support of dredging programs is not relevant to current conditions because the sediments are usually removed; accordingly, sediment data on completed dredging programs is not included in this assessment. 2.1.5.2 Sediment Chemistry Maps
Maps displaying sediment chemistry data categorized by numeric target and listing criteria for each contaminant of concern have been developed. Two sets of maps based on different data sets have been created. The first set of maps, Figure 2 through Figure 11, summarize both randomized and site specific sediment chemistry data that reflect current conditions within the harbors (see Section 1.3). The second set of maps, Figure 12 through Figure 21, summarizes only the randomized chemistry data. Randomized and Site Specific Sediment Chemistry Maps Data presented in Figure 2 through Figure 11 presents all data determined to be reflective of current conditions. These data include:
• Randomized Studies: The 1998 and 2003 Bight Programs (SCCWRP, 2003, 2007), 2006 Port TMDL study (WESTON, 2007a), EPA’s Western Environmental Monitoring and Assessment Program (WEMAP, 1999), and EPA’s Environmental Monitoring and Assessment Program (EMAP, 2005).
• Data Gap Study: A harbor-wide study was conducted in support of the WRAP in order to identify data gaps (WESTON, 2008).
• Other Studies: Data collected in both Ports as part of the Bay Protection and Toxic Cleanup Program (BPTCP, 2008) and a SCCWRP study called PV88 (Anderson et al., 1988).

SUMMARY OF SEDIMENT QUALITY CONDITIONS IN THE PORT OF LONG BEACH May 2009
WESTON Solutions, Inc. 12
• “Hot Spot” Characterizations: “Hot spot” characterization studies require a large number of sediment samples in a targeted area in order to clearly define the magnitude and extent of contamination. In POLA, these studies include sediment characterization evaluations within the vicinity of Fish Harbor, Dominguez Channel, yacht harbors, and boat maintenance facilities, (WESTON, 2005, 2006c, 2007c-h). ). In POLB, these studies include the Long Beach Naval Station Feasibility Study (Bechtel, 2003) and the Installation Restoration Site 7 Sediment Characterization Study (WESTON, 2007b).
The following summary of the contaminants by class in Los Angeles/Long Beach Harbor sediments is based upon both randomized and site specific sediment chemistry, as presented in Figure 2 through Figure 11. Metals Copper, lead, mercury, and zinc (Figure 2 through Figure 5) are metals of concern within the harbors, several areas of which are listed as impaired for all four metals (Table 4). These metals are often elevated in localized areas related to specific activities, such as marinas and boat repair yards (e.g. Figure 2 illustrates elevated copper in localized areas). During sediment characterization studies conducted in these localized areas, concentrations of copper and mercury greater than the regulatory limits or total threshold limit concentration (TTLC) have been measured in surface sediment in Los Angeles Harbor, and concentrations greater than the effects-range median (ER-M) sediment quality guideline have been measured in the Long Beach West Basin. Lead and zinc (Figure 3 and Figure 5) were present at concentrations exceeding the 303(d) listing criteria. However, only one sample out of over 100 analyzed, exceeded the 303 (d) listing criteria for both lead and zinc. Los Angeles/Long Beach Harbor is not listed for silver (Figure 6), but that metal is widespread throughout the inner and outer harbors at concentrations that exceed the listing criterion. Silver Based on five data points in the Outer Harbor, silver may be considered for §303(d) listing in the Los Angeles/Long Beach Outer Harbor; however, these data are not consistent with all other data collected in the Outer Harbor waterbody and should not be used alone to determine potential for listing. The five samples found to be elevated in silver in Outer Harbor sediment are all from one study (Bight ’98 [SCCWRP, 2003]), conducted during one year (1998), and analyzed by one analytical laboratory. This data set is the oldest data included in this evaluation. All other data collected after 1998, from four studies in which Outer Harbor sediment was assessed, demonstrate that silver concentrations are below the listing criteria. The methods and detection limits are different in the Bight ‘98 Outer Harbor data set than in the other studies. The method used in the Bight ’98 Outer Harbor data set to detect and quantify silver (graphite furnace atomic absorption [GFAA]) was different than in the other Outer Harbor studies (inductively coupled plasma mass spectrometry [ICPMS]). Method detection limits (MDLs) for the Bight ’98 samples were higher (MDL = 0.2 ppm) than all other studies conducted (MDL = 0.008 – 0.04 ppm)1. Differences in MDLs are directly related to the sensitivity of the method (and associated instrument) used to detect and quantify an analyte. This indicates that the samples analyzed in Outer Harbor as part of the Bight ’98 program had a lower sensitivity (i.e., detection limits for silver were 5 to 25 times higher) than those laboratories used to quantify silver for other studies conducted since 1998 (WEMAP, 1999; Bight ’03 [SCCWRP, 2007]; WESTON, 2005, 2006, 2007 [numerous studies]). All other data from the four studies in which Outer Harbor sediment was assessed (ICPMS) demonstrate that silver concentrations are relatively low. Furthermore, silver data from 14 different studies over the last 10 years indicate relatively low concentrations of silver in Los Angeles/Long Beach Harbors area.
1 MDL data was not available for all projects in the Contaminated Sediment Task Force (CSTF, 2003) database

SUMMARY OF SEDIMENT QUALITY CONDITIONS IN THE PORT OF LONG BEACH May 2009
WESTON Solutions, Inc. 13
Organics Of a number of the organic compounds on the 303(d) list, only chlordane, DDT, and PCBs (Figure 7 through Figure 9) are widespread at concentrations above the numeric target. However, specific PAHs, including total LMW PAHs, benzo[a]anthracene (Figure 10), and phenanthrene (Figure 11), are present in a few locations at concentrations that exceed both the numeric targets and the listing criteria. According to WESTON (2009), chlordane is often elevated near storm drain outfalls, and chlordane, DDTs, and PCBs are significantly elevated in POLA’s Consolidated Slip as a result of storm runoff from Dominguez Channel. DDTs and PCBs are persistent contaminants of concern that are elevated in sediments throughout the harbors. Concentrations of DDTs, PCBs, and PAHs commonly exceed ER-M levels, especially in slips as opposed to more open waters. Because TBT is a component of many boat anti-fouling bottom paints, elevated concentrations are often found in areas related to specific activities such as marinas and boat repair facilities. During sediment characterization studies conducted in the vicinity of boatyards and marinas, concentrations above the TTLC have been measured in surface sediments. There are no numeric targets or listing criteria for TBT.

SUMMARY OF SEDIMENT QUALITY CONDITIONS IN THE PORT OF LONG BEACH May 2009
WESTON Solutions, Inc. 14
Figu
re 2
. Lo
s Ang
les/
Long
Bea
ch H
arbo
rs su
rfac
e se
dim
ent s
ite sp
ecifi
c an
d m
onito
ring
copp
er d
ata
com
pare
d to
rele
vant
TM
DL
crite
ria
SUMMARY OF SEDIMENT QUALITY CONDITIONS IN THE PORT OF LONG BEACH May 2009
WESTON Solutions, Inc. 15
Figu
re 3
. Lo
s Ang
les/
Long
Bea
ch H
arbo
rs su
rfac
e se
dim
ent s
ite sp
ecifi
c an
d m
onito
ring
lead
dat
a co
mpa
red
to re
leva
nt T
MD
L cr
iteria

SUMMARY OF SEDIMENT QUALITY CONDITIONS IN THE PORT OF LONG BEACH May 2009
WESTON Solutions, Inc. 16
Figu
re 4
. Lo
s Ang
les/
Long
Bea
ch H
arbo
rs su
rfac
e se
dim
ent s
ite sp
ecifi
c an
d m
onito
ring
mer
cury
dat
a co
mpa
red
to re
leva
nt T
MD
L cr
iteria

SUMMARY OF SEDIMENT QUALITY CONDITIONS IN THE PORT OF LONG BEACH May 2009
WESTON Solutions, Inc. 17
Figu
re 5
. Lo
s Ang
les/
Long
Bea
ch H
arbo
rs su
rfac
e se
dim
ent s
ite sp
ecifi
c an
d m
onito
ring
zinc
dat
a co
mpa
red
to re
leva
nt T
MD
L cr
iteria

SUMMARY OF SEDIMENT QUALITY CONDITIONS IN THE PORT OF LONG BEACH May 2009
WESTON Solutions, Inc. 18
Fi
gure
6.
Los A
ngle
s/Lo
ng B
each
Har
bors
surf
ace
sedi
men
t site
spec
ific
and
mon
itorin
g si
lver
dat
a co
mpa
red
to re
leva
nt T
MD
L cr
iteria

SUMMARY OF SEDIMENT QUALITY CONDITIONS IN THE PORT OF LONG BEACH May 2009
WESTON Solutions, Inc. 19
Figu
re 7
. Lo
s Ang
les/
Long
Bea
ch H
arbo
rs su
rfac
e se
dim
ent s
ite sp
ecifi
c an
d m
onito
ring
chlo
rdan
e da
ta c
ompa
red
to re
leva
nt T
MD
L it
i

SUMMARY OF SEDIMENT QUALITY CONDITIONS IN THE PORT OF LONG BEACH May 2009
WESTON Solutions, Inc. 20
Figu
re 8
. Lo
s Ang
les/
Long
Bea
ch H
arbo
rs su
rfac
e se
dim
ent s
ite sp
ecifi
c an
d m
onito
ring
DD
T da
ta c
ompa
red
to re
leva
nt T
MD
L cr
iteria

SUMMARY OF SEDIMENT QUALITY CONDITIONS IN THE PORT OF LONG BEACH May 2009
WESTON Solutions, Inc. 21
Figu
re 9
. Lo
s Ang
les/
Long
Bea
ch H
arbo
rs su
rfac
e se
dim
ent s
ite sp
ecifi
c an
d m
onito
ring
PCB
dat
a co
mpa
red
to re
leva
nt T
MD
L cr
iteria

SUMMARY OF SEDIMENT QUALITY CONDITIONS IN THE PORT OF LONG BEACH May 2009
WESTON Solutions, Inc. 22
Figu
re 1
0. L
os A
ngle
s/Lo
ng B
each
Har
bors
surf
ace
sedi
men
t site
spec
ific
and
mon
itorin
g be
nza[
a]an
thra
cene
dat
a co
mpa
red
to re
leva
nt
TMD
Lit
i

SUMMARY OF SEDIMENT QUALITY CONDITIONS IN THE PORT OF LONG BEACH May 2009
WESTON Solutions, Inc. 23
Figu
re 1
1. L
os A
ngle
s/Lo
ng B
each
Har
bors
surf
ace
sedi
men
t site
spec
ific
and
mon
itorin
g ph
enan
thre
ne d
ata
com
pare
d to
rele
vant
TM
DL
iti

SUMMARY OF SEDIMENT QUALITY CONDITIONS IN THE PORT OF LONG BEACH May 2009
WESTON Solutions, Inc. 24
Randomized Sediment Chemistry Maps The data displayed in Figure 2 through Figure 11 illustrate the presence of several hot spots. It is these hotspots that are driving the TMDL development and will be key to future TMDL implementation strategies. In order to understand what conditions are likely to be once localized areas of concern are addressed, it is useful to examine data from randomized studies. Data presented in Figure 12 through Figure 21 present data collected using randomized study designs developed to characterize the harbors or waterbodies as a whole. These data include:
• Randomized Studies: The 1998 and 2003 Bight Programs (SCCWRP, 2003, 2007), 2006 Port TMDL study (WESTON, 2007a), EPA’s Western Environmental Monitoring and Assessment Program (WEMAP, 1999), and EPA’s Environmental Monitoring and Assessment Program (EMAP, 2005).
The five randomized studies discussed above provide good spatial coverage for characterizing existing general conditions (Figure 12 through Figure 21). These data indicate that, aside from localized hot spots, overall chemical concentrations in sediments are generally below TMDL listing criteria.

SUMMARY OF SEDIMENT QUALITY CONDITIONS IN THE PORT OF LONG BEACH May 2009
WESTON Solutions, Inc. 25
Figu
re 1
2. L
os A
ngle
s/Lo
ng B
each
Har
bors
surf
ace
sedi
men
t mon
itorin
g (r
ando
miz
ed st
udie
s) c
oppe
r dat
a co
mpa
red
to re
leva
nt T
MD
L it
i

SUMMARY OF SEDIMENT QUALITY CONDITIONS IN THE PORT OF LONG BEACH May 2009
WESTON Solutions, Inc. 26
Figu
re 1
3. L
os A
ngle
s/Lo
ng B
each
Har
bors
surf
ace
sedi
men
t mon
itorin
g (r
ando
miz
ed st
udie
s) le
ad d
ata
com
pare
d to
rele
vant
TM
DL
iti

SUMMARY OF SEDIMENT QUALITY CONDITIONS IN THE PORT OF LONG BEACH May 2009
WESTON Solutions, Inc. 27
Figu
re 1
4. L
os A
ngle
s/Lo
ng B
each
Har
bors
surf
ace
sedi
men
t mon
itorin
g (r
ando
miz
ed st
udie
s) m
ercu
ry d
ata
com
pare
d to
rele
vant
TM
DL
iti

SUMMARY OF SEDIMENT QUALITY CONDITIONS IN THE PORT OF LONG BEACH May 2009
WESTON Solutions, Inc. 28
Figu
re 1
5. L
os A
ngle
s/Lo
ng B
each
Har
bors
surf
ace
sedi
men
t mon
itorin
g (r
ando
miz
ed st
udie
s) z
inc
data
com
pare
d to
rele
vant
TM
DL
iti

SUMMARY OF SEDIMENT QUALITY CONDITIONS IN THE PORT OF LONG BEACH May 2009
WESTON Solutions, Inc. 29
Figu
re 1
6. L
os A
ngle
s/Lo
ng B
each
Har
bors
surf
ace
sedi
men
t mon
itorin
g (r
ando
miz
ed st
udie
s) si
lver
dat
a co
mpa
red
to re
leva
nt T
MD
L it
i

SUMMARY OF SEDIMENT QUALITY CONDITIONS IN THE PORT OF LONG BEACH May 2009
WESTON Solutions, Inc. 30
Figu
re 1
7. L
os A
ngle
s/Lo
ng B
each
Har
bors
surf
ace
sedi
men
t mon
itorin
g (r
ando
miz
ed st
udie
s) c
hlor
dane
dat
a co
mpa
red
to re
leva
nt T
MD
L it
i

SUMMARY OF SEDIMENT QUALITY CONDITIONS IN THE PORT OF LONG BEACH May 2009
WESTON Solutions, Inc. 31
Figu
re 1
8. L
os A
ngle
s/Lo
ng B
each
Har
bors
surf
ace
sedi
men
t mon
itorin
g (r
ando
miz
ed st
udie
s) D
DT
data
com
pare
d to
rele
vant
TM
DL
iti

SUMMARY OF SEDIMENT QUALITY CONDITIONS IN THE PORT OF LONG BEACH May 2009
WESTON Solutions, Inc. 32
Figu
re 1
9. L
os A
ngle
s/Lo
ng B
each
Har
bors
surf
ace
sedi
men
t mon
itorin
g (r
ando
miz
ed st
udie
s) P
CB
dat
a co
mpa
red
to re
leva
nt T
MD
L it
i

SUMMARY OF SEDIMENT QUALITY CONDITIONS IN THE PORT OF LONG BEACH May 2009
WESTON Solutions, Inc. 33
Figu
re 2
0. L
os A
ngle
s/Lo
ng B
each
Har
bors
surf
ace
sedi
men
t mon
itorin
g (r
ando
miz
ed st
udie
s) b
enza
[a]a
nthr
acen
e da
ta c
ompa
red
to
ltT
MD
Lit
i

SUMMARY OF SEDIMENT QUALITY CONDITIONS IN THE PORT OF LONG BEACH May 2009
WESTON Solutions, Inc. 34
Figu
re 2
1. L
os A
ngle
s/Lo
ng B
each
Har
bors
surf
ace
sedi
men
t mon
itorin
g (r
ando
miz
ed st
udie
s) p
hena
nthr
ene
data
com
pare
d to
rele
vant
TM
DL
iti

SUMMARY OF SEDIMENT QUALITY CONDITIONS IN THE PORT OF LONG BEACH May 2009
WESTON Solutions, Inc. 35
Sediment Toxicity As previously discussed, assessments of contaminant-related impacts in marine environments often include chemical, toxicological, and biological evaluations in order to determine contaminant-related impacts. Sediment toxicity has been observed in Consolidated Slip, Los Angeles/Long Beach Inner and Outer Harbors, and Fish Harbor. Amphipod mortality, marine invertebrate developmental toxicity, and impaired dinoflagellate growth are effects that have been previously measured in sediment or interstitial water toxicity tests in association with elevated concentrations of sediment metals, or legacy contaminants collected from localized areas of Los Angeles/Long Beach Harbors. Benthic Community Benthic community evaluations have found the benthic community in specific locations within the Los Angeles/Long Beach Harbors to exhibit adverse effects such as altered community structure (infauna population and species composition). Consolidated Slip and Inner Harbor are 303(d)-listed for degraded benthic communities. As with chemistry data, recent benthic assessments (e.g., MEC 2002, SAIC in prep.) indicate that the benthic community may not be as degraded throughout the harbor as previously thought. As with the sediment chemistry data, degraded impacted benthos appear to be largely confined to localized areas in back channels and along wharf faces, where the physical and chemical environment may be adversely affecting benthic communities. Conclusion Recent studies have shown that a number of localized areas of poor sediment quality and impaired benthic community still exist (e.g., Consolidated Slip, Long Beach West Basin, Fish Harbor, Inner Harbor slips). It is those hotspots that are driving the TMDL development and will be key to future TMDL implementation strategies. A suite of randomized-sampling studies has shown that in most of the harbors contaminant concentrations are below regulatory limits and require no action. The evaluation summarized in this section characterizes sediment quality harbor-wide and places hotspots in their limited spatial context. This approach allows resources to be focused on feasible solutions for hotspot remediation. Furthermore, this approach distinguishes between hotspots, which require focused efforts, and waterbody-wide issues that require regional approaches.

SUMMARY OF SEDIMENT QUALITY CONDITIONS IN THE PORT OF LONG BEACH May 2009
WESTON Solutions, Inc. 36
2.2 Summary of Project-Specific Surface Sediment Characterization Studies (1992 – 2008)
The purpose of this section was to describe the surface sediment condition in small, localized areas of LB Harbor, as assessed by targeted sampling programs such as the Bay Protection and Toxic Cleanup Program (BPTCP), conducted to characterize and delineate the spatial extent of potential contamination in sediment from localized areas of LB Harbor. The studies included in this section encompass surficial sediment chemistry data associated with 65 stations sampled as part of sediment characterization studies including the BPTCP (BPTCP, 2008), conducted from 1992-1997, and studies conducted on behalf of the U.S. Navy (Long Beach Naval Station Feasibility Study in 1998 [Bechtel, 2003]) and POLB (WESTON, 2007b). Data collected from large monitoring programs in which samples were randomly collected, including Southern California Bight Monitoring Conducted in 1994, 1998 and 2003 (Southern California Water Resources Project (SCCWRP), 1996; 2003; 2007), 2006 Port TMDL Support Study (WESTON, 2007a), Western Environmental Monitoring and Assessment Program (WEMAP, 1999), and Environmental Monitoring and Assessment Program (EMAP, 2005), were not included in this section. Data from these large monitoring programs are statistically valid and relevant for listing and delisting of TMDLs and therefore are presented above in Section 2.1. All references associated with the data summarized in this section are provided in the reference section below (Section 3.0). As described in Section 1.3 sediment chemistry data collected in areas where dredging, fill, or remediation activities has since occurred was not included in this data set because it no longer represents the current surficial sediment condition in LB Harbor. Figure 22 depicts the locations of stations evaluated as part of this section, after samples collected from areas where dredging, fill, or remediation occurred were eliminated. Only surface sediment chemistry is summarized here because unlike subsurface sediment, surface sediment has significant potential to contribute to the concentrations of pollutants in the water column and is likely to be bioavailable to benthic organisms that inhabit this biologically active layer. The definition of surface sediment was project/program specific and therefore was defined as sediment collected within the top 30 cm (12 in). Due to the large number of chemicals and studies evaluated here, it was necessary to focus this review on specific chemicals of concern. Heavy metals (arsenic, cadmium, chromium, copper, lead, mercury, nickel, zinc), and at least one representative analyte of each of the major chemical classes analyzed in these investigations (i.e., total detectable PAHs, total detectable PCBs, total detectable dichloro diphenyl trichloroethanes [DDTs], total chlordane, and tributyltin [TBT]) are summarized as part of this review. All chemistry data were associated with actual sampling coordinates and is presented on maps below. The analyte list varied by program and sampling location and as a consequence, the number of data points varied by constituent.

SUMMARY OF SEDIMENT QUALITY CONDITIONS IN THE PORT OF LONG BEACH May 2009
WESTON Solutions, Inc. 37
Figure 22. Locations of 63 Stations Associated with Sediment Chemical Characterization Studies

SUMMARY OF SEDIMENT QUALITY CONDITIONS IN THE PORT OF LONG BEACH May 2009
WESTON Solutions, Inc. 38
Surface sediment chemistry data were compared to effects range-low (ER-L) and effects range-median (ER-M) values developed by Long et al. (1995) and total threshold limit concentrations (TTLCs), where applicable. The effects range values are helpful in assessing the potential significance of elevated sediment-associated contaminants of concern, in conjunction with biological analyses. Briefly, these values were developed from a large data set where results of both benthic organism effects (e.g., toxicity tests, benthic community effects) and chemical analysis were available for individual samples. To derive these guidelines, the chemical values for paired data demonstrating benthic impairment were sorted in according to ascending chemical concentration. The ER-L was then calculated as the lower tenth percentile of the observed effects concentrations and the ER-M as the 50th percentile of the observed effects concentrations. While these values are useful for identifying elevated sediment-associated contaminants, they should not be used to infer causality because of the inherent variability and uncertainty of the approach. The ER-L and ER-M sediment quality values are used in conjunction with bioassay testing and are included for comparative purposes only. TTLCs indicate the level above which material must be managed as hazardous waste upon removal, in accordance with Title 22 of the California Code of Regulations (CCR). With the exception of TBT and PAHs, all other heavy metals and organic chemical concentrations are presented in the maps within this section by the following categories: 1) non-detect (ND), 2) ND to ER-L value, 3) ER-L to ER-M values, 4) ER-M value to TTLC, and 5)>TTLC. Because there is no TTLC for total PAHs, the following categories were used to map concentrations of total PAHs: 1) ND, 2) ND to ER-L value, 3) ER-L to ER-M values, 4) ER-M value to 2X ER-M value, and 5) >2X ER-M value. For TBT, there are no ER-L, ER-M, or TTLC values for comparison; therefore, concentrations were compared to the lowest observable effects concentration (LOEC) for benthic community effects (480 µg/kg) and the LOEC for acute toxicity (2,980 µg/kg), based on previous studies of these effects. Specifically, to establish the LOEC concentrations for community structure changes (i.e. sublethal effects) the LOECs from previous studies that measured benthic community structure changes were averaged (Austen and McEvoy, 1997; McGee et al., 1995). To establish the LOEC concentrations for acute toxicity (i.e. mortality) the LOECs from previous studies that measured acute toxicity were averaged (McGee et al., 1995; Meador et al., 1997; Stronkhorst et al., 1999). 2.2.1 Heavy Metals 2.2.1.1 Arsenic
Concentrations of arsenic in surface sediment from all characterization studies ranged from 3.80 to 30.0 mg/kg (Table 5, Figure 23). All concentrations of arsenic were below the ER-M value (70 mg/kg). As shown in Figure 23, only four of the 62 stations in which arsenic was measured demonstrated surficial sediment concentrations that were below the ER-L value (8.2 mg/kg).

SUMMARY OF SEDIMENT QUALITY CONDITIONS IN THE PORT OF LONG BEACH May 2009
WESTON Solutions, Inc. 39
Table 5. The Range of Concentrations and Total Exceedances of Sediment Quality Guidelines for Surface
Sediment Collected as Part of Numerous Studies from LB Harbor (1992 – 2008)
Analyte Sediment Quality Guidelines
Sample Size Range Number of
ER-M Exceedances
Number of TTLC
Exceedances ER-M TTLC Minimum Maximum
Metals (mg/kg) Arsenic 70 500 62 3.80 30.0 0 0 Cadmium 9.6 100 63 0.176 1.80 0 0 Chromium 370 2,500 63 19.2 126 0 0 Copper 270 2,500 63 21.1 365 2 0 Lead 218 1,000 63 10.1 449 2 0 Mercury 0.71 20 63 ND 4.70 12 0 Nickel 51.6 2,000 62 12.6 71.4 1 0 Zinc 410 5,000 63 53.9 746 1 0 Organics (μg/kg) Tributyltin 480* 2,980* 37 ND 353 0 0 PCBs 180 50,000 37 19.4 2,830 9 0 PAHs 44,792 - 23 311 10,697 0 - DDTs 46.1 1,000 37 ND 733 15 0 Chlordane 6 2,500 37 ND 18.3 1 0
Yellow: The concentration exceeds the analyte’s respective ER-M value. ND = non-detect * There are no ER-M or TTLC values for TBT; therefore, TBT was compared to the LOEC for community structure changes (480 µg/kg) and the LOEC for acute toxicity (2,980 µg/kg). There is no TTLC for PAHs; therefore, PAHs were only compared to the ER-M. It should be noted that sediment chemistry data collected in areas where dredging, fill, or remediation activities has since occurred was not included in this data set because it no longer represents the current surficial sediment condition in LB Harbor. 2.2.1.2 Cadmium
Concentrations of cadmium in surface sediment from all characterization studies ranged from 0.176 to 1.80 mg/kg (Table 5, Figure 24). All concentrations of cadmium were below the ER-M value (9.6 mg/kg). As shown in Figure 24, the majority of the 63 stations in which cadmium was measured demonstrated surficial sediment concentrations that were also below the ER-L value (1.2 mg/kg). The only exceedances of the ER-L value were measured in surficial sediment from West Basin. 2.2.1.3 Chromium
Concentrations of chromium in surface sediment from all monitoring and characterization studies ranged from 19.2 to 126 mg/kg (Table 5, Figure 25). All concentrations were below the ER-M value (370 mg/kg). As shown in Figure 25, the majority of the 63 stations in which chromium was measured demonstrated surficial sediment concentrations that were below the ER-L value (81 mg/kg). 2.2.1.4 Copper
Concentrations of copper in surface sediment from all characterization studies ranged from 21.1 to 365 mg/kg (Table 5, Figure 26). Two stations exceeded the ER-M value (270 mg/kg). Both of these stations were located in the northeastern portion of West Basin (between Pier T, Pier Echo, and the former Pier 1). As shown in Figure 26, only three of the 63 stations in which copper was measured demonstrated surficial sediment concentrations that were below the ER-L value (34 mg/kg).

SUMMARY OF SEDIMENT QUALITY CONDITIONS IN THE PORT OF LONG BEACH May 2009
WESTON Solutions, Inc. 40
2.2.1.5 Lead
Concentrations of lead in surface sediment from all characterization studies ranged from 10.1 to 449 mg/kg (Table 5, Figure 27). Two stations exceeded the ER-M value (218 mg/kg). Both of these stations were located in West Basin. As shown in Figure 27, the majority of stations in West Basin demonstrated surficial sediment concentrations that were above the ER-L value (46.7 mg/kg), whereas the majority of stations outside of West Basin demonstrated surficial sediment concentrations that were below the ER-L value. 2.2.1.6 Mercury
Concentrations of mercury in surface sediment from all characterization studies ranged from ND2 to 4.70 mg/kg (Table 5, Figure 28). Twelve (12) stations exceeded the ER-M value (0.71 mg/kg). Numerous exceedances were measured in West Basin, one exceedance was measured in Channel 2, and one exceedance was measured near the Inner Harbor Turning Basin. As shown in Figure 28, only three of the 63 stations in which mercury was measured demonstrated surficial sediment concentrations that were below the ER-L value (0.15 mg/kg). 2.2.1.7 Nickel
Concentrations of nickel in surface sediment from all characterization studies ranged from 12.6 to 71.4 mg/kg (Table 5, Figure 29). Only one station exceeded the ER-M value (51.6 mg/kg). This station was located in the northeastern portion of West Basin (between Pier T, Pier Echo, and the former Pier 1). As shown in Figure 29, only three of the 62 stations in which nickel was measured demonstrated surficial sediment concentrations that were below the ER-L value (20.9 mg/kg). 2.2.1.8 Zinc
Concentrations of zinc in surface sediment from all characterization studies ranged from 53.9 to 746 mg/kg (Table 5, Figure 30). Only one station exceeded the ER-M value (410 mg/kg). This station is located in the northeastern portion of West Basin (between Pier T, Pier Echo, and the former Pier 1). As shown in Figure 30, the majority of the 63 stations in which zinc was measured demonstrated surficial sediment concentrations that were below the ER-L value (150 mg/kg). 2.2.2 Organic Chemicals 2.2.2.1 Tributyltin (TBT)
Concentrations of TBT in surface sediment from all characterization studies ranged from ND to 353 μg/kg (Table 5, Figure 31). For TBT, there are no ER-L, ER-M, or TTLC values for comparison; therefore, concentrations were compared to the LOEC for benthic community effects (480 µg/kg; Austen and McEvoy, 1997; McGee et al., 1995) and the LOEC for acute toxicity (2,980 µg/kg; McGee et al., 1995; Meador et al., 1997; Stronkhorst et al., 1999). Based on these values, and as shown in Figure 31, none of the 37 stations demonstrated surficial sediment concentrations that were above the LOEC for benthic community effects or above the LOEC for acute toxicity. 2.2.2.2 Total Detectable PCBs
Concentrations of total PCBs in surface sediment from all characterization studies ranged from 19.4 to 2,830 μg/kg (Table 5, Figure 32). Nine (9) stations exceeded the ER-M value (180 μg/kg). The majority of these exceedances were measured in surface sediment from the southern portion of West Basin. As
2 Detection limits for each metal or chemical of concern varied among studies so are reporting only as non-detect (ND) in this review.

SUMMARY OF SEDIMENT QUALITY CONDITIONS IN THE PORT OF LONG BEACH May 2009
WESTON Solutions, Inc. 41
shown in Figure 32, only four of the 37 stations in which total PCBs were measured demonstrated surficial sediment concentrations that were below the ER-L value (22.7 μg/kg). 2.2.2.3 Total Detectable PAHs
Concentrations of total PAHs in surface sediment from all characterization studies ranged from 311 to 10,697 μg/kg (Table 5, Figure 33). All concentrations were below the ER-M value (44,792 μg/kg). As shown in Figure 33, all but one of the 23 stations in which total PAHs were measured demonstrated surficial sediment concentrations that were also below the ER-L value (4,022 mg/kg). The only exceedance of the ER-L value was measured in surface sediment from Channel 2. 2.2.2.4 Total Detectable DDTs
Concentrations of total DDTs in surface sediment from all characterization studies ranged from ND to 733 μg/kg (Table 5, Figure 34). Fifteen (15) stations exceeded the ER-M value (46.1 mg/kg). As shown in Figure 34, only two of the 37 stations in which total DDTs were measured demonstrated surficial sediment concentrations that were below the ER-L value (1.58 μg/kg). 2.2.2.5 Total Chlordane3
Concentrations of total chlordane in surface sediment from all characterization studies ranged from ND to 18.3 μg/kg (Table 5, Figure 35). Only one station exceeded the ER-M value (6 μg/kg). This station was located in Outer Harbor. As shown in Figure 35, 10 of the 37 stations in which chlordane was measured demonstrated surficial sediment concentrations that were above the ER-L value (0.5 μg/kg). All exceedances of the ER-L were measured in surface sediment outside of West Basin.
3 Technical (total) chlordane is comprised of 20-30 compounds including 5 which are typically analyzed by labs: alpha and gamma chlordane, oxychlordane, cis and trans nonachlor. For an accurate comparison to ER-L and ER-M values, total chlordane should be calculated as the sum of these 5 commonly measured chlordane compounds. However, it should be noted that in many historical and recent studies total chlordane was calculated as alpha-chlordane or alpha and gamma chlordane (because these were the only chlordanes analyzed) and in other studies, it is not clear which chlordane compounds were used to calculate total chlordane.

SUMMARY OF SEDIMENT QUALITY CONDITIONS IN THE PORT OF LONG BEACH May 2009
WESTON Solutions, Inc. 42
Figure 23. Concentrations of Arsenic in Surficial Sediment Samples Collected in LB Harbor from
1992 – 2008 as Part of Sediment Characterization Studies

SUMMARY OF SEDIMENT QUALITY CONDITIONS IN THE PORT OF LONG BEACH May 2009
WESTON Solutions, Inc. 43
Figure 24. Concentrations of Cadmium in Surficial Sediment Samples Collected in LB Harbor from
1992 – 2008 as Part of Sediment Characterization Studies

SUMMARY OF SEDIMENT QUALITY CONDITIONS IN THE PORT OF LONG BEACH May 2009
WESTON Solutions, Inc. 44
Figure 25. Concentrations of Chromium in Surficial Sediment Samples Collected in LB Harbor from
1992 – 2008 as Part of Sediment Characterization Studies

SUMMARY OF SEDIMENT QUALITY CONDITIONS IN THE PORT OF LONG BEACH May 2009
WESTON Solutions, Inc. 45
Figure 26. Concentrations of Copper in Surficial Sediment Samples Collected in LB Harbor from
1992 – 2008 as Part of Sediment Characterization Studies

SUMMARY OF SEDIMENT QUALITY CONDITIONS IN THE PORT OF LONG BEACH May 2009
WESTON Solutions, Inc. 46
Figure 27. Concentrations of Lead in Surficial Sediment Samples Collected in LB Harbor from
1992 – 2008 as Part of Sediment Characterization Studies

SUMMARY OF SEDIMENT QUALITY CONDITIONS IN THE PORT OF LONG BEACH May 2009
WESTON Solutions, Inc. 47
Figure 28. Concentrations of Mercury in Surficial Sediment Samples Collected in LB Harbor from
1992 – 2008 as Part of Sediment Characterization Studies

SUMMARY OF SEDIMENT QUALITY CONDITIONS IN THE PORT OF LONG BEACH May 2009
WESTON Solutions, Inc. 48
Figure 29. Concentrations of Nickel in Surficial Sediment Samples Collected in LB Harbor from
1992 – 2008 as Part of Sediment Characterization Studies

SUMMARY OF SEDIMENT QUALITY CONDITIONS IN THE PORT OF LONG BEACH May 2009
WESTON Solutions, Inc. 49
Figure 30. Concentrations of Zinc in Surficial Sediment Samples Collected in LB Harbor from
1992 – 2008 as Part of Sediment Characterization Studies

SUMMARY OF SEDIMENT QUALITY CONDITIONS IN THE PORT OF LONG BEACH May 2009
WESTON Solutions, Inc. 50
Figure 31. Concentrations of Tributyltin in Surficial Sediment Samples Collected in LB Harbor from
1992 – 2008 as Part of Sediment Characterization Studies

SUMMARY OF SEDIMENT QUALITY CONDITIONS IN THE PORT OF LONG BEACH May 2009
WESTON Solutions, Inc. 51
Figure 32. Concentrations of Total Detectable PCBs in Surficial Sediment Samples Collected in
LB Harbor from 1992 – 2008 as Part of Sediment Characterization Studies

SUMMARY OF SEDIMENT QUALITY CONDITIONS IN THE PORT OF LONG BEACH May 2009
WESTON Solutions, Inc. 52
Figure 33. Concentrations of Total Detectable PAHs in Surficial Sediment Samples Collected in
LB Harbor from 1992 – 2008 as Part of Sediment Characterization Studies

SUMMARY OF SEDIMENT QUALITY CONDITIONS IN THE PORT OF LONG BEACH May 2009
WESTON Solutions, Inc. 53
Figure 34. Concentrations of Total Detectable DDTs in Surficial Sediment Samples Collected in
LB Harbor from 1992 – 2008 as Part of Sediment Characterization Studies

SUMMARY OF SEDIMENT QUALITY CONDITIONS IN THE PORT OF LONG BEACH May 2009
WESTON Solutions, Inc. 54
Figure 35. Concentrations of Chlordane in Surficial Sediment Samples Collected in LB Harbor from
1992– 2008 as Part of Sediment Characterization Studies

SUMMARY OF SEDIMENT QUALITY CONDITIONS IN THE PORT OF LONG BEACH May 2009
WESTON Solutions, Inc. 55
2.3 Primary Literature Review of Relevant Long Beach Harbor Sediment
Studies In addition to reviewing all dredge-related/monitoring studies conducted in LB Harbor (i.e., the gray literature), a comprehensive review of the primary or peer-reviewed literature was also undertaken. This review involved searching for publications using the major scientific databases (e.g., Web of Science [1900 – present], Biosis Previews [1926 – present]) available to the public through the University of California and the California State University libraries and publications available through SCCWRP and government agencies such as the SWRCB. Papers found as part of this search fell into two categories: 1) those in which data evaluated was collected as part of large monitoring programs such as the BPTCP; or 2) those in which there was relevant sediment chemical characterization or other related chemistry data. It should be noted that the primary literature is discussed separately from the monitoring study data presented above because we do not have access to raw data values or exact locations and can not be certain that rigorous quality assurance and quality control procedures were conducted. Six comprehensive peer-reviewed publications were identified as part of this review in which sediment conditions were measured in multiple sites in LA Harbor (Anderson et al., 1988; Anderson et al., 1998; Anderson et al., 2001; Field et al., 2002; Bay et al., 2007; Barnett et al., 2008). These publications are not discussed here because the data used in each of these publications was acquired from one of the major monitoring programs in California, and thus the data has already been described previously (Sections 2.1 and 2.2). The major monitoring programs from which data are drawn include BPTCP (2008), WEMAP (1999), EMAP (2005), and Southern California Bight Monitoring (SCCWRP, 1996; 2003; 2007). The primary goals of these publications were to either present data collected as part of these monitoring efforts (Anderson et al., 1988; Anderson et al., 1998; Anderson et al., 2001) or to examine linkages between sediment chemicals and toxicological effects or changes to the benthic community or an associated metric that indicates an effect (Field et al., 2002; Bay et al., 2007; Barnett et al., 2008) using these large monitoring datasets. Aside from the large monitoring programs described above, there has been only one other comprehensive investigation in which sediment chemistry was evaluated in LB Harbor (Chen and Lu, 1974), though several sediment investigations have been conducted in LA Harbor. This sediment investigation was part of numerous studies characterizing geomorphology, physical properties, water quality, and biological integrity that were conducted in San Pedro Bay in the early 1970s and funded by California Sea Grant. In the sediment investigation study, surface sediment samples were collected from eleven stations in the LB Harbor District and assessed for trace metals, chlorinated pesticides, and PCBs. Concentrations of several priority metals (arsenic, cadmium, chromium, and lead) and dieldrin were within the range of concentrations measured as part of the large monitoring programs (Sections 2.1 and 2.2) and were below corresponding ER-M values (70, 9.6, 370, and 218 mg/kg, for metals, respectively, and 8.0 µg/kg for dieldrin). Nickel concentrations at one station exceeded the ER-M (51.6 mg/kg), but were otherwise in the range of concentrations measured as part of the large monitoring programs. At two or more stations, the concentrations of copper, mercury, zinc, total DDTs and total PCBs exceeded the corresponding ER-M values (Table 6), and some were elevated relative to the large monitoring studies. Because this study was conducted in 1973, well in advance of the monitoring studies, and given that the Clean Water Act was passed in 1972, the elevated concentrations of these chemicals are not unexpected.

SUMMARY OF SEDIMENT QUALITY CONDITIONS IN THE PORT OF LONG BEACH May 2009
WESTON Solutions, Inc. 56
Table 6. The Range of Concentrations and Total Exceedances of Sediment Quality Guidelines for Surface
Sediment Collected and Analyzed by Chen and Lu (1974)
Analyte
Sediment Quality
Guideline
Regulatory Level Range
ER-M TTLC Minimum Maximum
Metals (mg/kg) Arsenic 70 500 2.79 28.8 Cadmium 9.6 100 1.13 4.89 Chromium 370 2,500 36.7 98.2 Copper 270 2,500 32.4 861 Lead 218 1,000 45 147 Mercury 0.71 20 0.079 9.44 Nickel 51.6 2,000 22.5 69.2 Zinc 410 5,000 13.5 562 Organics (μg/kg) PCBs 180 50,000 63 2,030 DDTs 46.1 1,000 60.9 429 Dieldrin 6 2,500 ND 3.4
Yellow: The concentration exceeds the analyte’s respective ER-M value. ND = non-detect
In addition to the Chen and Lu (1974) study, two additional investigations in LB Harbor assessed related chemical measures from which relationships between the sediment chemical load and overlying water chemical concentrations could be inferred. In one study, cadmium flux from sediment to overlying water was measured in situ in association with other measurements at six stations in LB Harbor (Colbert et al., 2001). At five of six stations, a positive cadmium flux was measured from sediment to overlying water (over one or more time points), indicating that sediment was a contributor to water cadmium concentrations in many areas of LB Harbor. In a separate investigation, selected trace metals, chlorinated hydrocarbons and PAHs were evaluated in the seasurface microlayer at one station from LB Inner Harbor as well as four other nearshore areas and a station in LA Harbor (Cross et al., 1987; Applied GeoSciences, 1990). Concentrations of metals, DDTs, and PAHs were elevated in the seasurface microlayer in LB Harbor relative to offshore area. In addition to studies in LB Harbor, three studies were identified in which sediment chemistry was evaluated in the LA Harbor side of San Pedro Bay; however, in all three investigations chemistry was performed in conjunction with an evaluation of the biological effects of samples collected from LA Harbor in addition to other locations (Malins et al., 1987; Nipper et al., 1989; Thompson et al., 1989). These three investigations were conducted between 1987 and 1989 and demonstrated a wide range of chemical concentrations in sediment collected from one or more stations per investigation. With one exception, the concentrations of metals, PAHs, DDTs, and PCBs measured in these studies were within the range of concentrations measured as part of the large monitoring programs described above. In the East Basin, the concentration of total DDTs (763 µg /kg) and total PCBs (1,810 µg/kg) were significantly elevated relative to the concentrations measured as part of large monitoring programs and relative to corresponding ER-M values (46.1 and 180 µg/kg, respectively) (Thompson et al., 1989).

SUMMARY OF SEDIMENT QUALITY CONDITIONS IN THE PORT OF LONG BEACH May 2009
WESTON Solutions, Inc. 57
2.4 Future Remediation Areas 2.4.1 Installation Restoration Site 7 As a consequence of over 50 years of shipping and industrial uses by the U.S. Navy’s Long Beach operations, elevated concentrations of contaminants (i.e., heavy metals, PCBs, and PAHs) were measured in sediments from the Installation Restoration (IR) Site 7 (West Basin) area in POLB. Because sediments from IR Site 7 may pose ecological risks to benthic organisms, an environmental remediation project is necessary to remove contaminated sediments from the area. POLB will be conducting the remedial activities in the IR Site 7 area in accordance with a Lease in Furtherance of Conveyance (LIFOC) with the Navy, state environmental regulations, and the Record of Decision (execute in 2007) for the site. Current plans include the removal of material from two Areas of Ecological Concern (AOECs) requiring remediation, as identified by the Navy and previously established as part of a Remedial Investigation/Feasibility Study conducted by Bechtel National, Inc. (Bechtel, 2003). Specifically, areas identified for cleanup include AOEC A and C (Figure 36). Material from AOEC A and C will be removed and used as slip fill at Slip G. Thirty-four (34) sediment samples from AOEC A and C were collected as part of the feasibility study conducted by the U.S. Navy (eight samples within AOEC C) and the Pre-Design Sediment Sampling performed by WESTON (seven samples in AOEC A and 19 samples within AOEC C) (Figure 36). A review of sediment characterization studies conducted on behalf of POLB (WESTON, 2007b) and the U.S. Navy (Long Beach Naval Station Feasibility Study in 1998 [Bechtel, 2003]) revealed several exceedances of the ER-M in surface sediment from AOEC A and C (Table 7).

SUMMARY OF SEDIMENT QUALITY CONDITIONS IN THE PORT OF LONG BEACH May 2009
WESTON Solutions, Inc. 58
Figure 36. Sediment Sampling Stations within the Installation Restoration Site 7 Project Area
Concentrations of heavy metals of concern ranged from 0.109 mg/kg of mercury to 746 mg/kg of zinc. Several metals exceeded the ER-M including copper, lead, mercury, nickel, and zinc. For nickel and zinc, one station exceeded the ER-M. For copper, two stations exceeded the ER-M (270 mg/kg) at concentrations of 337 and 365 mg/kg. For lead, two stations exceeded the ER-M (218 mg/kg) at concentrations of 282 and 449 mg/kg. All of these exceedances were measured in surface sediment from AOEC A, with the exception of one sample which was located in AOEC C. In this sample, lead was measured at a concentration greater than the ER-M. For mercury, nine stations exceeded the ER-M (0.71 mg/kg), ranging in concentration from 0.72 to 1.40 mg/kg. All of these exceedances were measured in surface sediment from AOEC C, with the exception of one sample which was located in AOEC A. Concentrations of arsenic, cadmium, and chromium did not exceed the corresponding ER-M values. No analytes exceeded the corresponding TTLC values. Organics were only analyzed in samples from AOEC C. Organics measured at concentrations greater than the ER-M include total PCBs and DDTs. For total PCBs, six stations exceeded the ER-M (180 µg/kg), ranging in concentration from 180 to 2,830 µg/kg. For total DDTs, two stations exceeded the ER-M (46.1 µg/kg) at concentrations of 111 and 733 µg/kg. No analytes exceeded the corresponding TTLC values. Concentrations of TBT were below the LOEC for community structure changes (480 µg/kg) and the

SUMMARY OF SEDIMENT QUALITY CONDITIONS IN THE PORT OF LONG BEACH May 2009
WESTON Solutions, Inc. 59
LOEC for acute toxicity (2,980 µg/kg). Concentrations of chlordane were below detection levels in all samples. PAHs were not analyzed in samples from AOEC C. The upcoming dredging and remediation in IR Site 7 will ultimately result in a reduction of contaminant concentrations presented here to background levels. Table 7. The Range of Concentrations and Total Exceedances of Sediment Quality Guidelines for Surface
Sediment Collected from IR Site 7 AOEC A and C
Analyte Sediment Quality Guidelines
Sample Size Range Number of
ER-M Exceedances
Number of TTLC
Exceedances ER-M TTLC Minimum Maximum
Metals (mg/kg) Arsenic 70 500 34 5.90 30.0 0 0 Cadmium 9.6 100 34 0.176 1.80 0 0 Chromium 370 2,500 34 26.0 126 0 0 Copper 270 2,500 34 28.9 365 2 0 Lead 218 1,000 34 12.6 449 2 0 Mercury 0.71 20 34 0.109 1.40 9 0 Nickel 51.6 2,000 34 21.6 71.4 1 0 Zinc 410 5,000 34 80.9 746 1 0 Organics (µg/kg) Tributyltin 480* 2,980* 8 12.0 25.0 0 0 PCBs 180 50,000 8 ND 2,830 6 0 PAHs 44,792 - 0 - - - - DDTs 46.1 1,000 8 ND 733 2 0 Chlordane 6 2,500 8 ND ND 0 0
Yellow: The concentration exceeds the analyte’s respective ER-M value. ND = non-detect * There are no ER-M or TTLC values for TBT; therefore, TBT was compared to the LOEC for community structure changes (480µg/kg) and the LOEC for acute toxicity (2,980 µg/kg). There is no TTLC for PAHs; therefore, PAHs were only compared to the ER-M. 2.4.2 Middle Harbor Redevelopment Project The Middle Harbor Redevelopment Project is a program involving the redevelopment, expansion, and modernization of existing waterfront property and POLB lands which is necessary to support the future increases in containerized cargo volumes and to ensure adequate navigation depth for draft requirements of the current and future generations of cargo vessels. To achieve these goals this project proposes to consolidate Piers D, E, and F to create one larger and more efficient, 345-acre container terminal that can accommodate larger vessels through the creation of four deep-water berths. As part of this project, approximately 22 HA (54 acres) of water will be filled. Dredging will generate approximately 520,000 m3 (680,000 cy) of material, potentially removing contaminated sediments from the area. Filling of Slip 1 and the area between Pier E and Pier F will essentially cap contaminated sediments making them unavailable to the environment. Previous studies that describe the existing sediment conditions in the vicinity of the project area including studies by BPTCP from 1992 to 1997 (BPTCP, 2008), SCCWRP (2007), and WESTON (2007a). Prior to dredging, targeted sampling and analyses will further characterize potential dredged material. The final environmental impact report/environmental impact statement (EIR/EIS) for the Middle Harbor Redevelopment Project is currently under review by The Long Beach Board of Harbor Commissioners.

SUMMARY OF SEDIMENT QUALITY CONDITIONS IN THE PORT OF LONG BEACH May 2009
WESTON Solutions, Inc. 60
2.5 Issues Associated with Evaluating Large Sediment Chemistry Datasets In reviewing the data presented in this document, it should be noted that there are a number of confounding issues associated with comparing sediment chemistry data compiled across a large time period for disparate sampling programs and objectives. These issues are analytical, physical and biological in nature. Analytical issues that should be considered include interferences associated with the sediment matrix and the change in methods and technologies over time and their impact on analytical results. Physical and biological issues that should be considered include the removal, deposition or other disturbance and/or physical or biological alteration. All of these factors may alter the interpretation of existing environmental conditions based on historical sampling results. 2.5.1 Analytical Issues The degree of matrix interferences in sediment chemistry datasets should be considered when evaluating data from multiple sources. Matrix interferences are characteristics of the sediment that interfere with the test method execution such that reliability of data may be affected. These interferences occur in part because of the low level concentrations of target chemical analytes typically in sediment. Target chemical analytes penetrate the marine environment in trace concentrations at or below the part per billion range, of which only a small proportion bind to sediment particulates. In order to detect compounds at these ecologically and biologically relevant concentrations, some form of sample pre-concentration is necessary. This obligatory step also tandemly concentrates any potentially interfering materials, which are often present in sediment samples at far greater quantities than the target analytes. The occurrence of interfering substances in sediment extracts or digestates is therefore a major potential source of error during analysis of this inherently heterogeneous matrix. Matrix interferences in sediment samples can vary considerably and are dependent on the degree of chemical complexity of the sample site. Interfering sediment sample components include the degree of matrix homogeneity and the presence of hydrocarbons, lipids, sulfur and water. Quantitative analysis of target compounds remains a challenging task, since several laborious and costly steps to concentrate and purify samples may be necessary in order to obtain results liberated from the effects of coextractives. The extent of sample preparation required for the isolation of target analytes in the sediment matrix prior to quantification is dependant on the quantity of analyte present in the sample, the degree and diversity of coextractive chemical constituents, and the analytical tool to be utilized (Gomes et al., 2004). Though most sample preparation methods are proficient in negating analytical interferences, the more intense the extraction and purification procedures, the greater the potential for analyte losses resulting in lower recoveries. A compromise must therefore be made between the need for method detection limits (MDLs) of environmental relevance and the limitation of the amount of matrix interference present in the sample to be analyzed. Quality assurance/quality control (QA/QC) measurements are fundamental to the examination of possible interferences that affect correct quantification of target analytes in sediments. Accuracy of an analytical procedure can be determined by the use of certified reference materials while precision of a method can be determined by replicate analyses of a material. Analysis of matrix spikes on environmental samples is an important tool to indicate the bias of analytical measurements due to intrinsic chemical interferences that may be present in the sample matrix. The use of specialty analytical laboratories that have developed and implemented cleanup procedures and method modifications to specifically deal with sediment is also a key consideration in overcoming analytical interferences associated with this matrix. The improvement in instrumentation, methods and technologies used to analyze sediment for chemical constituents over time is another issue potentially affecting the evaluation of analytical data across large time scales. Specifically, non-detects associated with historical data could be due to the lack of ability to

SUMMARY OF SEDIMENT QUALITY CONDITIONS IN THE PORT OF LONG BEACH May 2009
WESTON Solutions, Inc. 61
detect specific metals or chemicals above present-day detection limits. For example, PCB analytical methods and instrumentation has changed dramatically over time. Early PCB quantitation methods were highly subjective Aroclor-based methods in which individual congeners could not be resolved. In the 1990s, Aroclor-based methods offered quantitative alternatives (Eganhouse and Gossett, 1991) but still relied on the subjective visual determination of Aroclor speciation as well as the assumption that environmentally or metabolically weathered samples accurately reflect the composition and toxicity of the Aroclor standards used to quantify them. More recently, congener-specific PCB analysis was implemented in which individual congeners present in a sample were quantified against congener standards rather than Aroclor standards. These methods are becoming preferred because they are less subjective and can yield more accurate results for environmental samples that may have weathered or were biologically degraded, and whose PCB composition is not identical with that of the Aroclors. 2.5.2 Physical Factors A number of physical factors may also confound the assessment of sediment chemistry data collected over a large time period. The area of sediment collection should be reviewed to see whether sedimentation processes are likely (i.e., due to deposition associated with inflows from the Los Angeles River and other sources) and could affect sediment chemistry results from one year to the next, depending on the degree of contamination in the newly deposited sediment (Los Angeles Regional Contaminated Sediments Task Force [CSTF], 2005). Because mixing of surface sediment can expose either more or less contaminated sediments, zones of elevated sediment mixing or disturbance (e.g., as a result of high ship traffic, propellers on tugs, dry dock operations, or other mechanisms) should also be considered when evaluating sediment chemistry and reviewing large datasets such as this one. 2.6 Analytical Data Gaps in LB Harbor 2.6.1 Emerging Substances of Concern There are a variety of chemicals considered ‘emerging substances of concern’ that have not been evaluated in sediment from LB Harbor. A brief review of these substances is provided here. Endocrine modulating compounds include those that have been shown to mimic or block the physiological function of endogenous hormones in organisms. These include natural hormones used by body builders (i.e., steroids), synthetic hormones such as birth control pills, alkylphenolic surfactants (e.g., detergents) such as nonylphenol and octylphenol, polyfluorinated compounds (i.e., perfluorooctane sulfonic acid [PFOS], perfluorooctanoic acid [PFOA], teflon, stainmaster, scotchgard, gore-tex), and brominated flame retardants (e.g., polybrominated diphenyl ethers [PBDEs]). In addition to endocrine disruptors, pharmaceuticals and personal care products also are found in aquatic environments but have not been measured in LB Harbor sediments. Examples of these include prescription medications such as antibiotics, blood lipid regulators, analgesics, anti-inflammatories, anti-seizure, natural and synthetic hormones, and antiparasiticides, over-the-counter (OTC) medications and personal care products such as fungicides, disinfectants, fragrances, cosmetics sunscreens and vitamins, and veterinary medications (similar to prescription and OTC medications listed above). The most recent substance of concern falls into the category of nanomaterials (e.g., nanoparticles, nanofibres, nanotubes, carbon black, quantum dots, nanogold, nanosilver, bucky balls), which also have not been examined in LB Harbor sediments. Because of their size (smaller than one tenth of a micrometer in at least one dimension), these are of concern because their surface area to volume ratio is high, and may result in increased absorption through the skin, gills/lungs, or digestive tract.

SUMMARY OF SEDIMENT QUALITY CONDITIONS IN THE PORT OF LONG BEACH May 2009
WESTON Solutions, Inc. 62
2.6.2 Other Pollutant Data Gaps Dioxins are a class of highly toxic chemicals that have been measured in only one sediment characterization study in LB Harbor (WESTON, 2006a), and thus the spatial distribution of this class has not been fully investigated. In this study, two composite samples of deep homogenized cores were analyzed for dioxins. Dioxin toxic equivalent (TEQ) concentrations were below the Region IX risk-based guidance levels for total dioxin TEQ of sediments (6 ng/kg; Brian Ross, USEPA Region IX, personal communication) and therefore were not considered to be significantly elevated. This class of likely carcinogens includes PCBs, polychlorinated dibenzo dioxins (PCDDs), and polychlorinated dibenzo furans (PCDFs), the most toxic of which is tetrachlorodibenzo-p-dioxin (TCDD). Dioxins are produced as a by-product of processes involving incineration of chlorine-based chemical compounds and hydrocarbons such as waste incineration, chemical and pesticide manufacturing and pulp and paper bleaching and are also degradation products of Agent Orange, an herbicide used by U.S. military during the Vietnam War. Also of concern is domoic acid, a naturally occurring marine neuroexcitatory toxin usually produced by diatom Pseudo-nitzschia, whose spatial distribution in surface sediment in LB Harbor has not been investigated. While this is a toxin and not a direct pollutant, it is well known that anthropogenic pollutants may contribute to the diatom blooms that result in the production of this toxin. While no studies to date have measured concentrations of domoic acid in surface sediment, the abundances of Pseudo-nitzschia and domoic acid in suspended particulate matter collected were measured in the San Pedro Channel and Los Angeles harbor areas in the summers of 2003 and 2004 (Schnetzer et al., 2007). Elevated particulate domoic acid concentrations were measured inside the LB Harbor (12.7 μg/L) in the spring of 2003; however, in the spring of 2004 these levels were an order of magnitude lower.

SUMMARY OF SEDIMENT QUALITY CONDITIONS IN THE PORT OF LONG BEACH May 2009
WESTON Solutions, Inc. 63
3.0 REFERENCES AMEC. 2001. Final Report: Port of Long Beach Main Channel Deepening Project and Southeast Basin
Borrow Site Sediment Characterization, Long Beach, California. AMEC. 2002. Final Report: Cerritos Channel Widening Project Pier S Shoreline Characterization, Port of
Long Beach, Long Beach, California. AMEC. 2004. Final Report: Back Channel and Inner Harbor Navigation Safety Improvements Project,
Dredged Material Characterization Study, Port of Long Beach. AMEC. 2008. Final Report: Pier J Maintenance Dredging Project Sediment Characterization Port of Long
Beach, California. Anderson, J.W., S.M. Bay, and B.E. Thompson, 1988. Characteristics and Effects of Contaminated
Sediments from Southern California. Southern California Coastal Water Research Project. Anderson, B.S., Hunt, J.W., Phillips, B.M. 2001. Sediment quality in Los Angeles Harbor, USA: A triad
assessment. Environmental Toxicology and Chemistry, 20: 359-370. Anderson, B.S., Hunt, J.W., Phillips, B.M., Newman, J., Tjeerdema, R.S., Wilson, C.J., Kapahi, G.,
Stephenson, M., Puckett, H.M., Fairey, R., Oakden, J., Lyons, M., Birosik, S. 1998. Chemistry, toxicity and benthic community conditions in selected sediments of the Los Angeles Region. Final Report for the Bay Protection and Toxic Cleanup Program. California State Water Resources Control Board.
Barnett, A.M., S.M. Bay, K.J. Ritter, S.L. Moore and S.B. Weisberg. 2008. Sediment quality in California
bays and estuaries. Southern California Coastal Water Research Project. Technical Report. Costa Mesa, CA.
Bay, S.M., K.J. Ritter, D.E. Vidal-Dorsch, and L.J. Field. 2007. Comparison of national and regional
sediment quality guidelines for predicting sediment toxicity in California. Technical Report 543. Southern California Coastal Water Research Project. Costa Mesa, CA. Bay, S, D. Greenstein and D. Young. 2007. Evaluation of methods for measuring sediment toxicity in California bays and estuaries. Technical Report 503. Southern California Coastal Water Research Project. Costa Mesa, CA.
Bechtel National, Inc. (Bechtel). 2003. Final Feasibility Study Report, Installation Restoration Site 7,
Naval Station Long Beach. Long Beach, CA. Bay Protection Toxics Control Program (BPTCP). 2008 (website updated). Available Online at:
http://www.waterboards.ca.gov/water_issues/programs/bptcp/ Black Rock Geosciences. 2002, Phase II investigation of Colonial Yacht Anchorage, Colonial Yacht
Anchorage, Berth 204. Anchorage Road, Wilmington, CA. California State Military Department. 2008. The California State Military Museum. Accessed October,
2008. http://www.militarymuseum.org/NOBLongBeach.html. Chen, K.Y., and J.C. Lu. 1974. Sediment compositions in Los Angeles – Long Beach Harbors and San
Pedro Basin. In D.F. Soule and M. Oguri (Eds.), Marine Studies of San Pedro Bay California.
SUMMARY OF SEDIMENT QUALITY CONDITIONS IN THE PORT OF LONG BEACH May 2009
WESTON Solutions, Inc. 64
Part 7. Sediment Investigations (177 p.). Los Angeles, CA: The Allan Hancock Foundation and The Office of Sea Grant Programs, University of Southern California.
Colbert, D. 2001. Cadmium flux in Los Angeles/Long Beach harbours and at sites along the California
continental margin. Estuarine, coastal and shelf science 53 (2): 169-180. Cross, J.N., Hardy, J..T, Hose, J.E., Hershelman, G.P., Antrim, L.D., Gossett, R.W., and Crecelius, E.A.
1987. Contaminant concentrations and toxicity of sea-surface microlayer near Los Angeles, California. Marine Environmental Research, 23:307–323.
Eganhouse, R.P., and Gossett, R.W. 1991. Sources and magnitude of bias associated with determination
of polychlorinated biphenyls in environmental samples. Analytical Chemistry, 63:2130-2137. EMAP. 2005. West EMAP Information Management Plan. Coastal EMAP Small Estuaries. National
Estuary Program Coastal Condition Report. United States Environmental Protection Agency, Office of Water/Office of Research and Development/EPA-842/B-06/001. 2006. http://www.epa.gov/nccr and http://www.epa.gov/emap/.
Field, L.J., D.D. MacDonald, S.B. Norton, C.G. Ingersoll, C.G. Severn, D. Smorong and R. Lindskoog.
2002. Predicting amphipod toxicity from sediment chemistry using logistic regression models. Environmental Toxicology and Chemistry, 21:1993-2005.
Gomes, R.L., M.D. Scrimshaw, J.N. Lester. 2004. Steroid estrogen determination in sediment and sewage
sludge: a critique of sample preparation and chromatographic/mass spectrometry considerations, incorporating a case study in method development. Trends in Analytical Chemistry, 23: 737.
Kinnetic Laboratories Inc. and ToxScan Inc. 1996. Sediment Testing for Proposed West Basin Dredging
Port of Long Beach (Sub-areas IV & V). Kinnetic Laboratories Inc. and ToxScan Inc. 1999. Results of Physical, Chemical, and Bioassay Testing
of Sediments Collected from the West Basin in the Port of Long Beach. Kozelka, P. 2009. EPA Region IX. Personal Communication. April. LA RWQCB and EPA Region IX (Los Angeles Regional Water Quality Control Board and US
Environmental Protection Agency Region IX). 2008. Total Maximum Daily Loads for Toxic Pollutants in Dominguez Channel and Greater Los Angeles and Long Beach Harbor Waters. Draft: Water Quality Assessment, Problem Statement, Numeric Targets.
LA RWQCB (Los Angeles Regional Water Quality Control Board). 1995. Water Quality Control Plan,
Los Angeles Region. Basin Plan for the Coastal Watersheds of Los Angeles and Ventura Counties.
LA RWQCB (Los Angeles Regional Water Quality Control Board). 2007. Surface Water Ambient
Monitoring Program (SWAMP) – Water Quality in the Dominguez Channel and Los Angeles/Long Beach Harbor Watershed Management Area (2002-2003).
Malins, D.C., McCain, B.B., Brown,D.W., 1987. Toxic chemicals, including aromatic and chlorinated
hydrocarbons and their derivatives, and liver lesions in white croaker (Genyonemus lineatus) from the vicinity of Los Angeles. Environmental Science and Technology, 21: 765-770.

SUMMARY OF SEDIMENT QUALITY CONDITIONS IN THE PORT OF LONG BEACH May 2009
WESTON Solutions, Inc. 65
MEC Analytical Systems, Inc. 1992. Physical, Chemical and Bioassay Analyses of Dredge Sediments from Pier J and the East Channel in Long Beach Harbor.
MEC Analytical Systems, Inc. 1995. Results of Chemical, Physical and Bioassay Testing for Port of Long
Beach Berths 88-94. MEC Analytical Systems, Inc. 1996. Sediment Characterization in the West Basin, Port of Long Beach. MEC Analytical Systems, Inc. 1996. Sediment Characterization in the West Basin, Port of Long Beach. MEC Analytical Systems, Inc. 1997. Results of Chemical, Physical and Bioassay Testing for Port of Long
Beach Berths J245-247. MEC Analytical Systems, Inc. 1999. Results of Physical, Chemical, and Bioassay Testing of Sediments
Collected From Channel Two In The Port of Long Beach. MEC Analytical Systems, Inc. 1999. Results of Physical, Chemical, and Bioassay Testing of Sediments
Collected From the West Basin In the Port of Long Beach. MEC Analytical Systems, Inc. 2002. Final Dredged Material Sampling and Analysis Report: Sampling
and Tier III Analysis for Port of Long Beach Southeast Basin Maintenance Dredging. Mesa Environmental Service. 1998. Al Larson’s Boat Shop Site Characterization Report. Al Larsen’s
Boat Shop, 1046 Seaside Avenue, Terminal Avenue, Terminal Island, CA90731. May. Nipper, M.G., Greenstein, D.J., Bay, S.M., 1989. Short-term and long-term sediment toxicity test
methods with the amphipod Grandidierella japonica. Environmental Toxicology and Chemistry, 8: 1191-1200.
Ogden Environmental and Energy Services. 1998. Final Report Sediment Testing for Maintenance
Dredging Permit Contract HD-5951, Job Task 9801. Ogden Environmental and Energy Services. 2000. Final Report Pier S Realignment and Dredging Project
Contract HD-5951. Poor, N. 2002. Atmospheric Deposition of Nitrogen and Air Toxins to the Tampa Bay Estuary, Final
Report, Prepared for Tampa Bay Estuary Program, September. Ross, B. United States Environmental Protection Agency Region IX (USEPA Region IX), personal
communication. Schnetzer, A., P.E. Miller, R.A. Schaffner. 2007. Blooms of Pseudo-nitzschia and domoic acid in San
Pedro Channel and Los Angeles harbor areas of the Southern California Bight, 2003-2004. Harmful Algae, 6: 372-387.
State Water Resources Control Board – California Environmental Protection Agency (SWRCB – Cal EPA), 2008. Draft Staff Report, Water Quality Control Plan for Enclosed Bays and Estuaries. January 29.
State Water Resources Control Board (SWRCB). 2004. Water Quality Control Policy for Developing California’s Clean Water Act Section §303(d) List.

SUMMARY OF SEDIMENT QUALITY CONDITIONS IN THE PORT OF LONG BEACH May 2009
WESTON Solutions, Inc. 66
Stolzenback, K.D., R. Lu, C. Xiong, S. Friedlander, R. Turco, D. Schiff, and L. Tiefenthaler. 2001. Measuring and Modeling of Atmospheric Deposition on Santa Monica Bay and the Santa Monica Bay Watershed. UCLA Institute for the Environment and Southern California Coastal Water Research Project, September.
Stronkhorst, J., B. vanHattum, and T. Bowmer. 1999. Bioaccumulation and toxicity of tributyltin to a burrowing heart urchin and an amphipod in spiked, silty marine sediments. Environmental Toxicology and Chemistry, 18:2343-2351.
Southern California Coastal Water Research Project (SCCWRP). 1996. Southern California Bight Pilot Project 1994. http://www.sccwrp.org/regional/94scbpp/94docs.htm.
Southern California Coastal Water Research Project (SCCWRP). 2003. Southern California Bight 1998
Regional Monitoring Program. Southern California Coastal Water Research Project. Technical Report. Westminster, CA.
Southern California Coastal Water Research Project (SCCWRP). 2007. Southern California Bight 2003
Regional Monitoring Program Executive Summary. Southern California Coastal Water Research Project. Technical Report. Costa Mesa, CA.
Tetra Tech. 1994a. Environmental Compliance Audit, TC-9514-03. Wilmington Marine Service. 801
South Fries Avenue, Wilmington, California. October. Tetra Tech. 1994b. Preliminary Site Assessment (PSA). TC-9514-18. Al Larson Boat Shop. 1046 South
Seaside Ave, Terminal Island, CA. November. Thompson, B.E., Bay, S.M., Anderson, J.W., 1989. Chronic effects of contaminated sediments on the
urchin Lytechinus pictus. Environmental Toxicology and Chemistry, 8: 629-637. ToxScan, Inc. 1997. Chemical Analysis and Toxicity Evaluation of Sediments at Berths J266-J270, Port
of Long Beach. WEMAP. 1999. Western Environmental Monitoring and Assessment Program. National Coastal
Condition Report. Environmental Protection Office of Water. United States Environmental Protection Agency, Office of Research and Development/ EPA-620/R-01/005. September 2001. Agency Washington, DC 20460 www.epa.gov/owow/oceans/NCCR/index and http://www.epa.gov/region09/water/wemap/.
Weston Solutions, Inc. (WESTON). 2002. Southeast Basin. Dredged Material Evaluation Final Report.
Sampling and Tier III Analysis for Port of Long Beach Southeast Basin Maintenance Dredging. October.
Weston Solutions, Inc. (WESTON). 2005. Final Report. Chemical and Geotechnical Characterization of
Sediments in the Vicinity of Southwest Marine, Port of Los Angeles, Port of Los Angeles, Environmental Management. December.
Weston Solutions, Inc. (WESTON). 2006a. Final Report Chemical and Physical Characterization of
Sediments Near Berth 77 in the Port of Long Beach, California. December

SUMMARY OF SEDIMENT QUALITY CONDITIONS IN THE PORT OF LONG BEACH May 2009
WESTON Solutions, Inc. 67
Weston Solutions, Inc. (WESTON). 2006b. Final Report Chemical and Physical Characterization of Sediments Within Slip 3 for the Pier E Redevelopment Program at the Port of Long Beach, California. December
Weston Solutions, Inc. (WESTON). 2006c. Draft Report. Contaminant Concentrations in Marine
Sediments and Seawater Adjacent to Westway Terminal, Inc. Berths 70-71, Port of Los Angeles. Port of Los Angeles, Environmental Management. December.
Weston Solutions, Inc. (WESTON). 2007a. Final Report Characterization of Sediment Contaminant Flux for the Inner Harbor and Outer Harbor Waterbodies to Support Sediment TMDL Implementation Ports of Los Angeles and Long Beach, California. May.
Weston Solutions, Inc. (WESTON). 2007b. Draft Report Pre-Design Sediment Sampling IR Site 7 (West
Basin) Sediment Remediation Project, Port of Long Beach, California. December. Weston Solutions, Inc. (WESTON). 2007c. Final Report. Chemical and Geotechnical Characterization of
Sediments in the Vicinity of Al Larson Boat Shop, Port of Los Angeles. Prepared for the Port of Los Angeles, Environmental Management. April.
Weston Solutions, Inc. (WESTON). 2007d. Final Report. Chemical and Geotechnical Characterization of
Sediments within the Cerritos Yacht Anchorage Leasehold Area, Port of Los Angeles. Prepared for Port of Los Angeles, Environmental Management. April.
Weston Solutions, Inc. (WESTON). 2007e. Final Report. Chemical and Geotechnical Characterization of
Sediments within the Colonial Yacht Anchorage Leasehold Area, Port of Los Angeles. Prepared for Port of Los Angeles, Environmental Management. April.
Weston Solutions, Inc. (WESTON). 2007f. Final Report. Chemical Characterization of Sediments within
the Southwest Marine Leasehold Areas for Use in Remediation Efforts, Port of Los Angeles. Prepared for Port of Los Angeles, Environmental Management. May.
Weston Solutions, Inc. (WESTON). 2007g. Final Report Chemical and Geotechnical Characterization of
Sediments within the Wilmington Marine Service Leasehold Area, Port of Los Angeles. Prepared for Port of Los Angeles, Environmental Management. April.
Weston Solutions, Inc. (WESTON). 2007h. White Paper. Preliminary Characterization of Mercury
Concentrations and Potential Environmental Impacts in Sediments, Port of Los Angeles. Prepared for Port of Los Angeles, Environmental Management. April.
Weston Solutions, Inc. (WESTON). 2008. Draft Report Sediment Characterization in Support of the
Water Resources Action Plan, Ports of Los Angeles. September. White, M.D. 2009. Images of America: The Port of Long Beach. Charleston, SC: Arcadia Publishing.