point-to-point verification of monitored sensors at
TRANSCRIPT

ESL-TR-04/10-01
Point-to-Point Verification of Monitored Sensors at Reynolds Army Clinic and Hospital
Final Report
Submitted to:
Reynolds Army Clinic and Hospital Fort Sill, Oklahoma
Submitted by:
Joseph Martinez Susan Linenschmidt
Dan Turner, Ph.D, P.E.
October 2004
Energy Systems Laboratory Texas Engineering Experiment Station
Texas A&M University System College Station, Texas 77843-3581

Executive Summary The U.S. Army Corps of Engineers awarded a contract to the Energy Systems Laboratory (ESL) at Texas A&M University through J & J Maintenance to perform a point-to-point verification of the newly upgraded Johnson Controls (JCI) Metasys (Version 12) system, operating at the 512,100 ft2 Reynolds Army Community Hospital (RACH) facility. The RACH facility consists of two sections. A relatively older clinic section (212,000 ft2), a newer hospital section (300,100 ft2) both conditioned by a central air-conditioning system. The air handlers are single duct, constant volume (CAV) or variable air volume (VAV) systems with reheat. There are also a few dual duct constant volume systems. Chilled and hot water is provided by the central energy plant located adjacent to the complex. Heating water is generated by central plant steam through heat exchangers located inside the clinic and hospital. Three McQuay chillers and three natural gas boilers operate in this facility. The chilled water system uses a primary/secondary distribution system. The energy management control system (EMCS) control points for each plant and air handler (AHU) system were verified. The exceptions were three AHUs that serve the elevator rooms. These units are not controlled by the Johnson Controls system. The emphasis of the point-to-point verification was specifically on points used in control algorithms for the heating, ventilation, and air conditioning (HVAC) systems. The control points investigated were temperature sensors, static pressure sensors, airflow sensors, and relative humidity sensors. Faulty sensors were identified, along with sensors that required relocating. Many of the temperature sensors required calibration. During this verification time period, it was not possible to calibrate all the temperature sensors. However, calibration procedures for supply, return, mixed, and preheat temperature sensors were provided to RACH facility personnel. They have been instructed to resume calibration as soon as outside weather conditions permit. ESL recommends that they be performed during winter months or when the outside temperature is less than 65 °F. Fifteen VAV air handlers systems use a return air volume tracking control algorithm. Air flow stations are used to control and monitor supply and return air flow. However, it was found that all the flow stations were not functioning correctly. The pitot tube assemblies were clogged with dust. False signals were being used by the control sequence causing the supply and return fan VFDs to operate at maximum conditions (60 Hz). ESL recommended that each flow station be back flushed with compressed air and that hatches be installed upstream and downstream of each flow station for preventative maintenance. After back flushing, four air handlers could not be calibrated because of a faulty flow station. New control parameters for the airflow stations were downloaded to each DX-9100 controller to increase the response time and accuracy of the return air tracking algorithm. During verification it was found that the static pressure signals provided to AHUs using VFDs were extremely low. After close investigation, it was determined that the static pressure sensors (Flow stations) were configured to measure velocity pressure instead of static pressure. Initial readings ranged from 0-0.3 in. H2O. The pneumatic lines at the
ii

flow station and transducer were corrected and static pressure measurements recorded. The correct values increased to approximately 1.0 in. H2O. Supply fan speeds began decreasing once their static pressure setpoints were satisfied. Two static pressure sensors did not pass verification. ESL recommended that the sensors be cleaned in the same manner as the air flow stations (Back flush the sensor with compressed air). The hospital air handlers use humidity control as part of their control algorithm. Some are controlled in the Direct Digital Control (DDC) and some use pneumatically controlled steam injectors. The majority of the humidity sensors monitor the return air. Six humidity sensors were verified to be out of range. AHU-225 and AHU-226 use supply and return air humidity for control. These two units serve the operating room of the hospital. Their supply humidity sensors for the operating rooms need replacing. Based on information published by Johnson controls, the humidity sensors cannot be calibrated. They can be factory repaired or replaced. ESL has recommended that the following problem areas which were identified during the verification process be given immediate attention.
1. Replace return air humidity sensors for AHU-155, AHU-245, AHU-345, and AHU-355.
2. Replace supply air humidity sensors for AHU-225 and AHU-226. 3. Clean and/or replace the flow stations for AHU-145, AHU-120, AHU220, and
AHU-355. 4. Clean and/or replace static pressure sensors (flow stations) for AHU-175, AHU-
355, AHU-240, and AHU-40. 5. Repair and/or replace the secondary chilled water flow meter and the main
bypass flow meter. 6. Relocate the differential pressure sensors for the clinic and hospital. Place the
sensors near the end of each loop. Each of these items has a direct impact on energy savings for RACH. Correcting these items before the commissioning phase begins is extremely important. Control sequence modifications using these components cannot be implemented until they are corrected.
iii

Table of Contents
Executive Summary...................................................................................... ii Figures............................................................................................................ v Tables ............................................................................................................. v Introduction................................................................................................... 1 Verification/Calibration Equipment........................................................... 1 Calibration Tolerances ................................................................................. 3 Verification/Calibration Procedures........................................................... 3
Temperature Sensors....................................................................................................... 4 Flow Stations .................................................................................................................. 5 Static Pressure Sensors ................................................................................................... 9 Return Air Humidity Sensors.......................................................................................... 9
Central Plant ................................................................................................. 9 Temperature Calibration ................................................................................................. 9 Differential Pressure Sensors........................................................................................ 10 Flow Meters .................................................................................................................. 12
Clinic Section............................................................................................... 14 AHU 20......................................................................................................................... 14 AHU 40......................................................................................................................... 14 AHU 110....................................................................................................................... 16 AHU 120....................................................................................................................... 18 AHU 130....................................................................................................................... 19 AHU 140....................................................................................................................... 21 AHU 210....................................................................................................................... 23 AHU 220....................................................................................................................... 25 AHU 230....................................................................................................................... 27 AHU 240....................................................................................................................... 28 AHU 250....................................................................................................................... 30 AHU 260....................................................................................................................... 31
Hospital Section........................................................................................... 31 AHU 55......................................................................................................................... 31 AHU 56......................................................................................................................... 32 AHU 115....................................................................................................................... 32 AHU 116....................................................................................................................... 32 AHU 125....................................................................................................................... 33 AHU 135....................................................................................................................... 35 AHU 145....................................................................................................................... 37 AHU 155....................................................................................................................... 39 AHU 165....................................................................................................................... 40 AHU 175....................................................................................................................... 41 AHU 215....................................................................................................................... 43 AHU 225....................................................................................................................... 44 AHU 226....................................................................................................................... 46
iv

AHU 235....................................................................................................................... 47 AHU 245....................................................................................................................... 48 AHU 315....................................................................................................................... 49 AHU 316....................................................................................................................... 50 AHU 325....................................................................................................................... 51 AHU 335....................................................................................................................... 52 AHU 345....................................................................................................................... 53 AHU 355....................................................................................................................... 54
Recommendations....................................................................................... 55 Figures Figure 1: Fluke 80PK-24 Probe ......................................................................................... 2 Figure 2: Typical Air Handler Schematic.......................................................................... 4 Figure 3: Return Airflow Station for AHU-130 ................................................................ 7 Figure 4: View of Clogged Pitot Tubes ............................................................................. 8 Figure 5: Central Plant Chilled Water Loop Schematic .................................................. 11 Figure 6: Main Bypass Flow............................................................................................ 12 Figure 7: Secondary Chilled Water Loop Flow............................................................... 13 Figure 8: AHU 135 Return Air Humidity........................................................................ 37 Figure 9: AHU 145 Return Air Humidity........................................................................ 39 Figure 10: AHU 155 Return Air Humidity...................................................................... 40 Figure 11: AHU 225 Supply Air Humidity ..................................................................... 45 Figure 12: AHU 225 Return Air Humidity...................................................................... 45 Figure 13: AHU 226 Supply Air Humidity ..................................................................... 47 Figure 14: AHU 225 Return Air Humidity...................................................................... 47 Figure 15: AHU 245 Return Air Humidity...................................................................... 49 Figure 16: AHU 315 Return Air Humidity...................................................................... 50 Figure 17: AHU 316 Return Air Humidity...................................................................... 51 Figure 18: AHU 345 Return Air Humidity...................................................................... 53 Figure 19: AHU 355 Return Air Humidity...................................................................... 55 Tables Table 1: Temperature Sensor Measurements for Central Plant Chillers ......................... 10 Table 2: Chilled Water DP Sensor Verification .............................................................. 12 Table 3: AHU 20 Initial Temperature Sensor Measurements ......................................... 14 Table 4: AHU 40 Flow Station Parameters ..................................................................... 15 Table 5: AHU 40 Flow Station Error............................................................................... 15 Table 6: AHU 40 Static Pressure Measurements............................................................. 15 Table 7: AHU 40 Initial Temperature Sensor Measurements ......................................... 16 Table 8: AHU 40 Preheat and Mixed Air Temperature Sensor Calibration.................... 16 Table 9: AHU 110 Flow Station Parameters ................................................................... 17 Table 10: AHU 110 Flow Station Error........................................................................... 17
v

Table 11: AHU 110 Static Pressure Measurements......................................................... 17 Table 12: AHU 110 Initial Temperature Sensor Measurements ..................................... 18 Table 13: AHU 120 Transducer Maximum Flow............................................................ 18 Table 14: AHU 120 Static Pressure Measurements......................................................... 19 Table 15: AHU 120 Initial Temperature Sensor Measurements ..................................... 19 Table 16: AHU 130 Flow Station Parameters ................................................................. 20 Table 17: AHU 130 Flow Station Error........................................................................... 20 Table 18: AHU 130 Static Pressure Measurements......................................................... 20 Table 19: AHU 130 Initial Temperature Sensor Measurements ..................................... 21 Table 20: AHU 130 Mixed Air and Preheat Temperature Sensor Calibration................ 21 Table 21: AHU 140 Flow Station Parameters ................................................................. 22 Table 22: AHU 140 Flow Station Error........................................................................... 22 Table 23: AHU 140 Static Pressure Measurements......................................................... 22 Table 24: AHU 140 Initial Temperature Sensor Measurements ..................................... 23 Table 25: AHU 140 Mixed Air and Preheat Temperature Sensor Calibration................ 23 Table 26: AHU 210 Flow Station Setup .......................................................................... 24 Table 27: AHU 210 Flow Station Error........................................................................... 24 Table 28: AHU 210 Static Pressure Measurements......................................................... 24 Table 29: AHU 210 Initial Temperature Sensor Measurements ..................................... 25 Table 30: AHU 210 Mixed Air and Preheat Temperature Sensor Calibration................ 25 Table 31: AHU 220 Static Pressure Measurements......................................................... 26 Table 32: AHU 220 Initial Temperature Sensor Measurements ..................................... 26 Table 33: AHU 220 Mixed Air and Preheat Temperature Sensor Calibration................ 26 Table 34: AHU 230 Flow Station Parameters ................................................................. 27 Table 35: AHU 230 Flow Station Error........................................................................... 27 Table 36: AHU 230 Static Pressure Measurements......................................................... 28 Table 37: AHU 230 Initial Temperature Sensor Measurements ..................................... 28 Table 38: AHU 230 Mixed Air and Preheat Temperature Sensor Calibration................ 28 Table 39: AHU 240 Flow Station Setup .......................................................................... 29 Table 40: AHU 240 Flow Station Error........................................................................... 29 Table 41: AHU 240 Static Pressure Measurements......................................................... 29 Table 42: AHU 240 Initial Temperature Sensor Measurements ..................................... 30 Table 43: AHU 240 Mixed Air and Preheat Temperature Sensor Calibration................ 30 Table 44: AHU 250 Initial Temperature Sensor Measurements ..................................... 30 Table 45: AHU 260 Initial Temperature Sensor Measurements ..................................... 31 Table 46: AHU 55 Initial Mixed Air and Preheat Temperature Sensor Measurements.. 31 Table 47: AHU 56 Initial Preheat Temperature Sensor Measurements .......................... 32 Table 48: AHU 115 Initial Mixed Air and Preheat Temperature Sensor Measurements 32 Table 49: AHU 116 Initial Preheat Temperature Sensor Measurements ........................ 33 Table 50: AHU 125 Flow Station Parameters ................................................................. 33 Table 51: AHU 125 Flow Station Error........................................................................... 34 Table 52: AHU 125 Static Pressure Measurements......................................................... 34 Table 53: AHU 125 Supply and Return Air Temperature Calibration............................ 34 Table 54: AHU 125 Mixed Air and Preheat Sensor Verification.................................... 35 Table 55: AHU 135 Flow Station Parameters ................................................................. 35 Table 56: AHU 135 Flow Station Error........................................................................... 35
vi

Table 57: AHU 135 Static Pressure Measurements......................................................... 36 Table 58: AHU 135 Mixed Air and Preheat Temperature Sensor Calibration................ 36 Table 59: AHU 145 CFM Comparison............................................................................ 37 Table 60: AHU 145 Flow Station Verification Measurements ....................................... 38 Table 61: AHU 145 Static Pressure Measurements......................................................... 38 Table 62: AHU 145 Mixed Air and Preheat Temperature Sensor Verification .............. 38 Table 63: AHU 155 Discharge and Return air Temperature Sensor Calibration ............ 39 Table 64: AHU 155 Mixed Air and Preheat Temperature Sensor Calibration................ 40 Table 65: AHU 165 Flow Station Parameters ................................................................. 41 Table 66: AHU 165 Flow Station Error........................................................................... 41 Table 67: AHU 165 Static Pressure Measurements......................................................... 41 Table 68: AHU 175 Flow Station Parameters ................................................................. 42 Table 69: AHU 175 Flow Station Calibration Error........................................................ 42 Table 70: AHU 175 Static Pressure Measurements......................................................... 43 Table 71: AHU 175 Supply Air Temperature Sensor Calibration Measurements .......... 43 Table 72: AHU 175 Mixed Air Temperature Sensor Calibration.................................... 43 Table 73: AHU 215 Mixed Air and Preheat Temperature Sensor Calibration................ 44 Table 74: AHU 225 Mixed Air and Preheat Temperature Sensor Verification .............. 46 Table 75: AHU 226 Mixed Air and Preheat Temperature Sensor Verification .............. 46 Table 76: AHU 235 Supply and Return Air Temperature Sensor Calibration ................ 48 Table 77: AHU 235 Mixed Air and Preheat Temperature Sensor Measurements .......... 48 Table 78: AHU 245 Supply and Return Air Temperature Sensor Calibration ................ 48 Table 79: AHU 245 Mixed Air and Preheat Temperature Sensor Calibration................ 49 Table 80: AHU 315 Mixed Air and Preheat Temperature Sensor Verification ............. 50 Table 81: AHU 316 Mixed Air and Preheat Temperature Sensor Verification .............. 51 Table 82: AHU 325 Mixed Air and Preheat Temperature Sensor Calibration................ 52 Table 83: AHU 335 Supply and Return Air Temperature Sensor Calibration ................ 52 Table 84: AHU 335 Mixed Air and Preheat Temperature Sensor Calibration................ 52 Table 85: AHU 345 Mixed Air and Preheat Temperature Sensors Calibration .............. 53 Table 86: AHU 355 Static Pressure Measurements......................................................... 54 Table 87: AHU 355 Supply Air Temperature Sensor Calibration Measurements .......... 55
vii

Introduction A point-to-point verification of the heating, ventilating, and air conditioning (HVAC) system of the Reynolds Army Community Hospital (RACH) in Fort Sill, Oklahoma was done by the Energy Systems Laboratory (ESL) of Texas A&M University. Work began on January 12, 2004 and was completed on July 2, 2004. The facility consists of a clinic section having 212,000 ft2 and a hospital section with 300,100 ft2. Both sections are contained in one building for a total of 512,000 ft2. The clinic section of the facility is occupied from 0700 hours – 1700 hours while the hospital side operates 24/7. Verification of the facility began shortly after the completion of a $2 million upgrade of the Energy Management Control System (EMCS) by Johnson Controls from their existing 8540 pneumatic system to a direct digital control (DDC) Metasys version 12.0 system. Only the points read by the control system and used for control sequencing were verified. In the following sections of this report detailed information will be provided for the type of equipment used for the point-to-point verification and calibration, calibration tolerances for the devices requiring calibration, areas that require attention prior to calibration, and calibration procedures. The remaining sections will focus on the central plant, clinic, and hospital areas. Each section will contain individual field data for each component tested and calibrated. Verification/Calibration Equipment Flow measurement Airside: A VelociCalc® Plus Air Velocity Meter, Model 8386A, was used to verify and calibrate air flow stations, temperature sensors, relative humidity sensors, and static pressure sensors. The specifications for this multifunction meter are as follows. Velocity from thermal sensor: Range: 0-9999 Ft/min Accuracy: ±3 % of reading or ±3 Ft/min which ever is greater Velocity from a pitot tube: Range: 250-15500 Ft/min Accuracy: ±1.5 % at 2000 Ft/min Temperature: Range: 14-140°F Accuracy: ±0.5 % Relative Humidity: Range: 0-95% RH Accuracy: ±3.0 % Static/Differential Pressure: Range: -5 - +15 in. H2O Accuracy: ±1.0 % of reading ±0.005 in. H2O
1

Waterside: A Panametric flow meter was used to verify the chilled water flow meters. It is an ultrasonic type flow meter, model PT868. This meter was configured for the Transit-time mode. Ultrasonic pulses are emitted from the meter into the fluid medium in order to calculate flow velocities through cross correlation and various digital signal processing techniques. The flow accuracy for this configuration (Transit-time mode) is dependent on pipe diameter. For pipe diameters greater than 6 inches, the accuracy is 2% of reading for velocities less than 1 Ft/sec. Pipe diameters less than 6 inches have an accuracy of 2-5% of reading. Temperature measurement Digital Thermometer: A Fluke 54-II Digital Thermometer was used to measure temperature. The electronic offset function maximizes overall accuracy by compensating for thermocouple errors. This instrument has an accuracy of ±(0.05% of reading +0.5°F). The range for a K-type thermocouple is –328°F to 2,501°F. Temperature Probe: In place of the standard bead thermocouple that comes with the digital thermometer, a Fluke 80PK-24 SureGrip Air Probe was used attached to the digital thermometer in order to gain temperature measurements.
Figure 1: Fluke 80PK-24 Probe
The probe is 8.5” long and made from Inconel (See Figure 1). The measurement range is –40.0°F to 1,500.8°F. This probe is compatible with K-type thermocouples. Error generated by the probe is reduced by the electronic offset function within the digital thermometer. A perforated baffle surrounds the probe to protect it during use. Relative Humidity measurement The HOBO® Logger, model H08-007-02, is a portable device designed to trend relative humidity for extended periods of time. These loggers were placed adjacent to existing
2

humidity sensors inside the air handler for point-to-point comparison. The operating range of these loggers is 0-95% relative humidity non-condensing. The accuracy is ±5% for the full operating range. Electro-pneumatic transducer Calibration The Flute 743B Documenting Process Calibrator can act either as a measurement or as a source device. It is capable of calibrating temperature, pressure, voltage, current, resistance, and frequency. The system supports devices using either linear or square root functions. It also acts as a data logger. The 743B Calibrator allows for downloading procedures and instructions from a PC. Calibration Tolerances Temperature sensors used in the energy management control system (EMCS) upgrade were TEP and TEA series Platinum sensors. TEP (Probe type) sensors were used for supply air, return air, and chilled water (water side) temperature sensing. The TEA (Averaging type) series Platinum sensors were used for sensing mixed air and preheat air temperatures. These 1000 ohm sensors are configured as passive inputs for their designated controller. The accuracy of these sensors is ±1°F at 70°F. Johnson Control does not provide information on whether the percent error of the sensing element is based on the measured value or full scale. The differential pressure transducers used in the upgrade were manufactured by Setra with specification provided by Johnson Controls. The published performance data for these transducers state that the standard accuracy is ±0.5% full scale (FS). The factory set zero output (4 ma) is within ±0.16 ma and the span output (20 ma) is set to within the same tolerance. NOTE: Calibration tolerances are based on published information provided by Johnson Controls. Verification/Calibration Procedures According to the “As built” mechanical drawings for the RACH facility, there are thirty seven air handler units serving the complex. There are fifteen VAV air handler systems and nineteen constant volume systems. Three of the constant volume systems are thermostatically controlled. They provide cooling for the elevator equipment. Since these units are not monitored by the Metasys control system they were not calibrated at this time. These units are listed as AHU-401, AHU-402, and AHU-403.
3

Temperature Sensors Readings from the DX-9100 controller were compared with measured temperatures in order to determine which sensors were out of calibration. When ever possible, the sensor accuracy was compared at two different temperatures before calibrations were made. The offsets for supply air temperature and return air temperature were found by using the following procedure. Figure 2 illustrates the typical air handler configuration for the variable air volume and constant volume systems at this facility. Procedure:
1. Manually close the Preheat valve and Chilled Water valves on the air handler (See Figure 2).
2. Modulate outside air and return air dampers to maintain a 55°F mixed air temperature. To maintain a 55°F mixed air temperature override the mixed air set point in the controller or manually fix the outside and return air dampers.
3. Wait for the system to stabilize (approx. 15 min.). 4. Record the corresponding SAT and RAT values from the DX-9100 controller and
TSI. 5. Once all values have been recorded. Open the return air damper and then close
the outside air damper. Wait for the system to stabilize. 6. Record the SAT and RAT values from the DX-9100 controller and TSI. 7. Calculate the offset between the DX-9100 controller and the measured values for
each corresponding point. Determine the average offset. 8. Use the average offset values to adjust the digital counts of the controller.
Figure 2: Typical Air Handler Schematic
Preheat and mixed air use averaging temperature sensors which can make comparison to a single point probe difficult. The following procedure described is for calibrating mixed air temperature (MAT) and preheat temperature (PHT) sensors using the existing Supply air temperature (SAT) and Return air temperature (RAT) sensors located on the air
4

handler (See Figure 2). This is a two-point calibration procedure. In using this procedure the assumption is made that the SAT and RAT temperature sensors have recently been calibrated. Procedure:
1. Manually close the Preheat valve and Chilled Water valves on the air handler. 2. Modulate outside air and return air dampers to maintain a 55°F mixed air
temperature. To maintain a 55°F mixed air temperature override the mixed air set point in the controller or manually fix the outside and return air dampers.
3. Wait for the system to stabilize (approx. 15 min.). The MAT, PHT and SAT should be reading ± 1.5°F of each other. The SAT will normally read slightly higher than the MAT and PHT because of the heat generated from the fan.
4. Record the MAT, PHT, and the SAT values from the DX-9100 controller. 5. Once all values have been recorded, open the return air damper and then close the
outside air damper. Wait for the system to stabilize. 6. Record the MAT, PHT, and SAT values from the DX-9100 controller. 7. Calculate the offset between the MAT and SAT and the offset between the PHT
and SAT sensors. 8. Use the offset values to adjust the digital counts of the controller.
The criteria for determining which sensors to calibrate takes into account the heat gain across the fan and a tolerance of ±1.0°F for the accuracy of the averaging sensors used. The heat gain across each fan was calculated by making the assumption that the fan brake horsepower is 70% of its maximum motor horsepower and that sensible heat is the only contribution to the temperature rise across the fan. Therefore the following equation can be used to solve for the temperature difference.
Tmq cp∆=
••
Where, is the sensible heat transfer from the motor, is mass flow rate of the air, and is the specific heat of air. The average temperature increase from the fan for each air
handler was approximately 1.0°F. The offset values provided in the calibration tables for the mixed air and preheat temperature sensors, take into account the heat gain across the supply fan.
•
q•
m
cp
Flow Stations The air handler units operating on VAV systems use a return air volume tracking algorithm in order to control the return air fan speed. The fan is ramped as needed based on a predetermined differential between supply and return air flow. The differential setpoint is based on the design specifications of the building. Initially, there was a
5

significant difference between measured flow, and the flow read by the DX-9100 controllers. There were many variables in this particular airflow system that created error in the actual flow reading displayed by the DX controller. Software settings, pneumatic transducers incorrectly sized for their corresponding airflow station, and clogged flow stations all contributed to the total error. For example, during verification it was not uncommon to find that the High CFM limit programmed in the controller did not correlate to the flow necessary for the Setra pressure transducers to output 20 mA. In some cases the square root function, which linearized the input signal to the controller, was not enabled. In addition to these problems, it was found that some of the pneumatic transducers installed did not match what was stated in the control drawings, which were provided by Johnson Controls. The maximum CFM, or High CFM limit, listed in the controller is used to determine the airflow through the flow station. The controller processes the mA signal that it receives from the transducer as a percentage of the total transducer span and associates that with the percentage of the CFM range for the air handler. The AI (analog input) point setup allows the designer to choose whether this association is linear or uses a square root function. For pitot tube style flow stations, the association should use the square root function. This makes it necessary to have the correct maximum CFM entered in the AI configuration for each controller in addition to the square root function being enabled. The most important factor in accurate return air volume tracking control is the response or performance of the flow station. The flow stations at RACH use a multi-pitot tube configuration to send an average velocity pressure signal to the input transducer (See Figure 3). The following fundamental equation is used to convert velocity pressure to a velocity. This equation can only be used if the fluid media is air.
pvVelocity *4005= where vp is velocity pressure, in inches of water column, and the velocity is in feet per minute (FPM). The air flow, in CFM, can then be determined by multiplying the calculated velocity by the cross sectional area of the duct. The maximum CFM equals the airflow for a 20 mA output signal from the transducer (100% of its range). The ontroller can interpolate for slightly higher velocity pressures, but accuracy is lost. c
The most common problem associated with pitot type flow station is the sizing of the transducers. The transducers achieve their greatest accuracy when measuring a differential pressure in the upper half of their range. If the velocity pressure is too low, the signal will be compromised because the magnitude of the noise signal is comparable to the actual signal. The DX-9100 controller cannot distinguish between the actual signal nd typical input signal noise. a
6

Figure 3: Return Airflow Station for AHU-130
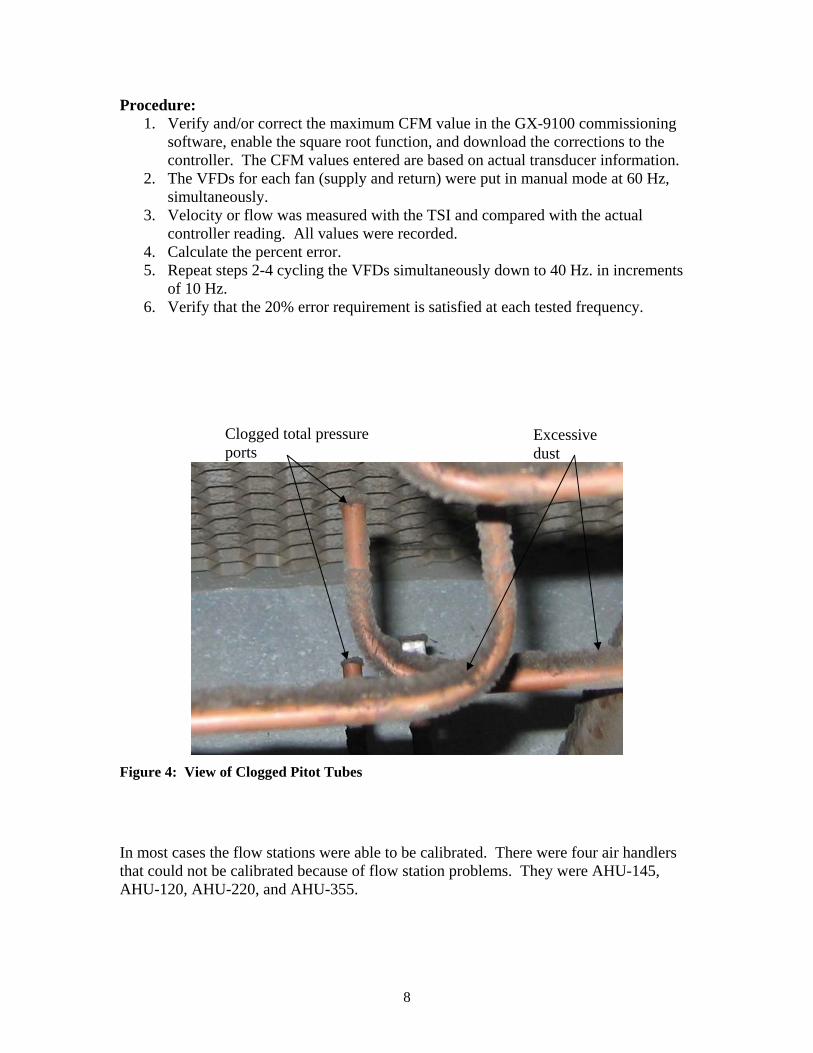
Figure 3 is a photograph of a flow station located on the return airside of air handler 130. It is accessible from the return fan plenum. The flow stations used in the other air handlers are not accessible. Notice the excessive amount of dust on the tubing and that some of the tubes that measure the total pressure are completely covered with dust. The blockage is causing the averaging sensor to send a skewed signal to the transducer. In order to illustrate this further, a more detailed picture is provided (See Figure 4). ESL recommended that each and every flow station be cleaned. Compressed air was used to back flush the tubing assembly. Pressurization of the flow station pitot tubes will force dust from the clogged ports into the ductwork. For future cleanings it is important to remember to remove the lines connecting the transducer or the high pressure will damage it. Service doors should be installed in the ductwork before and after the flow station to remove the excess debris and for preventative maintenance. Before calibration began on the flow stations, each flow station under went a preliminary test to determine if calibration was possible. A TSI, Veloci-Calc meter, was used to measure the velocity of the air in the duct which was then compared to the measured differential pressure signal generated from the flow station (Measured with a second TSI). The pressure signal was converted to a velocity. If both velocity readings were within 20 % of each other then the flow station could be calibrated. If either flow station (SA or RA) did not meet the criteria (20 % error) then neither of the flow stations were calibrated for that air handler. The flow stations that satisfied the 20% error criteria were calibrated using the following procedure.
7
Procedure: 1. Verify and/or correct the maximum CFM value in the GX-9100 commissioning
software, enable the square root function, and download the corrections to the controller. The CFM values entered are based on actual transducer information.
2. The VFDs for each fan (supply and return) were put in manual mode at 60 Hz, simultaneously.
3. Velocity or flow was measured with the TSI and compared with the actual controller reading. All values were recorded.
4. Calculate the percent error. 5. Repeat steps 2-4 cycling the VFDs simultaneously down to 40 Hz. in increments
of 10 Hz. 6. Verify that the 20% error requirement is satisfied at each tested frequency.
Clogged total pressure ports
Excessive dust
Figure 4: View of Clogged Pitot Tubes
In most cases the flow stations were able to be calibrated. There were four air handlersthat could not be calibrated because of flow station problems. They were AHUAHU-120, AHU-220, an
-145,
d AHU-355.
8

Static Pressure Sensors The static pressure sensors for the air handlers were typically located about 2/3 of the
ay down the longest run. The static pressure sensor is used to modulate the supply air aken with a single pitot tube extending into the duct or a
e
reach e static pressure setpoint so the supply fan motor runs at 100% all the time. For static
ressure to be read, the “low” port on the flow station needs to be connected to the “high” cer. The “high” port on the flow station should be connected. The
ference, “low”, port on the transducer should be exposed to the surrounding
ensors monitoring return air humidity control the steam humidifiers for the supply air of readings in either direction could cause discomfort to
s
he central plant located adjacent to the facility provides chilled water, steam, and one 350-ton
rimary/secondary loop system (See Figure 5). A small 38-ton ch is in i l for emergency use. Three natural gas steam tea ion (two at 350-BHP and one at 250 rs inside the clinic and hospital are used to provide heating water (40% l mix) in the hosp nd clinic. Measurement points for steam and hot water were not accessible for verification. Temperature Calibration Both supply and return temper were m red on condenser and evaporator (Chilled water) si f each o chille the ce lant. T measurements were done by directly measuring the tempe of a nuous st of water from each pipe. The results are shown in Table 1. A temperature difference less than one degree is the acceptable toleran nly single point verification was performed on the
wfan. Normally static pressure is tplate mounted flush on the side of the duct with a small hole exposed to the airflow. However, at RACH this was not the case. Flow stations were used as static pressursensors. In many cases, both high (total pressure) and low (static pressure) ports wereconnected to the Setra pressure transducer. When this is the case, the velocity pressure is read by the controller instead of the static pressure. Velocity pressure will never thpport on the transdureatmospheric conditions. A two point calibration procedure was performed on the static pressure sensors. The supply side VFD was put in manual mode during calibration. The VFD was first commanded to 60 Hz and then 40 Hz. At each calibration point the static pressure wasmeasured with a TSI meter and compared with the value displayed at the controller. Return Air Humidity Sensors Sthe hospital units. Incorrect patients while low humidity readings would also result in an excess usage of steam. While some humidity sensors allow for small calibrated adjustments, many of the sensorhad offsets that went far beyond the calibration limits and required replacement. Central Plant Tdomestic hot water to the building. Two 500-ton McQuay chillers and chiller supply chilled water to the complex. The chilled water uses a p
illerboilers are
stalled used for s
n the hospitam product
-BHP). Heat exchange glyco ital a
atures easu thedes o f the 3 rs in ntral p hese
rature conti ream
ce. O
9

sensors. Creating larg
10
e temp n would cause cooling problems in the hospital and clinic areas. Table 1: Temperature Senso Central Plant Chillers
Chiller Name Point Name DX-9100
(° F) Measured
(° F)
TemDifference
(°F)
erature spa
r Measurements for
perature
CWS 76.3 76.3 0 CWR 82.1 81.6 0.5
CHWS 40.8 40 0.8 M-1
CHWR 51.4 50.9 0.5 CWS 79.8 79.1 0.7 CWR 86.2 86 0.2
CHWS 42.5 41.3 1.2 M-2
CHWR 53.4 53.5 -0.1 CWS 78.1 77.4 0.7 CWR 84.5 84.4 0.1
CHWS 43.4 41.8 1.6
CHWS after calibration 41.9 42 -0.1
CHWS 2nd point 43.7 44 -0.3
M-3
CHWR 57.2 56.4 0.8 The temperature sensor for the chilled water supply on chiller M-3 required calibration. Once the sensor was adjusted, the chilled water supply setpoint was increased a few degrees to check the response of the sensor. The new temperature values were recorded. Differential Pressure Sensors Secondary chilled water loop differential pressure was measured for both the hospital and clinic sides of the complex. Return pressure was measured independently of supply and then subtracted to find differential pressure. For the hospital, it was necessary to disconnect the tubing to the DP sensor to gain access to the water pressure directly. DX readings were taken before and after measurements to ensure that the value did not change during the time it took to take the measurements (See Table 2).

ESL-TR-04/10-01
Figure 5: Central Plant Chilled Water Loop Schematic

Table 2: Chilled Water DP Sensor Verification
DP Sensor
Pump Setting
DX-9100 DP (psi)
Measured DP (psi)
Difference (psi)
60 Hz 17.3 18.0 -0.7 Clinic 40 Hz 12.0 12.0 0.0 40 Hz 8.6 9.0 -0.4 Hospital 50 Hz 14.8 16.0 -1.2
Before these measurements were taken, the secondary chilled water loop pumps were placed in hand and the system was allowed to settle in order to minimize fluctuation. The pumps were then ramped down in order to allow for a 2-point verification. Neither of the differential pressure sensors required calibration. Both sensors are located too close to the central plant. ESL recommends that both sensors be relocated to the ends of their perspective loops and adjust the differential setpoints accordingly. Flow Meters The flow meters for the main bypass of the chilled water loop and the secondary chilled water loop were checked using a Panametric flow meter for comparison against the paddle wheel type flow meters that are currently connected to the Metasys system. Both flow meters currently installed are made by Flow Research Corporation. The data collected between the Metasys trend data for the Main Bypass Flow and measured data found using the Panametric flow meter is shown in Figure 6.
Main Bypass Flow
450MetasysPanametric
150
200
250
300
350
400
Flow
(GPM
)
1009:27 9:30 9:33 9:36 9:38 9:41 9:44 9:47 9:50
Time Figure 6: Main Bypass Flow
12

Approximately 20 minutes of “Snap-shot” data from the Panametric flow meter andsecondary loop flow meter was collected. Because these are “Snap-shot” data points, they cannot be compared directly. The
the
response time of the Panametric flow meter and e paddle wheel type flow meter are not the same. Also, the Panametric flow meter uses
n integrating algorithm to calculate the flow where the DX-9100 controller does not. The DX-9100 controller can only provide instantaneous values from the paddle wheel type flow meter. The “Snap-shot” data was averaged over the time period of the data collection. The average offset of Metasys trend data compared with the Panametric flow meter was approximately 57 GPM with Metasys reading higher than the Panametric. It is not possible at this time to determine if the bypass flow meter is out of calibration. Further data collection is needed in addition to testing and calibration of the signal transducers. One reason for signal discrepancy may be caused by inclusion of multiple transducers in the wiring from the flow meter to the controller. For this particular meter, the output of the flow meter is converted into a mA signal and then into a voltage signal by a second transducer. It is then inputted into the DX-9100 controller. The error in converting from mA to voltage is a possible contributing factor for discrepancies in the flow. It should also be noted that Flow Research flow meters have difficulty accurately measuring velocities of less than 1 ft/s or a flow of 150 GPM for the 8” bypass line. Flows less than 150 GPM will contain a larger error.
tha
Secondary Loop Flow
1100
400
500
3:07 PM 3:14 PM 3:21 PM 3:28 PM 3:36 PM 3:43 PM 3:50 PM 3:57 PM 4:04 PM 4:12 PM
Time
MetasysPanametric
600
700
800
900
1000
Flow
(GPM
)
Figure 7: Secondary Chilled Water Loop Flow
13

Figure 7 illustrates the data collected for the secondary chilled water loop flow meter. The average offset measured between the flow meters was 539 GPM. Metasys showed the flow to vary between 480 GPM and 483 GPM. The Paname eter measured flow va at v between 93 1097 GPM. The for the Panametric flow meter during the twent ut per 02 . on the data collected e chilled water l low er, the r has furthe ation is needed to determ hy nput s is co t (i.e ddle wheel blades are , loos ad el s ). C ntly her of these flow meters are used for ntral plan control operatio r this on, low
eters have not been calibrated or repaired at this time.
en to verify the sensors for this unit are shown .
tric flow maverage flowlues th aried 7 GPM and
y min e time iod was 1 0 GPM Based for th oop f met mete failed. However,
r investig ine w the i ignal nstan . pabroken e or b ectrical connection , etc… urre neit
ce t n. Fo reas the fm Clinic Section AHU 20 This is a single duct constant volume unit that serves the northwest corner of the hospital basement. Temperature measurements takin Table 3 Table 3: AHU 20 Initial Temperature Sensor Measurements
Readings 1st readings 2nd readings
Air Handler Name
Sensor Name
DX-9100 Field Offset DX-9100 Field Offset DAT 60.3 60.0 0.3 73.3 73.0 0.3 RAT 74.1 74.5 -0.4 74.7 74.7 0.0 MAT 58.8 61.0 -2.2 79.9 73.2 6.7
AHU-20
PHT 71.0 71.5 -0.5 During initial testing, the mixed air sensor on AHU 20 was identified as needing calibration. However, the offset between the DX-9100 controller and the TSI probe was n ference in offsets between the readings at different temi s that n e of alib s in t. It i en t sor b place fore t to adjus digital of the analog input point in question.
HU 40 s
,
ot consistent. The difndicate
peratures correc this se sor is drifting or that the slop the c ration curve i
s recomm ded hat the sen e re d be rying t the counts
AAir handler 40 is a single duct variable air volume system with variable frequency drive(VFDs) on both its return and supply air fans. This system serves the majority of the clinic basement including autopsy, computer repair, corridors, offices, ADPE Fixx centerequipment management, reproduction center, housekeeping, elevator lobby, conferenceroom, orderly supply room, women’s locker, telephone equipment room, and inventory management. The supply air was designed to have a flow between 17,640 CFM and 22,520 CFM while the return air modulates from 10,030 to 13,550 CFM. The
14
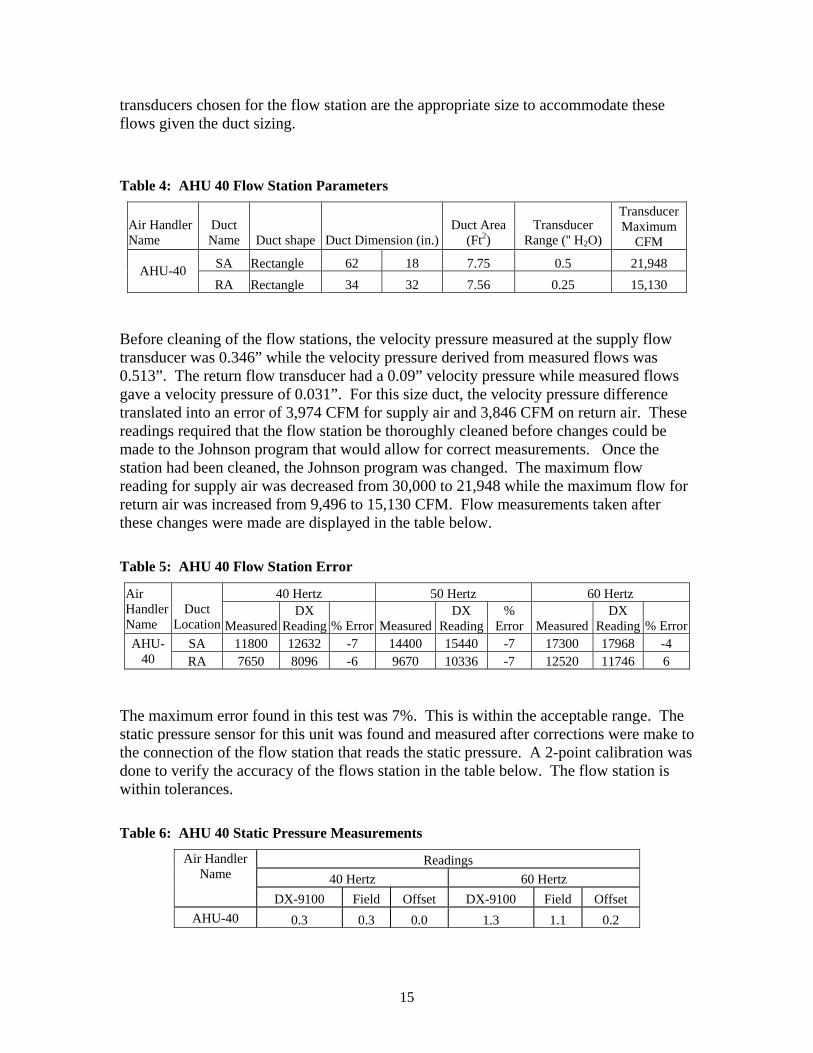
transducers chosen for the flow station are the appropriate size to accommodate these flows given the duct sizing. Table 4: AHU 40 Flow Station Parameters
Air HandName
l uct )
Are)
Transducer sducer
aximum er DName Duct shape Duct Dimension (in.
Duct(Ft2
a Range ('' H2O)
MC
Tran
FM SA an 5 ,94 Rect gle 62 18 7.7 0.5 21 8 AHU-40RA tan 6 ,13
Rec gle 34 32 7.5 0.25 15 0
Before cleaning of the flow stations, the velocity pressure measured at the supply flow transducer was 0.346” while the velocity pressure derived from measured flows was 0.513”. The return flow transducer had a 0.09” velocity pressure while measured flows gave a velocity pressure of 0.031”. For this size duct, the velocity pressure difference translated into an error of 3,974 CFM for supply air and 3,846 CFM on return air. These
adings required that the flow station be thoroughly cleaned before changes could be or correct measurements. Once the
station had been cleaned, the Johnson program was changed. The maximum flow reading fo was decreased from 30,000 to 21,948 while the maximum flow for return air was increased from 9,4 ,130 CFM. Flow me ts taken after these changes were mad lay th be
remade to the Johnson program that would allow f
r supply air96 to 15 asuremen
e are disp ed in e table low.
Table 5: AHU 40 Flow Station Error
40 Hertz 50 Hertz 60 Hertz Air Handler Name
Duct Location Measured
DX Reading % Error Measured
DX Reading
% Error Measured
DX Reading % Error
SA 11800 12632 -7 14400 15440 -7 17300 17968 -4 AHU-40 RA 7650 8096 -6 9670 10336 -7 12520 11746 6
The maximum error found in this test was 7%. This is within the acceptable range. The static pr r for this unit was found and m fter corrections were make to the connection of the flow station e static pressure. A 2-point calibration was done to the l within tolerances. Table 40 Pressu easur ts
Readings
essure senso
verify
easured athat reads th
accuracy of the flows station in the tab e below. The flow station is
6: AHU Static re M emen
40 Hertz 60 Hertz Air Hand
Name
DX-9100 Field Offset DX-9100 Field Offset
ler
AHU-40 0.3 0.3 0.0 1.3 1.1 0.2
15

Initial temperature measurements are shown in Table 7. The discharge air temperature nd return air temperature sensors were calibrated during the 1st and 2nd visits by ESL
bove measured r to move it
into the air stream. It now reads within tolerance. Table 7: AHU 40 Initial Te a n n
Reading
aengineers. The supply/discharge air temperature sensor now reads 0.5°F atemperature. The return air temperature sensor had to be relocated in orde
mper ture Se sor Measureme ts
s 1st readings adings 2nd re
Air HandlerName
S
91 eld et 00 Field t
ensor Name
DX- 00 Fi Offs DX-91 OffseDAT 60.3 66.3 -6.0 63.0 73.3 -10.3 RAT 72.8 74.3 -1.5 73.1 74.9 -1.8 MAT 64.9 69.1 -4.2 72.7 73.3 -0.6
AHU-40
PHT 66.8 67.8 -1.0 73.2 72.4 0.8 Final calibration of the mixed air and preheat temperature sensors was performed bRACH personnel. The results are shown below in Table 8. Table 8: AHU 40 Preheat and Mixed Air Temperature Sensor Calibration
Readings
y
1st readings 2nd readings
Air Handler 40 Sensor Name SAT Sensor Calibration Offset SAT Sensor Calibration OffsetMAT 63.8 63.8 -1 75.5 75.9 -1.4 Before
Calibration PHT 63.8 62.6 0.2 75.5 74.2 0.3 MAT 66.9 65.7 0.2 76.8 75.9 -0.1 After
Calibration HT 66.9 P 65.8 0.1 76.8 75.5 0.3 A
ir handler 110 is a single duct variable air volume system with variable frequency rives (VFDs) on both its return and supply air fans. It is located in section B, near the
nd
er for this air handler was incorrect given the duct sizing. riginal programming listed the supply air and return air maximum CFMs as 14,000 and ,288, respectively. This offset may have been an attempt to compensate for dirt in the
flow stations when the programming was done, as time went by, the readings grew
HU 110 AdNW corner of the 1st floor. The air handler serves the west corridor, Procedure room, exam rooms, chief Peds, reception waiting, office, lounge, south corridor, clinical support, chief ambulatory, supply room, podiatry, orthopedic, physical asst, and orthopedic surgeon. The supply air for the unit is designed to operate between 7,525 a11,185 CFM while the return air was designed for 5,030 to 8,690 CFM. The maximum CFM listed in the controllO9
16

further apart from measured values. The calculated maximum flows, based on the t ducer range, for AH re listed below 9. Table 9: AHU 110 Flow St Pa ter
rans U 110 a in Table
ation rame s
Air Handlere
Duct Name Duct shape
Duct mensi(in.) (Ft2)
Transducer Ra ('' H2O) Maximum CFM
Di on Duct Area nge Transducer Nam
SA Oval 31 21 3.86 0.5 10,942 AHU-110 RA Rectangle 34 22 5.19 0.25 10,402
Btr
efore cleaning of the flow stations, the velocity pressure measured at the supply flow ansducer was 0.54” while the velocity pressure derived from measured flows was
dler were of the correct size and did not need to be replaced. After cleaning of the flow stations and program changes, the following m low stations were now reading correctly (See Table 10).
able 10: AHU 110 Flow Station Error
0.624”. The transducers for airflow on this air han
easurements were taken to ensure that the air f
T
40 Hertz 50 Hertz 60 Hertz Air Handler Name
Duct Location Measured
DX Reading % Error Measured
DX Reading
% Error Measured
DX Reading % Error
SA 5983 7260 -21 7263 9088 -25 9418 10808 -15 AHU-110 RA 5260 5000 5 6513 6340 3 7811 7588 3
The static pressure sensor for this air handler was not connected correctly. Modifications
the pneumatic tubing were made to correct the situation. The results are shown in
Table 11 c Pressure
ings
toTable 11.
: AHU 110 Stati Measurements
Read40 H Hertertz 60 z
Air Handler
DX 0 F Of DX- Fiel fs
Name
-910 ield fset 9100 d Of et AHU-1 0 0. 0. 0.0 10 0.1 0.1 .0 4 4
Temperature readings were also taken for this air handler (See Table 12). The discharge
rn air temperature sensors are within specified tolerances, but the mixed air rs so
air and retuand preheat temperature sensors still require calibration. These are averaging sensotheir calibration must be done using the procedure described in the Calibration section. Due to the need for a two point calibration, the calibration of these sensors must wait
17

until cold weather would allow for a proper temperature variation in the calibration process without creating problems within the space conditioned by this air handle Table 12: AHU 110 Initial Temperature Sensor Measurements
Readings
r.
1st readings 2nd readings
Air Handler Sensor Name Name
DX-9100 Field Offset DX-9100 Field Offset DAT 60.5 60.6 -0.1 71.9 71.8 0.1 RAT 72.4 72.2 0.2 72.8 72.6 0.2 MAT 59.3 60.9 -1.6 69.8 71.8 -2.0
AHU-110
5 2 3 PHT 8.5 6 .2 -3.7 69.8 71.1 -1.
HU 120
rn air is controlled between 6,410 and 12,390 CFM. As of et, we have been unable to calibrate the flow stations for this air handler due to roblems with the supply side air flow station. Attempts to clean this flow station have
hatches to physically clean the is air handler will run as designed.
The curre s in the controller (See Table 13) are different given the duct sizing, and should be adjusted once stations are operating correctly.
able 13: AHU 120 Transducer Maximum Flow
AThis is a single duct VAV system that is located on the NW corner of the 1St floor, section B. It is a single duct VAV system that serves exam rooms, corridors, offices, and lobbies in the first floor of the clinic. The supply air for the unit varies from 8,470 CFM
14,450 CFM while the retutoypbeen unsuccessful. It will be necessary to either install pitot tubes and/or replace the flow station before th
nt maximum flowthe flow
T
AHU Number and Location
Design Transducer
Max CFM for Design Transducer
Max CFM by AHU Design
Max CFM in Controller
AHU 120 RA-F 0.25 15,909 12,390 15,000 AHU 120 SA-F 0.5 13,145 14,450 14,000
Static pressure readings (See Table 14) between the field measurements and JCI readings were m nc ow station was connected ressure would be read instead ity ure.
inimal o of veloc
e the fl press
so that static p
18

Table 14: AHU 120 Static Pressure Measurements
Readings Air Handler Name 40 Hertz 60 Hertz
DX-9100 Field Offset DX-9100 Field Offset AHU-120 0.3 0.3 0.0 0.9 1.0 -0.1
nitial temperatureI measurements (See Table 15) determined that the return air, mixed air,
and preheat temperature sensors required calibration. The return air temperature sensorhas been calibrated. The mixed air and preheat temperature sensors await cold weather which would allow a two point calibration before they are corrected.
Table 15: AHU 120 Initial Temperature Sensor Measurements
Readings 1st readings 2nd readings
Air Handler Name
Sensor Name
DX-9100 Field Offset DX-9100 Field Offset
DAT 59.5 59.8 -0.3 76.5 76.5 0.0 RAT 75.1 73.9 1.2 75.2 74.7 0.5 MAT 63.0 67.7 -4.7 70.7 73.0 -2.3
AHU-120
PHT 63.0 66.5 -3.5 70.8 73.3 -2.5 AHU 130 This is a single duct VAV system that serves the northeast corner of the clinic’s first f e n ma w off ler is ned to p e between 8,470 and 17,720 CFM of conditioned n ce. urn a des to have a flow between 7,710 nd 16,690 CF
flow straighteners or the total pressure pitot bes. It is accessible from inside the air handler. The dirt was removed by hand from is flow station in addition to using compressed air. On the day of cleaning, the
a 0.06” velocity pressure. After cleaning was done, the fans were locked in at 60 Hz. and a velocity pressure of 0.19” was observed which corresponded to a 17,680 CFM flow. Measured flow was 15,700 CFM. This c o o t was later noted that the wrong High Lim eflow entered in the controller was changedon rn t va ho Ta 16
loor. It servnd a fe
s seveices. T
ral treatmehe air hand
t and exam roodesig
s as wellrovid
as the drug monitoring clinic
air i to the spa Ret ir is igneda
M.
Before cleaning of the flow stations, the velocity pressure measured at the supply flow transducer was 0.12” while the velocity pressure derived from measured flows was 0.192”. The return flow transducer had a 0.024” velocity pressure while measured flowsgave a velocity pressure of 0.081”. Both flow stations were back flushed with compressed air. The return airflow station is located in a vertical duct so that any dirt or trash falls directly on the honeycomb airtuthcontroller read 6,000 CFM initially with
hange caused the return fan frequency to drop frit CFM w
m 60 tas in th
47 Hz contr
when it woller. The
as relea maxim
sed. Ium
from 32,750 CFM on supply and 20,000 CFM retu o the lues s wn in ble .
19

Table 16: AHU 130 Flow Station Parameters
Air Handler Name
Duct Name Duct shape
Duct Dimension (in.)
Duct Area (Ft2)
Transducer Range ('' H2O)
Transducer Maximum CFM
SA Rectangle 40 35 9.72 0.5 27,533 AHU-130 RA Rectangle 62 22 9.47 0.25 18,968
Initially, the supply air flow station did not respond as expected. Further investirevealed that the transducer measuring supply air veloci
gation ty pressure was wired to the AI
oint for static pressure and that the AI point for supply airflow was connected to the tatic pressure transducer. This problem was corrected and testing was restarted. Table
Table 17: AHU 130 Flow
40 z Hertz 60 z
ps17 displays the final calibration results.
Station Error
Hert 50 HertAir dler e
Duct Location Measured
DX Reading % Error Measured
DX Reading
% Error Measured
DX Reading % Error
HanNam
SA 12220 13112 -7 15140 16448 -9 17620 19008 -8 AHU-130 RA 9078 10608 -17 11707 13096 -12 14671 15424 -5
The return air is within tolerance but it does not measure as accurately as the supply air. One of the reasons for this is the flow station is mounted in a horizontal position and trash bu s lated on top of the honeyc straighteners blocking air flow to f th igna Static pressure wa ied. T ffset e sta pressur sor w ithintolerance. No calibration was required (See Tab ).
able 18: AHU 130 Static Pressure Measurements
ildup hasome o
accumue pitot tubes. This is skewing the output s
omb flowl.
s verif he o for th tic e sen as w le 18
T
Readings 40 Hertz 60 Hertz
Air Handler Name
DX-9100 Field Offset DX-9100 Field Offset AHU-130 0.4 0.3 0.1 1.1 1.0 0.1
Initial measurements of the temperature sensors for AHU 130 showed that all the sensors on this unit required calibration (See Table 19).
20

Table 19: AHU 130 Initial Temperature Sens ments
adings
or Measure
Re 1st ngs 2nd ngs readi readi
Air r S
D 00 eld t D 0 d O t
HandleName
ensor Name
X-91 Fi Offse X-910 Fiel ffseDAT 60.9 .9 .3 59 1.0 74.5 73 1.2 RAT 70.4 .5 .9 73 -3.1 70.0 73 -3.9MAT 70.2 61.9 8.3 72.2 70.6 1.6
AHU-130
PHT 61.6 61.7 -0.1 71.1 68.6 2.5 The discharge and return air temperature sensors for this unit were calibrated by RACHpersonnel. No calibration data was recorded. However, these sensors were verified by ESL Engineers. The mixed air and preheat temperature sensors were later calibrated using the method described in the calibration section (Table 20).
Table 20: AHU 130 Mixed Air and Preheat Temperature Sensor Calibration
Readings 1st readings 2nd readings
Air Handler 130
Sensor Name SAT Sensor
Calibration Offset SAT Sensor
Calibration Offset
MAT 64.5 59.6 3.9 75.8 71.1 3.7 Before Calibration PHT 64.5 62.7 0.8 75.8 73.5 1.3
MAT 65.5 63.1 1.4 76.3 74.4 0.9 After Calibration PHT 65.5 64.3 0.2 76.3 74.7 0.6
AHU 140 This is a single duct VAV system is lo d o southea rner of the clinic’s
rst floor, section D, an Primary Care, Superviso Clerk, pharmffice records, records, specimen collection, reception specimen collection, lounge,
HU ,090
.17” while the velocity pressure derived from measured flows was 0.12”.
rn flow transducer had a 0.001” velocity pressure while measured flows gave a e Johnson Controls program listed 13,000 CFM
for the maximum flow of supply air and 25,000 the maximum flow of return air. These values have been changed to those listed in Table 21.
that cate n the st corfi d serves the Chief acy,
ocorridor, SW pharmacy, NE pharmacy, and SE pharmacy. The supply air for the Aoperates between 6,840 and 9,330 CFM while the return air is controlled between 6and 8,580 CFM. Before cleaning of the flow stations, the velocity pressure measured at the supply flowransducer was 0t
The retuvelocity pressure of 0.002”. Initially, th
CFM for
21

Table 21: AHU 140 Flow Station Parameters
Air Handler Name
Duct Name Duct shape
Duct Dimension (in.)
Duct Area (Ft2)
Transducer Range ('' H2O)
Transducer Maximum CFM
SA Oval 33 20 3.99 0.5 11,292 AHU-140 RA Rectangle 46 20 6.39 0.25 12,794
he transducers of both supply and return air were calibrated by ESL personnel to Tminimize error. After the flow stations were cleaned, measurements were taken to determine % error between the DX Panel readings and measured flows. As seen in Table 22, the error was minimal and errors for both the supply and return CFMs were in the ame direction. s
Table 22: AHU 140 Flow Station Error
40 Hertz 5 60 Hertz 0 Hertz Air Handler Name
Duct Location Measured
DX Rea r
DX in
%
DX % Errording % Error Measu ed Read g Error Measured Reading
SA 5232 3 50 656 8 2 5406 68 6 3 186 8016AHU-140 RA 2986 2964 1 3770 3660 3 4718 4232 10
With both return and supply fans running at 60 Hertz, the air handler is using less than
alf the maximum return airflow that it was designed for. The return air duct is oversized iven the flow it is accommodating. Although our measurements came out close to those
t
that RACH replace this transducer with one that us .1” velocity pressure scale. Static p e re for this air handler wer mel fte e was determined that the pneum co were m stin med. results are shown in Table 23.
able 23: AHU 140 Static Pressure Measurements
hgon the DX Panel, they could just as easily been out of tolerance given the inherenproblems of correctly measuring velocity pressure at such a low velocity. It is suggested
es a 0 - 0
ressur adings e extrennected inco
y low. A r clos inspection it atic lines were
The rrectly. Once the repairs
ade, te g resu
T
Readings 40 Hertz 60 Hertz
Air Handler Name
DX-9100 Field Offset DX-9100 Field Offset AHU-140 0.2 0.2 0.0 0.6 0.6 0.0
Initial tem ents are shown he mixed air temsensor was the only sensor tha
perature measurem in Table 24. T perature t was out of the acceptable tolerance.
22

Tab 14 ial erature Sensor surem
Reading
le 24: AHU 0 Init Temp Mea ents
s 1st readings adings 2nd re
Air Handler Name
SName
DX-9100 Field Offset DX-9100 Field Offset
ensor
DAT 59.6 58.9 0.7 76.2 75.3 0.9 RAT 74.1 72.9 1.2 73.7 74.3 -0.6 MAT 58.5 61.3 -2.8 73.5 73.5 0.0
AHU-140
PHT 59.1 57.8 1.3 73.6 72.4 1.2 The mixed air sensor was calibrated as shown in the Table 25. Table 25: AHU 140 Mixed Air and Preheat Temperature Sensor Calibration
Readings 1st readings 2nd readings
Air Handler 140
Sensor Name SAT Sensor Calibration Offset SAT Sensor Calibration OffsetMAT 66.2 64 1.2 76.4 74.8 0.6 Before
Calibration PHT 66.2 64.9 0.3 76.4 75.3 0.1 MAT 76.6 75.9 -0.3 67.7 66.5 0.2 After
Calibration PHT 76.6 75.4 0.2 67.7 66.3 0.4 AHU 210
erves conference rooms, a computer room, and low for the unit is scheduled to be
m e 4,260 and 9, m t 2,830 to 7,600 CFM. The transducer range for th ply air tionTh ve n versight o hnsthe bill of ate trol d ings e co size is st The corre
ansducer range (0 – 0.5”) was installed by Johnson Controls after being notified by ACH personnel. A section of return air duct upstream and downstream of the return air
aximum flows programmed in the controller were changed from 32,752 on supply air d in Table 27. Initially the program for the
ear input. The input configuration was modified to incorporate the square root function. This will correct the software input s n n.
This is a single duct VAV system that soffices on the second floor of the clinic. Supply airf
aintained b tween 030 CFM. Return airflowe sup
is meant to be flow sta
aintained a was wrong.
is may ha m
bee an o n Jo on Controls during installation. According to rial on the con raw , th rrect ated. ct
trRflow station does not match what is stated in the mechanical “AS BUILT” drawings. Theduct and flow station are smaller than specifications. Either the duct was modified during initial construction and not documented or it was changed at a later date for reasons unknown. Mand 7,000 on return air to the flows listesupply airflow point was configured as a lin
ignal tra slatio
23

Ta 6: 21 Station Setup ble 2 AHU 0 Flow
Air HaNam
ndler Duct Duct Dimension Duct Area 2
Transducer Range Transducer e Name Duct shape (in.) (Ft ) ('' H2O) Maximum CFM
SA Oval 38 17 4.06 0.5 11,485 AHU-210 RA Rectangle 24 18 3.00 0.25 6,008
The supply and return air flow stations have been calibrated (See table 27). The percent
direction. The tracking of return air to supply air ler will be even more accurate pared to having the percent er tions.
able 27: AH w Station Error
40 Hertz 50 Hertz 60 Hertz
error for supply and return airflows are in the same for this air handror in opposite direc
as com
T U 210 Flo
Air Handler Name
Duct Location Measured
DX Reading % Error Measured
DX Reading
% Error Measured
DXReadi
ng % Error
SA 6305 6712 -6 7880 8648 -10 9752 10392 -7 AHU-210 RA 3327 3638 -9 4570 4692 -3 5417 5644 -4
The static pressure sensor for this air handler was not connected correctly. Modifications
the pneumatic tubing were made to correct the situation. The calibration results are own in Table 28.
Table 28: U 210 Static Pressure Measurements
tosh
AH
Readings 40 rHertz 60 He tz
Air Hand e
D 00 O DX Fie fse
ler Nam
X-91 Field ffset -9100 ld Of t AHU- 0 0. 0.0 210 0.2 0.2 0.0 .6 6
Initial measurements shown in Table 29, verified that the discharge and return temperature sensors did not need calibration.
24
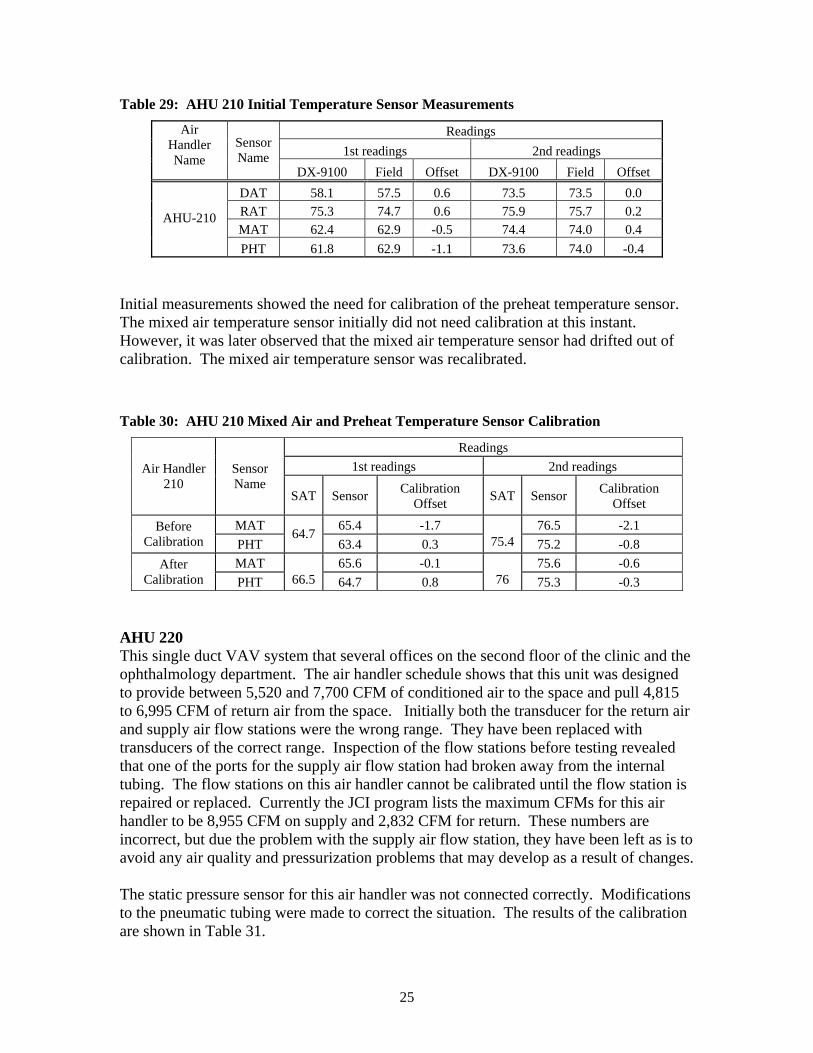
Table 29: AHU 210 Initial Temperat Measurements
ing
ure Sensor
Read s 1st readings 2nd readings
Air Handler
e Sensor
91 eld et 00 Field t Nam Name
DX- 00 Fi Offs DX-91 OffseDAT 58.1 57.5 .5 73.5 0.6 73 0.0 RAT 75.3 74.7 .9 75.7 0.6 75 0.2 MAT .4 62.9 .4 74.0 62 -0.5 74 0.4
AHU-210
PHT 61.8 62.9 -1.1 73.6 74.0 -0.4 Initial measurements showed the need for calibration of the preheat temperature sensor. The mixed air temperature sensor initially did not need calibration at this instant. However, it was later observed that the mixed air temperature sensor had drifted out of calibration. The mixed air temperature sensor was recalibrated. Table 30: AHU 210 Mixed Air and Preheat Temperature Sensor Calibration
Readings 1st readings 2nd readings Air Handler
210 Sensor Name
SAT Sensor Calibration Offset SAT Sensor Calibration
Offset MAT 65.4 -1.7 76.5 -2.1 Before
Calibration PHT 64.7
63.4 0.3
75.4 75.2 -0.8 MAT 65.6 -0.1 75.6 -0.6 After
Calibration PHT
66.5 64.7 0.8 76 75.3 -0.3 AHU 220 This single duct VAV system that ral o s o e sec floor he c and the
phthalmology departm nt. The air handler is unit was designed provide between 5,520 and 7,700 CFM of conditioned air to the space and pull 4,815
lists the maximum CFMs for this air
he static pressure sensor for this air handler was not connected correctly. Modifications matic tubing were made to correct the situation. The results of the calibration
seve fficeschedule shows that th
n th ond of t clinio etoto 6,995 CFM of return air from the space. Initially both the transducer for the return air and supply air flow stations were the wrong range. They have been replaced with transducers of the correct range. Inspection of the flow stations before testing revealed that one of the ports for the supply air flow station had broken away from the internal tubing. The flow stations on this air handler cannot be calibrated until the flow station is
paired or replaced. Currently the JCI programrehandler to be 8,955 CFM on supply and 2,832 CFM for return. These numbers areincorrect, but due the problem with the supply air flow station, they have been left as is to avoid any air quality and pressurization problems that may develop as a result of changes. Tto the pneuare shown in Table 31.
25

Table 31: U 220 Static Pressure Measurements AH
40 Hertz 60 Hertz Air Han me100 ld t F
dler Na DX-9 Fie Offse DX-9100 ield Offset
AH 0.5 0.4 1 0.1 U-220 0.1 1.2 .1 The corrected static pressure r will allow th ply ai to mo te a ded.
owever, due to a broken pressure port on the supply air flow station, the return fan has operate in manual mode. The signal from the supply flow station is extremely low,
itial temperature readings showed the need for calibration of return and preheat mperature sensors. The mixed air temperature sensor was marginal and was adjusted to
Tabl 220 Temperature Senso ments
senso e sup r fan dula s neeHtocausing the return fan to idle at minimum speed. Once the flow station is repaired or replaced, the flow stations can be calibrated. Intebring it closer in line with the other sensors.
e 32: AHU Initial r Measure
Readings 1s ings 2nd ngs t read readi
Air Handler Name
Sensor N
DX-9100 Field Offset DX-9100 Field Offset ame
D 0.8 4.3 AT 60.5 6 -0.3 73.8 7 -0.5 RAT 72.1 73.5 -1.4 72.5 74.0 -1.5 MAT 59.7 60.4 -0.7 73.2 74.0 -0.8
AHU-220
PHT 59.0 60.4 -1.4 72.5 74.0 -1.5 After the first set of calibrations, the return and preheat temperature sensors were tested to be within tolerance. Unfortunately, the mixed air temperature sensor was no longer within the required tolerance and recalibration was necessary (See Table 33). Table 33: AHU 220 Mixed Air and Preheat Temperature Sensor Calibration
Readings 1st readings 2nd readings
Air Handler Sensor Calibration C220 Name SAT Sensor Offset SAT Sensor
alibration Offset
Before 1.4 76.6 74.7 0.9 Calibration MAT 63.9 61.5
After Calibration MAT 76.6 74.7 0.9 65 64 0
Al ur r this un ave now bee ibrated and are within tolerances.
l temperat e sensors fo it h n cal
26

AHU 230 his single duct VAV system serves several exam rooms and work rooms, conference
om
orrect the software input signal translation. The corrected maximum CFM values have een entered into the controller’s program and are listed below in Table 34.
T 230 Flow ar eters
Trooms, offices, and a minor surgery area. The unit sends between 7,320 and 10,025 CFM of conditioned air to the space and pulls between 5,285 and 7,990 CFM of return air frthe space. While both supply and return flow stations were connected to transducers of the correct size, the maximum CFMs listed in the controller were incorrect. Initial valuesfor maximum CFM were 24,992 CFM on supply and 10,496 CFM for return. The controller software program for the supply airflow point was configured as a linear input. The input configuration was modified to incorporate the square root function. This will cb
able 34: AHU Station P am
Air HandN ame sha .)
c(F
r2 M
ler Duame
ct N Duct pe
Duct Dimension Du(in
t Area Tt2)
ansducer Range ('' H O)
Transducer aximum CFM
SA 3 5. 0.5 17 Circle 2 59 15,8AHU-230RA Rectangle 42 20 5.83 0.25 11,681
After the flow stations had been cleaned out and programming changes made, the percenterrors on each fl
ow stations was within reasonable limits as shown in Table 35. One
ing that should be noted about the flow station error is that signal from the supply flow ation read higher than the measured value while the return air signal was lower than its easured value. This means for a given supply airflow, the return fan will run faster than
ecessary to supply the return flow that the program requires. However, even taking this till within 20% of the correct value.
Table 35: AHU Station Error
40 Hertz 50 Hertz 60 Hertz
thstmnadditional error into account, the flow stations are s
230 Flow
Air Handler Duct DX % DX % DX % Name Location Measured Reading Error Measured Reading Error Measured Reading Error
SA 6750 7284 -8 8550 9126 -7 10349 10912 -5 AHU-230 RA 5447 4800 12 6510 6160 5 8150 7592 7
The static pressure sensor was calibrated using a two point process. Table 36 reflects the
atic pressure for this air handler with both supply and return fans running at 40 Hz and
stthen at 60 Hz.
27

Table 36: AHU 230 Static Pressure Measurement
4 z 60 He
s
0 Hert rtz Air Han me -9100 d D 0 Fi Offs
dler NaDX Fiel Offset X-910 eld et
AHU 0.2 0.1 1 0.1 -230 0. 0.5 0.4 This air handler was only able to provide a very low static pressure even running at fuspeed. However, it supplied the scheduled amount of air to the space.
ll
emperature measurements were taken for the unit as shown in Table 37. Initially all of
Table 3 Temperature Sen rements
eadin
Tthe temperature sensors required calibration.
37: AHU 2 0 Initial sor Measu
R gs 1 dings 2nd ngs st rea readi
Air Handler Name
SN
100 Field 100 d t
ensor ame
DX-9 Offset DX-9 Fiel OffseD .5 60.5 0 .1 AT 58 -2. 74.7 73 1.6 R .2 73.0 2 .3 73.3 AT 73 0. 73 0.0 MAT 67.8 66.4 1.4 75.0 73.1 1.9
AHU-240
PHT 67.2 65.7 1.5 74.4 72.6 1.8 Discharge air and return air were the first sensors to be calibrated. After they read correctly, the mixed air and preheat temperature sensors were calibrated as shown in Table 38. All sensors for this air handler are now calibrated. Table 38: AHU 230 Mixed Air and Preheat Temperature Sensor Calibration
Readings 1st readings 2nd readings
Air Handler 230
Sensor Name SAT Sensor
Calibration Offset SAT Sensor
Calibration Offset
MAT 65.7 62.7 2 73.7 71.5 1.2 BefoCalibra
re ti P 64 0.7 73.7 9 on HT 65.7 71. 0.8
MAT 65 4 0 73.9 .1 -6 73 0.2 AfterCalibra
tio 5 .5 -0.5 73.9 73.2 -0.3 n PHT 6 64
AHU 240 This is a single duct VAV system that serves conference rooms, offices, a library and records areas. It is a variable speed unit where the supply air is modulated as needed from 5,060 to 10,135 CFM and return air varies between 4,250 and 9,325 CFM. The maximum CFM for the supply flow transducer has been changed from 24,992 CFM. The controller software program for the supply airflow point was configured as a linear input.
28
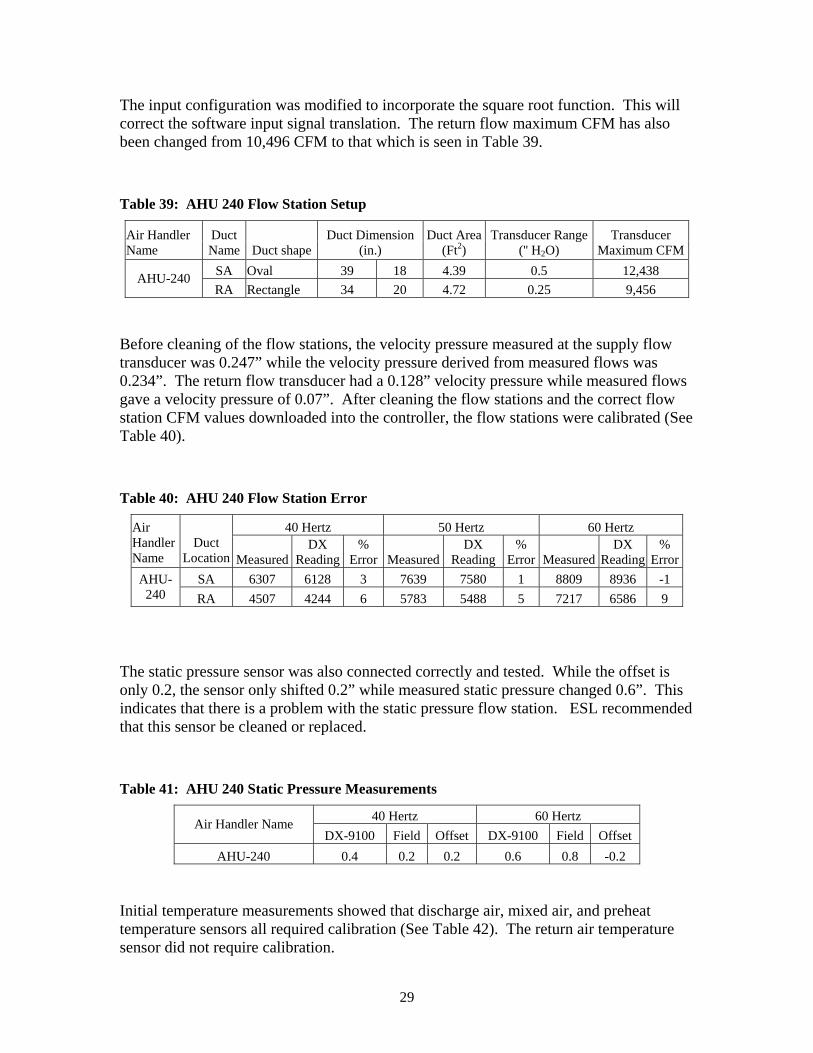
The input configuration was modified to incorporate the square root function. This will correct the software input signal translation. The return flow maximum CFM has also een changed from 10,496 CFM to that which is seen in Table 39.
Table 39: AHU 240 Flow Station Setup
b
AN
t uct ension Duct A(F
Transducer Range duir Handleame
r DucName Duct shape
D Dim(in.)
rea t2) ('' H2O) M
Transaximum
cer CFM
SA 39 1 4.3 0.5 38Oval 8 9 12,4 AHU-240 A gle 34 2 4.7 25 56 R Rectan 0 2 0. 9,4
Before cleaning of the flow stations, the velocity pressure measured at the supply flow
controller, the flow stations were calibrated (See able 40).
Table 40: AHU 240 Flow Station Error
40 Hert z
transducer was 0.247” while the velocity pressure derived from measured flows was 0.234”. The return flow transducer had a 0.128” velocity pressure while measured flows gave a velocity pressure of 0.07”. After cleaning the flow stations and the correct flow station CFM values downloaded into theT
z 50 Hert 60 Hertz Air Handler Name
DucLocation Measured
DX Reading
Error Measured
Reading
Error Measured
Reading
% Error
t % DX % DX
SA 6307 6128 3 7639 7580 1 8809 8936 -1 AHU-9 240 RA 4507 4244 6 5783 5488 5 7217 6586
The static pressure sensor was also connected correctly and tested. While the offset is only 0.2, the sensor only shifted 0.2” while measured static pressure changed 0.6”. This indica he problem w pressure flow sta ecommended that this s ed o d. Table 41 U 240 Static Pressure Measurement
40 rtz 60 He
tes that tensor be clean
re is a ith the static tion. ESL rr replace
: AH s
He rtz Air Handler Name DX-9100 Field Offset DX-9100 Field Offset
AHU-240 0.4 0.2 0.2 0.6 0.8 -0.2 Initial temperature measurements showed that discharge air, mixed air, and preheat
mperature sensors all required calibration (See Table 42). The return air temperature sensor did not require calibration. te
29

Table 42: AHU 240 Initial Temperature Sensor Measurements
Readings 1 2nst readings d readings
Air Handler Name
Sensor Name
DX-9100 Field Offset DX-9100 Field Offset DAT 58.5 6 0.5 -2.0 74.7 73.1 1.6 RAT 73.2 73.0 73.3 0.2 73.3 0.0 M .8 66.4 73.1 AT 67 1.4 75.0 1.9
AHU-240
PHT 67.2 65.7 .5 72.6 1 74.4 1.8
he discharge air temperature sensor was corrected in the first stage of calibration. The nd preheat temperature sensors were then calibrated as shown in the Table 43.
Readings
Tmixed air a Table 43: AHU 240 Mixed Air and Preheat Temperature Sensor Calibration
1st readings 2nd readings
Air Ha 2
Sensor SAT Sensor Calibration T Sensor Calibration Offset
ndler40 Name Offset SA
MAT 59.5 3.4 74.7 2.3 55.1 71.4 BeCalibration PHT 5 1 - .8
fore 9.5 59. 0.6 74.7 73 -0.1
M 59.8 .8 0 7 73.5 AT 58 5.1 0.6 After Ca 59.8 .3 -0 7 74 libration PHT 59 .5 5.1 0.1
HU 250 c.
air, mixed air, and preheat temperature sensors all required alibration.
AThis is a constant volume penthouse unit that serves the west atrium section of the cliniIt is located on the northwest corner of the roof. Temperature measurements showed (See Table 44) that the return c Table 44: AHU 250 Initial Temperature Sensor Measurements
Readings 1st readings 2nd readings
Air Handler Name
Sensor Name
DX-9100 Field Offset DX-9100 Field Offset DAT 50.2 50.4 -0.2 50.2 50.3 -0.1 RAT 66.8 73.1 -6.3 67.6 73.3 -5.7 MAT 58.2 57.0 1.2 60.0 56.0 4.0
AHU-250
PHT 56.1 57.0 -0 56.7 56.0 0.7 .9
30

The temperature se for t r handler were not calibrated. They will have to be calibrated as its. The calib n p ure re s that uts ir temperature be below 65 °F.
HU 260 his is a constant volume penthouse unit that serves the eastern waiting rooms in the
ll required calibration.
itial Temperature Sensor Measurements
Readings
nsors his ai weather perm ratio roced quire the o ide a
ATatrium of the clinic. It is located on the northeast corner of the roof. Temperature measurements showed (See Table 45) that the discharge air, return air, mixed air, and preheat temperature sensors a Table 45: AHU 260 In
1st readings 2nd readings Air
Handler Name Name
DX-9100 Field Offset DX-9100 Field Offset
Sensor
DAT 61.9 61.0 0.9 68.0 67.5 0.5 RAT 71.5 72.7 -1.2 71.6 73.3 -1.7 MAT 59.3 59.3 0.0 65.7 66.3 -0.6
AHU-260
PHT 60.6 60.7 -0.1 65.7 64.4 1.3 Temperature sensors for this air handler were not calibrated. They will have to be calibrated as weather permits. The calibration procedure requires that the outside air temperature be below 65 °F. Hospit tion AHU 55
his constant volume unit serves the basement of the hospital and conditions the CADD rea, FMB Administration, CPR storage, silver recovery, mail service, Muari Room,
d several
AHU 55 Initial Mixed Air and Preheat Temperature Sensor Measurements
al Sec
Taassembly area, electric and structural shops as well as the female locker room ancorridors. It is a large unit driven by a 20 hp motor that is designed to supply 22,545 CFM into the conditioned space. The Air-handling Unit Schedule requires a minimum outside airflow of 8,490 CFM. Table 46:
Readings 1st readings 2nd readings
Air Handler Sensor Calibration Calibration Name Name SAT Sensor Offset SAT Sensor Offset
PHT 56.6 0.6 76.7 -1.8AHU 55 58.2 75.90.9MAT 54.7 2.5 74
31

The m an at temperature sen een identified as necalibration (See Table 46) ese s wer c d. T ration procedures could not be performed because the am o r condition d
ot meet the required minimum outside air temperature requirements. See Calibration ction.
ace. Table 47 shows the sults of the verification. The preheat temperature sensor does not require calibration.
Table 47: AHU 56 Initial Preheat Temperature Sensor Measurements
Readings
ixed air d prehe sors have bensors
eding he calib. However, th e not alibrate
bient utside weathe s dinse AHU 56 This is a small constant volume unit serving the basement switchgear room. It is designed to provide 5,040 CFM of conditioned air into the spre
1st readings 2nd readings Air andlerH
Name me SAT S C n
O SAT S C n
O Sensor Na ensor
alibratioffset ensor
alibratioffset
AHU-56 PHT 72.9 .5 -0.6 .2 0.473 37.6 37 AHU 115 This is a constant volume unit that serves the dental clinic and physical therapy is designed to provide 15,585 CFM of air. Table 48 shows the results of the verificaThe preheat temperature sensor requires calibration.
areas. It tion.
able 48: AHU 115 Initial Mixed Air and Preheat Temperature Sensor Measurements T
Readings 1st readings 2nd readings Air
Handler N
Sensor Name SAT S
Calibratioffset SAT S
Calibration ffset ame ensor O
n ensor O
PH 71.1 73.7 T -2.3 -3.2 A MHU 115 AT 69.8 68.9 -0.1 71.5 70.3 0.2
HU 116 his air handler is a constant volume unit that uses 100% outside air and serves the oral
a. It is designed to supply 2,440 CFM of air. There is no mixed air
9).
ATsurgery aretemperature sensor used in the control algorithm. This air handler does have freeze protection. One calibration point for the preheat sensor can be obtain (See Table 4
32
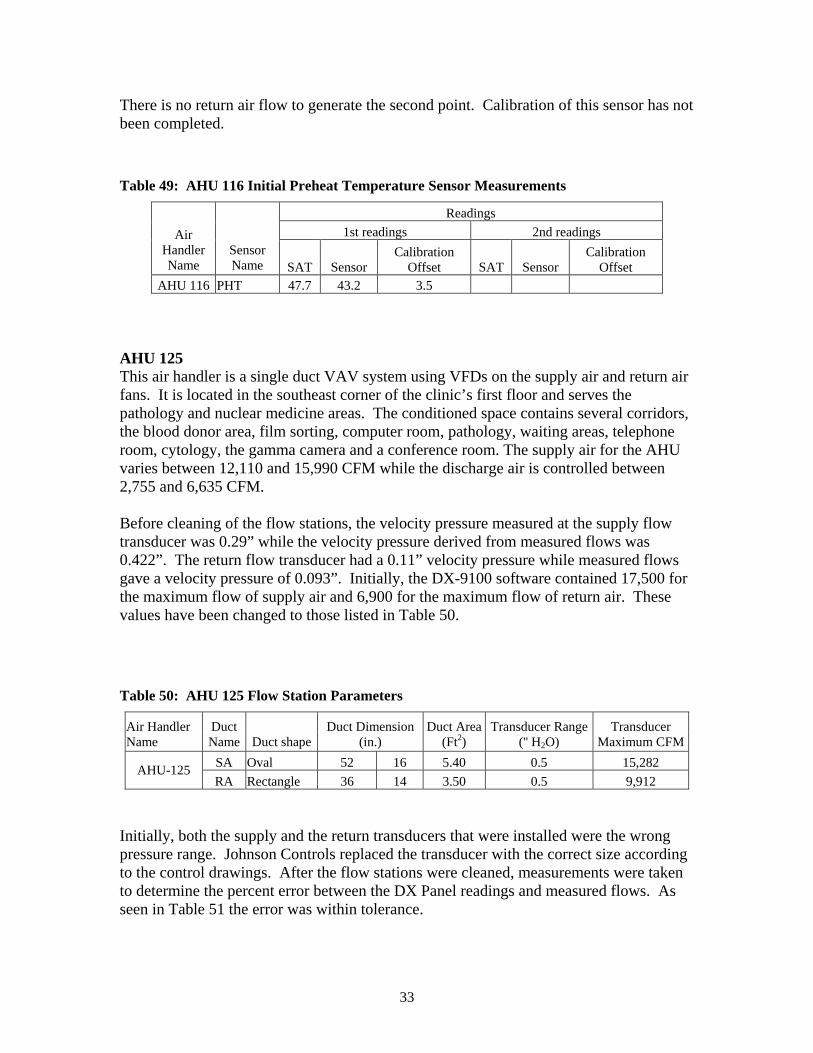
There is no return air flow to generate the second point. Calibration of this sensor has nobeen completed.
t
Table 49: AHU 116 Initial Preheat Temperature Sensor Measurements
Readings 1st readings 2nd readings Air
Handler Name
Sensor Name SAT Sensor
Calibration Offset SAT Sensor
Calibration Offset
AHU 116 PHT 47.7 43.2 3.5 AHU 125 This air handler is a single duct VAV system using VFDs on the supply air and return air fans. It is loca the southea espathology and e area e condit ace contains sev the blood donor area, film sorting, comput om ology, w g areas, te e ro gy amera and a conference room. The supply air for the AHU aries between 12,110 and 15,990 CFM while the discharge air is controlled between ,755 and 6,635 CFM.
e maximum flow of supply air and 6,900 for the maximum flow of return air. These alues have been changed to those listed in Table 50.
T ar ers
ted in nucle
st corner of thes. Th
clinic’s firioned sp
st floor and serv the eral corridors,ar medicin
er ro , path aitin lephonom, cytolo , the gamma c
v2 Before cleaning of the flow stations, the velocity pressure measured at the supply flow transducer was 0.29” while the velocity pressure derived from measured flows was 0.422”. The return flow transducer had a 0.11” velocity pressure while measured flows gave a velocity pressure of 0.093”. Initially, the DX-9100 software contained 17,500 for thv
able 50: AHU 125 Flow Station P amet
A dler N
uct me hap
ct ensi.)
ct (Ft
ran er 2O)
cMa C
ir Haname
DNa Duct s e
Du Dim on Du(in
Area T2)
sduc Range ('' H
Transdu er ximum FM
SA Oval 52 16 5.40 0.5 15,282 AHU-125 RA Rectangle 36 14 3.50 0.5 9,912
Initially, both the supply and the return transducers that were installed were the wrong
ressure range. Johnson Controls replaced the transducer with the correct size according the control drawings. After the flow stations were cleaned, measurements were taken
el readings and measured flows. As
ptoto determine the percent error between the DX Panseen in Table 51 the error was within tolerance.
33
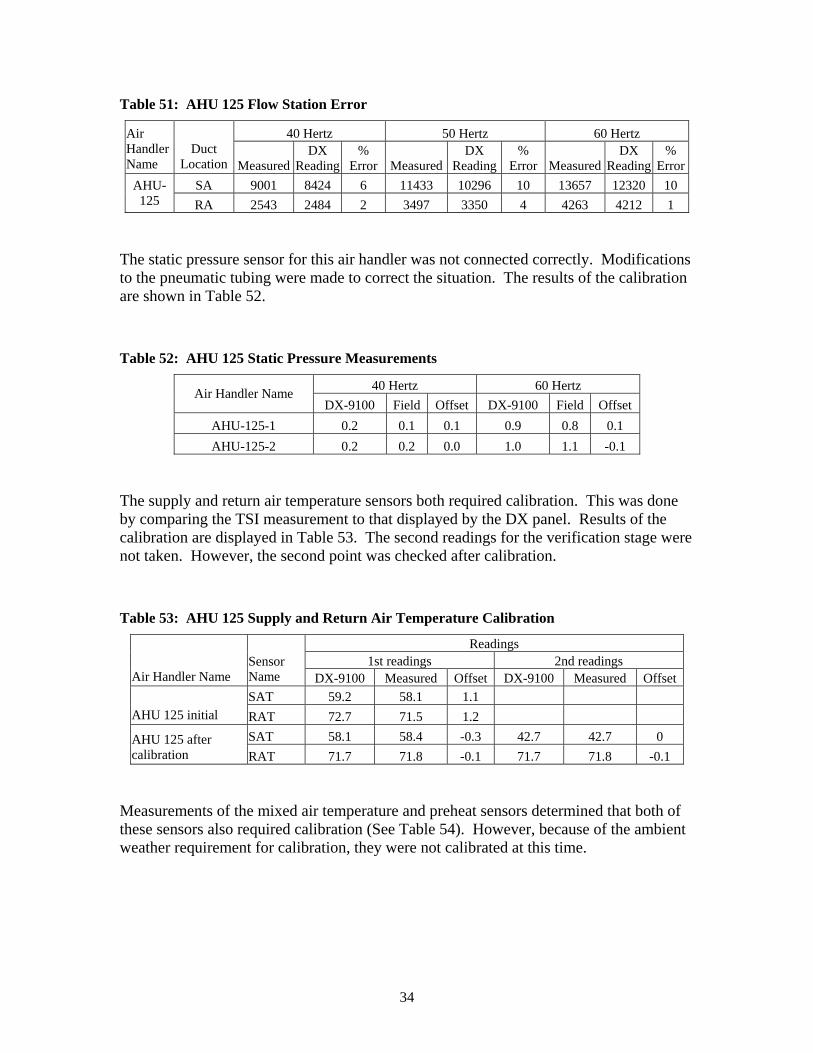
Table 51: AH
40 Hertz ertz 6 z
U 125 Flow Station Error
50 H 0 HertAir dler e
Duct Location Measured
DX Reading
% Error Measured
DX Reading
% Error Measured
DX Reading
% Error
HanNam
SA 9001 8424 6 11433 10296 10 13657 12320 10 AHU-125 RA 2543 2484 2 3497 3350 4 4263 4212 1
The static pressure sensor for this air handler was not connected correctly. Modifications
the pneumatic tubing were made to correct the situation. The results of the calibration
T 5 Pres su
40 H Hertz
toare shown in Table 52.
able 52: AHU 12 Static sure Mea rements
ertz 60Air Hand e 00 F Offs DX-91 Field ffset
ler NamDX-91 ield et 00 O
AHU- 0.1 0. 0.8 125-1 0.2 0.1 9 0.1AHU- 0.0 1. 1.1 1 125-2 0.2 0.2 0 -0.
The supply and return air temperature sensors both required calibration. This was done by comparing the TSI measurement to that displayed by the DX panel. Results of the calibration are displayed in Table 53. The second readings for the verification stage were
ot taken. However, the second point was checked after calibration.
able 53: AHU 125 Supply and Return Air Temperature Calibration
n T
Readings 1st readings 2nd readings
Air Handler Name Sensor Name DX-9100 Measured X-9100 Measured OffsetOffset DSAT 59.2 1.1 58.1
AHU 72.7 .2 125 initial RAT 71.5 1 SAT 58 58 -0.3 42.7 42.7 0 .1 .4 AHU 1
calibr T 1.7 71.8 -0.1 71.7 71.8 -0.1 25 after
ation RA 7 Measuremthese senso
ents of the mixed air temperature and preheat sensors determined that both of rs also required calibration (See Table 54). However, because of the ambient
weather requirement for calibration, they were not calibrated at this time.
34

Table 54: AHU 125 Mixed Air and Preheat Sensor Verification
Readings 1st readings 2nd readings
Air Handler Name
Sensor Name SAT Sensor
Calibration Offset SAT Sensor
Calibration Offset
PHT 40 1.7 56.5 1.4 AHU 125 MAT
42.7 40.4 1.3
58.9 51.4 6.5
AHU 135 T d supply air fans. It se logy, s s, and compreparation areas, d ervices, the roo ale locke m, mammography,
ltrasound roo a ious cor rs. The unit supplies between 11,460 CFM and 0,690 CFM.
.
maximum flows in e DX-9100 controller were changed from 20,000 for supply and 22,000 for return to eir appropriate values as listed in Table 55.
Table 55: A 35 Flow Stati ara ters
his air han ler is a single duct radio
VAV system usevera
ing VFDs on both the return air and s, patient rves
iagnol X-ray roomdark
puter roomr roostic s
nd varm, m
u ms, rido2 Before cleaning of the flow stations, the velocity pressure measured at the supply flowtransducer was 0.2” while the velocity pressure derived from measured flows was 0.24”The return flow transducer had a 0.21” velocity pressure while measured flows gave a
elocity pressure of 0.19”. After the flow stations were cleaned, the vthth
HU 1 on P me
A ler Na
ct e pe
ct D ens)
uc(
Tr duce ' H2
ucM
ir Handme
DuNam Duct sha
Du im ion D(in.
t Area 2Ft )
ans r Range(' O)
Transd er aximum CFM
SA Oval 43 24 6.31 0.5 17,865 AHU-135 RA Circle 38 7.88 0.5 22,304
nce the changes were downloaded into thO e controller, measurements were taken to ompare actual flow with the displayed flow values of the controller (See Table 56).
rance. Supply flow read lower han actual flow.
Table 56: AHU Station Error
40 Hertz 50 Hertz 60 Hertz
cError on both flow stations was within the accepted tolethan the actual flow while return flow read higher t
135 Flow
Air Handler Name
Duct Location Measured
DX Reading
% Error Measured
DX Reading
% Error Measured
DX Reading
% Error
SA 10485 9600 8 11010 10432 5 12073 11032 9 AHU-135 RA 8900 9707 -9 11200 12520 -12 14080 15264 -8
35

The static pressure sensor for this air handler was not connected correctly. Modifications the pneumatic tubing were made to correct the situation. The results of the calibration
fied that the
Table 57: AHU 135 Static ure
40 Hertz rtz
toare shown in Table 57. Measurements taken at low and high fan speeds veriflow station was working correctly.
Pressure Meas ments
60 HeAir Handler NamD 0 Field fset 00 eld Off
e X-910 Of DX-91 Fi set
AH 0.4 0 8 0.U-135 0.4 0. 1.8 1. 0
he supply and return air temperature sensors were calibrated by RACH personnel.
Table 58: AHU 135 Mixed Air and Preheat Temperature Sensor Calibration
Readings
THowever, calibration data was not recorded. ESL Engineers spot checked these sensors prior to verification of the mixed air and preheat temperature sensors. The results are displayed in the Table 58 indicate that the sensors require calibration.
1st readings 2nd readings Air Handler 135
Sensor Name
SAT Sensor Calibration Offset SAT Sensor Calibration
Offset MAT 71.3 -2.6 75.7 -1.5 Before
Calibration PHT 69.7
69.9 -1.2 75.2
75.1 -0.9 MAT 61.4 -0.2 75.2 -0.8 After 62.2 75.4 Calibration PHT 61.4 -0.2 75.4 -1
Return air humidity was monitored for 24 hours using a HOBO® Relative humidity logger and compared with trended data from EMCS. The sensor was found to read an average 7%RH higher than measured. This sensor should not need replacement.
36

AHU 135 Return Air Humidity
60
70
0
20
50
4/21
28/0412
4/28/0421:36
4/29/042:24
4/29/044:48
4/29/7:
04 4/29/0412:00
4/29/0414:24
30
40
%R
H
10
8/04 4/6:48 19:
4/29/040:00
04 4/29/12 9:36
Hobo loggerMetasys
igure 8: AHU 135 Return Air Humidity
f the nce
ispatch. The supply air for the AHU varies between 7,440 and 9,155 CFM.
city pressure measured at the supply flow transd hile the ve ssure derived fro0.22”. The sduc . e pr i a lows gave a velocity pressure of 0.12”. Initially, the Johnson Controls contained 11,000 for
e maximum flow of supply air and 11,000 for the maximum flow of return air. Table 9 lists the design CFM required compared to the values programmed in the DX-9100
Max CFM n
ler
F
AHU 145 This is a single duct VAV system that serves the admitting and emergency areas ohospital in addition to exam rooms, a nurse station, cynecology, trauma, and ambulad Before cleaning of the flow stations, the initial velo
ucer was 0.18” wreturn flow tran
locity pre m measured flows was er had a 0 48” v locity essure wh le me sured f
th5controller. Table 59: AHU 145 CFM Comparison
AHU Number and Location
Design Transducer
for Design Transducer
Max CFM by AHU Design
Max CFM iControl
AHU 145 RA-F 0.25 8,90 6,995 11,000 0AHU 145 SA-F 0.5 12,1 9,155 11,000 36
This air er c t be cal due t rror e r velmeasu ow rs he air v ity ca ed by using the velocity pressure measured by the flow sta Param in this controller were not adjusted.
handl ould no ibrated o the e betwe n the ai ocity red by the TSI fl mete and t eloc lculat
tion. eters
37

Table 60: AHU 145 Flow Station Verification Measurements
Air HandlerName
Percent Error
Duct Location
Average Velocity (FPM)
AFMS Pressure Reading ('' H2O)
AFMS Velocity (FPM)
SA 1570 0.06 981 -60 AHU-149
45 RA 1359 0.44 2657
Attempts at clean ul. It will be necessary to ent. The flow station that serves as ining
Table 61: AHU 145 Static Pressure Measurements
40 Hertz 60 Hertz
ing this air handler’s flow stations have been unsuccessf remove the flow stations for cleaning and/or replacem a static pressure sensor is not in need of cleaning or any rema
calibration. A two point verification was done to ensure that static pressure read correctly at both high and low pressures. The results are shown in Table 61 below.
Air Handler Name eld Offset DX-9100 Field Of DX-9100 Fi fset
AHU-145 0.2 0.3 -0.1 1.3 1.4 -0.1 The supply and return air temperature sensors were calibrated by RACH personnel.
62 indicate that the sensors require calibration.
Readings
However, calibration data was not recorded. ESL Engineers spot checked these sensors prior to verification of the mixed air and preheat temperature sensors. The results aredisplayed in the Table Table 62: AHU 145 Mixed Air and Preheat Temperature Sensor Verification
1st readings 2nd readings Air Handler Sensor Calibration CalibraName Name SAT Sensor Offset Sensor
tion Offset SAT
PHT 53.9 -0.7 -2 71.3 AHU 145 M
54.2 70.3 AT 55.1 -1.9 72.5 -3.2
The ensor was verified by pl g a logge ide thehandler n ng dity sensor (See Figure 9). This se does n quire epl
return air humidity s acin Hobo r ins air ext to the
acement. existi humi nsor ot re
r
38

AHU 145 Return Air Humidity
60
04/28/0
10
30
50
16:48 21:364/2
0:04
244/29/04
4:4804 4/29/04
9:36 12:004/214:
%RH
20
40
4 4/28/0419:12
4/28/04 9/04 4/29/00 2:
4/29/7:12
4/29/04 9/0424
Hobo loggerMetasys
Figure 9: AHU 145 n Air Hu
the food service and dining facilities for the ospital. The unit is designed to supply 19,050 CFM of conditioned air to the space sing a 25 hp motor.
nd the return air temperature sensor were
cess. Data collected before and after alibration is displayed in Table 63.
Retur midity
AHU 155 This is a constant volume unit that serviceshu
Both the discharge air temperature sensor acalibrated using the two-point calibration proc Table 63: AHU 155 Discharge and Return air Temperature Sensor Calibration
Readings 1st readings 2nd readings Air Handler
Name Sensor Name DX-9100 Measured Offset DX-9100 Measured Offset DAT 57.8 56.8 1 67.6 66.6 1
AHU 155 Initial RAT 74.7 73.3 1.4 75.1 74.2 0.9 DAT 66.6 66.5 0.1 57.3 57.1 0.2
AHU 155 Final RAT 74.3 74.3 0 74.2 73.8 0.4 The mixed air and preheat temperature sensors also required calibration. This was done fter discharge and return temperature sensors were calibrated. The mixed air
any farther.
atemperature sensor still contains a larger offset at higher temperatures (Sensor drift) than it does at lower temperatures, but it is accurate for the temperature range that it might be utilized for control purposes. We recommend monitoring this sensor periodically to make sure it does not drift
39

Table 64: AHU 155 Mixed Air and Preheat Temperature Sensor Calibration
Readings 1 ngs adingst readi 2nd re s
Air HaNa
ndme
Se Cal tion O SAT S Calibration
ler
SensorName SAT nsor ibra ffset ensor OffsetPHT 64.7 0.9 55.5 0.8
AHU 155 Initial MAT 66.6 61.6 4 57.3 55.8 0.5 PHT 67.5 0.5 73.4 0.3
AHU 155 Final MAT 69 67.9 0.1 74.7 72.6 1.1 A return air humidity sensor modulates the steam humidifier valve for the supply air to the space. This sensor was found to read 25% too high (See Figure 10). Calibration of this sensor is not possible; replace sensor.
AHU 155 Return Air Humidity
40
50
60
70
90
4/29/0412:00
4/29/0414:24
4/29/0416:48
4/29/0419:12
4/29/0421:36
4/30/040:00
4/30/042:24
4/30/044:48
4/30/047:12
4/30/049:36
%R
H
80
0
10
20
30
Hobo loggerMetasys
AHU 165
his is a single duct VAV system that serves the occupational therapy area and patient rvices. The unit is scheduled to supply between 4,240 and 6,590 CFM to the area.
um return airflow that AHU 165 is designed to pull from the space is 4,735
total
Figure 10: AHU 155 Return Air Humidity
TseThe maximCFM. Before cleaning of the flow stations, the velocity pressure measured at the supply flow transducer was 0.19” while the velocity pressure derived from measured flows was 0.147”. The return flow transducer had a 0.04” velocity pressure while measured flows gave a velocity pressure of 0.088”. These are small offsets but the impact on flow is significant. The difference of 0.043” on supply equates to 562 CFM or 13.6% of theflow. The 0.048” difference in return air velocity pressure becomes 1,413 CFM or 32.6% of the total flow.
40

After cleaning of the flow stations, the maximum CFM listed in the DX-9100 controller was changed. Initially the supply air flow station contained 13,000 CFM as its maximum
FM while return flow was set at 12,000 CFM. The adjusted values for maximum CFM an be found in Table 65
T H F n
Cc
able 65: A U 165 low Statio Parameters
AN
Duct N
D imens n )
Duct Area Transducer Range (''
Transducer Max M
ir Handler ame ame Duct shape
uct D io(in. (Ft2) H2O) imum CF
SA Oval 33 15 3.10 0.5 8,785 AHU-165 RA Rectangle 35 15 3.65 0.25 7,301
When these changes had been downloaded to the controller, measurements were tacompare the DX-9100 readings with the actual flows (See Table 66). While each flow station has an error of less than 20%, the error for supply is in the opposite direction as the error for return. This increases the total error for the system. These measurementwere made after two attempts to clean the flow station. For more accurate readings, anaccess panel would be needed so that the flow stations may be cleaned from the interior
ken to
s .
able 66: AH
Hertz
T U 165 Flow Station Error
40 Hertz 50 Hertz 60Air H ler N
Duct Measured Re
% Er Measured Re
% Er Measured Reading
% r
andame Location
DX ading ror
DX ading ror
DX Erro
SA 4107 4688 -14 5094 5800 -14 5792 6664 -15 AHU-165 R 3 3 1 4 4 1 5 A 843 456 0 838 324 1 838 5008 14
he static pressure sensor for this air handler was not connected correctly. Modifications
able 67: AHU 165 Static Pressure Measurements
60 Hertz
Tto the pneumatic tubing were made to correct the situation. Measurements of staticpressure were taken using a TSI. The calibration results are shown in Table 67. T
40 Hertz Air Handler Name DX-9100 Field Offset DX-9100 Field Offset
AHU-165 0.7 0.0 2.9 0.0 0.7 2.9
HU 175 his is a single duct VAV system that serves the inpatient pharmacy and several offices
on the first floor of the hospital. The unit was originally designed to provide a maximum
AT
41

9,950 CFM of conditioned air to the space while pulling a maximum of 9,045 CFreturn air from the space. Comparison of velocity pressures revealed that the flow stations were in need of calibration. At 60 Hz, the supply flow station measured velocitypressure to be 0.19” while the calculated velocity pressure based on TSI measurementsflow was 0.22”. For return air, the flow station measured 0.1” while 0.12” was the calculated velocity pressure. In addition to cleaning of the flow station, the 0 - 0.5” range transducer for return air had to be replaced with one having the correct 0 – 0.25
M in
of
” range. he maximum flow values entered into the control program were changed from their
the Table
Ta o tio t
Toriginal 6,500 CFM on supply and 24,000 CFM on return to the values listed in68.
ble 68: AHU 175 Fl w Sta n Parame ers
Air e Name Duct shape
D imensi(in.)
uct A(Ft2)
Transducer Rang('' H2O)
Transducer Maximum CFM
Handler Duct uct D on D rea e Nam
SA Circle 26 3.69 0.5 10,441 AHU-175 RA Rectangle 39 21 5.69 0.25 11,389
After cleaning the flow stations, changes were made to the control programs; flow
easurements were taken and compared to Johnson readings. Unfortunately, while the ithin 20% of the
rols reads a higher flow for supply air than does the measurements while the return air flow from Johnson is lower than the measured flow (See Table 69). This increases t all system ri e su nt on this is border line. Recommend rem for cleaning an
able 69: AHU 175 Flow Station Calibration Error
40 Hertz 50 Hertz 60 Hertz
msupply air flow station and the return air flow station both read wmeasured values, the errors are in opposite directions. Johnson cont
he error for the overair er. Conside ng these errors, th
oving the flow flow mea
statioremens from
system HVAC system
handl
d/or replacement.
T
Air Handler Name
Duct Location Measured
DX Reading
% Error Measured
DX Reading
% Error Measured
DX Reading
% Error
SA 4203 4525 -8 5440 5680 -4 6688 6864 -3 AHU-175 RA 6825 5780 15 7775 7070 9 9550 8128 15
The flow station used in static pressure measurement was checked using a 2 point calibration (See Table 70). The controller is displaying higher values than what is actually measured. Recommend using compressed air to back flush the flow station pitot
bes and verify that the digital counts on the controller have not been modified. tu
42

Table 70: AHU 175 Static Pressure Measurements
40 Hertz 60 Hertz Air Handler Name DX-9100 Field Offset DX-9100 Field Offset
AHU-175 0.3 0.1 0.2 1.5 1.1 0.4 It was not necessary to calibrate the return air temp ensor for AHU 175. However, the supply/discharge a re sensor needed calib Table 71). Then two point verification indicates that the higher the supply temperature, the greater th ea t Th d ensor dricalibration curve set at the factory is wrong. The calibra ro e t et so that at no ha su em ures there is v itt fe betw the m p re a he erat displa by t hn pr .
able 71: AHU 175 Supply Air Temperature Sensor Calibration Measurements
Readings
erature sir temperatu ration (See
e offset from the m sured emperature. is could be causetion p
by scedur
ft or the he offs shifted
rmeasured tem
al disc rge/ pply t perat ery l le dif rence eeneratu nd t temp ure yed he Jo son ogram
T
1st readings 2nd readings AHU 175 Calibration
Sensor Name DX-9100 Measured Offset DX-9100 Measured Offset
Before Calibration SAT 47.1 46.9 0.2 62 61.2 0.8 After Calibration SAT 45.8 46.2 -0.4 61.5 61.1 0.4
Verification measurements indicated that the mixed air temperature sensor required calibration (See Table 72). The preheat temperature sensor did not need calibrating athis time.
t
able 72: AHU 175 Mixed Air Temperature Sensor Calibration T
Readings 1st readings 2nd readings
AHU 175 Calibration
Sensor Name SAT Sensor
Calibration Offset SAT Sensor
Calibration Offset
PHT 44.8 0 60.2 0.3 Before Calibration MAT 45.8 43 1.8 61.5 53.3 7.2
PHT 60.4 -0.6 71.1 0.3 After Calibration MAT 60.8 61.6 -1.8 72.4 71.1 0.3
AHU 215 This is a constant volume dual duct unit that serves the critical care patient areas, semi-intensive care patient rooms, the stepdown unit, nurses’ stations, waiting rooms, and pulmonary lab. For humidity control, this system uses steam injection between the supply fan and the heating and cooling coils for the hot and cold decks, respectively.
is of concern with respect to the cold deck. oved before reaching the
However, the location of the steam injectorSteam is being injected into the system and then being rem
43

conditioned space. This is a waste of latent heat or energy. It is not clear at this time hy the air handler was configured in this manner. Economics may have been the
rn air temperature sensor. The mixed air and preheat averaging mperature sensors were compared with the average of the supply air sensors in order to evelop a single offset (See Table 73). Both the mixed air and preheat temperature nsors were calibrated within acceptable tolerances.
able 73: AHU 215 Mixed Air and Preheat Temperature Sensor Calibration
wdriving factor in the placement of the steam injector. Initial measurements displayed that the cold and hot deck temperature sensors were accurate as was the retutedse
T
Readings 1st readings 2nd readings
Air Handler Sensor 215 Name
Cold Deck
Hot Deck Sensor
Calibration Offset
Cold Deck
Hot Deck Sensor
Calibration Offset
MAT 61 63.2 60.2 0.9 71.9 70.5 69.7 0.5 Before Calibration PHT 61 63.2 61 0.1 71.9 70.5 70.5 -0.3
MAT 64.4 64.3 63.3 0.05 72.4 72.1 70.9 0.35 After Calibration PHT 64.4 64.3 63.5 -0.15 72.4 72.1 71.4 -0.15
AHU 225 This air ler unit is a constant v that serves numbe erating rooms, decontam area, patient areas and after surgery, iting room, anesthesiologist’s offices, and various rs o s loor. ir handler was re d because the it did not meet design requirem . After replac ler i ov hat the rn air wa o small to supply the ir handler needs. In order to satisfy the supply air requirements, the outside air design quirements were modified. This unit runs with both the return air damper and the
damper at their 100% open position in order to operate within design
hand olume unit r 1 and 2 opination for prior to
corrido family wa
This an the econd fplace original un ents
ing the air hand t disc ered t retu duct s toareoutside air parameters. Because this unit serves surgery rooms, it has 2 sets of filters. The first set is a typical air handler filter found in the unit itself. A second set of filters are HEPA filters that can be found in the supply air duct. The supply air humidity sensor reads 14% higher than measured values. This error cannot be fully corrected by calibration and the sensor should be replaced.
44

AHU 225 Supply Air Humidity
0
30
40
50
80
90
100
4/27/0414:24
4/27/0412
4/28/044:48
4/ 4/28/0414:24
4/28/04
%R
H
60
70
10
20
19:4/28/04
0:0028/049:36 19:12
Hobo loggerMetasys
igure 11: AHU 225 Supply Air Humidity
t
F
The return air humidity sensor read 6% higher than it should (See Figure 12). It does norequire replacement at this time. We recommend monitoring this sensor. This air handler serves part of the operating rooms. Maintaining the correct amount of humidity
critical for this area. is
AHU 225 Return Air Humidity
0
5
10
15
20
25
30
35
40
45
50
4/28/049:36
4/28/0414:24
4/28/0419:12
%R
H
4/27/0414:24
4/27/0419:12
4/28/040:00
4/28/044:48
Hobo loggerMetasys
igure 12: AHU 225 Return Air Humidity
erify that the preheat temperature nsor is in need of calibration (See Table 74). Thisair handler has not been calibrated
yet due to the lack of cold weather that is necessary to perform the two-point verification.
F
Field measurements compared wit DX-9100 readings vse
45

Table 74: AHU 225 Mixed Air and Preheat Temperature Sensor Verification
Readings 1st readings 2nd readings Air
Handler Name
Sensor Name SAT Sensor
Calibration Offset SAT Sensor
Calibration Offset
PHT 58.6 0.6 63.3 2.2 AHU 225 MAT 60.2 58.7 0.5 66.5 65 0.5
AT
HU 226 his is a constant volume air handler unit that serves number 3 and 4 operating rooms. It
rthern decontamination room, the isolation room, recovery ar thesia work room, and several corridors. This air handler wa ecau in ot meet de ents re e n t was too small to supply the air handler nreq u air design require we odif his u ns wboth the return air da and ou air d r at t 100 en po in o to op ig meter
easurements were taken of return, mixed, preheat, and supply air temperature and then
Table 75: AHU 226 Mixed Air and Preheat Temperature Sensor Verification
Readings
conditions the equipment and clean storage rooms, soiled work rooms, the noeas, anesse the origs replaced b
eal unit did natsign requirem . After placing th air handl
eeds. In order to satisfy the supply air r it discovered th the retur air duc
uirements, the o tside ments re m ied. T nit ru ith mper tside ampe heir % op sition rder
erate within des n para s. Mcompared with Johnson calculations of temperature (See Table 75). The return and supply air temperature sensors did not require calibration. However, the offsets for preheat temperature and mixed air temperature make calibration of these sensors
ecessary. n
1st readings 2nd readings Air Handler Name S S
Sensor Name AT Sensor
Calibration Offset SAT ensor
Calibration Offset
PH 6 5 7T 63.2 .8 4.4 .2 AHU 226 MA 6 5 8T 71 65.1 4.9 2.6 3.3 .3
alibration of the mixed air and preheat temperature sensors were not performed at this ns did not meet the criteria for the calibration procedure. The
Ctime. Ambient conditiosupply air humidity sensor read 9% higher than measured using a HOBO® logger over the course of a day. This is outside the range that the humidity sensor can be calibrated.It should be replaced.
46
AHU 226 Supply Air Humidity
30%
RH
40
50
60
70
80
90
Hobo loggerMe
0
10
20
4/26/0414:24
4/26/0419:12
4/27/040:00
4/27/044:48
4/27/049:36
4/27/0414:24
4/27/0419:12
tasys
Figure 13: AHU 226 Supply Air Humidity
The offset for the return air humidity sensor varied but averaged about 4% higher than
measured. (See Figure 14) This sensor is acceptable.
AHU 226 Return Air Humidity
5
10
40
45
15
20
25
%R
30
35
50
H
Hobo loggerMetasy
04/26/0414:24
4/26/0419:12
4/27/04 0:00 4/27/04 4:48 4/27/04 9:36 4/27/0414:24
4/27/0419:12
s
igure 14: AHU 225 Return Air Humidity F
AHU 235 This is a single duct constant volume air handler that serves the second floor West end nursing unit. It provides 12,350 CFM to the space using a 15 Hp motor. Initial temperature measurements showed the need for calibration of both the return and supply air temperature sensors (See Table 76). Previously the supply temperature sensor developed more error as temperature increased. The offset has been shifted so that there is very little error in the supply temperature range used by the system. The return air temperature also reads correctly now.
47

Table 76: AHU 235 Supply and Return Air Temperature Sensor Calibration
Readings 1st readings 2nd readings
AHU 235 Sensor Name DX-9100 Measured Offset DX-9100 Measured Offset SAT 64.9 64.1 0.8 50.3 50.3 0
Before Calibration RAT 72.1 71.4 0.7 72.9 72.6 0.3 SAT 65 64.5 0.5 51.5 51.9 -0.4
After Calibration RAT 72.8 72.6 0.2 71.5 71.5 0 Table 77 shows the calibration data for the mixed air temperature sensor and the preheaair temperature sensor. Initial measurements indicate that the sensors tend to drift at warmer tem
t
peratures. We recommend monitoring these sensors.
s
Table 77: AHU 235 Mixed Air and Preheat Temperature Sensor Measurement
Readings1st readings s 2nd reading
AiCalib ffse Cal Offset
r Handler 235
Sensor Name SAT Sensor ration O t SAT Sensor ibration MAT 68.9 0.4 76.6 -1.2 Before
C T alibration PH 70.3 69.5 -0.2 76.4 76.5 -1.1MAT 69.9 -0.6 75.4 -1 After
Calibration
70.3 75.4 PHT 69.5 -0.2 74.7 -0.3 AHU 245 This is a single duct constant volume unit that serves the second floor East end nursing
nit. It provides 12,520 CFM to the space. Both return air temperature and supply air temperature sensors required calibration. Table 78 shows the calibration results.
able 78: AHU 245 Supply and Return Air Temperature Sensor Calibration
u
T
Readings 1st readings 2nd readings
Air Handler Name Sensor Name DX-9100 Measured Offset DX-9100 Measured OffsetSAT 42.8 42.9 -0.1 70.2 69.4 0.8
AHU 245 init RAT 70.1 71.1 -1 72.8 73.5 -0.7 SAT 69.8 69.3 0.5 44.4 44.4 0
AHU 245 after RAT 73.2 73.2 0 73.2 73.2 0 Temperature measurements in Table 79, display the need for calibration of preheat anmixed air temperature sensors. W
d hile the preheat temperature sensor is now within
48
calibration tolerances, there are continued problems with the mixed air temperature nsor. Initially, this sensor was out of calibration by as much as 4°F. If this sensor is to
nded that the
Table ed n eat re o ati
Readings
sebe a key component in the control algorithm in the air handler, it is recommesensor be replaced.
79: AHU 245 Mix Air a d Preh Temperatu Sens r Calibr on
1st reading 2nd dings s reaA245
sor Name
SAT Sensor Calibration Offset SAT Sensor Calibration Offset
ir Handler Sen
MAT 48.4 2.2 67 4 Before Calibration PHT
51.6 48.8 1.8
72 70.5 0.5
MAT 50 1.1 68.4 1.9 After Calibration PHT
52.1 50.4 0.7
71.3 71.3 -1
A return air humidity sensor modulates the steam humidifier valve for the supply air to the space. This senso idity
st be replaced.
r was found to read 22% higher than measured relative hum(See Figure 15). This is too large an offset to calibrate. The sensor mu
AHU 245 Return Air humidity
0
10
20
40
50
60
70
80
4/29/049:36
4/29/0412:00
4/29/0414:24
4/29/0416:48
4/29/0419:12
4/29/0421:36
4/30/040:00
4/30/042:24
4/30/044:48
4/30/047:12
4/30/049:36
%RH
Hobo logger
30
Metasys
Figure 15: AHU 245 Return Air Humidity
AHU 315 This single duct constant volume unit is located in the obstetrics area and serves delivery
oms 2 and 3 along with a nursery, nurse’s station, doctor’s call room, maternal child ducation room, scrub room, female locker room, and sleep room. It provides 15,990 FM of air into the space.
roeC
49

Measurements of the mixed air temperature and pr sors determined that both of these sen also required calibra ble 80). However ambient weath io ot meet the criteri ation, they were no at this tim
able 80: AHU 315 Mixed Air and Preheat Temperature Sensor Verification
Readings
eheat sensors
er condite.
tion (See Ta , because thens did n a for calibr t calibrated
T
1st readings 2nd readings Air Handler Name
Sensor Name SAT Sensor
Calibration Offset SAT Sensor
Calibration Offset
PHT 54 4.6 63.8 3.3 AHU 315 59.6 68.1 MAT 55.1 3.5 58.8 8.3
A return air humidity sensor modulates the steam humidifier valve for the supply air to the space. This sensor was found to be only 3% higher than measured (See Figure 16), and does not need recalibrating.
AHU 315 Re umid
0
40
50
60
4/28/0416:48
4/28/0419:12
4/28/0421:36
4/29/040:00
4/29/042:24
4/29/044:48
4/29/047:12
4/29/049:36
4/29/0412:00
4/29/0414:24
turn Air H ity
10
20
30
%R
H Hobo loggerMetasys
Figure 16: AHU 315 Return Air Humidity
AHU 3This is the second u rving the o ics labor and delivery unit. It is a single duct con l lab d bir roo the wai area, delivery room 1, ste orage, and a nurse’s st . It supplies CFM ocon e
hen the temperature sensors on this air handler were checked, it was unnecessary to calibrate the discharge air temperature sensor or the return air temperature sensor, but the mixed air and preheat temperature sensors require calibration (See Table 81). However,
16 nit se bstetr
stant volume unit that conditions severa or an thing ms, ting rile st ation 9,140 f
ditioned air to the spac . W
50

because the ambient weather conditions did not meet the criteria for calibration, they were not calibrated at this time. Table 81: AHU 316 Mixed Air and Preheat Temperature Sensor Verification
Readings 1st readings 2nd readings Air
Handler Name
SenNam
sor e SAT Sensor
Calibration Offset SAT Sensor
Calibration Offset
PHT 67.6 -4.5 AHU 316 MAT 64.1 67 -3.9
A m ensor mod team humidifier valv ply air to the sp This was fo be easured (See Figure 17). It is within acceptable t use in midity c l a .
return air huace.
idity s sensor
ulates the s e for the supund toce for
only 2.5% higher than moleran the hu ontro lgorithm
AHU 316 Re Hunmidity
40
41
46
47
4/26/0414:24
4/26/0419:12
4/27/04 0:00 4/27/04 4:48 4/27/04 9:36 4/27/0414:24
4/27/0419:12
turn Air
42
43
44
45
%R
H
Hobo loggerMetasys
of
Figure 17: AHU 316 Return Air Humidity
AHU 325 This single duct constant volume unit serves the obstetrics nursing unit which consistspatient bedrooms, a lounge, dayroom, locker rooms, and corridor. The unit provides 9,750 CFM of conditioned air to the space. Both the preheat and mixed air temperature sensors are in need of calibration. The preheat air temperature sensor is accurate at low temperatures but drifts from the actual value at higher temperatures.
51
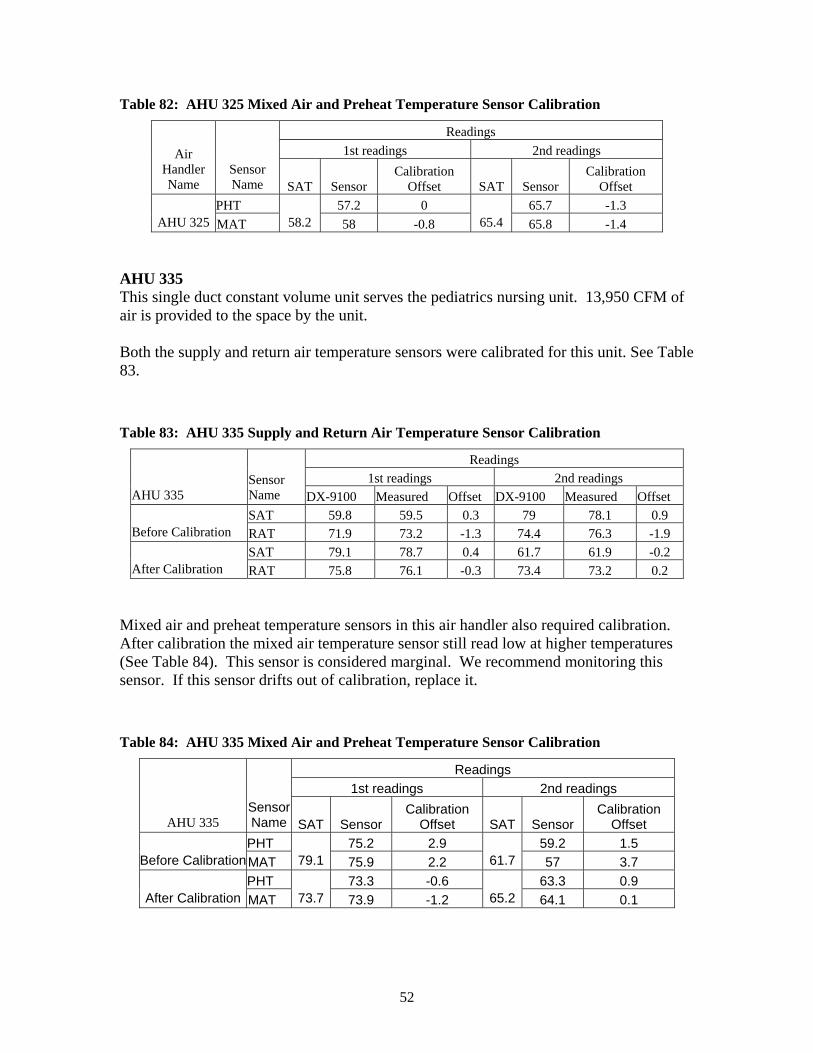
Table 82: AHU 325 Mixed Air and Preheat Temperature Sensor Calibration
Readings 1st readings 2nd readings Air
Handler Sensor Calibration Name Name SAT Sensor Offset SAT Sensor Offset
Calibration
PHT 57.2 0 65.7 -1.3 AHU 325 MAT 58.2 58 -0.8 65.4 65.8 -1.4
AHU 335 This single duct constant volume unit serves the pediatrics nursing unit. 13,950 CFM oair is provided to the space by the unit. Both the supply and return air temperature sensors were calibrated for this unit. See Table83.
f
able 83: AHU 335 Supply and Return Air Temperature Sensor Calibration T
Readings 1st readings 2nd readings
AHU 335 Sensor Name DX-9100 Measured Offset DX-9100 Measured Offset SAT 59.8 59.5 0.3 79 78.1 0.9
Before Calibration RAT 71.9 73.2 -1.3 74.4 76.3 -1.9 SAT 79.1 78.7 0.4 61.7 61.9 -0.2
After Calibration RAT 75.8 76.1 -0.3 73.4 73.2 0.2 Mixed air and preheat temperatu s is n e tion.
ter calibratio ed air tem ture sensor read at hi te atures ee Table 84). This sensor is considered marginal. We recommend monitoring this
Readings
re sensor in th air ha dler also r quired calibraAf(S
n the mix pera still low gher mper
sensor. If this sensor drifts out of calibration, replace it. Table 84: AHU 335 Mixed Air and Preheat Temperature Sensor Calibration
1st readings 2nd readings
AHU 335 Sensor Name SAT Sensor
Calibration Offset SAT Sensor
Calibration Offset
PHT 75.2 2.9 59.2 1.5 Before Calibration MAT 79.1 75.9 2.2 61.7 57 3.7
PHT 73.3 -0.6 63.3 0.9 After Calibration MAT 73.7 73.9 -1.2 65.2 64.1 0.1
52
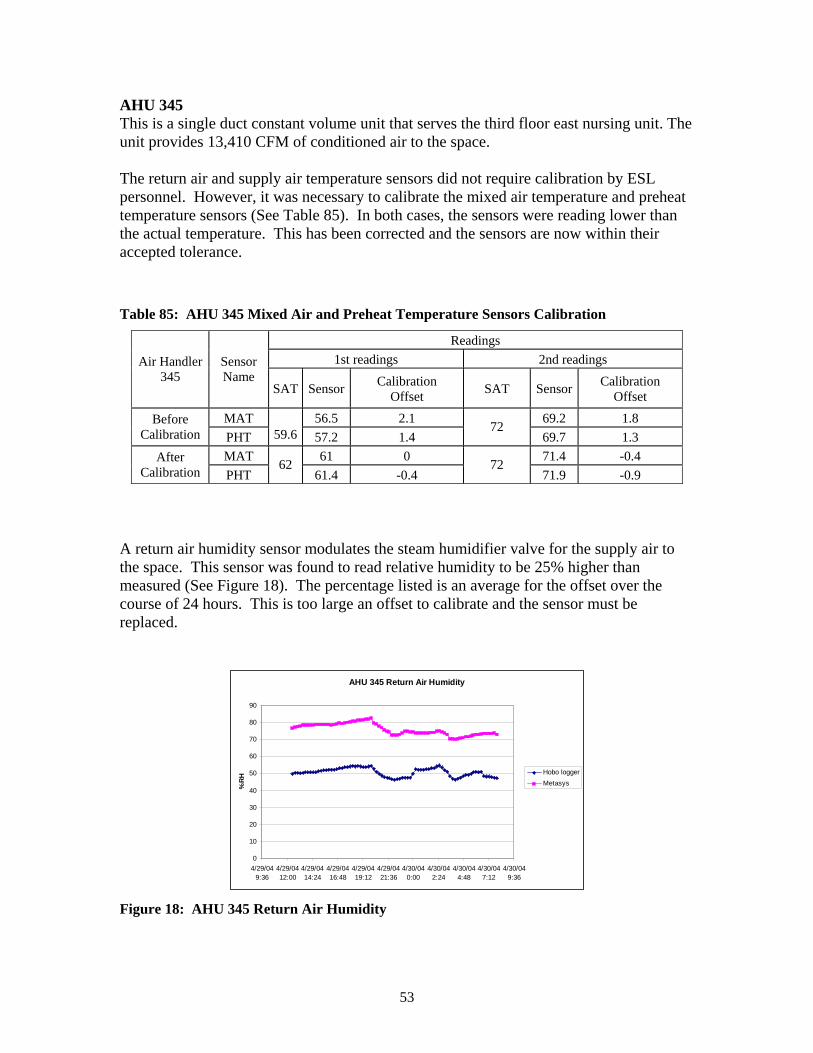
AHU 345 This is a single duct constant volume unit that serves the third floor east nursing unit. The unit provides 13,410 CFM of conditioned air to the space. The return air and supply air temperature sensors did not require calibration by ESL personnel. However, it was necessary to calibrate the mixed air temperature and preheat temperature sensors (See Table 85). In both cases, the sensors were reading lower than the actual temperature. This has been corrected and the sensors are now within their accepted tolerance. Table 85: AHU 345 Mixed Air and Preheat Temperature Sensors Calibration
Readings 1st readings 2nd readings Air Handler
345 Sensor Name
SAT Sensor Calibration Offset SAT Sensor Calibration
Offset MAT 56.5 2.1 69.2 1.8 Before
Calibration PHT
59.6 57.2 1.4 72
69.7 1.3 MAT 61 0 71.4 -0.4 After
Calibration 71.9 -0.9 PHT 62
61.4 -0.4 72
A return air humi for the supply air to the space. This sensomeasured (See Figure 18course of 24 hours. This must be replaced.
dity sensor modulates the steam humidifier valve r was found to read relative humidity to be 25% higher than
). The percentage listed is an average for the offset over the is too large an offset to calibrate and the sensor
AHU 345 Return Air Humidity
0
10
20
30
40
50
60
70
80
90
4/29/049:36
4/29/0412:00
4/29/0414:24
4/29/0416:48
4/29/0419:12
4/29/0421:36
4/30/040:00
4/30/042:24
4/30/044:48
4/30/047:12
4/30/049:36
%RH
Hobo loggerMetasys
Figure 18: AHU 345 Return Air Humidity
53
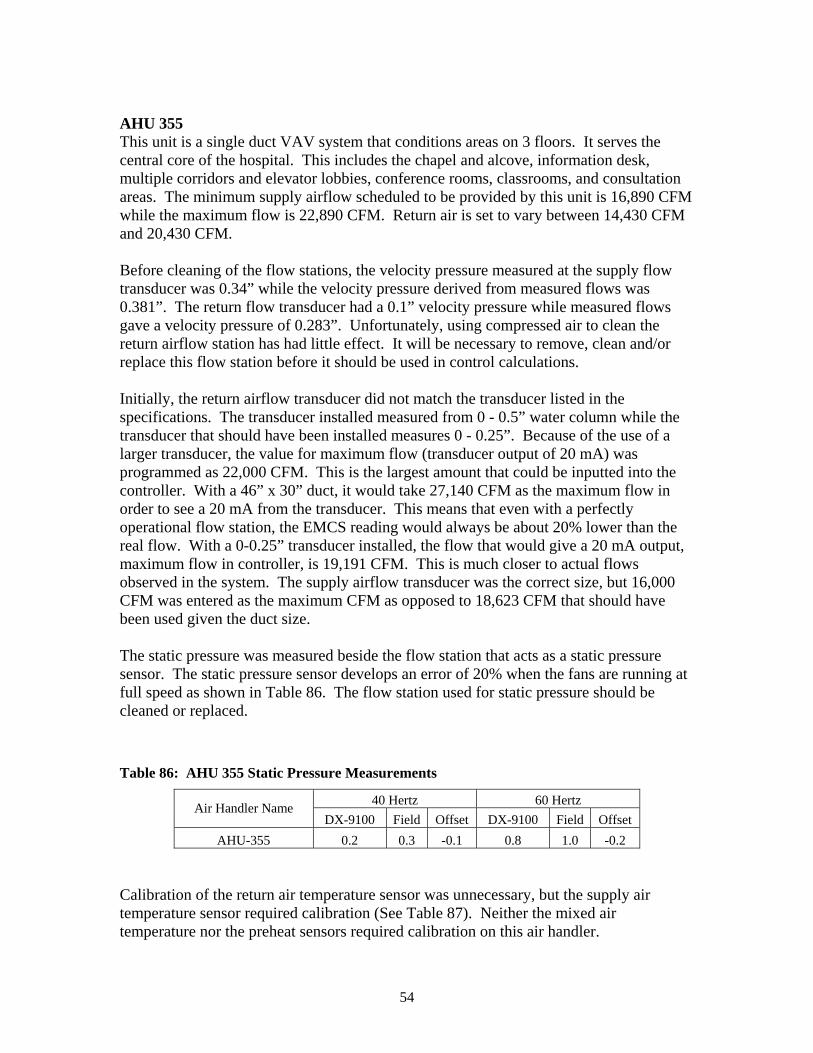
AHU 3This uncentral multiple corridors and elevator lobbies, conference rooms, classrooms, and consultation areas. The minimum supply airflow scheduled to be provided by this unit is 16,890 CFM while the maximum flow is 22,890 CFM. Return air is set to vary between 14,430 CFM and 20,430 CFM. Before cleaning of the flow stations, the velocity pressure measured at the supply flow transducer was 0.34” while the velocity pressure derived from measured flows was 0.381”. The return flow transducer had a 0.1” velocity pressure while measured flows gave a velocity pressure of 0.283”. Unfortunately, using compressed air to clean the return airflow station has had little effect. It will be necessary to remove, clean and/or replace this flow station before it should be used in control calculations. Initially, the return airflow transducer did not match the transducer listed in the specifications. The transducer installed measured from 0 - 0.5” water column while the transducer that should have been installed measures 0 - 0.25”. Because of the use of a larger transducer, the value for maximum flow (transducer output of 20 mA) was programmed as 22,000 CFM. This is the largest amount that could be inputted into the controller. With a 46” x 30” duct, it would take 27,140 CFM as the maximum flow in order to see a 20 mA from the transducer. This means that even with a perfectly operational flow station, the EMCS reading would always be about 20% lower than the real flow. With a 0-0.25” transducer installed, the flow that would give a 20 mA output, maximum flow in controller, is 19,191 CFM. This is much closer to actual flows observed in the system. The supply airflow transducer was the correct size, but 16,000 CFM was entered as the maximum CFM as opposed to 18,623 CFM that should have been used given the duct size. The static pressure was measured beside the flow station that acts as a static pressure sensor. The static pressure sensor develops an error of 20% when the fans are running at full speed as shown in Table 86. The flow station used for static pressure should be cleaned or replaced. Table 86: AHU 355 Static Pressure Measurements
40 Hertz 60 Hertz
55 it is a single duct VAV system that conditions areas on 3 floors. It serves the core of the hospital. This includes the chapel and alcove, information desk,
Air Handler Name DX-9100 Field Offset DX-9100 Field Offset
AHU-355 0.2 0.3 -0.1 0.8 1.0 -0.2 Calibration of the return air temperature sensor was unnecessary, but the supply air temperature sensor required calibration (See Table 87). Neither the mixed air temperature nor the preheat sensors required calibration on this air handler.
54

55
Table 87: AHU 355 Supply Air Temperature Sensor Calibration Measurements
Readings 1st readings 2nd readings
Air Handler Name Sensor Name DX-9100 Measured Offset DX-9100 Measured Offset
AHU 355 init SAT 56.5 57.4 -0.9 76.1 76.8 -0.7 AHU 355 after SAT 77.4 77.4 0 57.3 57.7 -0.4
A return air humidity sensor modulates the steam humidifier valve for the supply air to the space. This sensor was found to read relative humidity to be 8% lower than measured relative humidity (See Figure 19). This is a greater offset than can be recalibrated on the relative humidity sensor.
AHU 355 Return Air Humidity
0
5
10
15
20
25
30
35
40
45
50
4/27/0414:24
4/27/0419:12
4/28/040:00
4/28/044:48
4/28/049:36
4/28/0414:24
4/28/0419:12
%R
H Hobo loggerMetasys
Figure 19: AHU 355 Return Air Humidity
Recommendations The following recommendations are made based on the findings from the point-to-point verification at RACH.
1. Continue temperature sensor calibration on the remaining air handler units. There is still potential for thermal energy savings from temperature sensor calibration.
2. Replace return air humidity sensors for AHU-155, AHU-245, AHU-345, and
AHU-355. This will aid in comfort for the areas served by these air handlers.
3. Replace supply air humidity sensors for AHU-225 and AHU-226. These air handlers serve the operating rooms of the hospital.

56
4. Clean and/or replace the flow stations for AHU-145, AHU-120, AHU220, and AHU-355. These corrections will improve the performance of the air handlers and reduce energy consumption during unoccupied periods.
5. Clean and/or replace static pressure sensors (flow stations) for AHU-175, AHU-
355, AHU-240, and AHU-40. Correcting these sensors will help reduce the supply fan speed of the air handler and improve system response.
6. Repair and/or replace the secondary chilled water flow meter and the main bypass
flow meter. These meters are only used for monitoring purpose. However, they can be useful in determining primary/secondary performance.
7. Relocate the differential pressure sensors for the clinic and hospital. Place the
sensors near the end of each loop. This will provide information on how the loop is performing. Differential pressure reduction can have a significant impact on energy savings. Presently these sensors are located too close to the central plant.