plunging jet characteristics of plunging...
TRANSCRIPT

Coastal Engineering 31 (1997) 125-141
COASTAL ENGINEERING
Plunging jet characteristics of plunging breakers
Hubert Chanson a, Lee Jaw-Fang b a Hydraulics and Environmental Engineering, Department of Civil Engineering, The University of
Queensland, Brisbane, Qld. 4072, Australia
’ Department of Hydraulics and Ocean Engineering, National Cheng Kung University, Tainan 70101, Taiwan
ROC
Received 30 May 1996; accepted 11 November 1996
Abstract
With plunging breaking waves, air bubble entrainment is caused by the top of the wave forming a plunging jet and entraining air when it impacts the water in front of the wave. The potential for air bubble entrainment is related directly to the plunging jet impact characteristics. New experiments were performed in a two-dimensional wave flume. The breaking process was investigated with a high-speed video camera. The results provide new information on the breaking point characteristics, the jet impact conditions and the energy dissipation process. The entrainment of air bubbles is detailed. And the rate of energy dissipation by plunging breakers is estimated. 0 1997 Elsevier Science B.V.
Keywords: Plunging breakin g waves; Plunging jet; Energy dissipation; Air entrainment; Laboratory experi-
ment
1. Introduction
In lakes, estuaries and the ocean, gas transfer derives from free surface aeration. A substantial component of the mass transfer process occurs in the air bubble clouds entrained by breaking waves. The main mechanisms of air entrainment by breaking waves are spilling breakers and plunging breakers. In this study, only the plunging breaking wave type is examined as its potential for air bubble entrainment is much greater than the spilling wave type (Cokelet, 1977).
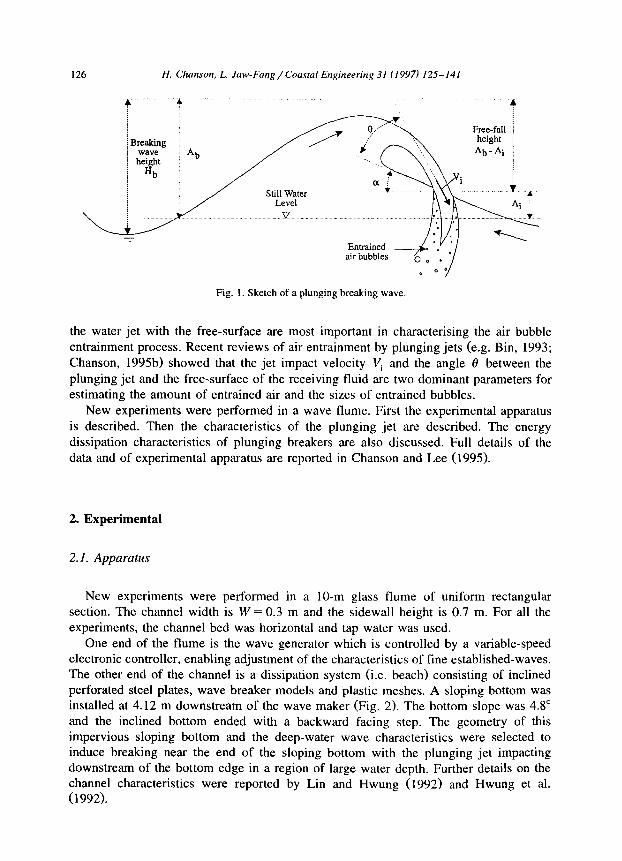
With plunging breakers, the entrainment of air bubbles is caused by the waves forming a water jet projecting ahead of the wave face and entraining air when it impacts the water free-surface in front of the wave (Fig. 1). Several studies (e.g. Koga, 1982; Hubbard et al., 1987) highlighted the lack of knowledge of the characteristics of plunging water jets in front of the breaking waves. The flow conditions at the impact of
037%3839/97/$17.00 0 1997 Elsevier Science B.V. All rights reserved.
PII SO378-3839(96)00056-7
126 H. Chmson, L. Jaw-Fang/Coastal Engineering 31 (1997) 125-141
Fig. I. Sketch of a plunging breaking wave
the water jet with the free-surface are most important in characterising the air bubble entrainment process. Recent reviews of air entrainment by plunging jets (e.g. Bin, 1993; Chanson, 1995b) showed that the jet impact velocity Vi and the angle 8 between the plunging jet and the free-surface of the receiving fluid are two dominant parameters for estimating the amount of entrained air and the sizes of entrained bubbles.
New experiments were performed in a wave flume. First the experimental apparatus is described. Then the characteristics of the plunging jet are described. The energy dissipation characteristics of plunging breakers are also discussed. Full details of the data and of experimental apparatus are reported in Chanson and Lee (1995).
2. Experimental
2. I. Apparatus
New experiments were performed in a 10-m glass flume of uniform rectangular section. The channel width is W = 0.3 m and the sidewall height is 0.7 m. For all the experiments, the channel bed was horizontal and tap water was used.
One end of the flume is the wave generator which is controlled by a variable-speed electronic controller, enabling adjustment of the characteristics of fine established-waves. The other end of the channel is a dissipation system (i.e. beach) consisting of inclined perforated steel plates, wave breaker models and plastic meshes. A sloping bottom was installed at 4.12 m downstream of the wave maker (Fig. 2). The bottom slope was 4.8” and the inclined bottom ended with a backward facing step. The geometry of this impervious sloping bottom and the deep-water wave characteristics were selected to induce breaking near the end of the sloping bottom with the plunging jet impacting downstream of the bottom edge in a region of large water depth. Further details on the channel characteristics were reported by Lin and Hwung (1992) and Hwung et al. (1992).

4
ix
0.3m
[
f 16
0 i
+mm
70
mm
r
. . . .
. . ..
_....
._...
......
......
......
......
......
......
. %
W!!
. . . .
. sl
opin
g bo
ttom
.._
_....
......
......
......
......
.. &
++
-___
____
____
.___
___ _
___ _
____
_-_+
l . .
. .
. . . .
. .
4 . .._
......
......
......
......
......
......
......
......
......
......
......
I:@
.! ._
____
......
_.._
___.
......
......
......
......
......
......
......
......
......
......
......
....
+
Det
ail o
f the
slop
ing
inci
dent
w
ave
flow
+
Wav
e gen
erat
or
4-4
Y W
ave
mea
sure
men
t lo
catio
n of
Ho
1 W
ave
b-/-
/ 13
1.2m
m
1570
mm
Wav
e ga
uge
1 +
ga
uge2
ga
uge
3
r-
2.70
5 m
......
......
......
......
......
......
......
......
......
......
......
*
6.21
5 m
...
......
......
......
......
......
......
......
......
......
......
......
......
. I_
_ I ......
......
......
......
......
......
......
......
......
......
......
......
......
......
......
......
......
......
......
......
......
...
f
., I
Stil
l jh
/ O
h
Bea
ch
(dis
sipa
tion
syst
em)
Fig.
2. S
ketc
h of
the
exp
erim
enta
l se
tup.
128 H. Chunson, L. Jaw-Fang/ Cocrstul Engineering 31 (1997) 125-141
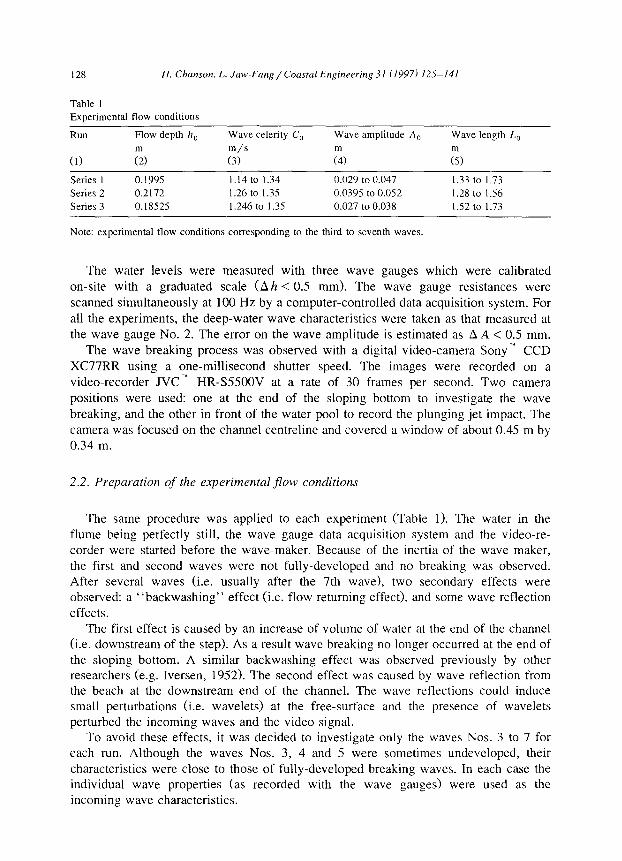
Table I Experimental flow conditions
Run
(1)
Flow depth h, Wave celerity C,
m/s (3)
Wave amplitude A, Wave length L,
Series I 0.199s 1.14 to 1.34 0.029 to 0.047 1.33 to 1.73
Series 2 0.2172 1.26 to 1.35 0.0395 to 0.052 1.28 to 1.56
Series 3 0.18525 1.246 to 1.35 0.027 to 0.038 I .52 to I .73
Note: experimental flow conditions corresponding to the third to seventh waves
The water levels were measured with three wave gauges which were calibrated on-site with a graduated scale (Ah < 0.5 mm). The wave gauge resistances were scanned simultaneously at 100 Hz by a computer-controlled data acquisition system. For all the experiments, the deep-water wave characteristics were taken as that measured at the wave gauge No. 2. The error on the wave amplitude is estimated as A A < 0.5 mm.
The wave breaking process was observed with a digital video-camera Sony’” CCD XC77RR using a one-millisecond shutter speed. The images were recorded on a video-recorder JVC ” HR-S5500V at a rate of 30 frames per second. Two camera positions were used: one at the end of the sloping bottom to investigate the wave breaking, and the other in front of the water pool to record the plunging jet impact. The camera was focused on the channel centreline and covered a window of about 0.45 m by 0.34 m.
2.2. Preparation of the experimental flow conditions
The same procedure was applied to each experiment (Table 1). The water in the flume being perfectly still, the wave gauge data acquisition system and the video-re- corder were started before the wave-maker. Because of the inertia of the wave maker, the first and second waves were not fully-developed and no breaking was observed. After several waves (i.e. usually after the 7th wave), two secondary effects were observed: a “backwashing” effect (i.e. flow returning effect), and some wave reflection effects.
The first effect is caused by an increase of volume of water at the end of the channel (i.e. downstream of the step). As a result wave breaking no longer occurred at the end of the sloping bottom. A similar backwashin g effect was observed previously by other researchers (e.g. Iversen, 1952). The second effect was caused by wave reflection from the beach at the downstream end of the channel. The wave reflections could induce small perturbations (i.e. wavelets) at the free-surface and the presence of wavelets perturbed the incoming waves and the video signal.
To avoid these effects, it was decided to investigate only the waves Nos. 3 to 7 for each run. Although the waves Nos. 3, 4 and 5 were sometimes undeveloped, their characteristics were close to those of fully-developed breaking waves. In each case the individual wave properties (as recorded with the wave gauges) were used as the incoming wave characteristics.
H. Chanson, L. Jaw-Fung/Coastul Engineering 31 (1997) 125-141 129
3. Experimental results
The wave characteristics at breaking and at the jet impact (definition in Fig. 2) were investigated for three still water levels (Table 1). For each wave, the individual wave characteristics (wave celerity C,, wave amplitude A,, wave length L,,, wave period T) were deduced from the wave gauge recordings.
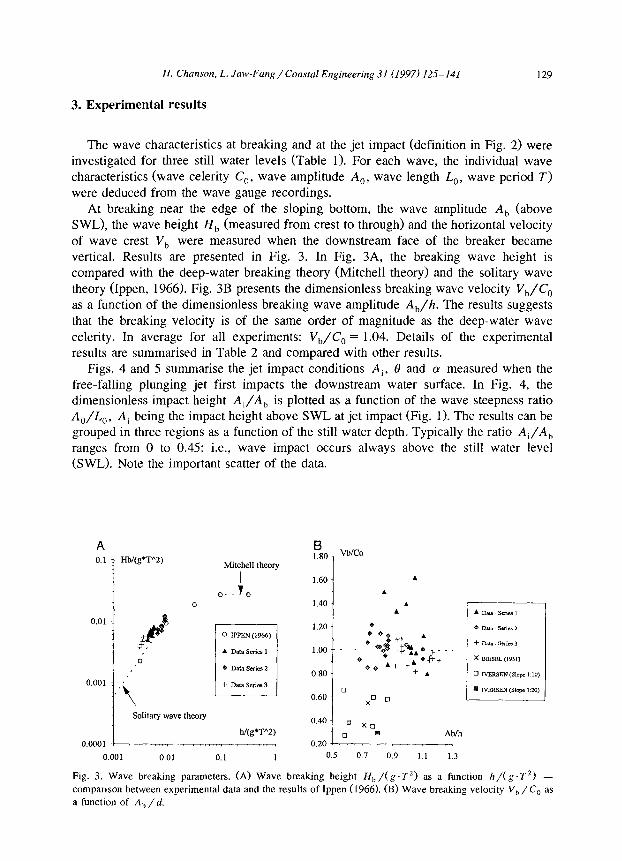
At breaking near the edge of the sloping bottom, the wave amplitude A, (above SWL), the wave height H, (measured from crest to through) and the horizontal velocity
of wave crest V, were measured when the downstream face of the breaker became vertical. Results are presented in Fig. 3. In Fig. 3A, the breaking wave height is compared with the deep-water breaking theory (Mitchell theory) and the solitary wave theory (Ippen, 1966). Fig. 3B presents the dimensionless breaking wave velocity V,/C,
as a function of the dimensionless breaking wave amplitude A,/h. The results suggests
that the breaking velocity is of the same order of magnitude as the deep-water wave celerity. In average for all experiments: V,/C, = 1.04. Details of the experimental results are summarised in Table 2 and compared with other results.
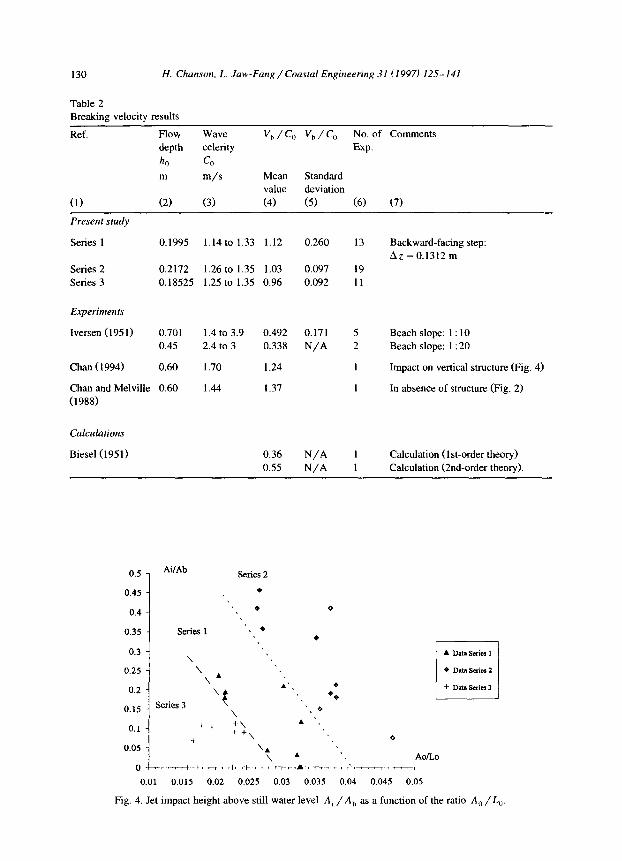
Figs. 4 and 5 summarise the jet impact conditions Ai, 19 and Q measured when the free-falling plunging jet first impacts the downstream water surface. In Fig. 4, the dimensionless impact height A/A, is plotted as a function of the wave steepness ratio A,/L,, Ai being the impact height above SWL at jet impact (Fig. 1). The results can be grouped in three regions as a function of the still water depth. Typically the ratio A/A,
ranges from 0 to 0.45: i.e., wave impact occurs always above the still water level (SWL). Note the important scatter of the data.
Hh/(g*T^Z)
I3 1.80
Mitchell theory
I 0.80
Solitary wave theory
, 0.60
0.40
hl(g*TA2)
0.20
. .
Fig. 3. Wave breaking parameters. (A) Wave breaking height H, /(g . T2) as a function h/(g .T?) -
comparison between experimental data and the results of Ippen (1966). (B) Wave breaking velocity V, /Co as a function of A,, /cf.
130 H. Chanson, L. Jaw-Fang/Coastal Engineering 31 (1997) 125-141
Table 2 Breaking velocity results
Ref.
(1)
Flow
depth
ho
m
(2)
Wave
celerity
Co
m/s
(3)
V,/C” V,/Co No. of Comments
Exp.
Mean Standard
value deviation
(4) (5) (6) (7)
Present study
Series 1 0.1995 1.14 to 1.33 1.12 0.260
Series 2 0.2172 1.26 to 1.35 1.03 0.097
Series 3 0.18525 1.25 to 1.35 0.96 0.092
Experiments
lversen (1951) 0.701 1.4 to 3.9 0.492 0.171
0.45 2.4 to 3 0.338 N/A
Chan (1994) 0.60 1.70 1.24
Chan and Melville 0.60 1.44 1.37
(1988)
Calculations
Biesel(1951) 0.36 N/A 0.55 N/A
13
19
11
1 Calculation (lst-order theory)
1 Calculation (2nd-order theory).
Backward-facing step:
AZ = 0.1312 m
Beach slope: 1: 10
Beach slope: 1: 20
Impact on vertical structure (Fig. 4)
In absence of structure (Fig. 2)
AorLo r-r T-l-T+ mr
0.01 0.015 0.02 0.025 0.03 0.035 0.04 0.045 0.05
Fig. 4. Jet impact height above still water level Ai /A, as a function of the ratio A, /Lo

H. Cltanson, L. Jaw-Fang/Coustol Engineering 31 (1997) 125-141 131
A 50
45
40
35
30
2s
20
15
10
5
0
e (degrees)
+
B 35 a
1 (degrees) .
30 -I
+ ++ ..+ A +
e . . 0 25 -
+ i. .+ : . A-5.. 0
20 -
Y 1s -
IO
0.01 0.02 0.03 0.04 0.05 0.01 0.02 0.03 0.04 0.05
Fig. 5. Plunging jet impact parameters. (A) Plunging jet angle 6 with the free-surface as a function of the ratio
A,/L,. (B) Free-surface slope LY at the jet impact as a function of the ratio A,, /L,.
The data of the impact angle 0 of the plunging jet are presented in Fig. 5A. FOJ all the experiments, the results are best correlated by:
@= 41.2 - 364.1 . ; 11) 0
where 8 is in degrees. It is worth noting that the jet impact angle is about 31” (mean value for all experiments) and that 0 decreases slightly with increasing wave amplitude and wave steepness. The former result is consistent with a re-analysis of plunging breaker photographs (Cole& 1967; Melville and Rapp, 1985; Longuet-Higgins, 1988) in which 0 ranged between 15 and 45”.
Fig. 5B shows the slope of the free-surface at impact with the horizontal. The data exhibit a wide range of scatter: i.e., between 0 and 35”. Such a scatter is consistent with the scatter of impact height data. Indeed the shape of the free-surface in front of the breaking point is such that the free-surface slope at impact is expected to decrease with decreasing impact height A, (as defined in Fig. I). Overall the order of magnitude of free-surface slope data is consistent with the re-analysis of photographs (Coles, 1967; Melville and Rapp, 1985; Longuet-Higgins, 1988).
4. Discussion
4.1. Impact flow conditions
After wave breaking, the plunging water jet is in free-falling motion before impacting on the free-surface (Fig. 1). For a free-falling jet, the impact flow conditions Vi and the jet angle with the horizontal ( LY + 0) can be deduced from simple jet trajectory

132 H. Chanson, L. Jaw-Fung/Coastal Engineering 31 (1997) 125-141
20 30 40 50 GO 70
Fig. 6. Jet impact angle: comparison between Eq. (3) and experimental data.
equations as functions of the breaking velocity V, and free-falling height (A, - Ai). It yields:
Vi=\IV;+2.g.(A,-Ai) (2)
tan(a+p) = d-=-y (3)
In Fig. 6, the measured jet angle with horizontal ((Y + 13) is compared with Eq. (3). The agreement between the data and a simple trajectory equation is fair although not excellent.
4.2. Bubble penetration depth
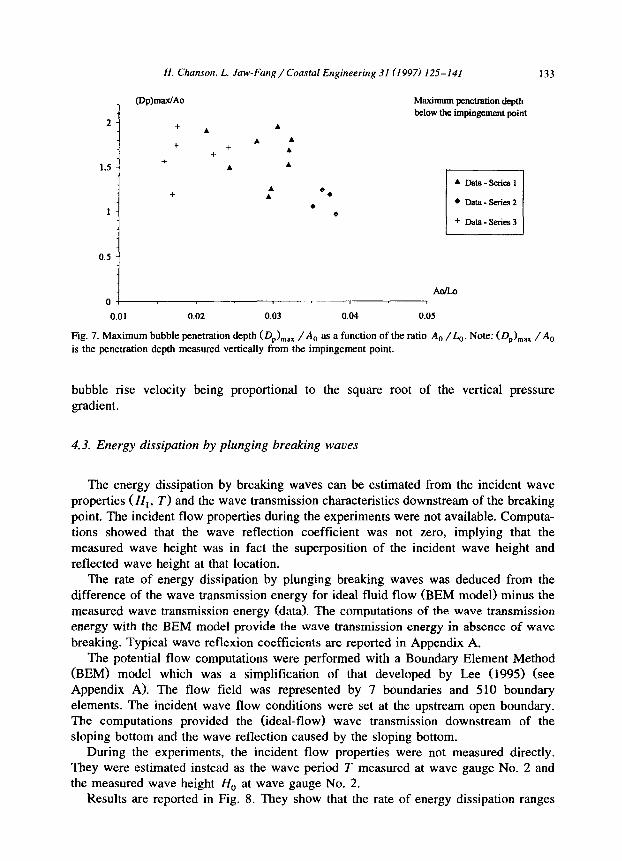
Following the impact of the plunging water jet, entrained bubbles are carried downwards by the jet motion before being trapped in surrounding vertical motion. Later the bubble path becomes driven by buoyancy and the air bubbles rise to the free-surface. The maximum bubble penetration depth was recorded during the experiments. Results are shown on Fig. 7 where (DpJmax is the maximum penetration depth measured vertically from the impingement point.
The results suggest that the air bubbles are entrained down to 1.2 to 2 times the wave amplitude below the free-surface. Such results must be considered as a pessimistic estimate for deep water waves as the effects of the flume bottom might be substantial. With plunging water jets in shallow waters, the submerged jet flow is deflected by the bottom. The change of momentum direction is accompanied by a local increase of pressure and of pressure gradient. The modification of the pressure field induces a modification of the bubble path as well as an increase of the buoyancy effects, the
H. Chanson, L. Jaw-Fang/Coastal Engineering 31 (1997) 125-141
_ @P)~Ao Maximum penetration depth below the impingement point
2- + . A
+ A A +
+ .
1.5 - +
A *
133
1 + 1
0.5 i
* A .*
0 0
A Data-series1
. Data-series2
+ Data-Series3
03. AWL0
0.01 0.02 0.03 0.04 0.05
Fig. 7. Maximum bubble penetration depth (DP),,,lx /A, as a function of the ratio A, /Lo. Note: (D,),,, /A,
is the penetration depth measured vertically from the impingement point.
bubble rise velocity being proportional to the square root of the vertical pressure gradient.
4.3. Energy dissipation by plunging breaking waves
The energy dissipation by breaking waves can be estimated from the incident wave properties (II,, T) and the wave transmission characteristics downstream of the breaking point. The incident flow properties during the experiments were not available. Computa- tions showed that the wave reflection coefficient was not zero, implying that the measured wave height was in fact the superposition of the incident wave height and reflected wave height at that location.
The rate of energy dissipation by plunging breaking waves was deduced from the difference of the wave transmission energy for ideal fluid flow (BEM model) minus the measured wave transmission energy (data). The computations of the wave transmission energy with the BEM model provide the wave transmission energy in absence of wave
breaking. Typical wave reflexion coefficients are reported in Appendix A. The potential flow computations were performed with a Boundary Element Method
(BEM) model which was a simplification of that developed by Lee (1995) (see Appendix A). The flow field was represented by 7 boundaries and 510 boundary elements. The incident wave flow conditions were set at the upstream open boundary. The computations provided the (ideal-flow) wave transmission downstream of the sloping bottom and the wave reflection caused by the sloping bottom.
During the experiments, the incident flow properties were not measured directly. They were estimated instead as the wave period T measured at wave gauge No. 2 and the measured wave height H, at wave gauge No. 2.
Results are reported in Fig. 8. They show that the rate of energy dissipation ranges

134 H. Chumon. L. Jaw-Fan~/Coustal Engirwering 31 (1997) 125-141
A AE/E (%)
60 --
50 0 --
40 --
30 --
20 -- .
40
30
20
AE/!Z (%)
+ _ . .
.
10 I 0 -I- I
0 0.5 1 1.5 2 2.5
Fig. 8. Rate of enegy dissipation by plunging breaking wave. (A) AE/E as a function of the wave steepness
A, /Lo. (B) A E/E as a function of the dimensionless penetraticn depth (Dp)max /A,.
from 20% to 60% with a mean values of about 40%. Fig. 8B suggests an increase of rate of energy dissipation with increasing bubble penetration depth which is best fitted by:
o.624 (4)
After the impact of the free-falling jet with the free-surface, a turbulent shear flow develops below the free-surface. Kinetic energy is dissipated by turbulent shear in the shear layers. Additionally the transfer of momentum from the impinging flow to the surrounding fluid is dissipated by vertical and recirculatory flow motion. The bubble penetration depth gives some information on the shear flow characteristic length, and
Fig. 88 shows an increase in energy dissipation with increasing shear flow length.
4.4. Compurison with energy dissipation by plunging jet at a drop structure
Energy dissipation by plunging jet is commonly used at drop structures and along stepped channels (e.g. Fig. 9A). A simple analytical expression of the rate of energy dissipation by plunging jet can be developed:
AE -=l-
E 3 AZ
?+h c I
(5)
h 2’/2 -=
h, 3 -+ 23/2

H. Chanson. L. Jaw-Fang/Coastal Engineering 31 (1997) 125-141
B (AE;E)drop-structure
100
i
%
90 Drop structure calculations
80
135
+ -’ / Vi‘ : o I;’ Plunging breaker
recirculatory .’ H H H H IT H H flow motion 0 10 20 30 40 50 60 70 80 90 100
Fig. 9. Comparison of energy dissipation at drop struchrres and at plunging breaking waves. (A) Sketch of a
drop structure (after Chanson, 1995a). (B) Comparison of energy dissipation at drop structures (vertical axis)
with that at plunging breaking waves (horizontal axis) for similar flow conditions - calculations performed
assuming a plunging jet thickness of 0.1 H,.
where h, h, and AZ are defined in Fig. 9A. Such calculations were successfully compared with a large number of experimental data (e.g. Chanson, 1995a).
For a plunging breaker the drop height equals (A,, - Ai) (see Fig. I>. At a drop structure, the critical flow depth is a characteristic jet thickness. For plunging breaking waves, Chanson and Cummings (1992) estimated a plunging jet thickness of about 0.01 to 0.1 . H, based upon a photographic analysis.
Assuming a plunging thickness of 0.1 . H,, the authors computed the equivalent rate of energy dissipation at drop structures for the wave flow conditions (see Appendix A). The results (Fig. 9B) indicate that the rate of energy dissipation by plunging jets is of the same magnitude for plunging breakin g waves and at drop structures. The reasonably good agreement suggests some analogy in the mechanisms of energy dissipation.
It must be emphasised however that the analogy between drop structures and plunging breakers is limited by fundamental differences: drop structure flows are steady flows impacting into shallow waters while plungin g breakers (as investigated in this study) are unsteady flows impacting in deeper waters.
5. Discussion
The energy dissipation calculations are based upon a number of approximations (denoted [Hll to [H51 below) which the authors wish to highlight.
The ideal fluid flow computations were performed for a steady flow [HI ] and they are the solution of linear equations [H2]. The incident wave properties were taken as the measured wave height and period at the wave gauge No. 2 [H3]. The wave reflection

136 H. Chanson, L. Jaw-Fang/Coastal Engineering 3I (1997) 125-141
energy from the beach (at the downstream end of flume) is neglected [H4]. The plunging jet impact takes place in a region of “relatively” shallow waters [H51 and the effects of the flume bottom might be significant.
Overall the authors believe that the errors on the wave reflection effects caused by the
sloping bottom and by the beach might “balance” each other. The reasonably good agreement between the drop structure calculations and the breaking wave calculations provides an interesting comparison, suggesting some similar dissipation processes.
6. Conclusion
Plunging breaking waves are an important mechanism of entrainment of air bubbles
in the ocean and induce the large amount of energy dissipation. New experiments were performed in a laboratory wave flume to investigate the characteristics of the plunging jet. The main results of the study indicate that the location of the plunging jet impact with the free-surface is always above the still water level with some substantial scatter, and that the impact angle of the plunging jet with the free-surface is about 31”. The rate of energy dissipation at each plunging breaker is about 20% to 60%. Energy dissipation calculations suggest that the rate of energy dissipation increases with the bubble penetration depth and with the characteristic length of the plunging jet shear flow. Interestingly the rate of energy dissipation is similar to the rate of energy dissipation at
drop structures. We wish to emphasise that the calculations of energy dissipation are based on several
approximations. In our view, the close agreement between energy dissipation calcula- tions at plunging breakers and at drop structures confirms the soundness of the calculations.
7. Notation
wave amplitude (m) wave crest elevation (m) at breaking measured from the still water level height (m) of the plunging jet impact measured above the still water level wave amplitude (m) of incoming waves celerity (m/s) of incoming waves maximum air bubble penetration height (m) measured vertically from the jet impact position: (Dp)max = (Lp)max + Ai
1: energy of the incident wave; 2: total head (m) of a free-surface flow gravity acceleration (m/s’): g = 9.79 m/s2 in Taiwan wave height (m) measured from crest to trough incident wave height (m) breaking wave height (m) measured from crest to trough 1: wave height (m) of deep-water waves; 2: wave height (m) of incoming waves measured at wave gauge No. 2 (see Fig. 2) wave reflection height (m)

T
V
Vll
‘i
W
x
Y 2
ZE
AZ e
P,
wave transmission height (m) still water depth (m) at breaking point critical flow depth (m) in open channel flow still water level (m) measured perpendicular to the channel bottom wave reflection coefficient: K, = H,/H,
wave transmission coefficient: K, = H,/H,
wave length (m) of incoming waves
maximum penetration height (m) measured from the still water level and positive downwards
wave period (s) velocity (m/s) velocity (m/s> of the wave crest at breaking point impact velocity (m/s> of the plunging jet channel width (m) distance along the channel bottom (m) distance measured perpendicular to the channel bed surface (m) transverse distance (m) measured perpendicular from the right sidewall angle between the free-surface and the horizontal at impact of the plunging jet
1: energy dissipation by breaking wave; 2: head loss (m) 1: backward facing step height (m); 2: drop (m) at a drop structure angle (“1 between the impinging plunging jet and the water free-surface water density (kg/m31
b
BEM i
0 r t
Subscripts
flow conditions at breaking BEM model computations impact flow conditions at the impingement of the plunging jet with the water free-surface incoming wave flow conditions wave reflection wave transmission
Abbreviations
BEM Boundary Element Method
H. Chumon, L. Juw-Fang/Coastal Engineering 31 (1997) 125-141 137
Acknowledgements
The authors acknowledge the financial support of the National Science Council of Taiwan, Republic of China (Grant NSC84-2611-E-006-029) and of the Australian Research Council (Grant No. A8941296). They acknowledge also the support of the Department of Hydraulics and Ocean Engineering at the National Cheng Kung Univer- sity and of the Tainan Hydraulics Laboratory which provided the experimental facility. They wish to thank Dr. G.S. Hwang and Mr. Y.J. Lan for their assistance.

138 H. Chanson, L. Jaw-Fang/Coustal Engineering 31 (1997) 125-141
Appendix A. Energy dissipation calculations
The energy dissipation by plunging breaking waves downstream of the sloping
bottom was estimated by comparing the wave height measurements at wave gauges Nos. 2 and 3 (see Fig. 2) with ideal-fluid flow computations.
The ideal-fluid flow computations were performed with a Boundary Element Method (BEM) model. The BEM model was a simplification of the two-dimensional steady flow model developed by Lee (1995). The incident wave flow conditions (see below) were set at the upstream boundary. The computations provided the (ideal-flow) wave transmis- sion over the sloping bottom and the wave reflection. The rate of energy dissipation by plunging breaking waves was deduced from the difference of the wave transmission energy for ideal fluid flow (BEM model) minus the measured wave transmission energy (data). It yields:
During the experiments, the incident flow properties (at the wave maker) were not available. Computations showed that wave reflection coefficient was not zero, implying that the measured wave height H, was in fact the superposition of the incident wave height H, and the reflected wave height H, at that location.
Run Wave Wave Wave Wave Wave Transmit. Reflected Transmit. Wave Wave Rate of Rate of No. No. celerity amplitude period height wave wave wave reflection transmis. energy energy
height height height coeff. coeff. dissipat. dissipat.
C, A, 7‘ H, H, H, 4 K, K, AE/E AE/E
data data data data G2data G3 BEM (a) BEM (b) BEM BEM (c) (d) m/s m %
(1) (2) (3) (4) (11) (12) (14)
Series I
1A 3 4
5
6
1B 3 4
5
IC 3 4
5
1D 3
4
5
1E 3 4
5
6
I .3595 0.0349 1.30 19 0.0463
I .2804 0.0457
I .2407 0.0459
I .2864 0.0347
I .3269 0.0469
I .2962 0.0467
I .3605 0.0293 I .3274 0.0444 1.3 0.0454
I .308 I 0.035
I .2978 0.0466
1.2993 0.0465
I .3079 0.0348
1.3204 0.0455
I .2967 0.0453
I .28 0.0447
1.256 0.06 17 0.0465 0.0149 0.0598 0.243 0.969 1.163 0.071 0.0551 0.0172 0.0687 0.243 0.969
1.092 0.0696 0.0475 0.0161 0.0675 0.233 0.971
1.073 0.0768 0.0462 0.0175 0.0746 0.229 0.972
1.258 0.0615 0.0471 0.0 147 0.0596 0.24 I 0.970
1.167 0.0706 0.0613 0.0171 0.0683 0.244 0.969
1.094 0.0708 0.0521 0.0165 0.0687 0.234 0.97 I
1.270 0.0546 0.0449 0.013 0.0529 0.239 0.970 1.203 0.0689 0.051 0.0168 0.0667 0.244 0.969 1.082 0.0696 0.05 18 0.016 0.0675 0.23 I 0.972
1.251 0.0622 0.0464 0.015 0.0603 0.24 I 0.970 1.164 0.0708 0.0585 0.0172 0.0685 0.244 0.969 1.088 0.0712 0.0523 0.0 164 0.069 I 0.232 0.97 I
1.256 0.0615 0.0476 0.0148 0.0596 0.241 0.970 I, 172 0.0696 0.0559 0.0169 0.0674 0.244 0.969 1.090 0.0685 0.0534 0.0159 0.0664 0.233 0.97 I 1.072 0.0755 0.0495 0.0172 0.0733 0.228 0.972
37. I 46.3
33.6 -
47.8 50. I 58.3 -
35.4 47.3 18.5 46.7
40.1 48.7
26.6 ~ 39. I 50. I 39.0 49.7
38.4 47.6
25.6 -
40.4 50.7
34.2 -
29.4
33.4 -
51.5 -

H. Churuon, L. Jmv-Fung/Coustal Engineering 31 (1997) 125-141 139
1F 4 1.2961 5 1.3018 6 1.2685
1G 3 1.2775 4 1.2947 5 1.2846
IH 4 1.4652 5 I .3959
0.044 1.219 0.0693 0.049 1 0.0 168 0.067 1 0.243 0.969 0.0457 I.099 0.0694 0.05 I 0.0 162 0.0673 0.234 0.970 0.0458 1.080 0.0724 0.05 14 0.0166 0.0703 0.230 0.972
0.0342 1.258 0.0608 0.0472 0.0146 0.0589 0.241 0.970 0.0458 1.190 0.0695 0.0532 0.0 169 0.0673 0.244 0.969 0.0455 1.094 0.069 0.0497 0.016 0.0669 0.233 0.971
0.0407 1.150 0.0706 0.052 0.0171 0.0683 0.242 0.969 0.0473 1.110 0.0694 0.0496 0.0164 0.0672 0.234 0.970
43.8 -
40.1 - 44.0 -
33.9 - 35.3 - 42.4 -
39.7 - 43.0 -
Series 2
2A 3
4
1.388 0.0413 1.110 0.0722 0.0577 0.0146 0.0705 0.203 0.978 1.284 0.0504 1.060 0.0799 0.0666 0.0156 0.078 1 0.197 0.979 I .2662 0.0499 1.009 0.0806 0.0499 0.0149 0.079 0.186 0.983
2B 3 1.3261 0.0407 1.151 0.0702 0.057 0.0142 0.0686 0.203 0.978 4 1.2934 0.0503 1.053 0.08 1 0.0689 0.0158 0.0792 0.195 0.980 5 1.3363 0.0492 1.011 0.0802 0.0554 0.0149 0.0786 0.187 0.983
2c 3 1.3302 0.0407 1.148 0.0701 0.0587 0.0142 0.0685 0.203 0.978 4 1.2882 0.0492 1.057 0.0806 0.069 I 0.0157 0.0788 0.196 0.979 5 1.2622 0.0488 1.013 0.0804 0.0634 0.0149 0.0788 0.187 0.982
2D 3 4 5
1.295 1 0.0395 1.157 0.069 0.057 I 0.0139 0.0674 0.203 0.978 1.3047 0.0503 1.060 0.08 17 0.0669 0.016 0.0799 0.197 0.979 1.3373 0.0486 1.018 0.0797 0.0588 0.0149 0.078 1 0.188 0.982 I .35 0.0604 0.959 0.0929 0.0623 0.0164 0.09 13 0.178 0.986
2E 3 1.3396 0.0409 1.150 0.07 0.0574 0.0142 0.0684 0.203 0.978 1.2995 0.0523 1.053 0.08 I4 0.066 0.0158 0.0796 0.195 0.980
2F 3
5
1.3026 0.0483 1.115 0.0782 0.0634 0.0158 0.0764 0.203 0.978 1.2892 0.0482 1.028 0.0777 0.0602 0.0 147 0.076 1 0.190 0.98 1 1.3015 0.0496 0.993 0.08 13 0.0548 0.0148 0.0798 0.183 0.984
2G 3 4
1.352 0.0407 1.152 0.0706 0.0602 0.0143 0.069 0.203 0.978 1.3034 0.05 11 1.049 0.0819 0.0698 0.0159 0.080 1 0.195 0.980 1.2584 0.0496 1.016 0.0848 0.0535 0.0 158 0.083 1 0.188 0.982
2H 4 1.2946 0.0492 1.081 0.0802 0.0634 0.016
0.0141 0.0157
0.0783 0.200 0.978
21 3 1.3136 0.0408 1.149 4 I .2792 0.0502 1.054
0.0596 0.0678
0.068 1 0.203 0.978 0.0787 0.195 0.980
31.8 - 26.3 - 58.3 -
29.7 - 23.5 - 48.8 -
25.6 - 22.5 - 34.4 47.9
27.1 - 28.8 - 42.0 47.9 52.1 48.7
28.4 40.5 30.2 46.5
29.8 - 36.2 - 51.4 -
22.9 - 23.4 - 56.7 -
33.3 -
22.6 - 25.0 -
Series 3
3A 3
5 6
1.2448 0.0267 1.354 0.0535 0.036 0.0149 0.05 13 0.279 0.959 46.8 50.2 1.3146 0.0334 1.305 0.0598 0.0379 0.017 0.0572 0.284 0.958 51.6 48.8 1.2903 0.036 1 1.229 0.0604 0.0406 0.0173 0.0578 0.287 0.957 46.4 49.5 1.2714 0.0369 1.196 0.0583 0.0374 0.0 166 0.0558 0.285 0.958 50.5 49.3
3B 3 1.2636 0.0302 1.341 0.0544 0.0373 0.0152 0.0521 0.28 1 0.959 4 1.2916 0.0378 1.274 0.0617 0.0366 0.0176 0.059 0.287 0.957 5 1.2873 0.0378 1.193 0.0588 0.0388 0.0167 0.0563 0.285 0.958
3c 3 1.2548 0.0284 1.362 0.0527 0.0386 0.0146 0.0505 0.277 0.960 4 1.2622 0.0339 1.326 0.0593 0.0424 0.0167 0.0586 0.282 0.959
44.9 48.6 53.0 48.3 48.1 50.9
38.5 49.1 40.8 -

140 H. Clrun! wn, L. Jaw-Fang /Coastd Engineering 31 (1997) 125- -141
3D 3 4
3E 3
3F 3
4
3G 3
3H 3 1.2959 0.0273 1.335 0.055 0.0347
4 1.2952 0.0366 1.274 0.062 0.0371
1.2357 0.0288 1.342 0.0545 0.03 19 0.0 153 0.0522 0.28 1 0.959 1.2933 0.0371 I .273 0.0608 0.0364 0.0174 0.0582 0.287 0.957
1.2239 0.0288 1.340 0.0545 0.0343 0.0 152 0.0522 0.28 I 0.959
1.2505 0.029
1.23 0.038
1.2468 0.0283
1.3069 0.0371
1.338 0.0548 0.0353
1.276 0.0622 0.038 1
0.0 154
0.0 148
0.0151
0.0175
0.0 154
0.0177
0.0525 0.281 0.959
0.0595 0.287 0.958
1.347 0.0541 0.0349
1.277 0.06 12 0.0372
0.0519 0.280
0.0586 0.287
0.0527 0.281
0.0593 0.287
0.959
0.958
0.959
0.957
57.8 49.9
55.8 50.8
52.4 -
50.5 -
54.2 -
50.4 -
54.7 -
52.1 -
55.9 -
Notes:
BEM: BEM model calculations. Data: experimental data. Data G2: experimental data recorded at gauge No. 2. Data G3: experimental data recorded at gauge No. 3. AE/E: rate of energy dissipation. (a): wave reflection height at the upstream open boundary located. 4 wave depths
upstream of the sloping bottom. (b): wave transmission height at the wave gauge No. 3. (c): wave energy dissipation (column 13). Cd): drop structure energy dissipation calculated using Eqs. (5) and (6) with h, = 0.1 .
H, and A z = A, - Ai (column 14).
References
Biesel, F., I95 1. Study of wave propagation in water of gradually varying depth. Natl. Bur. Stand. Circ., 52 I : 243-253.
Bin, A.K., 1993. Gas entrainment by plunging liquid jets. Chem. Eng. Sci., 48(21): 358553630.
Ghan, ES., 1994. Mechanics of deep water plunging-wave impacts on vertical structures. Coastal Eng., 22:
115-133.
Chan, E.S. and Melville, W.K., 1988. Deep-water plunging wave pressures on a vertical plane wall. Proc. R.
Sot. London, A417: 95-131.
Chanson, H., 1995a. Hydraulic Design of Stepped Cascades, Channels, Weirs and Spillways. Pergamon,
Oxford, 292 pp. (ISBN O-08-041918-6).
Chanson, H., 1995b. Air Bubble Entrainment in Free-surface Turbulent Flows. Experimental Investigations.
Report CH46/95, Dept. of Civil Engineering, University of Queensland, 368 pp. (ISBN O-86776-61 l-5). Chanson, H. and Cummings, P.D., 1992. Aeration of the Ocean due to Plunging Breaking Waves. Research
Report No. CE142, Dept. of Civil Engineering, University of Queensland, 42 pp. Chanson, H. and Lee, J.F., 1995. Characteristics of Plunging Breaking Waves. Research Report No. CE150,
Dept. of Civil Engineering, University of Queensland, 54 pp.
Cokelet, E.D., 1977. Breaking waves. Nature, 267: 769-774. Coles, K.A., 1967. Heavy Weather Sailing. Adlard Cole& London, 303 pp.
Hubbard, D.W., Griffin, O.M. and Peltzer, R.D., 1987. Foam Generation and Air Entrainment near a Free
Surface. Naval Research Laboratory Memorandum Report 6038, Washington, DC.
Hwung, H.H., Chyan, J.M. and Chung, Y.C., 1992. Energy dissipation and air bubbles mixing inside surf
zone. In: Proc. 23rd Int. Conf. Coastal Eng., Venice. ASCE, Vol. 1, Ch. 22, pp. 308-321. Ippen, A.T., 1966. Estuary and Coastal Hydrodynamics. McGraw-Hill, New York.
H. Chanson, L. Jaw-Fong/Coustul Engineering 31 (1997) 125-141 141
Iversen, H.W., 1951. Laboratory study of breakers. Natl. Bur. Stand. Circ., 521: 9-32.
Iversen, H.W., 1952. Waves and breakers in shoaling water. In: Proc. 3rd Conf. Coastal Eng., Cambridge,
MA, pp. l-12. Koga, M., 1982. Bubble Entrainment in Breaking Wind Waves. Tellus, 34f5): 48 l-489.
Lee, J.F., 1995. A boundary element formulation for 2D Stokes flow with filtration barriers. In: Proc. 10th Int.
Conf. on Boundary Element Tech. BETECH95, Liege. CMP, Southampton, pp. 145-152.
Lin, C. and Hwung, H.H., 1992. External and internal flow fields of plunging breakers. Exp. Fluids, 12:
229-237.
Longuet-Higgins, M.S., 1988. Mechanisms of wave breakin, m in deep water in see surface sound. In: B.R. Kerman (Editor), NATO ASI Series C, Vol. 238. Kluwer Academic Publishers, pp. l-30.
Melville, W.K. and Rapp, R.F., 1985. Momentum Flux in Breaking Waves. Nature, 3 17: 514-516.