platinum group metals yearbook 2018cpmgroup.com/files/presentations/2018/cpm pgm yearbook...1976...
TRANSCRIPT

Platinum Group Metals Yearbook 2018
Jeffrey M. Christian
Rohit Savant
10 July 2018

Special Thank You to This Year’s Sponsors
2
Sponsors
CME Group Commodities Now
Group Ten Metals Kitco Metals Inc.
Monex Precious Metals New Age Metals
NOAH Capital Markets Platinum Group Metals Ltd.
Umicore
Sabin Metal Group of Companies
The Institute of Scrap Recycling Industries, Inc.
Chinese Partners
China Gold Association
China National Gold Group Corporation
Jingyi Gold Co Ltd.

Economy
3

-6
-4
-2
0
2
4
6
8
10
-6
-4
-2
0
2
4
6
8
10
1980 1985 1990 1995 2000 2005 2010 2015 2020p 2025p
World
Emerging and Developing Economies
Advanced Economies
Real Gross Domestic Product
Annual, Projected Through 2026
Percent Change Percent Change
Actual Projected
Global Economic Growth
4
Average Global Economic Growth
Source: CPM Gold Long-Term Outlook
1980-2000 2000-2007 2010-2016 % Chg. 2017-2026
World 3.3% 4.5% 3.7% -17.8% 3.3%

Themes
5

Platinum Prices
6
750
850
950
1050
1150
1250
1350
1450
1550
1650
1750
1850
1950
10 11 12 13 14 15 16 17 18
$ / Oz
Platinum Prices: 1 January 2010 to 5 July 2018

Platinum Market Remains In A Surplus
7
-1,600
-1,400
-1,200
-1,000
-800
-600
-400
-200
0
200
400
600
800
1,000
1,200
1,400
1,600
-1,600
-1,400
-1,200
-1,000
-800
-600
-400
-200
0
200
400
600
800
1,000
1,200
1,400
1,600
76 78 80 82 84 86 88 90 92 94 96 98 00 02 04 06 08 10 12 14 16 18p
Platinum Surplus/Deficit
Annual, Projected Through 2018
Thousand Ounces Thousand Ounces
Deficit/Net Reduction in Inventories
Surplus/ Net Additions to Inventories

Platinum Cumulative Surpluses Recover
8
0
2
4
6
8
10
12
14
16
76 78 80 82 84 86 88 90 92 94 96 98 00 02 04 06 08 10 12 14 16
Government of Russia Estimated Investor Holdings
Estimated Industry Inventories Reported ETF Holdings
Reported Exchange Inventories Cummulative Surplus
Cumulative Platinum Surplus And Its Disposition
Mil. Oz.

Palladium Prices
9
350
400
450
500
550
600
650
700
750
800
850
900
950
1000
1050
1100
1150
Jan-10 Jan-12 Jan-14 Jan-16 Jan-18
$ / Oz
Palladium Prices: 1 January 2010 to 5 July 2018

Palladium Tight Market Conditions
-2,000
-1,500
-1,000
-500
0
500
1,000
1,500
2,000
2,500
3,000
3,500
-2,000
-1,500
-1,000
-500
0
500
1,000
1,500
2,000
2,500
3,000
3,500
76 79 82 85 88 91 94 97 00 03 06 09 12 15 18p
Thousand Ounces Thousand Ounces
Deficit/Net Reduction in Inventories
Surplus/Net Additions to Inventories
Annual, Projected Through 2018
Palladium Surplus/Deficit

Palladium Investors Increase Their Holdings
11
0
5
10
15
20
25
30
76 78 80 82 84 86 88 90 92 94 96 98 00 02 04 06 08 10 12 14 16
Government of Russia Estimated Investor Holdings Estimated Industry Inventories
Reported ETF Holdings Reported Exchange Inventories
Cumulative Palladium Surplus And Its Disposition
Mil. Oz.

Rhodium Prices
12
0
2,200
4,400
6,600
8,800
11,000
S-94 S-97 S-00 S-03 S-06 S-09 S-12 S-15
Daily JM Rhodium Prices
Through 5 July 2018
$/Ounce

Rhodium Surplus/Deficit
-200
-150
-100
-50
0
50
100
150
200
-200
-150
-100
-50
0
50
100
150
200
1976 1980 1984 1988 1992 1996 2000 2004 2008 2012 2016
Rhodium Surplus/Deficit
Annual, Projected Through 2018
Thousand Ounces
Thousand Ounces
Surplus/ Net Additions to Inventories
Deficit/ Net Reduction in Inventories
Thousand Ounces

Platinum
14

Platinum Supply Needs To Decline Further
0
1
2
3
4
5
6
7
8
9
0
1
2
3
4
5
6
7
8
9
76 78 80 82 84 86 88 90 92 94 96 98 00 02 04 06 08 10 12 14 16 18p
Million Ounces Million Ounces
Annual Platinum Supply
Projected Through 2018
South African Mine Production
Other Mine Production
Secondary Supply
Russian Supply

Platinum Secondary Supply Plateaus At Lower Levels
16
0
200
400
600
800
1,000
1,200
1,400
1,600
1977 1981 1985 1989 1993 1997 2001 2005 2009 2013 2017
China
Europe
Japan
United States
Platinum Available for Recovery from Spent Auto Catalysts
Annual, Projected Through 2018
Thousand Troy Ounces

Fabrication Demand Has Been Flat For Over Seven Years
17
0
1
2
3
4
5
6
7
8
9
0
1
2
3
4
5
6
7
8
9
76 78 80 82 84 86 88 90 92 94 96 98 00 02 04 06 08 10 12 14 16 18p
Other Countries
Other Uses
Dental
Petrochemical
Electronics
Million OuncesMillion Ounces
Jewelry
Automotive
Annual Platinum Fabrication Demand
Through 2018
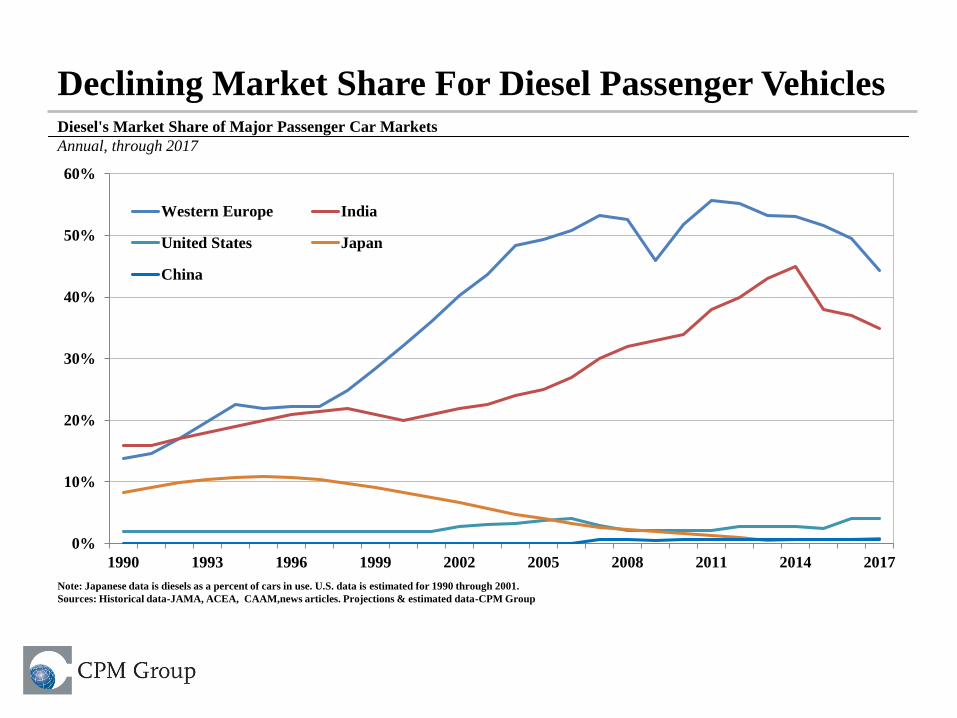
Declining Market Share For Diesel Passenger Vehicles
0%
10%
20%
30%
40%
50%
60%
1990 1993 1996 1999 2002 2005 2008 2011 2014 2017
Western Europe India
United States Japan
China
Diesel's Market Share of Major Passenger Car Markets
Annual, through 2017
Note: Japanese data is diesels as a percent of cars in use. U.S. data is estimated for 1990 through 2001.
Sources: Historical data-JAMA, ACEA, CAAM,news articles. Projections & estimated data-CPM Group

Strength In Commercial Vehicles Is Offsetting Weakness In
Passenger Vehicle Demand
0
500
1,000
1,500
2,000
2,500
J F M A M J J A S O N D
2013 2014 2015 2016 2017 2018
Monthly Commercial Vehicle Sales
Thous Units
Notes: Countries/regions included in this data series are China, US, Europe, Japan, India, and Brazil. These countries/regions account for 75% of global annual sales.
Sources: national auto associations, OICA, Bloomberg
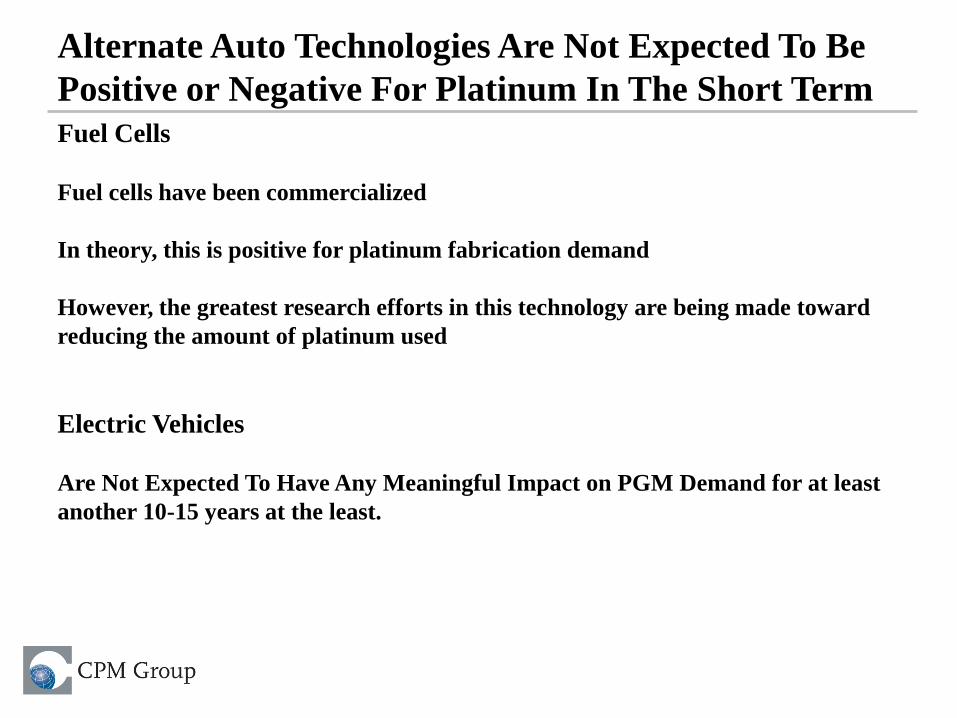
Alternate Auto Technologies Are Not Expected To Be
Positive or Negative For Platinum In The Short Term
Fuel Cells
Fuel cells have been commercialized
In theory, this is positive for platinum fabrication demand
However, the greatest research efforts in this technology are being made toward
reducing the amount of platinum used
Electric Vehicles
Are Not Expected To Have Any Meaningful Impact on PGM Demand for at least
another 10-15 years at the least.

Platinum Jewelry Demand Fails To Rise
0
500
1,000
1,500
2,000
2,500
3,000
0
500
1,000
1,500
2,000
2,500
3,000
1976 1981 1986 1991 1996 2001 2006 2011 2016
Thousand Ounces
Annual Data, Projected Through 2018
Thousand Ounces
Platinum Jewelry Demand

Investors Net Sellers Of Platinum ETPs YTD
22
-400,000
-200,000
0
200,000
400,000
600,000
800,000
1,000,000
-400,000
-200,000
0
200,000
400,000
600,000
800,000
1,000,000
Annual Changes to Platinum ETP Holdings
Annual, Through June 2018
Troy Ounces Troy Ounces
0.0
0.5
1.0
1.5
2.0
2.5
3.0
0.0
0.5
1.0
1.5
2.0
2.5
3.0
07 08 09 10 11 12 13 14 15 16 17 18
PHPT LSE
ZKB
Platinum PPLT NYSE
NewPlat JSE
Platinum Exchange Traded Product Holdings
Daily, Through June 2018
Moz Moz

Platinum Non-Commercials Turn Net Short
23
-2,500
-1,600
-700
200
1,100
2,000
2,900
3,800
-2,500
-1,600
-700
200
1,100
2,000
2,900
3,800
95 97 99 01 03 05 07 09 11 13 15 17
Long
Short
Net Fund Position in Nymex
'000 Ozs
Non-Commercial Gross Long and Short Platinum Positions
Nymex Futures & Options. Weekly Data, Through
'000 Ozs
26 Jun. 2018

Palladium
24

Annual Palladium Supply To Rise At A Gradual Rate This Year
0
1
2
3
4
5
6
7
8
9
10
0
1
2
3
4
5
6
7
8
9
10
76 80 84 88 92 96 00 04 08 12 16
South African Mine Production
Russian Supply
Other Mine Production
Million OuncesMillion Ounces
Secondary Supply
Note: Russian supply is exports through 2002 and production since 2003.
Annual Palladium Supply
Projected Through 2018

Annual Palladium Fabrication Demand To Continue Rising This Year
0.0
1.0
2.0
3.0
4.0
5.0
6.0
7.0
8.0
9.0
10.0
0.0
1.0
2.0
3.0
4.0
5.0
6.0
7.0
8.0
9.0
10.0
76 79 82 85 88 91 94 97 00 03 06 09 12 15 18p
Electrical Auto
Dental Jewelry
Petro Chemical Other Uses
Million OuncesMillion Ounces
Annual Palladium Fabrication Demand
Projected Through 2018

Strong Vehicle Sales
27
-
5
10
15
20
25
1992 1997 2002 2007 2012 2017
Million Units
U.S. Auto Sales
-
5,000
10,000
15,000
20,000
25,000
30,000
05 06 07 08 09 10 11 12 13 14 15 16 17 18
Annual Vehicle Sales in China
Thousand Vehicles

US Sales Continue To Grow Larger
0%
10%
20%
30%
40%
50%
60%
70%
80%
90%
100%
2002 2005 2008 2011 2014 2017
Passenger Cars Light Trucks
Ratio of US Cars to Light Truck Sales
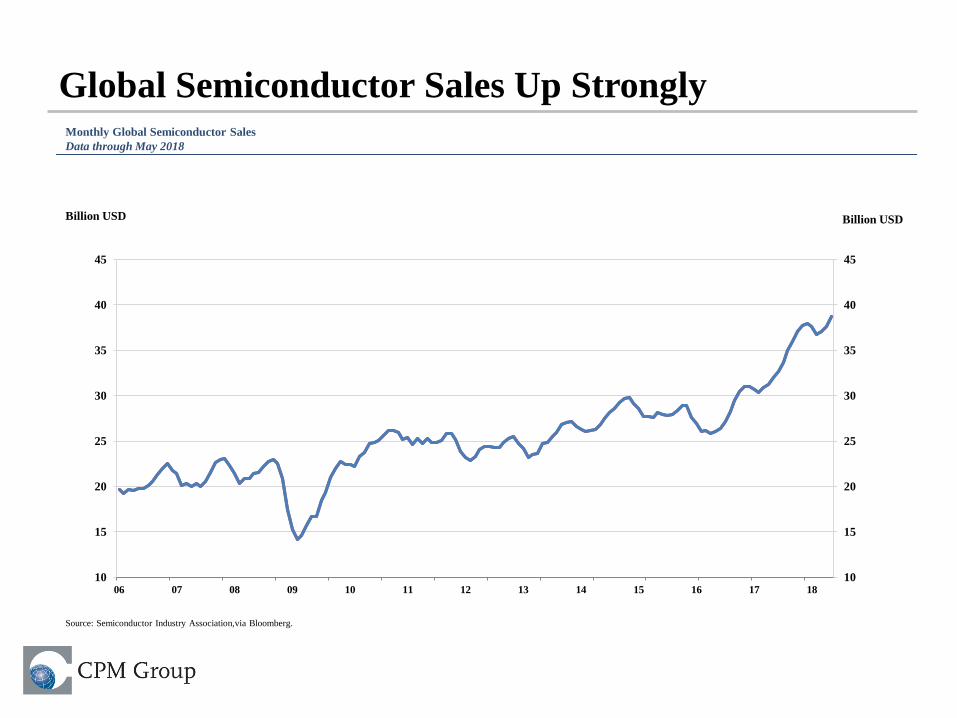
Global Semiconductor Sales Up Strongly
10
15
20
25
30
35
40
45
10
15
20
25
30
35
40
45
06 07 08 09 10 11 12 13 14 15 16 17 18
Source: Semiconductor Industry Association,via Bloomberg.
Monthly Global Semiconductor Sales
Data through May 2018
Billion USD Billion USD

Investors Net Sellers Of Palladium ETPs YTD
30
0.0
0.5
1.0
1.5
2.0
2.5
3.0
3.5
0.0
0.5
1.0
1.5
2.0
2.5
3.0
3.5
07 08 09 10 11 12 13 14 15 16 17 18
ABSAStandard BankSPPP NYSE (Sprott)MitsubishiSPALSPDMWITEGLTR
PHPD
ZKB
PALL
NYSE
Palladium ETP Holdings
Monthly Data, Through June 2018
Mln OzMln Oz
Source: ETP issuer website, Bloomberg
-800
-600
-400
-200
0
200
400
600
800
1,000
1,200
2007 2009 2011 2013 2015 2017
Thousand Ounces
Annual Changes to Palladium ETP Holdings
Through June 2018
Source: Bloomberg, ETP issuer website . Note: Yellow bar represents year-to-date
change in ETP holdings excluding two South African palladium ETPs.

Rhodium
31

Rhodium Supply Expected to Decline Slightly
0
200
400
600
800
1,000
1,200
0
200
400
600
800
1,000
1,200
1977 1985 1993 1997 2001 2005 2009 2013 2017
Thousand Ounces Thousand Ounces
Mine Production
Secondary Supply
Annual Rhodium Supply
Projected Through 2018

Rhodium Fabrication Demand: Rising
0
200
400
600
800
1000
1200
0
200
400
600
800
1000
1200
76 79 82 85 88 91 94 97 00 03 06 09 12 15 18p
Automotive Electronics
Chemical Glass
Other Other Countries
Thousand Ounces Thousand Ounces
Rhodium Fabrication DemandAnnual Data, Projected Through 2018

ETF Investors Have Been Selling
0
20,000
40,000
60,000
80,000
100,000
120,000
140,000
0
20,000
40,000
60,000
80,000
100,000
120,000
140,000
May-11 May-12 May-13 May-14 May-15 May-16 May-17 May-18
Rhodium Exchange Traded Product Holdings
Daily, Through June 2018
Ounces Ounces
Note: Metal is stored in the United Kingdom and is the combined holdings of the ETC's two primary listings, the db Physical Rhodium ETC (EUR) traded on the Xetra and Borse Italiano and the db Physical
Rhodium ETC traded on the LSE.
Source: db, Bloomberg

Minor PGMs
35

Ruthenium
0
100
200
300
400
500
600
700
800
900
0
100
200
300
400
500
600
700
800
900
72 74 76 78 80 82 84 86 88 90 92 94 96 98 00 02 04 06 08 10 12 14 16 18
$/Ounce$/Ounce
$
Metals Week New York Dealer Prices, Through 17 May 2018
The Price of Ruthenium

Iridium
0
200
400
600
800
1000
1200
0
200
400
600
800
1000
1200
72 74 76 78 80 82 84 86 88 90 92 94 96 98 00 02 04 06 08 10 12 14 16 18
$/Ounce$/Ounce
Metals Week New York Dealer Prices, Through 17 May 2018The Price of Iridium

Osmium
0
100
200
300
400
500
600
700
800
900
1,000
0
100
200
300
400
500
600
700
800
900
1,000
72 74 76 78 80 82 84 86 88 90 92 94 96 98 00 02 04 06 08 10 12 14 16 18
The Price of Osmium
Metals Week New York Dealer Prices, Through 17 May 2018
$/Ounce$/Ounce