plastics recovery assessment advisory workgroup
TRANSCRIPT

Oregon Plastics Recovery Assessment
January 2015
with

OREGON PLASTICS RECYCLING ASSESSMENT
Acknowledgments
The Oregon Department of Environmental Quality gratefully acknowledges the valuable contributions and insights of the members of the Plastics Recovery Assessment Advisory Workgroup:
Elizabeth Bedard, Association of Post-Consumer Plastics Recyclers (APR)
Allison Briggs-Ungerer, Assn. of Oregon Recyclers
Craig Cookson, American Chemistry Council
Dennis Denton, Denton Plastics
Kim Holmes, Society of Plastics Industries (SPI)
Julie Jackson, Republic Services
Nichole Janssen, Denton Plastics
Laura Leebrick, Oregon Refuse and Recycling Association
David Michaud, Tomra
Patty Moore, Moore Recycling Associates
Megan Ponder, City of Portland
Mark Rumford/Kevin DeWhitt, Agilyx
Mark Saelens, Lincoln County Solid Waste District
Vinod Singh, Far West Recycling
Carolyn Stein, BRING Recycling
Matt Stern, Waste Management
Matt Tracy, Metro
The Oregon Department of Environmental Quality also gratefully acknowledges the valuable contributions of numerous other individuals who either provided information by way of personal communications to the project or participated in open public meetings of the Advisory Workgroup.
This Report has been prepared for the State of Oregon, Department of Environmental Quality, to provide information useful for guiding state government recycling policy decisions and the information in this report should not be relied upon for any other purpose or by any other party. Data and information reviewed for this report were only investigated to the extent necessary for this purpose, and should not be considered suitable for business planning decisions. Specifically, the following data and information limitations apply:
Accuracy of Data: No investigation was conducted as to the completeness or accuracy of statements made or data obtained. Information contained in this Report was limited to data available from publically available sources (e.g., annual reports, studies, websites, etc.) as well as information willingly disclosed by representatives of establishments interviewed for this study.
Unaudited Information: The data provided in this report has not been audited or otherwise verified. There have not been any independent audit activities performed or verification of the information obtained from publically available sources or statements made by representatives of establishments interviewed for this study.
Age of Data and Information: This evaluation was conducted from March 2014 to September 2014 and based on plastics composition data that ranges from 2009 to 2012. As a result, some information relevant to the analysis is dated and may not be representative of current or future quantities or compositions.

OREGON PLASTICS RECYCLING ASSESSMENT
i
Table of Contents
Executive Summary ............................................................................................................................1
Existing Levels of Plastics Generation, Recycling, and Disposal ............................................................. 1
Market and Infrastructure Analysis ........................................................................................................ 2
Approaches to Overcome Barriers and Estimates of Increased Plastics Recycling ................................ 3
Assessment of Recycling Benefits .......................................................................................................... 6
Section 1. Introduction ......................................................................................................................8
Section 2. Plastics Disposal and Recycling ...........................................................................................9
Data Sources and Methods .................................................................................................................... 9
Overview of Recovery and Disposal ..................................................................................................... 10
Disposal Estimates by Waste Stream ................................................................................................... 12
Detailed Disposal Estimates by Plastic Type......................................................................................... 13
Section 3. Overview of Recycling Markets ......................................................................................... 17
Overview of Existing Recycling Markets ............................................................................................... 17
Market Specifications and Quality ....................................................................................................... 18
Market Options for Mixed Plastics and Minor Resins .......................................................................... 19
Section 4. Overview of Recovery Options .......................................................................................... 22
Recovery Options ................................................................................................................................. 22
Section 5. Sorting Technologies ........................................................................................................ 30
Materials Recovery Facility Technologies ............................................................................................ 30
Film Plastics Sorting .............................................................................................................................. 33
Reprocessor Sorting Technologies ....................................................................................................... 36
Plastics Recovery Facilities ................................................................................................................... 37
Section 6. Key State Waste and Recycling Policies with Significant Potential to Increase Plastics Recycling ......................................................................................................................................... 40
Pay-As-You-Throw Disposal Pricing ...................................................................................................... 42
Product Disposal Ban ............................................................................................................................ 42
Mandatory Recycling of Specified Materials ........................................................................................ 43
Mandatory Programs—Service Levels ................................................................................................. 44
Targeted Outreach and Technical Assistance ...................................................................................... 45
Recycling Program Management ......................................................................................................... 45
Integrated Solid Waste Management Plans ......................................................................................... 46
Recycling/Diversion Rate Requirements/Goals.................................................................................... 47
Disposal Tip Fee Surcharge/Tax ............................................................................................................ 48
Recycling Technical Assistance/Infrastructure/Program Grants .......................................................... 50
Recycling Market Development Programs ........................................................................................... 51
Mandatory Retail Take-Back (for Plastic Film) ..................................................................................... 51

OREGON PLASTICS RECYCLING ASSESSMENT
ii
Building Design Standards .................................................................................................................... 52
Renewable Energy Portfolio ................................................................................................................. 53
Mandatory Waste Processing/No Direct Landfilling ............................................................................ 54
Section 7. Options for Recycling More Plastics .................................................................................. 55
Infrastructure Analysis ......................................................................................................................... 55
Options for Recycling More Plastics ..................................................................................................... 58
Section 8. Considerations for Moving Forward .................................................................................. 62
Obstacles, Barriers, and Strategies for Success .................................................................................... 62
Opportunities for Private-Sector Involvement ..................................................................................... 66
Section 9. Estimates of Increased Plastics Recycling .......................................................................... 68
Section 10. Assessment of Recycling Benefits .................................................................................... 71
Recycling Scenarios without Electronics .............................................................................................. 74
Recycling Options with Electronics....................................................................................................... 76
Appendix A. Plastics Category Definitions ......................................................................................... 78
Oregon Plastics Definitions................................................................................................................... 78
Vermont Plastics Definitions ................................................................................................................ 80

OREGON PLASTICS RECYCLING ASSESSMENT
iii
List of Tables
Table 1. Estimated Plastics Recycling, Disposal, Generation, and Recycling Rates in Oregon (2012) ......... 1
Table 2. Increase in Recycling Quantities from Selected Options ............................................................... 5
Table 3. Estimated Quantities of Additional Recycling, by Resin Type ........................................................ 6
Table 4. GHG and Energy Use Benefits of Recycling Options, Including Electronics (EPA WARM) ............. 7
Table 5. Greenhouse Gas and Energy Savings Potential for Increased Plastics Recycling Options ............. 7
Table 6. Estimated Plastics Recycling, Disposal, Generation, and Recycling Rates in Oregon (2012) ....... 11
Table 7. Plastics Recycling in Oregon, by Material Type, 2007–2012 ........................................................ 11
Table 8. Estimated Statewide Plastics Disposal Composition and Tonnage by Waste Stream (2012) ...... 13
Table 9. Estimated Residential and Commercial Plastics Disposal Composition and Tonnages for Oregon with Extended Material List ........................................................................................................................ 14
Table 10. Estimated Plastics Disposal by Commercial Sector .................................................................... 15
Table 11. Detailed Plastics Subclass Estimates for Oregon—Top 20 Materials ......................................... 16
Table 12. Plastics Recycling in Oregon (2012) ............................................................................................ 17
Table 13. Summary of Recovery Market Specifications and Material Value ............................................. 29
Table 14. Summary of State-Level Policy Options and Generating Sector Applicability ........................... 41
Table 15. Increase in Recycling Quantities from Options .......................................................................... 70
Table 16. Estimated Quantities of New Recycling, by Resin Type ............................................................. 73
Table 17. Greenhouse Gas Emissions Benefits of Recycling Options Without Electronics (EPA WARM) .. 74
Table 18. Energy Use Benefits of Recycling Options without Electronics (EPA WARM) ............................ 75
Table 19. Greenhouse Gas Emissions Benefits of Recycling Options with Electronics (EPA WARM) ........ 76
Table 20. Energy Use Benefits of Recycling Options with Electronics (EPA WARM) ................................. 77
Table 21. Greenhouse Gas and Energy Savings Potential for Increased Plastics Recycling Options ......... 77

OREGON PLASTICS RECYCLING ASSESSMENT
iv
List of Figures
Figure 1. Plastics Recycling and Disposal Tonnages, with Material Recycling Rates (2012) ........................ 1
Figure 2. Increase in Recycling Quantities and Recycling Rate from Options .............................................. 4
Figure 3. Plastics Recycling in Oregon, by Material Type, 2007–2012....................................................... 11
Figure 4. Plastics Recycling and Disposal by Material Type (2012) ............................................................ 12
Figure 5. Plastics Recycling and Disposal Tonnages, with Material Recycling Rates (2012) ...................... 12
Figure 6. Emerging Plastics Markets in the United States and Canada ..................................................... 20
Figure 7. Sort for Value Matrix ................................................................................................................... 21
Figure 8. Screen .......................................................................................................................................... 30
Figure 9. Ballistic Separator ....................................................................................................................... 31
Figure 10. Optical Sorters ........................................................................................................................... 31
Figure 11. Robotic Sorter ........................................................................................................................... 32
Figure 12. Manual Sorting of Film .............................................................................................................. 33
Figure 13. Bollegraaf Film Grabber ............................................................................................................ 34
Figure 14. Bollegraaf Paper Magnet .......................................................................................................... 35
Figure 15. CP Mfg. Air Drum Separator ...................................................................................................... 35
Figure 16. Grocery Rigid Plastics ................................................................................................................ 59
Figure 17. Closed Loop Fund Timeline for Action ...................................................................................... 67
Figure 18. Increase in Recycling Quantities and Recycling Rate from Options .......................................... 68
OREGON PLASTICS RECYCLING ASSESSMENT
1
Executive Summary
Research on discards in Oregon has shown that increasing plastics recycling provides higher levels of potential energy and greenhouse gas savings compared to increasing the recycling of other major materials remaining in the waste stream. The purpose of this project was to identify specific opportunities to increase plastics recycling in Oregon and assess the lifecycle impacts of doing so.
Existing Levels of Plastics Generation, Recycling, and Disposal
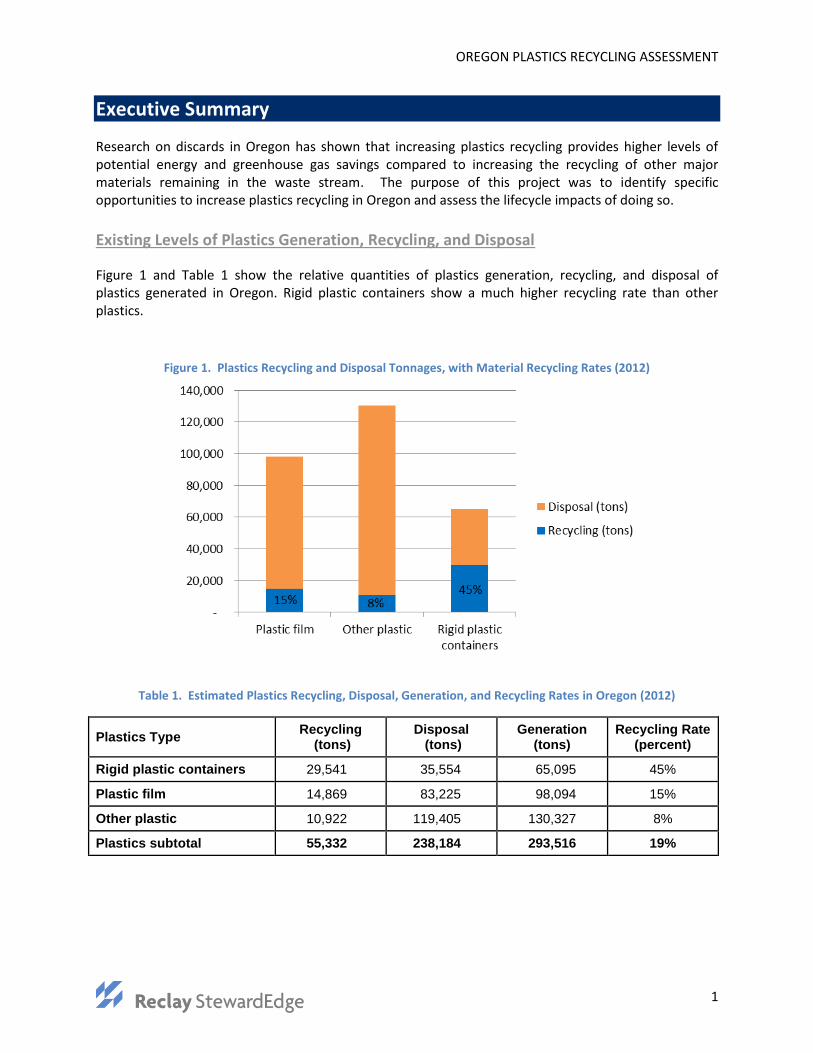
Figure 1 and Table 1 show the relative quantities of plastics generation, recycling, and disposal of plastics generated in Oregon. Rigid plastic containers show a much higher recycling rate than other plastics.
Figure 1. Plastics Recycling and Disposal Tonnages, with Material Recycling Rates (2012)
Table 1. Estimated Plastics Recycling, Disposal, Generation, and Recycling Rates in Oregon (2012)
Plastics Type Recycling
(tons) Disposal (tons)
Generation (tons)
Recycling Rate (percent)
Rigid plastic containers 29,541 35,554 65,095 45%
Plastic film 14,869 83,225 98,094 15%
Other plastic 10,922 119,405 130,327 8%
Plastics subtotal 55,332 238,184 293,516 19%

OREGON PLASTICS RECYCLING ASSESSMENT
2
As Figure 1 and Table 1 show, large quantities of plastics are not currently being recycled in the state. A number of contributing factors have resulted in barriers to higher levels of plastics recovery. To understand the barriers and the role that the State of Oregon and local authorities can play in overcoming the barriers, it is necessary to assess markets for plastics and the ability of local collection and processing infrastructures and reclamation infrastructures to sort and clean plastics in a cost-effective manner so that the recycled plastics can be used in the manufacture of products.
Market and Infrastructure Analysis
Oregon’s recycling infrastructure was analyzed for this report to identify where there are obstacles to plastics recycling that could be overcome with additional action by the State of Oregon and/or Metro. This analysis found that residential collection programs for recycling were generally uniform and robust and provided recycling opportunities to the vast majority of Oregon’s population. However, there are opportunities to expand the types of residential plastics that are collected beyond the rigid plastic containers that are the limit of what is targeted by most residential collection programs. Expanded plastics recycling could include other rigid plastic packaging, and potentially all rigid residential plastics.
For technical and market reasons, collection of residential film plastics is not recommended through the state’s curbside recycling infrastructure. The primary infrastructure for recycling residential film plastics is through return-to-retail and other drop-off collection programs. Currently less than half of recyclable residential film plastic is being collected in the state, and a more robust effort on drop-off film recycling could be considered.
Like residential plastics, commercial rigid and film plastics recycling fall short of their potential, mostly due to limitations in the ability to collect and sort rigid plastics in commingled commercial recyclables streams and the lack of infrastructure to collect film from small and medium-sized businesses.
Unlike typical residential single-stream materials recovery facilities (MRFs) in other states, none of Oregon’s MRFs have optical sorters for plastics. Because of this limitation, Oregon’s single-stream MRFs manually sort out bulky rigid plastics, film plastics, PET bottles, and HDPE bottles, and bale the remainder as pre-picked rigid plastic. Many of the PET bottles remain in Oregon to be reclaimed at ORPET, while most mixed residential plastics are exported to Asia for manual sorting and reclamation.
In addition to the residential MRFs discussed above, Oregon has a number of dry waste MRFs that can sort dry mixed waste to extract recyclables before disposing of the residual waste. Twelve of these MRFs are located in the Metro area and process dry waste as part of Metro’s dry waste landfill ban. The dry waste they process is primarily construction and demolition debris, as well as some loads of dry waste from industrial facilities and industrial parks. These dry waste MRFs recover only a small percentage of the plastics that pass through them.
Oregon does not have any reclaimers that can purchase and wash dirty plastics in the state except for ORPET, which accepts only PET bottles (no PET thermoforms) from both the deposit-return system and residential MRFs. ORPET purchases only PET since it lacks the equipment to sort mixed plastics. Other in-state reclaimers process only clean and dry materials that do not need washing—primarily commercial plastics and some bulky rigid plastics. AgriPlas is a specialty recycler of agricultural plastics in the state.

OREGON PLASTICS RECYCLING ASSESSMENT
3
Key market and infrastructure gaps and barriers can be summarized as follows:
In-state MRFs lack the ability to sort plastics into the grades domestic plastics reclaimers want to purchase, except for basic grades like PET and HDPE bottles, meaning that more sorting must be performed by someone else—usually export markets.
The lack of plastics recycling facilities in the Pacific Northwest that can accept and sort mixed plastics, and the fact that plastics reclaimers in the region specialize in narrow types of plastics (clean material only or specific plastics resins) limits the collecting and recycling of more types of plastics in Oregon. It should be noted that there is good domestic market demand out-of-state for plastic bottles and clean film not requiring washing as well as steady demand from export markets for mixed grades of rigid plastics.
Reclaimers with wash lines in the Pacific Northwest are extremely limited. Merlin in Canada, while a regional market, does not need increased plastics flows from the United States.
The inability to handle film cost-effectively in residential single-stream MRFs, along with diminished quality and value of such film, is a barrier to increased recycling of residential and dry waste film recycling. There are two parts to this barrier: 1) a technology barrier associated with the lack of cost-effective sorting equipment for sorting film plastics in single-stream MRFs, and 2) a market barrier due to the lack of film washing capability in the Pacific Northwest. Currently nearly all MRF film from Oregon goes to export markets.
Technical barriers also exist that prevent companies from recycling coated or laminated film plastics. These materials must either be sent to a recovery market or be disposed.
There are no full-scale recovery markets for mixed plastics in the Pacific Northwest. Developing a diversity of such markets, if desired in Oregon, would require a long-term cooperative effort between private industry and state and local authorities. Private industry has not invested in mixed plastics processing capacity in Oregon to date for several reasons, including Oregon’s small population compared to neighboring states, and lack of guarantees that mixed plastics will not continue to flow to export markets.
Export markets, especially for mixed plastics and MRF film plastics have been unstable in the last couple of years, particularly following enactment of China’s Green Fence policy regarding acceptance of recycled materials.
Approaches to Overcome Barriers and Estimates of Increased Plastics Recycling
Information for this study as presented in this report was developed by the consulting team of Reclay StewardEdge Inc. (RSE) and Cascadia Consulting Group. This information was considered by the Oregon Department of Environmental Quality, a multi-stakeholder Plastics Recovery Assessment Advisory Workgroup, and the consultant project team to identify specific practical options to recycling more plastics from Oregon. Ultimately, ten options were identified as being practical for implementation. These options and projections of possible plastics recycling increases are shown below in Figure 2 and Table 2.
These options are listed in order from those considered easiest to implement at the top of the list or left of the chart, progressing to the more difficult to implement options at the bottom of the list or right of the chart. If all of these options are aggressively implemented, it is estimated that recycling of plastics from Oregon could increase by nearly 70 percent over current levels. It should be noted that the

OREGON PLASTICS RECYCLING ASSESSMENT
4
options are all focused on recycling of plastics as plastics materials. Diversion of plastics to energy recovery was not included in the options that were considered further, based on feedback from the Plastics Recovery Assessment Advisory Workgroup and Oregon DEQ staff.
Table 2 shows estimates for existing levels of specific plastics types targeted by each option, and the potential increase that has been estimated as part of this project, corresponding to the increases depicted in Figure 2. Table 2 also provides notes to explain the figures and assumptions for each option.
Figure 2. Increase in Recycling Quantities and Recycling Rate from Options
It should be noted that the increases in plastics recycling that could occur from each of the options assumes that they are aggressively implemented. This was done in order to estimate an upper limit of what may be achievable from the specific options, while recognizing that less diversion may occur if implementation of the options is not aggressively supported.
Table 2 and Figure 2 show that implementing all of the identified initiatives has the potential to increase plastics recycling by up to 30,000 tons per year, which would bring Oregon’s plastics recycling rate up to 29 percent compared to RSE’s estimate that Oregon has an approximate plastics recycling rate of 19

OREGON PLASTICS RECYCLING ASSESSMENT
5
percent at the time this report was prepared.1 Recycling plastics from additional electronic products (such as printers, peripherals, and other items) could contribute an additional 3,800 tons.
Table 2. Increase in Recycling Quantities from Selected Options
Option
Current Estimate (tons/yr)
Increase (tons/yr) Notes and Assumptions
Bottle bill expansion 6,500 2,000
2018 bottle bill expansion to 10 cents and expanded container list; 71% deposit return rate; increase is net tons diverted from disposal and does not include containers shifted from existing recycling programs
Grocery rigid plastics - 1,500 Based on 350 million pounds (175,000 tons) generated nationally and collection of 70% in Oregon
Restaurant rigid plastics 1,630 2,200
Assumes recycling can be increased 70% of generated quantities; generation and existing recycling quantities based on CalRecycle generation data allocated to Oregon using restaurant employment data
Improve residential film drop-off 2,000 1,000
Existing recycling estimated from curbside film collection data and national bag/wrap recycling report estimates for grocery returns; option assumes a 50% increase over existing recycling levels
Commercial film recycling 13,100 6,600 Option assumes commercial polyethylene film recycling can be increased 50% over existing levels
Dry waste recovery 1,000 1,100 Assumes 20% of plastics in existing dry waste recycling facilities can be separated for recycling
All residential rigid packaging 830 5,800
Increase is for trays and thermoforms not currently included in collection programs and improvements in participant setouts for non-bottle RPCs already collected; assumes achieving a 50% collection rate for packaging
All residential rigid plastic 2,200 9,700 Increase is for non-packaging plastics only (i.e., in addition to packaging increase above) and assumes achieving a 50% collection rate
1 If plastics in composite multi-material products (e.g., electronics and appliances) are included, based on U.S. EPA estimates,
plastics recycling is estimated at 15 percent. “Plastics” identified in official Oregon waste and recycling composition data are only for products and packaging that are made primarily from plastics with only incidental amounts of other non-plastic materials. In total, RSE estimates approximately 58,000 tons per year of plastics from Oregon are currently being recycled—approximately 55,000 tons per year of plastics reported in 2012 Oregon Material Recovery and Waste Generation Rates Report (2013) and an additional nearly 3,000 tons of plastics components estimated by RSE from electronic products that are recycled.
OREGON PLASTICS RECYCLING ASSESSMENT
6
Option
Current Estimate (tons/yr)
Increase (tons/yr) Notes and Assumptions
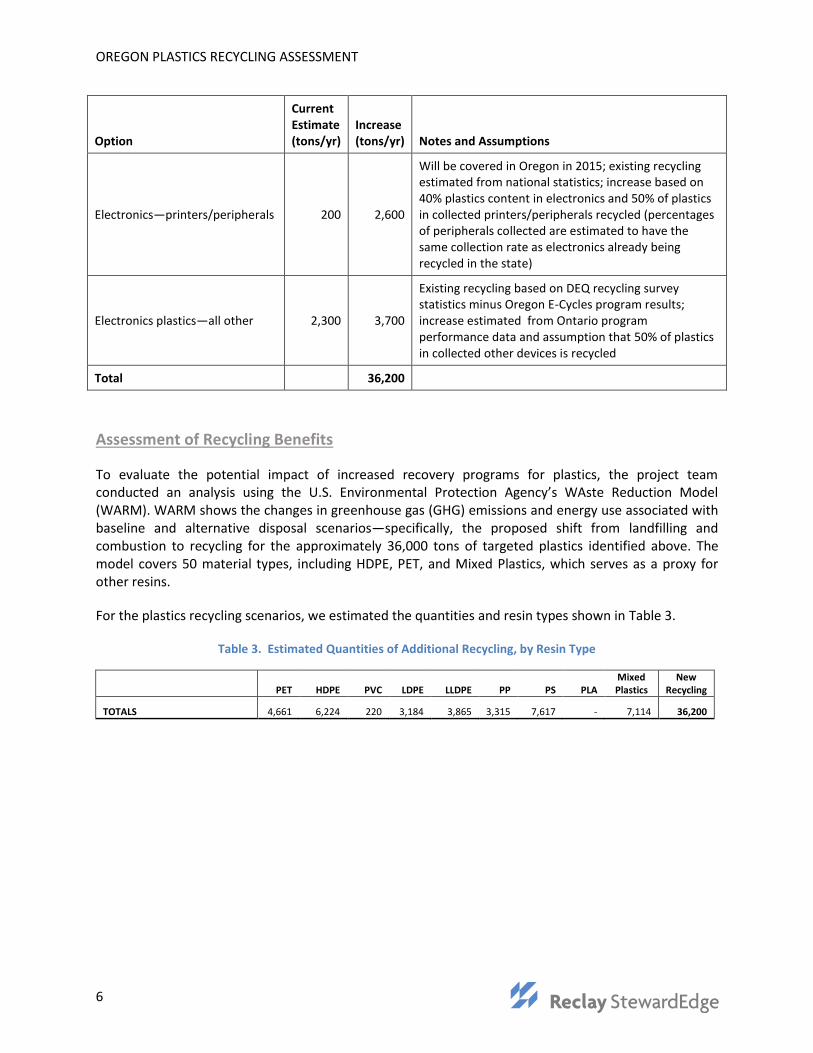
Electronics—printers/peripherals 200 2,600
Will be covered in Oregon in 2015; existing recycling estimated from national statistics; increase based on 40% plastics content in electronics and 50% of plastics in collected printers/peripherals recycled (percentages of peripherals collected are estimated to have the same collection rate as electronics already being recycled in the state)
Electronics plastics—all other 2,300 3,700
Existing recycling based on DEQ recycling survey statistics minus Oregon E-Cycles program results; increase estimated from Ontario program performance data and assumption that 50% of plastics in collected other devices is recycled
Total
36,200
Assessment of Recycling Benefits
To evaluate the potential impact of increased recovery programs for plastics, the project team conducted an analysis using the U.S. Environmental Protection Agency’s WAste Reduction Model (WARM). WARM shows the changes in greenhouse gas (GHG) emissions and energy use associated with baseline and alternative disposal scenarios—specifically, the proposed shift from landfilling and combustion to recycling for the approximately 36,000 tons of targeted plastics identified above. The model covers 50 material types, including HDPE, PET, and Mixed Plastics, which serves as a proxy for other resins.
For the plastics recycling scenarios, we estimated the quantities and resin types shown in Table 3.
Table 3. Estimated Quantities of Additional Recycling, by Resin Type
PET HDPE PVC LDPE LLDPE PP PS PLA
Mixed Plastics
New Recycling
TOTALS 4,661 6,224 220 3,184 3,865 3,315 7,617 - 7,114 36,200

OREGON PLASTICS RECYCLING ASSESSMENT
7
The results of WARM clearly show the benefit of increased plastics recycling and reduced landfilling and combustion. By not landfilling or burning 36,000 tons of plastic, nearly 5,800 metric tons carbon dioxide equivalent (MTCO2E) are avoided, mainly from avoided combustion, as shown in Table 4. Recycling these materials saves an estimated 34,000 MTCO2E, for net potential greenhouse gas reductions of nearly 40,000 MTCO2E. These GHG savings are equivalent to the annual emissions of more than 8,400 passenger vehicles. The plastics recycling options could produce net energy savings of more than 1,500,000 MBTUs, equivalent to the annual energy use of more than 13,600 households or more than 12 million gallons of gasoline.
Table 4. GHG and Energy Use Benefits of Recycling Options, Including Electronics (EPA WARM)
Greenhouse Gas Emissions
AVOIDED Total GHG Emissions from Baseline MSW Generation and Management (MTCO2E): (5,781)
Total GHG Emissions Reductions from Alternative MSW Generation and Management (MTCO2E): (34,140)
NET Incremental GHG Emissions (MTCO2E): (39,920)
Energy Use
LOST Total Energy Savings from Baseline MSW Generation and Management (million BTU): 11,667
Total Energy Use from Alternative MSW Generation and Management (million BTU): (1,511,905)
NET Incremental Energy Use (million BTU): (1,500,238)
Table 5 shows the potential greenhouse gas and energy savings for each of the separate options for increasing plastics recycling. Improved residential film drop-off, with an estimated 1,000 tons of additional recycling, yields the smallest GHG and energy savings. Expanded collection of all residential rigid plastics, with nearly 10,000 tons of additional recycling projected, yields the largest benefits.
Table 5. Greenhouse Gas and Energy Savings Potential for Increased Plastics Recycling Options
Recycling Option Additional
Recycling (tons) Potential GHG
Savings (MTCO2E) Potential Energy Savings (MBTUs)
Bottle bill expansion 2,000 (2,418) (66,516)
Grocery rigid plastics 1,500 (1,598) (66,475)
Restaurant rigid plastics 2,200 (2,399) (93,255)
Residential film drop-off 1,000 (1,002) (49,167)
Commercial film recycling 6,600 (6,613) (324,504)
Dry waste recovery 1,100 (1,133) (51,711)
All residential rigid packaging 5,800 (6,549) (228,552)
All residential rigid plastic 9,700 (11,007) (378,219)
Electronics – printers/peripherals 2,600 (2,971) (99,815)
Electronics plastics – all other 3,700 (4,228) (142,045)
TOTALS (rounded) 36,200 (39,920) (1,500,200)

OREGON PLASTICS RECYCLING ASSESSMENT
8
Section 1. Introduction
As part of the development of Oregon’s Materials Management 2050 Vision and Framework for Action, an analysis was done of the materials currently being disposed of in Oregon in terms of potential energy and greenhouse gas savings that could be gained by recovery and utilization of discards. Of all the materials analyzed, plastics as a whole showed the greatest potential for energy savings through recycling and recovery, and also showed significant potential for greenhouse gas reduction. Based on these findings, the Oregon Department of Environmental Quality (DEQ) and Metro initiated a project to analyze the waste and recycling streams to determine how much more plastics can be diverted from the waste stream and how those plastics can be recovered in such a way that they go to their highest and best use.
This report provides the results of that project, which was conducted by a project team led by Reclay StewardEdge Inc. and supported by Cascadia Consulting Group. This report is organized as follows:
Section 1. Introduction and purpose of the project.
Section 2. Estimates for the quantities of plastics that are generated, recycled, and disposed in Oregon, by type.
Section 3. Summary of recycling markets for recovered plastics to understand better what markets are currently available and what plastics types are currently recyclable by today’s market standards.
Section 4. Summary of recovery markets that non-recycled plastics can be directed to for conversion into energy or chemicals.
Section 5. Available commercial and pre-commercial technologies for sorting plastics into materials market categories either at a materials recovery facility (MRF), a plastics recycling facility (PRF), or at a reprocessing/reclamation operation.
Section 6. Waste and recycling policies with the potential to significantly increase plastics recycling that can be implemented at the state level.
Section 7. Options for recycling more plastics based on the information of the prior sections and the recommendations of the Plastics Recovery Assessment Advisory Workgroup.
Section 8. Considerations for moving forward with the options discussed in Section 7, including a discussion of barriers and obstacles and strategies for success.
Section 9. Estimates of increased plastics recycling that may be obtained if the options are aggressively undertaken.
Section 10. Lifecycle impacts assessment based on the estimate of the increase in recycling tons from Section 9.

OREGON PLASTICS RECYCLING ASSESSMENT
9
Section 2. Plastics Disposal and Recycling
This section provides an overview and summary of existing data sources regarding plastics recovery, disposal, and generation in Oregon. It also draws on data from studies in other states to provide additional estimates regarding types and quantities of plastics disposed and recovered in various sectors and waste streams.
Data Sources and Methods
This analysis reviewed existing data from DEQ, including the following statewide studies:
2012 Oregon Material Recovery and Waste Generation Rates Report (November 2013).
Background Paper: Plastic Recovery Assessment Project—Overview of Plastic Recycling and Disposal Information (May 2013).
Composition of Commingled Recyclables Before and After Processing (March 2011).
Oregon’s Rigid Plastic Container Recycling Rate for 2007 and Determination of the Recycling Rate for Compliance Purposes for 2009 (2008).
2009/2010 Waste Composition Study, data tables.
Trends in Oregon Waste Generation 1993–2010 (October 2011).
In particular, the May 2013 Background Paper: Plastic Recovery Assessment Project provides extensive information regarding plastics recycling and disposal in Oregon. Rather than replicating that information here, we direct the reader to the existing background paper. This summary document draws on different data sources, particularly those from outside of Oregon, to provide additional information to expand on and supplement the background paper.
The analysis examined data on material recovery and disposal from the following jurisdictions outside of Oregon:
California (2006)
Los Angeles, California (2007)
New York City (2012–2013)
Ontario, Canada (2001, 2011)
Vermont (2013)
Washington State (2009)
Wisconsin (2009)

OREGON PLASTICS RECYCLING ASSESSMENT
10
Overview of Recovery and Disposal
Table 6 provides summary estimates of plastics recycling, disposal, generation, and recycling rates for three major groups of “traditional” plastics in Oregon’s recycling and disposal streams—rigid plastic containers, plastic film, and other plastic.2 (Note that the “composite plastic” category—which consists largely of polyurethane foam materials, including carpet pad, packing materials, and furniture foam—is not included in this group for the purposes of the analysis in this report.)
Rigid plastic containers have a recycling rate estimated at 45 percent, while recycling rates are much lower for plastic film (15 percent) and other plastic (8 percent). The overall recycling rate across these three plastics categories is 19 percent.
As shown in Figure 3 and Table 7, recycling for all three categories of plastics have increased since 2007, a 35 percent increase overall. Rigid plastic containers represent the largest category and have shown significant increases since the addition of water bottles to Oregon’s bottle bill in 2009. Plastic film has shown the largest percent increase, with more than 50 percent growth since 2007.
Recycling data are reported in DEQ’s 2012 Oregon Material Recovery and Waste Generation Rates Report (November 2013), and plastics disposal data are estimated based on Oregon’s 2009/2010 Waste Composition Study and the 2012 Material Recovery and Waste Generation Rates Report. Generation figures are the sum of recycling and disposal, and the recycling rate is the portion of total generation that was recycled, by material and for the sum of these plastics categories.
2 Definitions for these terms come from Material Recovery Survey, “Attachment A: Recovered Materials
Definitions,” www.deq.state.or.us/lq/pubs/docs/sw/MRAttachmentA.pdf and personal communication with Peter Spendelow, DEQ, May 1, 2014 for other plastic:
Rigid plastic containers: Any container or package made predominantly of plastic resin that has a relatively inflexible finite shape or form with a minimum capacity of 8 ounces and a maximum of 5 gallons and that is capable of maintaining its shape while holding other products. Also includes most plastic plant pots, except for decorative pots, which are included in the “other plastic” category. Excludes film plastic and plastic products such as toys (which are included in the “other plastic” category).
Plastic film: Flexible plastic film, bags, sheeting, tarps, shrink wrap, strapping, and plastic baling twine. Other plastic: Any other plastic not meeting the definition of rigid plastic container or plastic film. Includes
all rigid plastic items that are products rather than packaging and rigid plastic packaging that does not contain at least 8 ounces; includes plastic products, plastic totes and pallets, and polystyrene “peanuts.” (Also referred to as “Plastic other.”)
Composite plastic: Composite plastic and foam—carpet pad, packing materials, and furniture foam.

OREGON PLASTICS RECYCLING ASSESSMENT
11
Table 6. Estimated Plastics Recycling, Disposal, Generation, and Recycling Rates in Oregon (2012)
Plastics Type Recycling
(tons) Disposal
(tons) Generation
(tons) Recycling Rate
(percent)
Rigid plastic containers 29,541 35,554 65,095 45%
Plastic film 14,869 83,225 98,094 15%
Other plastic 10,922 119,405 130,327 8%
Plastics subtotal1 55,332 238,184 293,516 19%
1 These figures exclude the “composite plastic” category, which consists largely of foam materials—including carpet pad, packing materials, and furniture foam—that are not readily recyclable.
Figure 3. Plastics Recycling in Oregon, by Material Type, 2007–2012
Table 7. Plastics Recycling in Oregon, by Material Type, 2007–2012
Plastics Type 2007 2008 2009 2010 2011 2012 Increase
(2007-2012)
Plastic Film 9,625 10,739 11,327 12,839 11,747 14,869 54%
Plastic Other 9,500 9,302 9,299 9,019 10,167 10,922 15%
Rigid Plastic Containers 21,990 19,790 23,377 28,599 30,100 29,541 34%
Total 41,116 39,831 44,004 50,456 52,014 55,332 35%

OREGON PLASTICS RECYCLING ASSESSMENT
12
Figure 4. Plastics Recycling and Disposal by Material Type (2012)
Figure 5. Plastics Recycling and Disposal Tonnages, with Material Recycling Rates (2012)
Disposal Estimates by Waste Stream
Table 8 provides more detailed estimates on the types of plastics contained in Oregon’s disposed waste stream based on source, including single-family, multifamily, commercial as well as some collection streams, drop boxes and self-haul. These source designations were determined from waste collection profiles, U.S. Census data for Oregon, and information from other statewide studies. This adapted composition by source was applied to disposal figures from 2012 to create Table 8. Oregon’s material definitions can be found in Appendix A.

OREGON PLASTICS RECYCLING ASSESSMENT
13
Table 8. Estimated Statewide Plastics Disposal Composition and Tonnage by Waste Stream (2012)
Sources: DEQ, 2012 Material Recovery and Waste Generation Rates Report, November 2013 DEQ, Oregon 2009/2010 Waste Composition Study: Excel results files U.S. Census Bureau, 2008-2012 American Community Survey 5-Year Estimates, 2012
Detailed Disposal Estimates by Plastic Type
Vermont Waste Characterization Study
Vermont (2013) conducted a waste characterization study with more detailed subtypes of plastics. This study was used as a basis to estimate the types of plastics in Oregon’s waste stream in more detail. To take into account different disposal profiles, the Vermont study was scaled to Oregon’s plastics disposal composition using several material groupings. For example, the grouping of “Bottle Bill bottles” included two plastic categories from the Oregon list (bottle bill plastics and plastic deposit water) and seven plastics categories on the Vermont list, including #1 PET, #7 HDPE, and #3–#7 beverage bottles. The Vermont study was used to determine the material composition of these multiple groupings, which was then applied to Oregon’s corresponding annual tons of disposal. This methodology was applied individually to the plastics produced by Single-family, Multifamily, and Commercial sources.
The Vermont study includes two composition lists: Residential and ICI (Industrial, Commercial, and Institutional). The Vermont Residential composition was referenced for the Oregon Residential streams, and the Vermont ICI data was used for the Commercial stream.
Definitions for Vermont and Oregon plastics categories are found at the end of this document in Appendix A.
Table 9 shows estimated residential and commercial plastics disposal composition in Oregon (2012) for Vermont’s extended list of plastics types.
OVERALL Residential Single-Fam. Residential Multifam. Commercial Drop Box Self-haul Special Purpose MRF Residual % Total
Disposal Tons
% Total
Disposal Tons
% Total
Disposal Tons
% Total
Disposal Tons
% Total
Disposal Tons
% Total
Disposal Tons
% Total
Disposal Tons
% Total
Disposal Tons
TOTAL DISPOSAL TONS 2,422,883 513,005 179,986 744,085 226,245 519,877 65,508 174,177
TOTAL PLASTIC 9.83% 238,184 10.07% 51,659 10.20% 18,351 11.57% 86,082 10.04% 22,723 7.26% 37,738 7.35% 4,814 9.65% 16,817
Plastic Packaging 4.50% 109,093 5.69% 29,175 5.55% 9,992 5.91% 43,993 3.44% 7,776 1.97% 10,228 3.79% 2,483 3.13% 5,447
Rigid Plastic Containers (RPCs) 1.47% 35,554 2.04% 10,466 2.09% 3,759 1.98% 14,704 1.07% 2,425 0.55% 2,838 0.83% 547 0.47% 817
Deposit plastic bottles 0.05% 1,171 0.05% 245 0.07% 132 0.08% 605 0.03% 61 0.02% 100 0.00% 1 0.02% 27
Plastic deposit water 0.06% 1,532 0.08% 405 0.09% 157 0.10% 743 0.05% 108 0.02% 86 0.00% 2 0.02% 31
No-deposit plastic beverage bots. 0.23% 5,510 0.28% 1,450 0.31% 549 0.31% 2,317 0.32% 732 0.07% 380 0.01% 9 0.04% 74
Other plastic bottles 0.37% 9,078 0.63% 3,247 0.59% 1,067 0.47% 3,516 0.11% 239 0.17% 886 0.01% 4 0.07% 120
Plastic tubs, curb-OK 8oz to 5gal 0.34% 8,127 0.32% 1,631 0.38% 686 0.44% 3,270 0.34% 763 0.16% 848 0.74% 486 0.25% 443
Other RPCs - tubs, trays, etc. 0.42% 10,136 0.68% 3,487 0.65% 1,167 0.57% 4,253 0.23% 523 0.10% 539 0.07% 45 0.07% 122
Other plastic packaging 3.04% 73,539 3.65% 18,709 3.46% 6,233 3.94% 29,289 2.37% 5,351 1.42% 7,390 2.96% 1,936 2.66% 4,630
Other rigid plastic packaging 0.80% 19,458 1.16% 5,940 0.99% 1,787 0.96% 7,133 0.49% 1,116 0.39% 2,033 0.07% 44 0.81% 1,406
Plastic bev. bots. <8oz or >5 gal 0.00% 93 0.01% 29 0.01% 14 0.00% 35 0.00% 3 0.00% 7 0.00% - 0.00% 6
Small tubs 6+oz but <8oz 0.03% 634 0.05% 252 0.04% 77 0.03% 239 0.02% 36 0.00% 24 0.00% 0 0.00% 6
Other rigid plastic packaging 0.77% 18,731 1.10% 5,660 0.94% 1,696 0.92% 6,859 0.48% 1,076 0.38% 2,001 0.07% 44 0.80% 1,394
Plastic film packaging - estimated 2.23% 54,080 2.49% 12,769 2.47% 4,446 2.98% 22,156 1.87% 4,235 1.03% 5,358 2.89% 1,892 1.85% 3,224
Plastic Products 5.33% 129,091 4.38% 22,484 4.64% 8,360 5.66% 42,090 6.61% 14,947 5.29% 27,510 3.56% 2,331 6.53% 11,369
Rigid plastic products 4.13% 99,947 3.04% 15,610 3.31% 5,965 4.05% 30,151 5.60% 12,663 4.74% 24,620 2.00% 1,309 5.53% 9,629
Other rigid plastic products 3.24% 78,558 2.21% 11,339 2.45% 4,410 3.21% 23,910 3.79% 8,573 4.09% 21,246 1.82% 1,189 4.53% 7,889
Mixed plastic / materials 0.88% 21,389 0.83% 4,270 0.86% 1,555 0.84% 6,241 1.81% 4,090 0.65% 3,374 0.18% 120 1.00% 1,740
Plastic film products - estimated 1.20% 29,145 1.34% 6,875 1.33% 2,395 1.60% 11,938 1.01% 2,284 0.56% 2,891 1.56% 1,022 1.00% 1,741
Plastic film - combined 3.43% 83,225 3.83% 19,644 3.80% 6,841 4.58% 34,094 2.88% 6,519 1.59% 8,248 4.45% 2,913 2.85% 4,965
Plastic film - recyclable 1.05% 25,482 0.56% 2,895 0.66% 1,194 1.25% 9,333 1.40% 3,163 0.76% 3,965 4.19% 2,747 1.25% 2,184
Plastic film - non-recyclable 2.38% 57,743 3.26% 16,749 3.14% 5,647 3.33% 24,761 1.48% 3,356 0.82% 4,283 0.25% 167 1.60% 2,781
Plastic beverage pouches 0.00% 105 0.01% 38 0.01% 11 0.01% 47 0.00% 5 0.00% 4 0.00% - 0.00% 1
Plastic film - other nonrecyclable 2.38% 57,637 3.26% 16,711 3.13% 5,636 3.32% 24,714 1.48% 3,350 0.82% 4,279 0.25% 167 1.60% 2,780
All recyclable plastic (recy film+curbside) 2.13% 51,629 1.98% 10,153 2.15% 3,877 2.70% 20,058 2.26% 5,105 1.21% 6,295 4.96% 3,249 1.66% 2,892
Plastic acceptable at the curb 1.08% 26,146 1.41% 7,259 1.49% 2,683 1.44% 10,725 0.86% 1,941 0.45% 2,330 0.77% 502 0.41% 707
All curbside plastic bottles 0.72% 17,385 1.05% 5,376 1.07% 1,919 0.97% 7,216 0.50% 1,142 0.28% 1,458 0.02% 16 0.15% 258
Plastic beverage containers 0.35% 8,412 0.42% 2,167 0.48% 863 0.50% 3,747 0.40% 909 0.11% 577 0.02% 12 0.08% 138
All curbside plastic tubs 0.36% 8,761 0.37% 1,882 0.42% 764 0.47% 3,509 0.35% 799 0.17% 872 0.74% 486 0.26% 450

OREGON PLASTICS RECYCLING ASSESSMENT
14
Table 9. Estimated Residential and Commercial Plastics Disposal Composition and Tonnages for Oregon with Extended Material List
Sources: DEQ, 2012 Material Recovery and Waste Generation Rates Report, November 2013 DEQ, Oregon 2009/2010 Waste Composition Study: Excel results files State of Vermont, Department of Environmental Conservation, State of Vermont Waste Composition Study, May 2013. Oregon estimates are based on Vermont waste composition study relative percentages.
Residential Single-Family Residential Multifamily Commercial %TotDisp %Plastics Tons %TotDisp %Plastics Tons %TotDisp %Plastics Tons
Total Stream Disposal 513,005 179,986 744,085
1a #1 PET Bottles EBB 0.1% 0.8% 388 0.1% 0.9% 173 0.1% 1.2% 1,031
1b #1 PET Bottles BB 0.0% 0.1% 57 0.0% 0.1% 25 0.0% 0.2% 198
1c #1 PET Bottles PLA 0.0% 0.0% - 0.0% 0.0% - 0.0% 0.0% -
2 #1PET Food and Dairy Bottles and Jars 0.3% 3.1% 1,597 0.3% 3.0% 551 0.2% 1.5% 1,334
3a #2 HDPE Beverage Bottles EBB 0.0% 0.1% 68 0.0% 0.2% 30 0.0% 0.0% 40
3b #2 HDPE Beverage Bottles BB 0.0% 0.0% - 0.0% 0.0% - 0.0% 0.0% -
4 HDPE Food and Dairy and Detergent 0.5% 5.4% 2,796 0.5% 5.3% 964 0.5% 4.5% 3,868
5a # 3 - 7 Bottles EBB 0.0% 0.2% 125 0.0% 0.3% 56 0.0% 0.1% 79
5b # 3 - 7 Bottles BB 0.0% 0.0% 11 0.0% 0.0% 5 0.0% 0.0% -
5c # 3 - 7 Bottles Non 0.0% 0.4% 200 0.0% 0.4% 69 0.1% 0.6% 533
5d # 3 - 7 Bottles PP 0.0% 0.3% 133 0.0% 0.3% 46 0.0% 0.2% 133
6a Plastic Cups PET 0.0% 0.2% 129 0.0% 0.2% 39 0.0% 0.4% 327
6b Plastic Cups PP 0.2% 1.5% 772 0.1% 1.3% 231 0.2% 1.5% 1,307
6c Plastic Cups PS 0.1% 1.4% 705 0.1% 1.4% 263 0.0% 0.4% 325
6d Plastic Cups Keurig 0.1% 1.3% 672 0.2% 1.5% 273 0.1% 0.6% 526
6e Plastic Cups Other 0.0% 0.4% 217 0.0% 0.4% 81 0.0% 0.4% 325
7a Tubs and Lids PE 0.0% 0.2% 90 0.0% 0.2% 36 0.0% 0.4% 351
7b Tubs and Lids PP 0.2% 1.9% 986 0.2% 2.2% 400 0.3% 2.6% 2,281
7c Tubs and Lids PS 0.1% 1.1% 543 0.1% 1.1% 203 0.0% 0.3% 244
7d Tubs and Lids PLA 0.0% 0.0% - 0.0% 0.0% - 0.0% 0.0% -
7e Tubs and Lids Other 0.1% 0.8% 434 0.1% 0.9% 162 0.1% 0.5% 407
8a Bulky Rigid >1 Gallons PE 0.1% 1.2% 597 0.1% 1.2% 223 0.0% 0.3% 244
8b Bulky Rigid >1 Gallons PP 0.0% 0.0% - 0.0% 0.0% - 0.1% 0.5% 407
8c Bulky Rigid >1 Gallons Other 0.6% 6.0% 3,092 0.6% 6.3% 1,155 0.8% 7.0% 6,019
8d Bulky Rigid >1 Gallons PE Buckets 0.2% 1.7% 868 0.2% 1.8% 324 0.0% 0.1% 81
9a Thermoforms PET 0.4% 3.7% 1,929 0.3% 3.2% 578 0.3% 2.7% 2,286
9b Thermoforms PS 0.2% 1.7% 900 0.1% 1.5% 270 0.1% 1.1% 980
9c Thermoforms PVC 0.0% 0.0% - 0.0% 0.0% - 0.0% 0.0% -
9d Thermoforms PP 0.2% 2.2% 1,158 0.2% 1.9% 347 0.1% 0.8% 653
9e Thermoforms PLA 0.0% 0.0% - 0.0% 0.0% - 0.0% 0.0% -
9f Thermoforms Other 0.2% 1.5% 772 0.1% 1.3% 231 0.2% 1.5% 1,307
10 Film, Retail Bags 0.5% 4.6% 2,399 0.5% 4.6% 835 0.2% 1.6% 1,417
11 Film, Other Bags 0.9% 9.1% 4,707 0.9% 8.9% 1,639 0.6% 5.3% 4,551
12 Film, Wrap 0.6% 5.7% 2,942 0.6% 5.6% 1,025 2.3% 19.8% 17,084
13 Film, Garbage 1.3% 13.0% 6,699 1.3% 12.7% 2,333 1.2% 10.1% 8,654
14a Film, Other 0.5% 5.3% 2,716 0.5% 5.2% 946 0.3% 2.6% 2,238
14b Film, Other Metalized 0.1% 0.6% 326 0.1% 0.7% 122 0.1% 0.5% 407
15a Ag Pots PE 0.0% 0.0% - 0.0% 0.0% - 0.0% 0.0% -
15b Ag Pots PP 0.0% 0.3% 134 0.0% 0.3% 55 0.0% 0.4% 351
15c Ag Pots PS 0.0% 0.0% - 0.0% 0.0% - 0.0% 0.1% 81
15d Ag Pots Other 0.0% 0.1% 54 0.0% 0.1% 20 0.0% 0.2% 163
16a Pouches EBB 0.0% 0.4% 181 0.0% 0.3% 63 0.0% 0.1% 75
16b Pouches BB 0.0% 0.0% - 0.0% 0.0% - 0.0% 0.0% -
16c Pouches Other 0.0% 0.0% - 0.0% 0.0% - 0.0% 0.1% 75
17a Other Plastic Blister 0.1% 0.5% 271 0.1% 0.6% 101 0.0% 0.3% 244
17b Other Plastic All Other 2.3% 23% 11,990 2.5% 24% 4,478 3.4% 30% 25,457
Plastics Totals 10% 100% 51,659 10% 100% 18,351 12% 100% 86,082
Materials representing 1-2% of plastics in collection stream
Materials representing more than 2% of plastics in collection stream

OREGON PLASTICS RECYCLING ASSESSMENT
15
The Vermont ICI composition, U.S. Census information, California commercial disposal data, and Oregon waste composition study were used to estimate plastics disposal for 16 business sectors representing commercial activities in state of Oregon. Government facilities were not included. These disposal figures include Oregon’s commercial, drop box, self-haul, and special purpose streams, which include waste from businesses. Estimates are based on tons of disposal per employee per year and were scaled to fit Oregon’s total disposed ICI waste. Table 10 shows the estimates, with the top ten plastic materials in each sector highlighted. Figures were rounded to the nearest thousand tons (nearest hundred tons for the Agriculture/Fisheries/ Forestry/Mining sector).
Table 10. Estimated Plastics Disposal by Commercial Sector
Sources: DEQ, 2011, Oregon Material Recovery and Waste Generation Rates Report, October 2012. 2009 Oregon Solid Waste Characterization and Composition Data, 2009. State of Vermont Waste Composition Study, May 2013. CalRecycle (California Integrated Waste Management Board), 2006, Targeted Statewide Waste Characterization Study: Waste Disposal and Diversion Findings for Selected Industry Groups; 1999, Statewide Waste Characterization Study. City of Los Angeles Bureau of Sanitation, 2001, Solid Resources Citywide Recycling Division, Characterization of Municipal Solid Waste for the City of Los Angeles. U.S. Census Bureau, 2012 County Business Patterns; 2008-2012 American Community Survey 5-Year Estimates; U.S. Bureau of Labor, Occupational Employment Statistics, 2013. Oregon estimates are based on Vermont 2013 and California 2006 study values.
Accommodation Manufacturing Medical ServicesOther Misc.
ServicesRecreation/Venues Wholesale Trade Construction
Plastics Types %Plastics Tons %Plastics Tons %Plastics Tons %Plastics Tons %Plastics Tons %Plastics Tons %Plastics Tons %Plastics Tons %Plastics Tons %Plastics Tons %Plastics Tons %Plastics Tons %Plastics Tons %Plastics Tons %Plastics Tons %Plastics Tons
Estimated Disposal by Sector (rounded) 6,000 23,000 40,000 74,000 41,000 11,000 152,000 173,000 106,000 152,000 59,000 220,000 178,000 78,000 82,000 160,000
1a #1 PET Bottles EBB 0.4% 3 4.2% 94 10.3% 418 1.2% 82 4.6% 173 0.7% 23 2.2% 515 1.9% 366 3.0% 323 2.6% 356 7.7% 676 2.1% 433 1.8% 387 2.2% 110 1.1% 115 2.1% 170
1b #1 PET Bottles BB 0.1% 1 0.8% 18 2.0% 80 0.2% 16 0.9% 33 0.1% 4 0.4% 99 0.4% 70 0.6% 62 0.5% 69 1.5% 130 0.4% 83 0.3% 75 0.4% 21 0.2% 22 0.4% 33
1c #1 PET Bottles PLA 0.0% - 0.0% - 0.0% - 0.0% - 0.0% - 0.0% - 0.0% - 0.0% - 0.0% - 0.0% - 0.0% - 0.0% - 0.0% - 0.0% - 0.0% - 0.0% -
2 #1PET Food and Dairy Bottles and Jars 0.2% 1 1.6% 36 4.0% 161 0.4% 31 1.8% 67 0.3% 9 0.9% 198 0.7% 141 1.2% 124 1.0% 137 3.0% 260 0.8% 166 0.7% 149 0.9% 42 0.4% 44 0.8% 65
3a #2 HDPE Beverage Bottles EBB 0.1% 0 0.1% 2 0.0% 2 0.2% 11 0.2% 8 0.0% 0 0.2% 40 0.2% 30 0.4% 43 0.2% 29 0.1% 4 0.2% 48 0.2% 35 0.3% 15 0.1% 14 0.5% 40
3b #2 HDPE Beverage Bottles BB 0.0% - 0.0% - 0.0% - 0.0% - 0.0% - 0.0% - 0.0% - 0.0% - 0.0% - 0.0% - 0.0% - 0.0% - 0.0% - 0.0% - 0.0% - 0.0% -
4 HDPE Food and Dairy and Detergent 1.8% 13 2.6% 58 1.2% 48 4.5% 319 6.4% 241 0.2% 6 5.0% 1,149 4.6% 875 11.6% 1,247 6.0% 832 1.5% 129 6.7% 1,386 4.7% 1,001 8.6% 426 3.7% 398 14.2% 1,161
5a # 3 - 7 Bottles EBB 1.1% 8 0.2% 5 0.1% 3 0.0% 3 0.1% 3 0.0% 1 0.0% 6 0.2% 39 0.1% 8 0.1% 11 0.2% 14 0.1% 12 0.0% 11 0.2% 10 0.0% 2 0.1% 5
5b # 3 - 7 Bottles BB 0.0% - 0.0% - 0.0% - 0.0% - 0.0% - 0.0% - 0.0% - 0.0% - 0.0% - 0.0% - 0.0% - 0.0% - 0.0% - 0.0% - 0.0% - 0.0% -
5c # 3 - 7 Bottles Non 2.1% 16 0.4% 9 0.2% 6 0.1% 6 0.2% 6 0.0% 1 0.1% 12 0.4% 79 0.1% 16 0.2% 21 0.3% 28 0.1% 25 0.1% 21 0.4% 20 0.0% 4 0.1% 9
5d # 3 - 7 Bottles PP 0.5% 4 0.1% 2 0.0% 2 0.0% 2 0.0% 2 0.0% 0 0.0% 3 0.1% 20 0.0% 4 0.0% 5 0.1% 7 0.0% 6 0.0% 5 0.1% 5 0.0% 1 0.0% 2
6a Plastic Cups PET 0.0% 0 0.2% 4 0.4% 16 0.0% 3 0.2% 7 0.0% 1 0.1% 20 0.1% 14 0.1% 12 0.1% 14 0.3% 26 0.1% 17 0.1% 15 0.1% 4 0.0% 4 0.1% 7
6b Plastic Cups PP 2.1% 16 0.4% 9 0.2% 6 0.1% 6 0.2% 6 0.0% 1 0.1% 12 0.4% 79 0.1% 16 0.2% 21 0.3% 28 0.1% 25 0.1% 21 0.4% 20 0.0% 4 0.1% 9
6c Plastic Cups PS 2.1% 16 0.4% 9 0.2% 6 0.1% 6 0.2% 6 0.0% 1 0.1% 12 0.4% 79 0.1% 16 0.2% 21 0.3% 28 0.1% 25 0.1% 21 0.4% 20 0.0% 4 0.1% 9
6d Plastic Cups Keurig 1.6% 12 0.3% 7 0.1% 5 0.1% 5 0.1% 5 0.0% 1 0.0% 9 0.3% 59 0.1% 12 0.1% 16 0.2% 21 0.1% 19 0.1% 16 0.3% 15 0.0% 3 0.1% 7
6e Plastic Cups Other 2.1% 16 0.4% 9 0.2% 6 0.1% 6 0.2% 6 0.0% 1 0.1% 12 0.4% 79 0.1% 16 0.2% 21 0.3% 28 0.1% 25 0.1% 21 0.4% 20 0.0% 4 0.1% 9
7a Tubs and Lids PE 0.1% 1 0.2% 4 0.1% 3 0.3% 22 0.4% 17 0.0% 0 0.3% 79 0.3% 60 0.8% 86 0.4% 57 0.1% 9 0.5% 96 0.3% 69 0.6% 29 0.3% 27 1.0% 80
7b Tubs and Lids PP 6.9% 52 1.3% 29 0.5% 21 0.3% 20 0.5% 20 0.1% 4 0.2% 39 1.3% 256 0.5% 51 0.5% 69 1.0% 90 0.4% 80 0.3% 68 1.3% 65 0.1% 14 0.4% 31
7c Tubs and Lids PS 1.6% 12 0.3% 7 0.1% 5 0.1% 5 0.1% 5 0.0% 1 0.0% 9 0.3% 59 0.1% 12 0.1% 16 0.2% 21 0.1% 19 0.1% 16 0.3% 15 0.0% 3 0.1% 7
7d Tubs and Lids PLA 0.0% - 0.0% - 0.0% - 0.0% - 0.0% - 0.0% - 0.0% - 0.0% - 0.0% - 0.0% - 0.0% - 0.0% - 0.0% - 0.0% - 0.0% - 0.0% -
7e Tubs and Lids Other 2.6% 20 0.5% 11 0.2% 8 0.1% 8 0.2% 8 0.1% 2 0.1% 15 0.5% 99 0.2% 19 0.2% 27 0.4% 35 0.1% 31 0.1% 26 0.5% 25 0.0% 5 0.1% 12
8a Bulky Rigid >1 Gallons PE 0.2% 1 0.3% 6 0.1% 5 0.5% 33 0.7% 25 0.0% 1 0.5% 119 0.5% 91 1.2% 129 0.6% 86 0.2% 13 0.7% 143 0.5% 104 0.9% 44 0.4% 41 1.5% 120
8b Bulky Rigid >1 Gallons PP 2.6% 20 0.5% 11 0.2% 8 0.1% 8 0.2% 8 0.1% 2 0.1% 15 0.5% 99 0.2% 19 0.2% 27 0.4% 35 0.1% 31 0.1% 26 0.5% 25 0.0% 5 0.1% 12
8c Bulky Rigid >1 Gallons Other 39.1% 294 7.5% 168 3.0% 119 1.6% 113 3.1% 116 0.8% 25 1.0% 220 7.6% 1,458 2.7% 288 2.8% 395 5.8% 512 2.2% 457 1.8% 389 7.5% 370 0.7% 78 2.1% 174
8d Bulky Rigid >1 Gallons PE Buckets 0.1% 0 0.1% 2 0.0% 2 0.2% 11 0.2% 8 0.0% 0 0.2% 40 0.2% 30 0.4% 43 0.2% 29 0.1% 4 0.2% 48 0.2% 35 0.3% 15 0.1% 14 0.5% 40
9a Thermoforms PET 0.1% 1 1.1% 25 2.8% 112 0.3% 22 1.2% 47 0.2% 6 0.6% 139 0.5% 98 0.8% 87 0.7% 96 2.1% 182 0.6% 116 0.5% 104 0.6% 30 0.3% 31 0.6% 46
9b Thermoforms PS 1.6% 12 0.3% 7 0.1% 5 0.1% 5 0.1% 5 0.0% 1 0.0% 9 0.3% 59 0.1% 12 0.1% 16 0.2% 21 0.1% 19 0.1% 16 0.3% 15 0.0% 3 0.1% 7
9c Thermoforms PVC 0.0% - 0.0% - 0.0% - 0.0% - 0.0% - 0.0% - 0.0% - 0.0% - 0.0% - 0.0% - 0.0% - 0.0% - 0.0% - 0.0% - 0.0% - 0.0% -
9d Thermoforms PP 1.1% 8 0.2% 5 0.1% 3 0.0% 3 0.1% 3 0.0% 1 0.0% 6 0.2% 39 0.1% 8 0.1% 11 0.2% 14 0.1% 12 0.0% 11 0.2% 10 0.0% 2 0.1% 5
9e Thermoforms PLA 0.0% - 0.0% - 0.0% - 0.0% - 0.0% - 0.0% - 0.0% - 0.0% - 0.0% - 0.0% - 0.0% - 0.0% - 0.0% - 0.0% - 0.0% - 0.0% -
9f Thermoforms Other 2.1% 16 0.4% 9 0.2% 6 0.1% 6 0.2% 6 0.0% 1 0.1% 12 0.4% 79 0.1% 16 0.2% 21 0.3% 28 0.1% 25 0.1% 21 0.4% 20 0.0% 4 0.1% 9
10 Film, Retail Bags 0.5% 4 1.7% 38 1.9% 78 2.4% 172 1.6% 60 0.3% 9 1.7% 393 1.6% 316 1.9% 203 1.9% 271 1.7% 150 2.3% 476 1.5% 323 1.9% 93 2.0% 218 1.2% 99
11 Film, Other Bags 1.6% 12 5.4% 121 6.2% 250 7.8% 554 5.2% 194 0.9% 28 5.5% 1,262 5.3% 1,013 6.1% 652 6.3% 871 5.5% 481 7.4% 1,529 4.9% 1,038 6.0% 299 6.6% 699 3.9% 317
12 Film, Wrap 5.9% 44 20.4% 454 23.2% 937 29.4% 2,078 19.4% 729 3.3% 105 20.6% 4,737 19.9% 3,804 22.8% 2,447 23.5% 3,271 20.6% 1,804 27.6% 5,740 18.3% 3,895 22.6% 1,122 24.6% 2,625 14.6% 1,191
13 Film, Garbage 3.0% 22 10.3% 230 11.7% 475 14.9% 1,053 9.8% 369 1.7% 53 10.4% 2,399 10.1% 1,927 11.5% 1,239 11.9% 1,657 10.4% 914 14.0% 2,908 9.3% 1,973 11.5% 569 12.5% 1,330 7.4% 603
14a Film, Other 0.8% 6 2.7% 60 3.0% 123 3.9% 272 2.5% 95 0.4% 14 2.7% 621 2.6% 498 3.0% 321 3.1% 429 2.7% 236 3.6% 752 2.4% 510 3.0% 147 3.2% 344 1.9% 156
14b Film, Other Metalized 0.1% 1 0.4% 10 0.5% 20 0.6% 45 0.4% 16 0.1% 2 0.4% 103 0.4% 83 0.5% 53 0.5% 71 0.4% 39 0.6% 125 0.4% 85 0.5% 25 0.5% 57 0.3% 26
15a Ag Pots PE 0.0% - 0.0% - 0.0% - 0.0% - 0.0% - 0.0% - 0.0% - 0.0% - 0.0% - 0.0% - 0.0% - 0.0% - 0.0% - 0.0% - 0.0% - 0.0% -
15b Ag Pots PP 1.1% 8 0.2% 5 0.1% 3 0.0% 3 0.1% 3 0.0% 1 0.0% 6 0.2% 39 0.1% 8 0.1% 11 0.2% 14 0.1% 12 0.0% 11 0.2% 10 0.0% 2 0.1% 5
15c Ag Pots PS 0.5% 4 0.1% 2 0.0% 2 0.0% 2 0.0% 2 0.0% 0 0.0% 3 0.1% 20 0.0% 4 0.0% 5 0.1% 7 0.0% 6 0.0% 5 0.1% 5 0.0% 1 0.0% 2
15d Ag Pots Other 1.1% 8 0.2% 5 0.1% 3 0.0% 3 0.1% 3 0.0% 1 0.0% 6 0.2% 39 0.1% 8 0.1% 11 0.2% 14 0.1% 12 0.0% 11 0.2% 10 0.0% 2 0.1% 5
16a Pouches EBB 0.0% 0 0.1% 2 0.1% 4 0.1% 9 0.1% 3 0.0% 0 0.1% 21 0.1% 17 0.1% 11 0.1% 14 0.1% 8 0.1% 25 0.1% 17 0.1% 5 0.1% 11 0.1% 5
16b Pouches BB 0.0% - 0.0% - 0.0% - 0.0% - 0.0% - 0.0% - 0.0% - 0.0% - 0.0% - 0.0% - 0.0% - 0.0% - 0.0% - 0.0% - 0.0% - 0.0% -
16c Pouches Other 0.0% 0 0.1% 2 0.1% 4 0.1% 9 0.1% 3 0.0% 0 0.1% 21 0.1% 17 0.1% 11 0.1% 14 0.1% 8 0.1% 25 0.1% 17 0.1% 5 0.1% 11 0.1% 5
17a Other Plastic Blister 0.1% 1 0.3% 7 0.3% 10 0.3% 20 0.4% 14 0.9% 27 0.4% 101 0.3% 67 0.3% 30 0.3% 47 0.3% 26 0.3% 55 0.5% 102 0.2% 12 0.4% 43 0.4% 35
17b Other Plastic All Other 13% 99 34% 748 27% 1,079 30% 2,097 38% 1,433 89% 2,811 46% 10,546 36% 6,950 29% 3,096 35% 4,855 31% 2,728 28% 5,774 50% 10,650 25% 1,264 42% 4,480 44.7% 3,648
Estimated Plastics (rounded) 100% 800 100% 2,000 100% 4,000 100% 7,000 100% 4,000 100% 3,000 100% 23,000 100% 19,000 100% 11,000 100% 14,000 100% 9,000 100% 21,000 100% 21,000 100% 5,000 100% 11,000 100% 8,000
Transportation and
Warehousing
Professional
Services
Agriculture/Fisheries/
Forestry/Mining
Information/Commu-
nications/Utilities
Retail Trade
(excl. food stores)
Restaurants/
Food Services
Food/Beverage
StoresFinancial Services
Educational
Services

OREGON PLASTICS RECYCLING ASSESSMENT
16
New York City Residential Recycling and Waste Characterization Study
A recent study conducted in New York City in 2012–2013 (unpublished data, 2014) covers more than 350 categories of plastics in residential recycling and disposed waste. The application to Oregon focused on the composition of disposed materials. The New York City Department of Sanitation gave permission to use the raw data, which Cascadia Consulting Group collected, for analysis in this Oregon project. The top 20 plastic types that represent more than 85 percent of disposed residential plastics waste are shown below in Table 11.
Table 11. Detailed Plastics Subclass Estimates for Oregon—Top 20 Materials
Note: based on New York City 2014 waste composition study results.
Annual Disposal Tons 692,991
Annual Plastic Tons 70,010
ID# SubclassResin Container
Type
Resin Subsort
Category
%Total
Disposal
%Plastic
Disposal
Estimated
Tons
11 #1 PET Clear/Green Bottles -Food Plastic Bottles #1 PET Clear/ Green 0.1% 1.3% 882
39 #2 HDPE Natura l Bottles -Mi lk/Soy/Dairy Plastic Bottles #2 HDPE Natura l 0.2% 1.8% 1,227
57#2 HDPE Pigmented Bottles -Non-
Food/Non-BeveragePlastic Bottles #2 HDPE Pigmented 0.2% 1.5% 1,048
181 #1 PET Thermoforms #1 PET Thermoforms #1 PET Clear/ Green 0.5% 5.4% 3,801
188Tubs/Lids Excluding #6 Polystyrene-#5
PP Rigid
Tubs/Lids Excluding
#6 Polystyrene#5 PP Rigid 0.2% 1.6% 1,107
198Tubs/Lids Excluding #6 Polystyrene-
Unlabeled Res in
Tubs/Lids Excluding
#6 PolystyreneUnlabeled Res in 0.2% 2.2% 1,571
199#6 Rigid Polystyrene
Conta iners/Packaging
#6 Rigid Polystyrene
Conta iners/Packaging#6 PS Rigid 0.1% 1.3% 930
200 #6 EPS Conta iners/Packaging#6 EPS
Conta iners/Packaging#6 PS Expanded 0.4% 4.0% 2,820
216Other Rigid Conta iners/Packaging-
Unlabeled Res in
Other Rigid
Conta iners/PackagingUnlabeled Res in 0.3% 2.9% 2,006
217 Fi lm Plastic: Reta i l Bags and SleevesFi lm Plastic: Reta i l
Bags and Sleeves
Polyethylene Fi lm
(HD/LD/LLD)0.4% 4.4% 3,062
218 Fi lm Plastic: Garbage BagsFi lm Plastic: Garbage
Bags
Polyethylene Fi lm
(HD/LD/LLD)2.2% 21.5% 15,059
246Fi lm Plastic: Other #2/#4 Polyethylene-
Polyethylene Fi lm (HD/LD/LLD)
Fi lm Plastic: Other
#2/#4 Polyethylene
Polyethylene Fi lm
(HD/LD/LLD)0.1% 1.5% 1,027
263Fi lm Plastic: Other Non-
PE/Contaminated-Non-PE Fi lm
Fi lm Plastic: Other
Non-PE/ContaminatedNon-PE Fi lm 1.0% 10.4% 7,268
271Single Use Plates/Cups/Cutlery-#5 PP
Rigid
Single Use Plastic
Plates/Cups/Cutlery#5 PP Rigid 0.1% 1.0% 710
273Single Use Plates/Cups/Cutlery-#6 PS
Rigid
Single Use Plastic
Plates/Cups/Cutlery#6 PS Rigid 0.2% 2.1% 1,457
274Single Use Plates/Cups/Cutlery-#6 PS
Expanded
Single Use Plastic
Plates/Cups/Cutlery#6 PS Expanded 0.5% 4.7% 3,322
281Single Use Plates/Cups/Cutlery-
Unlabeled Res in
Single Use Plastic
Plates/Cups/CutleryUnlabeled Res in 0.3% 2.7% 1,858
297 Appl iances : Unlabeled Res in Appl iances : Plastic Unlabeled Res in 0.2% 2.3% 1,613
329Bulk/Rigid: Toys/Housewares-
Unlabeled Res in
Bulk/Rigid Plastic:
Toys/HousewaresUnlabeled Res in 0.5% 5.4% 3,758
361 Other Plastics -Unlabeled Res in Other Plastics Unlabeled Res in 0.9% 8.5% 5,920
Portion these plastics represent: 8.7% 86.3% 60,448
Residential Plastic Disposal

OREGON PLASTICS RECYCLING ASSESSMENT
17
Section 3. Overview of Recycling Markets
Overview of Existing Recycling Markets
This section discusses recycling markets with a focus on Oregon and including a general discussion of markets throughout the Pacific Northwest and the greater United States. Table 12 shows estimates of the amount of Oregon plastics that are collected for recycling in Oregon in the three major categories that DEQ tracks and reports.
Table 12. Plastics Recycling in Oregon (2012)
Plastics Type Recycling
(tons)
Rigid plastic containers 29,541
Plastic film 14,869
Plastic other 10,922
Total plastics recycled 55,332
These materials are sorted by MRFs, collectors of recyclable materials, and generators (especially in the case of film plastics). Then they are sent to reclaimers in the Pacific Northwest (including British Columbia and Alberta), California, Nevada, and as far away as Florida. Substantial amounts of plastics are also exported to Asia.
Oregon Markets
Oregon plastics reclaimers recycle approximately 30 million pounds per year (15,000 tons), or approximately 25 percent of Oregon plastics that currently are collected for recycling. These reclaimers have the ability to recycle far more plastics than they currently process. Oregon plastics reclaimers face challenges in sourcing large quantities of good quality recovered plastics; furthermore, because Oregon’s plastics manufacturing industry is much smaller than the national average on a per-capita basis – only approximately 40 percent – recycled plastics often must be sold to manufacturers located out of state, incurring additional transportation costs. Following is a summary of these Oregon reclaimers and the materials they process:
AgriPlas (Brooks)—Has served as contractor for the Ag Container Recycling Council for Idaho, Oregon, and Washington. Recycles many forms of agricultural plastics, including triple-rinsed agricultural pesticide containers, agricultural/industrial film, woven polypropylene seed bags, PET strapping, bale twine, drip tape, and plant pots. Resins handled are primarily polyethylene and polypropylene. Does not accept plastics that are heavily contaminated with soil or organic materials.
Denton Plastics (Portland)—Primarily recycles clean post-consumer from commercial sources material, and pre-consumer manufacturing scrap plastics, with a focus on polypropylene and polyethylene. Processes and densifies film. Also recycles bulky rigid plastics, polystyrene, and engineering resins such as acrylonitrile butadiene styrene (ABS).

OREGON PLASTICS RECYCLING ASSESSMENT
18
Northwest Polymers (Molalla)—Processes plastics from commercial and industrial businesses that have manufacturing scrap or post-use crates, bins, pipes, and the like. Also recycles polyvinyl chloride (PVC) window manufacturing scrap.
ORPET (Warren)—Primarily grinds and washes deposit PET bottles from Oregon. Supplements with small amounts of PET bottles from Oregon’s residential curbside programs.
Northwest Region Markets
Epic Plastics (Lodi, CA)—Reclaims polyethylene and polypropylene plastic bottles.
Merlin Plastics (Calgary, Alberta, Canada)—Grinds and washes PET bottles.
Merlin Plastics (Delta, British Columbia, Canada)—Reclaimer for segregated bales of HDPE bottles, LDPE, LLDPE, PP, PVC bottles, non-bottle containers (injection-grade), and clean polyethylene film.
Peninsula Plastics (Turlock, CA)—Grinds and washes PET bottles.
Trex (Fernley, NV)—Recycles polyethylene film plastics into decking materials.
Export Markets
Oregon has one container terminal in Portland for exporting plastics. The freight lines that serve this terminal are limited in the destinations they ship to, with limited services to mainland China (two ports), Korea, Japan, Central America, and through the Panama Canal to Europe. Much more flexibility for containerized cargo to a larger number of port destinations is available through container ports in Seattle and Tacoma.
Most of the mixed and contaminated plastics from Oregon is sent to export markets for further sorting and recycling. The exports include mixed residential rigid containers, such as pre-picked bales where PET and HDPE bottles have been removed and the remainder baled together. MRF film and lower grades of mixed film is also sent to export markets for recycling.
While markets for plastic bottles have been steady, mixed rigid plastics and MRF film have been more difficult to market, largely as a result of China’s Green Fence initiative to improve the quality of materials being imported into that country and develop China’s domestic recycling collection infrastructure. The change in specifications for what is allowed into China resulted in a back-up of material at handling facilities in Oregon. This material is moving, some to alternative markets in India, Malaysia, and Vietnam and some now back into China. However, material from Europe, other countries, and other U.S. states is also flowing to these same alternative markets, which lack sufficient capacity to handle all of the material. Most of the alternative Asian markets are sorting and upgrading what is shipped to them and then sending the material on to China as single-resin commodities that will pass China’s customs import requirements.
Market Specifications and Quality
Most end users of recycled plastics need the plastics to be sorted by resin and grade. Fractional-melt polyethylene suitable for profile extrusion, for example, needs to be separated from injection-grade polyethylene. The ultimate manufacturers of recycled content products normally make their products only from one or two primary resin grades. They either need upstream suppliers to sort and reclaim the plastics for them, or if they are integrated into both reclamation and product manufacturing, they

OREGON PLASTICS RECYCLING ASSESSMENT
19
typically only purchase very specific bales of sorted plastics from MRFs and/or commercial generators who have large volumes of plastics discards.
Markets dictate quality standards and specifications based on their technological and economic ability to produce a recycled resin that performs as a cost-effective alternative to other sources of resin supply. Any decision regarding collection systems or investments in markets, therefore, needs to be based on whether the system can supply recycled resin that is a cost-effective alternative to other material sources including pre-consumer manufacturing scrap and virgin plastics.
China’s Green Fence had a large impact on prices and acceptable contamination, especially for film grades and mixed plastics bales. China is taking fewer grades directly now (e.g., certain mixed resin bales and especially bales with non-plastic contaminants are not being imported), but prices for acceptable grades that can be imported into China are fairly strong now. Prices for lower-quality bales dropped as a result of the Green Fence and have rebounded somewhat, but they are not expected to return to previous levels any time soon. Given the fundamental reasons for why China implemented Green Fence, it is expected that the initiative will have a permanent stimulus to improve the quality of mixed plastics sent for export from the United States, and an ongoing diminished price for contaminated materials that require intermediate sorting in other countries before ultimately making their way into the Chinese marketplace.
Some post-consumer plastics have very limited reclamation markets, with little or no U.S. market demand. Materials that are challenged in terms of limited reclamation markets include PVC packaging, metallized film (film chip bags), multi-layer film, compostable/degradable plastics, electronics plastics with brominated flame retardants, and plastics from durable goods that are shredded to separate metals from plastics and other materials.
In summary, the primary challenges to plastics recycling markets are contaminated materials, lack of infrastructure for sorting mixed plastics in the Northwest, costs of sorting of resins, high trucking and shipping costs, verification of what suppliers are selling, and whether lower-grade plastics have sufficient value, especially compared to alternative sources of supply, to be recycled cost-effectively. Market volatility and market competition from Asian recyclers also makes it difficult to establish plastics reclamation plants in the Pacific Northwest.
Market Options for Mixed Plastics and Minor Resins
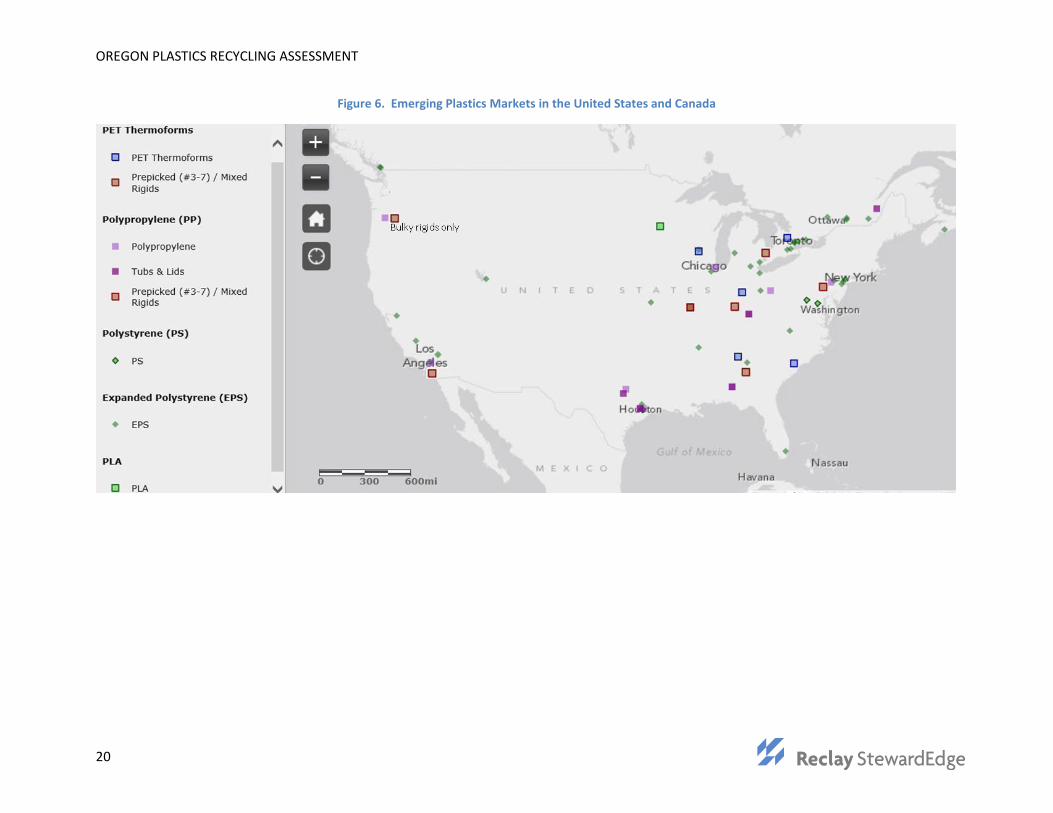
Figure 6 shows emerging domestic plastics markets for plastic materials like PET thermoforms and mixed grades of plastics. As the figure shows, virtually no markets for these grades currently exist in the Pacific Northwest.
OREGON PLASTICS RECYCLING ASSESSMENT
20
Figure 6. Emerging Plastics Markets in the United States and Canada

OREGON PLASTICS RECYCLING ASSESSMENT
21
It remains unclear when or if China’s Green Fence policy will be loosened and if higher bale prices and increased market flexibility to ship mixed materials directly to China will return. Therefore, if increasing quantities of plastics are to be diverted from disposal in Oregon to recycling markets, consideration should be given to investments within the state to sort a broader array of plastics for domestic market specifications and market value. Figure 7 below shows a matrix of market values of sorted market grades for domestic recycling markets, illustrating increases in value with higher levels of separation.
Figure 7. Sort for Value Matrix
Source: Moore Recycling Associates (2013)
As the figure shows, as more plastics sorts are performed, the market value of the collected plastics increases significantly. Market price stability and the ability to consistently ship material regardless of market conditions are also benefits. The May 2013 values per ton in the figure depict the time period when the impact of China’s Green Fence policy on recycling markets was most intense.
OREGON PLASTICS RECYCLING ASSESSMENT
22
Section 4. Overview of Recovery Options
Recovery Options
Introduction
Recovery options include processes that convert material resources into energy or chemicals, rather than return them to use as a polymer. Recovery options are less desired than recycling because they do not utilize the highest and best use of the material properties of the polymers. However, recovery options are preferred to loss of the resources through landfill disposal if those materials otherwise would not be recycled for technical or economic reasons.
The following recovery options are discussed in this section:
Pyrolysis;
Gasification;
Engineered Fuel;
Industrial Use; and
Waste-to-Energy.
The discussion of each recovery option includes a description of the technology, a summary of the market status including general U.S. description and specific opportunities in Oregon and Washington, and a summary of specifications and order of magnitude financial costs. The end of this section also includes a table that summarizes recovery market options for plastics from Oregon.
Pyrolysis
Technology Description: Pyrolysis is a high temperature (350 - 800°C) low-oxygen processes that breaks plastics down to short-chain hydrocarbons without burning them, unlike regular combustion that requires an oxygen-rich environment and converts waste to mainly carbon dioxide and water, releasing energy. Most pyrolysis systems have been developed primarily to treat otherwise non-recycled plastics waste streams, although pyrolysis can treat rubber (e.g., car tires), organic materials, and mixed municipal solid waste. Products of pyrolysis include a gaseous fraction (that may be collected and combusted with oxygen to provide heat to fuel the pyrolysis process), liquid crude-like oils, waxes, metals (if material processed contains metals), and a sludge and/or carbon char. There are a number of technology vendors who are developing competing technologies that may yield varying amounts of the product streams listed, based on differences in process conditions, use of catalysts, and feedstock accepted. The primary product marketed by plastics pyrolysis companies in North America is crude-like oils, which average 80-90 percent of system output.3 This oil is normally sent to a refinery where it is refined and blended with other refinery products.
3 “Conversion Technology: A complement To Plastic Recycling,”4R Sustainability Inc., April 2011.
OREGON PLASTICS RECYCLING ASSESSMENT
23
Market Status: At the time of this report Reclay StewardEdge was not aware of any plants in the United States that were operating on an ongoing commercial-scale basis to process plastics. The only two commercial-scale plants that had been operating continuously in the U.S. were idled in late 2013 and mid-2014, respectively. Agilyx is a pyrolysis technology developer that is headquartered in Oregon. The company operates a research and development facility in Tigard. Agilyx also developed a full-scale pyrolysis plant in Portland in partnership with Waste Management called WM Agilyx Wastech, a 40-ton per day capacity plant that was limited to processing 14,225 tons per year by permit. This plant operated for approximately sixteen months before shutting down at the end of July, 2014 for financial reasons. At the time of the plant closure, the project partners voiced a desire to replace the equipment with Agilyx’s Generation 6 System and reopen the plant. In late 2013 Plastic2Oil LLC / JBI Inc. (Niagara Falls, New York) shut down its 30-ton per day facility (estimated), which used its own technology, due to weather-related equipment damage. The equipment was repaired by the end of 2014; however, there are no plans to return the plant to ongoing commercial operations and it now serves as a demonstration plant for potential technology licensees and investors.
Agilyx also had licensed its equipment to Rational Energies, Plymouth, MN, which opened a 40-ton per day facility in 2012. The business plan for this enterprise included an agreement with Hennepin County to lease space on a demonstration basis from mid-2012 through mid-2013 at the county’s Brooklyn Park Transfer Station that included installing mixed waste processing equipment to recover metals and plastics from mixed solid waste, with non-recyclable plastics to be prepared and sent to Rational Energies’ pyrolysis plant. Rational Energies was unable to find a consistent market for its product oil offtake. As a result, the company stopped processing the materials and the equipment was sold in the spring of 2014 after less than two years of operation.
There are a number of smaller research and development/demonstration facilities that operate for small periods of time. Several other commercial-scale plastics pyrolysis facilities have been announced and are in various states of development or are seeking financing. Pyrolysis technologies should still be considered developmental; their ability to transition to the commercialized phase of technology development depends on technologies and business model improvements that will allow merchant commercial plants to be economically viable over the long run.
Specifications and Financial: Pyrolysis technologies are able to accept mixed unsorted plastic resins, including multi-layer films, metalized/coated film, and plastics with small amounts of contamination from food, dirt, and paper residues. Pyrolysis facilities, however, seek polyolefin resins and engineering grade resins as they provide the highest yield. While PET can be processed by pyrolysis, it is not desired because of the low yield of product oil. Likewise, pyrolysis of PVC and PVDC is not desired because it results in organic chlorides in the product oil or production of hydrochloric acid, which requires further treatment of the product. Pyrolysis facilities generally request that a good faith effort be made to exclude chlorinated resins; however, such materials can be handled by pyrolysis systems at normal levels found in packaging waste streams. Furthermore, governmental permits may limit the amount of PVC in the processed feedstock as is the case in Oregon. Business models for pyrolysis facilities are based on obtaining non-recycled plastics at little or no cost.4 This generally means that they will not source material from long distances because of the freight cost involved, nor will they normally pay a
4 “Conversion Technology: A complement To Plastic Recycling,”4R Sustainability Inc., April 2011.

OREGON PLASTICS RECYCLING ASSESSMENT
24
market value for plastic. It should be noted that the price of crude oil had dropped to record low prices by the end of 2014, which may have impacted the profitability of pyrolysis plants in that year.
Gasification
Technology Description: Gasification is similar to pyrolysis as it treats waste in an elevated temperature low oxygen environment to break down plastics without burning. Like pyrolysis, gasification can process either mixed municipal solid waste (MSW) or separated plastics. Gasification operates at a higher temperature range than pyrolysis, typically 800 - 1200°C, and often includes the introduction of controlled amounts of oxygen and steam so that the material fully decomposes into synthesis gas (syngas) made up of hydrogen and carbon monoxide with ash or slag byproducts. The hydrogen may be used as a renewable replacement for natural gas for heat production and electrical power generation. Syngases can also be collected and converted into methanol, ethanol, and other chemicals.
Market Status: Different technologies have been developed to handle various waste inputs for gasification, but they can be generally divided into thermal technologies and plasma arc technologies. Plasma arc uses an electric arc to heat the waste to extremely high temperatures, whereas thermal gasification technologies combust fuels to produce the heat needed in the gasification module. Like the development of pyrolysis, gasification technologies are just entering the commercialized stage of development. At the time of this report there were five plants operating in North America to gasify solid waste materials, four in the United States and one in Canada. All of the U.S. plants were demonstration-scale facilities, or were designed at a smaller scale for industrial process waste streams—three of the plants use plasma arc gasification technology. One of the five U.S. plants, the largest at 40,000 tons per year is located in Dalton, Georgia, where it gasifies post-consumer carpet (composed of a mixture of plastic resins). In Oregon, InEnTec Columbia Ridge LLC operates a plasma gasifier at the Columbia Ridge landfill, where it can gasify up to 9,125 tons per year of solid waste. The first large scale plant began operations in the spring of 2014 in Edmonton, Alberta, Canada, processing up to 110,000 tons per year of residual waste (including non-recycled plastics) that remains after mixed MSW has been processed to remove recyclable and compostable materials.
Specifications and Financial: Gasification facilities can process a wide variety of plastics (including PVC) and are often designed to process refuse derived fuel after mixed municipal solid waste has been processed to remove recyclables. One existing industrial gasification facility was specifically designed to process chlorinated compounds, such as PVC. Cost data is difficult to obtain because plants are either operated by developers as demonstration facilities or for in-house industrial waste treatment. Estimates provided by technology vendors indicate the cost to process the waste is approximately $50 per short ton,5 which depends on the cost of electricity or fuel required to run the process and amount of pre-processing of waste that is needed. Edmonton and Ottawa plants in Canada are being developed under long-term municipal contracts to process municipal solid waste, and cost data is publicly available—the Edmonton plant will charge tip fees of CAN $75 per tonne and the Ottawa plant will charge CAN $83.25 per tonne. According to the City of Edmonton, its contract terms require that any
5 “Environmental and Economic Analysis of Emerging Plastics Conversion Technologies,” RTI International, January
2012.
OREGON PLASTICS RECYCLING ASSESSMENT
25
other suppliers of material to the facility must be charged a fee higher than what the city pays, even if it were baled non-recycled plastics.
Engineered Fuel
Technology Description: Mixed plastics and organic material, such as paper, are processed to remove unsuitable materials (or selectively sourced), size-reduced to a consistent particle size, and then most commonly agglomerated or pressed into uniform pellets or cubes. The pellets are then sold as fuel for industrial boilers, power generation plants, and cement kilns where they supplement and partially replace primary solid fuels including coal, wood/biomass, and petroleum coke. In some cases the fuel is not pelletized and is sold in loose form. The use of loose unpelletized fuel is discussed in the following section on Industrial Uses.
Market Status: Reclay StewardEdge has identified seven commercial-scale facilities in operation in the United States that utilize scrap plastics and paper to manufacture solid fuel pellets (there are many more that make fuel pellets from clean wood waste). Three of these facilities process municipal solid waste to remove materials for recycling, remove and dispose of PVC, and use the remaining paper and plastics in the waste to make their pellets. The others primarily use material that has been diverted from the commercial and industrial waste stream such as paper and plastics converting waste for their pellets. Increasingly, however, pellet producers also are investigating using MRF residuals to produce a fuel pellet. Waste Management Inc. has a small pilot fuel pellet plant in San Antonio Texas and a large commercial scale facility to process MSW in Philadelphia, Pennsylvania. There are no fuel pellet facilities in the Pacific Northwest.6
Specifications and Financial: For product consistency, certificate of approval/permit limitations (for both themselves and their customers), and pollution control reasons manufacturers need to produce consistent product in terms of pellet size, moisture content, Btu value, non-combustible contaminants, and exclusion of materials that can release combustion pollutants. Fuel pellet producers do not typically accept PVC items above de minimus levels and some facilities prefer not to receive metallized film (e.g., potato chip bags). Pellet manufacturers that utilize only post-industrial or MRF scrap typically charge a small tip fee for collecting/receiving materials, whereas facilities that process MSW and produce pellets charge equivalent tip fees to disposal facilities.
Industrial Uses
Overview: There are several industries that have the potential to use film plastics in their processes. The industries discussed in this section combust solid fuels and most currently use some type of recovered materials as supplemental fuel sources, such as tire-derived fuel.7 Other industries such as
6 Portland Metro and BFI operated a pilot pellet fuel plant in the Metro area for nearly two years from late 1995
until early 1997, and the fuel pellets were consumed by an Oregon paper mill. While the operation was technically feasible, the prices of alternative energy sources such as wood chips and natural gas fell so that the fuel pellets were not cost-competitive on an unsubsidized basis. The project was discontinued and the equipment sold.
7 Materials used to make tires are closely related to those used to make plastics packaging and industries that use
tire derived fuel can be considered potential markets for plastics derived fuel. Tire-derived fuel is used extensively

OREGON PLASTICS RECYCLING ASSESSMENT
26
the steel-making industry could use recovered film plastics as a chemical reducing agent in the steel-making process. Although the largest market segment for coal is electrical power generation, it is not discussed in this section as a potential recovery market for residential film plastics (as a supplement to coal) because of the additional expense associated with fuel preparation/handling, modifications of governmental approvals, and cost of pollution control system upgrades. Because the market potential differs across each of the industries that are discussed in this section, each is discussed separately below.
Cement/Lime Kilns
Technology Description: Portland cement and lime are industrial and construction materials that are produced from minerals using high temperature kilns. These kilns require a lot of energy and are substantial contributors to greenhouse gases. Cement kilns throughout the world make significant use of renewable and waste fuel sources.
Market Status: Between 10 and 13 of the 107 cement kilns located in the United States will specifically accept non-recycled plastics. Large cement companies have developed materials sourcing divisions for supplying their cement kilns with waste-derived fuel. The Geocycle division of Holcim Cement has eleven locations, although the one nearest to Oregon is located in Trident, Montana. Similarly, Systech Environmental Corporation prepares alternative fuels for its parent, Lafarge North America Cement; however, it does not have any location on the U.S. West Coast. Ash Grove Cement in Durkee, Oregon, is the only cement plant in the state. Approximately 8 percent of its fuel comes from the combustion of scrap tires with the remainder from coal.
Specifications and Financial:
Cement kilns that combust alternative fuels, including plastics, typically charge a small tip fee, although in some cases they may pay a small positive value depending on the energy value of the material and whether the material has been pre-processed into a form that can be readily fed into the kiln, such as being shredded. Alternative fuel material normally must be shredded down to a 2-4 inch particle size so that it can be handled by fuel handling systems that are designed to feed coal. Unlike most other recovery markets, cement kilns willingly accept metallized film.
Pulp and Paper Mills
Technology Description: Pulp and paper mills use steam and hot water in the papermaking process. Energy for this heat typically comes from combusting natural gas, fuel oil, and in some cases solid fuels such as biomass.
Market Status: Reclay StewardEdge is aware of with 32 pulp and paper mills in the United States that combust tire derived fuel, which is similar to non-recycled plastics in many respects. RSE further investigated which paper mills in Oregon combust solid fuels for at least part of their heat demand,
throughout the United States and Europe in cement kilns, waste boilers at pulp and paper mills, coal-fired electricity generation plants, waste-to-energy (WtE) processes, and various industrial boiler plants. Relatively few tires in Canada go to such energy applications

OREGON PLASTICS RECYCLING ASSESSMENT
27
which could be considered potential industrial users of non-recycled plastics subject to permit modifications and testing for the need to modify emissions treatment equipment:
Collins Products (Klamath Falls)—Approved to combust wood waste.
SP Fiber Technologies (Newberg)—Approved to combust tire-derived fuel and wood waste, including construction/demolition debris with incidental plastics.
IP Masonite (Pilot Rock)—Approved to combust wood waste.
IP (Springfield)—Approved to combust wood waste.
GP (Toledo)—Approved to combust tire-derived fuel and wood waste (including construction/demolition debris with incidental plastics).
Not all paper mills have the mechanical handling and feeding systems to combust solid fuels at their mills. Also, the number of facilities that are equipped for combined heat and power are limited. Combined heat and power means that fuel is first combusted to provide heat for an industrial process, followed by using residual heat to generate electrical power. Because Oregon state policy considers wood waste and biomass combustion as renewable energy, but does not consider non-recycled plastics as renewable energy, combined heat and power mills would not be interested in combusting non-recycled plastics as long as there is sufficient wood waste and biomass available, especially given the effort that would be required to obtain government approvals to combust non-recycled plastics and the potential require to upgrade combustion and emissions equipment at the plants.
Specifications and Financial:
RSE is not familiar with paper mills that combust alternative fuels that include plastics and therefore there is not information available on price or specifications. If tire chips are considered a proxy for non-recycled plastics, due to similarity in Btu-heat content, plastics that has been prepared as a fuel into 2-4 inch shreds (so that it can be handled by fuel handling systems that are designed to feed biomass), with PVC removed, may have a value of $40 per ton or more, depending also on who pays the freight.
Steel Mills
Technology Description: The process of making iron from iron ore is a chemical one that is conducted in a basic oxygen process furnace at high temperatures. Iron ore is mostly Fe2O3, with other oxides of iron. In order to make elemental iron, a carbon source (reducing agent) must be chemically reacted with the oxygen in iron ore, reducing it to elemental Fe and giving off CO2 as a byproduct. Iron mills typically use pulverized coal or natural gas as the carbon source. This process leaves excess carbon dissolved in the metal—if this excess carbon is burned out to reduce the carbon to lower levels, it produces the material known as steel. This process of making iron or steel from iron ore is called the basic oxygen process. There are 35 such basic oxygen furnaces, all located in the Eastern United States. A second type of steel mill that does not make iron and steel from ore, but instead uses recycled scrap metal is called an electric arc furnace. There is one electric arc furnace steel mill in Oregon, Cascade Steel, located in McMinnville.
Market Status: One steel producer in Japan and two in Europe use non-recycled plastics as the carbon source instead of coal or natural gas (polyethylene plastic is 86 percent by weight carbon) in the making of iron and steel from ore. Currently, no North American mills use recovered plastics as the reducing agent. There is one company in the Eastern United States, International Recycling Group, that had

OREGON PLASTICS RECYCLING ASSESSMENT
28
hoped to change this. International Recycling Group purchased the shuttered NURRC LLC’s PET reclamation facility in Spartanburg, S.C. in the summer of 2013 with the intention of operating it as a plastics recovery facility to sort mixed plastics, recycle certain plastics such as PET, and convert “previously unmarketable plastic” into a low-cost reducing agent for blast furnaces at a fuel preparation facility it hoped to build in Northern Indiana. International Recycling Group has experienced financial difficulties and its South Carolina facility was shut down after less than one year of operation, putting the business plan for a combined plastics recovery facility/plastics reclamation/iron-reducing agent into question. International Recycling Group still hopes to develop a plastics-to-reducing agent business one day, but for now this market does not exist in North America.
Waste-to-Energy
Overview: Waste-to-energy (WTE) is the process of combusting mixed municipal solid waste to produce electricity. Although WTE plants are designed to combust MSW generated from their partner jurisdictions, plants with excess capacity may accept some non-recycled film plastics from elsewhere.
Market Status: Oregon has one WTE plant that is owned and operated by Covanta Marion Inc. The facility began commercial operations in 1986 and processes on average 550 tons of MSW each day (180,000 tons of Marion County’s MSW annually), providing the 325,000 citizens of Marion County with a disposal option while generating provides 11 megawatts per hour of electricity that is sold to Portland General Electric Company. The facility processes about 90 percent of the County’s non-recycled waste—the other 10 percent consists of construction and demolition wastes, food processing waste, and other miscellaneous non-burnable materials. Ferrous and non-ferrous metals which were not previously separated from the waste are picked out of the ash with large magnets and an eddy current machine—the facility does not pre-process waste that will be combusted, other than manually removing material that cannot be processed from the tip floor.
Specifications and Financial: Most WTE plants are financed as disposal facilities under agreement with a host jurisdiction and so have limited ability to accept waste from outside the host jurisdiction. Any facility that would have excess capacity can be expected to charge at full disposal tip fee prices to accept such waste. Because segregated plastics has a higher energy value than MSW, any facility willing to accept plastics from outside their jurisdiction would need to blend and meter the plastics in with other waste in order to avoid temperature spikes and processing inconsistencies. WTE plants are able to accept all types of plastics for disposal and energy recovery. The tip fee at this facility is $67.50 per ton
OREGON PLASTICS RECYCLING ASSESSMENT
29
Summary of Recovery Options
Table 13 summarizes the market specifications and value (or tip fee charged) for loads of plastics delivered to each type of recovery market
Table 13. Summary of Recovery Market Specifications and Material Value
Recovery Market Typical Specification Delivered
Value (per ton)
Pyrolysis May be mixed with rigid plastics. PVC must be less than 10-15%.
1 PET is not desired due to low oil yields. Most exclude
metallized film. $0
Gasification None. Separation of film from solid waste is not required. -$75 to -$85
Engineered Fuel (Pellets)
May be mixed with contaminated paper. No PVC or metallized film above incidental levels.
unknown to -$85
Industrial Uses No PVC. Specifications vary among industry types (e.g., cement kilns accept metallized film; others may accept plastics/paper mixes).
$0 to -$40
Waste-to-Energy None. Separation of film from solid waste is not required. -$67.50
Source: Reclay StewardEdge 1The threshold level for PVC is generally corresponds to the level that it is found in the residual packaging waste stream after bottles have been removed for recycling.
As Table 13 shows, there is a wide variation in specifications and delivered value. Those recovery markets that accept mixed municipal solid waste, such as energy-from-waste and gasification, have the least demanding specifications, but also have the lowest market value offered since they charge tip fees that are on par with disposal facilities. As materials move up the value chain the specifications typically get more stringent and the material value increases. It is possible for some recovery markets, specifically industrial uses and pyrolysis, to pay a small positive value for recovered plastics, under certain circumstances. This can occur when energy costs for traditional fuels are high. For engineered fuel and industrial uses, it also depends on the availability of other alternative combustible waste materials in a local area. As long as there is a surplus of these other combustible waste materials, it is likely that that tip fees will be charged rather than a positive value be paid.
Reclay StewardEdge offers the following recovery market conclusions:
There are few pyrolysis, gasification, and engineered fuel pellet facilities operating commercially in North America. There is market risk associated with such a small number of facilities, especially since the next best market may be a far distance and transportation to that market may be costly. Pyrolysis and gasification are not yet in widespread commercial use.
For all the technologies discussed, commercial economic viability is highly dependent on local conditions (e.g. transportation costs, landfill tip fees, availability of other diverted materials with energy value, and electricity cost for those conversion technologies that use large amounts of electricity).
A diversified approach with several recovery markets for non-recycled plastics should be considered if recovery is to be a key element of plastics diversion from waste in Oregon in the future.

OREGON PLASTICS RECYCLING ASSESSMENT
30
Section 5. Sorting Technologies
This report section discusses plastics sorting and processing technologies that can be employed by materials recovery facilities, plastics recovery facilities, and reprocessors for the recycling of plastics, including stage of technology development. A list of equipment vendors is included at the end of this report in the appendix.
In order to be recycled to their highest and best use, plastics need to be separated from other non-plastic materials, and then they need to be sorted into plastics grades based on resin type (e.g., polypropylene), and often processing characteristics (e.g., melt flow), and sometimes other factors such as color. Ideally, generators at the point of generation of post-consumer plastics would segregate one grade of plastics from other grades of plastics/other discards in order to avoid incurring sorting costs. However, this is only feasible for certain industrial and commercial generators, such as segregating polyethylene film by furniture stores and warehouse/distribution centers. For most generators of plastics discards, including most businesses and residences, the recyclables they generate are so diverse that recyclables are commingled for collection convenience or economies-of-scale, necessitating that recyclers separate plastics from other material types and then sort the plastics into market grades.
Non-durable plastic products and packaging are often individual plastic items, which allow sorting to be performed on the whole piece level. However, most durable plastic products are joined with other materials into composite products, and the plastics in these durable products may not be easily separable as whole pieces from other materials. Examples include plastic parts in automobiles, plastics housings for electronics, and plastic flat panel computer and television display screens. For these materials, either expensive manual dismantling is required, or the composite products can be shredded with sorting occurring on the small particle level. The discussion of sorting in this section is focused on sorting of individual whole pieces of plastics that are not part of composite products, which can be employed at the local and state level (MRFs and local recyclers).
Materials Recovery Facility Technologies
The ability of MRFs to cost-effectively employ sorting technologies to separate plastics from other recyclables and sort plastics by type depends on the size and throughput of the MRFs. Following is a description of the various sort technologies and discussion of how they may be applied.
Separation Technologies
Residential recyclables, and increasingly industrial, commercial, and institutional (ICI) recyclables, are collected commingled as mixtures of paper, plastics, glass, and metals. The first step to sorting plastics into market grades is to separate other materials out of mixed recyclables so that only plastics remain, after which the plastics are sorted into market grades. Combinations of mechanical equipment and manual sorters perform this separation.
In the United States, equipment called screens is used to assist in performing this separation, separating two-dimensional paper from three dimensional containers where at least 10 tons per
Figure 8. Screen

OREGON PLASTICS RECYCLING ASSESSMENT
31
Figure 9. Ballistic Separator
hour of recyclables are being processed. Screens are made up of a series of rotating shafts with discs or fingers mounted on them. Larger-sized flat materials are pushed up and over the top of the screen, whereas smaller sized or three dimensional materials either fall between the gaps between the shafts or roll down and off the bottom of the screens. However, plastics with a large two dimensional surface area such as lids or thermoforms often wind up sorted by screens with paper. These plastics must be removed from the paper sorting area of MRFs and conveyed to the containers sorting part of the plants if they are to be recycled instead of disposed.
Screens are not effective in separating flat two-dimensional plastics, film plastics, large plastics (over gallon size), small plastics less than 2 inches in size, or foam polystyrene. These materials either must be removed by hand before being feed into screens, must be collected separate from other mixed recyclables, or must be separated using equipment such as ballistic separators.
Ballistic separators are inclined reciprocating floor machines that walk larger-sized flat two-dimensional materials up and over the top of the unit, whereas small materials fall through holes in the floor and round three-dimensional materials roll down to the bottom of the unit. They perform the same function as screens, except that they are gentler on the recyclables fed into them and so are able to handle large plastics, film plastics, and polystyrene foam. Ballistic separators are used in Europe for sorting plastics and metals (in Europe, paper is normally collected in a separate stream). Ballistic separators are used in North America to sort MSW and construction and demolition debris. Some residential MRFs in the United States that desire to handle a more diverse-stream of recyclables are considering ballistic separators in place of the more traditional screens and at least one plastics reclaimer has installed ballistic separators to separate contamination from incoming plastic bottles at its facility.
The following subsections describe sorting technologies for plastics after other paper and other containers have been separated from the plastics using mechanical equipment and manual sorters.
Optical Sorting
Most new single-stream MRFs designed to process 20 tons per hour or more of residential recyclables have an optical sorter installed; it is common for new residential MRFs that process more than 20 tons per hour to have more than one machine. Optical sorters work by measuring the spectrum of near infrared (NIR) and/or visible light that is reflected off the surface of items they are sorting, and based on the spectrum reflected back, optical sorters can identify the surface resin and color of the plastic product. Essentially, optical sorters are composed of three components—a feed-regulating conveyor system, a lamp/camera/computer to identify the plastic material and/or color, and a separation system to separate one type of desired plastic material from mixtures of other materials. There are approximately twelve companies that offer optical sorters for sale, and optical sorters are considered to be a widely commercialized technology.
Figure 10. Optical Sorters

OREGON PLASTICS RECYCLING ASSESSMENT
32
solidwastemag.com/news/robomrf/1000213709/
Figure 11. Robotic Sorter
The standard practice up to this point in time is that one machine is used to sort out one plastic material grade from a mixed stream. If additional sorts are to be performed, either more machines in series are needed, or manual sorters downstream of the optical sorters are required. Optical sorters can be equipped with dual-eject capability so that they can positively sort two plastics materials streams out from mixed materials from one machine; however, doing so usually results in more sorting errors than is found in single eject machines (single-eject machines are 92-98 percent effective).
Optical sorters are programmable, and mixes of plastics can be recirculated in separate batches through one machine for further sub-sorts, as long as the mechanical feeding, takeaway, and sorted material storage systems have been flexibly designed with this in mind. Historically, MRF and PRF mechanical systems have not been designed with this flexibility, and only in the last year or two have sort lines begun to be retrofitted, designed, or used in this manner to allow for one optical sorter to sort more than one type of plastic, or to sort uncolored plastics from colored plastics.
Optical sorters have limitations. Unfortunately, the spectrum (chemical composition read by NIR machines) for materials and grades within one resin category is the same—therefore, blow molded HDPE bottles, injection molded LDPE lids, and LDPE film all appear to be the same material to an optical sorter (i.e., “polyethylene”), even though the materials in this example are three distinct market grades. This means that NIR optical sorters used in MRFs cannot distinguish between these materials and a NIR optical sorter would sort them all into the same category, requiring manual labor after the optical sorter to perform further grade sorts based on processing characteristics or LDPE/HDPE differences. Most NIR machines cannot identify the resin in plastics that have been pigmented black.
None of Oregon’s single-stream MRFs have optical sorters installed. Several factors have likely contributed to this situation, including:
Single-stream MRFs that were constructed a number of years ago and are due for replacement or equipment retrofits.
Several smaller sized MRFs, rather than fewer but larger MRFs that would have the economies of scale to make use of optical sorters.
The state’s bottle bill, which recovers a large percentage of PET through the deposit-return infrastructure rather than through residential curbside systems.
Reliance on export markets for collected plastics, rather than North American reclaimers that specialize in reclaiming only certain resin types and require sorted materials.
Robotic Sorters
An experimental technology that in the future may eventually assist in sorting plastics is the robotic sorter, shown in Figure 11. Bollegraaf has experimented with this technology in Germany. The design application of this technology is for quality control sorting and for production sorting in low to medium throughput applications. Units developed so far consist of an optical scanner over a conveyor belt followed by a robotic arm that picks low percentage contaminants from a conveyor and deposits them into a bin, chute, or onto another conveyor. This system cannot
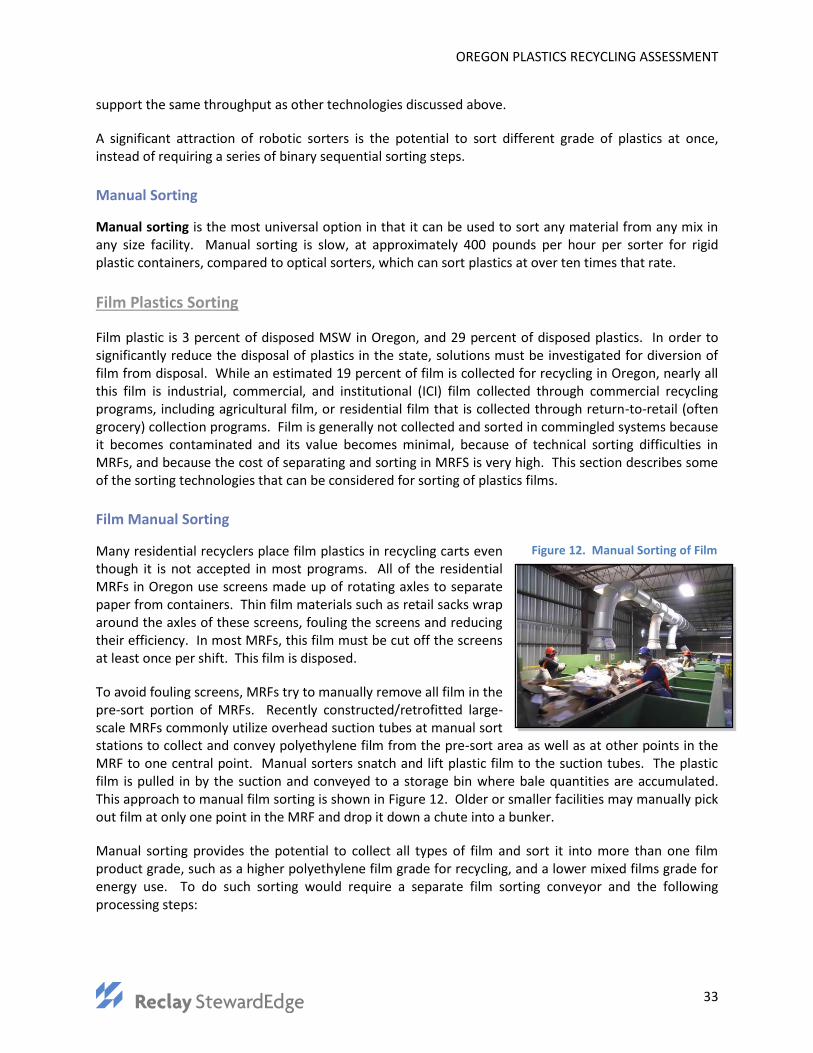
OREGON PLASTICS RECYCLING ASSESSMENT
33
Figure 12. Manual Sorting of Film
support the same throughput as other technologies discussed above.
A significant attraction of robotic sorters is the potential to sort different grade of plastics at once, instead of requiring a series of binary sequential sorting steps.
Manual Sorting
Manual sorting is the most universal option in that it can be used to sort any material from any mix in any size facility. Manual sorting is slow, at approximately 400 pounds per hour per sorter for rigid plastic containers, compared to optical sorters, which can sort plastics at over ten times that rate.
Film Plastics Sorting
Film plastic is 3 percent of disposed MSW in Oregon, and 29 percent of disposed plastics. In order to significantly reduce the disposal of plastics in the state, solutions must be investigated for diversion of film from disposal. While an estimated 19 percent of film is collected for recycling in Oregon, nearly all this film is industrial, commercial, and institutional (ICI) film collected through commercial recycling programs, including agricultural film, or residential film that is collected through return-to-retail (often grocery) collection programs. Film is generally not collected and sorted in commingled systems because it becomes contaminated and its value becomes minimal, because of technical sorting difficulties in MRFs, and because the cost of separating and sorting in MRFS is very high. This section describes some of the sorting technologies that can be considered for sorting of plastics films.
Film Manual Sorting
Many residential recyclers place film plastics in recycling carts even though it is not accepted in most programs. All of the residential MRFs in Oregon use screens made up of rotating axles to separate paper from containers. Thin film materials such as retail sacks wrap around the axles of these screens, fouling the screens and reducing their efficiency. In most MRFs, this film must be cut off the screens at least once per shift. This film is disposed.
To avoid fouling screens, MRFs try to manually remove all film in the pre-sort portion of MRFs. Recently constructed/retrofitted large-scale MRFs commonly utilize overhead suction tubes at manual sort stations to collect and convey polyethylene film from the pre-sort area as well as at other points in the MRF to one central point. Manual sorters snatch and lift plastic film to the suction tubes. The plastic film is pulled in by the suction and conveyed to a storage bin where bale quantities are accumulated. This approach to manual film sorting is shown in Figure 12. Older or smaller facilities may manually pick out film at only one point in the MRF and drop it down a chute into a bunker.
Manual sorting provides the potential to collect all types of film and sort it into more than one film product grade, such as a higher polyethylene film grade for recycling, and a lower mixed films grade for energy use. To do such sorting would require a separate film sorting conveyor and the following processing steps:

OREGON PLASTICS RECYCLING ASSESSMENT
34
Figure 13. Bollegraaf Film Grabber
Separate film from non-film materials. The best practice for manually sorting film is for all film to be “bags-in-bags”—that is, all film stuffed inside a tied-off bag.
Open bags-in-bags so each piece of film is individualized.
Positively sort out bags and film that is obviously only polyethylene into a one grade.
Leave all remaining film as a mixed resin/laminate grade.
The primary challenge of manually sorting plastic film is the amount of labor required and the resulting cost. Assuming a worker can make 50 picks per minute, one worker can sort a maximum of 3,000 individualized bags per hour. Using a conversion factor of 275,000 film pieces per ton, it would take one worker approximately 90 hours to pick one ton. Manual sorting costs can be greatly reduced if residents can be trained to package all plastic film into a tied bag. This bag can then be removed at the pre-sort and dropped down a chute to a dedicated film sorting line, on which it would be opened and clean polyethylene picked off and sent to a dedicated film baler. To show the impact on sorting cost and efficiency, if 25 same-film items are in one bag, the productivity of the same worker can be increased from sorting 3,000 individualized film items per hour to sorting 75,000 film items per hour, and can pick a ton in 3.6 hours. The degree to which film is bagged-in-bags is the single factor with the largest impact on film sorting costs in a MRF.
Film Grabber
MRF equipment suppliers offer some commercially-available mechanical equipment to assist in sorting films in MRFs. Bollegraaf offers the Film Grabber, shown in Figure 13. The Film Grabber is mounted across a conveyor of mixed recyclables and uses a rotating drum with protruding fingers to comb through the mix of recyclables and hook the film. As the drum rotates the hooked film is lifted out of the other recyclables. When the film reaches the top of the drum the fingers retract and the film is blown off to the collection bin. This technology works well for individualized plastic bags and other very thin and highly flexible materials, but it is not effective in separating bags-in-bags or thicker polyethylene films such as cereal box liners, chip bags, and laminated film plastic packaging. When this technology is used on a fiber or single-stream line this system also captures some paper that would need to be manually separated later.
Bollegraaf does not market its Film Grabber as being highly effective in separating film in a single-stream recycling operation. A consideration in placing a Film Grabber in a recycling facility is that the fingers on the grabber drum must be able to reach nearly to the conveyor belt surface to snag a majority of the film. This means that large materials such as OCC, buckets and large bottles need to be removed before the Film Grabber location, which means it would have to follow the pre-sort station and OCC screen in a single-stream facility (many facilities also add a glass screen at this point). Additionally, the Film Grabber must be placed ahead of the ONP screen (which normally immediately follows the OCC/glass screens) to avoid large volumes of plastic film wrapping around the screen shafts.
The Film Grabber is not yet in common use and has only been installed in a few facilities in North America. A dual-stream MRF in Canada with a Film Grabber installed on its container sort line is effective in capturing between 30 and 60 percent of the plastic film in the stream. A single-stream MRF

OREGON PLASTICS RECYCLING ASSESSMENT
35
Figure 14. Bollegraaf Paper Magnet
Figure 15. CP Mfg. Air Drum Separator
in Edmonton, England also uses Film Grabber technology. That MRF sorts recyclables that are collected in many programs using a film blue-bag approach rather than bins or carts (including some programs that accept packaging film). The MRF uses two Film Grabbers located at the front of the sort line just after debagging equipment. These film grabbers were installed primarily to capture the large bags that recyclables had been set out in and thus opened by the bag breakers. In that MRF film Grabbers are effective in capturing up to half of the plastic film out of the single-stream material—it is believed that much of this film is the large blue bags themselves, which would be easier for the Film Grabber to snag, than smaller sized packaging film that may have been the mixed recyclables. Labor is still required after a Film Grabber to sort the film that the Film Grabber fails to capture. Generally speaking, Film Grabbers are not effective enough to replace manual labor in U.S. MRFs, and so is not a piece of equipment used in this country.
Air Separators
MRF equipment manufacturers make equipment to separate two dimensional flexible materials from three dimensional rigid containers. This equipment is normally employed in single-stream MRFs on the container sorting line immediately after the paper screens have separated paper from containers. The equipment has been designed to capture single sheets of residual paper that has carried over into the container stream, but it also separates individual plastic film products. Bollegraaf’s technology, shown in Figure 14, is named the Paper Magnet; CP Manufacturing makes a piece of equipment called an Air Drum Separator, shown in Figure 15; and Machinex calls its equipment an Air Separator (illustration not available).
All three vendors’ equipment use suction to cause flexible materials like paper and film plastics to be sucked onto and adhere to a moving surface, which directs them down a separate chute, whereas curved rigid materials do not adhere to the surface and continue on their way for further sorting. The current configurations of the various vendors’ equipment have not been designed to accommodate the weight or dimensions of bagged film and so their effectiveness for separating bagged film is not known, nor has the effectiveness of different vendors’ equipment relative to each other for separating bagged film been evaluated.
BHS offers a front-end piece of equipment called a Nihot Windshifter that is designed to separate dense materials from less dense materials. It can be used at construction and demolition debris recycling operations to separate plastics from heavier non-plastic items.
The primary limitation of air separation equipment is that it cannot distinguish plastic film from paper nor can it separate polyethylene film from other resins or laminates. Manual sorting is also needed to separate polyethylene film from non-polyethylene/laminates.

OREGON PLASTICS RECYCLING ASSESSMENT
36
Film Optical Sorting
Optical sorters use conveyor belts moving at high speed and jets of air to sort rigid plastic containers. Film plastics have a tendency to not remain in place on a fast-moving conveyor belt and swirling jets of air at the sorting end, and thus do not lend themselves to optical sorting of thin film products, unless the equipment is adapted for film sorting. TITECH states that its optical sorters can sort a maximum throughput of 0.7 tons per hour of film per meter of optical sorter width. Pellenc in France has also worked to adapt its rigid packaging optical sorter technology to sort PE plastic film from other film resin types. This application is new and currently used on plastic film with a thickness of 2.5 mils or more. Pellenc has had to adapt its machines to use airflow to keep the film from moving as it is scanned and sorted. Since a large percentage of North American residential plastic film is only 0.5 mils thick, Pellenc believes that its technology in its current stage of development would not be very effective for sorting residential North American film.
The German film reprocessor Relux uses NIR optical sorters at its reclamation facility in Germany to sort film that MRFs have separated from other recyclables using manual sorting or other technologies. The incoming bale specification calls for the bales to have at least 92 percent film plastics and the film is to exclude aluminized plastics (chip bags). Relux begins by shredding the film into large pieces, optically sorts the pieces into PE and non-PE film, and then washes and pelletizes the PE film for sale into film and sheet markets. Multi-layer or non-PE film is sent for energy recovery. If optical sorting of film is to be employed in North America, the most logical place for it to be utilized may be at the reclamation stage rather than at the MRF stage. The project team is not aware of any film reclaimer in North America using optical sorters for film sorting.
Reprocessor Sorting Technologies
Depending on how plastic materials are collected and the products produced at the MRF or return center, some secondary sorting by either a PRF or a plastics reprocessor (reclaimer) may be required.
The MRF sorting technologies discussed above can all be used. Specifically, optical sorting is used to perform quality control checks and remove contaminants, sort by color, and remove color contaminants at the flake level after the plastics has been ground and washed, using the same general technology as whole-container optical sorting, only at a small scale level.
Additional technologies that can be employed by a reprocessor include density separation in a wash system. Washing plastics usually starts with shredding to reduce piece size, followed by washing in heated water containing detergents and wetting agents, where it is mechanically agitated through a series of chambers. The washing performs several functions including:
Removal of residual foods, oils, and salts.
Removal of dirt, dust, and glass grit the film picks up through collection and MRF processing.
Dissolution/pulping and removal of paper and potentially plastic labels if water soluble label adhesives were used.
Dissolution of water-soluble printing inks.
Density separation of those plastic materials denser than water (e.g., PET, PS, PVC, PLA) from those less dense than water (polyethylene and polypropylene).

OREGON PLASTICS RECYCLING ASSESSMENT
37
Washing is not effective in removing some adhesives and the materials attached by these adhesives. Foamed resins that otherwise would sink may float with the desired resins (e.g., polystyrene foam). Also, multi-laminate films may either sink or float depending on the relative proportions and densities of the resins used in them.
Plastics Recovery Facilities
Plastics recovery facilities (PRFs) is a concept that dates back twenty years when Oregon’s Garten Foundation received a major grant in 1994 from the plastics industry to install newly developed optical sorting equipment to sort mixed plastic bottles delivered to the facility. Due to technological advances, the equipment at the Garten Foundation became obsolete fairly rapidly. Since that time, the concept of a PRF has not become commonplace in the infrastructure for recycling plastics in the United States. In the fall of 2013 a high-technology PRF operated by Waste Management in North Carolina was shut down as the equipment became old and Waste Management chose to focus on sorting in its MRFs rather than at a centralized PRF.
Only in the past three years has interest in PRFs increased and today five companies operate facilities that can be considered to be high-tech PRFs, as opposed to low tech manual sorting of mixed plastics like is done in Asia. The locations of North American PRFs are shown in Figure 6 on page 20 of this report (depicted as the “Prepicked #3-7” facilities). The paragraphs below describe these companies and the PRFs they operate.
Description of New and Existing PRFs
QRS Recycling operates two PRFs, the first of which opened in New Albany, IN in 2011 at the site of its existing commercial single-stream (dry waste) MRF. QRS opened its second PRF in Atlanta, GA in 2012 in a leased 100,000 square foot building. These two facilities make use of advanced optical sorting technology. QRS Recycling has also entered into joint venture partnership with broker and industrial plastics recycler Canusa Hershman to open a 128,000-square-foot PRF in Sparrows Point, Maryland, which is scheduled to open in December, 2014. The facility is being designed to process 55,000 tons per year of mixed plastics, which will be sourced from MRFs throughout the Mid-Atlantic region. Except for QRS’ first facility that was located its existing MRF, QRS’ other facilities are operated as merchant stand-alone sorting centers that are not attached to some other MRF or plastics reclamation operation.
Trigon Plastics, located in Newmanstown, Pennsylvania, is the only plastics reclaimer in the United States that operates a PRF. Trigon constructed a single-stream materials recovery facility at the location of its existing plant that washes HDPE and produces plastic lumber. In addition to sorting, baling, and shipping of single-stream recyclables (including paper) from the MRF to markets, Trigon installed four optical sorters to perform advanced plastics sorting. These sorters were installed in early 2013. This MRF/PRF can sort 12,500 tons of mixed plastics per year. Polyethylene is used in-house by Trigon for its plastic lumber products.
Entropex, located in Sarnia, Ontario, is a Canadian plastics reclaimer that specializes in polyolefins (polyethylene and polypropylene). Entropex has an 180,000-square-foot reclamation plant. In 2010 Entropex received a grant between $1 and $2 million from Ontario’s extended producer responsibility program to add 30,000 tons per year of mixed rigids recycling capacity, which it calls RigidReclaim, to its existing plastics bottles recycling capacity of 20,000 tons per year, for a total recycling capacity of 50,000 tons per year. Entropex sells reclaimed resin pellets into a variety of industries.

OREGON PLASTICS RECYCLING ASSESSMENT
38
Titus Services officially opened a PRF in Los Angeles, CA, in July 2014. This facility is actually a single-stream MRF that Titus has retrofitted—Titus refers to it as a secondary MRF, since Titus’ intends to take loose unbaled residue and remainders from the ends of conveyor belts of MRFs in the Los Angeles area, and further sort the material to recover paper, metals, and up to seven plastics grades in one shift (more plastics sorting into additional grades can be performed on a second shift. Titus is encouraging MRFs to save the cost of sorting and baling pre-picked rigids, and instead allow that material to go to the residue/remainders for sorting at Titus. Titus will charge a tip fee to accept and process this stream of material. Titus will also accept and sort baled pre-picked rigids, but would pay a market value for that material, since it would need to compete against export markets. Titus’ processing equipment includes proprietary pre-processing equipment, followed by two optical sorters. Titus’ system is designed to process approximately 16,800 tons per year of plastics through its MRF. Sorted plastics are baled and shipped to other plastics reclaimers. Titus believes its business model could be of an appropriate scale and could be economically feasible in the Portland Metro area if a closed or under-utilized MRF in the area could be retrofitted with Titus’ technology. Titus also welcomes working with joint venture partners. Alternatively, if it is necessary to build and capitalize a new facility, financial assistance of some type may be needed for Titus’ business model to be financially viable.
MBA Polymers operates three PRFs, located in England, Austria, and China. These PRFs are totally different from the PRFs described above. They were designed to process mixed shredded plastics and other light materials that remain after durable goods such as electronics, appliances, or automobiles have been shredded and the metals or other heavy items such as glass have been removed. However, in its England plant, which was designed primarily to recycle plastics from auto shredders, MBA has been processing significant quantities of mixed rigid MRF plastics as well with good process results and facility profit. MBA Polymers does not rely heavily on up-front whole-piece optical sorting, but instead uses a variety of other cleaning and separation processes to ultimately produce reclaimed pellets ready for use in recycled product manufacturing. MBA’s plants process from 40 to 80,000 tons per year. The capital cost of the plants range from $25-$60 million each, depending on size and capacity.
Long-term commitments with major MRFs within a region may be needed for developers of a stand-alone PRF to consider such a facility in the Northwest. It is also likely that some plastics reclaimers will consider adding a PRF to their existing large reclamation plants as a way to develop new sources of supply for the resins they desire and to save the shipping and handling expense associated with transporting material from an off-site PRF.
OREGON PLASTICS RECYCLING ASSESSMENT
39
Economies of Scale and Applicability to Oregon
The minimum size of a PRF, based on the facilities described above, appears to be at least 15,000 tons per year for a small-scale facility. Preferred sizes for better facility economics, especially if the PRF is to also perform reclamation steps (washing and pelletizing), are 50,000 tons per year or higher. Oregon plastics reclaimers recycle approximately 15,000 tons per year, or approximately 25 percent of Oregon plastics that currently are collected for recycling. These reclaimers have the ability to recycle far more plastics than they currently process and having a PRF in the region would help to supply them with more of the specific resins that they reclaim.
Current levels of residential pre-picked mixed plastics marketed (exported) by Oregon MRFs is estimated to be approximately 6,500 tons per year. Current levels of Oregon residential mixed plastics collected for recycling, alone, cannot support a PRF in the state. Three approaches could be pursued that could make a small-scale Oregon PRF feasible, as follows:
1. Expand the plastics collected from residences by:
• Working to increase residential recycling rates of plastic tubs, which do not currently have a high recycling rate and are a relatively clean stream with good market demand.
• Expanding the list of plastics collected from residences to include other RPCs such as thermoforms.
• Expanding the list of plastics collected from residences to include non-packaging products such as toys and outdoor plastics furniture.
2. Expand mixed rigid plastics collected from non-residential sources.
3. Expanding the geographic range from which plastics are sourced to also include Washington. Over 130,000 tons per year of rigid plastics currently remain in the waste stream and are discarded in Oregon each year. An alternative approach from the small scale PRF would be to divert a significant portion of this material so that it could justify a large-scale facility like those operated by MBA Polymers overseas. Such a facility would begin by shredding all plastics received down to smaller sized particles that would then be cleaned and separated on the particle level rather than on the whole-piece level. This approach may require a transformation in how discards are managed in Oregon from source-separated recyclables collection with MRF materials separation, to dry waste separation with the plastics fraction going to a PRF for further sorting and reclamation.

OREGON PLASTICS RECYCLING ASSESSMENT
40
Section 6. Key State Waste and Recycling Policies with Significant Potential to Increase Plastics Recycling
In 2012, Oregon recovered nearly 2.4 million tons of municipal post-consumer waste generated in the state—for a recovery rate of 49.7 percent (Oregon’s reported rate of 53.4 percent includes statutory “credits” for waste prevention, reuse, and composting activities that do not produce measurable recovery). With the credits, the state exceeded its goal of 50 percent recovery. Plastics recovery has increased in recent years, though it remains lower overall than many materials typically recycled in curbside collection programs. Additional energy recovery occurs at the Marion County Waste-to-Energy Facility that the Oregon Department of Environmental Quality does not “count” in the statewide recovery calculations.8
Plastics, including rigid plastic containers, plastic film, other plastics, and composite plastics, including carpet pad, accounted for approximately 2 percent (by weight) of the material recovered in 2012. Approximately 57,600 tons of plastics were recycled in 2012, while 238,000 tons were disposed. Per-capita plastics recycling in Oregon is approximately 28 pounds per person per year.
Overview of Waste and Recycling Policies
The consultant team has compiled a list of preliminary policies that have the potential to contribute to significant increases in plastics recycling rates. These policies are listed in Table 14 below. Descriptions and general policy considerations follow the table.
Although these policies are generally expected to support reaching high state recycling rates, the specific contribution of any one specific policy in isolation is not well understood. Furthermore:
“In general it appears that a combination of policy instruments is required to divert waste from landfills effectively. Economic instruments such as user charges for the
management of municipal waste (e.g. ‘pay‑as‑you‑throw’ schemes), landfill tax and product charges can have a significant role if designed to regulate the behaviour of households, waste companies and producers.”9
Table 14 lists what are believed to be a selection of policies with the greatest potential impact—it is not a comprehensive list of policies that can be considered. Some policies, such as Pay-As-You-Throw rate systems and a container deposit system (bottle bill), have already been implemented to a significant extent in Oregon. Accordingly, such options offer limited opportunities for future improvements in Oregon, as compared with states that have not yet adopted such approaches.
8 Oregon Department of Environmental Quality, 2012 Oregon Material Recovery and Waste Generation Rates
Report, November 2013. http://www.deq.state.or.us/lq/pubs/docs/sw/2012MRWGRatesReport.pdf
9 European Environment Agency, Diverting Waste from Landfill: Effectiveness of Waste-Management Policies in
the European Union, 2009.

OREGON PLASTICS RECYCLING ASSESSMENT
41
Table 14. Summary of State-Level Policy Options and Generating Sector Applicability
Policy
Sin
gle
-fam
ily
resi
de
nti
al
Mu
lti-
fam
ily
resi
de
nti
al
Ind
ust
rial
&
Co
mm
erc
ial
Pay-As-You-Throw Disposal Pricing ■ ■
Product Disposal Ban ■ ■ ■
Mandatory Recycling of Specified Materials ■ ■ ■
Mandatory Programs—Service Levels ■ ■ ■
Targeted Outreach and Technical Assistance ■ ■
Recycling Program Management ■ ■ ■
Integrated Solid Waste Management Plans ■ ■ ■
Recycling/Diversion Rate Requirements/Goals ■ ■ ■
Disposal Tip Fee Surcharge/Tax ■ ■ ■
Recycling Technical Assistance/Infrastructure/Program Grants ■ ■ ■
Recycling Market Development Programs ■ ■ ■
Mandatory Retail Take-Back (for Plastic Film) ■ ■
Building Design Standards ■ ■ ■
Renewable Energy Portfolio ■
Mandatory Waste Processing/No Direct Landfilling ■ ■ ■
In addition, some policies can be considered on the local level by individual local governments. Due to the differences in communities and services provided, these policies generally cannot be mandated by state governments. Such local-level policies include:
Disposal limits—Single-family residences are limited in the quantity they are allowed to dispose of (a limitation of 65 gallons of waste per week) or waste collection service levels are scaled back (such as from weekly to biweekly waste collection). Such policies can drive generators to divert more materials from waste disposal to recycling but also can lead to more contaminants being diverted into the recycling stream.
Recycling rewards or rebates—Customers who recycle receive rewards points or a rebate on their bill (RecycleBank is one example).
Waste collection bans—This local policy is necessary for implementing a disposal ban. Bans can entail not collecting waste that is set out with mandated recyclables or banning recyclables from disposal facilities such as landfills. Although Oregon bans five types of materials from disposal sites (such as large home or industrial appliances and computers, monitors and televisions), it does not ban plastics from disposal.
Multi-family penalties—Assess a disposal penalty or surcharge to multi-family complexes where recyclables are not being separated for recycling above minimum threshold levels. Such penalties can provide an incentive to complex managers to educate and inform residents of the requirement

OREGON PLASTICS RECYCLING ASSESSMENT
42
to recycle, support equal convenience for recyclables and waste collection, and ensure sufficient recycling collection container capacity.
Specific Waste and Recycling Policy Options
Pay-As-You-Throw Disposal Pricing
Description: Pay-As-You-Throw (PAYT) disposal pricing provides a variable fee structure for waste not diverted from disposal. This policy provides a direct financial incentive to generators to divert recyclable waste and minimize waste generation.
Effectiveness:
Transfer of 5-6 percent of disposed residential tons into the recycling bin (recycling-only impacts, excluding additional source reduction and organics diversion impacts).10
Does not increase away-from-home generation.
Cost: Low. Additional cost incurred by municipalities for management information systems to bill residential customers at different rates based on quantity disposed. May have higher expenses if a cart-based collection system is chosen and if new carts must be purchased.
Example locations:
States with 100 percent PAYT include Oregon, Washington, and Minnesota.
Implementation requirements:
More involved customer billing system.
Each individual generator needs to pay separately for service to be effective (that is, PAYT does not work well where multi-family residences have common bulk waste disposal containers; it works better with single-family and commercial waste generators).
Transferability considerations: None.
Product Disposal Ban
Description: Specified items are banned from direct-to-landfill disposal (and in some, but not all cases, incineration/waste-to-energy disposal).
Effectiveness:
Effective in establishing diversion infrastructure.
Promote the “commodity status” of materials.
10 “Measuring Source Reduction: PAYT/Variable Rates as an Example,” Skumatz Economic Research Associates,
Inc., May 2000

OREGON PLASTICS RECYCLING ASSESSMENT
43
Not highly effective in ensuring generators divert materials.
Enforcement (inspection and penalties) improves effectiveness, but may be costly.
Only applies to the specified products named in the policy. Application should be targeted to high-impact materials, rather than generating a long list of banned materials.
More effective with highly visible items, or items that tend to be generated and collected together in large quantities (such as yard waste or appliances).
Cost: Low. Rarely do state agencies choose to expend cost to enforce this policy. Higher levels of enforcement would be more costly.
Example locations:
Wisconsin bans several materials from disposal and incineration, including plastic containers #1 and #2 as well as #3 through #7.
North Carolina bans the landfilling of plastic bottles.
Massachusetts bans the disposal and/or transfer for disposal of single-resin narrow-necked plastics.
Implementation requirements:
Development of processing and reclamation infrastructure may require lead time.
Success can be encouraged through grants and program support.
May require local government adjustment of service contracts and promotion/education on the local level.
Transferability considerations: None.
Mandatory Recycling of Specified Materials
Description: State and/or local ordinances that mandate recycling of certain products, such as all plastic bottles or plastic film from large generators. Single-stream recycling policies could be included, as well as policies such as collection of “all rigids” (all rigid plastic packaging and/or products).
Effectiveness:
Effective in establishing diversion infrastructure, especially for commercial sectors.
Level of compliance is partially dependent upon enforcement.
Cost: Medium-low. Materials recovery facilities may charge communities a higher processing fee if additional plastics sorting is required.
Example locations:
Florida specifies that counties must collect at least four of eight listed materials, one of which is “plastic bottles.”
Pennsylvania’s Act 101 states that mandated municipalities must collect at least three out of eight specified materials (“plastics" is one of the materials on the Act 101 list).

OREGON PLASTICS RECYCLING ASSESSMENT
44
Implementation requirements: Complementary diversion collection or MSW processing infrastructure is needed for all generating sectors.
Transferability considerations: None.
Mandatory Programs—Service Levels
Description: State mandates residential recycling program minimum service levels, which may include:
Minimum community population above which curbside recycling collection must be provided.
Requirement to provide multi-family recycling collection.
Requirement to collect residential recyclables using a single-stream approach.
Requirement to provide recycling (often of specific materials) at commercial and/or institutional establishments.
Minimum collection frequency (e.g., no less than every other week).
Minimum requirements for drop-off sites (number of sites per thousand population, convenience standards, distance to nearest sites).
Requirement to provide recycling collection container (bins or cart) for no additional user fee.
Requirement to provide equal access and convenience for recycling, in relation to disposal.
Minimum recycling education requirements.
Effectiveness: Believed to be very effective in establishing diversion infrastructure, especially for commercial sectors. Oregon’s existing law requires all cities with populations of 4,000 or more to provide a minimum of three recycling program elements along with basic recycling education and promotion. All cities of 10,000 residents must provide an additional one or two recycling program elements, depending on the activities chosen.
Cost: Medium. Cost depends on what specifically is required. Collection in rural areas can be very expensive. For residential recyclables, new collection carts can cost over $50 each depending on container size and quantity ordered. Additional costs are normally incurred by multi-family and commercial companies for recycling requirements for those sectors. Costs associated with requirements of single-family homes are normally incurred by municipalities.
Example locations:
Oregon requires that recycling be provided for residents once a municipality reaches a certain size, and specifies a certain level of consumer education.
Delaware mandates that curbside collection must be provided to all residents, sets a minimum frequency of collection (no less than every other week), and requires that carts be provided to residents of single-family homes.
Implementation requirements: Needs additional local ordinance and local enforcement support. Additional collection containers, trucks, and staff will be required.
Transferability considerations: May require a state grant program to provide funding, or else this policy may be considered to be unenforceable as an unfunded mandate.

OREGON PLASTICS RECYCLING ASSESSMENT
45
Targeted Outreach and Technical Assistance
Description: Target key materials, such as commercial pallet wrap, and/or key generator sectors, such as grocery stores, big-box stores, or hospitals to increase plastic recycling.
Effectiveness: Effectiveness varies with the specific targeted material and generator sector(s), the campaign for outreach and/or technical assistance, and the resources provided.
Cost: Medium. Cost also various with the level of efforts and the type of assistance provided. On-site technical assistance (site visits) is more costly than assistance over the phone. Both those methods are more costly, albeit more effective, than educational materials alone.
Example locations:
Metro’s Recycle at Work program provides technical assistance to businesses to improve their recycling of targeted materials.
Minnesota has a targeted program for plastic bag collection at retail locations.
In California, supermarkets participated in a pilot program to help design and improve recycling approaches for packing containers and other rigid plastic containers used in grocery-store delicatessens and bakeries.
New Jersey targets plastic shrink wrap used in marinas to protect boats from winter weather and is working to increase its recycling levels. The state awarded funding to multiple coastal counties for program implementation and has implemented an education and outreach program directed to marinas, boaters, and local officials.
Implementation requirements: Need to identify plastic materials and generator sectors to target. Conduct research and develop appropriate strategies for outreach and assistance. State grant funding could support local outreach and technical assistance efforts.
Transferability considerations: None
Recycling Program Management
Description: Requires a county or regional recycling coordinator to manage public outreach, reporting, and recycling planning. Promotion, education, and technical assistance efforts can also be covered. Recycling coordinators may be positioned at the city, county, regional, and/or wasteshed level.
Effectiveness:
Helps to ensure suitable and effective education and outreach programs are implemented.
Helps with planning and data collection and reporting, which are critical to monitoring program success which, in turn, assists in procuring continued program support.
Cost: Medium-low. Cost of a recycling coordinator may be approximately $70,000 per year for each municipality, and such cost is incurred by local governments. Some state grant funding is frequently necessary to avoid unfunded mandates on local governments.
OREGON PLASTICS RECYCLING ASSESSMENT
46
Example locations:
Pennsylvania’s Act 101 provides grants that pay for up to 50 percent of the salary and approved expenses of a county recycling coordinator. Act 101 also provides county with the opportunity to be awarded Recycling Performance Grants, which provides monetary incentives to recycle more tonnage.
New Jersey, which requires “municipal certified recycling coordinators.”
South Carolina’s Solid Waste Policy and Management Act of 1991 set statewide waste reduction and recycling goals for MSW, and requires the designation of a recycling coordinator by each county or region. The Act also established the Office of Solid Waste Reduction and Recycling (the Office) within the Division of Health and Environmental Control, which is charged with providing technical assistance as well as educational and awareness programs to local governments, businesses, colleges/universities, schools and the public regarding solid waste and recycling issues. The Office, which is solely a resource and has not regulatory, compliance, or enforcement role, also provides grant funding to support recycling efforts.
Implementation requirements:
Funding for the position and staffing are required. In some cases, jurisdictions may form an authority to fulfill this function more cost-effectively.
State support and grants often provide assistance to local governments/authorities
Many states require local jurisdictions to have recycling coordinators who must perform specific duties (including reporting to the state), or make funding/grants dependent upon such roles.
Effectiveness largely dependent upon state support and interaction with/training of recycling coordinators.
Transferability considerations:
Funding must be available.
May require statutory changes.
Integrated Solid Waste Management Plans
Description: Requires a county or regional recycling coordinator to develop a solid waste management plan, which generally is required to support a state solid waste management plan. May require a regional planning approach.
Effectiveness:
Provides a mechanism that ensures that state and local governments monitor, review, and analyze the effectiveness of recycling and solid waste reduction programs.
Ensures that local policies and programs are in line with state solid waste management goals.
Many plans involve the development of strategies and implementation plans and annual reporting as well, which helps ensure that programmatic efforts are made to move toward the local government’s stated goals.
Periodically updating solid waste management plans helps ensure that advancements and changes in technologies, types of materials disposed, and changes in recycling markets can be incorporated into future efforts.

OREGON PLASTICS RECYCLING ASSESSMENT
47
Some states provide grant opportunities to help fund local government efforts to develop a solid waste management plan.
The requirement of counties or regions to submit plans can help ensure that programs within the county or region are somewhat consistent in terms of service levels and goals.
Some state plans require the development of a disaster recovery plan, which many communities would not consider or update regularly without such direction.
In some states, like Pennsylvania and South Carolina, the Planning process is used to help ensure that disposal capacity (and other waste management infrastructure) is adequate.
Some states, like Massachusetts, are using the planning process to help move toward zero waste.
Cost: Low. Cost of creating a plan is generally low and is incurred by state and local governments who are creating the plans. However, the cost of implementing the plan may be high, depending on the programs and plan elements identified.
Example locations:
Most wastesheds in Oregon have plans in place, and the state has historically provided some funding to develop plans in the past. Many plans were created more than a decade ago.
Pennsylvania’s Act 101 requires that counties submit solid waste management plans, and indicates what is required in the plan. The plan must be consistent with Act 101 and the state solid waste management plan.
Georgia’s Comprehensive Solid Waste Management Act (1990) established a statewide per-capita solid waste disposal goal, and required the development of state and local solid waste management plans. Plans can be completed by the local jurisdiction, regionally, or co-jurisdictionally, and must provide for 10 years of collection and disposal capacity.
A number of other states including Massachusetts, Minnesota, South Carolina, and Virginia.
Implementation requirements:
Requires a state submittal and review/approval process, and/or data reporting.
May require a state plan or state goals that county or regional plans must support.
Transferability considerations: None
Recycling/Diversion Rate Requirements/Goals
Description: Requires the achievement of certain recycling and/or diversion rates by certain dates. Requirement may be measured on the state or local level. Often implemented/revised as part of the state solid waste management planning process.
Effectiveness:
Can help provide motivation and broad direction to local governments.
Many state recycling rate/diversion rate goals are not met.
Often help spur the development of recycling infrastructure and the cooperation/peer assistance of other local governments.
Effectiveness largely dependent upon assistance (technical and financial) provided by state agency.

OREGON PLASTICS RECYCLING ASSESSMENT
48
In many states there are no consequences/penalties for not reaching the stated goal(s).
May promote the recycling of heavier materials (despite commodity value or landfill impacts) because most states measure progress toward recycling and diversion goals in terms of weight.
Note that different states calculate recycling rates using different methods, and may focus on different waste streams (e.g., MSW or total waste that may including building and construction materials), which makes it challenging to compare rates among states in an equivalent and meaningful way.
Cost: Medium-high (setting goals is not costly but efforts to achieve them can be). Achieving higher recycling rates is generally more expensive than allowing materials to go to disposal. In order to avoid unfunded mandate situations, a grant program from the state government to local governments will likely be required to ensure local governments don’t bear all the costs of meeting goals.
Example locations:
Oregon sets diversion requirements at the wasteshed level and has a statewide goal of 50 percent diversion. In 2012, Oregon achieved a recovery rate of 49.7 percent (or 53.4 percent with “credits” for other recycling, composting, and “counting” energy recovery activities). Oregon also has goals for rigid plastic containers and is considering new goals for plastics recycling and other recyclables as part of its 2050 Materials Management Vision efforts.
California in 2011 established a new goal for at least 75 percent of solid waste to be source reduced, recycled, or composted by 2020. The state’s prior goal was 50 percent diversion, which it required of each jurisdiction individually. On a statewide basis, California had exceeded 50 percent diversion for several years.
Florida in 2010 established a 75 percent diversion goal by 2020, with credit to be given for waste-to-energy. In 2009, the state’s recycling rate was at 29 percent with an additional 18 percent combusted for energy. The state’s first recycling goal, set over 20 years ago, was 30 percent.
Implementation requirements:
Requires direction, oversight and assistance from state staff to be effective.
Requires local governments to actively implement and enhance recycling programs to achieve the goals.
To be effective, may require planning, reporting, education and outreach, and programmatic implementation on the part of local governments.
Requires change in state statute if penalties for failing to meet the goal are to be considered.
Transferability considerations: None
Disposal Tip Fee Surcharge/Tax
Description: Landfill surcharges or taxes provide a financial incentive to divert waste from disposal. (Some states refer to this as a recycling surcharge, as the revenues collected are used to develop recycling programs.). Landfill taxes can be made at both the state and local level. In some cases state enabling legislation grants local governments the right to implement local landfill surcharges.
OREGON PLASTICS RECYCLING ASSESSMENT
49
Effectiveness:
Effectiveness is largely dependent upon the level of the surcharge/tax. Also depends on the extent to which funds are used to enhance diversion infrastructure and/or for promotion/education.
Overly high fees may simply result in a transfer of waste across borders to remote landfills, resulting in an increase in greenhouse gases (from handling and transfer), without a commensurate increase in diversion. Oregon partly avoids this issue by also placing a surcharge on the export of waste for disposal.
Alternatives (e.g., an adequate and cost-effective recycling infrastructure) must exist to be effective. Combination with other strategies may enhance effectiveness.
Surcharges/taxes are often used to help implement recycling/solid waste management programs.
Cost: Medium. Most states’ surcharges are five percent or less of the disposal tip fee, and many believe these low surcharges do not provide enough of an incentive to deter disposal and incentivize recycling. These surcharges are an additional cost paid by businesses, individual subscribers, and municipalities to the state, which typically then returns the revenues to local governments through grant programs.
Example locations:
Oregon has a solid waste tip fee surcharge of $1.24 per ton, and $0.94/ton on exported waste.
California, through AB 939, allows local governments to raise fees to help reach the state’s diversion goal, although local surcharges are limited to $1.40 per ton of waste disposed. In Santa Clara County, for example, $1.30 per ton of waste disposed is levied on waste delivered to all solid waste facilities in the County.
Pennsylvania has a $2.00-per-ton recycling fee charged on all waste disposed in the state. This fee was slated to sunset on January 1, 2012 but was extended through 2020 with the passage of HB 961.
Illinois has a $2.00 per ton landfill surcharge and allows local governments to implement landfill fees, up to $1.27 per ton. Local governments must first pass an ordinance to implement the surcharge.
Oklahoma has a $1.50 per ton landfill surcharge.
All but 16 states have waste disposal surcharges.
Implementation requirements:
For a landfill tax to be effective in promoting recycling the tax/surcharge level should be relatively high.11 It is also most effective for motivating commercial waste generators to divert materials from disposal.
May require a change to state statute if implemented statewide.
May require a local ordinance to implement locally.
11 “Diverting Waste from Landfill: Effectiveness of Waste-Management Policies in the European Union”, European
Environment Agency, 2009

OREGON PLASTICS RECYCLING ASSESSMENT
50
Transferability considerations: If implemented at local level, must have disposal or transfer facilities; a more effective local approach would be to place a fee on solid waste collection services.
Recycling Technical Assistance/Infrastructure/Program Grants
Description: Provides state grant funds to county and/or local governments in order to put diversion infrastructure in place, develop markets, fund continuous improvement, or fund ongoing recycling program management (e.g., recycling coordinator staff positions). DEQ provides some solid waste grants to local governments for improving recycling, waste prevention, and household hazardous waste management.
Effectiveness: Varies. Such grants can be useful for building infrastructure and making programs more efficient and effective.
Cost: High. Although the cost varies depending on how the grant programs are structured, grant programs normally are costly and are paid for by state governments. Unless the grant program is designed to result in additional diversion, program expenses may simply be transferred from local governments to state governments with little increase in diversion. Some one-time targeted infrastructure-related grants may be paid for by industry companies or trade associations (e.g., away from home collection containers funded by Coca-Cola).
Example locations:
Pennsylvania has had a technical assistance program which provides grants of up to $7,500 to local governments to improve their recycling programs. The grant has historically been managed by the Solid Waste Association of America (SWANA) but after a hiatus is being resurrected and will be managed by a local consulting group called Vernon Land Use Associates.
Massachusetts, through its Sustainable Materials Recovery Program (SMRP), offers several types of grants, including municipal grants for municipalities and certain non-profits that wish to increase the effectiveness of their recycling, reuse, or composting programs. The state sets priority programs, and grants are available for those priority programs, regional initiatives, pilot programs, and small-scale initiatives. In recent years $1.5 million has been available for grants.
The Iowa Department of Economic Development offers businesses with technical assistance to implement waste reduction and recycling programs. Financial assistance (up to a 50 percent cost share) is also available through the Solid Waste Alternatives Program (SWAP).
Implementation requirements:
Requires state funding and personnel to provide oversight of and administer the program.
May require reporting, sharing of reports/outcomes with other communities and the public, audits, and recordkeeping and monitoring of projects.
May also require procurement and administration of third party consultant services if technical assistance is provided.
Transferability considerations: None.

OREGON PLASTICS RECYCLING ASSESSMENT
51
Recycling Market Development Programs
Description: Programs intended to provide a demand-pull to drive increasing diversion, particularly of materials with limited markets. May include tax incentives, technical assistance, or outright grants. Recycling market development zones or programs can involve loans, technical assistance, marketing support, closed-loop industrial parks, and incentives for using “waste” materials as inputs to manufacturing.
Effectiveness: Varies. Can be useful for building markets for challenged materials.
Cost: Medium-high. State governments typically bear the costs of market development programs, which normally have budgets of several million dollars per year.
Example locations:
The state of California (through CalRecycle) provides a multi-pronged approach to assisting businesses (haulers, processors and manufacturers/end users of scrap tires) in strengthening their business through grants, research and development, education and outreach, general technical assistance and business technical assistance (provided by consultants).
Pennsylvania has formed a Recycling Markets Center (RMC) to provide businesses using recycled materials with technical and other assistance, such as market analysis, assistance for start-up ventures, process evaluation and development assistance, strategic networking assistance, project management through partner linkages, technology transfer assistance and training, and acceleration of product commercialization. Economic services include siting of new business opportunities in tax incentive areas, supply chain evaluation, material quality evaluation, and business policy and environmental policy advocacy.
The Minnesota Pollution Control Agency helps start-up and expanding businesses in Minnesota develop uses for recycled materials by offering technical, financial, and marketing assistance.
Implementation requirements:
Requires state funding and staffing
Requires access to staff or consultants with appropriate levels of expertise
Transferability considerations: None.
Mandatory Retail Take-Back (for Plastic Film)
Description: Requirement that retail establishments that issue film bags, dry cleaner film, or other plastic films take back those materials for recycling.
Effectiveness:
Can provide convenient collection of materials that would not otherwise be collected (e.g., through municipal curbside or drop-off programs) for recycling.
Effectiveness is dependent, in part, on convenience and education/outreach efforts.
Benefits MRFs, in that plastic film is not delivered to MRFs receiving curbside/drop-off materials, and film plastics can be problematic in a typical MRF environment.

OREGON PLASTICS RECYCLING ASSESSMENT
52
Cost: Low. Retailers bear the cost of collection and recycling materials that are returned to them.
Example locations:
In 2006, the State of California passed a law, effective July 1, 2007, mandating that all retail establishments of a certain size or larger label their bags for return to the store for recycling, have recycling bins available to customers and to provide reusable bags for customers to purchase.
Rhode Island Resource Recovery Corporation implemented the first (2005) statewide film plastics recycling program. Retailers that provide film plastics are required to collect the film plastics. The program, called ReStore, accepts plastic grocery bags, fresh produce bags, newspaper sleeves, dry cleaning film and all plastic shopping bags except opaque, darkly colored, and puncture-resistant bags. The program is mandatory for retailers of a certain size.
In New York, retailers of a certain size are required to have an in-store plastic bag recycling plan. Stores may not send plastic bags to disposal facilities, and they must sell reusable bags. An additional requirement is that they track, for three years, the amount of plastic bags collected and recycled.
Implementation requirements:
Requires education and outreach to retail establishment
Mandatory statewide program would require passage of state statute. Can be implemented on local level, which would require passage of local ordinance.
Transferability considerations: None.
Building Design Standards
Description: Requirement that multi-family and commercial buildings be designed with sufficient room for recycling collection containers. May require equivalent convenience for access to recycling and waste collection containers. Such mandates when passed at the state level must be implemented at the local level through the building permit process.
Effectiveness:
Removes the “space constraint” barrier that multi-family dwellings have historically claimed prohibits effective recycling programs.
If not mandated, owners/developers of multi-family housing would likely allocate such space for a different use, so mandating appears to be helpful.
Effectiveness partially dependent upon the ability to remove other barriers to recycling as well, including keeping the recycling area clean and safe, and implementing effective outreach and education programs.
Cost: Low. Cost is incurred by owners of multi-family complexes and commercial buildings.
Example locations:
The California Solid Waste Reuse and Recycling Access Act of 1991 (Act) required the California Integrated Waste Management Board (CIWMB, now CalRecycle), to develop a model ordinance for communities that requires adequate areas for collection and loading of recyclable materials in

OREGON PLASTICS RECYCLING ASSESSMENT
53
development projects. If communities did not pass their own ordinance, then they would be required to pass the model ordinance by September 1, 1993.
Florida in 2010 passed a law that requires newly developed property used for multifamily residential or commercial purposes to provide adequate space and an adequate receptacle for recycling by tenants and owners of the property.
Implementation requirements:
Ordinances need to be developed at the local level to ensure multi-family and commercial development projects incorporate adequate space standards.
If mandated by the state, a state statute would be required.
As was done in California, development of a model ordinance would facilitate implementation.
The state would need to monitor local communities to ensure that such an ordinance was indeed developed and adopted by all the local jurisdictions.
Transferability considerations: None.
Renewable Energy Portfolio
Description: Encourages and may require electrical utilities to meet a certain percentage of energy from renewable sources. Must specifically identify fuels derived from waste materials (i.e., post-consumer plastics waste) as qualifying as a renewable energy source. Oregon has established a renewable energy portfolio requirement that does not allow waste-derived fuels other than biomass (wood waste) to qualify as renewable.
Effectiveness:
If non-recyclable plastics outthrows are collected source separated from waste destined for disposal and delivered to a renewable energy facility, and that use is allowed to count as “diverted” or “recycled,” then the amount of plastics diverted/recycled could increase significantly. Many European nations report their “recycling rates” statistics in this manner.
Materials that are collected for anticipated energy use are available for traditional recycling processes where feasible and economical. The data on collection and characterization of the composition of the material can facilitate the development of recycling markets.
States define which materials, specifically, could be included in the definition of renewable energy.
If states offer renewable energy credits, it makes separation/collection of these materials more cost-effective, essentially driving demand for the materials.
Reduces reliance upon fossil fuels.
Might be combined with “No Direct Landfilling of Waste” strategy described below.
Cost: High. Cost is incurred by rate payers (businesses and the public) in the form of higher utility rates.

OREGON PLASTICS RECYCLING ASSESSMENT
54
Example locations:
Wisconsin has a renewable energy portfolio program that counts fuel pellets as a renewable fuel. Plastics that have been in contact with food cannot be used for fuel pellet production, but plastics from many commercial and industrial generators are in strong demand, diverting plastics that would otherwise be landfilled.
Implementation requirements:
Private development of appropriate infrastructure often follows establishment of a renewable energy portfolio program, but can take several years to develop.
Transferability considerations:
More likely to advance in states with limited biomass resources to compete as alternative fuels.
Mandatory Waste Processing/No Direct Landfilling
Description: Waste must be treated or processed before being landfilled. Processing can include mass-burn waste to energy, but increasingly mechanical-biological treatment (MBT) is being considered. MBT can separate certain materials for mechanical recycling, others for energy conversion (refuse-derived fuel, pyrolysis, gasification) with the remainder going through a biological process (anaerobic digestion, fermentation, and/or composting). Metro’s enhanced dry waste recovery program requires that covered materials (mostly construction and demolition materials) go to an appropriate facility for waste processing, rather than directly to a landfill. According to DEQ, a couple of facilities in Oregon currently sort waste and recover plastics for recycling, with approximately 800 tons of plastics recycled in 2013.
Effectiveness:
Has the potential to divert very high percentages of plastics to recycling and energy recovery markets, although contamination issues have limited effectiveness to date.
Preferable to landfilling, as some resources (e.g., heat energy) from plastics are recovered through these processes.
Cost: High. Cost is incurred by rate payers (businesses and the public) in the form of higher waste disposal costs.
Example locations: None for mixed MSW in the United States, although this policy is in effect in European and other countries. A couple of U.S. states including Florida and Massachusetts have implemented this policy for special waste streams (e.g., construction and demolition debris).
Implementation requirements: Suitable infrastructure to process/sort MSW, as well as a collection system that targets appropriate materials. Can add significant costs to disposal.
Transferability considerations: Less feasible in rural areas.

OREGON PLASTICS RECYCLING ASSESSMENT
55
Section 7. Options for Recycling More Plastics
Infrastructure Analysis
Collection Infrastructure
According to DEQ data, approximately 82 percent of Oregon’s population is provided with curbside or drop-off recycling collection services. The vast majority, 79 percent of the state’s population, has single-family curbside or multi-family on-site recycling collection; 3 percent need to transport their recyclables to a drop-off collection site. This rate of recycling collection access is high compared to other states and is a direct result of policy action by the State of Oregon through the Recycling Opportunity Act. Oregon could consider expanding the Act to increase the access to recycling to even more of the state’s population, which would provide a commensurate increase in plastics recycling.
Because DEQ’s Materials Management Workgroup has been discussing initiatives that are broader in scope than that of this plastics assessment and that relate to cross-material initiatives, the concept of expanding recycling collection in general was not further investigated for this study.
RSE also assessed how residential recycling collection is performed to see if collection practices were structured in a way that would not provide an obstacle to greater levels of plastics recycling. We found that:
Virtually all residential recycling programs in the state collect recyclables single-stream (i.e., mixed with recyclables of other materials including paper and metals, but usually excluding glass from the commingled container).
Some 94 percent of residential curbside collection has carts instead of bins—this is a best practice with respect to plastics recycling.
Some 54 percent of carts are collected weekly; 45 percent are collected biweekly; and 1 percent are collected monthly. Except for the small portion (1 percent) of collection that is provided only monthly service, the collection frequencies in Oregon are considered to be adequate.12
Oregon recycling programs were also assessed for the types of plastics that are collected in residential recycling programs. Oregon recycling programs are very consistent with respect to the types of plastics accepted and some 99 percent of curbside collection includes plastic bottles, jars, tubs, and buckets up to 5 gallons (“rigid plastic containers”). This consistency regarding what is collected can be attributed to two factors—policy action by the State of Oregon through its rigid plastics recycling law, which signals which plastics types should be included in recycling programs, and the fact that virtually all recyclables in the state are collected single-stream and transferred or direct-delivered to a handful of residential MRFs
12 While some studies have suggested that weekly collection frequency may recover a significant level of additional
recyclables than biweekly collection, other studies have not reached the same conclusion. The effects of variations in cart size, supporting policies such as Pay-As-You-Throw, effectiveness of public education and awareness programs, and list of materials accepted for recycling make it difficult to review program data from numerous jurisdictions and say with certainty the impact of collection frequency alone on recycling performance. More study is needed.

OREGON PLASTICS RECYCLING ASSESSMENT
56
in the Metro area, rather than being processed at various facilities across the state of differing capabilities.
Residential film bags and wraps are generally not accepted for curbside collection in Oregon. As has been mentioned previously, sorting film from other recyclables in single-stream MRFs is costly and problematic, and the resulting film becomes so contaminated that its value drops significantly. Instead film bags and wraps generated by the residential sector are collected through drop-off, with over 300 locations, mostly return to retail, supplemented with some municipal or recycler drop-off sites. This approach to film recycling in Oregon recovers an estimated 1,700 tons, and when combined with the film that residents improperly place in residential curbside collection programs (estimated to be 300 tons), approximately 2,000 tons or one-third of “recyclable” residential film plastics is being recovered for recycling, with 4,089 tons of film still estimated to be disposed as shown in Table 8. It should be noted that DEQ in its waste characterization studies separates film into two types—recyclable polyethylene film and non-recyclable film that is not made from polyethylene or is not available for recycling, such as bags used for trash can liners and pet waste clean-up. A substantial majority of residential film is classified by DEQ as being non-recyclable, and if existing residential film recycling is divided by all residential film generated (2,000 divided by 2,000 tons recycled plus 26,486 tons disposed), only 7 percent of residential film is currently being recycled. In addition to the recycling of film, studies have shown that a very large percentage of film carryout bags/sacks are reused as waste bags and so are not available for recycling. The majority of residential recyclable film is still being disposed in Oregon and higher levels of recycling are achievable, especially for film wraps which are often not labeled by resin type and whose recyclability is not well-understood by the public.
Generally, there are opportunities to work directly with a number of commercial sectors (retail, building industry, hospitality industry, etc.) by providing targeted outreach and technical assistance to develop, implement and foster stewardship and recovery programs. A couple of opportunities with specific industries are discussed later in this section.
Commercial film plastics are collected for recycling through a variety of approaches. Large-volume film generators collect and bale their film on site, and are able to sell it for a good profit. Medium-volume generators may be able to bag recyclable film together and place it in their recycling collection container. Unfortunately, much of the recyclable film generated by small- and medium-sized generators is disposed rather than recycled and obstacles to commercial film plastics recycling remain that include small individual-location generation quantities and expense of sorting from mixed recyclables.
Materials Recovery Facilities/Sorting Infrastructure
As discussed above, virtually all residential recycling programs in Oregon collect the same plastics materials in commingled single-stream programs that mostly exclude glass. These recyclables are then transported from across the state to the following residential commingled single-stream MRFs, which are all located in the Metro area:
Far West Recycling (Beaverton);
Far West Recycling (Hillsboro);
Far West Recycling (Portland);
KB Recycling (Clackamas);

OREGON PLASTICS RECYCLING ASSESSMENT
57
Oregon Recycling Systems (Portland); and
SP Recycling (Clackamas).
Unlike typical single-stream MRFs in other states, none of Oregon’s MRFs have optical sorters for plastics. Several factors may have contributed to this, including:
Oregon’s bottle bill. The bottle bill by its coverage of carbonated soft drinks and bottled water significantly reduces the quantity of PET bottles that need to be sorted in MRFs. The bottle bill expansion that is scheduled to occur will further amplify this effect.
MRF capitalization cycles. It can cost up to $1 million to retrofit an optical sorter into an existing MRF, depending on the extent to which building modifications, bunker additions, and conveyor replacements need to be made. The expense is much less if optical sorters are added as part of new MRF construction or major retrofits. Such retrofits only occur every decade or so. Timing of such upgrades likely has played a part in the lack of optical sorters in Oregon MRFs today.
Low throughput of Oregon MRFs. Oregon MRFs are processing less than half of the quantity of residential recyclables that they have been designed to process. While some of this processing capacity may be used for mixed commercial recyclables, reduced throughput makes it difficult to add expensive pieces of capital equipment.
Oregon’s single-stream MRFs manually sort out bulky rigid plastics, film plastics, PET bottles, and HDPE bottles, and bale the remainder as pre-picked rigid packaging. Most residential plastics are exported to Asia for manual sorting and reclamation, although many of the PET bottles remain in Oregon to be reclaimed at ORPET.
In addition to the residential MRFs discussed above, Oregon has a number of dry waste MRFs that can sort dry mixed waste to extract recyclables before disposing of the residual waste. Twelve of these MRFs are in the Metro area and process dry waste as part of Metro’s dry waste landfill ban. The dry waste they process is primarily construction and demolition debris, and some loads of dry waste from industrial facilities and industrial parks. These dry waste MRFs recover only a small percentage of the plastics that go through them.
Reclamation Infrastructure
Oregon does not have any reclaimers that can purchase and wash dirty plastics in the state except for ORPET, which only accepts PET bottles (no thermoforms) from both the deposit-return system and residential MRFs. ORPET only purchases PET since it lacks the equipment to sort mixed plastics. ORPET’s processing capacity is 15,000 tons per year. Although it currently needs to purchase curbside bottles from in and out of state to operate at capacity, ORPET expects that the bottle bill expansion will result in full utilization of its existing installed capacity from just in-state deposit bottles.
Other in-state reclaimers are Denton Plastics and Northwest Polymers. These companies process clean and dry materials that don’t need to be washed—primarily commercial plastics and some bulky rigid plastics. AgriPlas is a specialty recycler of agricultural plastics in the state.
Summary of Market and Infrastructure Gaps and Barriers
Key market and infrastructure gaps and barriers can be summarized as follows:

OREGON PLASTICS RECYCLING ASSESSMENT
58
In-state MRFs lack the ability to sort plastics into the grades domestic plastics reclaimers want to purchase, except for basic grades like PET and HDPE bottles, meaning that more sorting must be performed by someone else—usually export markets.
The lack of PRFs in the Pacific Northwest and the fact that plastics reclaimers in the region specialize in narrow types of plastics (clean material only, or specific plastics resins) is a limitation to collecting and recycling more types of plastics in Oregon. It should be noted that there is good domestic market demand out-of-state for plastic bottles and clean film not requiring washing, and steady demand from export markets for mixed grades of rigid plastics.
Reclaimers with wash lines in the Pacific Northwest are extremely limited. Merlin in Canada, while a regional market, does not need increased plastics flows from the United States.
The inability to cost-effectively handle film in residential single-stream MRFs, plus diminished quality/value of such film, is a barrier to increased recycling of residential and dry waste film recycling. There are two parts to this barrier—a technology barrier associated with the lack of cost-effective sorting equipment for sorting film plastics in single-stream MRFs, and a market barrier due to the lack of film washing capability in the Pacific Northwest. Currently, nearly all MRF film from Oregon goes to export markets.
Technical barriers also exist that prevent companies from recycling coated or laminated film plastics. These materials must either be sent to a recovery market, or be disposed.
There are no full-scale recovery markets for mixed plastics in the Pacific Northwest. Developing a diversity of such markets, if desired in Oregon, would require a long-term cooperative effort between private industry and state and local authorities. Private industry has not invested in mixed plastics processing capacity in Oregon to date for several reasons, including Oregon’s small population compared to neighboring states, and lack of guarantees that mixed plastics will not continue to flow to export markets.
Export markets, especially for mixed plastics and MRF film plastics, have been unstable in the last couple of years.
Options for Recycling More Plastics
The information of the previous sections and the above infrastructure analysis was considered by DEQ, the Plastics Recovery Assessment Advisory Workgroup, and consultant project team to identify specific practical options for recycling more plastics from Oregon. The following options were identified and are described in the paragraphs that follow:
Bottle bill expansion.
Grocery rigid plastics.
Electronics—printers/peripherals.
Electronics plastics—all other.
Restaurant rigid plastics.
Improve residential film drop-off.
Commercial film recycling.
Dry waste recovery.
All residential rigid packaging.
All residential rigid plastic.

OREGON PLASTICS RECYCLING ASSESSMENT
59
These options are listed in order from those that would be easiest to implement at the top of the list, progressing to the harder to implement options at the bottom of the list. If all of these options are aggressively implemented, RSE estimates that recycling of plastics from Oregon could increase by nearly 70 percent over current levels. It should be noted that the options are all focused on recycling of plastics as plastics materials—diversion of plastics to energy was not included in the options that were considered. This was based on feedback from the Plastics Recovery Assessment Advisory Workgroup and Oregon DEQ staff.
Bottle bill expansion. Oregon’s beverage container deposit-refund law currently includes a five cent deposit on beer, carbonated water and soft drinks, and still water metal, glass, and plastic containers. In June, 2011 House Bill 3145 was passed in the legislature and subsequently became law. This bill expands the deposit-return program to include all beverages, except for wine, liquor, milk, and milk substitutes, beginning no later than January 1, 2018—the actual date depends on how quickly the state is able to shift returns from retail establishments to redemption centers. The bill also expands the deposit value from 5 cents to 10 cents if the beverage container return rate is less than 80 percent of covered containers for two consecutive years, but no sooner than January 1, 2017. As of 2013 the return rate was approximately 71 percent. It is expected that both the product expansion and the deposit value increase will occur without additional policy action by the state and this approach is included in estimates of additional plastics recovery from disposal in Oregon.
Grocery rigid plastics. The Association of Postconsumer Plastics Recyclers funded research into the amount of rigid plastic containers that are generated in large chain grocery stores bakery, deli, meat, and pharmacy departments. These plastics primarily include white and clear HDPE and PP injection molded containers and lids. Plastics and plastics recycling industry trade associations have identified this category as having the potential for 350 million pounds of plastics recycling nationwide. The economics for recycling these materials are often favorable, assuming backhaul to grocery chain warehouse and distribution centers (along with film and baled old corrugated containers already backhauled for recycling).
Electronics—printers and peripherals. Oregon currently has product stewardship for televisions, computers, and computer monitors. Data from the DEQ shows that some 27.7 million pounds of these covered electronic devices were collected for recycling in the state in 2013. Electronics recyclers estimate that some 20 percent of the weight of these devices is plastics, and that the substantial majority of plastics from these devices are already being recycled, mostly through export to Asia. On January 1, 2015 the state will expand the program to include printers and other peripherals such as keyboards and mice.
Electronics—all other electronics. In addition to the recycling of certain covered electronics under the state’s product stewardship program, some 25.2 million pounds of other electronics are currently recycled through other recycling programs according to DEQ survey data. If Oregon were to expand the coverage of electronic goods to also include cell phones, telephones, and other audio/video electronic
Figure 16. Grocery Rigid Plastics

OREGON PLASTICS RECYCLING ASSESSMENT
60
devices, the amount of plastics recycled could be increases significantly over the levels estimated from the existing program.
Restaurant rigid plastics. Recyclable rigid plastic containers are generated in both full service restaurants and quick service (fast food) restaurants. These restaurants also generate large quantities of other recyclable materials, such as old corrugated containers that are already being collected for recycling. Outreach to these restaurants and the recyclers who serve them can result in higher recycling rates for rigid plastic containers from restaurants and other institutional food preparation establishments.
Improve residential film drop-off. Return to retail programs for the collection and recycling of clean and dry residential polyethylene film are widespread in Oregon. Despite this fact, a majority of recyclable residential polyethylene film is still disposed by Oregonians. The Flexible Film Recycling Group (FFRG) is a product group of the American Chemistry Council that is working to increase the collection and recycling of all flexible films and to educate the public about the importance of recycling. FFRG conducts a modest direct public outreach program and has been working with retail take-back programs to improve local and on-premises consumer education regarding which film products are recyclable and can be returned to retail. FFRG has also worked on an intensive pilot promotion and education program in Milwaukee, Wisconsin in partnership with the Wisconsin Department of Natural Resources and the Sustainable Packaging Coalition. This consumer outreach initiative has subsequently been expanded statewide in Wisconsin and could be a model for a statewide promotion and education initiative in Oregon designed to recover greater quantities of residential film in the state.
Commercial film recycling. Like residential film, less than half of recyclable commercial films are currently being collected for recycling. Unlike residential film, this film is more likely to lack printing or be clear or white, and so is of higher value and greater market demand than residential film. Challenges to recycling commercial film at higher levels are the extent to which it is dispersed to all types of businesses, lack of no-cost reverse distribution collection of film separated for recycling, and challenges with cost-effectively separating film from other commercial recyclables. FFRG has worked in partnership with the Wisconsin Department of Natural Resources on the Wrap Recycling Action Project (Wisconsin WRAP) to pilot test strategies to recycle commercial film at higher levels. The resources developed through this initiative, and additional grass-roots outreach in Oregon, can result in the expansion of commercial film recycling in the state.
Dry waste recovery. Metro developed the Enhanced Dry Waste Recovery Program (EDWRP) in 2007 to increase the amount of material recovered from mixed dry waste and meet the state‐mandated waste reduction goal for 2009 of 64 percent for Multnomah, Clackamas and Washington counties. As a result, Metro Code requires that beginning Jan. 1, 2009, all mixed dry waste generated in the region be delivered to a Metro‐authorized material recovery facility (MRF) for processing prior to disposal. Currently, the MRFs participating in the EDWRP focus on recycling materials other than plastics, although select types of plastics that are readily identifiable by resin type and that have strong markets are separated for recycling. The amount of plastics that can be recycled from the EDWRP MRFs can be significantly increased; however, doing so would require a plastics recovery facility in the region that can use advanced separation technologies to identify the different types of plastics and cost-effectively sort and recycle them into marketable commodities.
All residential rigid packaging. Oregon has the good fortune that that the vast majority of residential recyclables collected for recycling in the state is collected single-stream and transferred for recycling to several MRFs in the Metro region for sorting and shipment to markets. Nearly all residential recycling

OREGON PLASTICS RECYCLING ASSESSMENT
61
programs statewide currently target the same list of plastics—rigid plastic containers from 6 ounces to 5 gallons in size that are bottles, tubs, pails (buckets), and retail plant containers that are 4"or larger. Other rigid plastic packaging including food trays, thermoforms, containers larger than 5 gallons or smaller than 8 ounces, and other like plastic packages have grown in recyclability in recent years. Export markets for the expanded list of materials, however, are not stable, and a plastics recovery facility in the region that can use advanced separation technologies to identify the different types of plastics and cost-effectively sort and recycle them into marketable commodities may be an important consideration prior to expanding plastics recycling statewide to all residential rigid packaging. (For the purposes of analysis, Oregon’s “plastic other” recycling category was assumed to include 50 percent rigid plastic packaging and 50 percent rigid plastic products, by weight; these assumptions may be refined further as needed.)
All residential rigid plastic. Like the option of collecting all rigid packaging, this option would expand the plastics collected to include all residential rigid plastics, including non-packaging plastics such as children’s toys, clothes hangers, laundry baskets, and other plastic products. Expanding plastics recycling to such a level is not common in the U.S., although MRFs are increasingly preparing bulky rigid plastics as a grade (composed primarily of polyethylene and polypropylene products, including 5-gallon buckets that are large in size and manually removed early in the MRF). Export markets for the expanded list of all rigid plastics, however, are not stable, and a plastics recovery facility in the region with advanced separation technologies to identify and sort different types of plastics for cost-effective recycling may be an important consideration prior to expanding collection of all residential rigid plastics.

OREGON PLASTICS RECYCLING ASSESSMENT
62
Section 8. Considerations for Moving Forward
This section discusses considerations for moving forward for each of the options to increasing plastics recycling introduced above. The bottle bill expansion and electronics product stewardship for printers/peripherals options are already committed to by state legislation that was passed within the last couple of years. All other options will not occur automatically, but will require some or all of the following to advance each option: supporting state or local authority policies (laws, ordinances, and regulations), promotion and education, equipment upgrades, financing, new support infrastructure (plastics recovery facility), public-private partnerships, and outreach and technical assistance.
Obstacles, Barriers, and Strategies for Success
Specific obstacles and barriers to increasing plastics recycling under each of the options, and supporting elements that may be needed and should be considered are summarized below.
Bottle bill expansion
Barriers and obstacles
o Existing system of retail return lacks the capability to cost-effectively sort, bale, and market the increased variety of plastics types that will be collected in an expanded bottle bill.
o Significant quantities of beverage containers will continue to be disposed at a five cent deposit level.
Strategies for success (note—these are already progressing toward implementation in Oregon)
o Transition of the return system to a redemption center model where return sites operate at a larger scale and where beverage distributors and retailers, through the Oregon Beverage Recycling Cooperative, can invest in plastics sorting infrastructure.
o Increase in the return value to ensure higher capture rates for covered bottles.
Grocery rigid plastics
Barriers and obstacles
o Lack of awareness by independent and chain grocery stores that grocery rigid plastics are recyclable with a high recycling market demand.
o Lack of awareness by independent and chain grocery stores of recycling markets and materials separation and preparation practices.
o Lack of backhaul capability by independent grocers compared to that of larger chains.
Strategies for success
o Targeted outreach and technical assistance to independent grocers, grocery suppliers, and grocery chains to promote plastics recycling, educate staff, and eliminate awareness barriers.
o Promotion of commercial single-stream recycling to small independent grocers that otherwise lack the backhaul capability of large chains.

OREGON PLASTICS RECYCLING ASSESSMENT
63
Restaurant rigid plastics
Barriers and obstacles
o Miscellaneous rigid plastics are not accepted or emphasized for recycling by recycling service providers in existing ICI recycling programs—as a result there is confusion on the part of restaurant staff regarding the recyclability of rigid plastic containers from restaurants.
o Recyclers of commercial mixed recyclables lack the knowledge of markets for plastics or lack sufficient sorting stations/storage bunkers/equipment to separate plastics into market streams.
o Many containers contain significant food residue and may require rinsing before recycling. Lack of time/willingness by kitchen staff to rinse and set aside rigid packaging for recycling collection, especially during periods of peak food preparation activities, may limit recycling.
o Lack of backhaul capability and/or lack of a tradition of backhauling recyclables to a central warehouse and distribution center.
Strategies for success
o Targeted outreach and technical assistance to restaurants, restaurant suppliers, and restaurant chains to promote plastics recycling, educate staff, and eliminate awareness barriers.
o Promotion of commercial single-stream recycling to small independent restaurants that otherwise lack the backhaul option that may be available to large chains with their own warehouse and distribution networks.
Improve residential film drop-off
Barriers and obstacles
o Lack of knowledge that polyethylene film and wraps that are not bags are also recyclable. o Lack of labeling regarding which films are polyethylene (and are recyclable) compared to
which films are made of other materials and are not recyclable. o Seeming light weight and small amount of film per piece, and perception that not recycling
film will not make much of a difference. o Failure of consumers to remember to take return-to-retail film with them on trips to the
grocery store or to other drop-off locations
Strategies for success
o Intensive promotion and education outreach initiative designed to inform the public of which types of film are recyclable and the importance of film recycling in the state.
o A law that requires that film packaging in Oregon be labeled with the Sustainable Packaging Coalition’s How2Recycle label.
o Promotion of film bag alternatives including paper bags and reusable bags.

OREGON PLASTICS RECYCLING ASSESSMENT
64
Commercial film recycling
Barriers and obstacles
o Dispersion of commercial film to all types of businesses, so that only small quantities are generated at any one business.
o Lack of no-cost reverse distribution collection of film separated for recycling. o Challenges with film contamination/quality degradation and the technical ability and cost-
effective ability to separate film from other mixed commercial recyclables.
Strategies for success
o Technical assistance to mixed materials commercial MRFs and dry waste MRFs on film recyclability.
o Development and dissemination of best practices for commercial film recycling. o Grassroots film recycling development and direct outreach to commercial zones designed to
increase the amount of commercial film recycled. o Market development assistance to allow regional film recyclers to accept, clean, sort, and
recycle contaminated films. o Expanding the network of service providers (e.g., fiber collectors, distributors) to collect
commercial film for recycling.
Dry waste recovery
Barriers and obstacles
o Recyclers of commercial mixed recyclables and Enhanced Dry Waste Recovery Program MRFs lack the knowledge of markets for plastics or lack sufficient sorting stations/storage bunkers/equipment to separate plastics into market streams.
o Instability of export markets for mixed plastics. o Lack of plastics recovery facilities that can take mixed plastics and sort and potentially clean
it for recycling. o Plastics separated from dry waste may be contaminated by gypsum from wallboard and dirt.
Such plastics would need to be cleaned by reclamation markets, and there are no such markets in Oregon or Washington with this capability.
Strategies for success
o Consider market development activities to locate a plastics recycling facility with the ability to separate durable goods plastics on the flake level by plastic type and grade.
o Policies that support recycling, such as mandatory separation of organics paired with dry waste recycling MRFs.

OREGON PLASTICS RECYCLING ASSESSMENT
65
All residential rigid packaging
Barriers and obstacles
o Instability of export markets for mixed plastics. o Lack of optical sorting equipment in Oregon MRFs. o Lack of plastics recovery facilities in the Pacific Northwest that can take mixed plastics and
sort and potentially clean it for recycling.
Strategies for success
o Consider market development activities to locate a plastics recycling facility in the Metro area.
o Policies that support recycling, including
Recycling rate goals for all rigid packaging (not just RPCs).
Recycling mandates for all plastics packaging.
Plastic packaging landfill bans.
o Market development for resins/products that are challenged by lack of in-region domestic markets, including for foam polystyrene, PVC, and polystyrene.
All residential rigid plastic
Barriers and obstacles
o Instability of export markets for mixed plastics. o Lack of optical sorting equipment in Oregon MRFs. o Lack of plastics recovery facilities in the Pacific Northwest that can take mixed plastics and
sort and potentially clean it for recycling.
Strategies for success
o Consider market development activities to locate a plastics recycling facility in the Northwest United States, specifically one that can recycle plastics at the flake level.
o Market development for resins/products that are challenged by lack of in-region domestic markets, including for foam polystyrene, PVC, and polystyrene.
Electronics—printers/peripherals
Barriers and obstacles
o Smaller device size (smaller plastic part size) and potential increased diversity of plastic resin/grade types can make it less cost-effective to recycle plastic components compared to computers, monitors, and televisions, especially if manual dismantling is relied on for recycling.
o Lack of domestic markets with the capability for separating mixed shredded electronics plastics.
Strategies for success
o Consider market development activities to locate a plastics recycling facility with the ability to separate durable goods plastics on the flake level by plastic type and grade.

OREGON PLASTICS RECYCLING ASSESSMENT
66
Electronics plastics—all other
Barriers and obstacles
o Smaller device size (smaller plastic part size) and potential increased diversity of plastic resin/grade types can make it less cost-effective to recycle plastic components compared to computers, monitors, and televisions, especially if manual dismantling is relied on for recycling.
o Lack of domestic markets with the capability for separating mixed shredded electronics plastics.
o Perception that some devices are not “electronics” or are not of suitable value such that it is not important to recycle them.
Strategies for success
o Consider market development activities to locate a plastics recycling facility with the ability to separate durable goods plastics on the flake level by plastic type and grade.
o Note—Oregon already has a landfill ban for televisions, computers, and displays. The landfill ban could be expanded to include other covered electronic devices in the state as they are designated and included in Oregon’s electronics recycling law.
Opportunities for Private-Sector Involvement
Plastics Associations’ Initiatives
Previously in this report it was mentioned that the American Chemistry Council—Plastics Division (using a different name many years ago) was instrumental to developing the first PRF in the United States, which was installed in Oregon twenty years ago. The American Chemistry Council and other plastics industry associations continue to work to increase plastics recycling across the nation and they have expressed willingness to partner with the public sector to increase plastics recycling in Oregon as well. Initiatives that can serve as models for their deeper participation in Oregon include:
Activities undertaken to boost plastics recycling in Wisconsin, which the plastics resin industry considers to be a template for expansion in 2015. The activities in Wisconsin focused on two areas:
o Wisconsin WRAP (Wrap Recycling Action Project). This project had an ICI film focus that included three primary elements: (1) pilot collection of film and wraps by working with paper stock recyclers to include film in their collection routes, and working to establish film reverse distribution recycling options; (2) developing ICI film recycling resources including tip sheets and workplace posters; and (3) a residential film bag and wrap outreach program focused on promoting the return of clean residential polyethylene film to retail stores.
o Rigid Recycling Study. This study is a joint American Chemistry Council—Plastics Division (ACC) and Association of Postconsumer Plastic Recyclers (APR) study designed to investigate opportunities to divert rigid plastics from the ICI sector in Wisconsin. The ICI sector is the largest generator of plastics waste in Wisconsin, accounting for 65 percent of plastics in Wisconsin’s waste stream. This Wisconsin study was just beginning as this Oregon project was concluding; however, learnings from the study may be available after year end 2014.

OREGON PLASTICS RECYCLING ASSESSMENT
67
Recycle Grocery Rigid Plastics. This initiative was also a joint ACC/APR project that investigated the opportunity to recycle rigid plastics from chain grocery stores. Generation estimates from this work have been incorporated into this Oregon project. Furthermore, there are supporting educational resources including a project website, “how-to” manual, worksheets, videos, and technical assistance that can be leveraged to expand grocery plastics recycling in Oregon.
Other ongoing industry trade association projects, including:
o PET thermoforms sorting and recycling pilots, funded through a NAPCOR/ Society of the Plastics Industry (SPI) joint initiative.
o Ongoing staff support to provide support and assistance to recycle non-bottle rigid plastic, funded through a joint ACC/SPI initiative.
Other Private-Sector Initiatives
The Curbside Value Partnership (CVP) is a multi-material organization that was initially financed by aluminum and steel industry companies, but has subsequently broadened its member-sponsors to include companies that represent bottle and non-bottle plastics, fiber, and cartons interests. CVP works through public-private partnerships to implement best practices for stronger residential recycling programs. In July of 2014, CVP announced its “Recycling Partnership,” which provides technical and financial assistance around four key areas of residential recycling programs:
Access: ensuring all households with curbside collection are served by large roll carts;
Champion Building: building support from local and state elected officials;
Regional Coordination: creating strategies across the entire supply chain, ensuring use of best management practices and regional approaches for better economies of scale; and
Education and Outreach: increasing participation and reducing contamination of recyclables.
The Closed Loop Fund is a new initiative that was launched in April 2014 with financial backing from Walmart, Coca-Cola, and other multinational companies. The Closed Loop Fund plans to loan as much as $100 million over the next couple of years, mostly to governments at zero interest, using a competitive request for proposals approach, to better capitalize residential recycling programs. Criteria for awarding loans will consider:
Financials: considering how applicants will repay the loans via landfill diversion savings, additional commodity revenue, or other cost savings; and
Scalability: whether the uses of funds from the loan can be scaled and be replicated by other cities.
Figure 17 shows the planned timeline over which the Closed Loop Fund intends to be active.
Figure 17. Closed Loop Fund Timeline for Action

OREGON PLASTICS RECYCLING ASSESSMENT
68
Section 9. Estimates of Increased Plastics Recycling
This section provides estimates of the increases in plastics recycling that potentially could occur if each of the options discussed above were to be aggressively implemented. To develop these estimates, RSE developed a supply and recovery model that estimates how much of different types of plastics are currently being recycled from the state through its different infrastructures (residential, industrial/commercial/institutional, bottle bill, and product stewardship programs). We than modeled and developed estimates of the increases in plastics recycling that could occur from each of the options assuming they were aggressively implemented.
The model that was developed is based on the best data that was available from DEQ and from other sources, and these data vary in terms of detail. Furthermore, the level of effort and investment in each option that is made will impact the amount of additional increase in plastics recycling that is obtained. The consulting team necessarily had to make assumptions in terms of how much cost, effort, governmental policy action, and private industry resources may be devoted to supporting the implementation of the strategies. For the purposes of this study, RSE assumed an aggressive implementation effort in order to estimate an upper limit of what may be achievable from the specific options, while recognizing that less diversion will occur if implementation of the options is not aggressively supported.
Figure 18 shows estimates for potential increases in plastics recycling that could occur, including the impact on the overall plastics recycling rate for the state, from implementation of plastics recycling options identified in this report.
Figure 18. Increase in Recycling Quantities and Recycling Rate from Options

OREGON PLASTICS RECYCLING ASSESSMENT
69
Table 15 shows estimates for existing levels of specific plastics types targeted by each option, and the potential increase estimated as part of this project, corresponding to the increases depicted in Figure 18. Table 15 also provides notes to further explain the figures and assumptions for each option.
Figure 18 and Table 15 show that implementing all of the identified initiatives has the potential to result in plastics recycling increases of up to 30,000 tons year (without recycling of additional electronics plastics), which if achieved would bring Oregon’s plastics recycling rate up to 29 percent compared to RSE’s estimate that Oregon has an approximate plastics recycling rate of 19 percent at the time this report was prepared. Recovering additional plastics from electronic products could yield up to 6,000 additional tons per year.13
13 If plastics in composite multi-material products (e.g., electronics and appliances) are included, based on U.S. EPA
national estimates, plastics recycling is estimated at 15 percent. “Plastics” identified in official Oregon waste and recycling composition data are only for products and packaging that are made primarily from plastics with only incidental amounts of other non-plastic materials. In total, RSE estimates approximately 58,000 tons per year of plastics from Oregon are currently being recycled—approximately 55,000 tons per year of plastics reported in DEQ’s 2012 Oregon Material Recovery and Waste Generation Rates Report (November 2013) and an additional nearly 3,000 tons of plastics components estimated by RSE from electronic products that are recycled.

OREGON PLASTICS RECYCLING ASSESSMENT
70
Table 15. Increase in Recycling Quantities from Options
Option Current
Estimate (tons/yr)
Increase (tons/yr)
Notes and Assumptions
Bottle bill expansion 6,500 2,000
2018 bottle bill expansion to 10 cents and expanded container list; 71% deposit return rate; increase is net tons diverted from disposal and does not include containers shifted from existing recycling programs
Grocery rigid plastics - 1,500 Based on 350 million pounds (175,000 tons) generated nationally and collection of 70% in Oregon
Restaurant rigid plastics 1,630 2,200
Assumes recycling can be increased 70% of generated quantities; generation and existing recycling quantities based on CalRecycle generation data allocated to Oregon using restaurant employment data
Improve residential film drop-off 2,000 1,000
Existing recycling estimated from curbside film collection data and national bag/wrap recycling report estimates for grocery returns; option assumes a 50% increase over existing recycling levels
Commercial film recycling 13,100 6,600 Option assumes commercial polyethylene film recycling can be increased 50% over existing levels
Dry waste recovery 1,000 1,100 Assumes 20% of plastics in existing dry waste recycling facilities can be separated for recycling
All residential rigid packaging 830 5,800
Increase is for trays and thermoforms not currently included in collection programs and improvements in participant setouts for non-bottle RPCs already collected; assumes achieving a 50% collection rate for packaging
All residential rigid plastic 2,200 9,700 Increase is for non-packaging plastics only (i.e., in addition to packaging increase above) and assumes achieving a 50% collection rate
Electronics—printers/peripherals 200 2,600
Will be covered in Oregon in 2015; existing recycling estimated from national statistics; increase based on 40% plastics content in electronics and 50% of plastics in collected printers/peripherals recycled (percentages of peripherals collected are estimated to have the same collection rate as electronics already being recycled in the state)
Electronics plastics—all other 2,300 3,700
Existing recycling based on DEQ recycling survey statistics minus Oregon E-Cycles program results; increase estimated from Ontario program performance data and assumption that 50% of plastics in collected other devices is recycled
Total
36,200

OREGON PLASTICS RECYCLING ASSESSMENT
71
Section 10. Assessment of Recycling Benefits
To evaluate the potential impact of increased recovery programs for plastics, the project team conducted an analysis using the U.S. Environmental Protection Agency’s WAste Reduction Model (WARM). EPA developed WARM for solid waste managers to calculate the GHG emissions associated with different waste management options. The consultants used this model and its associated emission factors to calculate the greenhouse gas (GHG) emissions benefits and energy savings associated with shifting targeted plastics from their disposal methods of landfill and combustion to recycling.
WARM calculates GHG emissions for baseline and alternative waste management practices, including source reduction, recycling, combustion, composting, and landfilling. The model calculates emissions in metric tons of carbon dioxide equivalent (MTCO2E) and metric tons of carbon equivalent (MTCE) across a wide range of material types commonly found in municipal solid waste. The model includes 42 materials and 8 mixed material categories. For each material, WARM applies material-specific emission factors for each management practice to calculate the GHG emissions and energy savings of each option. Users can modify additional inputs, such as landfill gas recovery practices and transportation distances to MSW facilities, or use standard default values.
For the options of increased plastics recycling described in the previous chapter and summarized in Table 15, it is assumed that upstream production and consumption are not changing; the only assumed change is in waste management methods. WARM uses a life-cycle assessment approach (LCA), though it does not address the use phase of materials. The GHG emission factors were developed following a life-cycle assessment methodology using estimation techniques developed for national inventories of GHG emissions.14 WARM shows the changes in emissions and energy associated with alternative disposal scenarios, such as the proposed shift from disposal and combustion to recycling for the targeted plastics. The model focuses on greenhouse gas emissions and energy use and does not address other environmental factors, such as other air pollutants, water pollution, or toxicity.
WARM was selected for its clarity, ease of use, and broad acceptance. Because WARM is freely available online and commonly used, it offers a consistent methodology that can be easily replicated in the future as well as by other entities. WARM is widely used by state and local governments as well as federal agencies, allowing for comparisons of results. The latest version of WARM (version 13, June 2014, Excel format) includes publicly available documentation on EPA’s website to describe the calculations, assumptions, and methodology underpinning the model.15 WARM is flexible and user-friendly, allowing customized entries to assess the various recycling options.
Regarding disposal methods, we applied Oregon’s statewide estimate of 93 percent landfilled and 7 percent combusted. We selected “Oregon” as the state for WARM’s calculation of avoided electricity-related emissions in the landfilling and combustion pathways, based on the regional electricity grid mix
14 USEPA, “Documentation for Greenhouse Gas Emission and Energy Factors Used in the Waste Reduction Model
(WARM).” http://epa.gov/epawaste/conserve/tools/warm/SWMGHGreport.html
15 U.S. EPA, “Documentation for Greenhouse Gas Emission and Energy Factors Used in the Waste Reduction Model
(WARM),” updated June 2014. http://epa.gov/epawaste/conserve/tools/warm/SWMGHGreport.html#documentation

OREGON PLASTICS RECYCLING ASSESSMENT
72
emission factor for the location. The model assumed national averages for landfill gas (LFG) recovery, LFG collection efficiency, and decay rate for municipal solid waste (MSW); it also assumed that captured LFG was recovered for energy.
For transportation, we assumed that materials were transported an average of 67 miles for management by landfill and combustion, following assumptions used in DEQ’s life cycle assessment for drinking water.16 For recycling, we assumed an average transportation distance of 350 miles, in recognition that some materials stay local (such as PET to ORPET), while others travel to more distant locations such as California, Nevada, and Asia.
WARM supports comparison of baseline and alternative scenarios for management of MSW materials. The model covers 50 material types, including 9 plastics categories:
HDPE;
LDPE;
PET;
LLDPE;
PP;
PS;
PVC;
PLA; and
Mixed Plastics.
The model currently lacks emission and energy factors for recycling for some of these plastics categories, however. WARM makes recycling calculations for HDPE, PET, and Mixed Plastics. Mixed Plastics, which is calculated as 61 percent PET and 39 percent HDPE, also serves as a recommended proxy for the other plastic resins that are not currently quantified for recycling emissions and energy use.17 EPA’s model documentation provides more details on the plastics calculations included in WARM.18
For each of the following plastics recycling options, the project team made assumptions regarding the portions of particular plastic resins and estimated associated tonnages:
Bottle bill expansion;
Grocery rigid plastics;
16 DEQ, Life Cycle Assessment of Drinking Water Systems: Bottle Water, Tap Water, and Home/Office Delivery
Water—Final Peer-Reviewed Appendix, August 2009, Table J-4. www.deq.state.or.us/lq/pubs/docs/sw/LifeCycleAssessmentDrinkingWaterAppendix.pdf
17 USEPA, “Using WARM Emission Factors for Materials and Pathways Not in WARM,” November 2012.
http://epa.gov/epawaste/conserve/tools/warm/pdfs/warm_efs_111612.pdf
18 USEPA, “Plastics,” WARM version 13, June 2014.
http://epa.gov/epawaste/conserve/tools/warm/pdfs/Plastics.pdf

OREGON PLASTICS RECYCLING ASSESSMENT
73
Restaurant rigid plastics;
Improve residential film drop-off;
Commercial film recycling;
Dry waste recovery;
All residential rigid packaging;
All residential rigid plastic;
Electronics – printers/peripherals; and
Electronics plastics – all other.
For the plastics recycling options, we estimated the quantities and resin types shown in Table 16. PET is estimated at nearly 4,700 tons, and HDPE is estimated at more than 6,200 tons. The more than 7,000 tons of LDPE and LLDPE are analyzed used the HDPE values as a proxy, for total polyethylene of more than 13,000 tons. Mixed plastics—including PVC, PP, PS, PLA, and other mixed plastics—are estimated at approximately 12,000 tons not including electronics and at more than 18,000 tons when electronics plastics are included. Note that these estimates of additional plastics recycling already include assumptions regarding recycling rates, ranging from 20 to 70 percent, for the amount of targeted plastics that are assumed to be recycled in the recycling options. Accordingly, when the WARM model shows these plastics shifting from their baseline (93 percent landfilled, 7 percent combusted) to the recycling scenario (100 percent recycled), the analysis applies only the portion projected to be captured for recycling and does not imply a 100 percent overall recycling rate for the waste stream.
Table 16. Estimated Quantities of New Recycling, by Resin Type
Recycling Option PET HDPE PVC LDPE LLDPE PP PS PLA Mixed Plastics
New Recycling
Bottle bill expansion 1,676 132 192 2,000
Grocery rigid plastics
825 675 1,500
Restaurant rigid plastics 506 1,144 550 2,200
Residential film drop-off 400 200 400 1,000
Commercial film recycling 1,320 1,980 3,300 6,600
Dry waste recovery 660 220 55 165 1,100
All residential rigid packaging 1,218 870 464 928 638 1,682 5,800
All residential rigid plastic 1,261 873 485 970 679 5,432 9,700
Electronics – printers/peripherals 2,600 2,600
Electronics plastics – all other 3,700 3,700
TOTALS 4,661 6,224 220 3,184 3,865 3,315 7,617 - 7,114 36,200

OREGON PLASTICS RECYCLING ASSESSMENT
74
Recycling Scenarios without Electronics
Avoided greenhouse gas emissions. The results of WARM clearly show the benefit of increased plastics recycling and the associated reductions in landfilling and combustion. By not landfilling or combusting nearly 30,000 tons of plastics (not including electronics plastics), approximately 4,800 metric tons carbon dioxide equivalent (MTCO2E) are avoided; the majority of these savings are from avoided combustion emissions. Recycling these materials saves an estimated 28,000 MTCO2E, mainly from avoiding the manufacture of virgin plastics from petroleum or natural gas, an energy- and GHG-intensive process. Shifting these plastics from disposal to recycling offers the potential to avoid nearly 33,000 MTCO2E of greenhouse gas emissions, as shown in Table 17. These GHG savings are the equivalent of the annual emissions of nearly 7,000 passenger vehicles.
Table 17. Greenhouse Gas Emissions Benefits of Recycling Options Without Electronics (EPA WARM)
Baseline Waste Management (93% landfill, 7% combustion)
Commodity Tons
Recycled Tons
Landfilled Tons
Combusted Tons
Composted Total
MTCO2E
HDPE - 12,344 929 NA 2,229
PET - 4,335 326 NA 694
Mixed Plastics - 11,128 838 NA 1,872
GHG Emissions from Baseline Waste Management (MTCO2E): 4,795
Recycling Scenario (targeted plastics are diverted to recycling)
Commodity Tons
Recycled Tons
Landfilled Tons
Combusted Tons
Composted Total
MTCO2E
HDPE 13,273 - - NA (11,069)
PET 4,661 - - NA (5,057)
Mixed Plastics 11,966 - - NA (11,801)
GHG Emissions from Alternative Waste Management Scenario (MTCO2E): (27,927)
AVOIDED Total GHG Emissions from Baseline MSW Generation and Management (MTCO2E): (4,795)
Total GHG Emissions Reductions from Alternative MSW Generation and Management (MTCO2E): (27,927)
NET Incremental GHG Emissions (MTCO2E): (32,722)

OREGON PLASTICS RECYCLING ASSESSMENT
75
Energy savings. WARM also shows that increased plastics recycling yields energy savings, shown in million British thermal units (MBTUs). As shown in Table 18, the baseline scenario produces energy savings of about 10,000 MTBUs, mainly from combustion with energy recovery; these savings are not captured in the recycling scenario, though recycling yields greater energy savings overall. Recycling these plastics saves nearly 1,270,000 MBTUs. Subtracting the lost energy savings from the baseline scenario yields net energy savings of nearly 1,260,000 MBTUs. These energy savings are the equivalent to the annual energy use of more than 11,400 household or more than 10 million gallons of gasoline. Including electronics in the recycling scenarios yields greater benefits, as illustrated in the following section.
Table 18. Energy Use Benefits of Recycling Options without Electronics (EPA WARM)
Baseline Waste Management (93% landfill, 7% combustion)
Commodity Tons
Recycled Tons
Landfilled Tons
Combusted Tons
Composted Total Million
BTU
HDPE - 12,344 929 NA (7,422)
PET - 4,335 326 NA (65)
Mixed Plastics - 11,128 838 NA (2,740)
Energy Use from Baseline Waste Management (million BTU): (10,227)
Recycling Scenario (targeted plastics are diverted to recycling)
Commodity Tons
Recycled Tons
Landfilled Tons
Combusted Tons
Composted Total Million
BTU
HDPE 13,273 - - NA (660,020)
PET 4,661 - - NA (146,469)
Mixed Plastics 11,966 - - NA (462,116)
Energy Use from Alternative Waste Management Scenario (million BTU): (1,268,605)
LOST Total Energy Savings from Baseline MSW Generation and Management (million BTU): 10,227
Total Energy Use from Alternative MSW Generation and Management (million BTU): (1,268,605)
NET Incremental Energy Use (million BTU): (1,258,378)
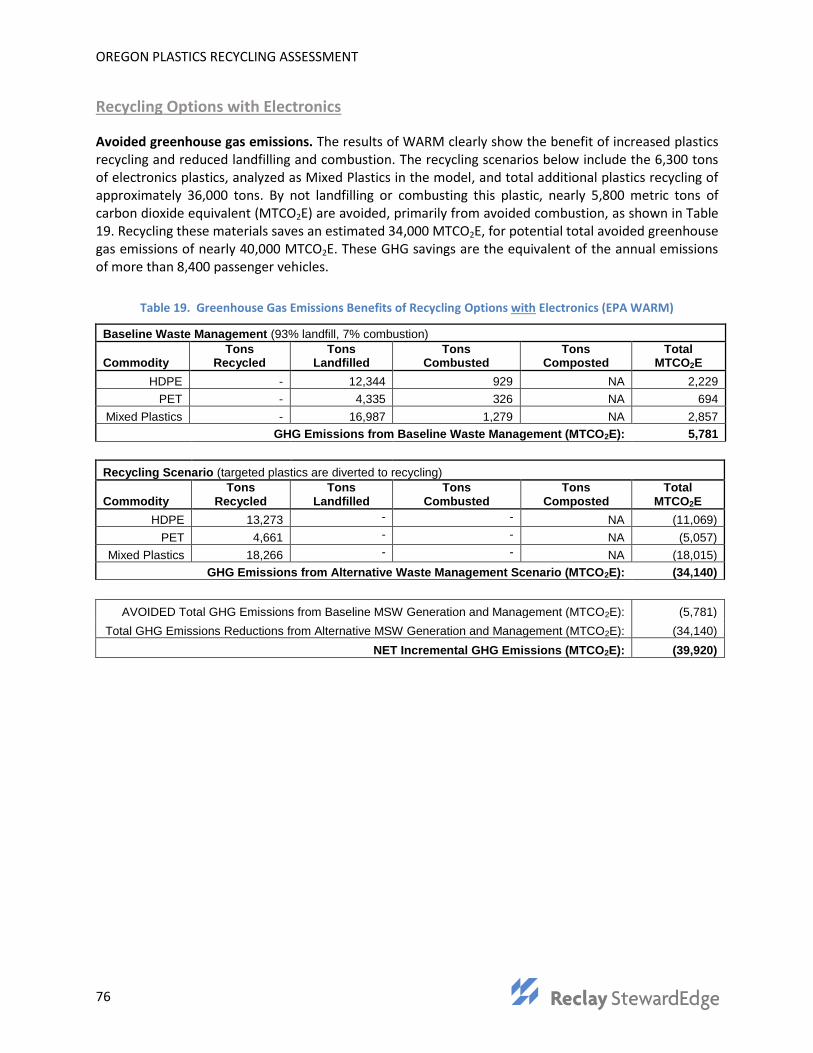
OREGON PLASTICS RECYCLING ASSESSMENT
76
Recycling Options with Electronics
Avoided greenhouse gas emissions. The results of WARM clearly show the benefit of increased plastics recycling and reduced landfilling and combustion. The recycling scenarios below include the 6,300 tons of electronics plastics, analyzed as Mixed Plastics in the model, and total additional plastics recycling of approximately 36,000 tons. By not landfilling or combusting this plastic, nearly 5,800 metric tons of carbon dioxide equivalent (MTCO2E) are avoided, primarily from avoided combustion, as shown in Table 19. Recycling these materials saves an estimated 34,000 MTCO2E, for potential total avoided greenhouse gas emissions of nearly 40,000 MTCO2E. These GHG savings are the equivalent of the annual emissions of more than 8,400 passenger vehicles.
Table 19. Greenhouse Gas Emissions Benefits of Recycling Options with Electronics (EPA WARM)
Baseline Waste Management (93% landfill, 7% combustion)
Commodity Tons
Recycled Tons
Landfilled Tons
Combusted Tons
Composted Total
MTCO2E
HDPE - 12,344 929 NA 2,229
PET - 4,335 326 NA 694
Mixed Plastics - 16,987 1,279 NA 2,857
GHG Emissions from Baseline Waste Management (MTCO2E): 5,781
Recycling Scenario (targeted plastics are diverted to recycling)
Commodity Tons
Recycled Tons
Landfilled Tons
Combusted Tons
Composted Total
MTCO2E
HDPE 13,273 - - NA (11,069)
PET 4,661 - - NA (5,057)
Mixed Plastics 18,266 - - NA (18,015)
GHG Emissions from Alternative Waste Management Scenario (MTCO2E): (34,140)
AVOIDED Total GHG Emissions from Baseline MSW Generation and Management (MTCO2E): (5,781)
Total GHG Emissions Reductions from Alternative MSW Generation and Management (MTCO2E): (34,140)
NET Incremental GHG Emissions (MTCO2E): (39,920)

OREGON PLASTICS RECYCLING ASSESSMENT
77
Energy savings. As shown in Table 20, the baseline scenario, with electronics, produces energy savings of nearly 12,000 MTBUs, mainly from combustion with energy recovery; these savings are not captured in the recycling scenario. Recycling these plastics saves more than 1,510,000 MBTUs. Subtracting the lost energy savings from the baseline scenario yields net energy savings of just over 1,500,000 MBTUs. These energy savings are the equivalent to the annual energy use of more than 13,600 household or more than 12 million gallons of gasoline.
Table 20. Energy Use Benefits of Recycling Options with Electronics (EPA WARM)
Baseline Waste Management (93% landfill, 7% combustion)
Commodity Tons
Recycled Tons
Landfilled Tons
Combusted Tons
Composted Total Million
BTU
HDPE - 12,344 929 NA (7,422)
PET - 4,335 326 NA (65)
Mixed Plastics - 16,987 1,279 NA (4,180)
Energy Use from Baseline Waste Management (million BTU): (11,667)
Recycling Scenario (targeted plastics are diverted to recycling)
Commodity Tons
Recycled Tons
Landfilled Tons
Combusted Tons
Composted Total Million
BTU
HDPE 13,273 - - NA (660,020)
PET 4,661 - - NA (146,469)
Mixed Plastics 18,266 - - NA (705,416)
Energy Use from Alternative Waste Management Scenario (million BTU): (1,511,905)
LOST Total Energy Savings from Baseline MSW Generation and Management (million BTU): 11,667
Total Energy Use from Alternative MSW Generation and Management (million BTU): (1,511,905)
NET Incremental Energy Use (million BTU): (1,500,238)
Savings by option. Table 21 shows the potential greenhouse gas and energy savings for each of the separate options for increasing plastics recycling.
Table 21. Greenhouse Gas and Energy Savings Potential for Increased Plastics Recycling Options
Recycling Options Additional Recycling
Potential GHG Savings (MTCO2E)
Potential Energy Savings (MBTUs)
Bottle bill expansion 2,000 (2,418) (66,516)
Grocery rigid plastics 1,500 (1,598) (66,475)
Restaurant rigid plastics 2,200 (2,399) (93,255)
Residential film drop-off 1,000 (1,002) (49,167)
Commercial film recycling 6,600 (6,613) (324,504)
Dry waste recovery 1,100 (1,133) (51,711)
All residential rigid packaging 5,800 (6,549) (228,552)
All residential rigid plastic 9,700 (11,007) (378,219)
Electronics – printers/peripherals 2,600 (2,971) (99,815)
Electronics plastics – all other 3,700 (4,228) (142,045)
TOTALS (rounded) 36,200 (39,920) (1,500,200)

OREGON PLASTICS RECYCLING ASSESSMENT
78
Appendix A. Plastics Category Definitions
Oregon Plastics Definitions
Deposit beer and soft drink plastic beverage bottles (current definition). Any beverage container up to 3 liters in size with an Oregon deposit for beer, soft drink, carbonated water and carbonated juice drinks. Does not include out-of-state bottles, soft drink syrup containers, or carbonated beverages that are 100 percent pure tea, milk, cocoa and fruit or vegetable juices juice (carbonated beverages that contain tea, milk, cocoa and fruit or vegetable juices and that have any added ingredients are considered to be a soft drink and are currently covered).
Deposit plastic water bottles. Only includes still waters and flavored waters added to the bottle bill as of 2009, up to 3 liters in size. Does not include out-of-state bottles.
Deposit beverage container (expanded definition likely to become effective in 2017). An individual, separate, sealed glass, metal or plastic bottle or can (but excluding cartons, foil pouches and drink boxes) and metal containers that require a tool to be opened:
a) That contains the following beverages, intended for human consumption and in a quantity less than or equal to three fluid liters:
o Water and flavored water; o Beer or other malt beverages; o Mineral waters, soda water and similar carbonated soft drinks.
b) Any beverage other than those specified in paragraph (a) that is intended for human consumption and is in a quantity more than or equal to four fluid ounces and less than or equal to one and one-half fluid liters, except distilled liquor, wine, dairy or plant-based milks, infant formula and any other exemptions set forth in rule of the Oregon Liquor Control Commission., containing a beverage in a quantity less than or equal to three fluid liters.
No-deposit plastic beverage bottles (RPCs). 8-ounce to 5-gallon plastic beverage bottle without an Oregon deposit such as milk, juice, alcohol, wine, smoothie, coffee, tea. Includes beer, soft drink, and water bottles that are over 3 liters in size or that are from out-of-state that are not marked with the Oregon refund value. Does not include cream, half & half, syrups, and powdered beverages.
No-deposit very small, large beverage bottles. Plastic Bottles less than 8 ounces or larger than 5 gallons that hold ready-to-drink beverages. Mainly small liquor bottles.
Other plastic bottles. All non-beverage bottles 8 ounces to 5 gallons used for non-beverage food, medicines, vitamins, hair and bath products, laundry supplies, antifreeze, oil.
Plastic tubs, pails acceptable in curbside. Tubs, pails (buckets), flowerpots 4 inches or larger, from 8 ounces to 5 gallons in size made from plastic and meeting the definition in Oregon Revised Statute 459A.650 for Rigid Plastic Container. Does not include trays or clamshells.
Other plastic tubs, pails, and trays that meet Rigid Plastic Container definition but are not acceptable in curbside. Plastic packages of finite shape with a capacity of from 8 ounces to 5 gallons. Includes cookie trays, trays with sidewalls that can contain at least 8 ounces, clamshells, flower pots less 4 inches that are greater than 8 ounces. Does not include lids, unless the lid is
OREGON PLASTICS RECYCLING ASSESSMENT
79
attached or is itself a rigid plastic container. Includes plastic cups used commercially to package food, but not plastic cups sold as a product for home or office use (usually unmarked - included in “rigid plastic products”). Does not include tubs/pails that are acceptable in curbside, or any bottles. Does not include flexible tubes like bathroom caulk, toothpaste.
Small Plastic Tubs acceptable in curbside. Includes the plastic tubs and yogurt containers that are at least 6 ounces in size, but less than 8 ounces.
Other rigid plastic packaging. Includes expanded polystyrene packaging and food trays (holding less than 8 ounces), urethane foam packaging, containers larger than 5 gallons, plastic bottle and container lids and lids from glass, metal, or paper containers. Amended in 2000 to include “small rigid plastic containers” - plastic containers such as yogurt cups that are less than 8 ounces in size.
Other rigid plastic products. Dishware and utensils, including expanded polystyrene cups and plates when originally sold for home use (non-packaging), plastic household items, all-plastic furniture, and toys. Includes thermoset plastic products and “fiberglass” (mainly plastic) boat parts, corrugated roofing, and similar products. Includes polyurethane foam products, such as urethane foam carpet padding.
Mixed plastics/materials. Items whose predominant material is plastic, but is combined with other material, such as kitchen ware, toys, plastic pens, car parts with other components, non-vinyl floor tiles and coverings that have canvas, paper, or other types of backing material or significant non-plastic components, etc.
Plastic beverage pouches. Includes ready-to-drink beverages only.
“Recyclable” polyethylene film plastic. Includes plastic grocery bags, retail bags, newspaper bags, dry cleaner bags, pallet-wrap, stretch wrap, clear and black polyethylene plastic sheeting, hay sleeves and silage bags, fertilizer/peat/feed bags from nurseries and agricultural operations, furniture and mattress wrap, bubble wrap, woven lumber wrap, roofing material wrap, insulation wrap, commercial bags and liners, commercial parts packaging, and building wrap. Excludes any film that is not polyethylene or other polyolefin, any film that is laminated to other materials (tape/labels are OK), any bag used as a garbage bag (can liners and tied-off garbage bags), bags contaminated with food and other sticky/contaminating materials on the inside, food and household product packaging such as frozen vegetable bags, and plastic sheeting used for ground cloths or masking, if contaminated. Diaper packaging, bread bags, and zip lock and similar household use bags are recyclable in many drop-off recycling programs, but were not included in the “recyclable film plastic” category in Oregon’s 2009 waste composition study.
Other film plastic. All other plastic bags and flexible plastic film including garbage bags, plastic strapping, and other flexible plastic items. Any plastic bag used as a garbage bag goes here.

OREGON PLASTICS RECYCLING ASSESSMENT
80
Vermont Plastics Definitions
PET Bottles means clear or colored PET bottles, including “VT” deposit containers. When marked for identification, it bears the number “1” in the center of the triangular recycling symbol and may also bear the letters “PETE” or “PET”. The color is usually transparent green or clear. A PET container usually has a small dot left from the manufacturing process, not a seam. It does not turn white when bent.
PET Food and Dairy Bottles and Jars (which originally contained non-hazardous material) means food and rice milk, soy milk, milk and dairy bottles and jars (e.g., peanut butter, mayonnaise) but excluding PET tubs and lids.
HDPE Beverage Bottles means natural and colored HDPE containers that contained beverages, excluding rice milk, soy milk, milk and dairy. When marked for identification, it bears the number “2” in the triangular recycling symbol and may also bear the letters “HDPE.”
HDPE Food, Dairy and Detergent Bottles, means all HDPE bottles that would not be subject to either the current VT deposit or an expanded deposit, including food bottles, rice milk, soy milk, milk and dairy and laundry detergent bottles.
Plastic Bottles #3-#7 (which originally contained non-hazardous material) means plastic bottles made of types of plastic other than HDPE or PET. Items may be made of PVC, PP, or PS. When marked for identification, these items may bear the number 3, 4, 5, 6, or 7 in the triangular recycling symbol. This subtype also includes unmarked plastic bottles. This category is to be set aside for sub-sorting by DSM.
Plastic Cups means all plastic cups, no matter what resin used for drinking beverages including iced coffee, solo cups, etc. This category also includes Keurig cups used to brew cups of coffee.
Tubs and Lids means all plastic containers used for food items that are not a bottle or a jar. Examples include yogurt and butter containers, no matter what resin type.
Bulky Rigids (and containers greater than 1 gallon) means plastic pails, large bottles holding kitty litter and bulk water, and plastic objects other than disposable package items. These items are usually made to last for a few months up to many years. These include 5 gallon pails, and the plastics used in children toys, furniture, plastic landscape ties; plastic railroad ties, mop buckets, sporting goods, etc. This category does not include agricultural pots which are to be separately sorted.
Thermoforms means typically clear plastic packaging used for lettuce, berries, deli foods, which is sometimes called a “clamshell”, no matter which resin it is. Excludes extruded polystyrene foam (EPS).
Film, Retail Bags means all plastic bags used to carry groceries and other items purchased at retail stores.
Film, Other Bags means all plastic bags that are not retail bags or garbage bags, including bread bags, bags used in cereal boxes, non-metalized chip and snack bags, sandwich bags, dry cleaning bags, etc.

OREGON PLASTICS RECYCLING ASSESSMENT
81
Film, Wrap means film plastic used for large-scale packaging or transport packaging. Examples include shrink-wrap, mattress bags, furniture wrap, and film bubble wrap.
Film, Garbage Bags means bags made specifically to store garbage. Note that bags containing garbage that were once retail bags should be classified as retail bags once the garbage has been emptied out of them.
Other Film means plastic film that is contaminated or otherwise non-recyclable. Examples include painting tarps, food wrappers such as candy-bar wrappers, mailing pouches, bank bags, X-ray film, metalized film including metalized chip and snack bags, and plastic food wrap.
Agricultural Pots means all pots no matter the resin type that are used for agricultural purposes including pots, flats and trays.
Pouches means plastic and metalized plastic pouches used to store food and beverages.
Remainder/Other Plastic means plastic that cannot be put in any other type or subtype. This type includes items made mostly of plastic but combined with other materials. Examples include auto parts made of plastic attached to metal, plastic drinking straws, produce trays, foam packing blocks, foamed polystyrene (including meat trays), plastic strapping, new plastic laminate (e.g., Formica), vinyl, linoleum, plastic lumber, imitation ceramics, handles and knobs, plastic lids, some kitchen ware, toys, plastic string (as used for hay bales), and CD’s.
www.reclaystewardedge.com