plasma of dogs with lymphoma characterizing circulating
TRANSCRIPT

Page 1/21
Characterizing Circulating Nucleosomes in thePlasma of Dogs with LymphomaChristopher Dolan ( [email protected] )
Texas A&M UniversityTasha Miller
Texas A&M UniversityJarvis Jill
Texas A&M UniversityJason Terrell
Volition America LLCTheresa Kelly
Volition America LLCThomas Bygott
Volition Diagnostics UK LtdHeather Wilson-Robles
Texas A&M University
Research Article
Keywords: Canine, Lymphoma, circulating nucleosomes, cell free DNA, circulating DNA, Histone 3.1
Posted Date: March 24th, 2021
DOI: https://doi.org/10.21203/rs.3.rs-318227/v1
License: This work is licensed under a Creative Commons Attribution 4.0 International License. Read Full License
Version of Record: A version of this preprint was published at BMC Veterinary Research on August 16th,2021. See the published version at https://doi.org/10.1186/s12917-021-02991-x.

Page 2/21
AbstractBackground:
Nucleosomes consist of DNA wrapped around a histone octamer core like beads on a string so that DNAcan be condensed as chromatin into chromosomes. Diseases such as cancer or in�ammation lead to celldeath where chromatin is fragmentated and released as mononucleosomes into the blood. The Nu.QTM
H3.1 assay measures total nucleosome concentration in plasma of humans and has been used to detectand identify cancer even at early stages. The objectives of this study were to determine if nucleosomelevels could be used to distinguish between healthy dogs and dogs with various stages of lymphoma(LSA) using the Nu.Q™ H3.1 assay.
A total of 126 dogs diagnosed with LSA and 134 healthy controls were recruited for this study. Plasmawas collected from each dog and stored in K2-EDTA tubes. The LSA patient samples were recruited fromTAMU or purchased from various biobanks. All control cases were recruited from TAMU. Samples werealso collected longitudinally from 3 dogs undergoing treatment for multicentric lymphoma at TAMU as apilot study to investigate the pattern of nucleosome concentrations in plasma during treatment.
Results:
Dogs with LSA had an approximately 7-fold increase in their plasma nucleosome concentrationscompared to controls (AUC 87.8%). Nucleosome concentrations increased with cancer stage and dogswith B cell lymphomas had signi�cantly higher nucleosome concentrations than dogs with T celllymphomas.
Nucleosome concentrations from serially monitored patients were elevated at diagnosis and progressionwith subsequent decreases in nucleosome concentration that corresponded to clinically detectableresponses to therapy.
Conclusions:
The Nu.QTM H3.1 assay was able to reliably detect elevated nucleosome concentrations in the plasma ofdogs with LSA. Furthermore, it appears that nucleosomes are useful for differentiating cancer fromhealthy individuals in canines. Results from serially monitored patients indicate that nucleosomes couldbe an objective monitoring tool for remission status in canine lymphoma patients.
Page 3/21
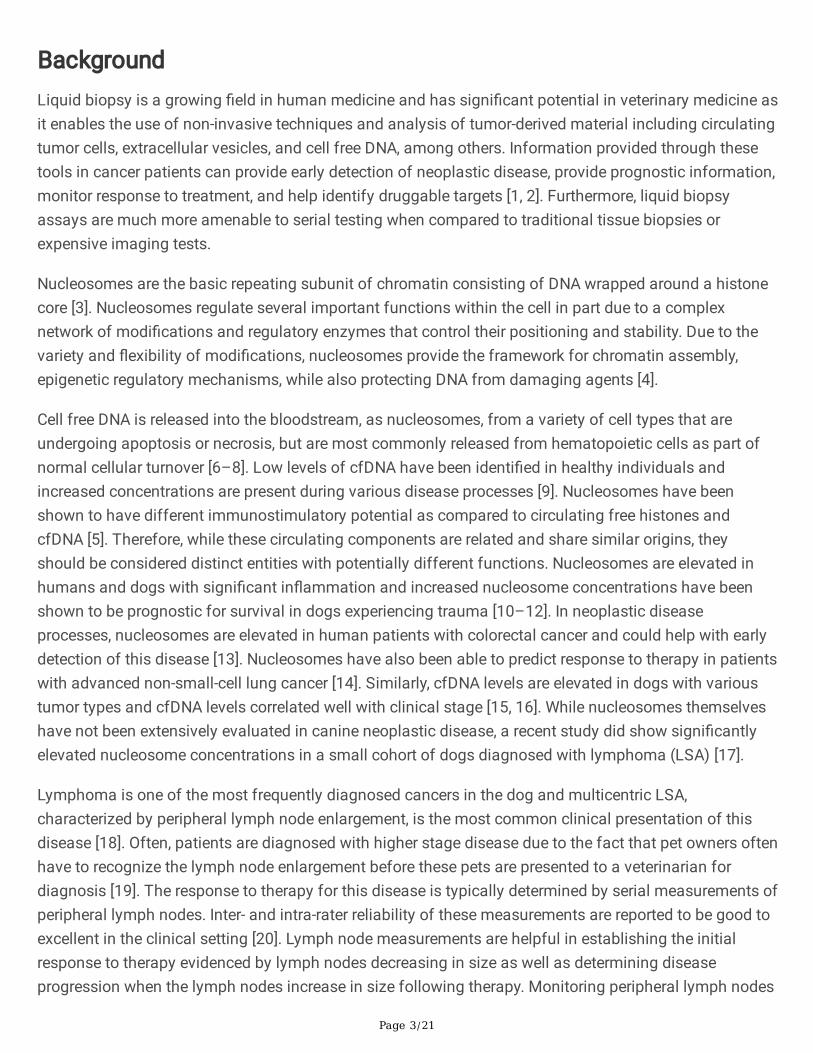
BackgroundLiquid biopsy is a growing �eld in human medicine and has signi�cant potential in veterinary medicine asit enables the use of non-invasive techniques and analysis of tumor-derived material including circulatingtumor cells, extracellular vesicles, and cell free DNA, among others. Information provided through thesetools in cancer patients can provide early detection of neoplastic disease, provide prognostic information,monitor response to treatment, and help identify druggable targets [1, 2]. Furthermore, liquid biopsyassays are much more amenable to serial testing when compared to traditional tissue biopsies orexpensive imaging tests.
Nucleosomes are the basic repeating subunit of chromatin consisting of DNA wrapped around a histonecore [3]. Nucleosomes regulate several important functions within the cell in part due to a complexnetwork of modi�cations and regulatory enzymes that control their positioning and stability. Due to thevariety and �exibility of modi�cations, nucleosomes provide the framework for chromatin assembly,epigenetic regulatory mechanisms, while also protecting DNA from damaging agents [4].
Cell free DNA is released into the bloodstream, as nucleosomes, from a variety of cell types that areundergoing apoptosis or necrosis, but are most commonly released from hematopoietic cells as part ofnormal cellular turnover [6–8]. Low levels of cfDNA have been identi�ed in healthy individuals andincreased concentrations are present during various disease processes [9]. Nucleosomes have beenshown to have different immunostimulatory potential as compared to circulating free histones andcfDNA [5]. Therefore, while these circulating components are related and share similar origins, theyshould be considered distinct entities with potentially different functions. Nucleosomes are elevated inhumans and dogs with signi�cant in�ammation and increased nucleosome concentrations have beenshown to be prognostic for survival in dogs experiencing trauma [10–12]. In neoplastic diseaseprocesses, nucleosomes are elevated in human patients with colorectal cancer and could help with earlydetection of this disease [13]. Nucleosomes have also been able to predict response to therapy in patientswith advanced non-small-cell lung cancer [14]. Similarly, cfDNA levels are elevated in dogs with varioustumor types and cfDNA levels correlated well with clinical stage [15, 16]. While nucleosomes themselveshave not been extensively evaluated in canine neoplastic disease, a recent study did show signi�cantlyelevated nucleosome concentrations in a small cohort of dogs diagnosed with lymphoma (LSA) [17].
Lymphoma is one of the most frequently diagnosed cancers in the dog and multicentric LSA,characterized by peripheral lymph node enlargement, is the most common clinical presentation of thisdisease [18]. Often, patients are diagnosed with higher stage disease due to the fact that pet owners oftenhave to recognize the lymph node enlargement before these pets are presented to a veterinarian fordiagnosis [19]. The response to therapy for this disease is typically determined by serial measurements ofperipheral lymph nodes. Inter- and intra-rater reliability of these measurements are reported to be good toexcellent in the clinical setting [20]. Lymph node measurements are helpful in establishing the initialresponse to therapy evidenced by lymph nodes decreasing in size as well as determining diseaseprogression when the lymph nodes increase in size following therapy. Monitoring peripheral lymph nodes

Page 4/21
as the primary indicator of treatment response is lacking as it does not detect minimal residual disease(MRD) after the lymph nodes have returned to a normal size. Previous studies in both humans and dogshave shown a variable amount of MRD following a positive response to therapy and the level of MRD atthe end of a chemotherapy protocol has been shown to be prognostic [21, 22]. Lymph nodemeasurements also fail to detect early indicators of disease progression as the disease burden mustadvance enough to cause lymph node enlargement before the patient is determined to be out ofremission. Establishing liquid biopsy techniques, such as measuring nucleosome levels, in caninelymphoma could be helpful by providing objective measures of disease progression or treatmentresponse even if the lymph nodes are normal in size. Such techniques could potentially reveal the MRDas well as provide an early indication of progressive disease prior to detectable lymph node enlargement.
The Nu.Q™ H3.1 Assay detects circulating nucleosomes in the blood of humans that occur with variousdisease states and has been used to detect and identify cancer even at early stages [13, 23]. Thisplatform is an enzyme-linked immunosorbent assay (ELISA) directed at the histone H3.1 (H3.1) corehistone protein. Previous investigations with histone H3.1 have identi�ed cancer-associated mutationswhich induced nucleosome instability and enhanced cancer cell colony formation [24].
The objectives of this study were to determine whether H3.1 nucleosome concentrations could be used todistinguish healthy dogs and dogs with of LSA using the Nu.Q™ H3.1 assay as well as how nucleosomelevels varied across disease stage and with treatment.
Results
Patient PopulationA total of 260 dogs were included in this study with 134 in the healthy control cohort and 126 in the LSAcohort. The healthy control cohort ranged in age from 0.83 to 14 years (median 6 years) and the LSAcohort ranged from 2 to 15 years (median 9 years). The healthy control cohort ranged in weight from 2.5to 55.8 kilograms (median 23 kilograms) and the LSA cohort ranged from 5.0 to 74.5 kilograms (median28.8 kilograms). The breeds most prevalent in the healthy control cohort were mixed breed (n = 29),Labrador retriever (n = 15), Australian cattle dog (n = 10), pit bull terrier (n = 7), border collie (n = 6), goldenretriever (n = 5), dachshund (n = 4), and German shepherd (n = 3). The breeds most prevalent in the LSApopulation were mixed breed (n = 39), Labrador retriever (n = 10), cocker spaniel (n = 4), golden retriever (n = 8), Shetland sheepdog (n = 4), giant schnauzer (n = 3), and 2 or fewer of a variety of other pure breddogs such as German Shepherd dogs, boxers, Basset Hounds and terriers. The healthy control cohort hada male to female ratio of 1.05 and a sex distribution including 4 intact females, spayed females (n = 61),intact males (n = 3), and castrated males (n = 65). The LSA cohort had a male to female ratio of 1.86 (82males and 44 females) and a sex distribution including intact females (n = 3), spayed females (n = 41),intact males (n = 9), and castrated males (n = 73).
Nucleosome Concentration

Page 5/21
The nucleosome concentrations in the LSA cohort were signi�cantly higher than those in the healthycontrol cohort ((median 211.1 ng/ml, mean 570.9 ng/mL, SEM 90.85) and median 31.1 ng/ml, mean32.07 ng/mL, SEM 1.118, respectively) with a p-value of < 0.0001 (Fig. 1)). According to the receiveroperator characteristic (ROC) curve the area under the curve was 87.8% with a sensitivity of 74.6% and aspeci�city of 100% with a cut off for the healthy range set at 67.5 ng/mL (nucleosome range for allhealthy dogs was 6.33–67.42 ng/mL).
To determine whether nucleosome concentrations were elevated across all stages of LSA, we comparednucleosome concentrations between healthy controls and the different stages of lymphoma. Stage ofdisease was available for all patients included in this study. All stages of LSA, except stage II, hadsigni�cantly elevated nucleosome concentrations compared to healthy controls (Fig. 2). The mediannucleosome concentration for stage I LSA was 104.9 ng/ml (n = 11, mean 691.9 ng/ml, SEM 358, p-value < 0.0001, AUC 87.99%), for stage II LSA was 36.2 ng/ml (n = 7, mean 135.6 ng/ml, SEM 96.45, p-value > 0.088, AUC 69.2%), for stage III LSA was 177.5 ng/ml (n = 37, mean 452.9 ng/ml, SEM 130.4, p-value < 0.0001, AUC 85.1%), for stage IV LSA was 200.2 ng/ml (n = 38, mean 564.2 ng/ml, SEM 167.9, p-value < 0.0001, AUC 91.7%), and for stage V LSA was 421.4 ng/ml (n = 33, mean 763.0 ng/mL, SEM 217.7, p-value < 0.0001, AUC 90.3%).
We next investigated whether elevated nucleosome concentrations were common to both B-cell and T-cellLSA. Immunophenotyping information was available for 61 LSA cases, and nucleosome concentrationwas compared amongst two immunophenotype groups and healthy controls. Nucleosomeconcentrations were signi�cantly elevated in both B-cell and T-cell LSA compared to healthy controls(Fig. 3). The median nucleosome concentration for B-cell LSA was 421.42 ng/ml (n = 43, mean 1031.7ng/ml, SEM 234.2, p-value < 0.0001, AUC 98%) and 153.7 ng/ml for T-cell LSA (n = 18, mean 277.6 ng/ml,SEM 99.4 p-value 0.0006, AUC 74.9%). T-cell LSA patients were found to have a signi�cantly lowernucleosome concentration than B-cell LSA patients (p-value 0.018). In the B cell lymphoma cohort therewas one dog with WHO stage I disease (2.3%), no dogs with stage II disease, 13 dogs with stage IIIdisease (30.2%) and 15 dogs each with stage IV (34.9%) and 14 with stage V disease (32.6%). For the Tcell lymphoma cohort there were no dogs with stage I disease, one dog with stage II disease (5.6%), 10dogs with stage III disease (55.6%), 2 dogs with stage IV disease (11.1%) and 5 dogs with stage V disease(27.8%). When using the compressed WHO staging system previously published by Valli et al in 2013, thetwo have a similar distribution of stage with compressed stage 1 (stages I/II) including one dog each (Bcell 2.3% and T cell 5.5%), stage 2 (compressed stages III/IV) the B cell cohort had 28 cases (65.1%) andthe T cell cohort had 12 cases (66.6%), �nally for the compressed stage 3 (stage V) the B cell cohort had14 (32.5%) cases and the T cell cohort had 5 cases (27.8%) [19].
A receiver operating characteristic analysis was performed with an established threshold of 67.4 ng/mlwhich generated an area under the curve of 0.878 (Fig. 4). This threshold produced a sensitivity of 74% ata speci�city of 100%. The performance of this threshold for each speci�c stage was investigated byapplying it retroactively to the population of LSA patients. This analysis showed that the threshold couldaccurately distinguish LSA patients from healthy patients in 63% (7/11) of stage I patients, 14.3% (1/7)
Page 6/21
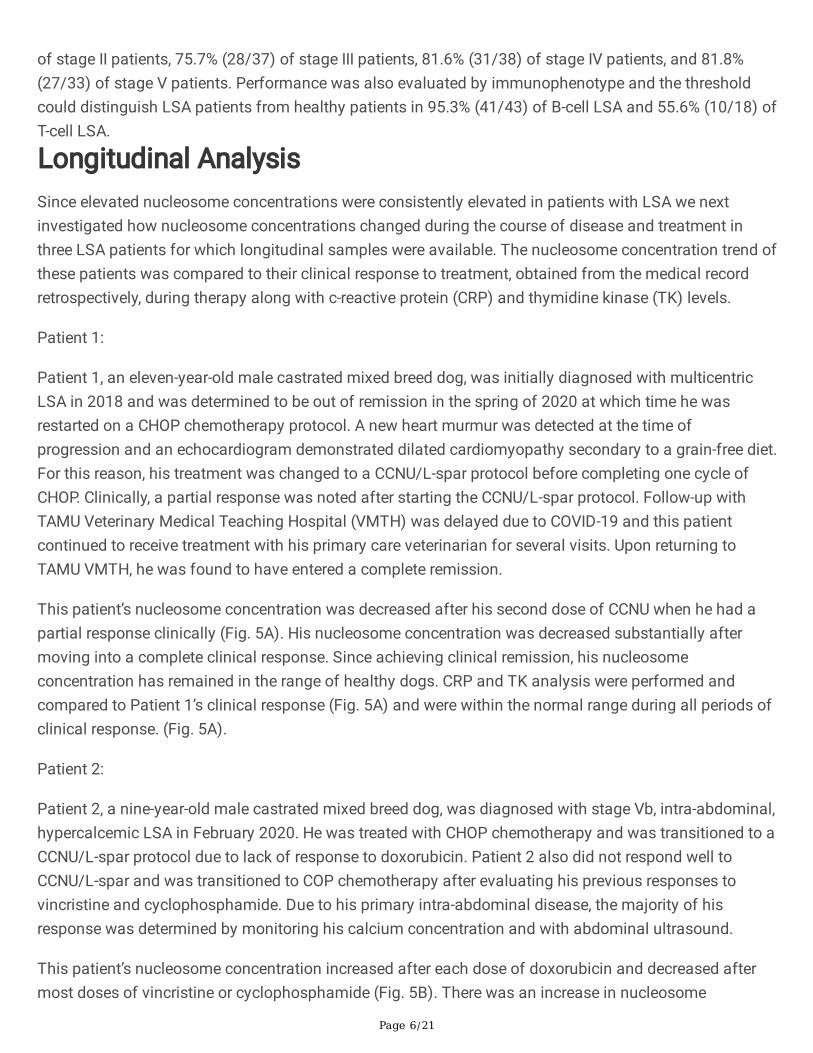
of stage II patients, 75.7% (28/37) of stage III patients, 81.6% (31/38) of stage IV patients, and 81.8%(27/33) of stage V patients. Performance was also evaluated by immunophenotype and the thresholdcould distinguish LSA patients from healthy patients in 95.3% (41/43) of B-cell LSA and 55.6% (10/18) ofT-cell LSA.
Longitudinal AnalysisSince elevated nucleosome concentrations were consistently elevated in patients with LSA we nextinvestigated how nucleosome concentrations changed during the course of disease and treatment inthree LSA patients for which longitudinal samples were available. The nucleosome concentration trend ofthese patients was compared to their clinical response to treatment, obtained from the medical recordretrospectively, during therapy along with c-reactive protein (CRP) and thymidine kinase (TK) levels.
Patient 1:
Patient 1, an eleven-year-old male castrated mixed breed dog, was initially diagnosed with multicentricLSA in 2018 and was determined to be out of remission in the spring of 2020 at which time he wasrestarted on a CHOP chemotherapy protocol. A new heart murmur was detected at the time ofprogression and an echocardiogram demonstrated dilated cardiomyopathy secondary to a grain-free diet.For this reason, his treatment was changed to a CCNU/L-spar protocol before completing one cycle ofCHOP. Clinically, a partial response was noted after starting the CCNU/L-spar protocol. Follow-up withTAMU Veterinary Medical Teaching Hospital (VMTH) was delayed due to COVID-19 and this patientcontinued to receive treatment with his primary care veterinarian for several visits. Upon returning toTAMU VMTH, he was found to have entered a complete remission.
This patient’s nucleosome concentration was decreased after his second dose of CCNU when he had apartial response clinically (Fig. 5A). His nucleosome concentration was decreased substantially aftermoving into a complete clinical response. Since achieving clinical remission, his nucleosomeconcentration has remained in the range of healthy dogs. CRP and TK analysis were performed andcompared to Patient 1’s clinical response (Fig. 5A) and were within the normal range during all periods ofclinical response. (Fig. 5A).
Patient 2:
Patient 2, a nine-year-old male castrated mixed breed dog, was diagnosed with stage Vb, intra-abdominal,hypercalcemic LSA in February 2020. He was treated with CHOP chemotherapy and was transitioned to aCCNU/L-spar protocol due to lack of response to doxorubicin. Patient 2 also did not respond well toCCNU/L-spar and was transitioned to COP chemotherapy after evaluating his previous responses tovincristine and cyclophosphamide. Due to his primary intra-abdominal disease, the majority of hisresponse was determined by monitoring his calcium concentration and with abdominal ultrasound.
This patient’s nucleosome concentration increased after each dose of doxorubicin and decreased aftermost doses of vincristine or cyclophosphamide (Fig. 5B). There was an increase in nucleosome
Page 7/21
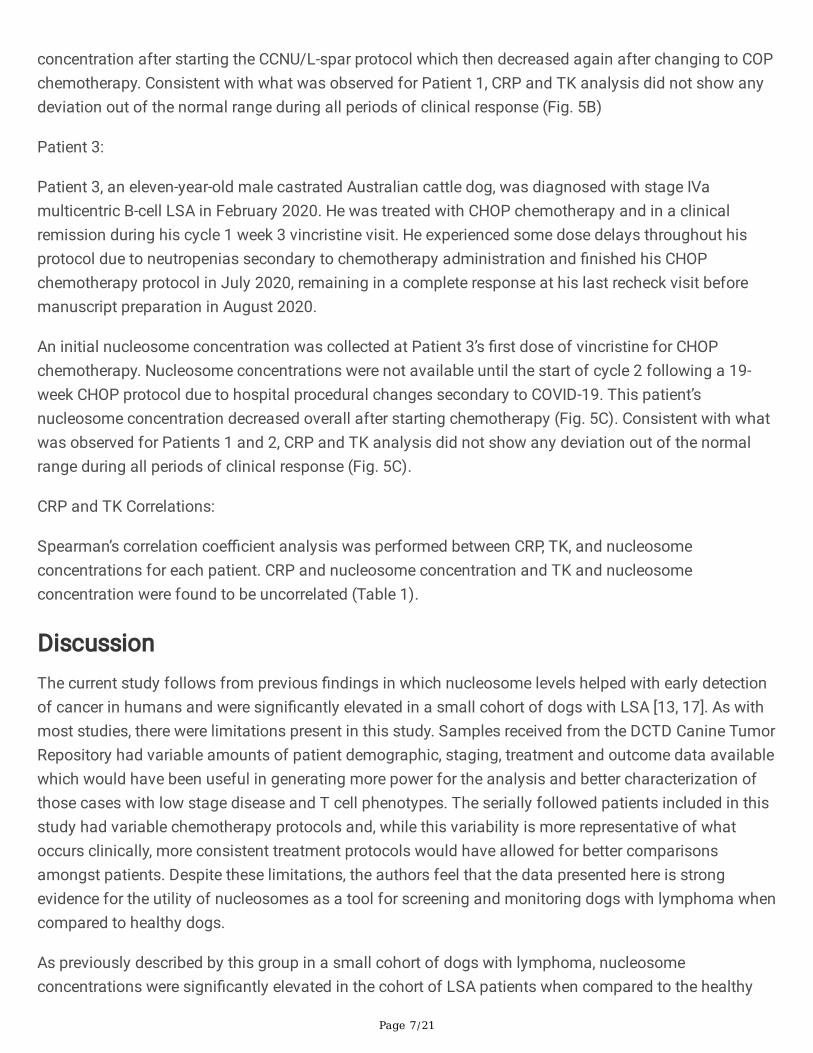
concentration after starting the CCNU/L-spar protocol which then decreased again after changing to COPchemotherapy. Consistent with what was observed for Patient 1, CRP and TK analysis did not show anydeviation out of the normal range during all periods of clinical response (Fig. 5B)
Patient 3:
Patient 3, an eleven-year-old male castrated Australian cattle dog, was diagnosed with stage IVamulticentric B-cell LSA in February 2020. He was treated with CHOP chemotherapy and in a clinicalremission during his cycle 1 week 3 vincristine visit. He experienced some dose delays throughout hisprotocol due to neutropenias secondary to chemotherapy administration and �nished his CHOPchemotherapy protocol in July 2020, remaining in a complete response at his last recheck visit beforemanuscript preparation in August 2020.
An initial nucleosome concentration was collected at Patient 3’s �rst dose of vincristine for CHOPchemotherapy. Nucleosome concentrations were not available until the start of cycle 2 following a 19-week CHOP protocol due to hospital procedural changes secondary to COVID-19. This patient’snucleosome concentration decreased overall after starting chemotherapy (Fig. 5C). Consistent with whatwas observed for Patients 1 and 2, CRP and TK analysis did not show any deviation out of the normalrange during all periods of clinical response (Fig. 5C).
CRP and TK Correlations:
Spearman’s correlation coe�cient analysis was performed between CRP, TK, and nucleosomeconcentrations for each patient. CRP and nucleosome concentration and TK and nucleosomeconcentration were found to be uncorrelated (Table 1).
DiscussionThe current study follows from previous �ndings in which nucleosome levels helped with early detectionof cancer in humans and were signi�cantly elevated in a small cohort of dogs with LSA [13, 17]. As withmost studies, there were limitations present in this study. Samples received from the DCTD Canine TumorRepository had variable amounts of patient demographic, staging, treatment and outcome data availablewhich would have been useful in generating more power for the analysis and better characterization ofthose cases with low stage disease and T cell phenotypes. The serially followed patients included in thisstudy had variable chemotherapy protocols and, while this variability is more representative of whatoccurs clinically, more consistent treatment protocols would have allowed for better comparisonsamongst patients. Despite these limitations, the authors feel that the data presented here is strongevidence for the utility of nucleosomes as a tool for screening and monitoring dogs with lymphoma whencompared to healthy dogs.
As previously described by this group in a small cohort of dogs with lymphoma, nucleosomeconcentrations were signi�cantly elevated in the cohort of LSA patients when compared to the healthy

Page 8/21
control cohort [17]. The median plasma nucleosome concentration in LSA patients was 6.8 times higherthan in the healthy controls. Broadly we found that elevated nucleosome concentrations were present atall cancer stages, except stage II, and present in both B and T cell lymphoma. Finally, in three patientsexamined longitudinally nucleosome concentrations correlated well with clinical response, though somevariations in concentration were seen over time. Additionally, these samples were all batched andevaluated retrospectively, which does not recapitulate how active real time monitoring would occur inactive patients.
When evaluated by stage, only the dogs with stage II LSA were found to not have signi�cant elevationscompared to healthy controls. This subpopulation contained only 7 dogs and the lack of signi�cance issuspected to be due to a population of insu�cient size. Another potential consideration is that the tumorburden associated with this stage of disease does not produce more nucleosomes than healthy dogs.However, this is unlikely since the nucleosome concentrations of dogs diagnosed with stage I LSA weresigni�cantly elevated compared to healthy controls in this study. Another consideration for the lownucleosome concentration in the stage II LSA cases is a T cell phenotype. The dogs in this study with Tcell LSA had signi�cantly lower nucleosome concentrations than those with B cell LSA, however, uponfurther review, only one of the dogs with stage II LSA had immunophenotype data available and this dogdid, indeed, have T cell LSA. Additional collection and analysis of lower stage LSA patients with fullcharacterization of their disease is needed to help further characterize the nucleosome concentrations inthese patient populations.
As mentioned above, while both B-cell and T-cell LSA had signi�cant increases in nucleosomeconcentration compared to healthy controls, B-cell LSA patients had a 2.7 fold higher mediannucleosome concentration as compared to T-cell LSA patients. The underlying mechanism of thisdifference is unknown. One potential explanation is that while T-cell LSA patients often have peripherallymphadenopathy, it is the authors’ experience that their disease burden is subjectively lower than their B-cell counterparts in the clinical setting. The lower nucleosome concentration detected in this study maybe the result of an overall lower disease burden that occurs between B-cell and T-cell LSA. In humans, ithas been shown that the amount of cfDNA shed by a LSA patient depends on the particular LSA subtype[25]. It is possible this is also true in dogs and the difference between B-cell and T-cell LSA nucleosomeconcentrations are indicative of underlying pathophysiologic differences between these LSA subtypes.Finally, owing to the fact that many samples for the lymphoma cohort were purchased from a biobank,most of the cases in this population were not characterized by �ow cytometry. It is possible that some ofthe samples in this group were from dogs with indolent T-cell LSA. Standard immunophenotyping (CD3positivity) would not be able to differentiate the less aggressive T-cell lymphomas from the moreaggressive T cell lymphomas. Studies in humans have also shown that the levels of cfDNA are higher inmore aggressive subtypes of LSA [25, 26]. If indolent LSA cases were included in the population of T-cellLSA cases, they may have arti�cially lowered the overall nucleosome concentration in this population.
A sensitivity of 74.6% at a speci�city of 100% in distinguishing LSA patients from healthy controls wasachieved using nucleosome concentrations with a threshold of 67.5 ng/ml. This indicates that
Page 9/21
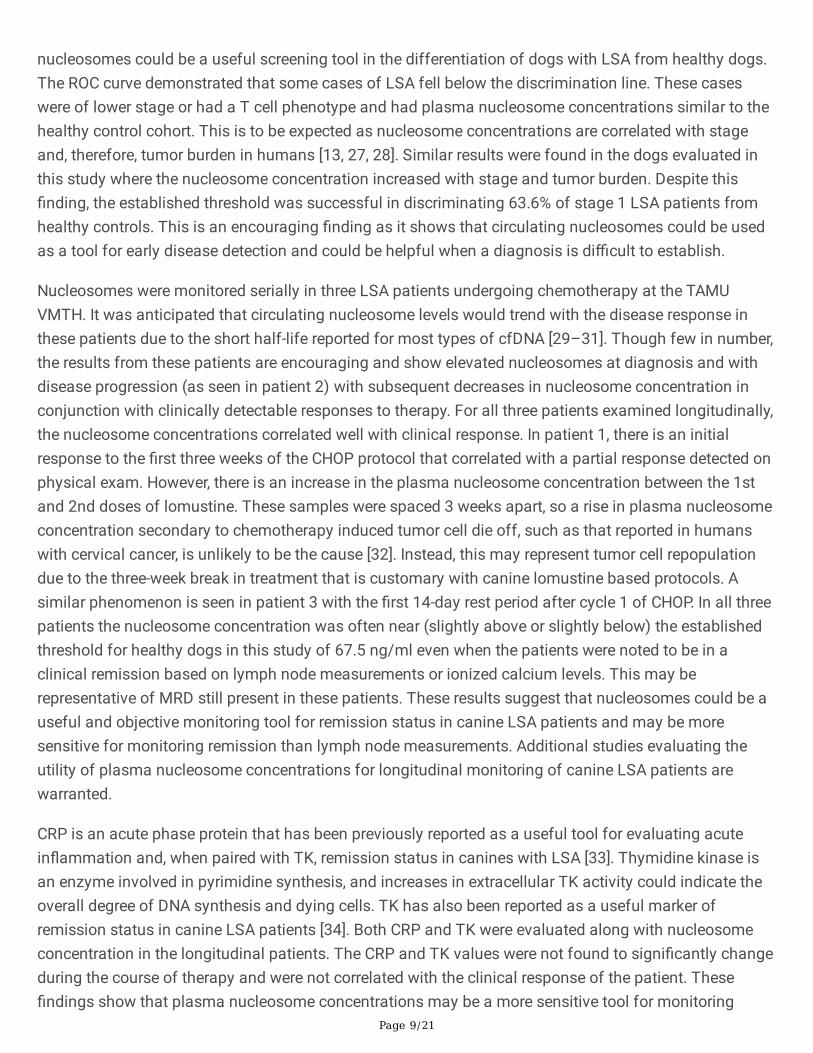
nucleosomes could be a useful screening tool in the differentiation of dogs with LSA from healthy dogs.The ROC curve demonstrated that some cases of LSA fell below the discrimination line. These caseswere of lower stage or had a T cell phenotype and had plasma nucleosome concentrations similar to thehealthy control cohort. This is to be expected as nucleosome concentrations are correlated with stageand, therefore, tumor burden in humans [13, 27, 28]. Similar results were found in the dogs evaluated inthis study where the nucleosome concentration increased with stage and tumor burden. Despite this�nding, the established threshold was successful in discriminating 63.6% of stage 1 LSA patients fromhealthy controls. This is an encouraging �nding as it shows that circulating nucleosomes could be usedas a tool for early disease detection and could be helpful when a diagnosis is di�cult to establish.
Nucleosomes were monitored serially in three LSA patients undergoing chemotherapy at the TAMUVMTH. It was anticipated that circulating nucleosome levels would trend with the disease response inthese patients due to the short half-life reported for most types of cfDNA [29–31]. Though few in number,the results from these patients are encouraging and show elevated nucleosomes at diagnosis and withdisease progression (as seen in patient 2) with subsequent decreases in nucleosome concentration inconjunction with clinically detectable responses to therapy. For all three patients examined longitudinally,the nucleosome concentrations correlated well with clinical response. In patient 1, there is an initialresponse to the �rst three weeks of the CHOP protocol that correlated with a partial response detected onphysical exam. However, there is an increase in the plasma nucleosome concentration between the 1stand 2nd doses of lomustine. These samples were spaced 3 weeks apart, so a rise in plasma nucleosomeconcentration secondary to chemotherapy induced tumor cell die off, such as that reported in humanswith cervical cancer, is unlikely to be the cause [32]. Instead, this may represent tumor cell repopulationdue to the three-week break in treatment that is customary with canine lomustine based protocols. Asimilar phenomenon is seen in patient 3 with the �rst 14-day rest period after cycle 1 of CHOP. In all threepatients the nucleosome concentration was often near (slightly above or slightly below) the establishedthreshold for healthy dogs in this study of 67.5 ng/ml even when the patients were noted to be in aclinical remission based on lymph node measurements or ionized calcium levels. This may berepresentative of MRD still present in these patients. These results suggest that nucleosomes could be auseful and objective monitoring tool for remission status in canine LSA patients and may be moresensitive for monitoring remission than lymph node measurements. Additional studies evaluating theutility of plasma nucleosome concentrations for longitudinal monitoring of canine LSA patients arewarranted.
CRP is an acute phase protein that has been previously reported as a useful tool for evaluating acutein�ammation and, when paired with TK, remission status in canines with LSA [33]. Thymidine kinase isan enzyme involved in pyrimidine synthesis, and increases in extracellular TK activity could indicate theoverall degree of DNA synthesis and dying cells. TK has also been reported as a useful marker ofremission status in canine LSA patients [34]. Both CRP and TK were evaluated along with nucleosomeconcentration in the longitudinal patients. The CRP and TK values were not found to signi�cantly changeduring the course of therapy and were not correlated with the clinical response of the patient. These�ndings show that plasma nucleosome concentrations may be a more sensitive tool for monitoring

Page 10/21
clinical response of canine LSA patients than CRP or TK. This also suggests that serial nucleosomeconcentrations could potentially be utilized to detect a patient moving out of remission prior to changesin peripheral lymph node size.
ConclusionThe results of this study demonstrate that plasma nucleosome concentrations of dogs with LSA aresigni�cantly elevated compared to healthy controls. These �ndings support the use of nucleosomes as atool for the early detection of LSA in dogs. The longitudinal analyses of three patients also suggests thatthere may be utility for nucleosomes in monitoring a patient’s response to therapy and may be useful inmonitoring remission status.
MethodsHealthy Dogs
Dogs were recruited from patients presenting to the Texas A&M University Veterinary Medical TeachingHospital (TAMU VMTH) for routine wellness exams or from dogs owned by TAMU VMTH personnel. Allanimal studies were approved by the Texas A&M University Animal Care and Use Committee (AUP #2017-0350). Owners were questioned to determine the health status of each patient. In order to be eligible forinclusion, dogs were required to be over one year of age and healthy. Dogs were excluded if there was anysecondary signi�cant in�ammatory/infectious disease or history of neoplasia. Information recorded foreach patient included signalment, body weight, body condition score, and any relevant comorbiditiesreported by the owner.
Lymphoma Dogs
The LSA dog cohort was recruited in part from dogs presenting to the TAMU VMTH for treatment of naivemulticentric LSA (AUP #2019-0211). The remaining samples were recruited from the National CancerInstitute Division of Cancer Treatment and Diagnosis (NCI-DCTD) Canine Tumor Repository. Whenavailable, information including patient signalment, body weight, body condition score, stage of disease,and immunophenotype were recorded.
Samples were collected longitudinally from three dogs undergoing treatment for multicentric LSA at theTAMU VMTH (AUP #2019-0211). These dogs were selected to evaluate the duration and pattern ofelevated cancer associated nucleosome concentrations in plasma. Blood was collected at each clinicvisit. These samples were collected prior to treatment and labeled according to the visit date. Additionalinformation including treatment protocol and remission status at each visit were recorded.
Sample Collection and Processing

Page 11/21
For patients presenting to the TAMU VMTH, blood was collected and immediately placed in K2-EDTAblood collection tubes. Within one hour of collection, samples were centrifuged at room temperature at3000xg for 10 min. Plasma was then immediately removed without disrupting the buffy coat layer, placedin pre-labeled cryovials and frozen at -80°C to run in batches. Processing samples with this protocol wasshown to be appropriate for reliable, consistent nucleosome detection in dog plasma [17]. Samplesreceived from the DCTD Canine Tumor Repository were stored frozen at -80°C to be run in batches.
Nucleosome Assays
Frozen samples were thawed and allowed to come to room temperature for at least 30 minutes prior toanalysis. All samples were performed in duplicate. The samples were evaluated using the Nu.Q™ H3.1ELISA (Belgian Volition, SRL, Isnes, Belgium) and were performed according to the manufacturer’sinstructions. Brie�y, a standard curve was generated using the known standards provided. Before use, thewells were washed 3 times with 200μL of the provided diluted wash solution with excess solution beingremoved after each wash. Patient and healthy dog plasma samples were vortexed and then centrifugedfor 2 min at 11,000xg at 4°C before samples were loaded into the plates. Lymphoma samples werediluted 3-fold in order to ensure that they would register on the plates within the limits of the colorimetricstandards. Twenty microliters of patient samples and kit controls were run in duplicate in wells on 96 wellplates. Eighty microliters of assay buffer was then added to each well. The plates were sealed with foiland incubated at room temperature for 2.5 hours under agitation at ~700rpm. Plates were emptied andwashed as described above. Next, 100μL of HRP labelled detection antibody was added to each well. Theplate was sealed with foil and incubated at room temperature for 1.5 hours under agitation at ~700rpm.Plates were then emptied and washed as described above. Next, 100μL of TMB substrate was added toeach well. The plate was sealed with foil and incubated at room temperature for 20 minutes in the darkunder agitation at ~700rpm. One hundred microliters of stop solution were then added and the plate wasshaken gently. Plates were read at an absorbance of 450nm (BioTek Synergy H1 plate reader, BioTekInstruments, Winooski, VT) within 5 minutes of stop solution being added. The standard curve waslinearized and �tted to a 5-parameter logistic curve using statistical software (Graphpad Software,version 8, San Diego, CA).
CRP Assays
For the longitudinal LSA patients, samples were submitted to the Texas A&M University GastrointestinalLaboratory for their commercially available CRP assay if su�cient sample quantity was present. Ifsample quantity was not su�cient for both nucleosome and CRP analysis, nucleosome assays weregiven priority.
Thymidine Kinase Assays
The Canine Thymidine Kinase 1 soluble ELISA assay (My Biosource Inc, San Diego, CA) was used toevaluate TK levels in all dogs that were followed longitudinally. The assay was performed according tothe manufacturer’s protocol. Brie�y, 40μl of sample was added to wells followed by 10μl anti-TK1
Page 12/21
antibody. Then 50μl streptavidin-HRP was added to each well except the blank control well. The plate wasmixed well, covered with sealer and incubated for 60 minutes at 37°C. The plate was then washed 5 timeswith wash buffer and the wells were soaked with at least 0.35 ml wash buffer for 30 seconds to 1 minutefor each wash. Next 50μl of substrate solution A was added to each well followed by 50μl of substratesolution B to each well. The plate was covered with a fresh sealer for 10 minutes at 37°C in the dark.Finally, 50μl of Stop Solution was added to each well. Plates were read at an absorbance of 450nm(BioTek Synergy H1 plate reader, BioTek Instruments, Winooski, VT) within 10 minutes of stop solutionbeing added. The standard curve was linearized and �tted to a 5-parameter logistic curve using statisticalsoftware (Graphpad Software, version 8, San Diego, CA).
Statistical Analysis
Descriptive statistics for the patient populations were performed using Microsoft excel for Mac (v.16.16.27, 2016). For data sets containing only two cohorts, such as the healthy controls versus all LSAcases, a Wilcoxon rank sum test was used to compare the medians of the data sets. For data sets wheremultiple conditions were compared such as disease stage, a two-way ANOVA for repeat measures with aTukey’s multiple comparisons test was performed. This part of the analysis was performed usingGraphPad Prism version 8.0.0 for Macintosh, GraphPad Software, San Diego, California USA,www.graphpad.com. Spearman’s correlation, ROC curves and speci�city/sensitivity calculations wereperformed using R version 3.4.3 and the pROC package [35, 36].
Abbreviations1. LSA - Lymphoma
2. CRP - C-Reactive Protein
3. TK - Thymidine Kinase
4. TAMU VMTH – Texas A&M University Veterinary Medical Teaching Hospital
5. ROC – Receiver Operating Characteristic
�. MRD – Minimal Residual Disease
DeclarationsEthics approval and consent to participate:
All animal studies were approved by the Texas A&M University Animal Care and Use Committee (AUP#2017-0350). Client-owned animals were evaluated with the informed consent of the owner (AUP #2019-0211).
All methods were carried out in accordance with relevant guidelines and regulations.
No humans were involved in this study.

Page 13/21
No agents were administered to dogs in any way in this study.
Consent for publication:
Not applicable
Availability of data and materials
All relevant data are within the paper.
Funding
Funding for materials and author salaries was provided by Belgian Volition SRL. HWR and TM receivedsalary from these funds. JT, TK, and TB are employees of Volition Diagnostics UK Ltd & Volition America.The URL to the Volition website is: https://volition.com/. Some additional funding for HWR and TMsalaries was provided by the Fred and Vola Palmer Chair of Comparative Oncology held by HWR.
Authors' contributions
Conceptualization: Heather Wilson-Robles.
Data curation: Christopher Dolan, Heather Wilson-Robles, Tasha Miller, Jill Jarvis.
Formal analysis: Heather Wilson-Robles, Theresa Kelly, Thomas Bygott.
Funding acquisition: Heather Wilson-Robles, Jason Terrell.
Investigation: Christopher Dolan, Heather Wilson-Robles, Jill Jarvis.
Methodology: Heather Wilson-Robles, Tasha Miller.
Project administration: Heather Wilson-Robles, Jill Jarvis.
Resources: Heather Wilson-Robles, Tasha Miller, Jill Jarvis, Jason Terrell, Theresa Kelly, Thomas Bygott.
Software: Heather Wilson-Robles, Thomas Bygott.
Supervision: Heather Wilson-Robles.
Validation: Heather Wilson-Robles, Tasha Miller.
Visualization: Heather Wilson-Robles.
Writing – original draft: Christopher Dolan, Heather Wilson-Robles.

Page 14/21
Writing – review & editing: Christopher Dolan, Heather Wilson-Robles, Jason Terrell, Theresa
Kelly, Thomas Bygott.
Acknowledgements
The authors would like to acknowledge the Fred and Vola Palmer Chair in Comparative Oncology forfunding support of this work.
Authors' information (optional)
Not applicable.
References1. Rubis GD, Krishnan SR, Bebawy M. Liquid Biopsies in Cancer Diagnosis, Monitoring, and Prognosis.
Trends in Pharmacological Sciences. 2019 Mar;40(Nat. Rev. Genet. 17 2016):172–86.
2. Zhang W, Xia W, Lv Z, Ni C, Xin Y, Yang L. Liquid Biopsy for Cancer: Circulating Tumor Cells,Circulating Free DNA or Exosomes? Cell Physiol Biochem. 2017;41(2):755–68.
3. Luger K, Mäder AW, Richmond RK, Sargent DF, Richmond & TJ. Crystal structure of the nucleosomecore particle at 2.8Å resolution. Nature. 1997;(389):251–60.
4. Cutter AR, Hayes JJ. A brief review of nucleosome structure. Febs Lett. 2015;589(20PartA):2914–22.
5. Marsman G, Zeerleder S, Luken BM. Extracellular histones, cell-free DNA, or nucleosomes: differencesin immunostimulation. Cell Death Dis. 2016;7(12):e2518–e2518.
�. Jahr S, Hentze H, Englisch S, Hardt D, Fackelmayer FO, Hesch R-D, et al. DNA Fragments in the BloodPlasma of Cancer Patients: Quantitations and Evidence for Their Origin from Apoptotic and NecroticCells. Cancer Research. 2001;(61):1659–65.
7. Snyder MW, Kircher M, Hill AJ, Daza RM, Shendure J. Cell-free DNA Comprises an In VivoNucleosome Footprint that Informs Its Tissues-Of-Origin. Cell. 2016;164(1–2):57–68.
�. Lui YYN, Chik K-W, Chiu RWK, Ho C-Y, Lam CWK, Lo YMD. Predominant hematopoietic origin of cell-free DNA in plasma and serum after sex-mismatched bone marrow transplantation. Clin Chem.2002;48(3):421–7.
9. Alborelli I, Generali D, Jermann P, Cappelletti MR, Ferrero G, Scaggiante B, et al. Cell-free DNA analysisin healthy individuals by next-generation sequencing: a proof of concept and technical validationstudy. Cell Death Dis. 2019;10(7):534.
10. Letendre J-A, Goggs R. Concentrations of Plasma Nucleosomes but Not Cell-Free DNA Are Prognosticin Dogs Following Trauma. Frontiers Vet Sci. 2018;5:180.
11. Letendre J, Goggs R. Determining prognosis in canine sepsis by bedside measurement of cell-freeDNA and nucleosomes. J Vet Emerg Crit Car. 2018;28(6):503–11.
Page 15/21
12. Phan T, Mcmillan R, Skiadopoulos L, Walborn A, Hoppensteadt D, Fareed J, et al. Elevatedextracellular nucleosomes and their relevance to in�ammation in stage 5 chronic kidney disease. IntAngiol. 2018;37(5).
13. Rasmussen L, Christensen IJ, Herzog M, Micallef J, Nielsen HJ. Circulating cell-free nucleosomes asbiomarkers for early detection of colorectal cancer. Oncotarget. 2017;9(12):10247–58.
14. Kumar S, Guleria R, Singh V, Bharti AC, Mohan A, Das BC. Plasma Nucleosome Levels Might PredictResponse to Therapy in Patients With Advanced Non–Small-Cell Lung Cancer. Clin Lung Cancer.2010;11(1):36–44.
15. Tagawa M, Shimbo G, Inokuma H, Miyahara K. Quanti�cation of plasma cell-free DNA levels in dogswith various tumors. J Vet Diagn Invest. 2019;31(6):836–43.
1�. Beffagna G, Sammarco A, Bedin C, Romualdi C, Mainenti M, Mollo A, et al. Circulating Cell-Free DNAin Dogs with Mammary Tumors: Short and Long Fragments and Integrity Index. Plos One.2017;12(1):e0169454.
17. Wilson-Robles H, Miller T, Jarvis J, Terrell J, Dewsbury N, Kelly T, et al. Evaluation of nucleosomeconcentrations in healthy dogs and dogs with cancer. Biorxiv. 2020;2020.07.08.193466.
1�. Zandvliet M. Canine lymphoma: a review. The Veterinary quarterly. 2016 Jun;36(2):76–104.
19. Valli VE, Kass PH, Myint MS, Scott F. Canine Lymphomas. Vet Pathol. 2013;50(5):738–48.
20. Childress MO, Fulkerson CM, Lahrman SA, Weng H -Y. Inter‐ and intra‐rater reliability of calliper‐basedlymph node measurement in dogs with peripheral nodal lymphomas. Vet Comp Oncol.2016;14(S1):74–81.
21. Rambaldi A, Lazzari M, Manzoni C, Carlotti E, Arcaini L, Baccarani M, et al. Monitoring of minimalresidual disease after CHOP and rituximab in previously untreated patients with follicular lymphoma.Blood. 2002;99(3):856–62.
22. Yamazaki J, Takahashi M, Setoguchi A, Fujino Y, Ohno K, Tsujimoto H. Monitoring of MinimalResidual Disease (MRD) after Multidrug Chemotherapy and Its Correlation to Outcome in Dogs withLymphoma: A Proof-of‐Concept Pilot Study. J Vet Intern Med. 2010;24(4):897–903.
23. Bauden M, Pamart D, Ansari D, Herzog M, Eccleston M, Micallef J, et al. Circulating nucleosomes asepigenetic biomarkers in pancreatic cancer. Clin Epigenetics. 2015;7(1):106.
24. Arimura Y, Ikura M, Fujita R, Noda M, Kobayashi W, Horikoshi N, et al. Cancer-associated mutations ofhistones H2B, H3.1 and H2A.Z.1 affect the structure and stability of the nucleosome. Nucleic AcidsRes. 2018;gky661.
25. Schroers-Martin JG, Kurtz DM, Soo J, Jin M, Scherer F, Craig A, et al. Determinants of CirculatingTumor DNA Levels across Lymphoma Histologic Subtypes. Blood [Internet]. 2017 Dec7;130(Supplement 1):4018–4018. Available from:https://doi.org/10.1182/blood.V130.Suppl_1.4018.4018
2�. Hohaus S, Giachelia M, Massini G, Mansueto G, Vannata B, Bozzoli V, et al. Cell-free circulating DNAin Hodgkin’s and non-Hodgkin’s lymphomas. Ann Oncol. 2009;20(8):1408–13.

Page 16/21
27. HOLDENRIEDER S, STIEBER P, BODENMÜLLER H, BUSCH M, PAWEL J, SCHALHORN A, et al.Circulating Nucleosomes in Serum. Ann Ny Acad Sci. 2001;945(1):93–102.
2�. Schwarzenbach H, Hoon DSB, Pantel K. Cell-free nucleic acids as biomarkers in cancer patients. NatRev Cancer. 2011;11(6):426–37.
29. Gauthier VJ, Tyler LN, Mannik M. Blood clearance kinetics and liver uptake of mononucleosomes inmice. J Immunol Baltim Md 1950. 1996;156(3):1151–6.
30. Fatouros IG, Jamurtas AZ, Nikolaidis MG, Destouni A, Michailidis Y, Vrettou C, et al. Time of samplingis crucial for measurement of cell-free plasma DNA following acute aseptic in�ammation induced byexercise. Clin Biochem. 2010;43(16–17):1368–70.
31. Lo YMD, Zhang J, Leung TN, Lau TK, Chang AMZ, Hjelm NM. Rapid Clearance of Fetal DNA fromMaternal Plasma. Am J Hum Genetics. 1999;64(1):218–24.
32. Trejo-Becerril C, Oñate-Ocaña LF, Taja-Chayeb L, Vanoye-Carlo A, Cetina L, Duenas-Gonzalez A.Serum nucleosomes during neoadjuvant chemotherapy in patients with cervical cancer. Predictiveand prognostic signi�cance. Bmc Cancer. 2005;5(1):65.
33. Nielsen L, Toft N, Eckersall PD, Mellor DJ, Morris JS. Serum C-Reactive Protein Concentration as anIndicator of Remission Status in Dogs with Multicentric Lymphoma. J Vet Intern Med.2007;21(6):1231–6.
34. Euler H, Einarsson R, Olsson U, Lagerstedt A, Eriksson S. Serum Thymidine Kinase Activity in Dogswith Malignant Lymphoma: A Potent Marker for Prognosis and Monitoring the Disease. J Vet InternMed. 2004;18(5):696–702.
35. R Core Team. A language and environment for statistical computing. R Foundation for StatisticalComputing, Vienna, Austria. URL http://www R-project org. 2010 Jan 1;
3�. Robin X, Turck N, Hainard A, Tiberti N, Lisacek F, Sanchez J-C, et al. pROC: an open-source packagefor R and S + to analyze and compare ROC curves. Bmc Bioinformatics. 2011;12(1):77.
TablesDue to technical limitations, table 1 is only available as a download in the Supplemental Files section.
Figures

Page 17/21
Figure 1
Elevated Nucleosome Levels in LSA. Mean plasma nucleosome concentrations (ng/mL) weresigni�cantly higher in LSA dogs compared to healthy controls.

Page 18/21
Figure 2
Mean Nucleosome Concentrations: LSA by Stage. Mean plasma nucleosome concentrations (ng/mL) inall LSA stages (except stage II) were signi�cantly higher than healthy controls.

Page 19/21
Figure 3
Mean Nucleosome Concentrations: LSA by Immunophenotype. Mean plasma nucleosome concentrations(ng/mL) in B- and T-cell LSA were signi�cantly higher than healthy controls. B-cell LSA mean nucleosomeconcentrations were signi�cantly higher than T-cell LSA.

Page 20/21
Figure 4
Discriminating LSA from Healthy Controls. ROC analysis with an established threshold of 67.5 ng/mlgenerated an area under the curve of 0.878. This threshold produced a sensitivity of 74.6% at a speci�cityof 100%
Figure 5
Trends in Nucleosome, CRP, and TK Concentrations During Treatment for LSA. Clinical response isrepresented for each patient with red time points indicating either the initial diagnosis or progressivedisease. Orange time points indicate a partial response or stable disease, and green time points indicate acomplete clinical response. The left y-axis represents nucleosome concentration and TK concentrationwhile the right y axis represents CRP concentration and iCa concentration. The nucleosome concentration
Page 21/21
and TK concentration are plotted as ng/mL, and the CRP and iCa concentrations are plotted as mg/L forcomparison. The x-axis represents visits to the hospital along with administered treatment. V –vincristine, C – cyclophosphamide, D – doxorubicin, L – lomustine (CCNU), LSP – L-asparaginase, R –recheck visit (no treatment), Del – Delay visit (no treatment). A. Trends shown for Patient 1. Nucleosomeconcentrations decreased after the second dose of lomustine when a partial response was notedclinically. The nucleosome concentration decreased substantially after moving into a complete responseand has since remained in the range of healthy dogs. The CRP and TK were within the normal rangeduring all periods of clinical response and were uncorrelated with nucleosome concentration. B. Trendsshown for Patient 2. Nucleosome concentrations increased after each dose of doxorubicin and decreasedafter most doses of vincristine. Another increase is seen after starting CCNU/L-spar chemotherapy and adecrease occurs after changing to COP chemotherapy. The CRP and TK were within the normal rangeduring all periods of clinical response and had no correlation with nucleosome concentration. C. Trendsshown for Patient 3. Nucleosome concentration decreased overall after starting chemotherapy. The CRPand TK were within the normal range during all periods of clinical response and had no correlation withnucleosome concentration.
Supplementary Files
This is a list of supplementary �les associated with this preprint. Click to download.
Table1LSAH3.1NucleosomeConcentration.pdf