plasma diagnostics for high power ignitron development
TRANSCRIPT

IEEE TRANSACTIONS ON MAGNETICS, VOL. 27, NO. 1, JANUARY 1991 181
PLASMA DIAGNOSTICS FOR HIGH POWER IGNITRON DEVELOPMENT*
D.L. Loree, M. Giesselmann, M. Kristiansen Texas Tech University, Lubbock, Tx 79409
and
A. Shulski Richardson Electronics, LaFox, Illinois 60147
Abstract The development of high power ignitrons with peak
current ratings of up to lo00 kA and simultaneous charge transfer rates of 250-500 C is currently under way in a joint effort between Texas Tech University (lTU), Lawrence Livermore National Laboratory (LLNL) and industry. Research at lTU is concentrated on plasma diagnostics, novel anode designs, electrode placements and trigger scheme^.^.^.^ Electrical measurements as well as optical plasma studies such as high speed framing photography, Mach-Zehnder interferometry and spectroscopy have been performed. The cooperative efforts have lead to the developmentof a new commercial tube (Richardson
This paper describes plasma diagnostics performed on a demountable ignitron (DIG) which provides optical access to
the discharge plasma through four viewports, two of which are on opposite sides on a common optical axis. The latter pair of viewports was used to perform plasma density studies using a Mach-Zehnder interferometer. Time resolved recordings of the interference pattems, either visually or electronically, during changes in plasma behavior (such as current conduction or plasma heating) yield time resolved information about the particle density. This technique was applied to the demountable ignitron during high current discharges. The light source was a 2W CW argon laser which was pulsed using a ferroelectric liquid crystal light valve. The resulting fringe pattems were recorded with a mechanical high speed camera. In the paper all experimental details, results and a theoretical evaluation are given. In addition, high speed framing photography was used to study the influence on electrode design and placement on the discharge plasma.
Electronics NL-9ooO).
Introduction
In order to improve the high power switching capabilities and the lifetime of ignitrons, the discharge plasma has to be stable and well controlled. Anode shape and placement seem to play a dominant role in achieving these goals. Sculptured electrodes have been shown to aid in high current conduction.4 Better switching performance means more reliable voltage holdoff, lower forward voltage drop, and higher peak current ratings without reduced lifetime. Anode shape and placement also affect the elecmc field distribution inside the tube and thereby influence the voltage holdoff reliability. Another factor influencing the voltage holdoff is the condensation of the mercury. To improve the reliability, Richardson’s new NL-9000 tube has two separate water cooling jackets, one to cool the mercury pool and another one to cool the sidewall jet, keeping its temperature above the temperature of the mercury pool region.5 To study the effects of anode geometry on the discharge plasma, high speed framing photographs of the discharge development in the demountable ignitron (DIG) have been taken. A cross-sectional drawing of this tube is shown in Fig. 1. Note that the DIG has no cooling jackets, therefore the influence of ignitron cooling cannot be researched with this tube.
ExDerimental Setup
The experimental setup that was used for the plasma diagnostics consists of two major parts:
* Sponsored by: DOE through LLNL under Subcontract#:B039926
Fig. 1 Demountable Ignitron
-The pulsed power circuitry to operate the demountable ignitron -The diagnostic equipment for time resolved plasma studies.
During all measurements described below, the demountable ignitron (DIG) was used as a crowbar of an energy storage inductor of 1 pH charged by four banks of 10 capacitors each; totaling to 2.56 mF. Charging of the storage inductor (i.e. test stand) is initiated by firing a Size E series ignitron (NL-1057). A three dimensional view of the ignitron test stand is shown in Fig. 2. Firing of the crowbar tube (DIG) is initiated by sensing the passage of a preset voltage level of the capacitor bank voltage in a downward slope. The time f” current onset to peak current is about 70 ps in the main and crowbar current loops. The currents proceed in the form of exponentially decaying, oscillating waveforms for around 400 to lo00 ps depending upon the peak current. The oscillations in the current waveforms are caused by sway inductances and the fact that the series ignitron does not open completely when the crowbar ignitron is triggered.
Plasma Diagnostics SetuD
To investigate the discharge in the DIG under various operating conditions such as different current levels and anode geometries, the following investigations have been performed.
-Time resolved high speed photography in the visible range -Time resolved high speed photography with spectral filtering at the
-Time resolved interferometry using a Mach-Zehnder interferometer
Figure 3 shows the arrangement of the Mach-Zehnder interferometry system. The interferometer consists of a rectangular frame, housing two beam splitters located at the input and output, and two mirrors at the remaining comers. The input beam is split up into two parallel beams with equal path length that are superimposed at the output. The experiment is inserted along the optical axis of the throughports of the DIG into one of the beams through a cutout on
Hg emission line and other wavelengths
and an Argon Laser
0018-9464/91/0100-0181$01.~ 0 1991 EEE

182
Coaxial Cables from Banks
Coaxlal Cablea from Banks
*IgnHar and Vmap. pmb. conrUCtions (yw shown.
Fig. 2 Three Dimensional View of Test Stand
Beam p a n d e r Interferometer
Fig. 3 Mach-Zehnder Interferometry System
one side of the frame. A CW Argon Laser, (Continental 3020 AS) with 2 watts maximum output power (multi-line, multi mode) was used as the coherent light source for the interferometer. A beam expander is mounted directly behind the aperture of the laser and expands the beam to the a diameter of 25 mm. A ferroelectric light valve Model LVIOOAC, made by Displaytech, Inc., with 25 mm clear aperture was used to pulse the laser light to obtain a light pulse that coincides with the plasma discharge in the DIG. This light valve contains two adjustable polarizers and an active liquid crystal element in the center. The operation is based on the rotation of the plane of polarization in the center element upon application of a voltage of +I5 V. The transition time between the open and the closed position is around 50 p. The shutter was installed after the beam expander to reduce the power density on the surface of the polarizers, which dissipate the total beam energy in the closed mode. With this shutter, an exactly controllable laser-pulse, timed in relation to the crowbar discharge, has been achieved.
Theory of fringe shift evaluation
At the output of the interferometer, a fringe pattern is created, showing bright lines separated by dark lines at regular intervals, 6y, called the vacuum fringe spacing. The fringe pattern is caused by the superposition of the two parallel laser beams generated inside the interferometer by the input beam splitter. Both beams are traveling the same path length. One beam is acting as the phase reference beam and is totally enclosed. The other beam is passing through the experiment and experiences a phase shift which is almost entirely dependent on the charged particle density of the plasma. Compared to the phase shift caused by the charged
Fig. 4a Example of Localized Phase Shift Fringe Pattem
Fig. 4b Example of Uniform Phase Shift Fringe Pattem
particle density, the magnitude of any additional phase shift by the neutral gas density in the ignitron is negligible. The response to the neutral gas density was estimated to be only around 5% compared to the response to the ionized plasma.
During all experiments, the Mach-Zehnder interferometer was aligned to produce finite fringes (a family of straight lines or curves that are basically parallel) rather then infinite fringes (closed circles or ellipses). The advantage of fiiite fringes are that very small fringe shifts can be detected and the sign of the phase shift can also be determined. Figure 4a shows on the left a typical finite fringe pattern, that can be expected if the phase shift is localized within a small portion of the diameter of the laser beam, whereas Fig. 4b shows the observed fringe pattern if the phase shift extends over the entire diameter of the beam. If a fringe shift relative to the vacuum fringe spacing, dy/6y, is observed as shown in Fig. 4, the spatially averaged charged particle density , 5, multiplied by the the plasma length L is given by: 6
X2
T = +J n dx (plasma length L = x2 - xl) (1)
X1 - n = spatially averaged charged particle density
Introducing the two possible wavelengths of the argon laser, (488 nm, blue) and (515 nm, green) and an estimated plasma length of L=15 cm, we get:
fi [ ~ m - ~ ] = 3.05 x 10l6 - dy (for 488 nm Argon) (3) sy
A [cm3] = 2.89 x 10’6 - dY (for 515 nm Argon) (4) bY
The frequency of the laser light will determine the minimum as well as the maximum detectable plasma density. The lower detection limit will be given by the smallest fringe shift that can be evaluated in relation to the vacuum fringe spacing whereas the high limit is reached when the light absorption within the plasma becomes excessive. The high limit is usually given when the plasma frequency, given by
183
wp =plasma frequency = , ( 5 )
reaches 10% of the light frequency. Higher wavelengths mean lower detectable plasma densities as well as lower maximum densities. In the given case the plasma densities have been found on the lower end of the detectable spectrum.
Imaeing Techniaue and Image Process ing
All pictures have been taken with a Dynafax (model C 326-2) camera. Depending on the filtering 8 - 10 consecutive frames with 3 ps exposure time and 45 ps interframe time have been recorded for each discharge. The exposures are taken at the preceeding intervals with consecutive frames for each discharge being labeled from 1 (tube triggered) to 8 (well after peak current). Kodak Tri-X Pan 35 mm film (No. 5063) was used in the camera. For better evaluation of the pictures, the prints were scanned using a Abaton 300FB scanner. The scanner was connected to a Macintosh IIx computer and was operated in grayscale mode with its maximum resolution of 4 bits (16 gray levels). An image processing program was then used to perform a noise reduction and to create a meaningful printout, that shows the plasma intensity structure or the fringe structure, respectively, much clearer than the original photograph. The software also provides the option of color imaging whereby a range of different colors from the spectrum can be assigned to a range of gray-levels in the picture. This technique enables one to show image structures with great clarity.
Results
Hieh Speed Framing
the plasma behavior, framing pictures have been taken with:
(a) A solid graphite anode (b) A stainless steel cup anode (c) A stainless steel cup anode with slits to induce arc rotation.
The frames showed that the plasma was most diffuse with the solid graphite anode. In contrast, the stainless steel cup anode causes the plasma to concentrate towards the rim of the cup, leading to a decreased plasma intensity in the center where the mgger electrode is placed. The stainless steel cup anode with slits caused the greatest amount of plasma structure variation between consecutive frames, with angled plasma streamers being visible across the viewport whichmight be caused by plasma rotation. Processed photographic sequences of plasma discharges with both stainless steel anode types are shown in Ref. 1.
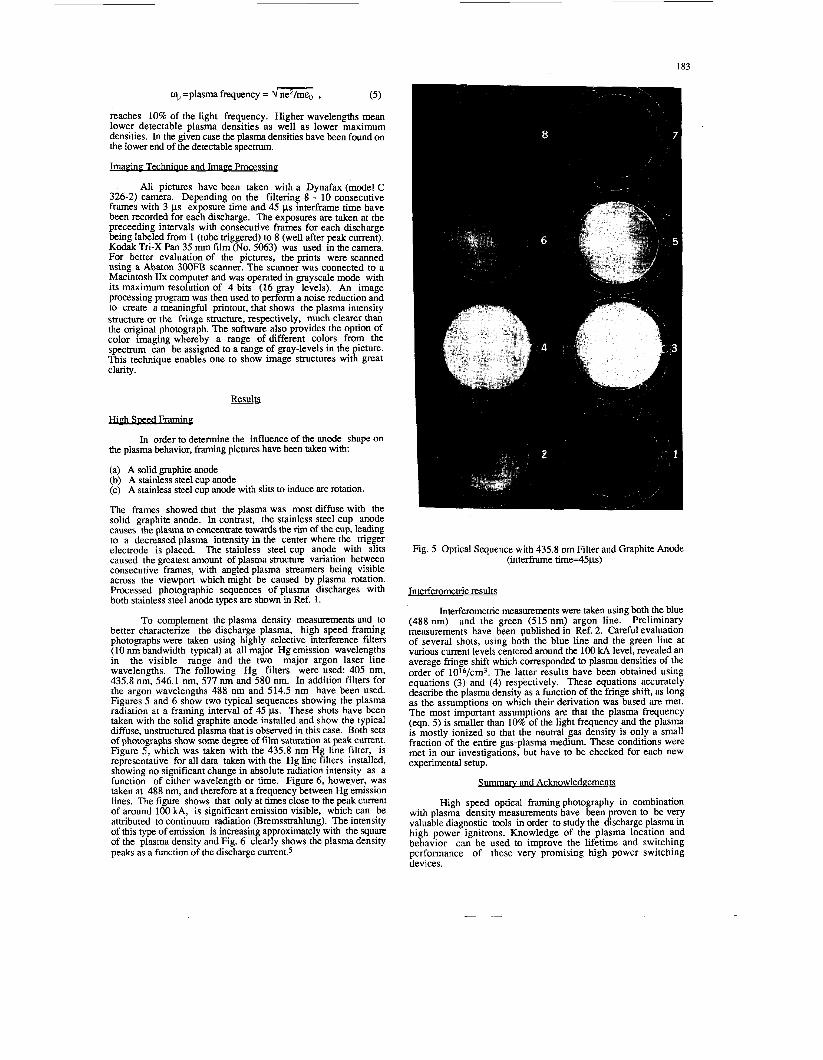
To complement the plasma density measurements and to better characterize the discharge plasma, high speed framing photographs were taken using highly selective interference filters (10 nm bandwidth typical) at all major Hg emission wavelengths in the visible range and the two major argon laser line wavelengths. The following Hg filters were used 405 nm, 435.8 nm, 546.1 nm, 577 nm and 580 nm. In addition filters for the argon wavelengths 488 nm and 514.5 nm have been used. Figures 5 and 6 show two typical sequences showing the plasma radiation at a framing interval of 45 ps. These shots have been taken with the solid graphite anode installed and show the typical diffuse, unstructured plasma that is observed in this case. Both sets of photographs show some degree of film saturation at peak current. Figure 5, which was taken with the 435.8 nm Hg line filter, is representative for all data taken with the Hg line filters installed, showing no significant change in absolute radiation intensity as a function of either wavelength or time. Figure 6, however, was taken at 488 nm, and therefore at a frequency between Hg emission lines. The figure shows that only at times close to the peak current of around 100 kA, is significant emission visible, which can be attributed to continuum radiation (Bremsstrahlung). The intensity of this type of emission is increasing approximately with the square of the plasma density and Fig. 6 clearly shows the plasma density peaks as a function of the discharge current.5
In order to determine the influence of the anode shape on
Fig. 5 Optical Sequence with 435.8 nm Filter and Graphite Anode (interframe time45p.s)
Interferometric results
Interferometric measurements were taken using both the blue (488 nm) and the green (515 nm) argon line. Preliminary measurements have been published in Ref. 2. Careful evaluation of several shots, using both the blue line and the green line at various current levels centered around the 100 kA level, revealed an average fringe shift which corresponded to plasma densities of the order of lO16/cm3. The latter results have been obtained using equations (3) and (4) respectively. These equations accurately describe the plasma density as a function of the fringe shift, as long as the assumptions on which their derivation was based are met. The most important assumptions are that the plasma frequency (eqn. 5) is smaller than 10% of the light frequency and the plasma is mostly ionized so that the neutral gas density is only a small fraction of the en t ie gas-plasma medium. These conditions were met in our investigations, but have to be checked for each new experimental setup.
Summarv and Acknowledgements
High speed optical framing photography in combination with plasma density measurements have been proven to be very valuable diagnostic tools in order to study the discharge plasma in high power ignitrons. Knowledge of the plasma location and behavior can be used to improve the lifetime and switching performance of these very promising high power switching devices.

184
Fig. 6 Optical Sequence with 488 nm Filter and Graphite Anode (interframe time45ps)
We would like to acknowledge the support of LLNL and particularly Ron Kihara and Wayne Hofer. We would also like to acknowledge John Burke, whose Master's thesis provided some of the data for this paper, and the following people at the Texas Tech University Pulsed Power Laboratory: Lonnie Stephenson, Ellis Loree, and Kim Zinsmeyer.
References
J.E. Burke, D.L. Loree, M. Giesselmann, and M. Kristiansen, "Optical Study of the Effects of Anode Geometry on the Performance of an Ignitron," Proceedings of the 7th IEEE Pulsed Power Conference, Monterey, California, June 12-14, 1989, pp. 503-506.
D.L. Loree, J.E. Burke, M. Giesselmann, and M. Kristiansen, "Preliminary Interferometric Investigations of a Demountable Ignitron," Proceedings of the 7th IEEE Pulsed Power Conference, Monterey, California, June
D.L. Loree, M. Giesselmann, and M. Kristiansen, "Ignitron Research at Texas Tech University," Intemational Magnetic Pulse Compression Workshop, Granlibakken Conference Center, Lake Tahoe, Ca, Feb. 12-14, 1990.
P.G. Slade, "The Vacuum Interrupter Contact," Transactions on Comuonents. Hvbrids. and Manufac- turing Technoloev, Vol. CHMT-7, No. 1, March 1984,
12-14, 1989, pp. 507-509.
pp. 25-32.
D.B. Cummings, "Improving Ignition Voltage Holdoff By Heating the Wall," Proceedings of the 17th Power Modulator Symposium, Seattle, Wa, June 1986, pp. 97-100.
Proceedings of the Plasma Diagnostic Seminar, edited by JimThompson and M. Kristiansen, June 1973, Texas Tech University, Lubbock Texas 79409.
r - -